A Co-Opetition Straw Supply Strategy Integrating Rural Official Organizations and Farmers’ Behavior in China


1
School of Economics and Management, North China Electric Power University, Beijing 102206, China
2
Research Center for Beijing Energy Development, Beijing 102206, China
3
Beijing Key Laboratory of New Energy and Low-Carbon Development, North China Electric Power University, Changping, Beijing 102206, China
*
Author to whom correspondence should be addressed.
Energies 2018, 11(10), 2802; https://doi.org/10.3390/en11102802
Submission received: 29 September 2018
/
Revised: 12 October 2018
/
Accepted: 16 October 2018
/
Published: 17 October 2018
(This article belongs to the Section C: Energy Economics and Policy)
Abstract
:China has a huge potential of biomass power generation since it is a big agricultural producer and abundant in agriculture straw. However, the current straw supply system cannot guarantee the feedstock sufficiency for biomass power plants. The main reason is the high costs of straw collection and transportation because farmers are scattered across the country and farming in a small-scaled method for self-support. This study aims at solving the issue with the introduction of China’s rural official organizations to collect agriculture straw in a centralized way and to share benefits with farmers. We apply the approach of multi-agent modeling and simulation to analyze the farmer’s participation behavior within a co-opetition supply strategy after the rural official organizations are incorporated. The results demonstrate that farmers’ participation is positively affected by the cooperative enthusiasm of rural official organizations. In addition to those basic factors, such as straw price, transportation cost, and shipping distance, the benefit sharing policy has a significant impact on the equilibrium percentage of the cooperative farmers. We recommend that the Chinese central government encourage and support rural official organizations to participate in the agriculture straw supply chain, and the benefit sharing policy should be implemented with the precaution against free rides.
1. Introduction
The Chinese central government has pledged that emissions will peak approximately 2030, and it intends to increase the share of non-fossil fuels in primary energy consumption to approximately 20% [1], so that various types of renewable energies are well developed, including biomass energy, which is viewed as carbon neutral [2]. Biomass power generation (direct-fired generation that this study focuses on), if implemented with appropriate technologies, could mitigate greenhouse gas emission, increase farmers’ income, and provide clean electricity that is more stable than other renewable power options, such as wind and solar [3]. Benefitting from the policies and plans of stimulating the biomass power industry, the total biomass power installation increased from approximately 1400 MW in 2006 to 14,760 MW in 2017. The annual electricity generated from biomass rose from 7.50 billion kWh in 2006 to 79.5 billion kWh in 2017. Targets have been set that by 2020 the biomass installation will reach 15,000 MW and the annual biomass electricity output will be 90 billion kWh [4].
The feedstock for biomass energy includes both agricultural and forestry sources. In this study, we focus on agricultural biomass—straw—because the distribution of forest biomass is more centralized and its production and supply system is better-developed than straw. As a major agricultural producer, China has the potential to produce a large amount of agriculture straw [5]. The theoretical annual production of agricultural biomass resources is approximately 870 million t (440 million tce), and approximately 400 million t (200 million tce) are available as energy sources [6], including wheat, corn, and rice straw.
However, with such a large ammount of resources, most biomass plants are suffering from meager profits or even deficits. Seventy percent of China’s biomass plants are facing losses, which could be 100 million CNY (Chinese Yuan) per year. For instance, all the 13 biomass plants in Jiangsu Province of China were under loss in 2012 [7]. The reason is that these plants do not develop efficient supply chains to deliver sufficient and low-cost biomass feedstock. Currently, the collection and transportation costs account for approximately 60% of the total feedstock cost [8]. Although the designed economic radius of straw purchase is generally 50 km for a 30 MW biomass plant, the practical radius could exceed 100 km due to low farmer participation [9]. Thus, improving the efficiency of this straw supply chain is an important issue for China’s clean production and sustainable utilization of resources.
The supply of straw is greatly affected by farmers’ behaviors. Unlike in developed countries, where large farms are the basic organization forms of agricultural production, Chinese farmers are farming in a decentralized and small-scaled way for self-support. Due to a modest purchasing price versus high collection and transportation costs [10], these scattered farmers have weak enthusiasm for collecting and selling straw. Hence, a large amount of straw is discarded or even incinerated on farmlands, leading to a severe resource waste and air pollution. Furthermore, Chinese farmers’ social and economic behaviors are greatly affected by the actions of local governments. Previous studies reached an agreement that the government should play a more active part in the supply chain of biomass energy prior to the establishment of a modern industrial chain and a mature distributed energy system [11,12]. However, the concrete role and detailed method of government involvement have not been explored.
Currently, there exists two feedstock supply methods for China’s biomass plants, including the direct-deal method (farmers directly deliver biomass feedstock to plants) and the broker method (small brokers act as resellers) [13]. The former is only applicable within the territories adjacent to plants, and the latter is the major feedstock purchase style that most plants use in practice. However, because these small-scale biomass brokers are individuals rather than companies, the binding effect of the contracts between them and the plants is quite weak. Reliance on the broker method is not able to satisfy the continuous demand for sufficient biomass feedstock. Our previous studies [14,15] proposed to introduce rural official organizations to reshape the straw supply system. In China’s newest plan on the energy technology innovation, an important target for biomass energy is to develop a sustainable feedstock supply system. That policy will downwardly affect the rural official organizations to act to enhance the utilization of straw resources. Within the Chinese vertical political institution, the villagers’ committee (VC), a local official governmental organization, plays the role of administering China’s vast rural areas, whose influence penetrates all aspects of a farmer’s life. Because much labor and time costs need to be put into, the opportunity cost for farmers to collect the straw is very high considering many job opportunities exist for them to work in urban areas. In our field investigation, farmers expressed their expectation for the introduction of the VCs into the collection and delivery of straw. The introduction of the VCs can help farmers reduce labor and machinery investments. A new supply method can be designed to introduce VCs into the feedstock supply system, whose tasks are collecting straw in collaboration with farmers, as well as temporary storage, pretreatment, and transportation (in-field and road) [14]. If this new method were implemented, we would observe three market configurations: Competition, co-opetition, and cooperation. The first scenario is the conventional situation, i.e., only the broker method exists. The co-opetition scenario incorporates both ways, including the competition between brokers and VCs as well as the cooperation between VCs and farmers. Within the last configuration, the VC method is used exclusively. Correspondingly, biomass plants are faced with three supply options—competition, co-opetition, and cooperation strategies. Figure 1 shows the supply chain architectures in the three situations, where a solid line with an arrow at the end means the feedstock flow, and a frame with dotted outline denotes a coalition making decisions jointly.
In our previous study [15], we proposed a basic version of co-opetition strategy for China’s biomass supply chain—using both the broker and VC methods to purchase straw feedstock, and applied a game theory model and Monte Carlo simulation to verify its effectiveness and efficiency. Results showed that the co-opetition strategy could supply sufficient straw and the strategy was able to bring the highest profits for plants and the entire biomass supply chain.
This study will further extend [15] from three aspects. First, we re-model the general single farmer player in the previous game theory model as multiple farmer agents to investigate their individual choosing behaviors based on the evolutionary concept, which assumes the farmers use bounded rational. Although the theory of non-cooperative game is applicable to study the behaviors of players in any situation where each player’s optimal choice may depend on his forecast of his opponents’ choices, its viewpoint is more useful in settings with a small number of players [16]. Instead, the evolutionary game theory assumes that games are played repeatedly by biologically or socially conditioned players who use bounded rationality and randomly drawn from large populations [17]. In the practical straw supply chain, farmers generally have bounded rationality due to their limited information acquisition and education backgrounds. Previous studies modeled farmers’ behavior based on this concept to investigate the evolutionary direction and the equilibrium status [18,19]. Second, multi-agent simulation technology is used to model and simulate farmers’ behaviors on a Java-based computer platform. Multi-agent simulation is a technology that was established on the theory of complex adaptive systems (CASs), whose units have the characteristics of autonomy, social ability, reactivity, and pro-activeness [20]. The core of this technique is the concept of the intelligent agent—the abstraction of individuals who operate in socioeconomic systems to be represented on computer platforms. This technology was applied to many supply chain issues to study the dynamics of stakeholders [21,22,23,24]. In this paper, we build four groups of agents in a simulation environment with uncertainty and variability to examine the changing tendency of farmers’ behaviors. Third, this paper incorporates a benefit sharing policy in the co-opetition supply strategy, i.e., VCs share the revenue from selling biomass with farmers by improving their welfares, such as building rural roads and irrigation facilities, since such infrastructures in rural areas need to be improved. In our field investigation, farmers expressed their expectation for the introduction of the VCs. Due to the low price, the revenue from straw selling is much smaller. Benefit sharing based on the cooperation between farmers and the VC could optimize the utility brought by the profit from straw selling. This policy is considered as a new parameter in the model equations and its impact is investigated with the phenomenon of free rides.
Therefore, the purpose of this study is to propose a co-opetition strategy in China’s straw supply chain, with the considerations of rural official organizations and farmers’ behaviors. To that end, three objectives are expected to be achieved: (1) The change tendency of farmers’ participation in the cooperation with rural official organizations; (2) the factors that affect the farmers’ participation behavior; and (3) the impacts of the benefit sharing policy and free ride behavior on the implement of this strategy.
The rest of the paper is organized as follows. The multi-agent model is built in Section 2. Section 3 presents the multi-agent simulation with a case study, as well as an analysis and discussion of the results. The final section concludes the paper, provides policy implications, and notes areas for future research.
2. Modeling
2.1. Modeling Framework
A multi-agent model is built on the basis of our previous study [15], which established a game theory model on the co-opetition market scenario involving four players—farmers, VC, broker, and plant. That game theory model, which formulated the interactions among those four players, serves as the framework of this multi-agent model. Equations (1)–(3) are the payoff functions of the cooperative formed by the VC and farmers, the broker, and the plant, respectively. Table A1 presents the notations used in this study.
With the co-opetition strategy, the farmer player cooperates with the VC so that they perform as a single entity, , to maximize their total profit. Their decision variables are the profit per unit of straw and the straw quantity to supply.
where, denotes the profit per unit of straw, is the straw supplied by the cooperative, is the straw supplied by the broker player, is the straw factory-gate price, is straw collection cost coefficient ( [25]), is the transportation cost per km∙t, and is the transportation distance.
The broker player competes with the cooperative consisting of the farmer and the VC. His decision variable is the quantity of straw he purchases from the farmer.
where, denotes the straw price offered by the farmer, which is a result of the farmer’s unit profit, , i.e., .
The biomass plant makes decisions on the amount of wood biomass it needs to purchase. Owing to the difficulty of straw collection and supply, the plant undertakes a passive position in the supply chain. To meet the feedstock demand for a sustainable and stable operation, the plant purchased wood biomass as a supplement approach.
where, denotes the wood biomass purchased by the plant agent; is a substitution of the expression, , where is the price of biomass electricity, is the operation cost of the plant per kWh, and is the conversion ratio of biomass to electricity; is the total straw purchased by the plant agent; and is the wood biomass price, .
More details on those equations and the equilibrium deductions can be found in our previous study [15]. The game theory analysis and the Monte Carlo simulation results in our previous study [15] indicated that the co-opetition strategy was optimal for biomass plants. Hence, a problem emerges: How will an individual farmer choose his strategy dynamically—sell straw to brokers or cooperate with the VC? We disassemble this single player in the following sections with a multi-agent simulation model to investigate those dynamics.
2.2. Agents
We identify and design four categories of intelligent agents—farmers, VCs, brokers, and a biomass power plant. Additionally, we build a probe named Observer to monitor the system state. In the methodology of multi-agent simulation, each class of agents is equipped with several common attributes and behavior methods, implemented on computers with object-oriented languages, such as Java. For a single instance of that agent class, it is assigned with various attribute values and follows the methods as behaving rules.
2.2.1. Farmer Agents
Farmer agents have the following attributes: Id number ; unit transportation cost, ; transportation distance, ; unit straw yield, ; collection cost coefficient, ; and the strategy choice and the utility in the current round, and , respectively.
To simulate the practical situation in the operation of biomass supply chain, we model the farmer agents with a strategy choosing behavior as follows:
where is the id number of a farmer agent , is the current simulation round, denotes farmer ’s strategy choice, is farmer ’s utility, and is the average utility level of all the farmers.
when a farmer agent chooses the VC method in the current round, and means choosing the broker method. In addition, we have when a VC cooperates with farmers and when it does not. If the farmer agent finds his utility in the last round is greater than the average level of the group, he will keep his strategy the same as the one he chose in the last round; otherwise, the choice will be switched.
As for the payoff function for farmer agents, we design three scenarios to analyze the impacts of farmers’ caring about non-monetary benefits and free rides.
In the first scenario, which is the base case, we establish the payoff function without considering the non-monetary benefits, i.e., the payoff of the farmers’ agents is only the monetary benefit from selling biomass. To be noticed, we have when a VC cooperates with farmers, and when it does not. With different combinations of farmers’ and VCs’ choices, the estimation of utility has three formations. Within the co-opetition, the first formation represents the utility of a single farmer who chooses the VC method scenario; the second represents the utility of a farmer who chooses the broker method; and the third condition indicates the situation of pure competition only with the broker method. The deduction of these three equations is based on our previous study [15].
where, denotes the benefit sharing ratio of VCs (), is the percentage of the farmers choosing the VC method within the VC ’s area, is the numbers of farmers, and is VC ’s strategy choice in round .
Compared with the traditional broker method, the biggest difference with the new method is that the VC will organize farmers to collect straw corporately and share the profit to improve local welfares. To further investigate the impact of the benefit sharing policy, we design another two scenarios where we integrate the immaterial utility into farmers’ payoff as ; where, is the utility that a farmer agent wants to maximize, and are the monetary and non-monetary benefit, respectively, and denotes the weight of the monetary benefit, which in this simulation, we assume to be 0.8 [26]. Another issue involved with the sharing policy is free rides, i.e., the villagers not participating in the VC method could also enjoy the benefits of improvements to local welfare. Therefore, we model the second and the third scenarios, both with and without the free-ride behavior, as Equations (6) and (7), which are only different in the term on the right when the VC chooses to cooperate and the farmer is willing to take part in the new method. The second scenario represents the situation where the VC makes the welfare improvements that could benefit all of the local villagers, such as renovating infrastructures, including village roads, schools, and infirmaries. In the third scenario, the improvement efforts are more specific to the farmers who supply straw, such as maintaining irrigation facilities, and providing pension insurance and medical care.
2.2.2. VC Agents
In the same spirit, VC agents have attributes, including an id number ; unit transportation cost, ; transportation distance, ; collection cost coefficient, ; and the strategy choice and profit in the current round, and , respectively.
They also have strategy choosing and payoff calculation behaviors:
where, is the average profit of the VCs.
2.2.3. Broker Agents
Broker agents’ strategies are the straw quantities they purchase, q. Their objectives are to optimize profit as in Equation (2).
Referring to the analysis in our previous study [15], the equilibrium straw quantity a broker purchases in competition and co-opetition scenarios are as Equations (10) and (11), respectively. Thus, in every round of trading, broker agents use these two equations to decide their strategies.
2.2.4. Plant Agent
Because straw is more difficult to purchase, when compared with wood biomass, the wood biomass quantity, , is assumed as the decision variable of the plant in this model. The profit-maximization problem of the plant agent is given by Equation (3).
Equation (3) describes the plant’s decision-making behavior on the wood biomass amount based on the straw it can purchase from the market, which demonstrates its passive position in the straw supply chain. Referring to our previous study [15], the equilibrium wood biomass quantity is defined by Equation (12):
where is the optimal wood biomass quantity calculated through and is the annual biomass demand of the plant agent. Corresponding to different equilibrium straw quantities, the equilibrium wood biomass quantity is a piecewise function, which is consistent with the competition, cooperation, and co-opetition scenarios.
2.3. Simulation Environment
To apply the multi-agent model above, we structure the agents on the platform of RePast (Argonne National Laboratory; Argonne, IL, USA), with the schedule shown in Figure 2. Beginning with producing agents and initializing the system state, RePast operates round by round to simulate the interactions among agents. Meanwhile, the Observer gathers information and displays it on the outputting interface. The whole procedure terminates when the system reaches stability. The Observer is responsible for gathering statistics, such as the proportions of farmers choosing the VC method, (overall) and (in local villages); the proportions of farmers choosing cooperation, ; the average profit of VCs, , and farmers, . In addition, it ends every trading round by producing the procurement price of agricultural biomass for the next round, .
3. Simulation
3.1. Data
To manage the challenges of uncertainty and variability, we apply the multi-agent simulation based on a practical case in Shandong Province of China to deal with the uncertainties of biomass price, transportation cost and distance, and different initial states. Data were collected from related literature and our investigation of the Shanxian biomass plant in Shandong Province. As China’s first biomass-based power plant established by the National Bio-energy Group, Shanxian biomass plant went into production on 1 December 2006. It was installed with a 30 MW generator and the annual generated electricity was designed to be 210 million kWh, consuming a biomass feedstock of approximately 300,000 t every year. The simulation is conducted based on the practical situation of the biomass supply system for the Shanxian biomass plant, and combined with the co-opetition supply strategy that we propose.
In our previous study [15], we used the Monte Carlo method to verify the advantage of the co-opetition strategy. Table A2 lists the simulation parameters we assumed in that study. Based on those assumptions, we further conduct the multi-agent simulation in this study. Table 1 presents the data in this multi-agent simulation, which are from related literature and our investigations. To investigate the impact of uncertainty, we first operate the simulation without uncertainty, where the straw price, unit transportation cost, and transportation distance are assumed to be constant as the mean or likeliest values in the Monte Carlo simulation. The initial state is assumed to be while , or as . Allowing for uncertainty, we then assign these parameters with the same distributions shown in Table 1. The system is assumed to start with a point in the uniformly distributed set, .
3.2. Results
Figure 3 shows the results for the multi-agent simulation without uncertainty, including the blue plots indicating the number of farmers who participate in the VC method, and the red ones denoting how many VCs choose to cooperate with farmers for collecting and supplying agriculture straw, both in terms of percentage of the total number. Although beginning with various initial configurations, the proportion of farmers choosing the VC method reaches stability at approximately 62%. A similar situation occurs with VCs, where the percentage tends to the final level of 100%. The figure shows that the blue curves reach stability earlier (about ) than the red ones (about ). With the same learning coefficient, , there are more farmer agents following the rational behavior than VC agents per unit of time. Additionally, we find no consistent relationship between , and in Figure 4, which means in the simulation environment without uncertainty, there is no impact of the initial state on the final stable percentage of farmers.
Figure 5 represents the simulation results considering the uncertainty of the procurement price of straw for the plant, ; the unit transportation cost, ; and the transportation distance, , including the coordinates of denoted by blue dots and the coordinates of denoted by orange dots. For each pair of the initial and the final coordinates, we conducted 100 simulation trials, which means the red points drawn on the figure represent the mean values of the stable percentages. As expected, while the initial points are uniformly distributed in the space of , the final coordinates approach a stable point of approximately (0.56, 1), as indicated by the red dot. Compared to the situation without uncertainty, the stable percentages of farmers, , is less concentrated, ranging from 0.48 to 0.72. Furthermore, to explore the relationship between the initial state and the stable percentage, we drew plots illustrating the changes of with various values of (Figure 6). The results show that a greater leads to higher levels of , and has no significant impact on the stable percentage.
3.3. Discussion
In this section, we first investigate the factors affecting the stable percentage of farmers choosing the VC method. Then, the impact of free ride behavior on the implementation of this strategy is studied. In addition, the findings in this paper are compared with some previous analogous studies.
Figure 7 illustrates the impacts of four factors on the stable percentage of farmers choosing the VC method: Straw price, unit transportation cost, transportation distance, and benefit sharing ratio. These results are based on 100 simulations trials. The stable percentages of farmers are indicated with blue dots, and red curves are plotted to represent the averages. An observation is that the growth of the straw price would lead to a greater stable percentage. The unit transportation cost and the transportation distance do not have significant impacts on the stable percentage. It is important to note that as the benefit sharing ratio increases, fewer farmers are willing to participate in the VC method when non-monetary utility is not included into the farmer agents’ payoff function as shown in Equation (5). This scenario represents the situation where farmers only care about monetary returns and the benefit sharing policy is not applied. In this scenario, the benefit sharing ratio is a proportion of the earnings retained by the VCs. Hence, without considering farmers’ non-monetary demand or sharing the benefit from straw selling, the farmers’ participation would decrease if more profit is allocated to the VCs.
Further, we quantify the impact of the VC’s benefit-sharing ratio on the stable percentage of farmers’ participation with the application of a benefit sharing policy. Figure 8 illustrates the impact with gray dots and a plot representing the free-ride results and green ones for the non-free-ride scenario. For comparison, the results without the consideration of non-monetary benefits are also depicted in this figure. It is important to note that the green and gray plots are more flat, which means when we consider the non-monetary benefit, the impact of the sharing ratio is not so significant because the profit allocated to VCs is not retained, but transformed into the immaterial utility that farmers can perceive. Comparing the green and gray plots, the stable percentage is lower in the free-ride scenario, especially when the benefit sharing ratio is high. From this observation, we can find that the prevalence of free rides could severely undermine farmers’ participation in the VC straw supply method. Only the welfare improving measures that are more specific to the farmers who supply straw can truly raise the participation.
In the multi-agent simulation, the farmers’ participation tend to be stable at 56% over time. Shastri et al. [23] developed an agent-based model to investigate Canadian farmers’ participation in energy crop planting. Their results also demonstrated the tendency that the farmers’ percentage would approach a certain value when the supply system reached stability. In contrast to their study, our paper examines the tendencies with various initial statuses. When the starting percentage is lower than the final stable value, it would increase to reach that level; otherwise, the approaching direction would be the opposite. Further, another observation is that a higher initial cooperative willingness of the VCs would raise the final stable participation of farmers. Thus, we suggest that the government encourages and supports rural official organizations to play an active role in the straw supply system. Based on the existing structure of the straw supply chain, Wang [13] investigated the straw supply amount with government incentives, which were implemented using direct subsidies to farmers, brokers, or plants corresponding to the straw quantities. From a different perspective, we focus on farmers’ participation in this study because the straw yield of one household of farmers is limited due to the small farming scale and there is a ceiling for the increasing of the straw amount from a single household. Furthermore, we reshape the straw supply chain with a co-opetition strategy involving farmers, rural official organizations, brokers, and plants. Jiang and Sun [27] proposed a co-opetition strategy involved with biomass plants and straw collection and supply enterprises, which are currently very rare in China’s agriculture with a low industrialization level. With regard to the affecting factors, our previous study [15] examined straw price, unit transportation cost, and transportation distance, and found that transportation distance was the major bottleneck the plant should carefully control to guarantee sufficient biomass feedstock. In this paper, the impact of unit transportation cost and transportation distance are reduced when we consider the benefit sharing policy. In addition, the benefit sharing ratio and free ride behavior could be the factors that have more significant impacts on farmers’ participation.
4. Conclusions and Policy Implications
Although China possesses abundant agricultural biomass resources and a large potential for biomass power generation, feedstock supply is insufficient due to the lack of a scientific supply chain. In this paper, we investigated the dynamics of farmers’ behavior within a co-opetition strategy, and built a multi-agent model to capture the core decision making behaviors of the participants along the straw supply chain. To apply the multi-agent model, simulation was conducted based on a practical case in China. The results demonstrate that: (1) Within a co-opetition supply strategy, the proportion of the farmers who choose to cooperate with the VCs will tend to be stable over time. The equilibrium proportion is affected by the cooperative willingness of the VCs in a positive relationship; (2) straw price, transportation cost, shipping distance, and the benefit sharing ratio of the VCs have impacts on the equilibrium proportion of farmers to different degrees. Straw price has a significant influence on the equilibrium proportion and a higher price leads to more farmers choosing to cooperate with the VCs. The co-opetition supply strategy mitigates the negative impacts of transportation cost and shipping distance; and (3) the impacts of the benefit sharing ratio depends on the methods of benefit sharing. In general, increasing the ratio will reduce the equilibrium proportion. Free-ride behaviors will further damage farmers’ willingness to cooperate. The implementation of a benefit sharing policy more specific to the farmers who supply straw for generation will improve the equilibrium proportion overall.
To the best of our knowledge, the real problems in China’s biomass supply chain are threefold: (1) The Chinese government is making efforts to promote biomass energy. Although rural official organizations have a strong influence among farmers, the government has not figured out an appropriate and specific method to use this influence to improve farmers’ supplying willingness; (2) if rural official organizations are introduced, which will change the structure of the biomass supply market, biomass power plants need a reasonable feedstock supply strategy to optimize their profit; and (3) how will the farmers react when the rural organization is incorporated? It is necessary for the rural organization to consider the farmers’ demand for public welfare and make a specific benefit sharing policy. Therefore, based on the findings of this paper, we make the following policy suggestions concerning the implementation of the co-opetition strategy:
- (1)
- The smooth operation of the straw supply chain within this strategy is closely related to farmers’ participation, which is positively affected by the cooperative enthusiasm of rural official organizations. Supporting policy is suggested to assist the VCs in the investment of straw collection machines and the reduction of transportation fees to improve their willingness of establishing the cooperative straw supply system;
- (2)
- The co-opetition strategy is suggested to be implemented combined with a benefit sharing policy, which is a supporting measure for the strategy to use part of the profit to improve villagers’ welfare. Currently, the economic development levels in some of China’s rural areas are so backward that the local villagers have strong expectations regarding improvements of local infrastructure. Considering the limited income from selling the straw produced by a single household of farmers and their intense immaterial demand of welfare improvement, collecting straw resources and sharing the benefits from selling it in bulk are helpful to increase villagers’ willingness to participate in the straw supply system; and
- (3)
- Free-ride behaviors will damage the effect of the co-opetition strategy. Rural official organizations are suggested to share benefits through welfare improving actions that are more specific to the farmers who supply straw (e.g., maintaining irrigation facilities, and providing pension insurance and medical care) to prevent the free-ride phenomenon.
The model will be extended in the future within the configuration of incomplete information and cooperative gaming. Biomass feedstock supply chains in different regions of China will be considered as more data become available. This study will eventually help determine a comprehensive and efficient supply system, integrating rural official organizations for China’s biomass plants.
Author Contributions
Funding acquisition, Q.T.; Methodology, K.L.; Project administration, Q.T.; Supervision, X.Z.; Writing—original draft, K.L.; Writing—review & editing, X.Z.
Funding
This research was funded by the National Natural Science foundation of China, grant number 71373077, the Major Program of the National Social Science Fund of China, grant No. 15ZDB165 and the 111 Project, grant number B18021.
Acknowledgments
The authors would like to thank the anonymous referees and the editor of this journal and gratefully acknowledge equally to the experts and farmers involved in the survey and interviews.
Conflicts of Interest
The authors declare no conflict of interest. The funders had no role in the design of the study; in the collection, analyses, or interpretation of data; in the writing of the manuscript, or in the decision to publish the results.
Appendix A

Table A1.
Notations in this study.
| Variable | Definition |
|---|---|
| Farmer’s profit per unit of straw (CNY/t) | |
| Straw supplied by the broker player (t) | |
| Straw supplied by the cooperative formed by farmers and the VC (t) | |
| Total straw purchased by the plant agent (t) | |
| Wood biomass purchased by the plant agent (t) | |
| Straw selling price charged by the farmer player (CNY/t) | |
| Straw factory-gate price (CNY/t) | |
| Wood biomass price (CNY/t); | |
| Straw collection cost coefficient | |
| Transportation cost per km∙t, CNY/(km∙t) | |
| Transportation distance, km | |
| Coefficient of plant’s revenue per unit of fired biomass (CNY/t); | |
| Price of biomass-based electricity (CNY/kWh) | |
| Unit operation cost for the plant (CNY/kWh) | |
| Conversion ratio of biomass to electricity (kWh/t) | |
| Fixed cost of the plant (CNY) | |
| Id number of farmer agents | |
| Id number of VC agents | |
| Numbers of farmers and VCs, respectively | |
| Straw yield, t/km2 | |
| Farmer i’s strategy choice in round t (= 0 or 1) | |
| Farmer i’s utility in round t | |
| VC j’s strategy choice in Round t (= 0 or 1) | |
| VC j’s profit in round t | |
| Benefit sharing ratio of VCs; 0 < λ < 1 | |
| Percentage of farmers choosing the VC method within VC j’s area | |
| Weight of monetary benefit for farmers | |
| Annual biomass demand of the plant agent (t) |
Table A2.
Parameter assumptions in the Monte Carlo simulation of our previous study.
| Parameter | Distribution |
|---|---|
| Constant: 240, 0.002 a | |
| Constant: 0.75 b | |
| Constant: 0.15 a | |
| Constant: 20 a | |
| Constant: 700 a | |
| Normal: Mean = 250, Standard Deviation = 20 a | |
| Constant: 300 a | |
| Triangular: Min = 2.5, Likeliest = 2.75, Max = 3 a | |
| Constant: 44.85 c | |
| Uniform: Min = 0, Max = 60 a |
a Collected in our field investigations. b According to the document, “Notice on Improvement of Power Pricing Policy for Agriculture and Forestry Biomass Generated”, released by the National Development and Reform Commission of China in July 2010. c Estimated according to the China Statistical Yearbook (2015).
References
- China’s National Development and Reform Commission. Enhanced Actions on Climate Change: China’s Intended Nationally Determined Contributions. 2015. Available online: http://www.gov.cn/xinwen/2015-06/30/content_2887330.htm (accessed on 2 July 2016).
- Thakur, A.; Canter, C.E.; Kumar, A. Life-cycle energy and emission analysis of power generation from forest biomass. Appl. Energy 2014, 128, 246–253. [Google Scholar] [CrossRef]
- Wang, C.; Zhang, L.; Chang, Y.; Pang, M. Biomass direct-fired power generation system in China: An integrated energy, GHG emissions, and economic evaluation for Salix. Energy Policy 2015, 84, 155–165. [Google Scholar] [CrossRef]
- China’s National Energy Administration. The 13th Five-Year Plan of Biomass Energy Development. 2016. Available online: http://zfxxgk.nea.gov.cn/auto87/201612/t20161205_2328.htm?keywords= (accessed on 9 December 2016).
- Wang, L.; Watanabe, T. A Stackelberg game theoretic analysis of incentive effects under perceived risk for China’s straw-based power plant supply chain. Energies 2016, 9, 455. [Google Scholar] [CrossRef]
- Ren, D.; Zhao, Y.; Xie, X.; Zhang, Q. Report on the Development of China’s Renewable Energy Industry (2015); China National Renewable Energy Centre: Beijing, China, 2015. [Google Scholar]
- Zhang, Q.; Zhou, D.; Fang, X. Analysis on the policies of biomass power generation in China. Renew. Sustain. Energy Rev. 2014, 32, 926–935. [Google Scholar] [CrossRef]
- Tan, Q.; Yang, H.; Zhang, X.; Deng, Y.; Wei, Y. Measurement Model and Empirical Analysis of Fuel Collection Cost for Biomass Power Generation. Forum Sci. Technol. China 2014, 21, 117–123. [Google Scholar]
- Liu, L.; Ye, J.; Zhao, Y.; Zhao, E. The plight of the biomass power generation industry in China—A supply chain risk perspective. Renew. Sustain. Energy Rev. 2015, 49, 680–692. [Google Scholar] [CrossRef]
- Ren, L.; Cafferty, K.; Roni, M.; Jacobson, J.; Xie, G.; Ovard, L.; Wright, C. Analyzing and Comparing Biomass Feedstock Supply Systems in China: Corn Stover and Sweet Sorghum Case Studies. Energies 2015, 8, 5577–5597. [Google Scholar] [CrossRef] [Green Version]
- Wang, X. Research on Farmers’ Behavior during the Development and Utilization of Biomass-Energy in China; Chinese Academy of Agricultural Sciences: Beijing, China, 2009. [Google Scholar]
- Qu, W.; Tu, Q.; Bluemling, B. Which factors are effective for farmers’ biogas use?—Evidence from a large-scale survey in China. Energy Policy 2013, 63, 26–33. [Google Scholar] [CrossRef]
- Wang, Y. The Studies of Biomass Power Generation Supply Chain Cooperation Patterns in the Game Situation; Nanjing University of Aeronautics and Astronautics: Nanjing, China, 2011. [Google Scholar]
- Zhang, X.; Luo, K.; Tan, Q. A feedstock supply model integrating the official organization for China’s biomass generation plants. Energy Policy 2016, 97, 276–290. [Google Scholar] [CrossRef]
- Zhang, X.; Luo, K.; Tan, Q. A Game Theory Analysis of China’s Agri-biomass-based Power Generation Supply Chain: A Co-opetition Strategy. Energy Procedia 2017, 105, 168–173. [Google Scholar] [CrossRef]
- Fundenberg, D.; Tirole, J. Game Theory; MIT Press: Cambridge, MA, USA, 1991. [Google Scholar]
- Weibull, J.W. Evolutionary Game Theory; The MIT Press: Cambridge, MA, USA, 1995. [Google Scholar]
- Cao, H.; Zhang, S.Y. Analysis of the main interests of agricultural insurance main body based on the perspective of evolutionary game. Agric. Agric. Sci. Proc. 2010, 1, 354–363. [Google Scholar] [CrossRef]
- Wang, Y.; Meng, W. Evolutionary game analysis on co-competition mechanism of supply chain. J. Ind. Eng./Eng. Manag. 2004, 18, 96–98. [Google Scholar]
- Chaib-Draa, B.; Muller, J. Multiagent Based Supply Chain Management; Springer: Berlin, Germany, 2006. [Google Scholar]
- Ge, H.; Gray, R.; Nolan, J. Agricultural supply chain optimization and complexity: A comparison of analytic vs simulated solutions and policies. Int. J. Prod. Econ. 2015, 159, 208–220. [Google Scholar] [CrossRef]
- Moncada, J.A.; Lukszo, Z.; Junginger, M.; Faaij, A.; Weijnen, M. A conceptual framework for the analysis of the effect of institutions on biofuel supply chains. Appl. Energy 2017, 185, 895–915. [Google Scholar] [CrossRef]
- Shastri, Y.; Rodrguez, L.; Hansen, A.; Ting, K.C. Agent-based analysis of biomass feedstock production dynamics. Bioenergy Res. 2011, 4, 258–275. [Google Scholar] [CrossRef]
- Xiong, W.; Wei, P. Evolutionary analysis on co-comeptition relationship among enterprises of supply chain net based on multi-agent. J. Syst. Sci. Math. Sci. 2015, 37, 779–787. [Google Scholar]
- Sun, J.; Chen, J.; Xi, Y.; Hou, J. Mapping the cost risk of agricultural residue supply for energy application in rural China. J. Clean. Prod. 2011, 19, 121–128. [Google Scholar] [CrossRef]
- Luo, K.; Zhang, X.; Tan, Q. Novel role of rural official organization in the biomass-based power supply chain in China: A combined game theory and agent-based simulation approach. Sustainability 2016, 8, 814. [Google Scholar] [CrossRef]
- Jiang, N.; Sun, J. The strategy of co-opetition research for the straw supply market in the technology of straw and coal hybrid co-firing. J. Xi’an Jiaotong Univ. (Soc. Sci.) 2015, 35, 47–52. [Google Scholar]
Figure 1.
Supply chain architectures in (a) competition, (b) co-opetition, and (c) cooperation scenarios.
Figure 1.
Supply chain architectures in (a) competition, (b) co-opetition, and (c) cooperation scenarios.

Figure 2.
Simulation flowchart.
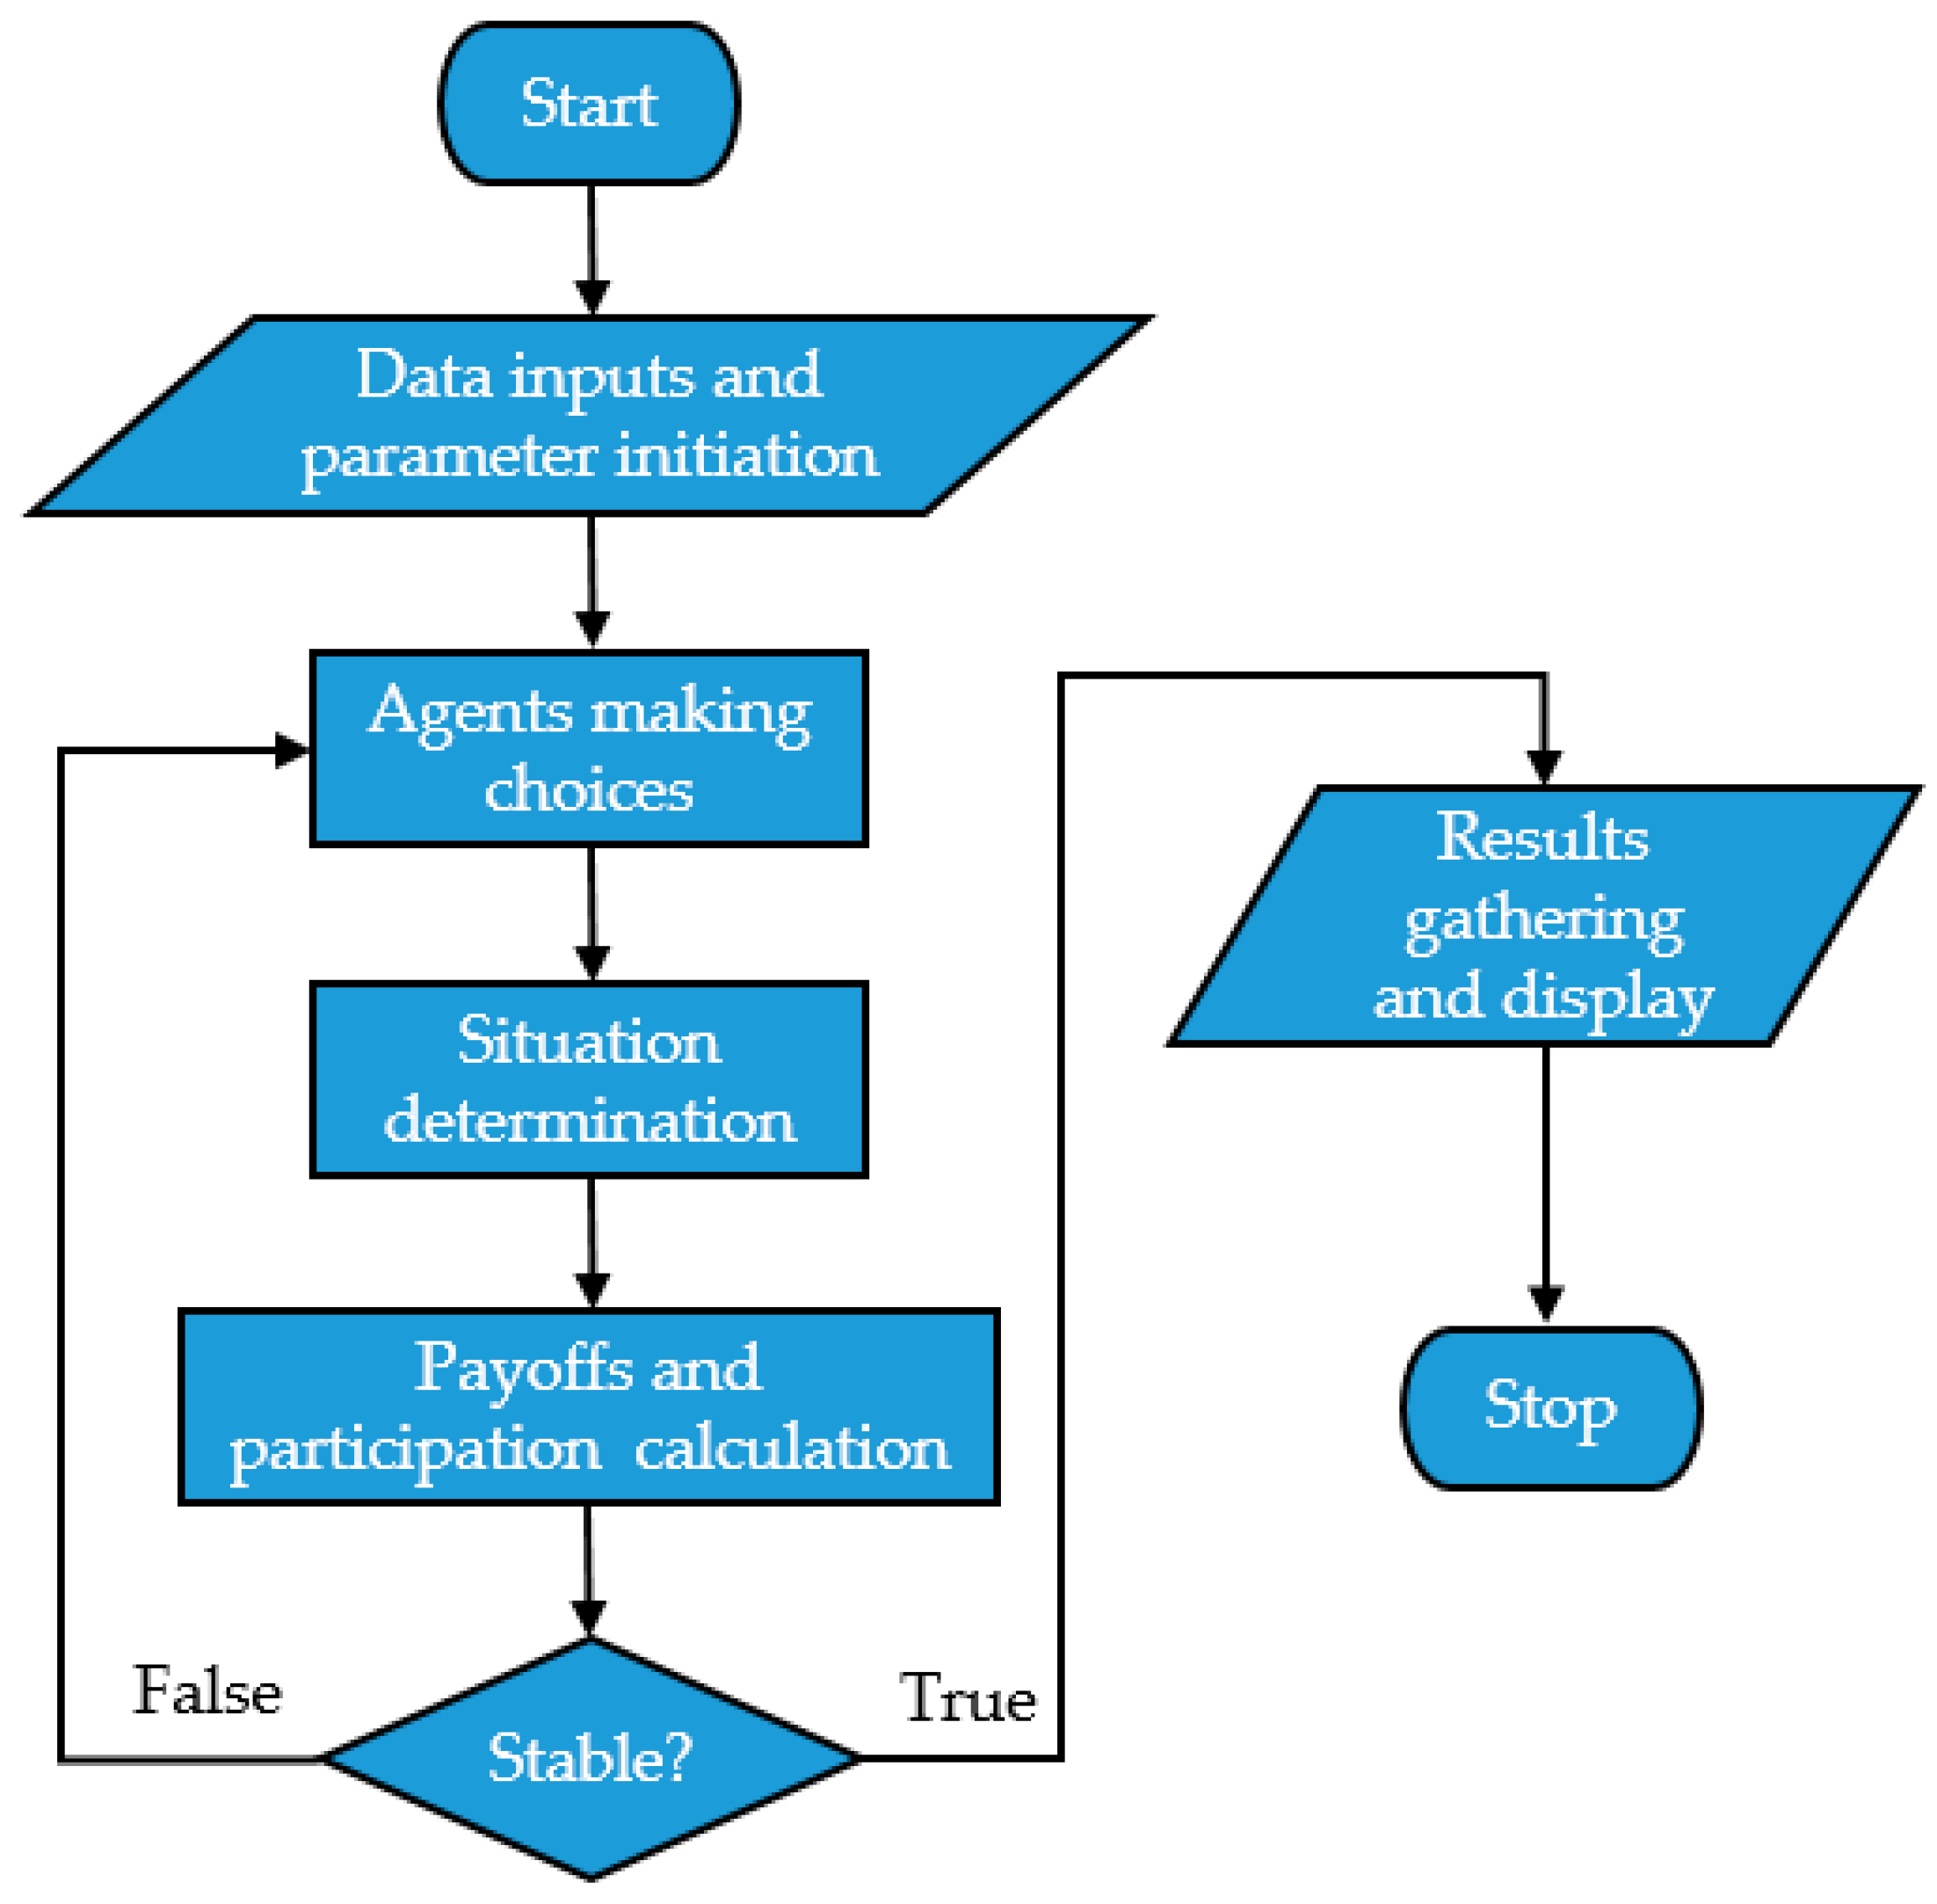
Figure 3.
Tendency of the percentages of farmers and villagers’ committees (VCs) with various initial values.
Figure 3.
Tendency of the percentages of farmers and villagers’ committees (VCs) with various initial values.
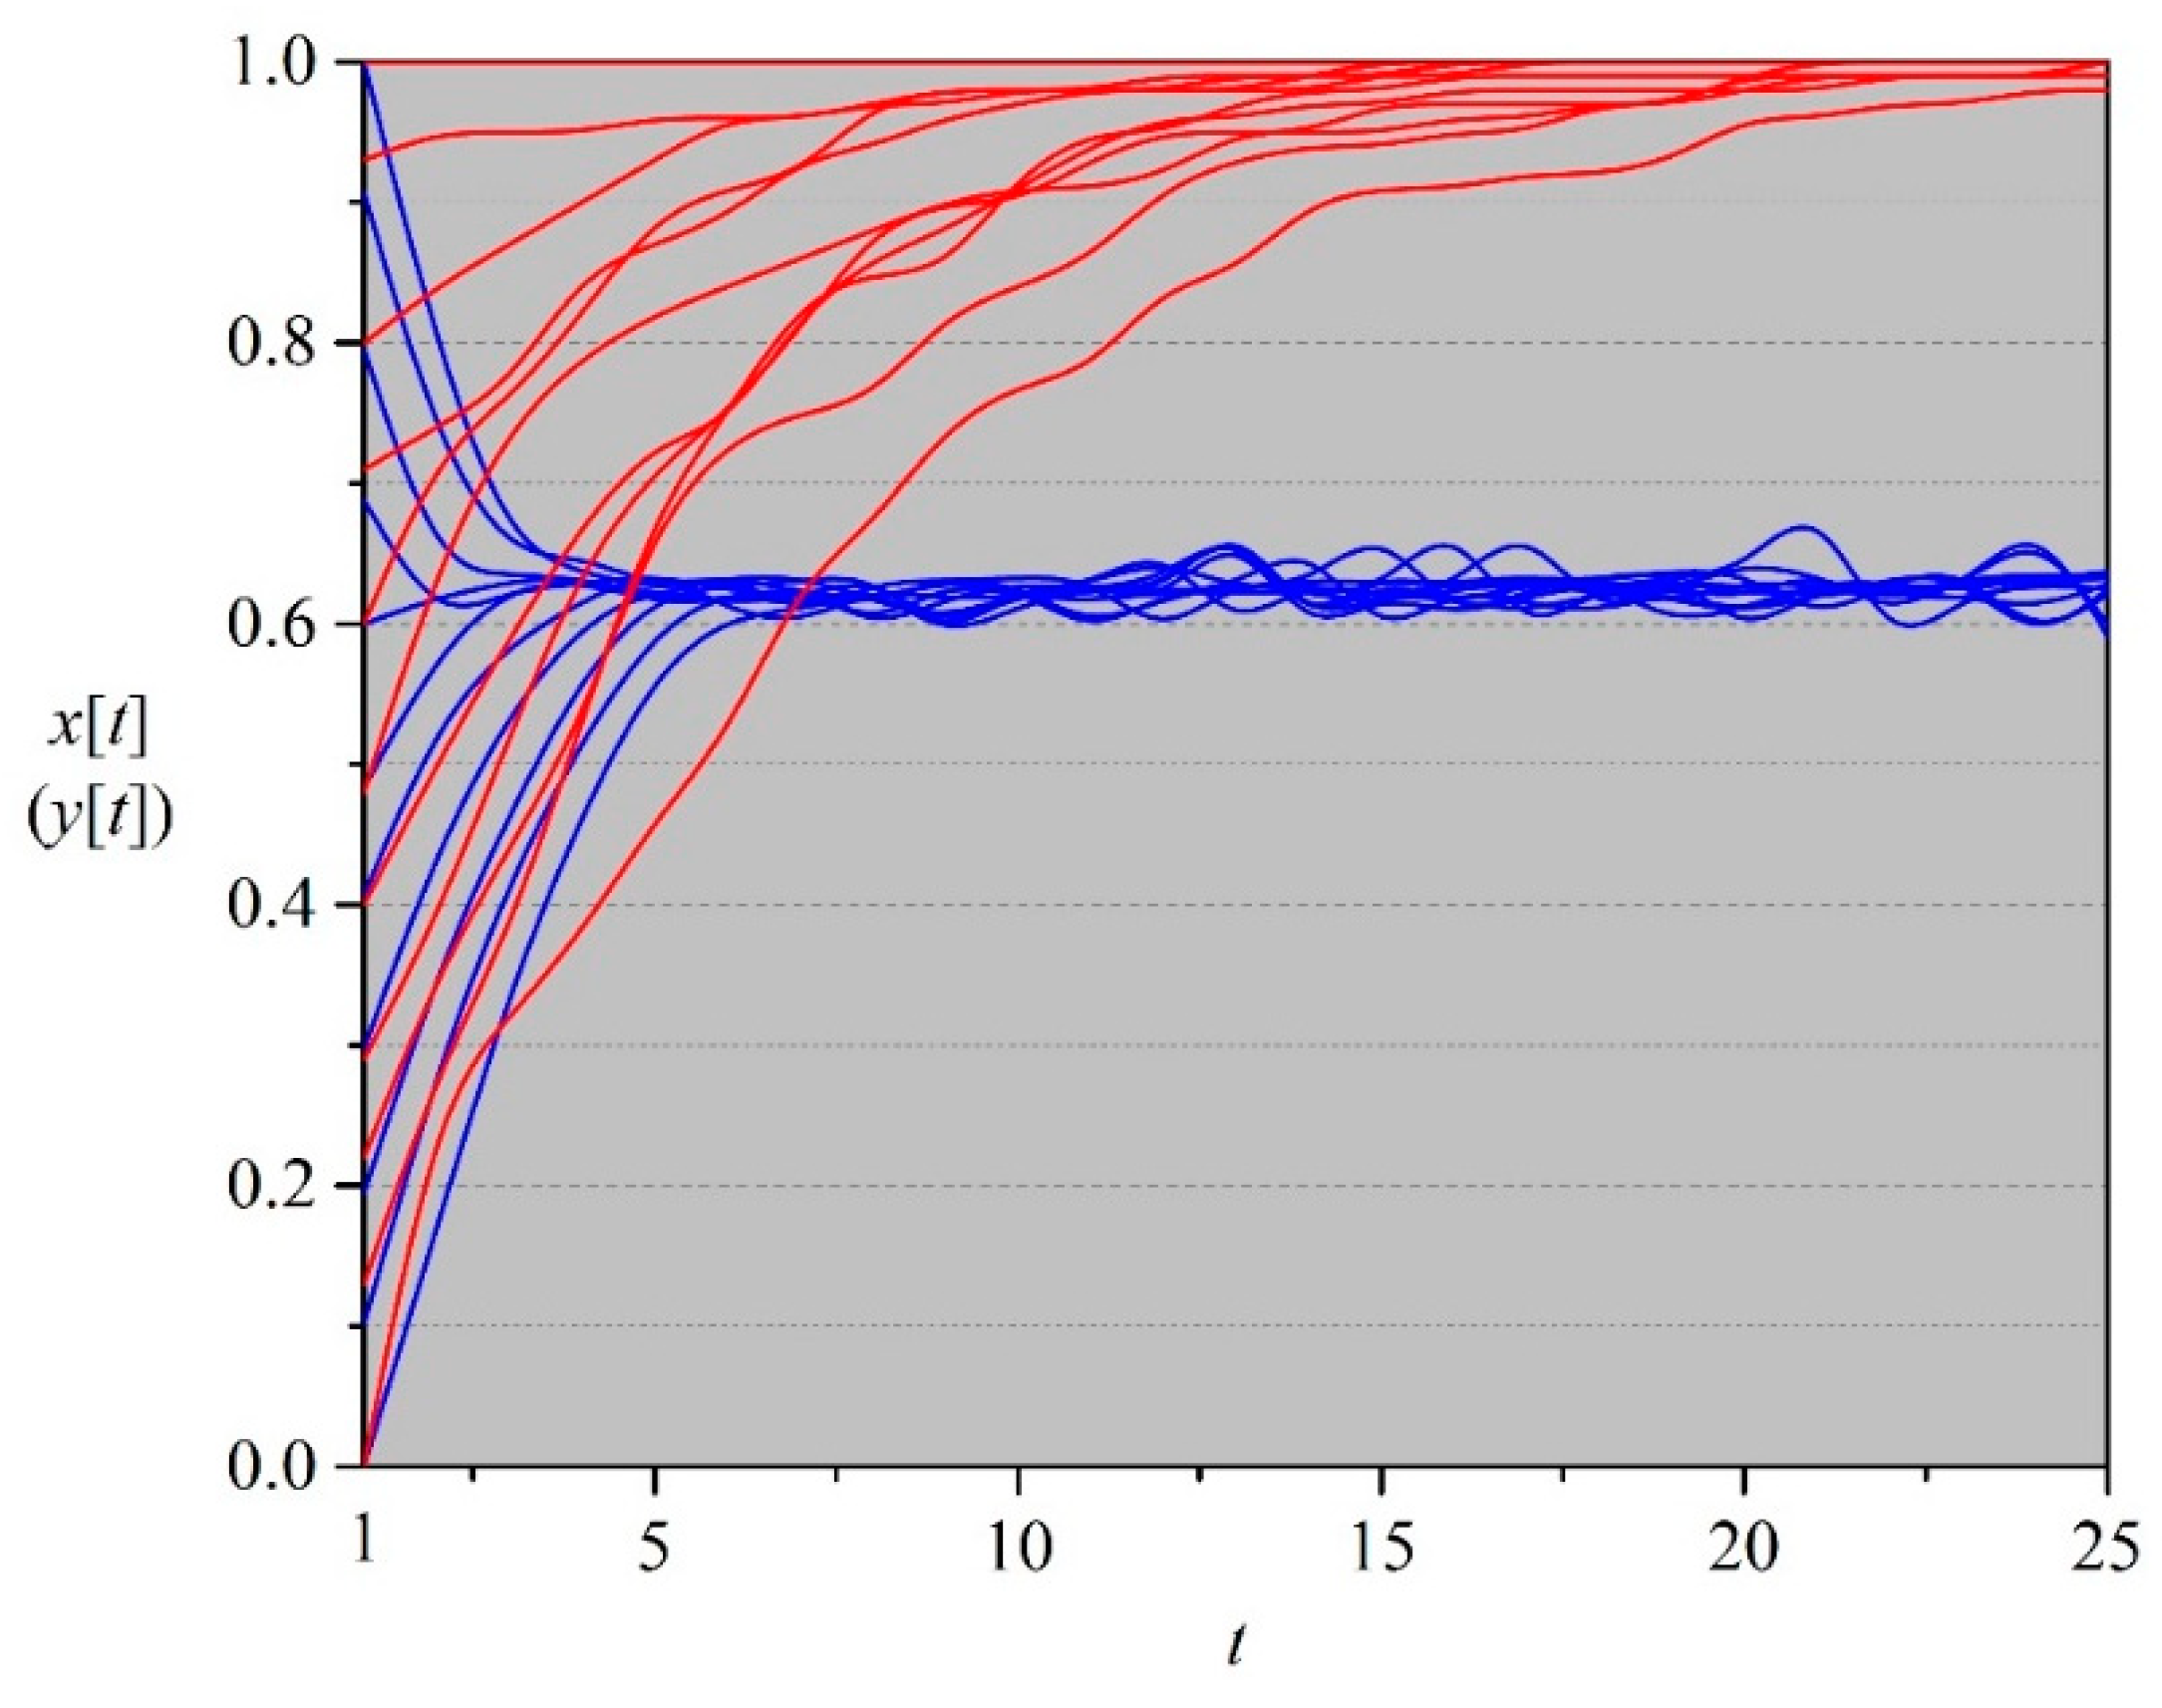
Figure 4.
Exploration of the relationship between the stable percentage of farmers and initial state.
Figure 4.
Exploration of the relationship between the stable percentage of farmers and initial state.
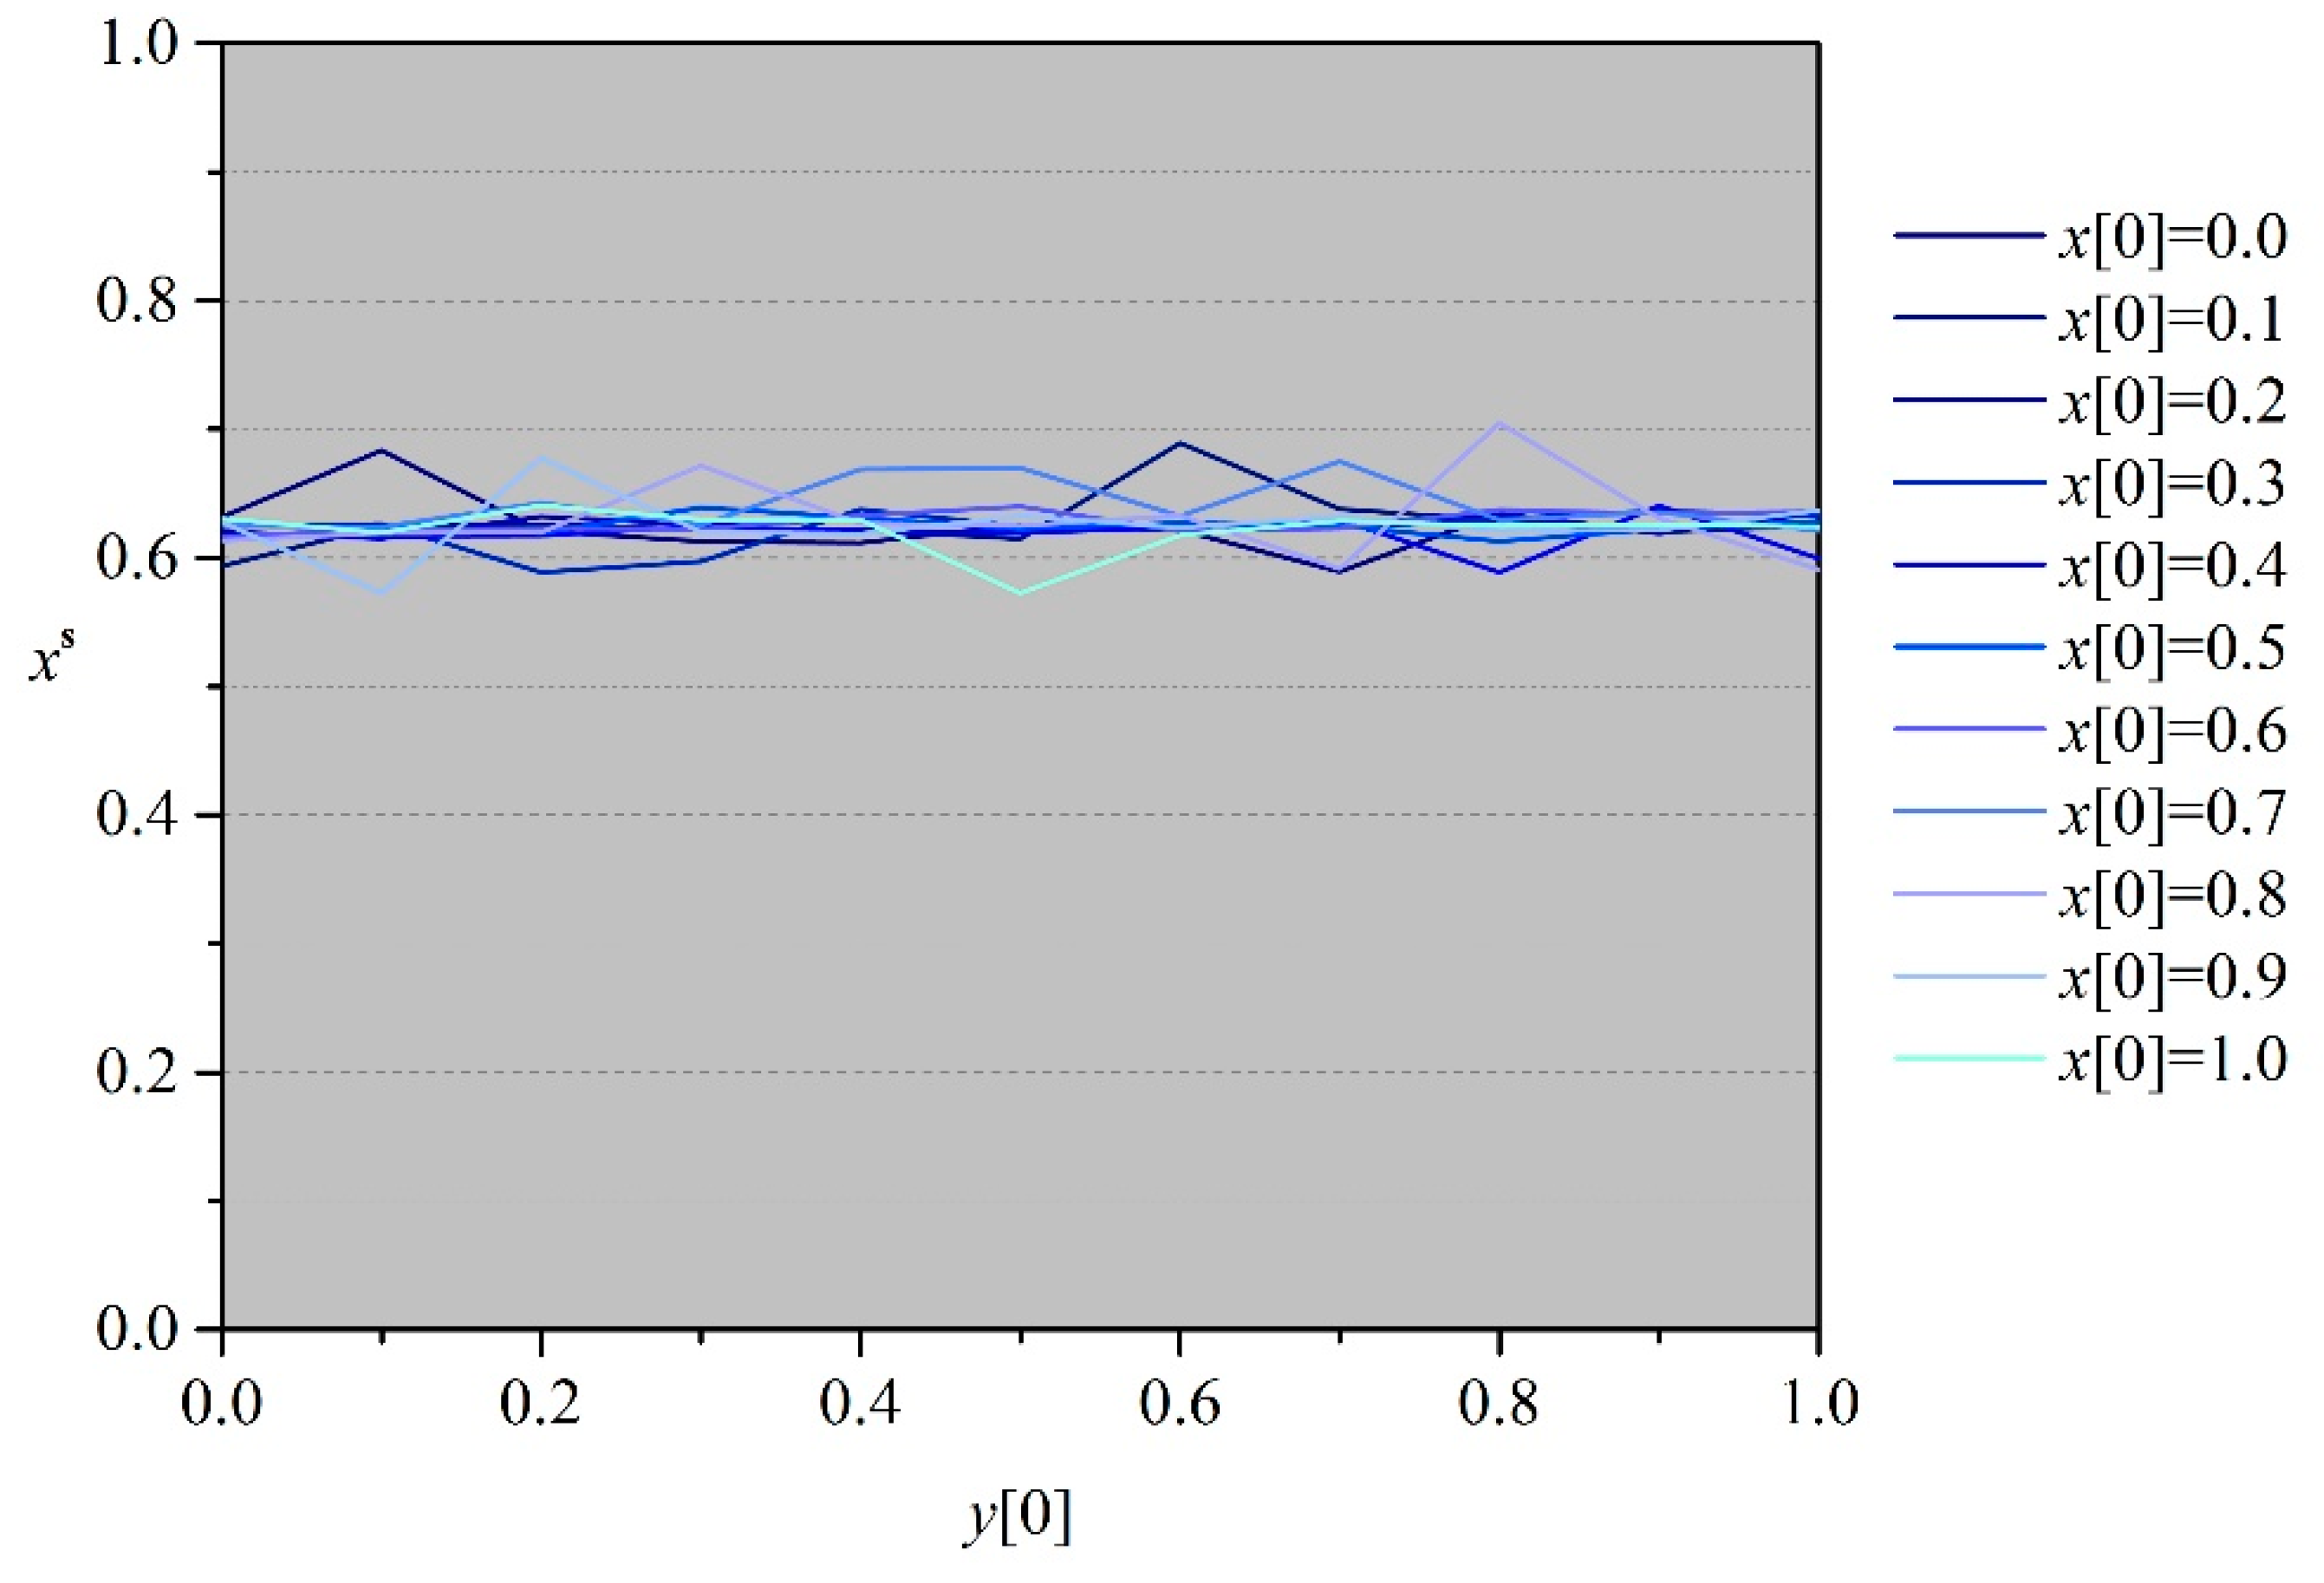
Figure 5.
Initial and final percentages of farmers and VCs with uncertainty.
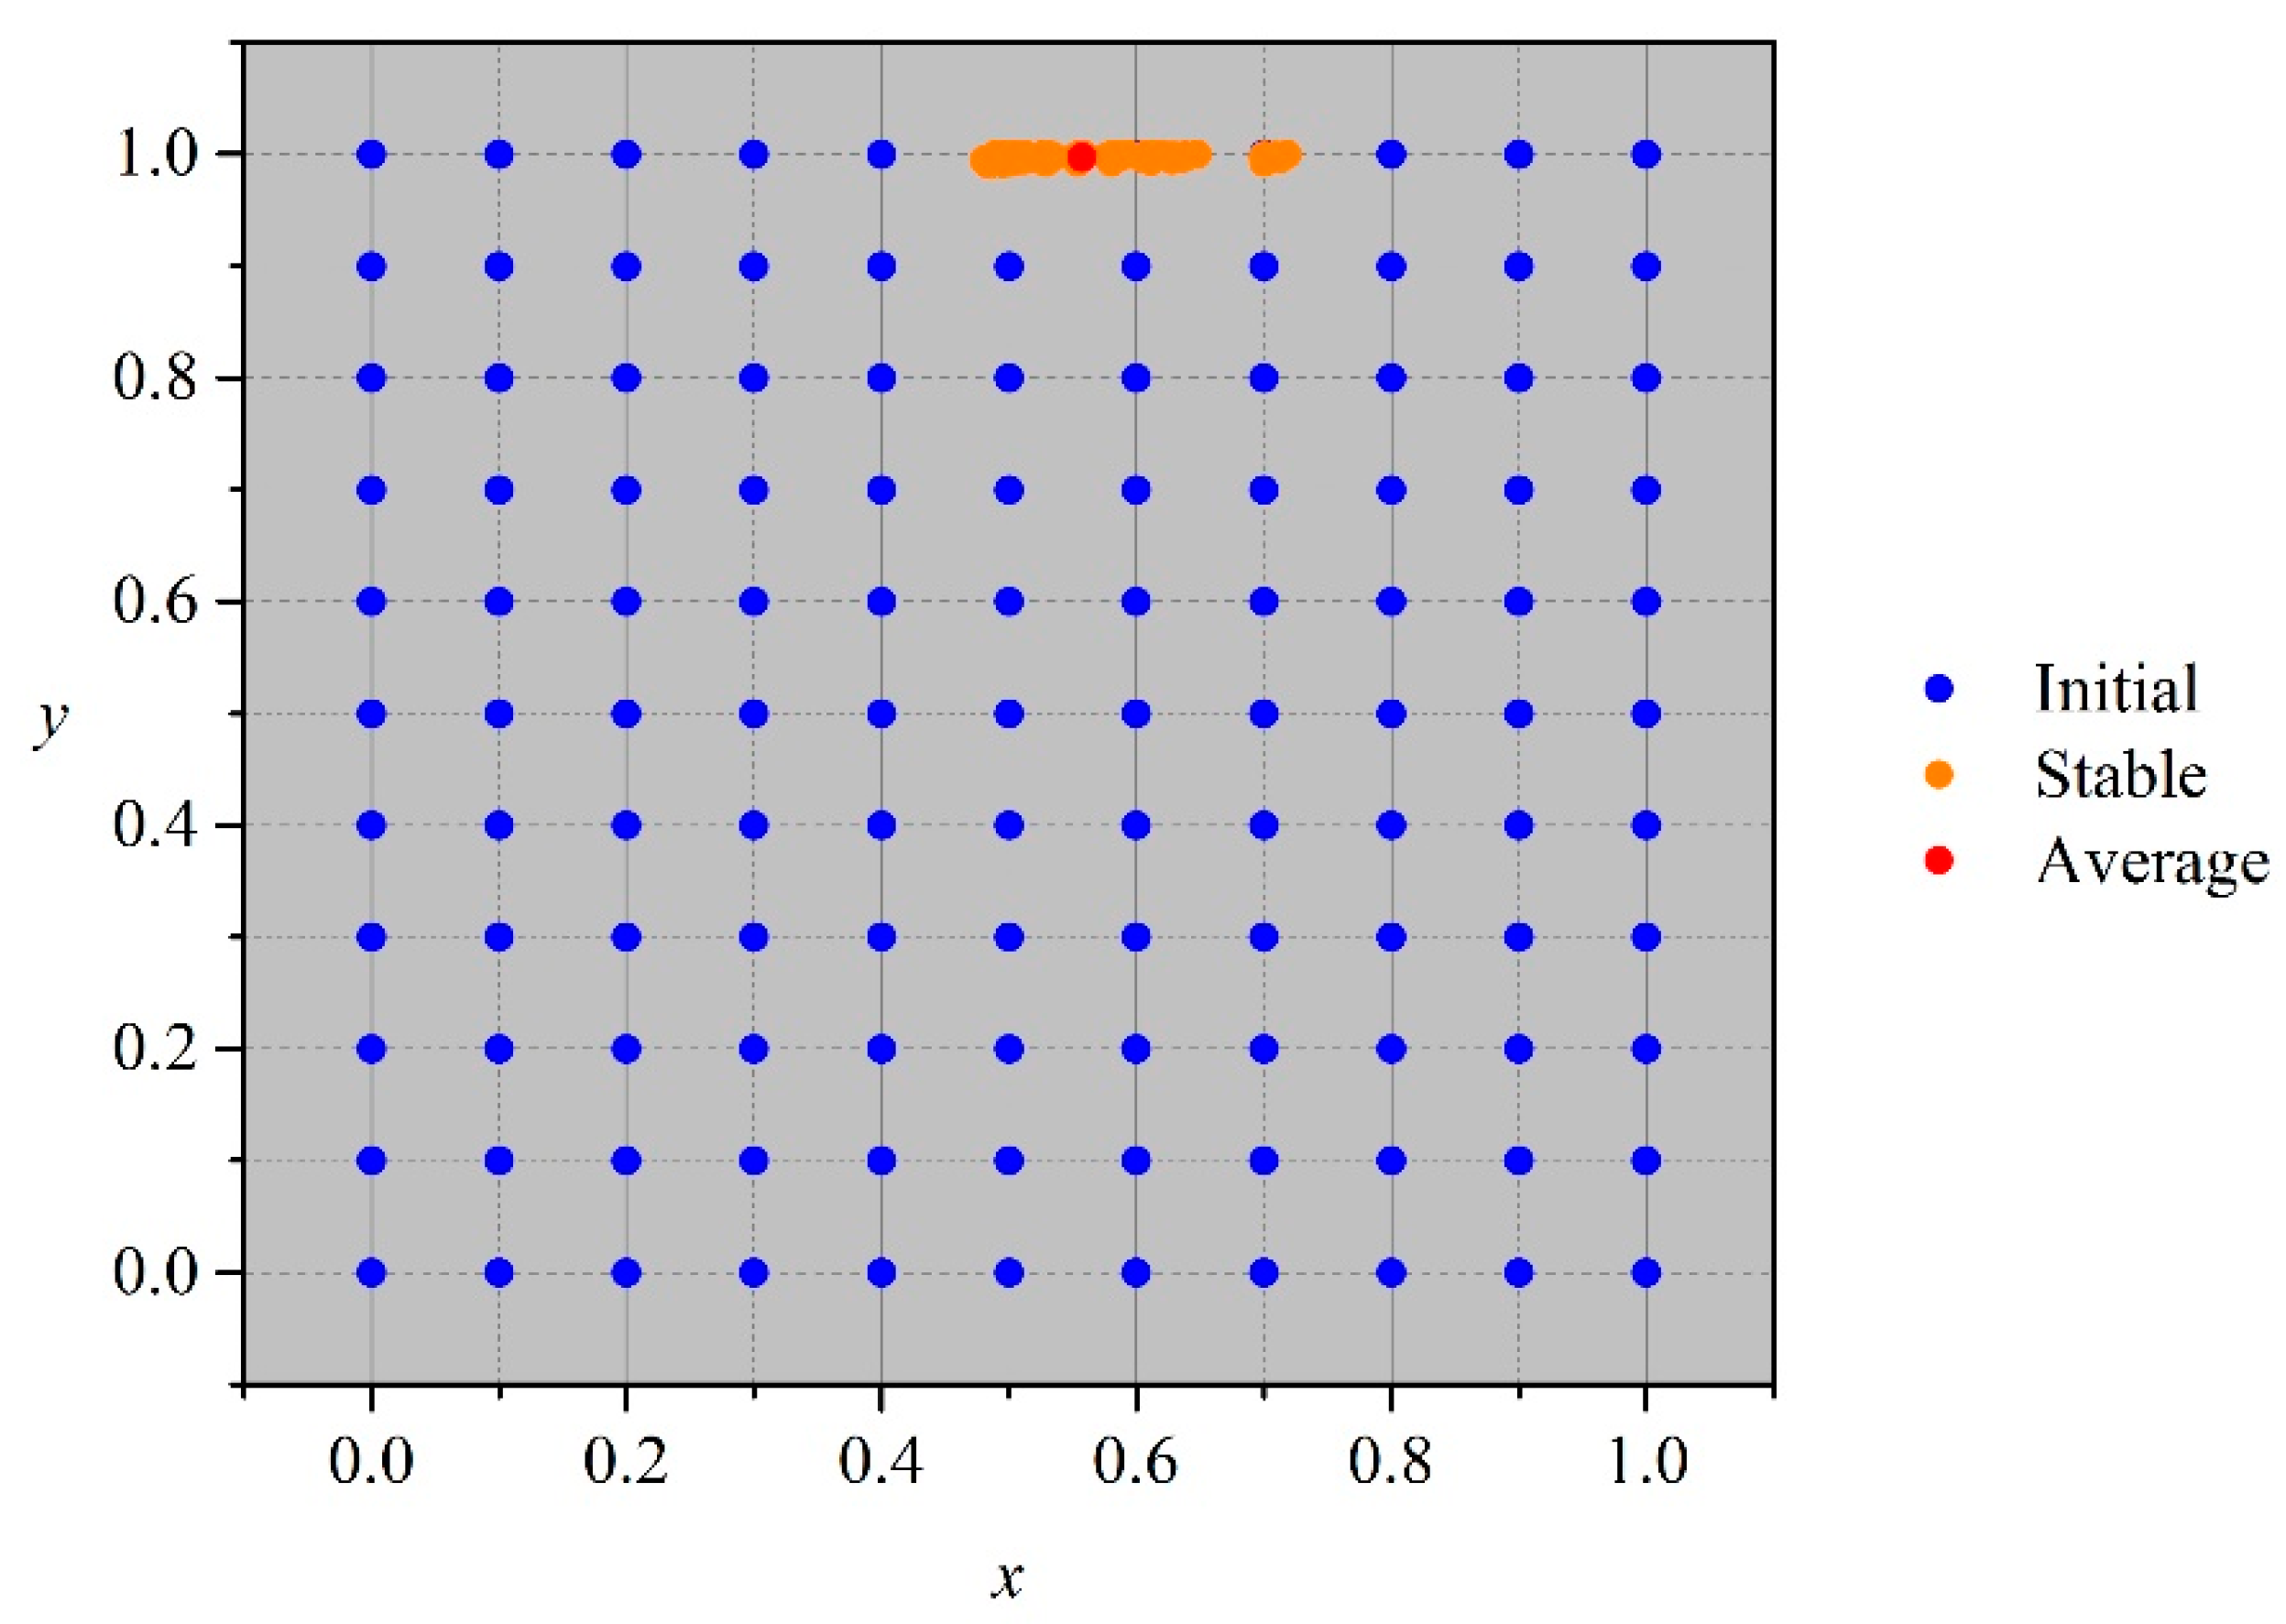
Figure 6.
Exploration of the relationship between , , and with uncertainty.
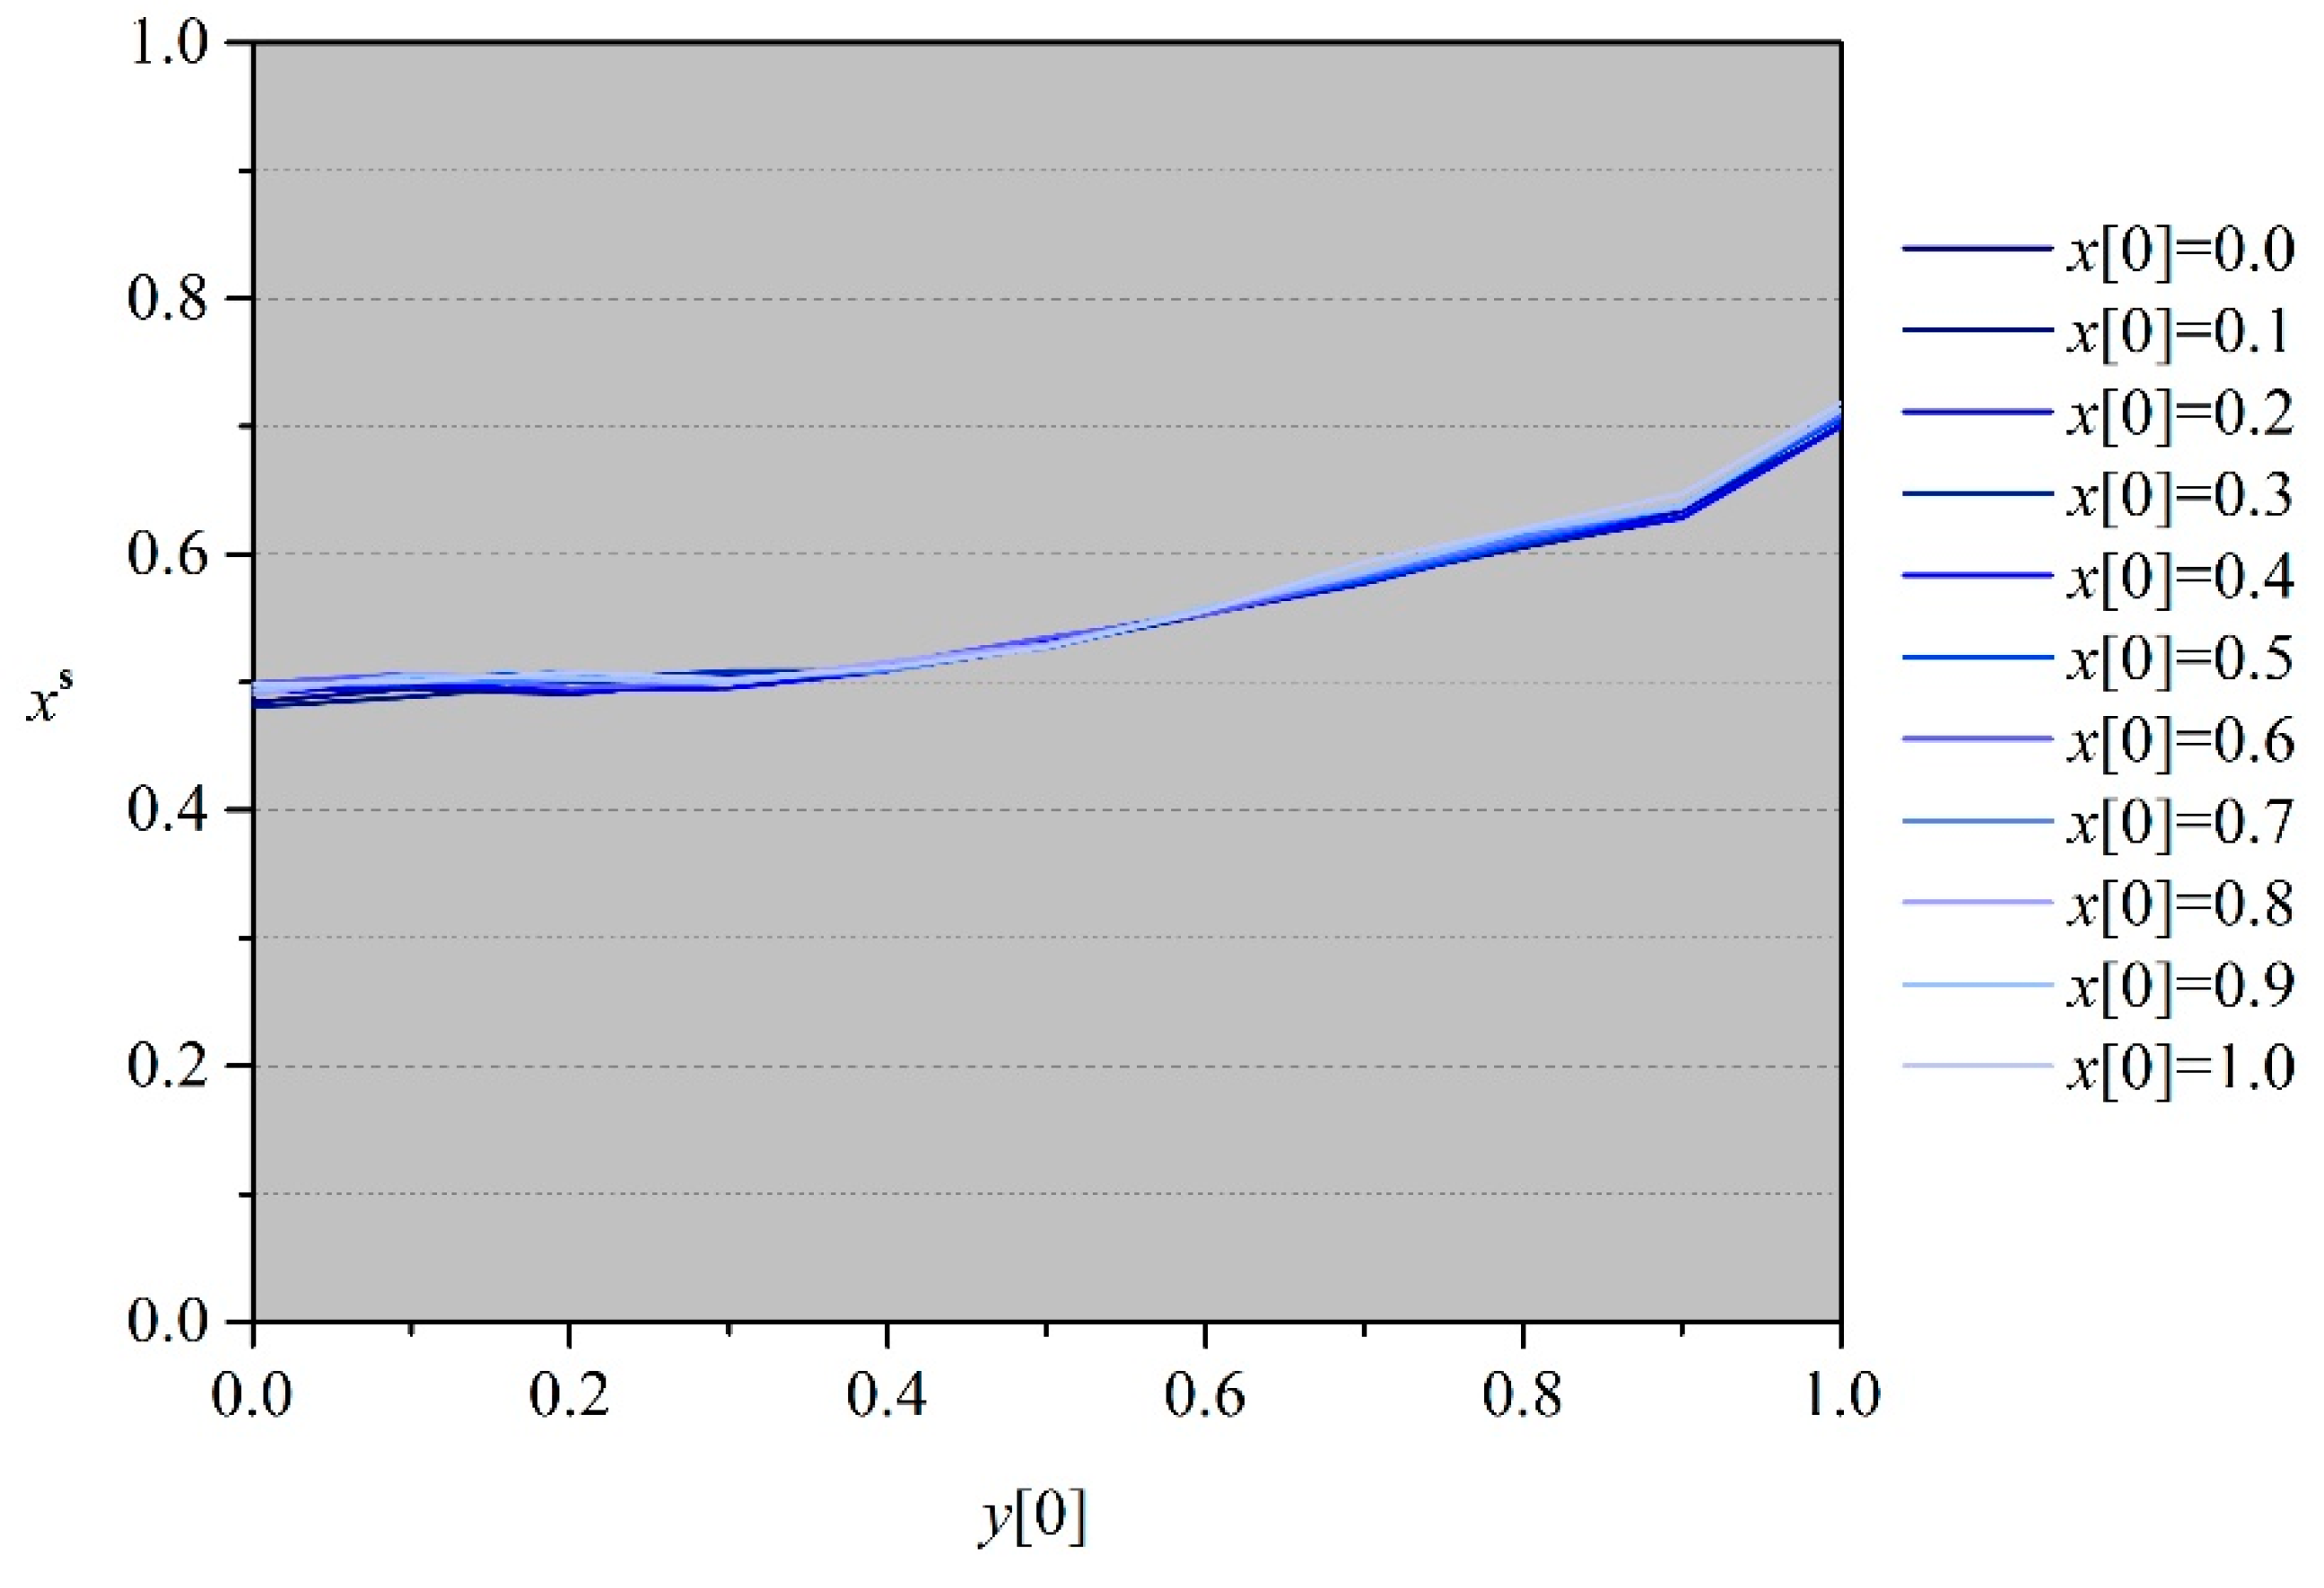
Figure 7.
Impacts of (a) the straw price, (b) the unit transportation cost, (c) the transportation distance, and (d) the benefit sharing ratio on the stable percentage of farmers choosing the VC method.
Figure 7.
Impacts of (a) the straw price, (b) the unit transportation cost, (c) the transportation distance, and (d) the benefit sharing ratio on the stable percentage of farmers choosing the VC method.

Figure 8.
Impact of the benefit-sharing ratio on the stable percentage of farmers choosing the VC method with and without free rides.
Figure 8.
Impact of the benefit-sharing ratio on the stable percentage of farmers choosing the VC method with and without free rides.

Table 1.
Parameter assumptions in the multi-agent simulation.
| Parameter | Distribution |
|---|---|
| Constant: 50 a | |
| Constant: 100 a | |
| Constant: 0.2 b | |
| Scenario without uncertainty | |
| Constant: 250 | |
| Constant: 2.75 | |
| Constant: 30 | |
| Scenario with uncertainty | |
| Normal: Mean =250, Standard Deviation = 20 | |
| Triangular: Min = 2.5, Likeliest = 2.75, Max = 3 | |
| Uniform: Min = 0, Max = 60 | |
a Assumed for the simulation; b referring to [14].
© 2018 by the authors. Licensee MDPI, Basel, Switzerland. This article is an open access article distributed under the terms and conditions of the Creative Commons Attribution (CC BY) license (http://creativecommons.org/licenses/by/4.0/).
Share and Cite
MDPI and ACS Style
Luo, K.; Zhang, X.; Tan, Q. A Co-Opetition Straw Supply Strategy Integrating Rural Official Organizations and Farmers’ Behavior in China. Energies 2018, 11, 2802. https://doi.org/10.3390/en11102802
AMA Style
Luo K, Zhang X, Tan Q. A Co-Opetition Straw Supply Strategy Integrating Rural Official Organizations and Farmers’ Behavior in China. Energies. 2018; 11(10):2802. https://doi.org/10.3390/en11102802
Chicago/Turabian StyleLuo, Kaiyan, Xingping Zhang, and Qinliang Tan. 2018. "A Co-Opetition Straw Supply Strategy Integrating Rural Official Organizations and Farmers’ Behavior in China" Energies 11, no. 10: 2802. https://doi.org/10.3390/en11102802
Note that from the first issue of 2016, this journal uses article numbers instead of page numbers. See further details here.