Large Eddy Simulation of Turbulent Attached Cavitating Flows around Different Twisted Hydrofoils

1
School of Energy and Power Engineering, Nanjing University of Science and Technology, Nanjing 210094, China
2
Aviation Key Laboratory of Science and Technology on Aero Electromechanical System Integration Nanjing Engineering Institute of Aircraft Systems, Nanjing 211100, China
3
School of Mechanical Engineering, Beijing Institute of Technology, Beijing 100081, China
*
Author to whom correspondence should be addressed.
Energies 2018, 11(10), 2768; https://doi.org/10.3390/en11102768
Submission received: 30 August 2018
/
Revised: 8 October 2018
/
Accepted: 12 October 2018
/
Published: 16 October 2018
Abstract
:In this paper, the turbulent attached cavitating flows around two different twisted hydrofoils, named as NACA0009 and Clark-y, are studied numerically, with emphasis on cavity shedding dynamic behavior and the turbulence flow structures. The computational method of large eddy simulation (LES) coupled with a homogeneous cavitation model is applied and assessed by previous experimental data. It was found that the predicted results were in good agreement with that of the experiment. The unsteady cavity morphology of the two hydrofoils undergoes a similar quasi-periodic process, but has different shedding dynamic behavior. The scale of the U-type shedding structures forming on the suction surface of NACA0009 is larger than that of Clark-y. This phenomenon is also present in the iso-surface distributions of Q-criterion. Otherwise, the time-averaged cavity morphology is dramatically different for the two hydrofoils, and it is found that the attached location of the cavity is closely related to the hydrofoil geometry. The time fluctuation of the lift force coefficients is affected significantly by the cavity shedding dynamics. Compared with NACA0009, the lift force of Clark-y shows more fluctuation, due to its complicated shedding behavior. Further analysis of the turbulent structure indicates that the more violent shedding behaviors can induce higher levels of turbulence velocity fluctuations.

1. Introduction
Cavitation is a very important flow phenomenon that influences the design and operation of hydraulic machines [1,2,3,4], such as pumps, ship propellers, and turbomachinery. A better understanding of the cavitating flow mechanism is substantially necessary for effective cavitation control in engineering designs [5].
Owing to the great efforts of many researchers in the past, knowledge of turbulent cavitating flows have been remarkably improved recently. Some attention has been focused on the time-evolution features of unsteady cavitating flows around various physical models. For example, Wang et al. [6] experimentally observed the unsteady cloud cavitating flow structures around a two-dimensional Clark-y hydrofoil; Barre et al. [7] studied the attached sheet cavitating flows in venture; Wu et al. [8] studied the transient characteristics of cloud cavitating flow around a flexible hydrofoil; Gopalan and Katz [9] investigated the flow structure in the closure region of attached cavitating flow in nozzles; Foeth [10] made numerous experiments to study the sheet/cloud cavitating structures around different three-dimensional (3D) hydrofoils; Luo et al. [11] observed the unsteady cavity behaviors around a mini hydrofoil, and studied the Reynolds number effect on cavitation scale; and Wang et al. [12] studied unsteady cavitating flow around an axisymmetric projectile, and discussed the effect of free surface on the cavity.
Although these transient cavitating flows present different flow structures, the mechanism of their unsteadiness and shedding dynamics are similar. Arndt [13] suggested that the re-entrant jet physics and bubbly flow shock wave were the two mechanisms for inducing shedding behavior in unsteady cavitating flows. Ganesh et al. [14] conducted a series of experiments and found that the formation and propagation of a bubbly shock wave could cause large-scale shedding of an attached cavity at a small enough cavitation number. Wang [15] also indicated that a bubbly shock wave can cause void fraction discontinuity in sheet/cloud cavitating flows in a convergent–divergent channel. Actually, the mechanism of the re-entrant jet-induced shedding is typical, and widely studied by many researchers. As early as 1955, Knapp [16] found and reported the re-entrant jet in cavitating flows. The re-entrant jet, known as the main cause of cavity shedding, was proved and demonstrated by Kawanami et al. [17]. This result was confirmed again by many other researchers, such as Pendar and Roohi [18], Park and Rhee [19], Dular et al. [20], and so on. Besides, the re-entrant jet behavior of impingement on cavity interface was observed to be responsible for the periodic features of unsteady cavitation [21], and this conclusion was also proved by Le et al. [22] and Pham et al. [23].
On the other hand, it was found that turbulent cavitating flows often involve complex vortex structures. Meanwhile, as the use of the large eddy simulation (LES) method in computational fluid dynamics (CFD) has dramatically increased; in recent years, many researchers have applied the LES method to study turbulence–cavitation interactions. Ji et al. [24] used the LES method, proposed first by Smagorinsky [25], to simulating the turbulent attached cavitating flows around a two-dimensional Clark-y hydrofoil and found that the turbulence velocity fluctuation is much influenced by the cavity shedding. Based on the same case as Ji et al. [24], Huang et al. [26] found that the interaction between leading and trailing edge vortices was significantly influenced by the unsteady cavity. Luo et al. [27] studied the vortex structures and pressure fluctuations in the unsteady cavitating flow around a twisted hydrofoil using the LES method. Dittakavi [28] applied LES to study the turbulent–cavitation interactions in a Venturi nozzle. Gnanaskandan and Mahesh [29] simulated the unsteady cavitating flows around a wedge, based on the LES method, and found that streamwise and spanwise fluctuations are equally important at the cavity closure and in the wake. Liu et al. [30] used the LES method to simulate the cavitating flow around hydrofoil ALE15, and they found that the cavitation–vortex interaction is mainly affected by the vortex stretching and dilatation terms. Chen et al. [31] applied the LES method to investigate the cavitation shedding regime around a 3D twisted hydrofoil. It should be noted that due to its great advantages for simulating complex vortex structures in turbulent cavitating flows, the LES method has been widely used in other research [32,33,34,35,36,37]. As the fundamental studies, all of the studies mentioned above have enhanced the understanding of turbulence dynamics in unsteady cavitating flows.
Inspired by previous work, this paper applies the LES method to investigate the turbulent cavitating flows around two different twisted hydrofoils. Although there has been literatures [5,10] about the cavitation phenomenon around different twisted hydrofoils, some detailed discussions about differences of cavitating characteristics are still an interesting and attractive topic for engineering applications, such as the blade designs for turbo-machinery and marine propellers. Moreover, turbulence-cavitation interactions remain a difficult issue. Therefore, the present paper makes comparisons of unsteady cavitating flows around two different twisted hydrofoils, with special emphasis on the interactions between the shedding dynamics and turbulent fluctuations.
2. Numerical Methods and Validation
The present work applied the LES method, coupled with the cavitation model proposed by Zwart et al. [38], in order to simulate unsteady cavitating flows under the frame of a homogenous multiphase flow assumption. The details of the solver are given as follows.
In the homogenous multiphase flow, each fluid phase is assumed to share the same velocity and pressure field. The basic governing equations contain the mass and momentum conservation equations, shown as Equations (1) and (2):
where u with different subscripts i and j presents the velocity component in different coordinate directions, ρm is the mixture density, p is the pressure, and μm is the mixture dynamic viscosity.
For the LES approach, after a Favre-filtering operation to Equations (1) and (2), the LES basic equations are given as below:
where the variables with over-bars indicate the filtered quantities. Another new term τij, naming the sub-grid scale stresses, is added in Equation (4), and is defined as:
A widely used modeling method is the eddy-viscosity model, which assumes that the sub-grid scale stresses τij are proportional to the modulus of the strain rate tensor of the filter’s large-scale flow. The following equation denotes this relationship:
where μt is the sub-grid scale turbulent viscosity, which is closed by the wall-adopting local eddy (WALE) viscosity model [39] in this work. The corresponding definitions in the WALE model are as follows:
where Ls is the mixing length for the sub-grid stresses, k is von Karman’s constant, d represents the distance to the closest wall, and V is the volume of the computational cell. The default WALE constant Cw is set to 0.5.
For the cavitation process, the mass transfer equation is expressed as below:
where is the water volume fraction. The source terms and denote the condensation and evaporation rates. In the present work, the source terms are expressed by the Zwart cavitation model. This model is derived from a simplified Rayleigh-Plesset equation, neglecting the second order derivative of the bubble radius, the surface tension term, and the viscous term. Then the source terms and are defined as:
where Fc and Fe are two empirical coefficients for the condensation and vaporization processes, and αnuc and RB respectively represent the volume fraction and the radius of the nucleation sites. These empirical constants in the ANSYS CFX (18.0 Version, ANSYS, Canonsburg, PA, USA) software [40] are set to Fc = 0.01, Fe = 50, αnuc = 5 × 10⁻⁴, and RB = 1 × 10⁻⁶ m. The Zwart cavitation model has been widely used to simulate cavitating flows, and more descriptions about this popular numerical method can be found in [41,42,43,44].
Brief introductions of the simulation cases are listed in Table 1. Case 1 is used to validate the numerical method again. The other two cases with the same flow condition are simulated to investigate the differences of unsteady cavitating flows between the two hydrofoils.
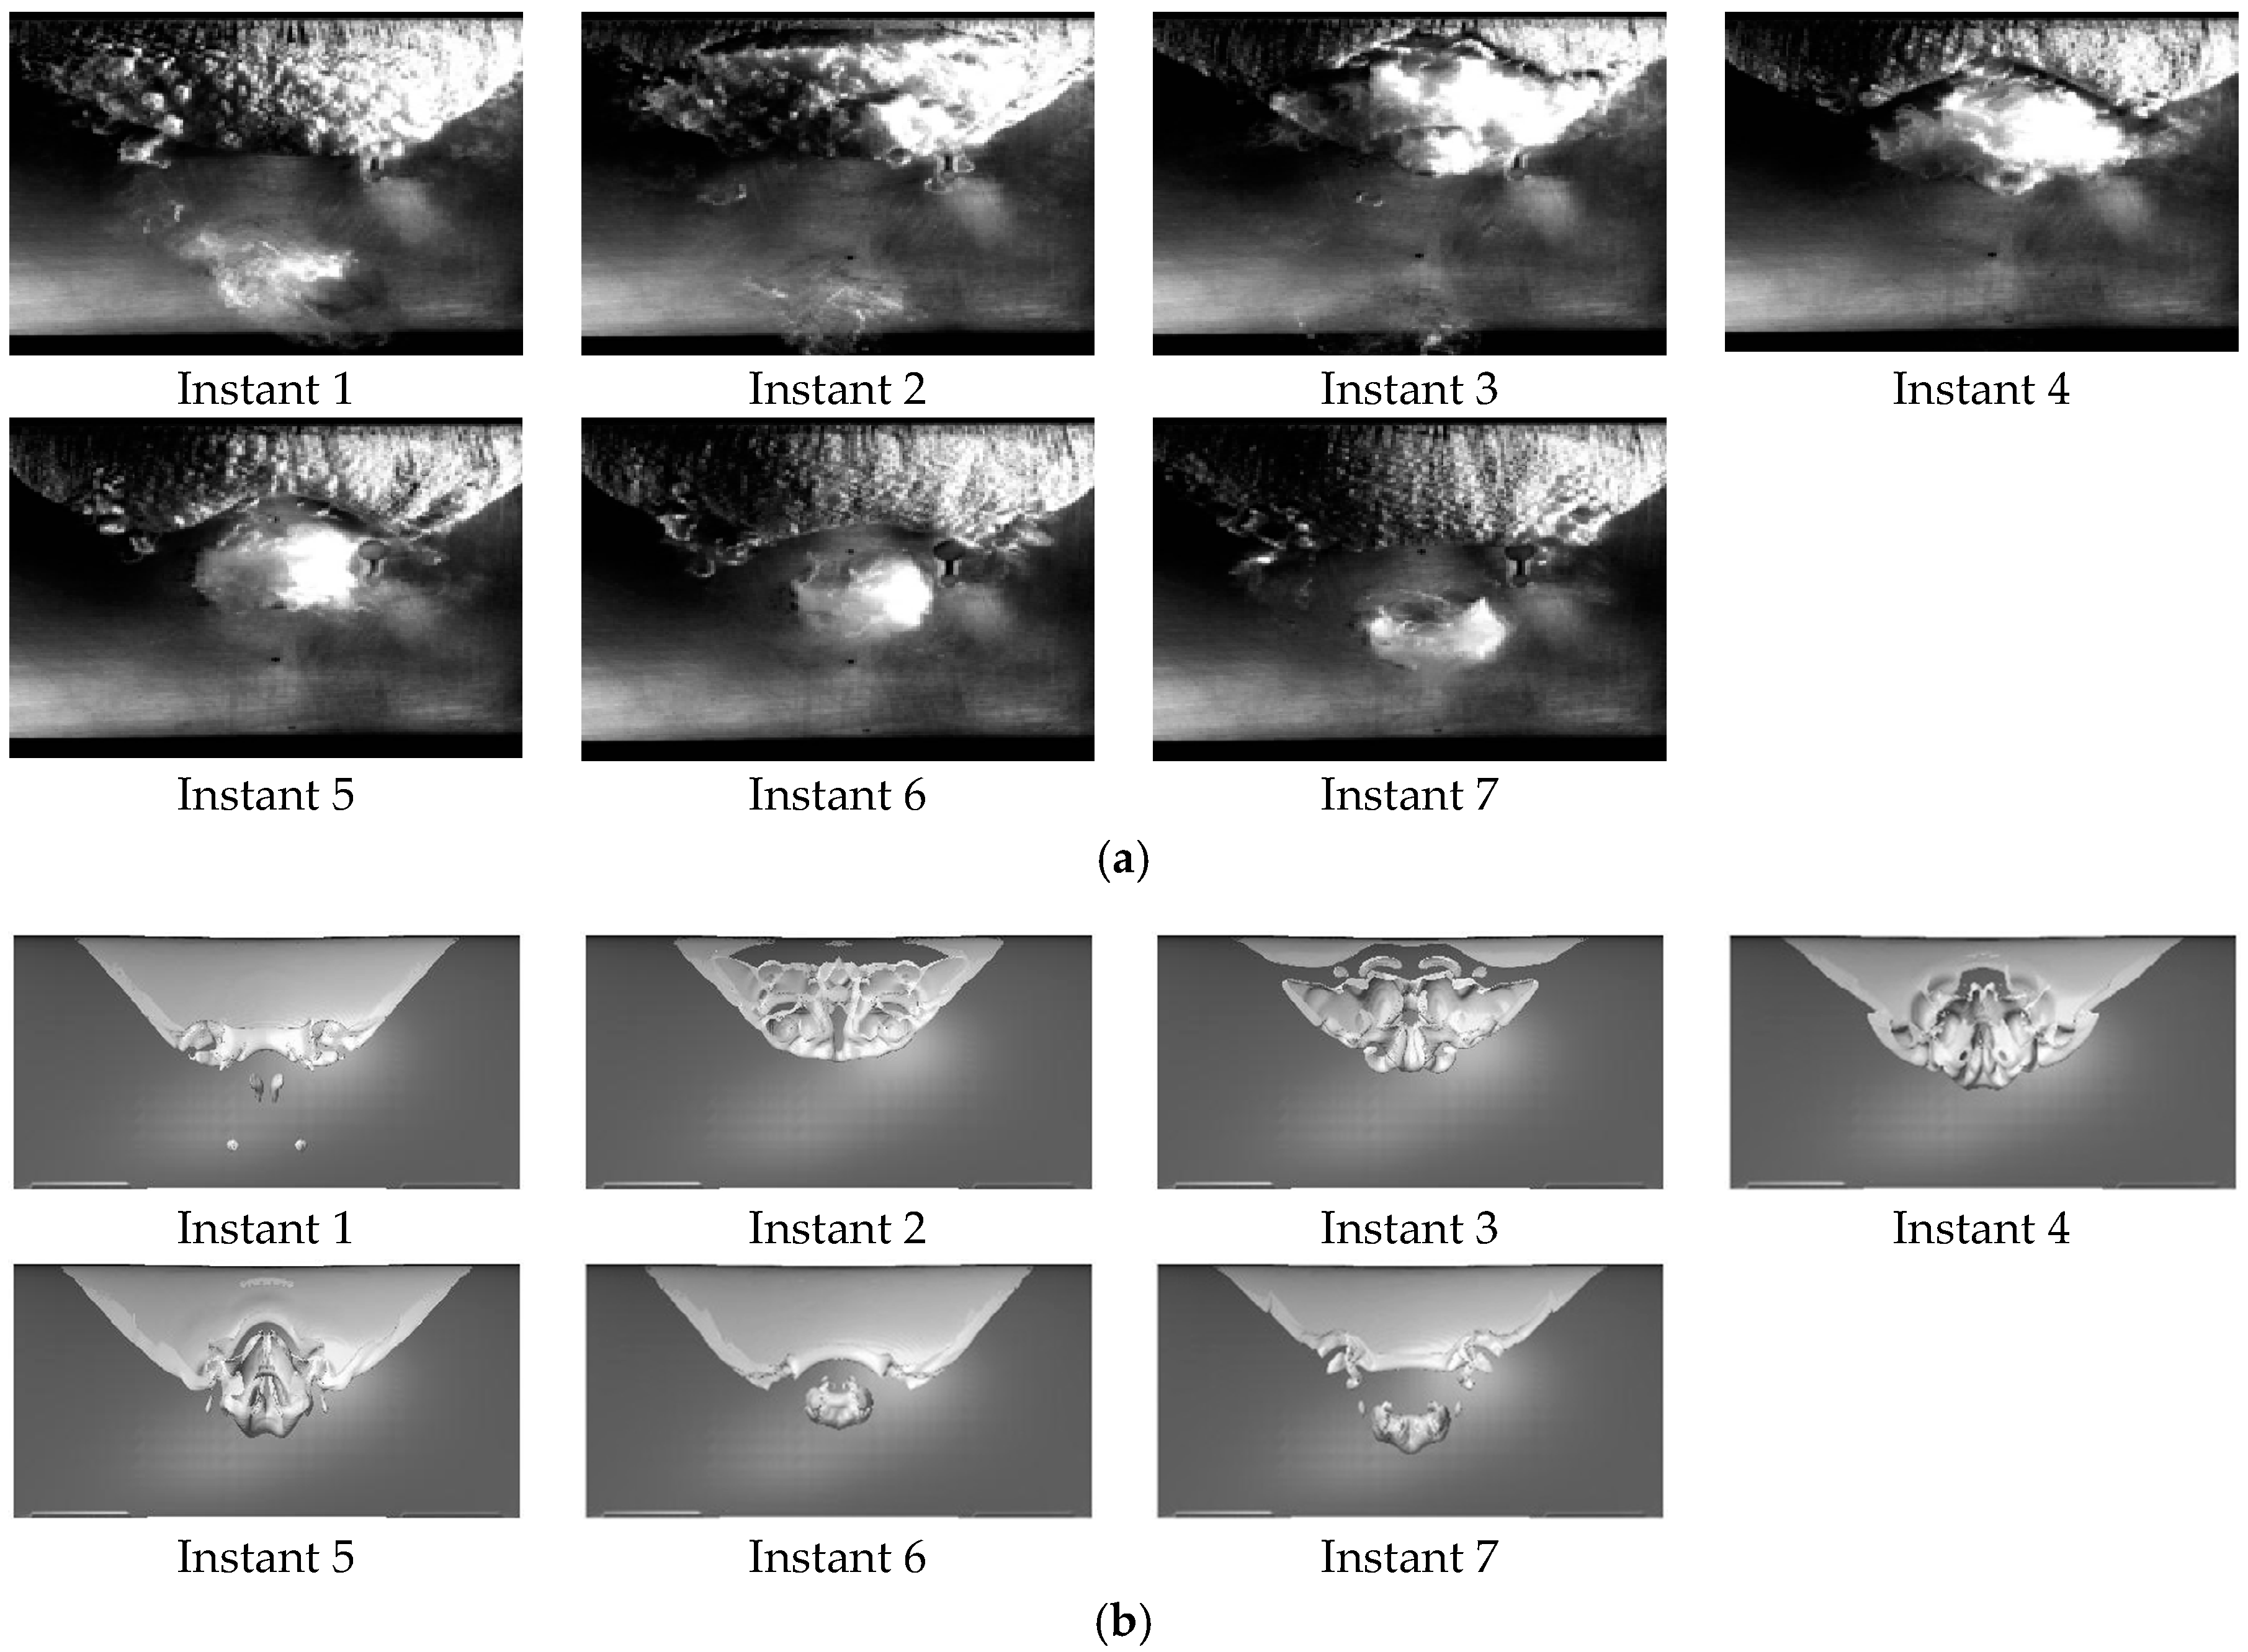
To be consistent with the experiment setup of [10], in the simulation of Case 1, the inflow velocity is 6.97 m/s and the cavitation number is 1.07. The computational domain and the boundary conditions are similar to the description in the literature [37]. Half of the flow domain is computed because of the geometric symmetry. Thus, the domain is with the width of C1, the height of two C1, and the length of seven C1. Here, C1 with the value of 0.15 m is the chord length of the Delft Twist-11 hydrofoil. Figure 1a,b respectively gives the observed and numerical unsteady cavitation structures around the Delft twisted hydrofoil in one typical cycle. Here, in the predicted results, the cavity morphology is expressed by the iso-surface of the water vapor volume fraction, with a value of 0.1. From Figure 1a,b, it is found that the experiments and simulations can be remarkably consistent for capturing the periodical evolution process of attached turbulent cavity around the hydrofoil, including the attached cavity growing up, breaking off, primary shedding, secondary shedding, and final collapse downstream. In addition, Table 2 gives the typical cavity shedding frequency f and the lift coefficient CL obtained by several researchers. Here, the predicted frequency f is obtained by a fast Fourier transform (FFT) analysis of the total vapor volume. The lift coefficient CL is defined as Equation (14). When compared with other documents, the data acquired in this work agree well with that of prior experiments. Consequently, the above analysis can reasonably indicate the present LES method used in this work is suitable and reliable to simulate the unsteady cavitating flows around the twisted hydrofoil.
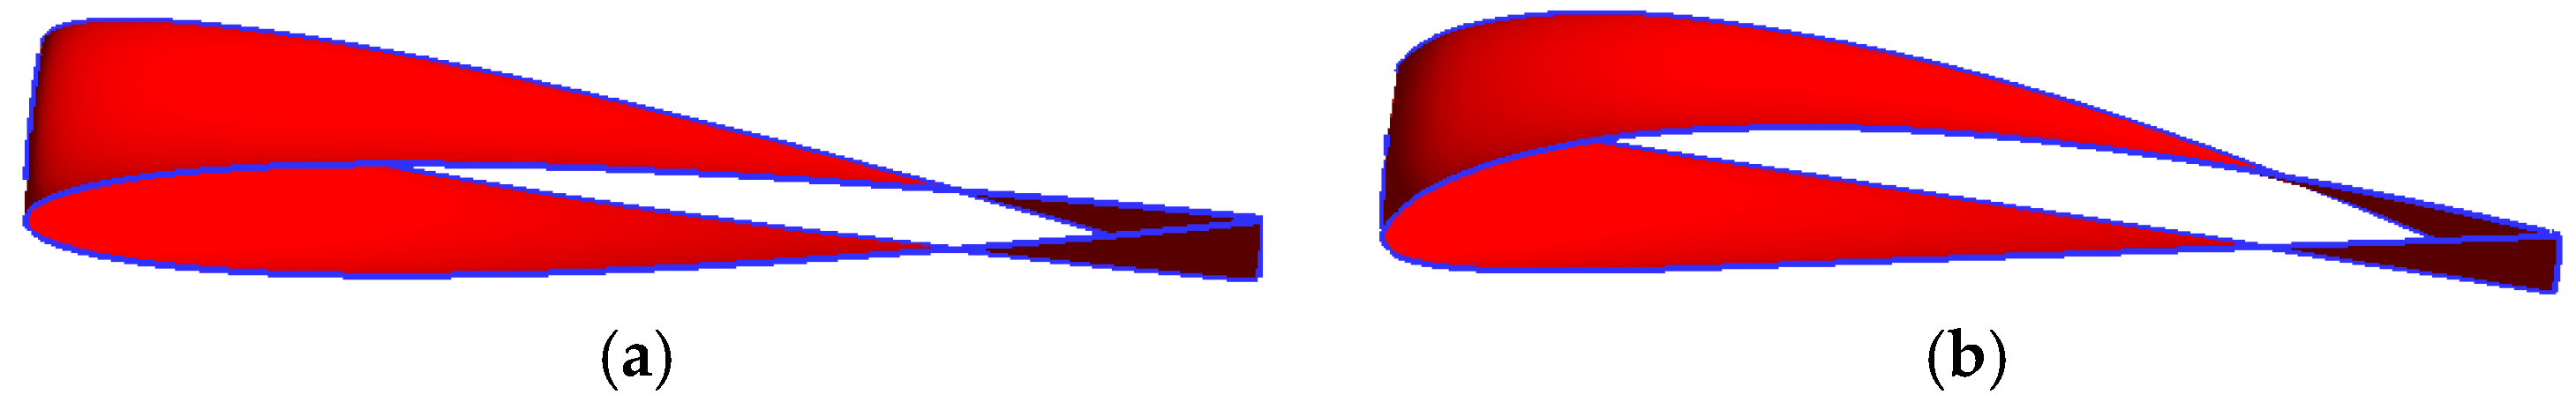
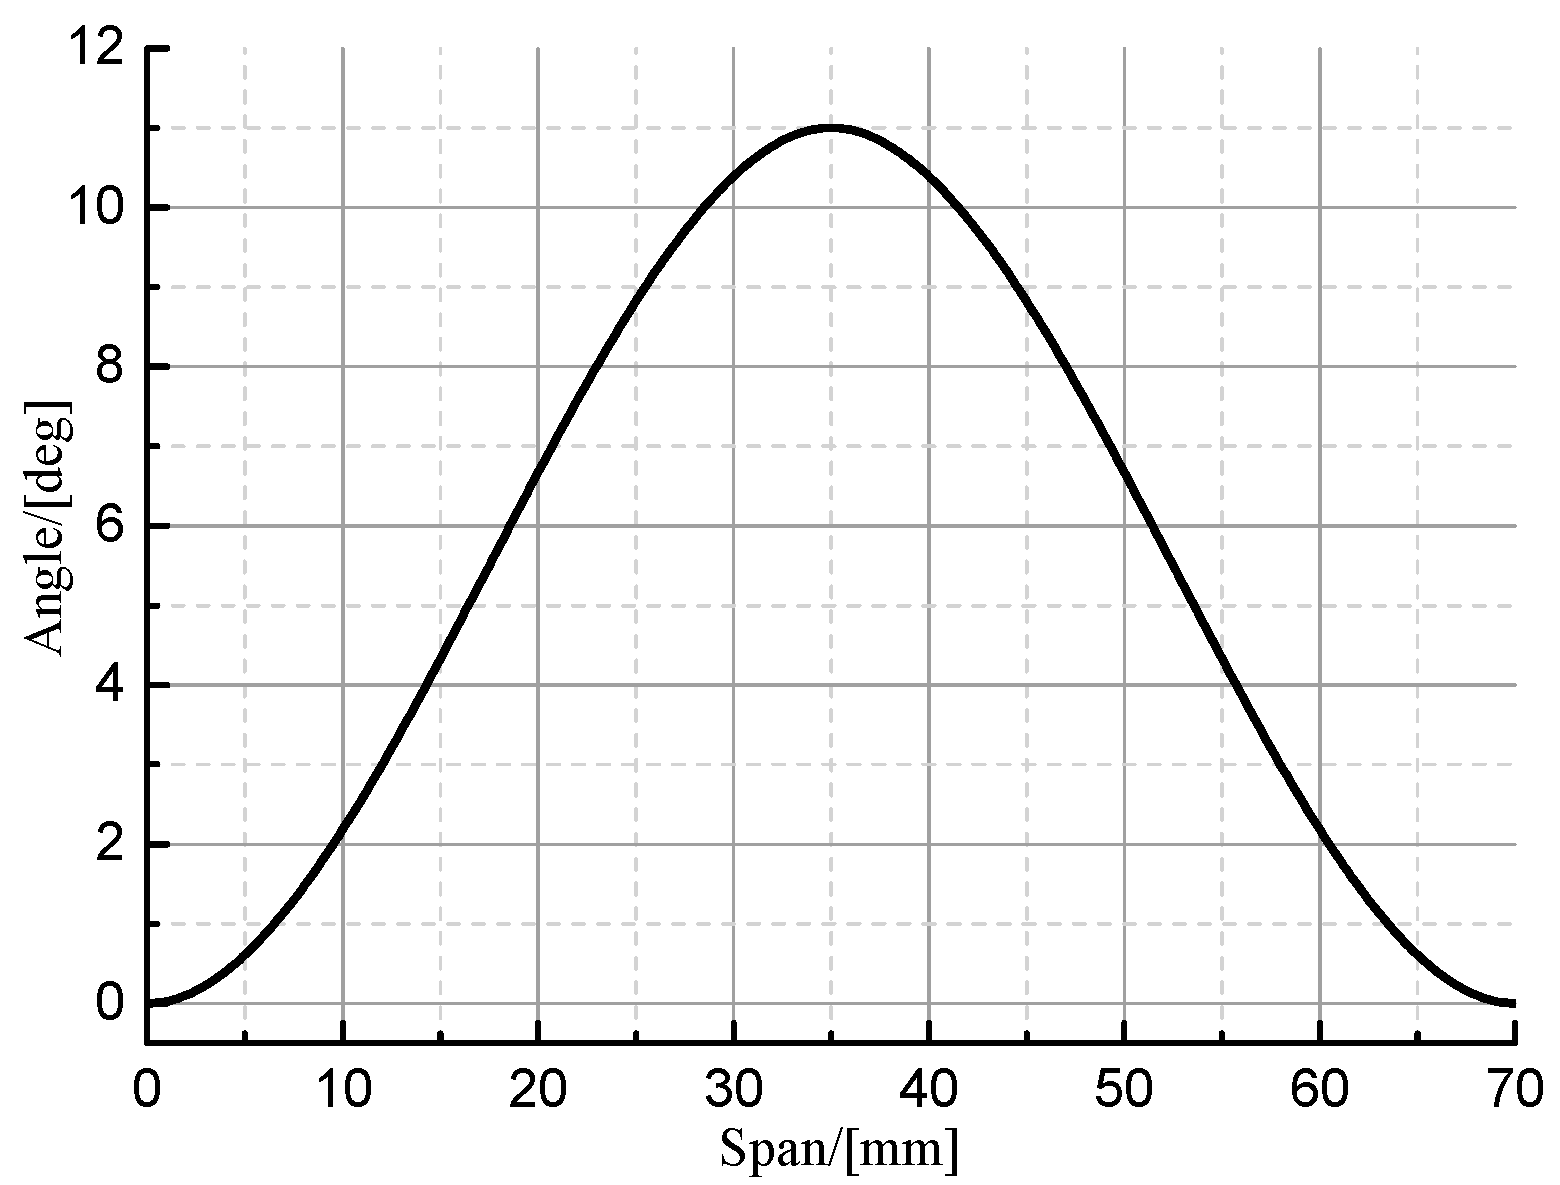
Based on the numerical method mentioned above, this work will contribute to numerical studies of unsteady cavitating flows around two twisted hydrofoils, with special emphasis on the differences of cavitation characteristics between them. Figure 2 gives the geometry of two twisted hydrofoils with different sections, named NACA0009 and Clark-y, respectively. The two hydrofoils have the same chord length of C = 70 mm and span length of S = 70 mm. The only difference between the two twisted hydrofoils is the sectional profile. One has a symmetric NACA0009 section, and the other has an asymmetric Clark-y section. As shown in Figure 3, the sections of two hydrofoils vary with their angles of attack from 0° to 11° along the span direction, which is similar to the Delft twisted hydrofoil [46].
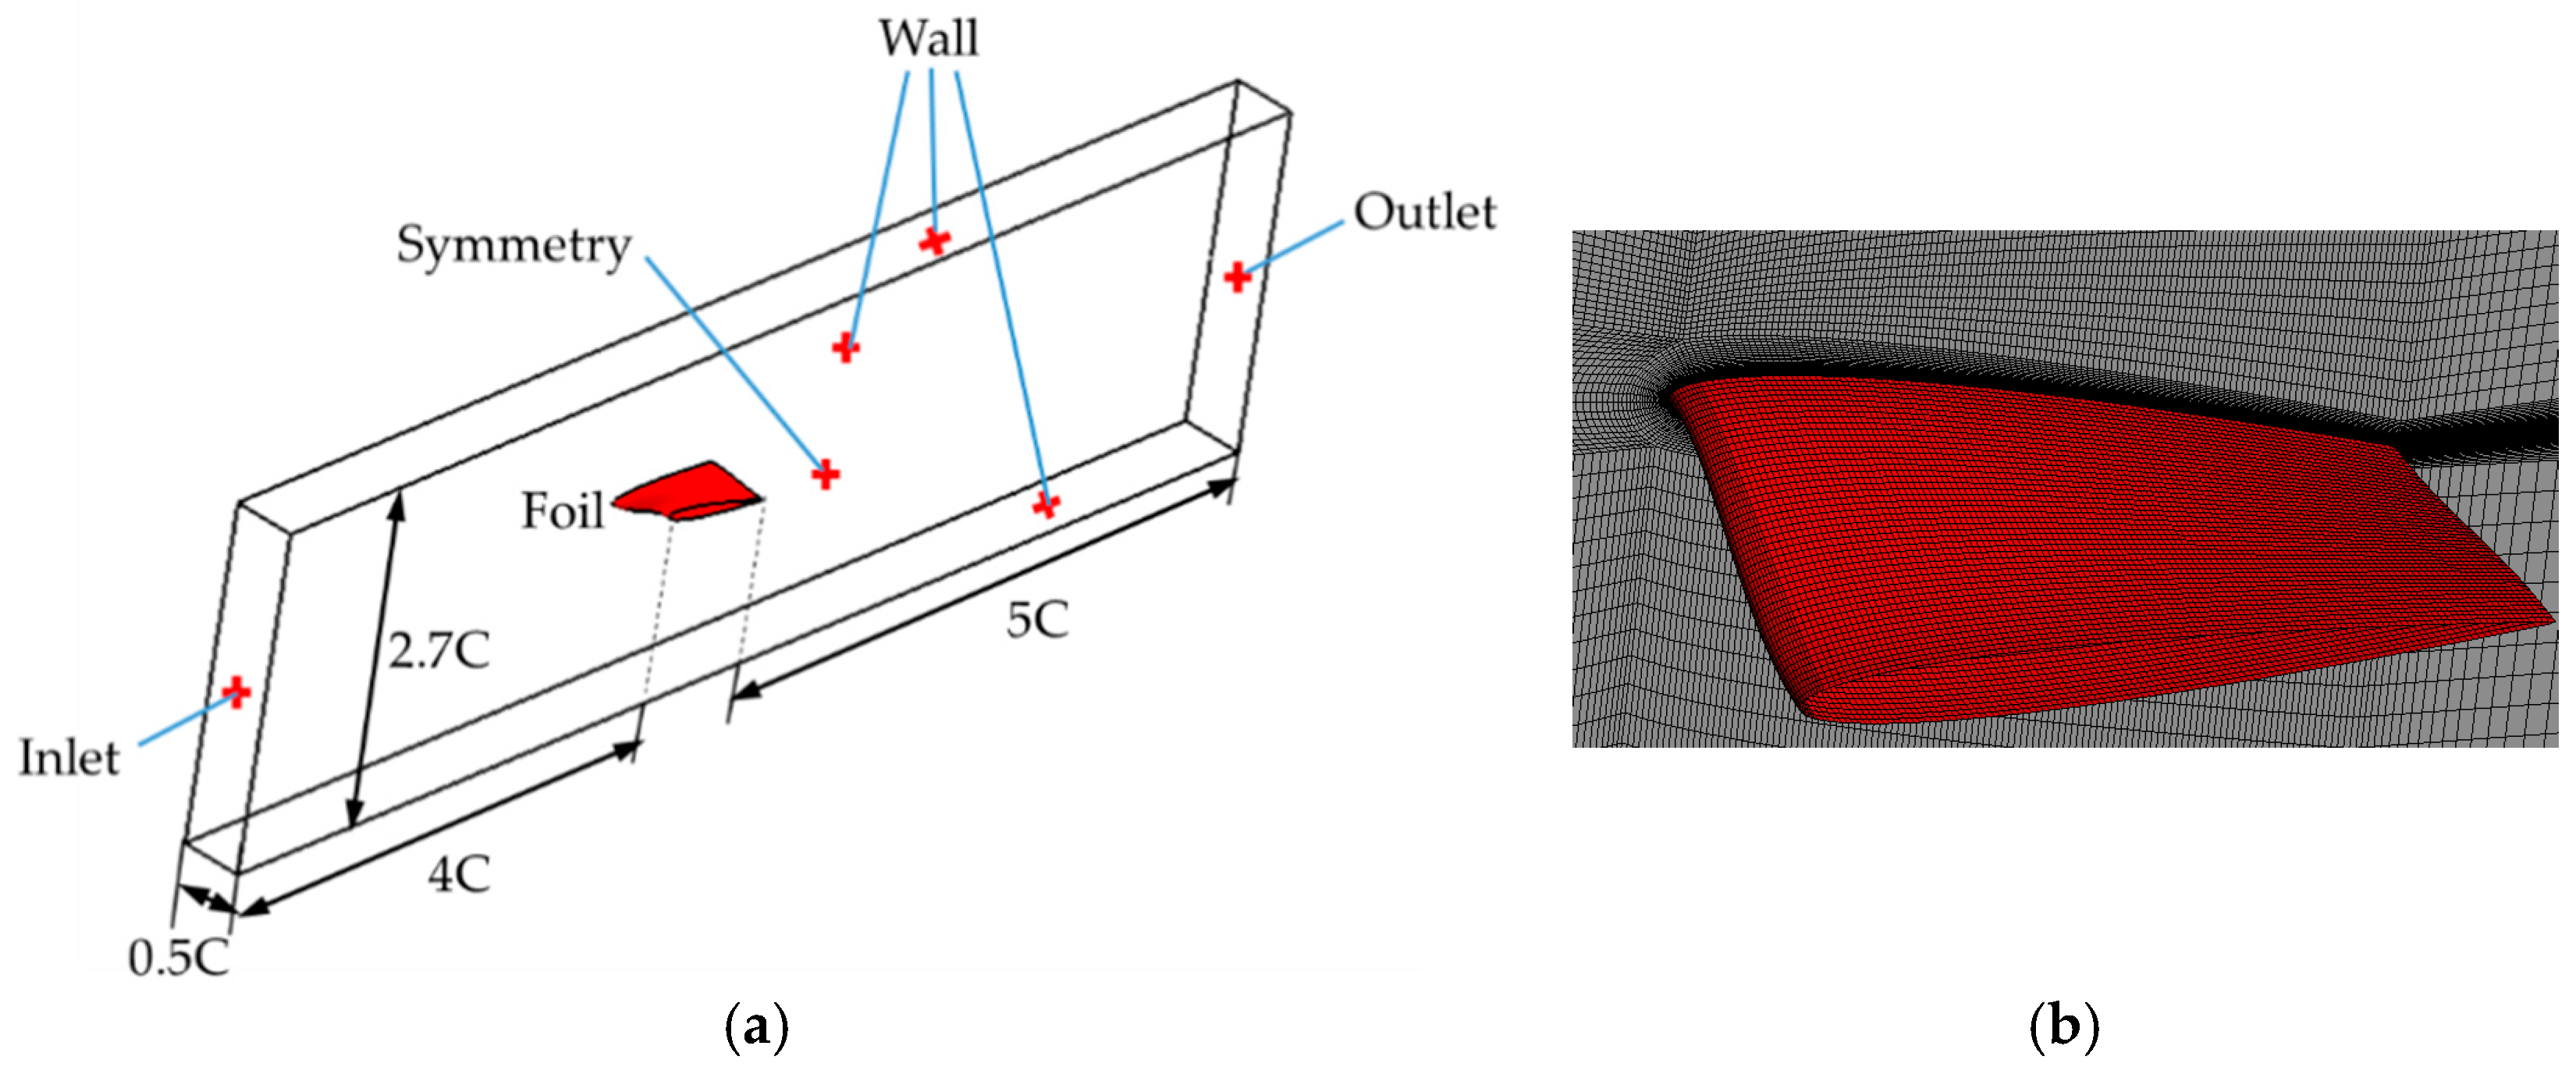
Figure 4 shows the setup of computational domain and mesh around the hydrofoil. From Figure 4a, the hydrofoil is placed horizontally in the domain, with a width of 0.5C, a height of 2.7C, and a length of 10C. It should be noted that only half of hydrofoil was considered, due to its geometric symmetry. The corresponding boundary conditions are listed in Table 3. According to the velocity of and the pressure of 32,510.2 Pa, the cavitation number σ is equal to 1.2. The grid distribution around the hydrofoil is shown in Figure 4b. An O–H type mesh was applied and refined near the foil surface. In order to find a balance between computation cost and accuracy, three sets of mesh with the same grid topology were tested. As listed in Table 4, the meshes with different spatial resolutions were evaluated by two variables, CL and CD. The time-averaged lift coefficient CL and drag coefficient CD of the NACA0009 hydrofoil are defined as below:
where FL and FD are lift force and drag force, respectively; the other variables can be found above.
In Table 4, the comparisons of CL and CD indicate that the small differences between the medium mesh and fine resolution mesh can be neglected. Besides, the y+ of the medium mesh is nearly 1 for most of the hydrofoil surface. The definition of y+ can be written as Equation (15). According to the previous comments for a valid LES method [37,44], a medium mesh with about 3.5 million nodes was selected as the final grid.
where Δy is the distance to the nearest wall, uτ is the friction velocity at the nearest wall and υ is the kinematic viscosity.
All the simulations were conducted using commercial CFD software named ANSYS CFX. The time-dependent cavitating flow simulation was performed with the initial condition of steady non-cavitation results. The high-resolution scheme was used for the convective term, and the second order backward Euler scheme was used for the transient term. The time step was set to s. Then, the computation of 800 time steps took about three days, using a computer with 64 GB memory and 24 parallel cores.
3. Results and Discussion
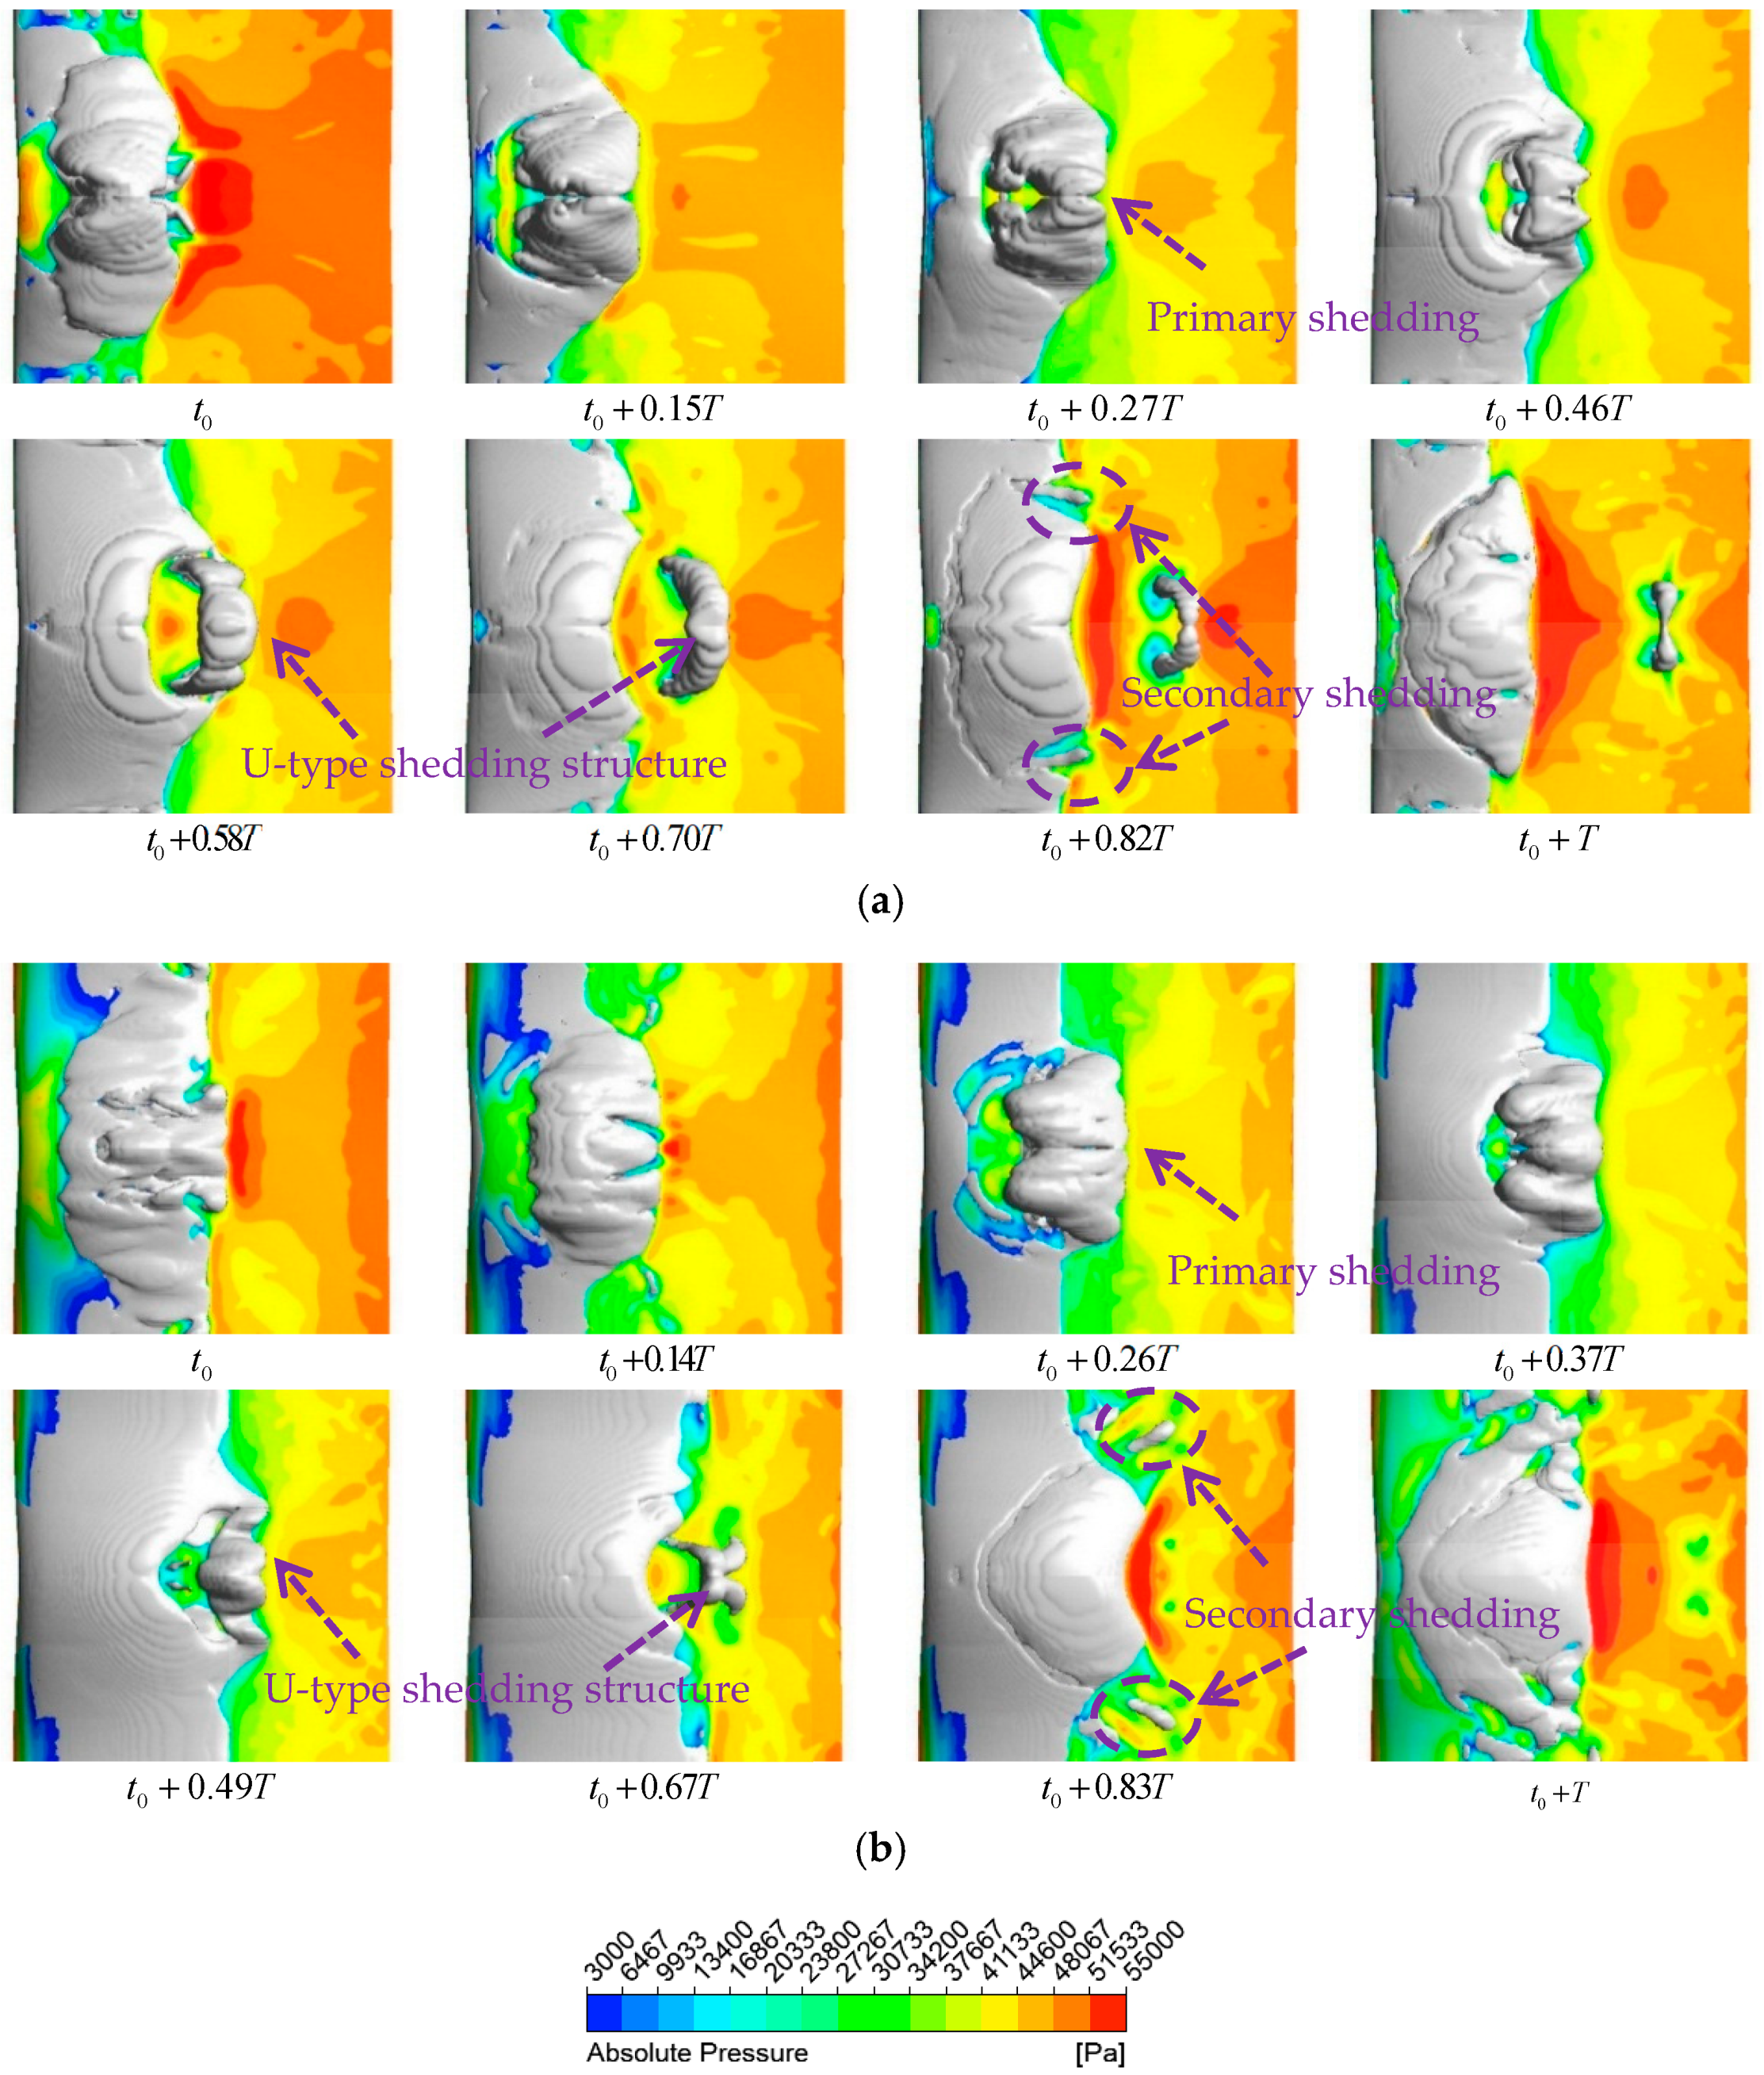
Figure 5a,b respectively gives some computational snapshots of cavity topology and the pressure distribution on the suction surface of NACA0009 and Clark-y in a typical cycle. Here, the iso-surface of water vapor volume fraction with a value of 0.1 was selected to depict the morphology of cavitation. The reference time is expressed by t0, and T is the period of unsteady cavity evolution. For the two hydrofoils, the time evolution of unsteady cavity morphology undergoes a similar process, including the attached cavity breaking off, and subsequently growing up again, as well as the primary shedding with a U-type vortex structure and the secondary shedding occurring at the two sides of the attached cavity tail. However, there are some distinct differences in the details of transient cavity morphology. Firstly, the fully developed attached cavity of NACA0009 with the regular convex closure completely covers the hydrofoil leading edge. In contrast, the attached cavity around the Clark-y hydrofoil with a larger scale is not covered the leading edge, especially at the two sides of the hydrofoil. Secondly, to focus on the primary shedding process, the U-type shedding vortex structure forms and immediately sheds downstream, with a larger scale for the NACA0009. However, for the Clark-y, the upstream part of the break-off cavity grows faster, and could catch up with the downstream part to join together again. This behavior is probably responsible for the final, smaller-scale structure of U-type shedding.
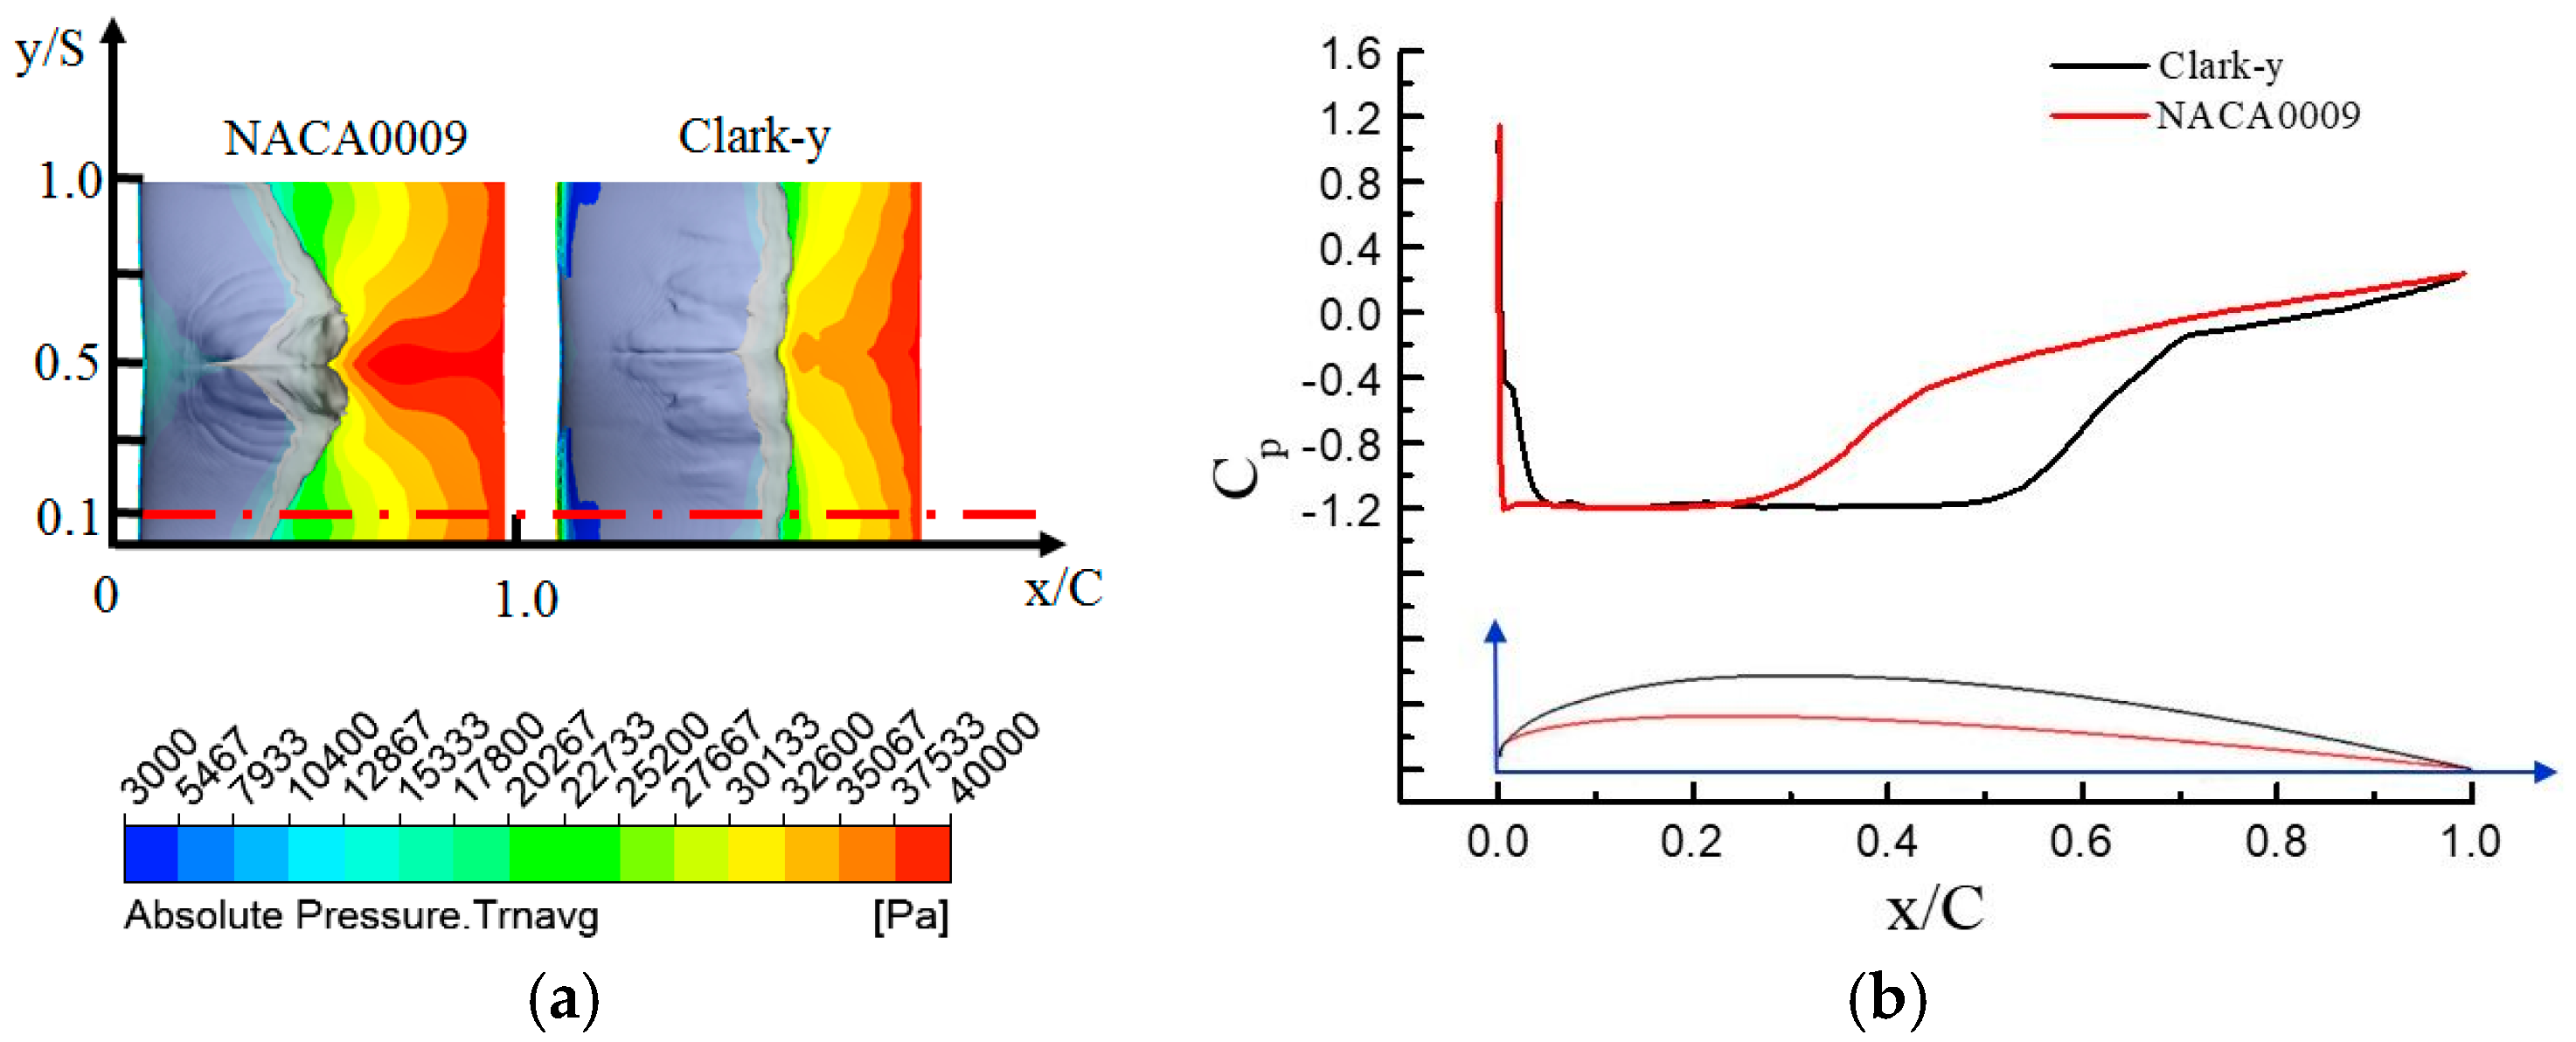
From Figure 6a, the time-averaged cavity topology for the two hydrofoils demonstrates the similar characteristics as that mentioned in the previous section. That is, for the NACA0009 the time-averaged cavity starts from the whole leading edge and curls into a convex closure. However, for the Clark-y, only a partial nearby area of the mid-plane of leading edge is covered by the cavity, which has a nearly straight closure. From the time-averaged pressure distributions, a larger area, with high pressure levels than that of the Clark-y, was found located behind the cavity colure of the NACA0009. It can be concluded that the high pressure restrains the growth of the cavity, in order to induce a smaller scale of cavity on the NACA0009. To further study the location difference of the cavity at the leading edge for the two hydrofoils, Figure 6b gives the geometry outline of a typical section and the corresponding pressure distributions for the two hydrofoils. The selected section is located at y/S = 0.1, marked by a red dashed line, as shown in Figure 6a. The profiles of pressure present a similar trend along the suction surface for the two hydrofoils, including decreasing dramatically at the leading edge of the vapor pressure and then increasing sharply behind the closure of the attached cavity. However, by comparisons, it is found that the pressure of the NACA0009 is always larger than that of the Clark-y, except for the cavitation region. To focus on the leading edge, the pressure of Clark-y delays reaching the vapor pressure, which is probably attributed to its larger curvature at the leading edge. Consequently, it can be concluded that the body geometry substantially affects the pressure distributions, and then yields to the different attached cavity characteristics.
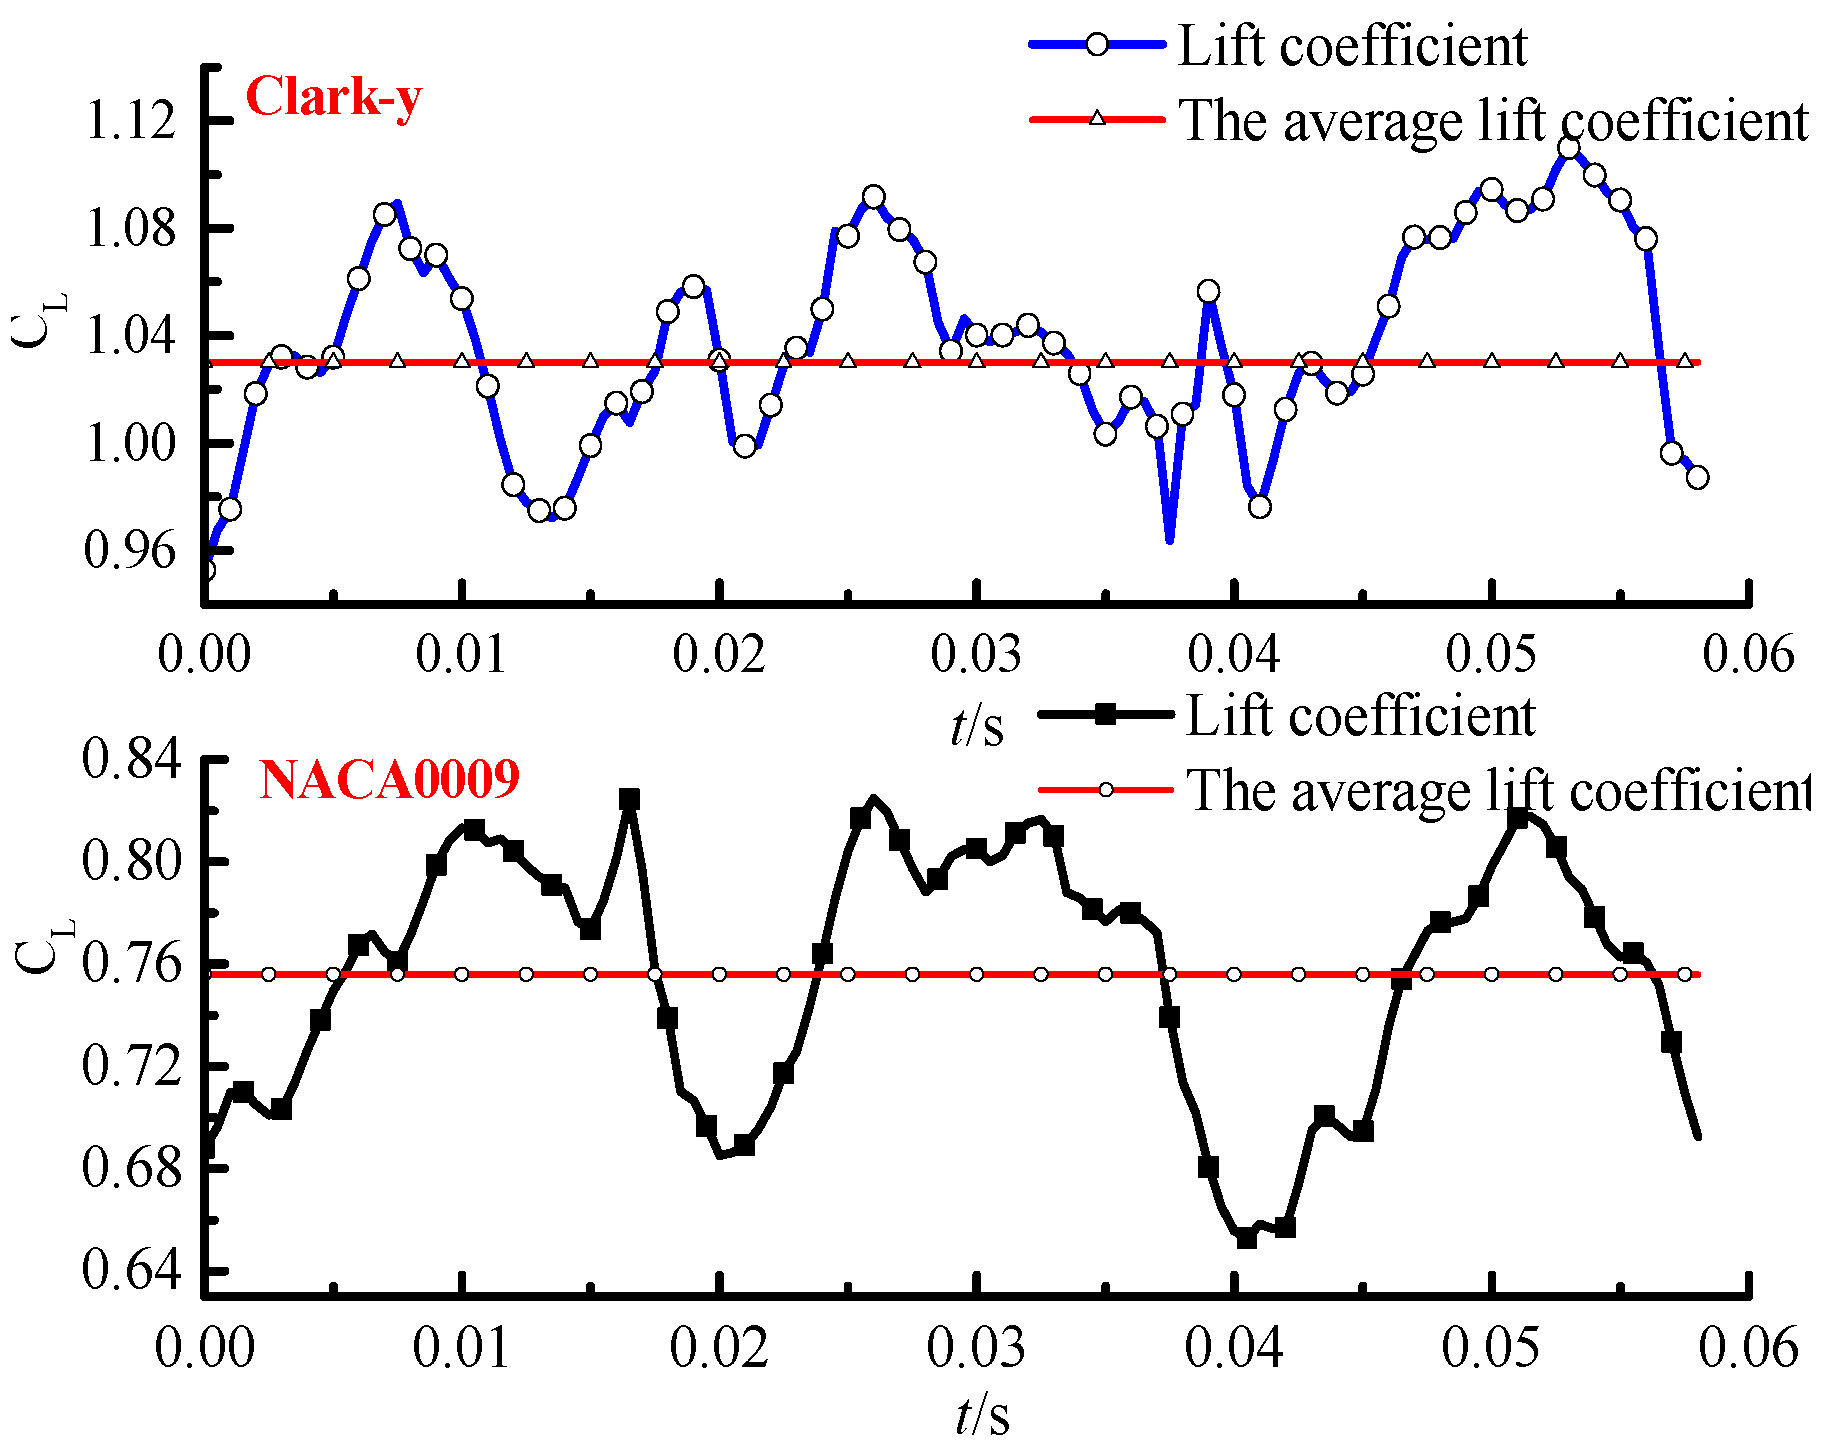
Figure 7 gives the comparisons of lift coefficients for the two hydrofoils. The time-dependent lift curves both show quasi-periodic characteristics, which is similar to the time evolution of cavity topology. However, compared with that of NACA0009, we observe that the transient lift coefficient signals of Clark-y present more small fluctuations over time, due to its more complicated cavity shedding process, as mentioned above. It is also found that the time-averaged value of the lift coefficient for Clark-y is much larger than that of NACA0009. Actually, the lift value is defined by the pressure difference of the pressure and suction surfaces of the hydrofoil. As for the cavitating flows, the pressure value of the suction surface is substantially affected by the cavitation area, which has low pressure. As a result, the larger cavitation region of Clark-y yields to lower pressure of suction surface, leading to the larger lift force.
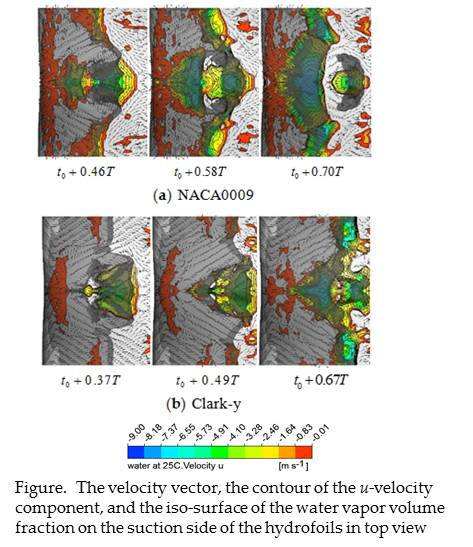
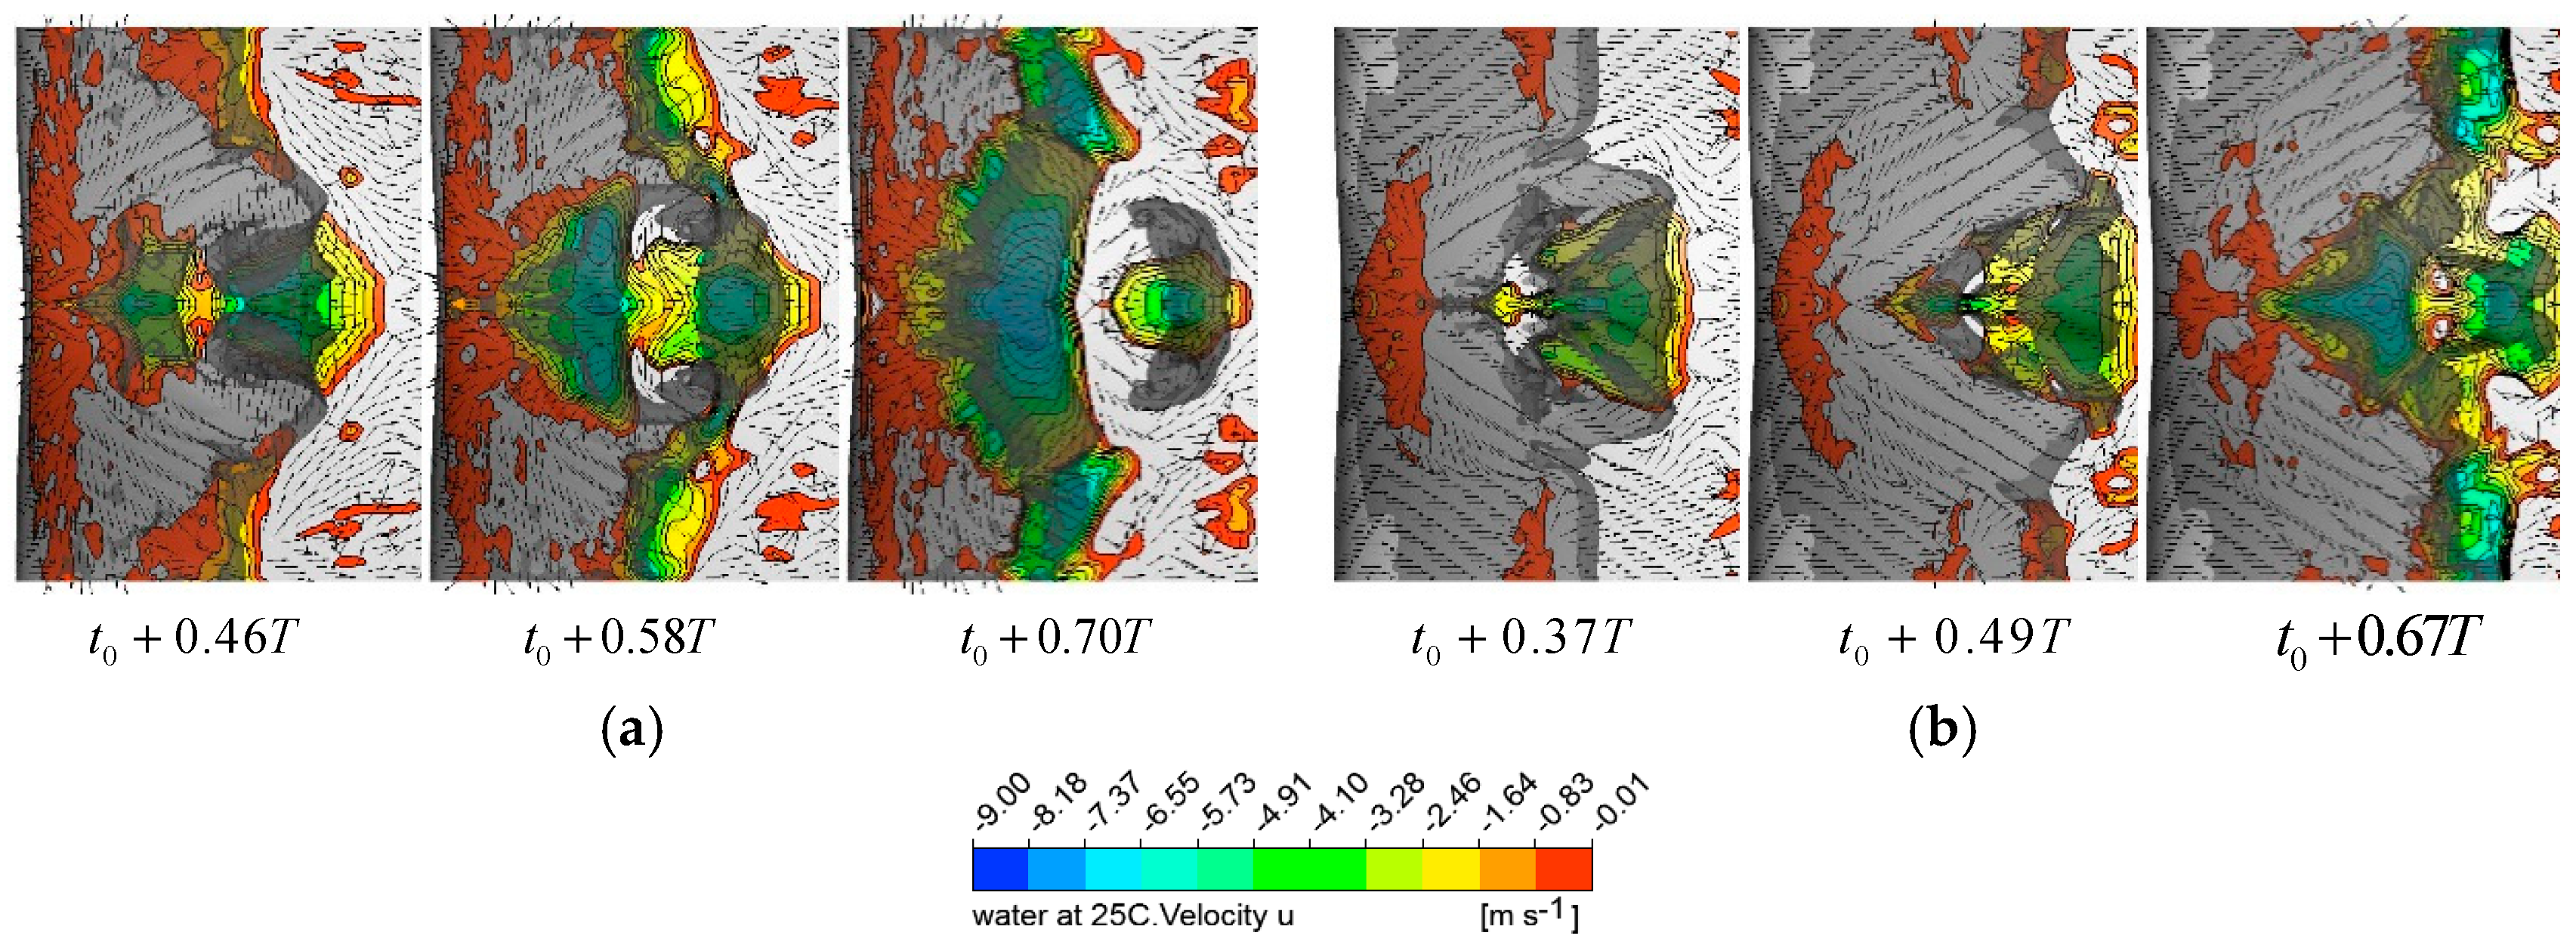
The cavity shedding behavior in unsteady cavitating flows is closely related to the reentrant flow and the attached cavity itself [47,48]. Then, in the present work, the velocity vector distributions on the suction surface were investigated during the cavity shedding process. In Figure 8, the cavity topology with iso-surface values of and the contour of u-velocity component are displayed to study the cavity shedding behaviors. It should be noted that the negative values of u-velocity can represent the reentrant flow behaviors. For the NACA0009 in Figure 8a, the reentrant flow invaded the attached cavity more widely with a radially-diverging pattern, which then caused the horseshoe vortex structure with larger-scale shedding from the attached cavity. In contrast, for the Clark-y in Figure 8b, it was found that the reentrant flow just invaded the center part of the suction surface, with a sharp corner head form. Moreover, after the first break-up, the upstream attached cavity developed quickly enough to overcome the collision of the weaker reentrant flow and join with the downstream part again. As a result, this conjunction behavior, as well as the reentrant flow, leads to the second breaking off at the downstream position and the smaller-scale of U-type shedding structure on the Clark-y.
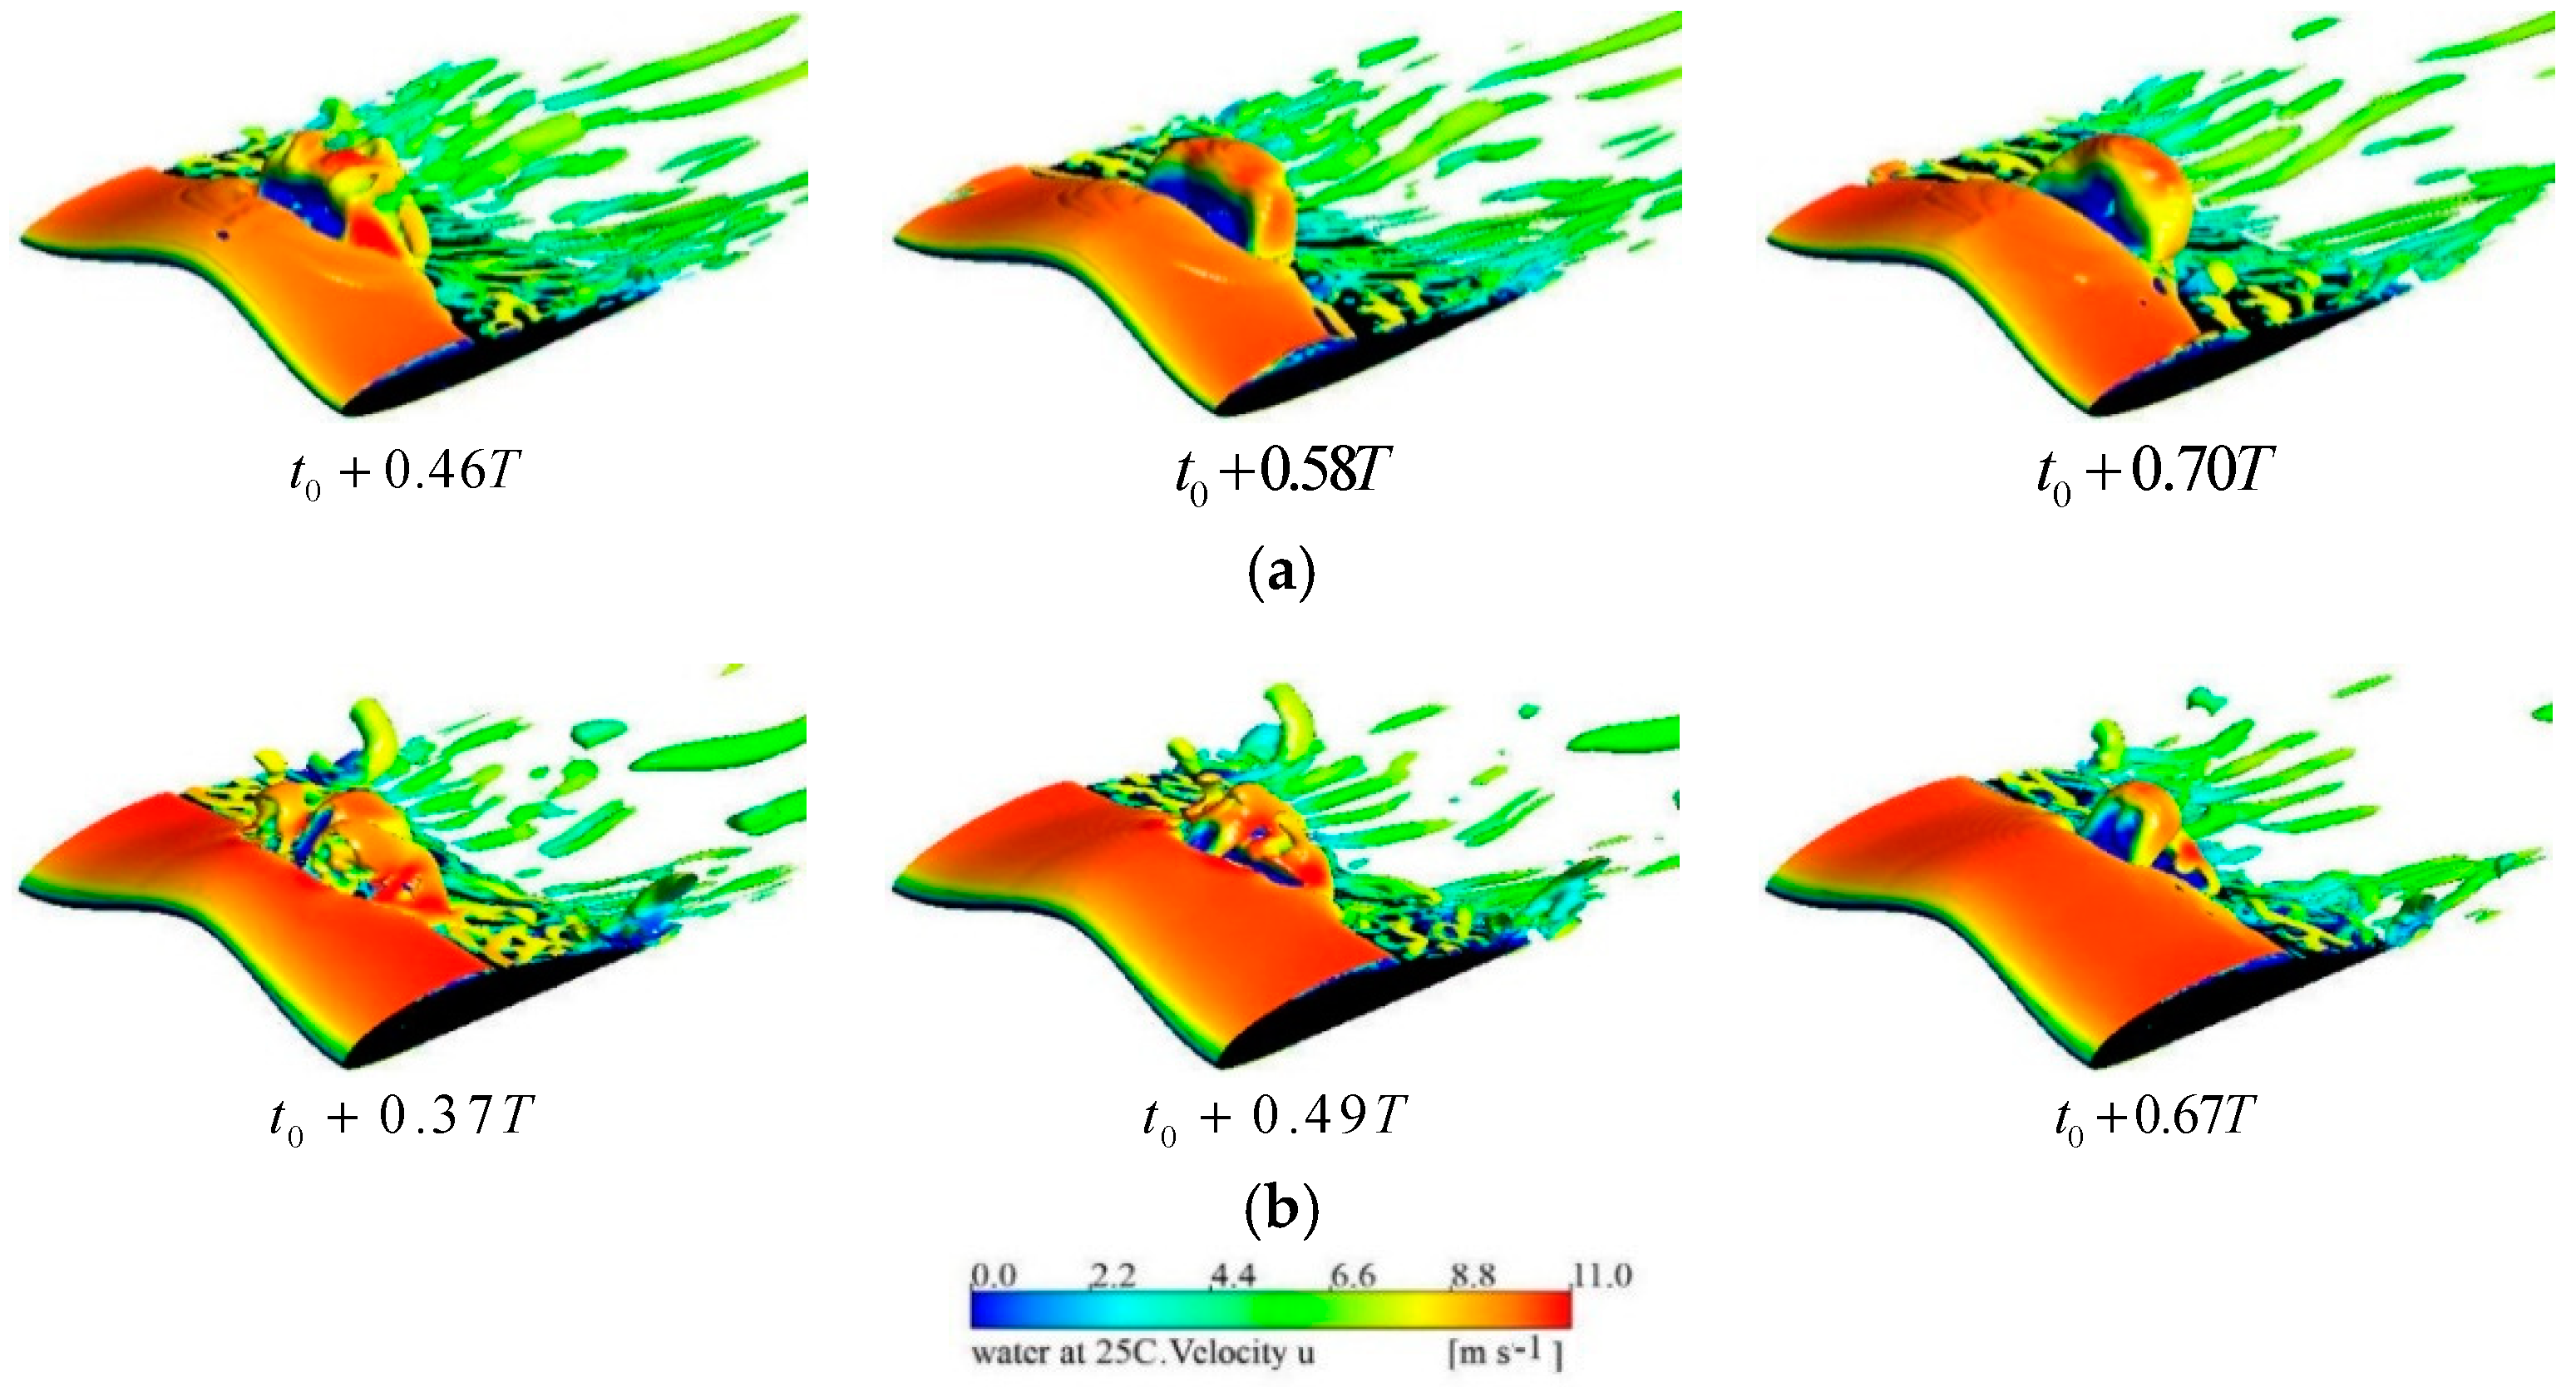
As demonstrated by Gopalan and Katz [9], the bubbles at the closure region of the attached cavity presented hairpin-like structures. To more clearly demonstrate the turbulence flow structures during the shedding process, Figure 9 displays the iso-surface of the Q-criterion (Q = 4 × 10⁵) for the two hydrofoils. It was found that the vortex shedding structures are closely related with the cavity morphology. The larger scale of the shedding cavity contributes to the larger scale of the U-type vortex and vice versa. During the cavity shedding process, the U-type vortex structures forming on the suction side are governed downstream by the main flow, and gradually collapse. The scale of the U-type vortex structure on the NACA0009 is larger than that of Clark-y. However, the downstream region of the cavity closure on the Clark-y contains more complicated turbulence structures, including numerous and correlative U-type structures.
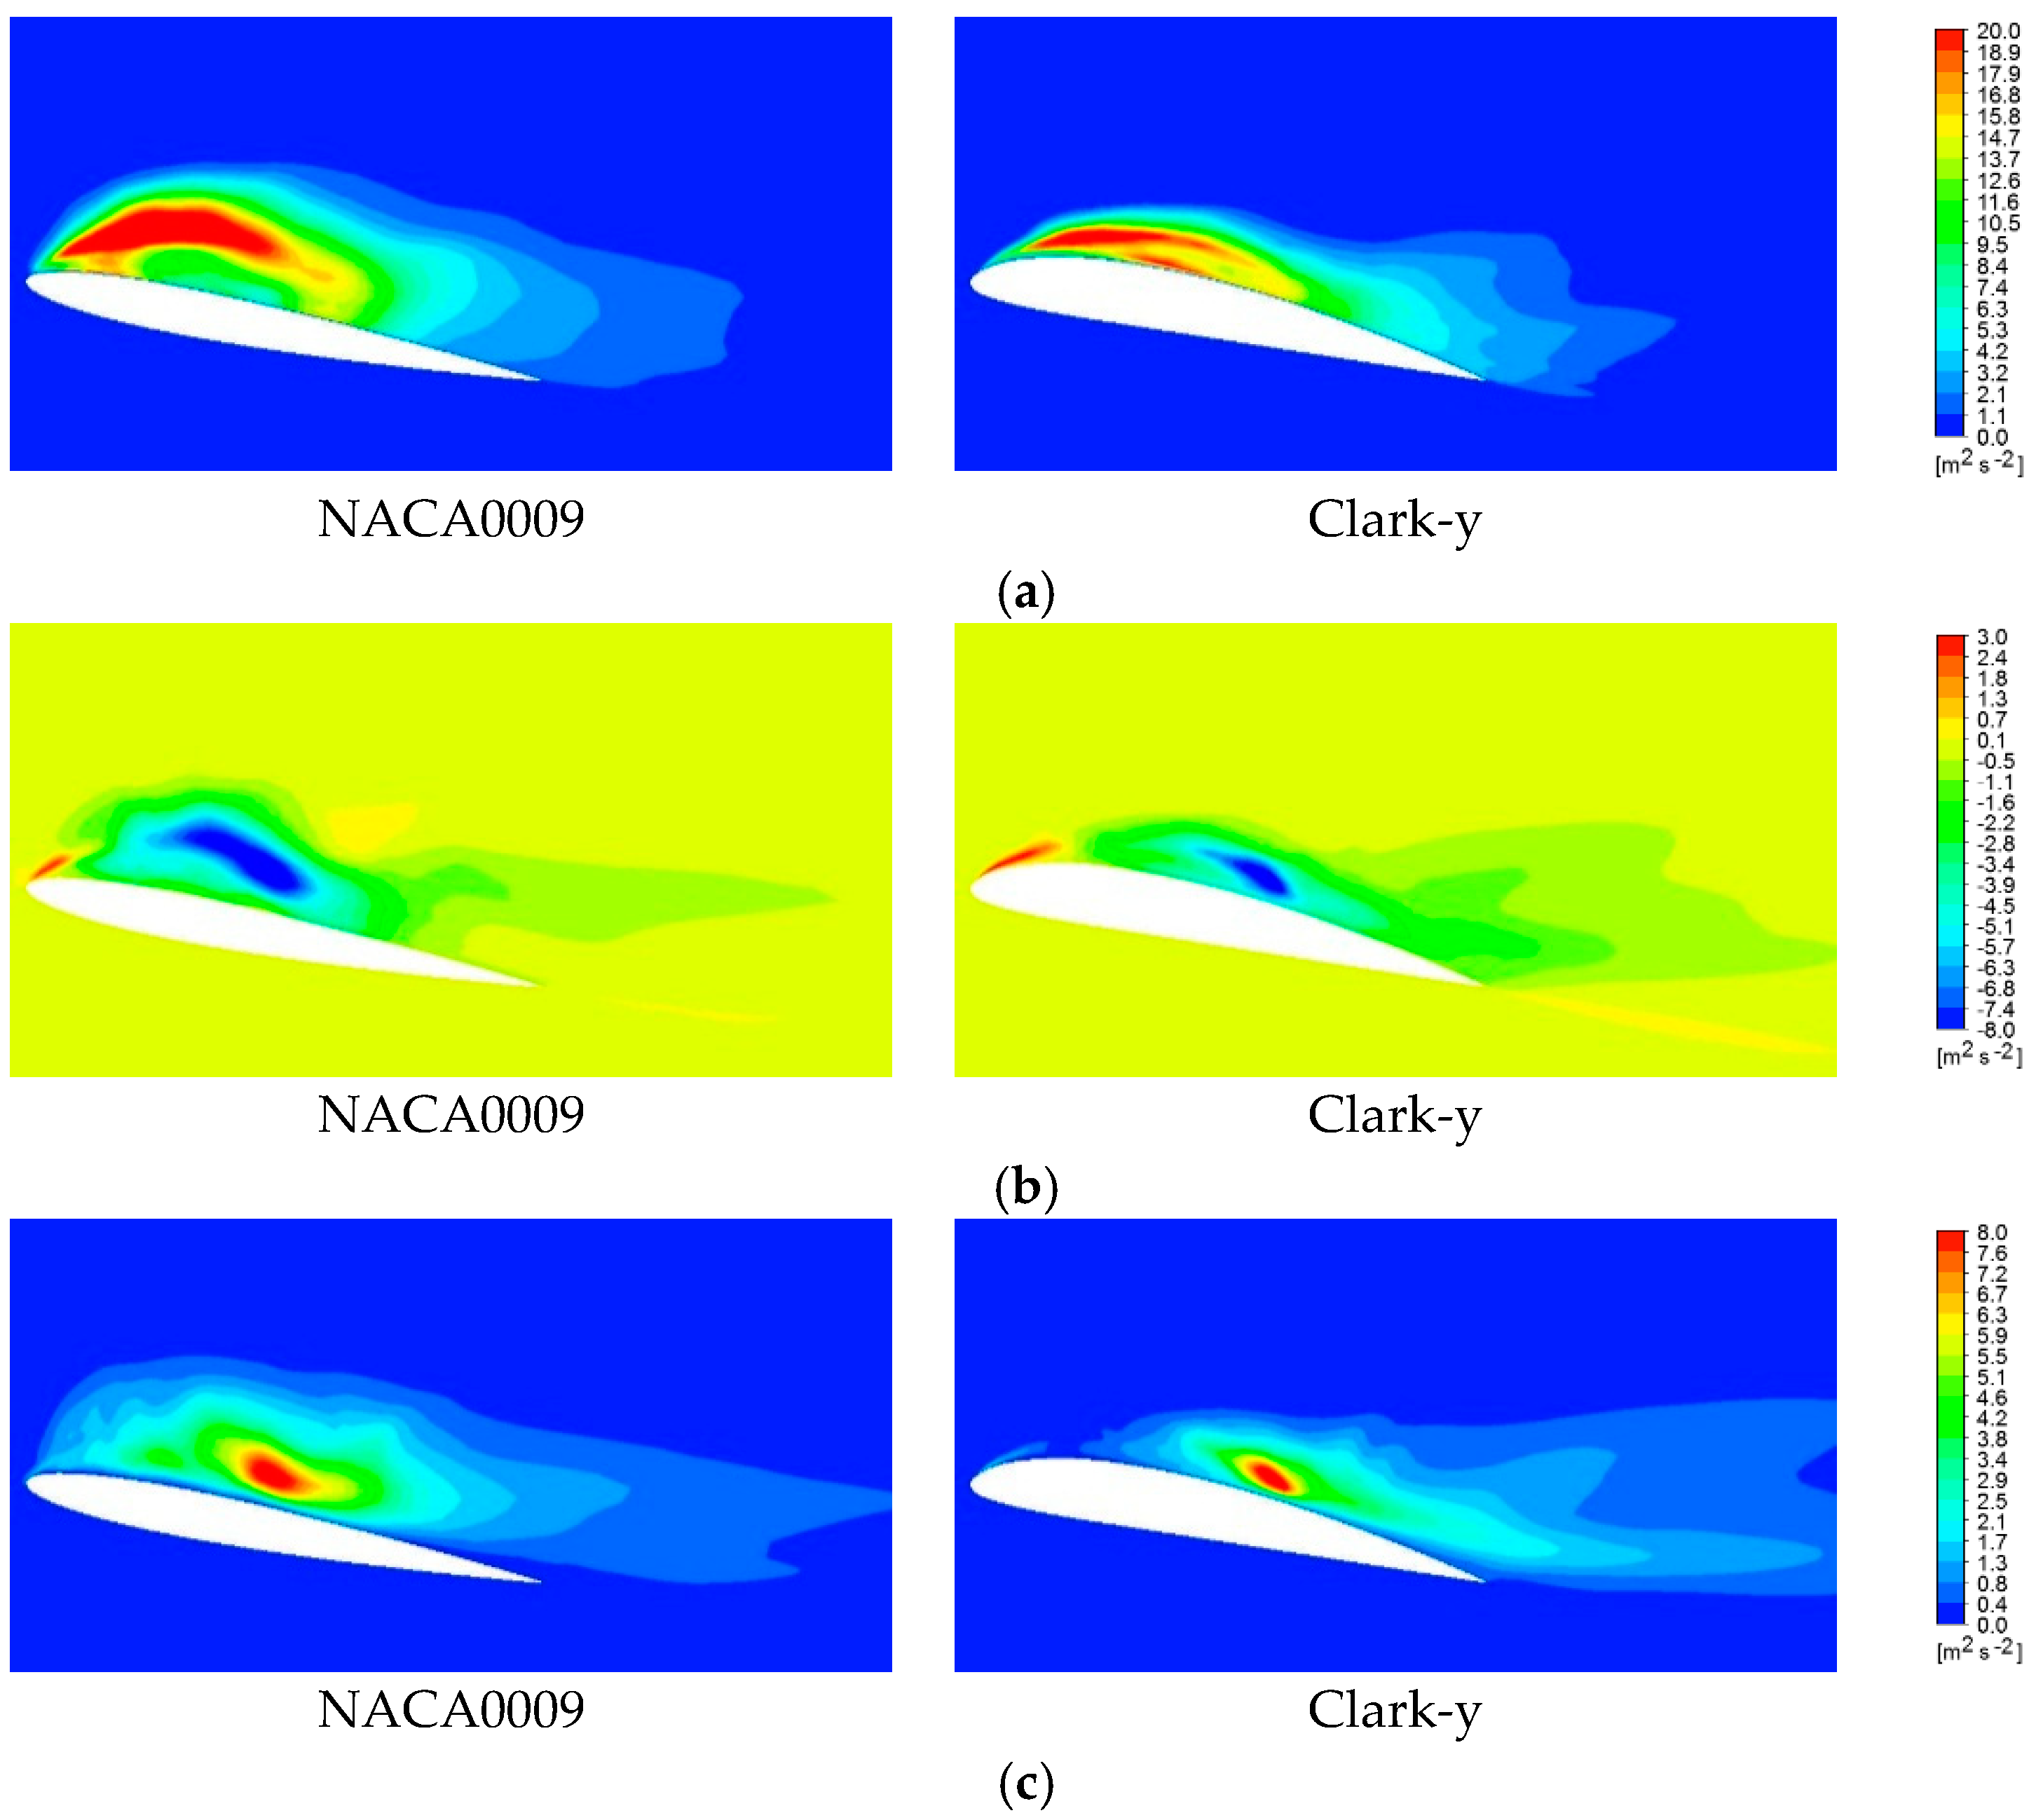
The distributions of Reynolds stresses , , and on the mid-plane of hydrofoils are displayed in Figure 10, where and are the horizontal and vertical turbulent fluctuation velocity components on the mid-plane. As can be seen, the normal and shear Reynolds stresses of high magnitude are located just in the cavitation region. This indicates that the unsteady cavity evolutions greatly affect the turbulelnt features and can induce more turbulence velocity fluctuations. Similar conclusions were also reported by Laberteaux and Ceccio [21] and Ji et al. [24]. In more detail, the normal Reynolds stress in Figure 10a is dominant in the attached cavity region, due to the transient changes in the growing and shriking of the attached cavity. The Reynolds stresses and are predominant in the downstream and closure of the cavity, which is probably influenced by the shedding and the U-type vortex structure formation of the detached cavity. When compared with those of Clark-y, all the Reynolds stress components of NACA0009, as shown in Figure 10, are in higher levels and occupy more areas in the cavitation region. This again forcefully indicates that the time-evolution process of a cavity on NACA0009 shows more violent reentrant flows and a larger scale of U-type shedding structures.
4. Conclusions
Numerical investigations of the turbulent attached cavitating flows around NACA0009 and Clark-y hydrofoils are respectively carried out by the method of LES, coupled with the Zwart cavitation model under the homogenous flow theory frame. The computational method was evaluated by the published experimental data and presents a fairly good ability to simulate the unsteady cavitating flows. The main conclusions are drawn and summarized below.
First, the U-type shedding characteristics of unsteady cavity are influenced by the interaction of the attached cavity and the re-entrant flow. The similar time evolution process of the turbulent attached cavity around the two hydrofoils presents different shedding traits. For NACA0009, it is easier to form the larger scale of the U-type vortex, and the side re-entrant flow can easily converge at the middle section to impinge the attached cavity together. However, for Clark-y, the break-off cavities tend to merge together again, to cause the final, smaller scale of the U-type shedding cavity. This behavior is probably because the weaker re-entrant flow can hardly cut off the attached cavity with a higher growth speed.
Second, the cavity attached characteristics are related to the pressure distributions. Compared with that of NACA0009, the time-averaged cavity attached on the Clark-y hydrofoil is much larger and is located more downstream from the leading edge, especially at the two sides of hydrofoil. Further analysis verifies this phenomenon is closely relevant to the different pressure distributions on the suction surface of the two hydrofoils.
Third, the turbulent fluctuations and vortex structures are closely related with the cavity shedding dynamics. Due to the more complicated shedding behaviors, the distributions of the Q-criterion iso-surface around the Clark-y hydrofoil shows more disorder with a much smaller scale; also, the time evolution of the lift coefficients shows more fluctuations for the Clark-y hydrofoil. In addition, the contours of the Reynolds stress components indicate that the shedding behaviors with more violent and stronger collision of reentrant flows can induce much higher levels of turbulence velocity fluctuations.
The turbulent cavitating flows around the twisted hydrofoils present some 3D effects, such as the U-type shedding structures and the reentrant flow behaviors. More investigations about these points are probably beneficial for the further study of turbulence–cavitation interactions. Actually, some experimental investigations about the unsteady cavitating flows around these two twisted hydrofoils have been conducted, and we expect the results can be shared in the near future. On the other hand, the verification of the numerical method is always a vital part in the CFD field. Due to the extensive use of the LES in cavitation research recently, it is necessary to discuss its reliability. This work tried to validate the LES method using the typical experimental data. However, some recent comments suggested that the previous verification and validation (V&V) method for LES has some limitations, and they provided a general framework for LES V&V [49,50]. In addition, it has been found that cavitation has a great influence on LES numerical error and modeling error [51]. Therefore, in our future study we are also trying to focus on the V&V investigation of the LES method.
Author Contributions
The simulations were undertaken by C.H. and L.Y.; G.W. supervised and proposed some advice for the study; C.H. and G.C. wrote the paper.
Funding
This research was funded by the National Natural Science Foundation of China (Grant No. 51606097), the Natural Science Foundation of Jiangsu Province (Grant No. BK20150764), and the Fundamental Research Funds for the Central Universities (Grant No. 30916011333).
Conflicts of Interest
The authors declare no conflict of interest.
Nomenclature
| C | Chord length of hydrofoil, mm |
| Cw | WALE constant |
| CL | Lift coefficient |
| CD | Drag coefficient |
| f | Typical shedding frequency of cavity dynamic development |
| Fc | Empirical condensation coefficient |
| Fe | Empirical vaporization coefficient |
| FL | Lift force |
| FD | Drag force |
| k | von Karman’s constant |
| Ls | Mixing length for the sub-grid stresses |
| LES | Large eddy simulation |
| DES | Detached eddy simulation |
| CFD | Computational fluid dynamics |
| m+ | Condensation rates |
| m− | Evaporation rates |
| pv | Saturated vapor pressure |
| pout | Outlet pressure |
| RB | Radius of the nucleation sites |
| S | Span length of hydrofoil |
| C | The chord length of hydrofoil |
| Strain rate tensor | |
| U∞ | Inlet velocity |
| V | Volume of the computational cell |
| Greek Letters | |
| ρm | Mixture density |
| ρl | Water density |
| ρv | Water vapor density |
| αl | Water volume fraction |
| αv | Water vapor |
| αnuc | Volume fraction of the nucleation sites |
| σ | Cavitation number |
| μm | Mixture dynamic viscosity |
| μt | Subgrid-scale turbulent viscosity |
| τij | Subgrid-scale stresses |
References
- Sedlar, M.; Ji, B.; Kratky, T.; Rebok, T.; Huzlik, R. Numerical and experimental investigation of three-dimensional cavitating flow around the straight NACA2412 hydrofoil. Ocean Eng. 2016, 123, 357–382. [Google Scholar] [CrossRef]
- Ji, B.; Wang, J.; Luo, X.; Miyagawa, K.; Xiao, L.Z.; Long, X.; Tsujimoto, Y. Numerical simulation of cavitation surge and vortical flows in a diffuser with swirling flow. J. Mech. Sci. Technol. 2016, 30, 2507–2514. [Google Scholar] [CrossRef]
- Zuo, Z.G.; Liu, S.H.; Liu, D.M.; Qin, D.Q. Numerical predictions and stability analysis of cavitating draft tube vortices at high head in a model Francis turbine. Sci. China Technol. Sci. 2014, 57, 2106–2114. [Google Scholar] [CrossRef]
- Zhu, Z.F. Numerical study on characteristic correlation between cavitating flow and skew of ship propellers. Ocean Eng. 2015, 99, 63–71. [Google Scholar] [CrossRef]
- Peng, X.X.; Ji, B.; Cao, Y.; Xu, L.; Zhang, G.; Luo, X.; Long, X. Combined experimental observation and numerical simulation of the cloud cavitation with U-type flow structures on hydrofoils. Int. J. Multiph. Flow 2016, 79, 10–22. [Google Scholar] [CrossRef]
- Wang, G.; Senocak, I.; Shyy, W.; Ikohagi, T.; Cao, S. Dynamics of attached turbulent cavitating flows. Prog. Aerosp. Sci. 2001, 37, 551–581. [Google Scholar] [CrossRef]
- Barre, S.; Rolland, J.; Boitel, G.; Goncalves, E.; Patella, R.F. Experiments and modeling of cavitating flows in venturi: Attached sheet cavitation. Eur. J. Mech. B Fluid 2009, 28, 444–464. [Google Scholar] [CrossRef]
- Wu, Q.; Huang, B.; Wang, G.; Cao, S. The transient characteristics of cloud cavitating flow over a flexible hydrofoil. Int. J. Multiph. Flow 2018, 99, 162–173. [Google Scholar] [CrossRef]
- Gopalan, S.; Katz, J. Flow structure and modeling issues in the closure region of attached cavitation. Phys. Fluids 2000, 12, 895–911. [Google Scholar] [CrossRef]
- Foeth, E.J. The Structure of Three-Dimensional Sheet Cavitation. Ph.D. Thesis, Delft University of Technology, Delft, The Netherlands, 2008. [Google Scholar]
- Luo, X.; Ji, B.; Zhang, Y.; Xu, H. Cavitating flow over a mini hydrofoil. Chin. Phys. Lett. 2012, 29, 016401. [Google Scholar] [CrossRef]
- Wang, Y.; Wu, X.; Huang, C.; Wu, X. Unsteady characteristics of cloud cavitating flow near the free surface around an axisymmetric projectile. Int. J. Multiph. Flow 2016, 85, 48–56. [Google Scholar] [CrossRef]
- Arndt, R.E.A. Some remarks on hydrofoil cavitation. J. Hydrodyn. 2012, 24, 305–314. [Google Scholar] [CrossRef]
- Ganesh, H.; Makiharju, S.A.; Ceccio, S.L. Bubbly shock propagation as a mechanism for sheet-to-cloud transition of partial cavities. J. Fluid Mech. 2016, 802, 37–78. [Google Scholar] [CrossRef] [Green Version]
- Wang, C.; Huang, B.; Wang, G.; Zhang, M.; Ding, N. Unsteady pressure fluctuation characteristics in the process of breakup and shedding of sheet/cloud cavitation. Int. J. Heat Mass Transf. 2017, 114, 769–785. [Google Scholar] [CrossRef]
- Knapp, R.T. Recent investigations of the mechanics of cavitation and cavitation damage. Trans. ASME 1955, 77, 1045–1054. [Google Scholar]
- Kawanami, Y.; Kato, H.; Yamaguchi, H.; Tanimura, M.; Tagaya, Y. Mechanism and control of cloud cavitation. J. Fluids Eng. 1997, 119, 788–794. [Google Scholar] [CrossRef]
- Pendar, M.R.; Roohi, E. Investigation of cavitation around 3D hemispherical head-form body and conical cavitators using different turbulence and cavitation models. Ocean Eng. 2016, 112, 287–306. [Google Scholar] [CrossRef]
- Park, S.; Rhee, S.H. Numerical analysis of the three-dimensional cloud cavitating flow around a twisted hydrofoil. Fluid Dyn. Res. 2012, 45, 201–218. [Google Scholar] [CrossRef]
- Dular, M.; Bachert, R.; Schaad, C.; Stoffel, B. Investigation of a re-entrant jet reflection at an inclined cavity closure line. Eur. J. Mech. B Fluids 2007, 26, 688–705. [Google Scholar] [CrossRef]
- Laberteaux, K.; Ceccio, S. Partial cavity flows. Part 1. Cavities forming on models without spanwise variation. J. Fluid Mech. 2001, 431, 1–41. [Google Scholar] [CrossRef]
- Le, Q.; Franc, J.P.; Michel, J.M. Partial cavities: Global behavior and mean pressure distribution. J. Fluids Eng. 1993, 115, 243–248. [Google Scholar] [CrossRef]
- Pham, T.M.; Larrarte, F.; Fruman, D.H. Investigation of unsteady sheet cavitation and cloud cavitation mechanisms. J. Fluids Eng. 1999, 121, 289–296. [Google Scholar] [CrossRef]
- Ji, B.; Long, Y.; Long, X.; Qian, Z.; Zhou, J. Large eddy simulation of turbulent attached cavitating flow with special emphasis on large scale structures of the hydrofoil wake and turbulence-cavitation interactions. J. Hydrodyn. 2017, 29, 27–39. [Google Scholar] [CrossRef]
- Smagorinsky, J. General circulation experiments with the primitive equations: I. The basic experiment. Mon. Weather Rev. 1963, 91, 99–164. [Google Scholar] [CrossRef]
- Huang, B.; Zhao, Y.; Wang, G. Large eddy simulation of turbulent vortex cavitation interactions in transient sheet/cloud cavitating flows. Comput. Fluids 2014, 92, 113–124. [Google Scholar] [CrossRef]
- Luo, X.; Ji, B.; Peng, X.; Xu, H.; Nishi, M. Numerical simulation of cavity shedding from a three-dimensional twisted hydrofoil and induced pressure fluctuation by large-eddy simulation. J. Fluids Eng. 2012, 134, 379–389. [Google Scholar] [CrossRef]
- Dittakavi, N.; Chunekar, A.; Frankel, S. Large eddy simulation of turbulent-cavitation interactions in a Venturi nozzle. J. Fluids Eng. 2010, 132, 121301. [Google Scholar] [CrossRef]
- Gnanaskandan, A.; Mahesh, K. Large eddy simulation of the transition from sheet to cloud cavitation over a wedge. Int. J. Multiph. Flow 2016, 83, 86–102. [Google Scholar] [CrossRef]
- Liu, M.; Tan, L.; Liu, Y.; Xu, Y.; Cao, S. Large eddy simulation of cavitation vortex interaction and pressure fluctuation around hydrofoil ALE 15. Ocean Eng. 2018, 163, 264–274. [Google Scholar] [CrossRef]
- Chen, Y.; Chen, X.; Li, J.; Gong, Z.; Lu, C. Large eddy simulation and investigation on the flow structure of the cascading cavitation shedding regime around 3D twisted hydrofoil. Ocean Eng. 2017, 129, 1–19. [Google Scholar] [CrossRef]
- Ji, B.; Luo, X.W.; Arndt, R.E.; Peng, X.; Wu, Y. Large eddy simulation and theoretical investigations of the transient cavitating vortical flow structure around a NACA66 hydrofoil. Int. J. Multiph. Flow 2015, 68, 121–134. [Google Scholar] [CrossRef]
- Li, L.; Li, B.; Hu, Z.; Lin, Y.; Cheung, S.C. Large eddy simulation of unsteady shedding behavior in cavitating flows with time-average validation. Ocean Eng. 2016, 125, 1–11. [Google Scholar] [CrossRef] [Green Version]
- Wang, G.; Ostoja-Starzewski, M. Large eddy simulation of a sheet/cloud cavitation on a NACA0015 hydrofoil. Appl. Math. Model. 2007, 31, 417–447. [Google Scholar] [CrossRef]
- Dai, S.; Younis, B.A.; Sun, L. Large-eddy simulations of cavitation in a square surface cavity. Appl. Math. Model. 2014, 38, 5665–5683. [Google Scholar] [CrossRef]
- Roohi, E.; Zahiri, A.P.; Passandideh-Fard, M. Numerical simulation of cavitation around a two-dimensional hydrofoil using VOF method and LES turbulence model. Appl. Math. Model. 2013, 37, 6469–6488. [Google Scholar] [CrossRef]
- Ji, B.; Luo, X.; Peng, X.; Wu, Y. Three-dimensional large eddy simulation and vorticity analysis of unsteady cavitating flow around a twisted hydrofoil. J. Hydrodyn. 2013, 25, 510–519. [Google Scholar] [CrossRef]
- Zwart, P.J.; Gerber, A.G.; Belamri, T. A two-phase flow model for predicting cavitation dynamics. In Proceedings of the International Conference on Multiphase Flow, Yokohama, Japan, 3 May–4 June 2004. [Google Scholar]
- Nicoud, F.; Ducros, F. Subgrid-scale stress modelling based on the square of the velocity gradient tensor. Flow Turbul. Combust. 1999, 62, 183–200. [Google Scholar] [CrossRef]
- ANSYS Inc. ANSYS CFX 18.0 Tutorials; ANSYS Inc.: Canonsburg, PA, USA, 2018. [Google Scholar]
- Ji, B.; Luo, X.W.; Peng, X.X.; Wu, Y.L.; Xu, H.Y. Numerical analysis of cavitation evolution and excited pressure fluctuation around a propeller in non-uniform wake. Int. J. Multiph. Flow 2012, 43, 13–21. [Google Scholar] [CrossRef]
- Ji, B.; Luo, X.W.; Arndt, R.E.A.; Wu, Y. Numerical simulation of three dimensional cavitation shedding dynamics with special emphasis on cavitation–vortex interaction. Ocean Eng. 2014, 87, 64–77. [Google Scholar] [CrossRef]
- Long, X.; Cheng, H.; Ji, B.; Arndt, R.E.A. Numerical investigation of attached cavitation shedding dynamics around the Clark-Y hydrofoil with the FBDCM and an integral method. Ocean Eng. 2017, 137, 247–261. [Google Scholar] [CrossRef]
- Long, X.; Cheng, H.; Ji, B.; Arndt, R.E.A.; Peng, X. Large eddy simulation and Euler–Lagrangian coupling investigation of the transient cavitating turbulent flow around a twisted hydrofoil. Int. J. Multiph. Flow 2018, 100, 41–56. [Google Scholar] [CrossRef]
- Bensow, R. Simulation of the unsteady cavitation on the the Delft Twist11 foil using RANS, DES and LES. In Proceedings of the International Symposium on Marine Propulsors, Hamburg, Germany, 15–17 June 2011. [Google Scholar]
- Foeth, E.J.; Terwisga, T.V.; Doorne, C.V. On the collapse structure of an attached cavity on a three-dimensional hydrofoil. J. Fluids Eng. Trans. ASME 2008, 130, 071303. [Google Scholar] [CrossRef]
- Callenaere, M.; Franc, J.P.; Michel, J.M.; Riondet, M. The cavitation instability induced by the development of a re-entrant jet. J. Fluid Mech. 2001, 444, 223–256. [Google Scholar] [CrossRef]
- Ji, B.; Luo, X.; Wu, Y.; Peng, X.; Duan, Y. Numerical analysis of unsteady cavitating turbulent flow and shedding horse-shoe vortex structure around a twisted hydrofoil. Int. J. Multiph. Flow 2013, 51, 33–43. [Google Scholar] [CrossRef]
- Xing, T. A general framework for verification and validation of large eddy simulations. J. Hydrodyn. 2015, 27, 163–175. [Google Scholar] [CrossRef]
- Dutta, R.; Xing, T. Five-equation and robust three-equation methods for solution verification of large eddy simulation. J. Hydrodyn. 2018, 30, 23–33. [Google Scholar] [CrossRef] [Green Version]
- Long, X.; Long, Y.; Wang, W.; Cheng, H.; Ji, B. Some notes on numerical simulation and error analyses of the attached turbulent cavitating flow by LES. J. Hydrodyn. 2018, 30, 369–372. [Google Scholar] [CrossRef]
Figure 1.
Comparisons of observed and predicted top view of the cavitation evolution process in one typical cycle (σ = 1.07): (a) experimental data; and (b) predicted results.
Figure 1.
Comparisons of observed and predicted top view of the cavitation evolution process in one typical cycle (σ = 1.07): (a) experimental data; and (b) predicted results.

Figure 2.
The geometry of two hydrofoils in side view: (a) NACA0009; and (b) Clark-y.

Figure 3.
Distribution of the geometric angle of attack of the hydrofoil.

Figure 4.
Computational domain and mesh around the hydrofoil. (a) Boundary conditions; and (b) three-dimensional (3D) Mesh.
Figure 4.
Computational domain and mesh around the hydrofoil. (a) Boundary conditions; and (b) three-dimensional (3D) Mesh.

Figure 5.
Top view of the transient cavity topology and pressure distributions of two different hydrofoils: (a) NACA0009 and (b) Clark-y.
Figure 5.
Top view of the transient cavity topology and pressure distributions of two different hydrofoils: (a) NACA0009 and (b) Clark-y.

Figure 6.
Comparisons of typical cavity shape and pressure distributions of the two hydrofoils: (a) top view of the time-averaged cavity topology and pressure contour of the suction surface; (b) geometric outline and pressure distributions of a monitor curve on the suction surface.
Figure 6.
Comparisons of typical cavity shape and pressure distributions of the two hydrofoils: (a) top view of the time-averaged cavity topology and pressure contour of the suction surface; (b) geometric outline and pressure distributions of a monitor curve on the suction surface.

Figure 7.
The time fluctuations of lift coefficients of the two hydrofoils.

Figure 8.
The velocity vector, the contour of the u-velocity component, and the iso-surface of the water vapor volume fraction on the suction side of the hydrofoils in top view: (a) NACA0009; and (b) Clark-y.
Figure 8.
The velocity vector, the contour of the u-velocity component, and the iso-surface of the water vapor volume fraction on the suction side of the hydrofoils in top view: (a) NACA0009; and (b) Clark-y.

Figure 9.
Comparisons of vortex strucutres on the suction side of hydrofoils during the cavity shedding process: (a) NACA0009; and (b) Clark-y.
Figure 9.
Comparisons of vortex strucutres on the suction side of hydrofoils during the cavity shedding process: (a) NACA0009; and (b) Clark-y.

Figure 10.
The contours of Reynolds stresses on the mid-plane of the two hydrofoils: (a) , (b) ; and (c) .
Figure 10.
The contours of Reynolds stresses on the mid-plane of the two hydrofoils: (a) , (b) ; and (c) .


Table 1.
Summary of the simulation cases.
| Case | Physical Model | Typical Geometry Size | Inflow Velocity | Cavitation Number |
|---|---|---|---|---|
| 1 | Delft Twist-11 hydrofoil | C1 = 0.15 m, S1 = 0.3 m | 6.97 m/s | 1.07 |
| 2 | NACA0009 hydrofoil | C2 = S2 = 0.07 m | 7 m/s | 1.2 |
| 3 | Clark-y hydrofoil | C3 = S3 = 0.07 m | 7 m/s | 1.2 |
Table 2.
The lift coefficient CL and the frequency f suggested by different documents. EXP: experiment; LES: large eddy simulation; and DES: detached eddy simulation.
Table 2.
The lift coefficient CL and the frequency f suggested by different documents. EXP: experiment; LES: large eddy simulation; and DES: detached eddy simulation.
| Cases | CL | f (HZ) |
|---|---|---|
| EXP [10] | 0.53 | 32.2 |
| LES [45] | 0.44 | 34 |
| LES, fine [45] | 0.45 | - |
| DES [45] | 0.42 | 30 |
| LES (in this work) | 0.45 | 34 |
Table 3.
The list of boundary conditions.
| Boundary Type | Location in the Domain | Variable | Value |
|---|---|---|---|
| Inlet | The left face | Velocity | 7 m/s |
| Outlet | The right face | Static pressure | 32,510.2 Pa |
| Wall | The upper, lower, and back side face | Free-slip | - |
| Wall | The foil surface | No-slip | - |
| Symmetry | The front side face | - | - |
Table 4.
Results of the mesh independence study.
| Mesh | Grid Nodes | CL | CD |
|---|---|---|---|
| Coarse | 2.0 million | 0.768 | 0.056 |
| Medium | 3.5 million | 0.755 | 0.053 |
| Fine | 4.1 million | 0.755 | 0.052 |
© 2018 by the authors. Licensee MDPI, Basel, Switzerland. This article is an open access article distributed under the terms and conditions of the Creative Commons Attribution (CC BY) license (http://creativecommons.org/licenses/by/4.0/).
Share and Cite
MDPI and ACS Style
Hu, C.; Chen, G.; Yang, L.; Wang, G. Large Eddy Simulation of Turbulent Attached Cavitating Flows around Different Twisted Hydrofoils. Energies 2018, 11, 2768. https://doi.org/10.3390/en11102768
AMA Style
Hu C, Chen G, Yang L, Wang G. Large Eddy Simulation of Turbulent Attached Cavitating Flows around Different Twisted Hydrofoils. Energies. 2018; 11(10):2768. https://doi.org/10.3390/en11102768
Chicago/Turabian StyleHu, Changli, Guanghao Chen, Long Yang, and Guoyu Wang. 2018. "Large Eddy Simulation of Turbulent Attached Cavitating Flows around Different Twisted Hydrofoils" Energies 11, no. 10: 2768. https://doi.org/10.3390/en11102768
Note that from the first issue of 2016, this journal uses article numbers instead of page numbers. See further details here.