Author Contributions
Conceptualization, M.R.; Data curation, M.R.; Formal analysis, M.R.; Funding acquisition, U.-J.S.; Methodology, T.K.; Project administration, T.K.; Resources, T.K.; Software, M.R.; Supervision, T.K.; Writing—original draft, M.R.; Writing—review & editing, M.R. and T.K.
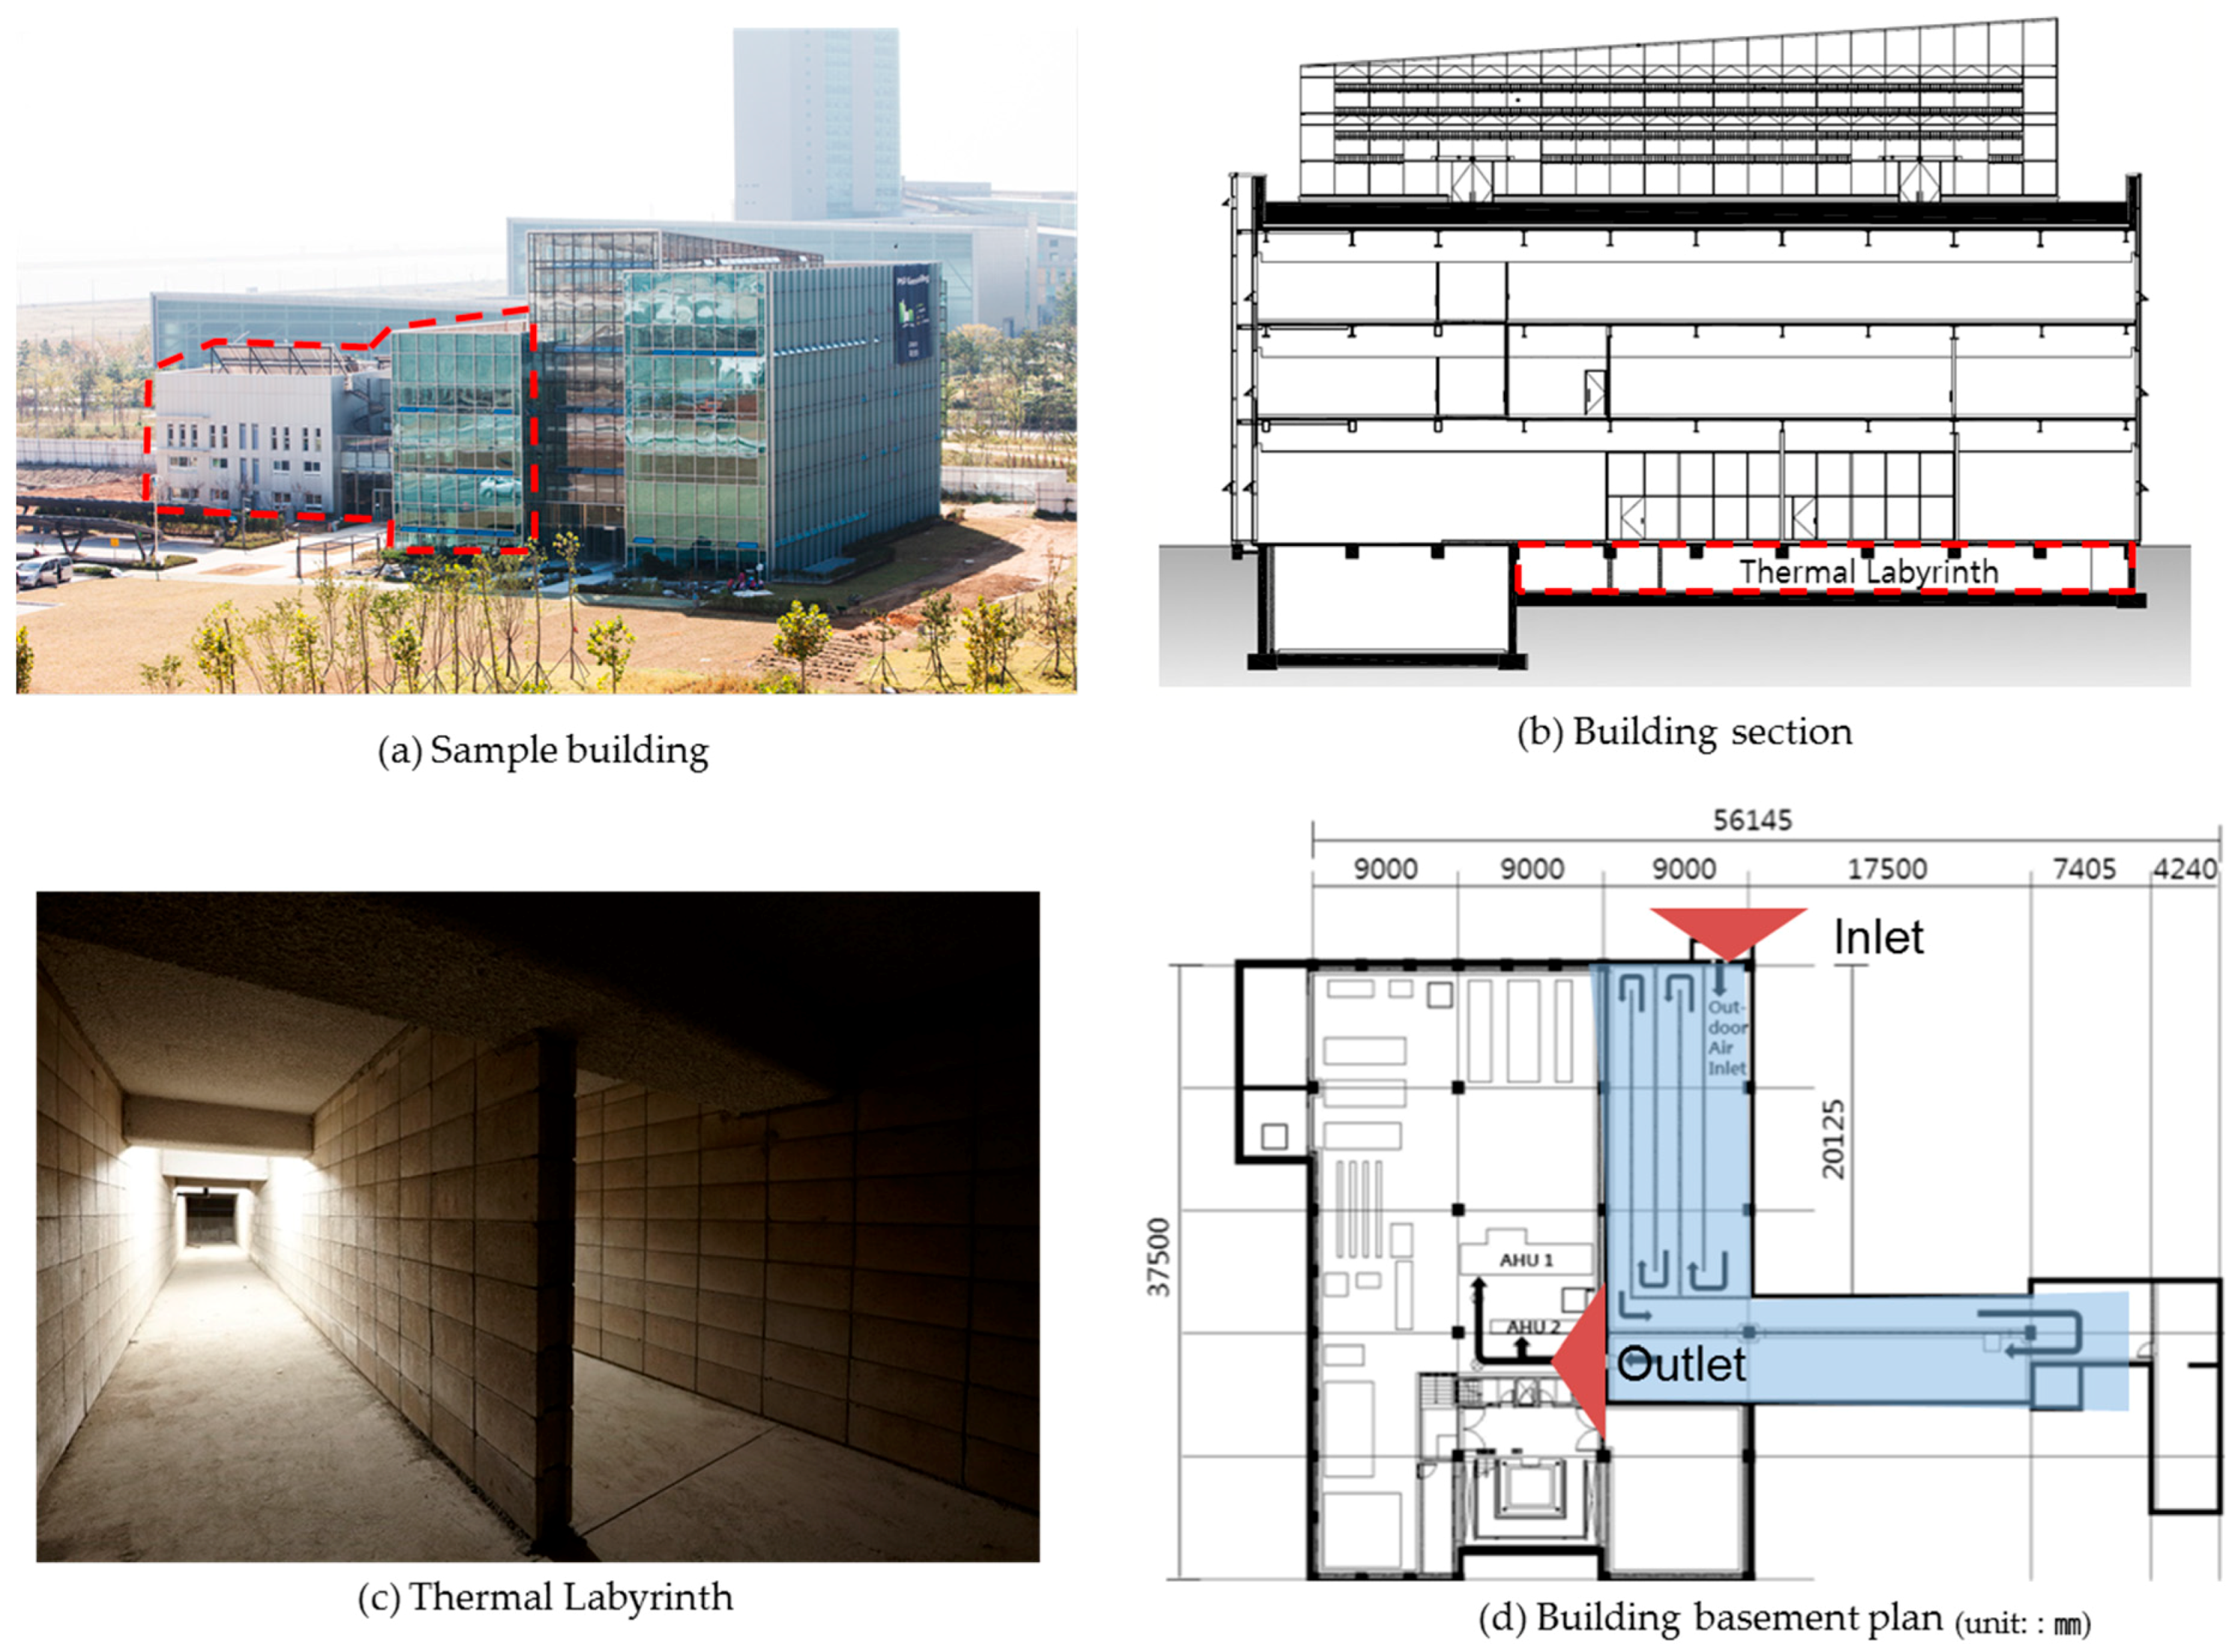
Figure 1.
Photographs and plans of sample building. (a) Sample building; (b) Building Section; (c) Thermal Labyrinth; (d) Building basement plan.
Figure 1.
Photographs and plans of sample building. (a) Sample building; (b) Building Section; (c) Thermal Labyrinth; (d) Building basement plan.
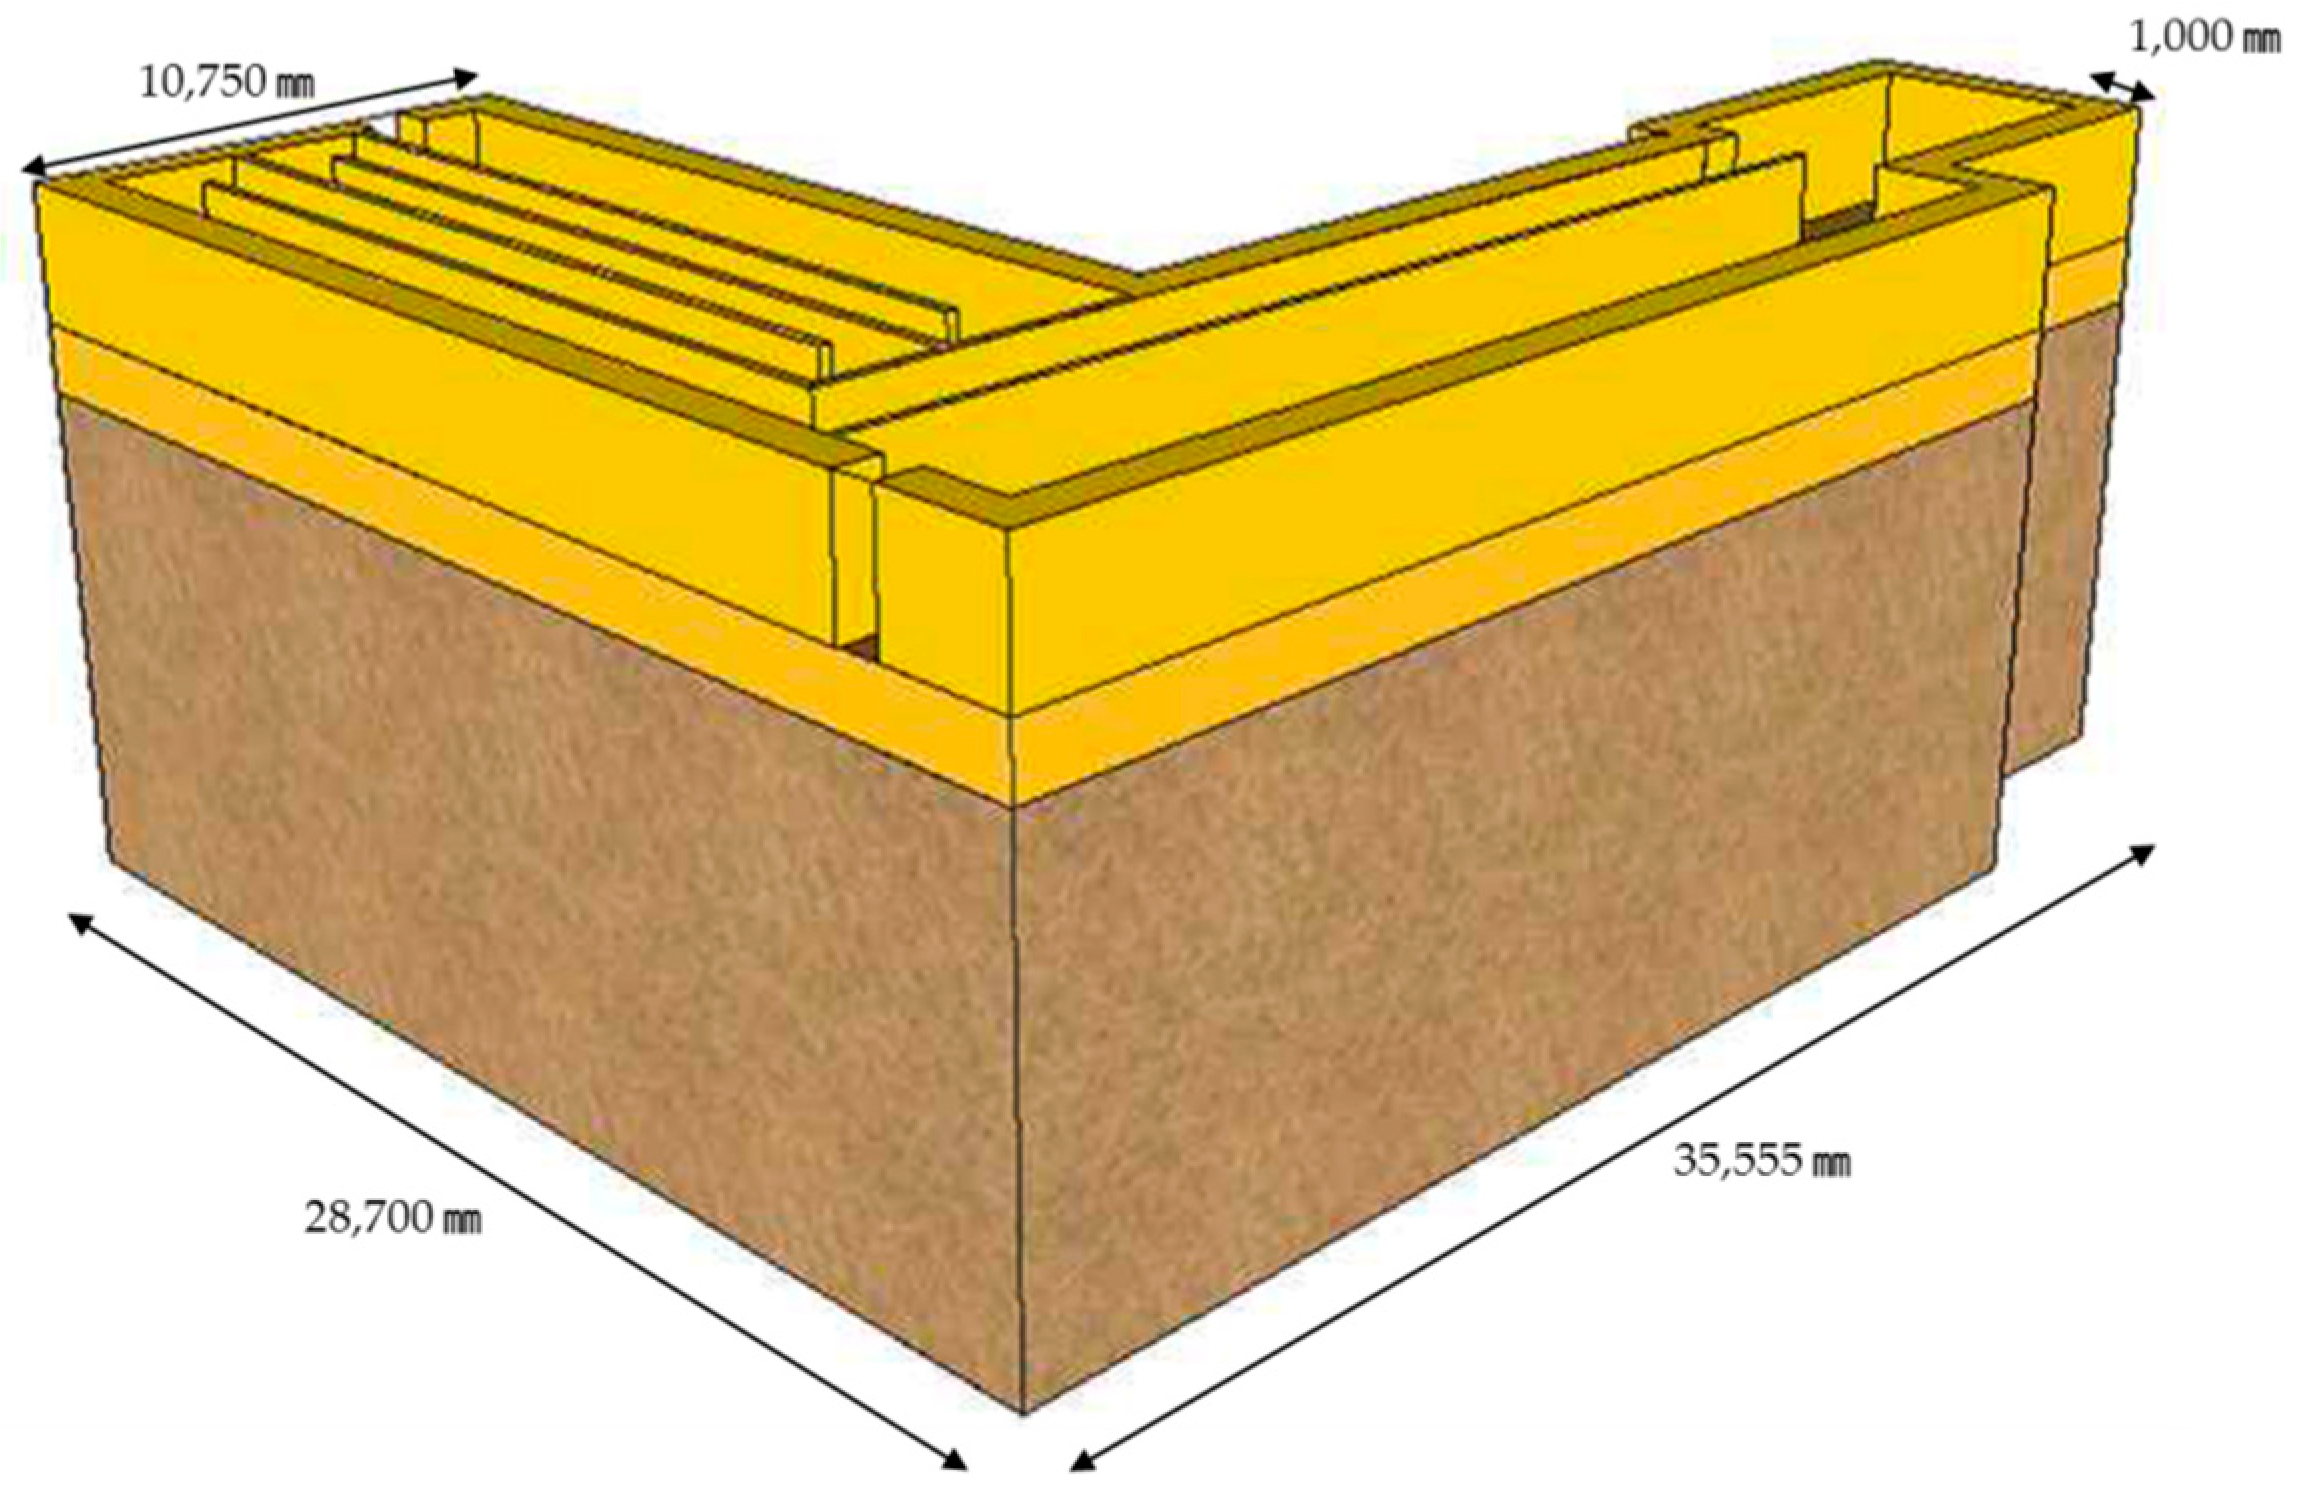
Figure 2.
Earth modeling for thermal labyrinth analysis.
Figure 2.
Earth modeling for thermal labyrinth analysis.
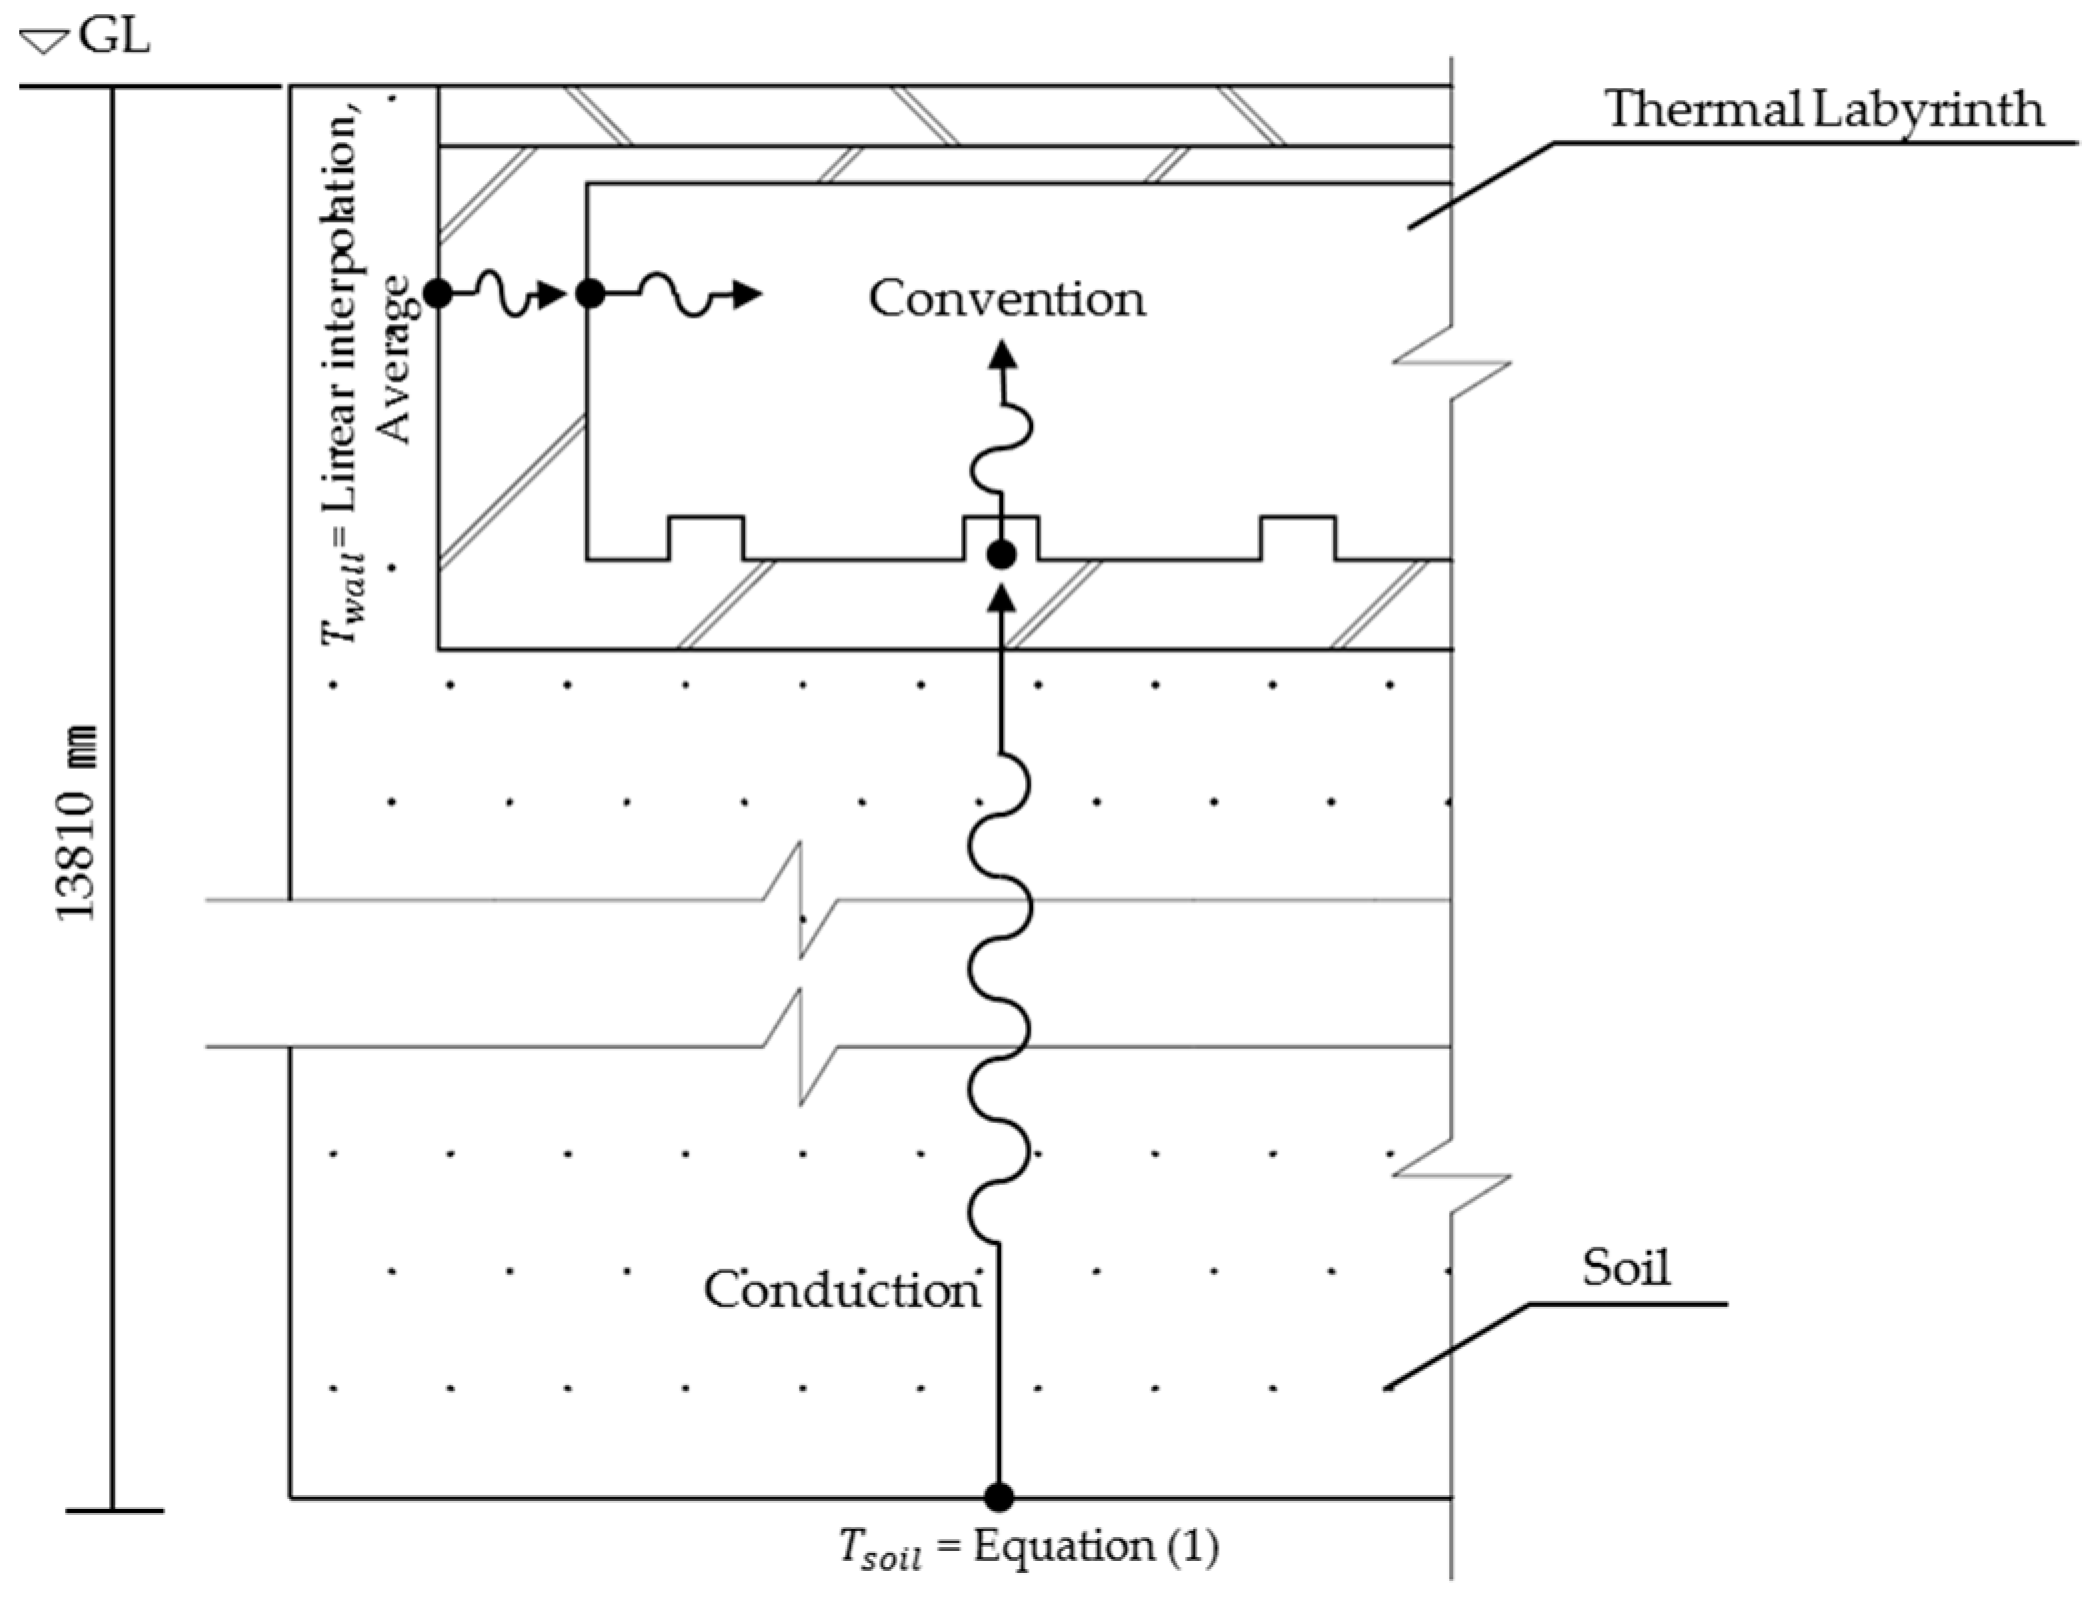
Figure 3.
Heat transfer diagram.
Figure 3.
Heat transfer diagram.
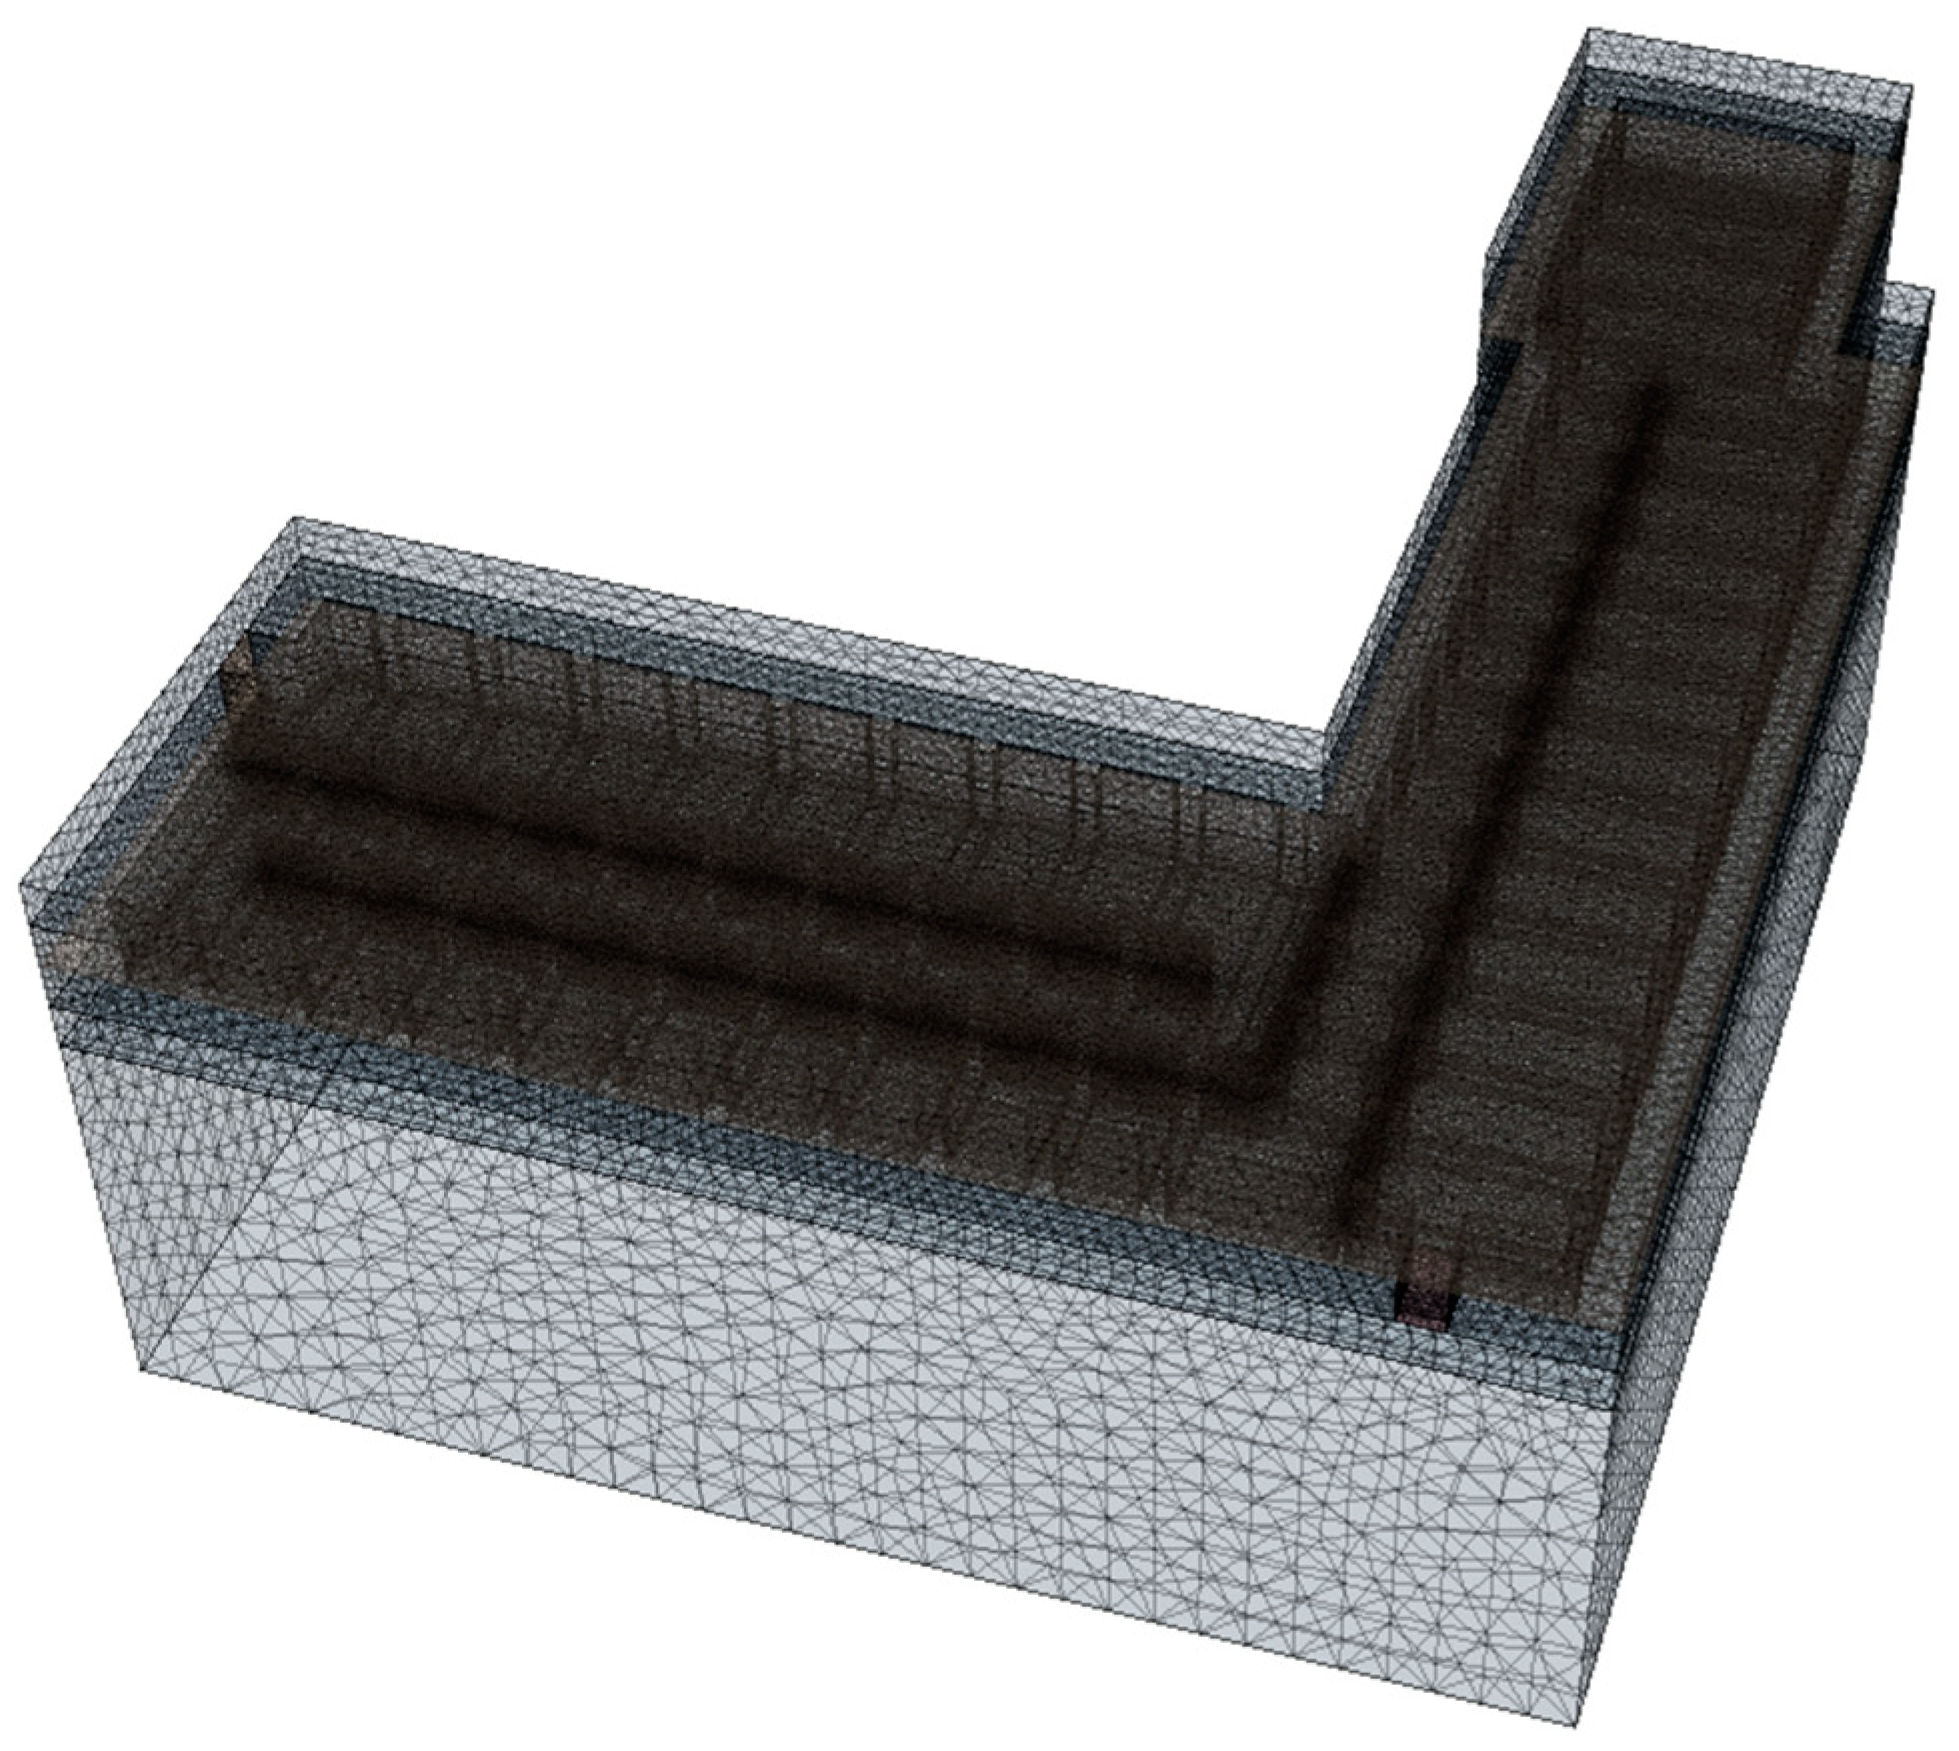
Figure 4.
Scene with its mesh.
Figure 4.
Scene with its mesh.
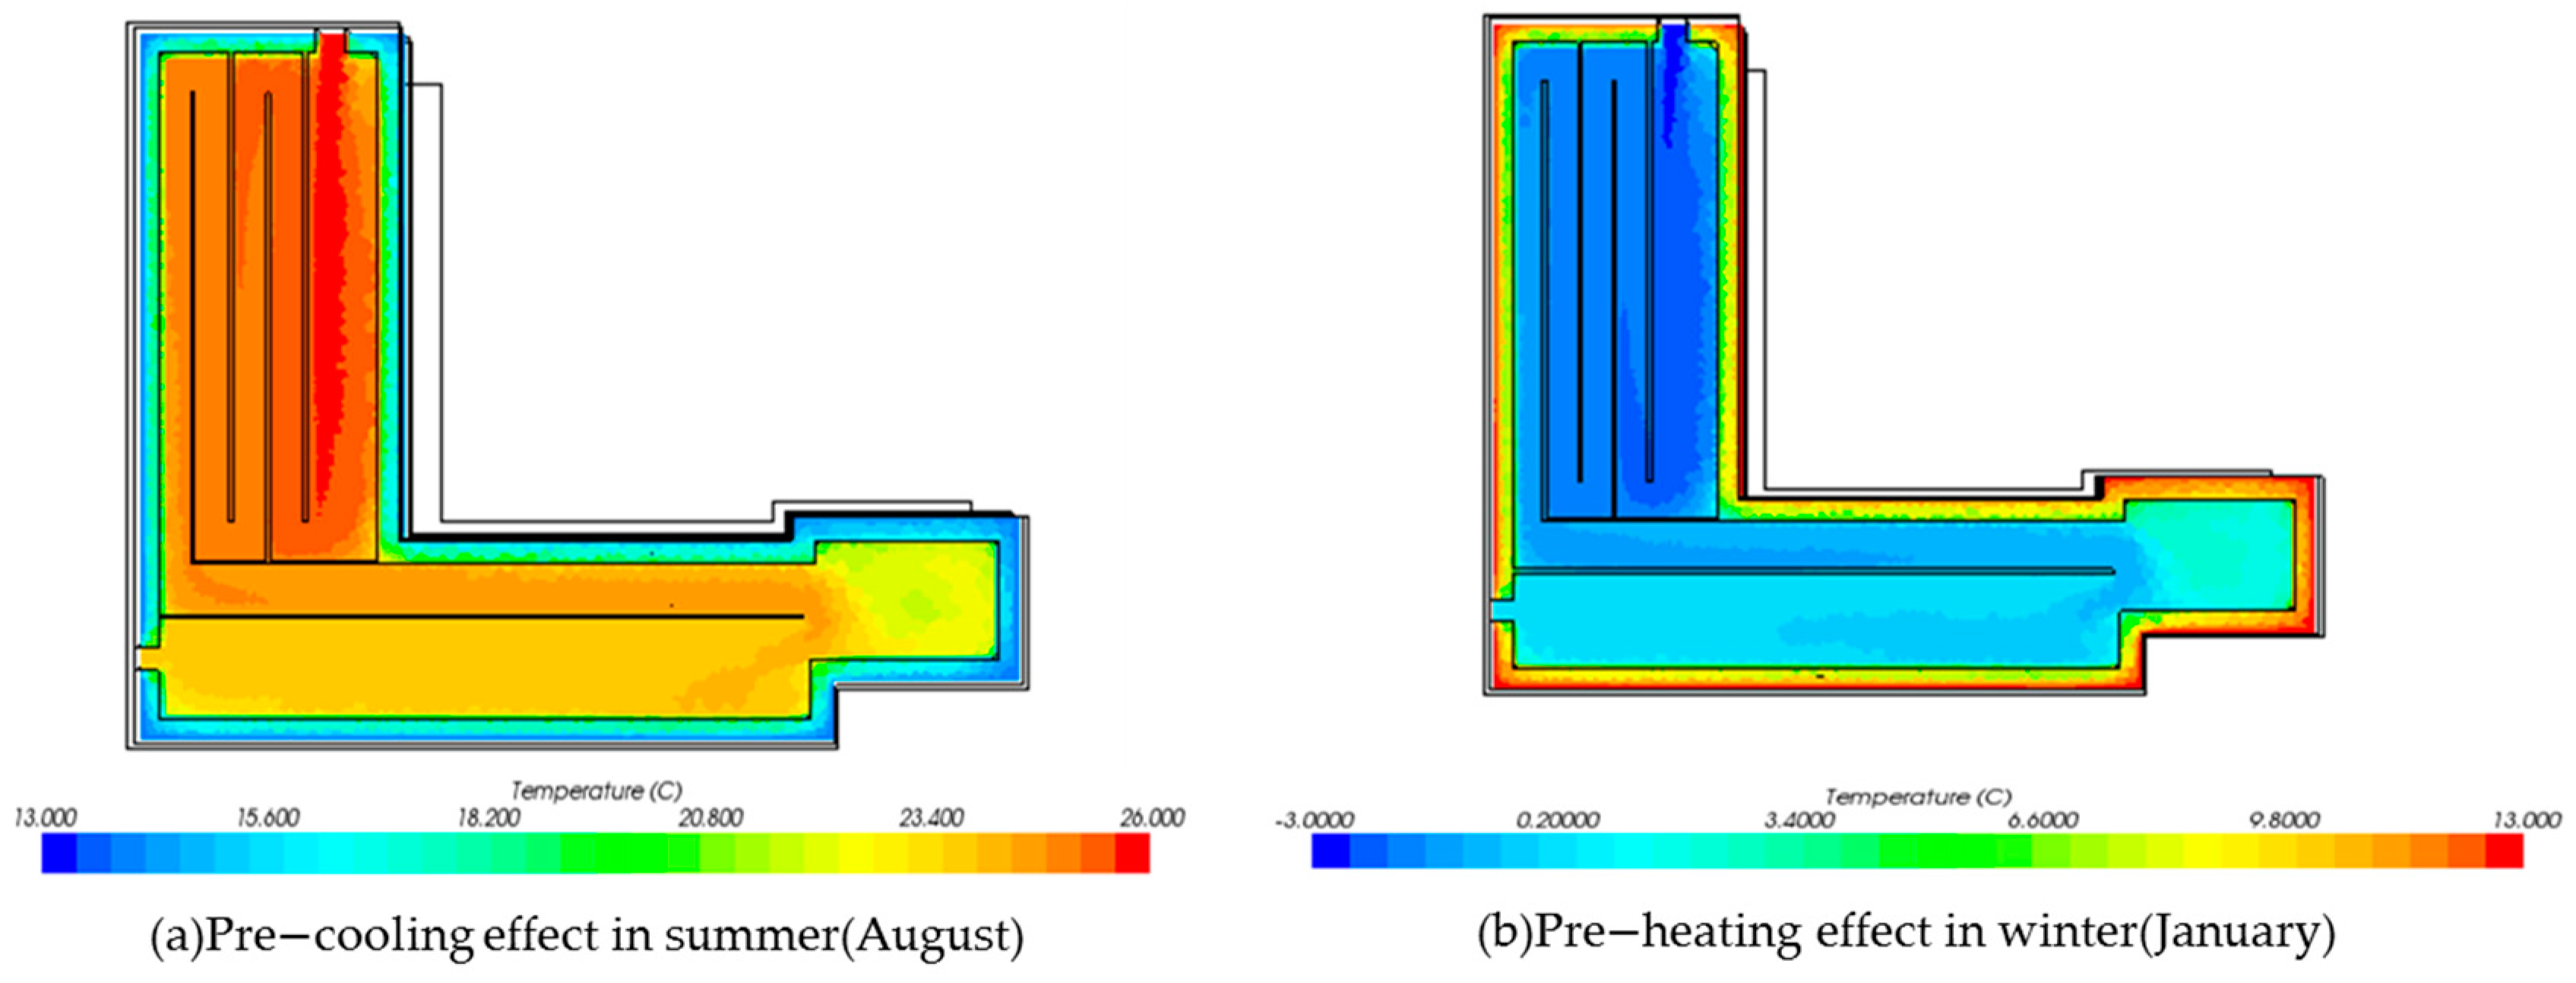
Figure 5.
Example of pre-cooling and pre-heating effect (Case 1-2). (a) Pre-cooling effect in summer (August). (b) Pre-heating effect in winter (January).
Figure 5.
Example of pre-cooling and pre-heating effect (Case 1-2). (a) Pre-cooling effect in summer (August). (b) Pre-heating effect in winter (January).
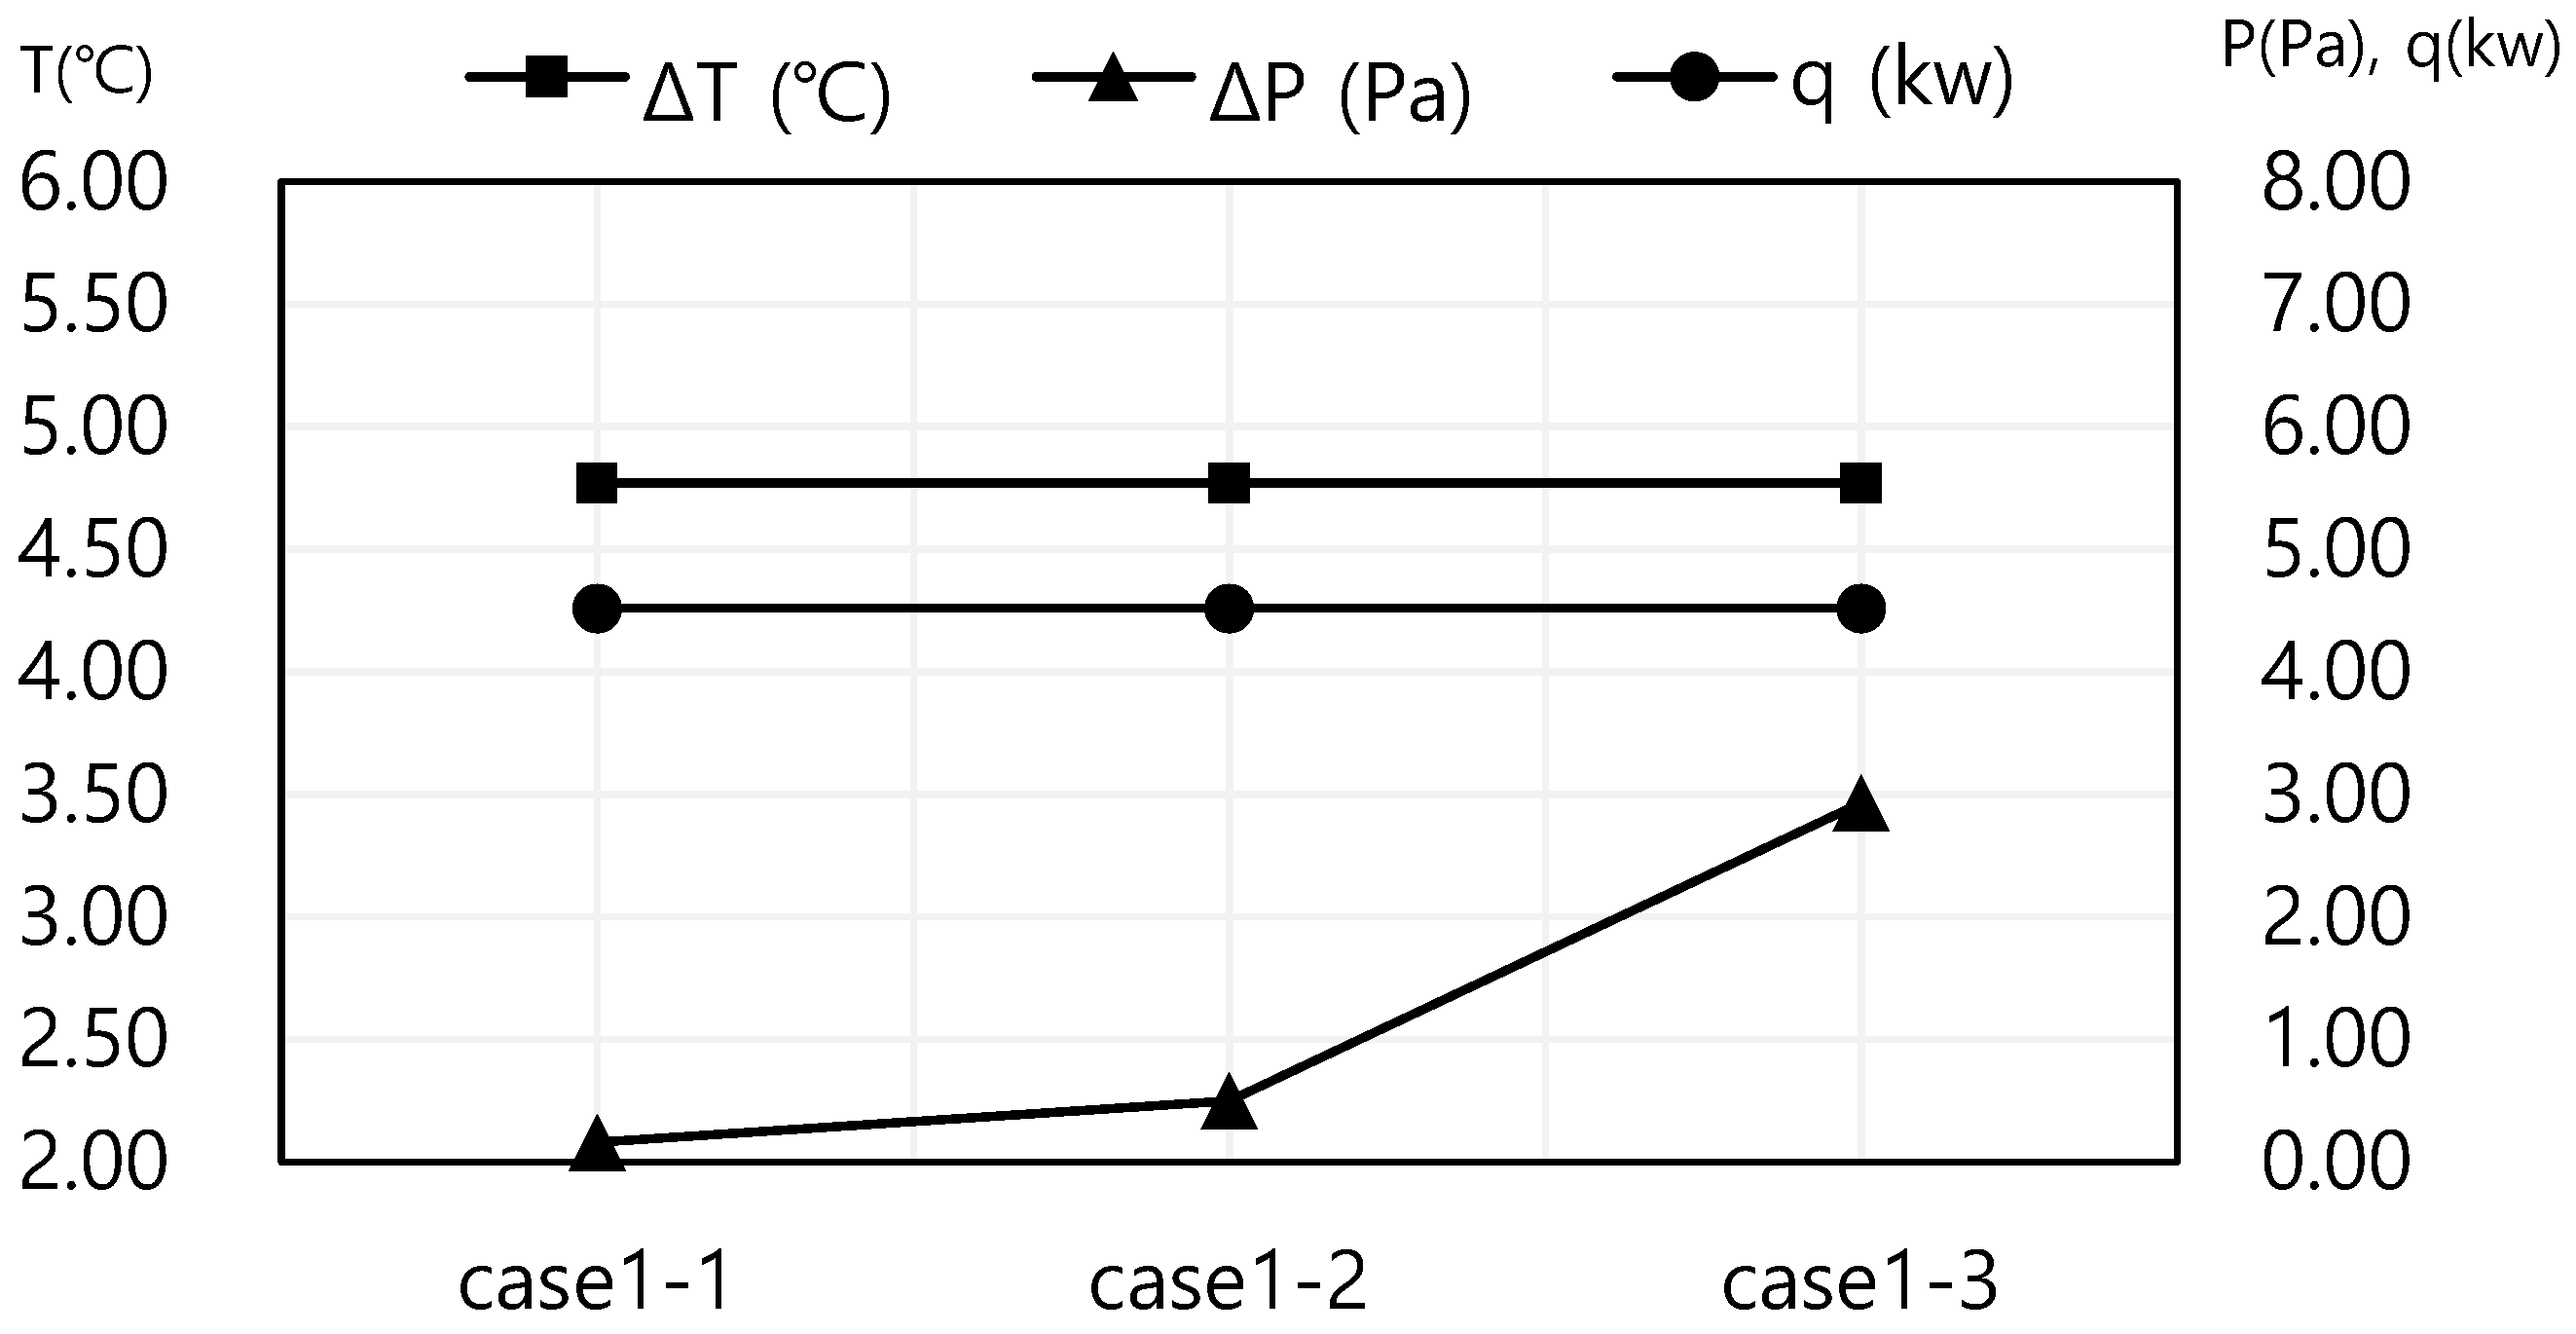
Figure 6.
Change in temperature, pressure, and thermal capacity with length.
Figure 6.
Change in temperature, pressure, and thermal capacity with length.
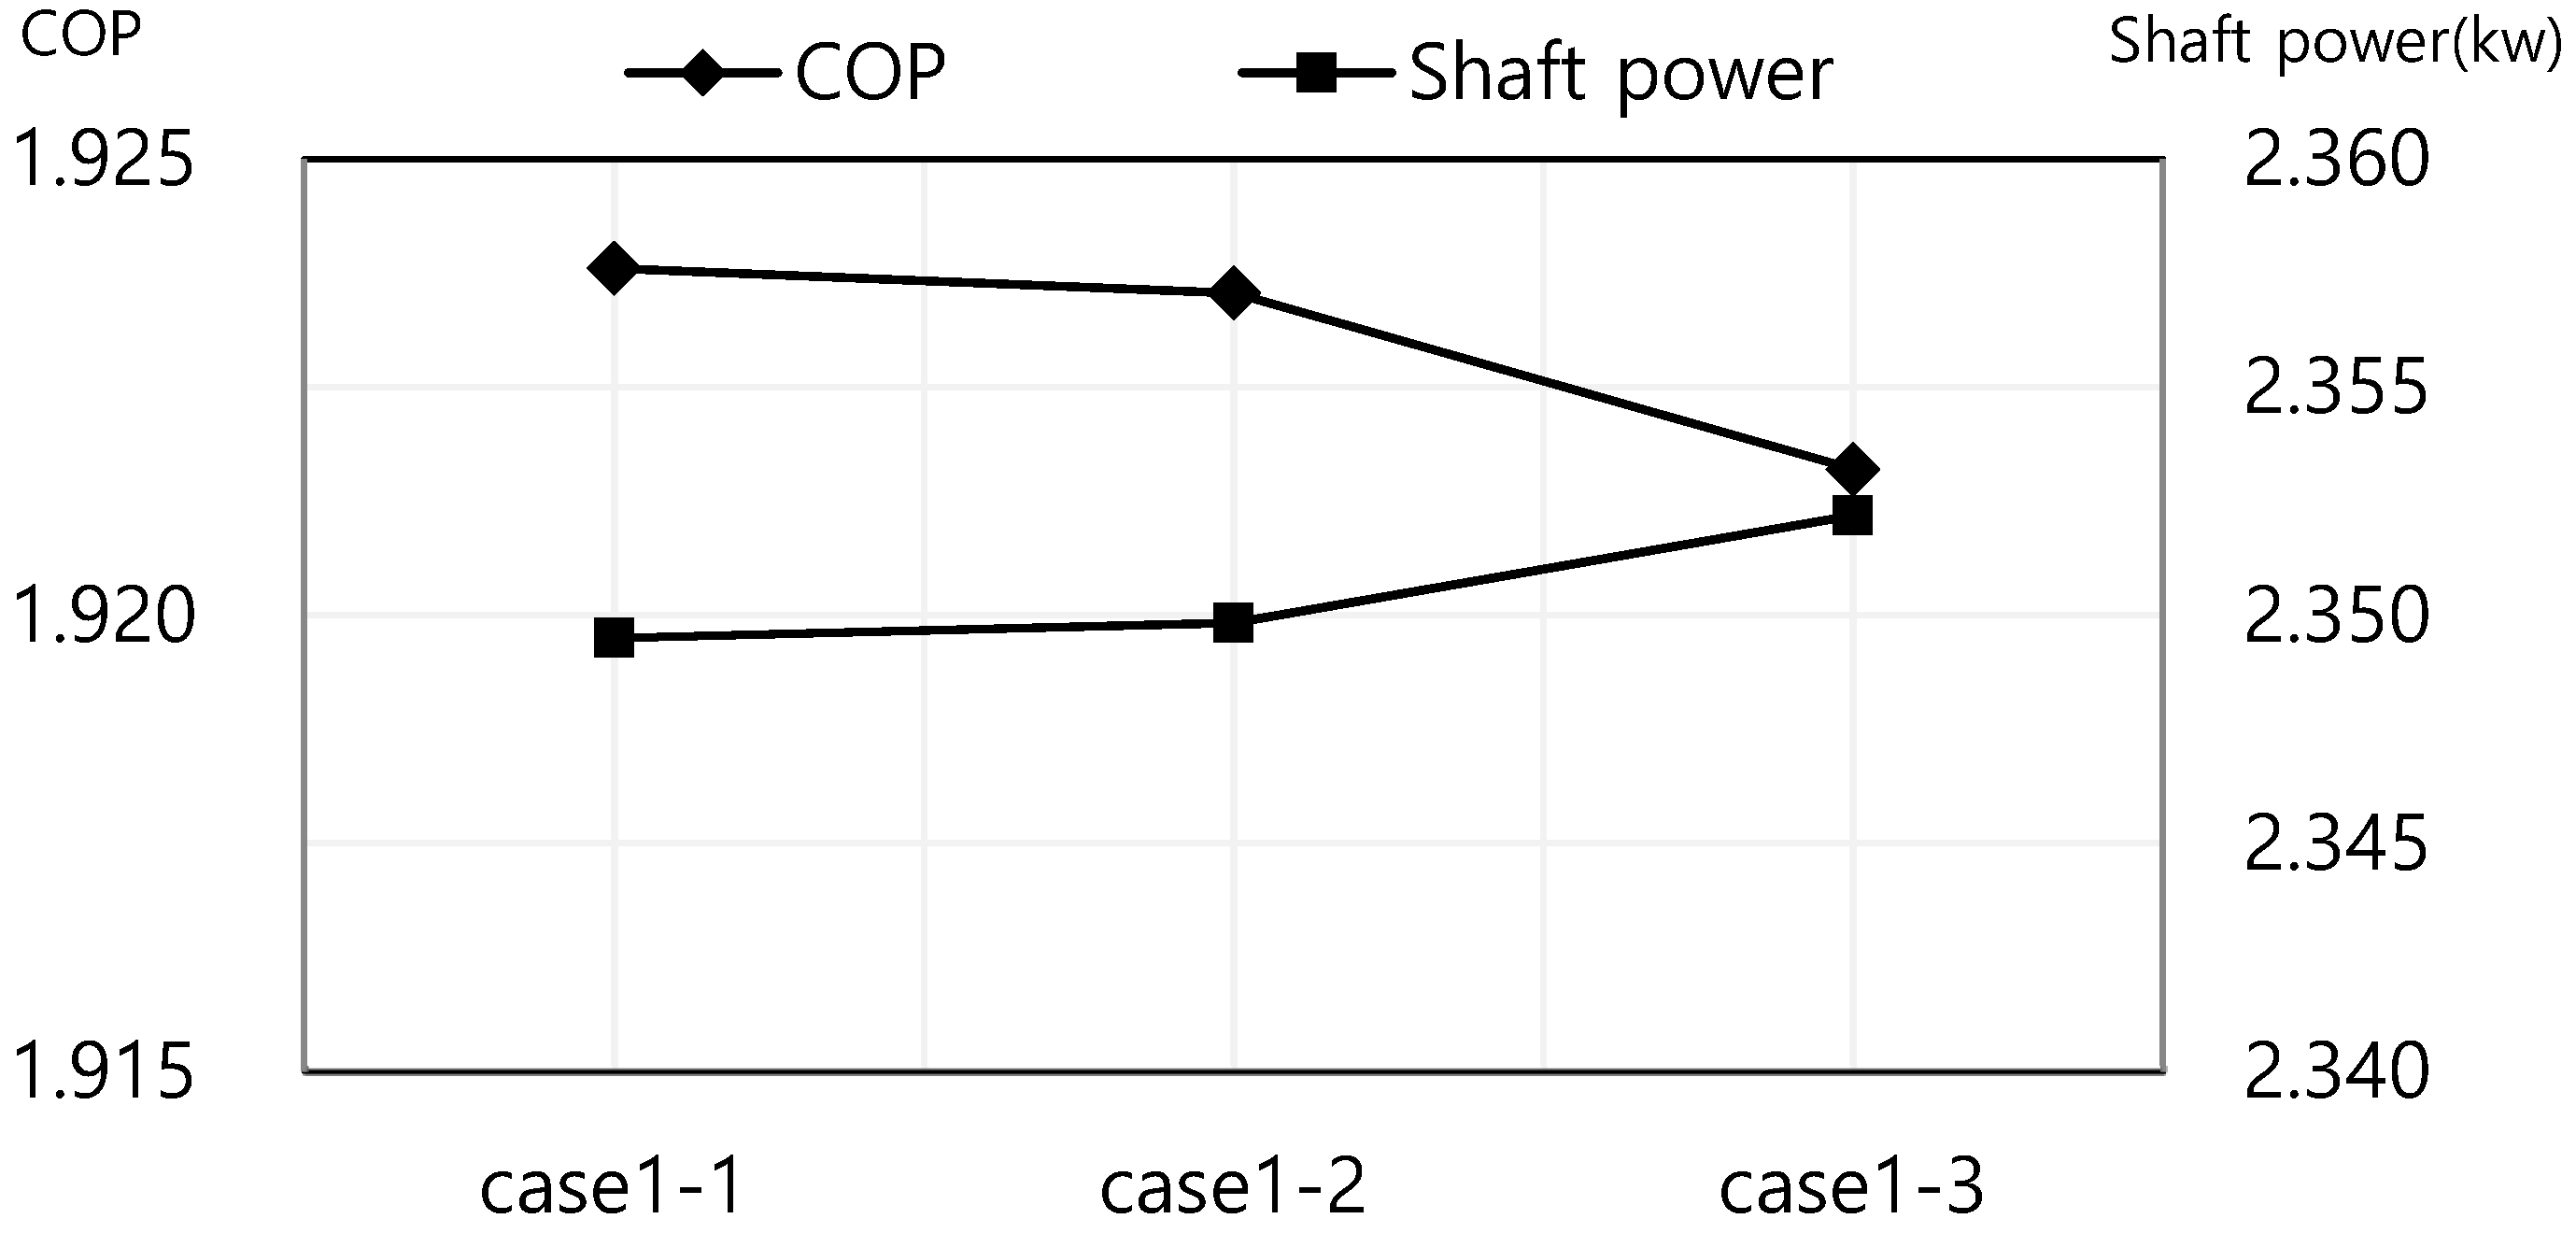
Figure 7.
Air blower axial power and COP changes with length.
Figure 7.
Air blower axial power and COP changes with length.
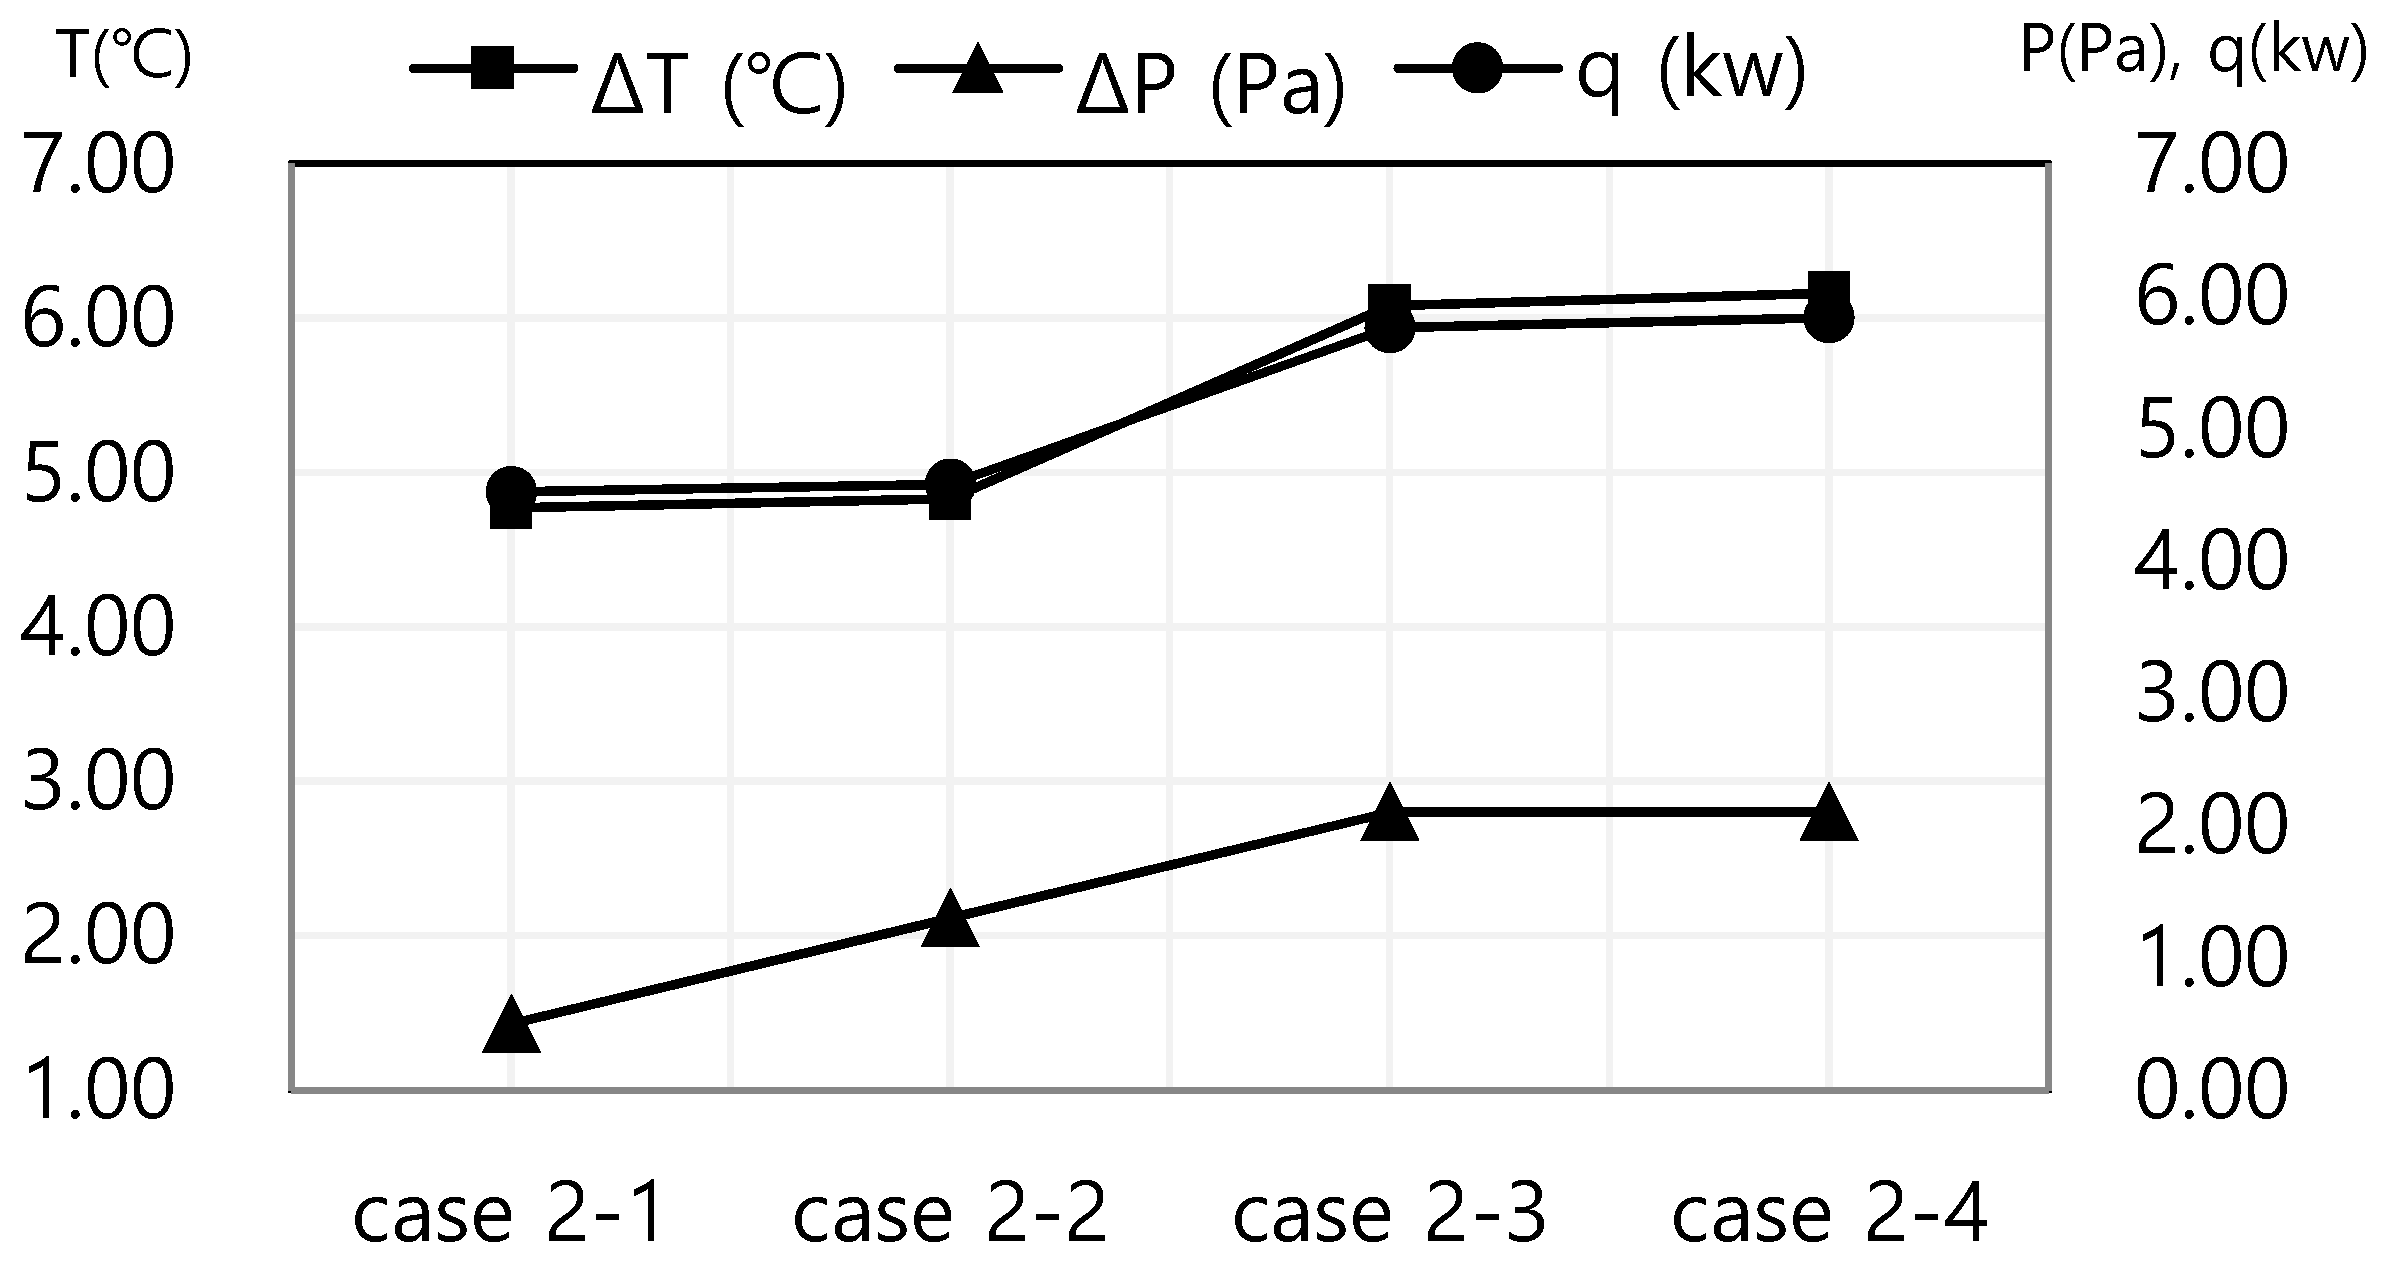
Figure 8.
Changes in temperature, pressure, and thermal capacity with the internal form change.
Figure 8.
Changes in temperature, pressure, and thermal capacity with the internal form change.
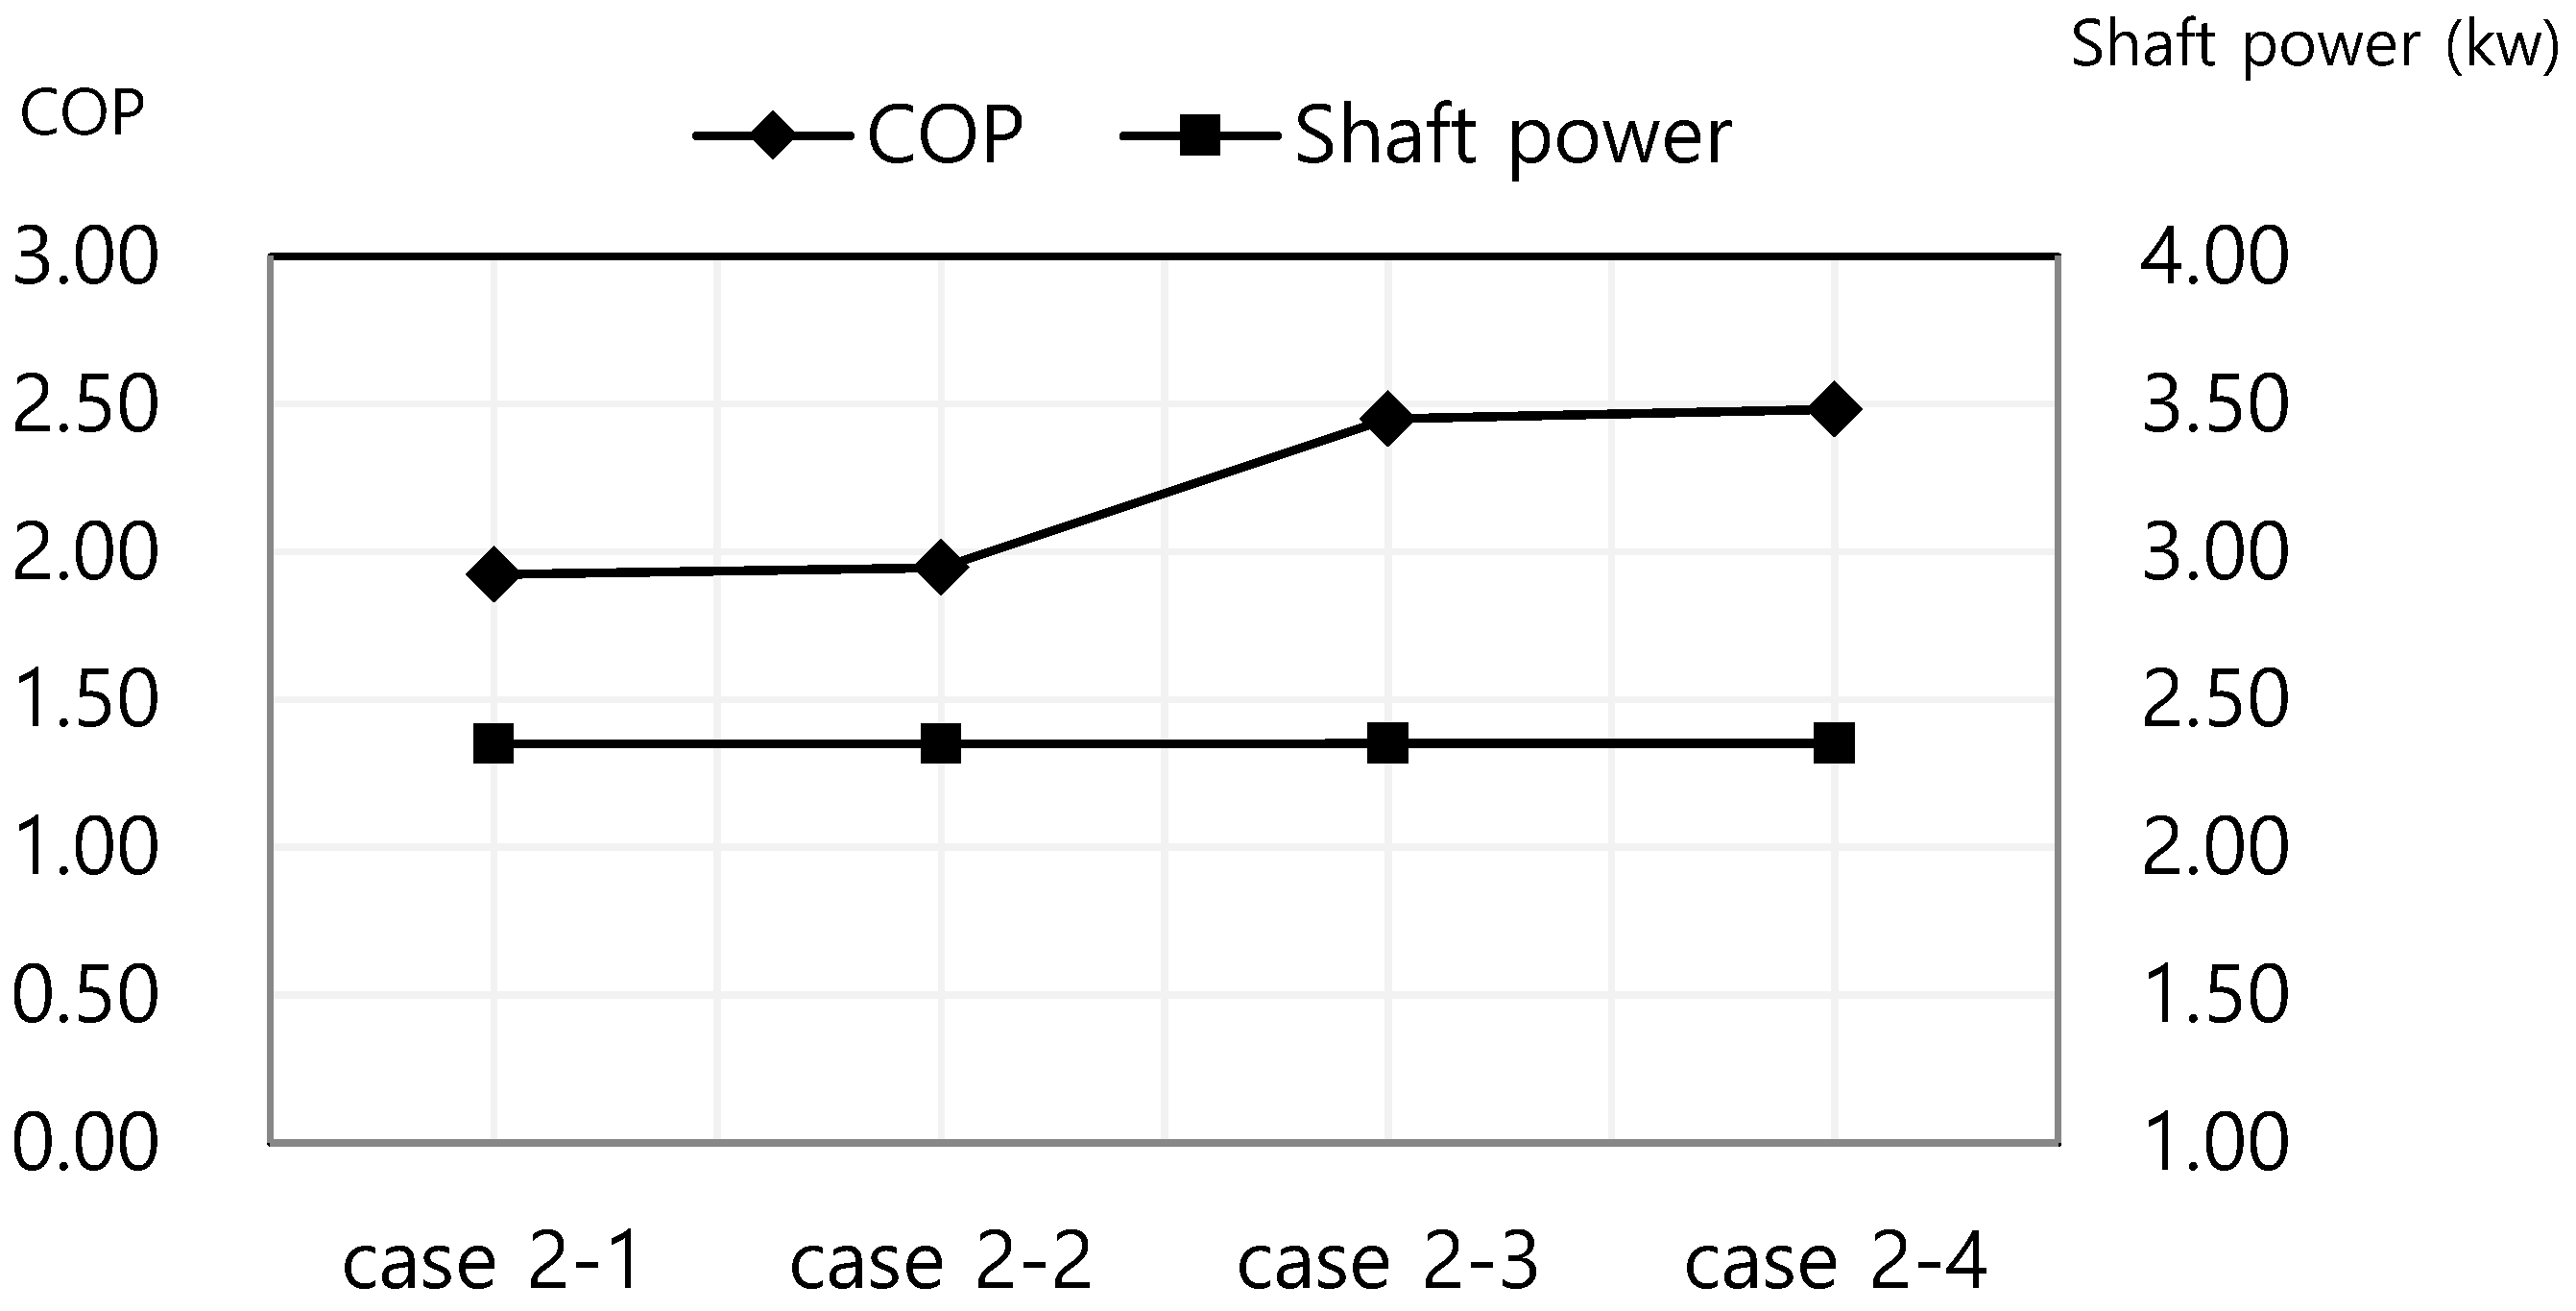
Figure 9.
Changes in the axial power of the air blower and COP with the internal form change.
Figure 9.
Changes in the axial power of the air blower and COP with the internal form change.
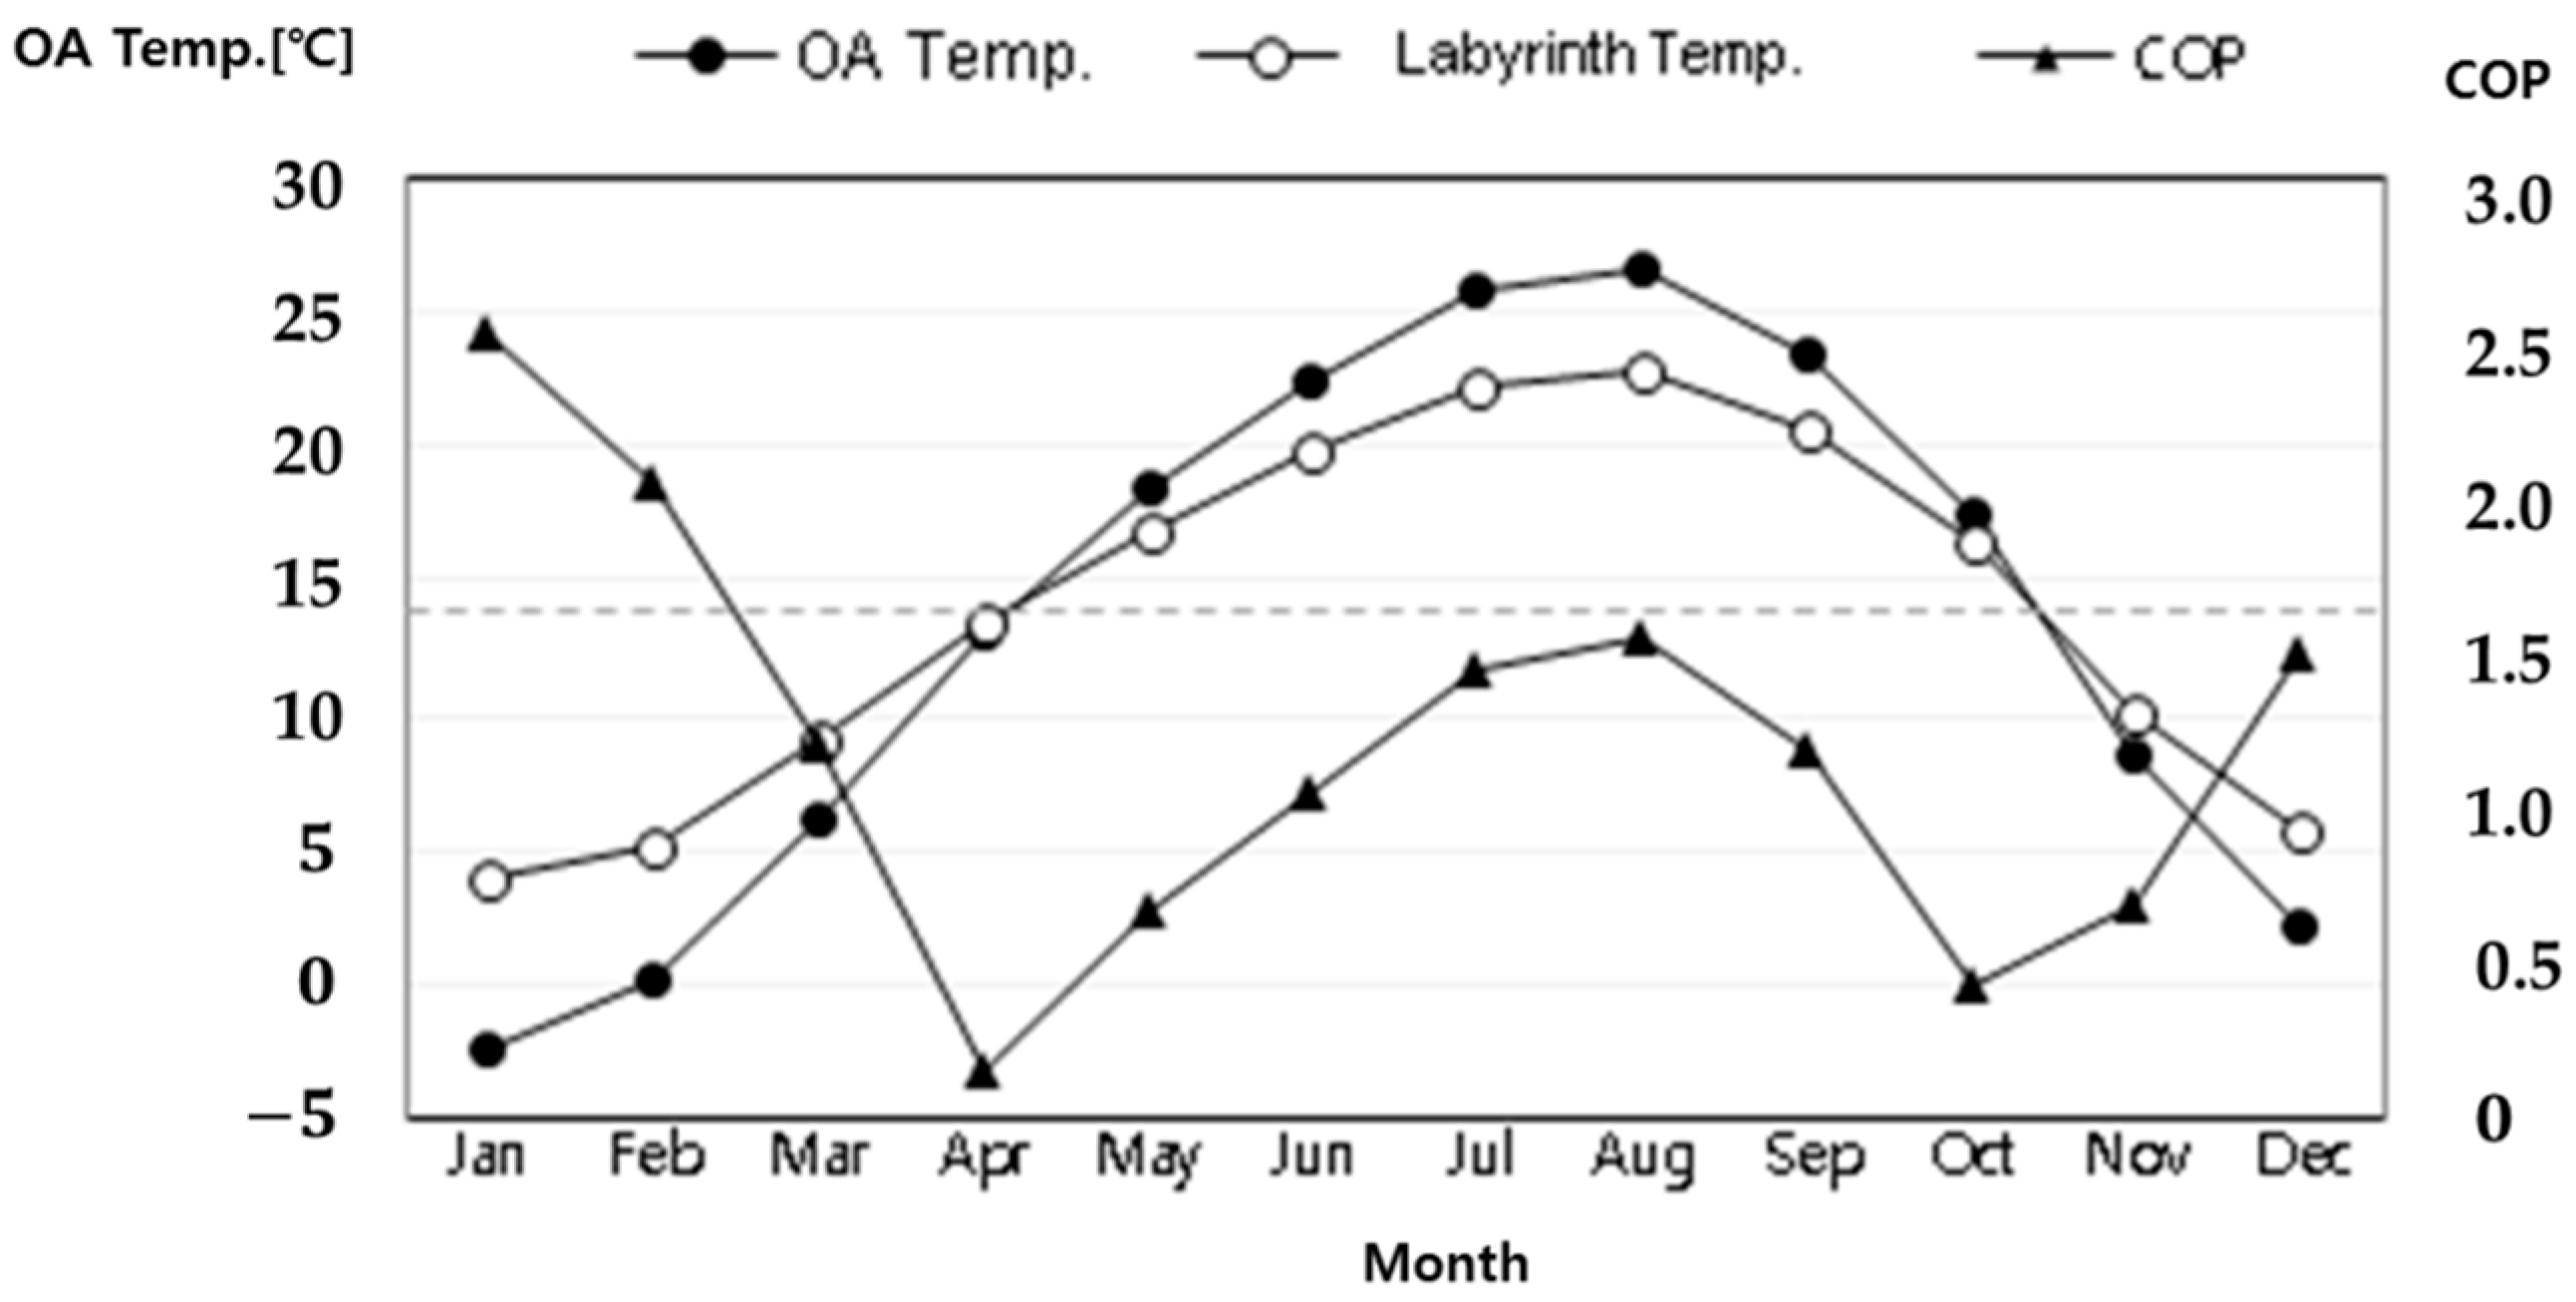
Figure 10.
Monthly average outdoor air (OA) temperature, optimized thermal labyrinth temperature, and COP.
Figure 10.
Monthly average outdoor air (OA) temperature, optimized thermal labyrinth temperature, and COP.
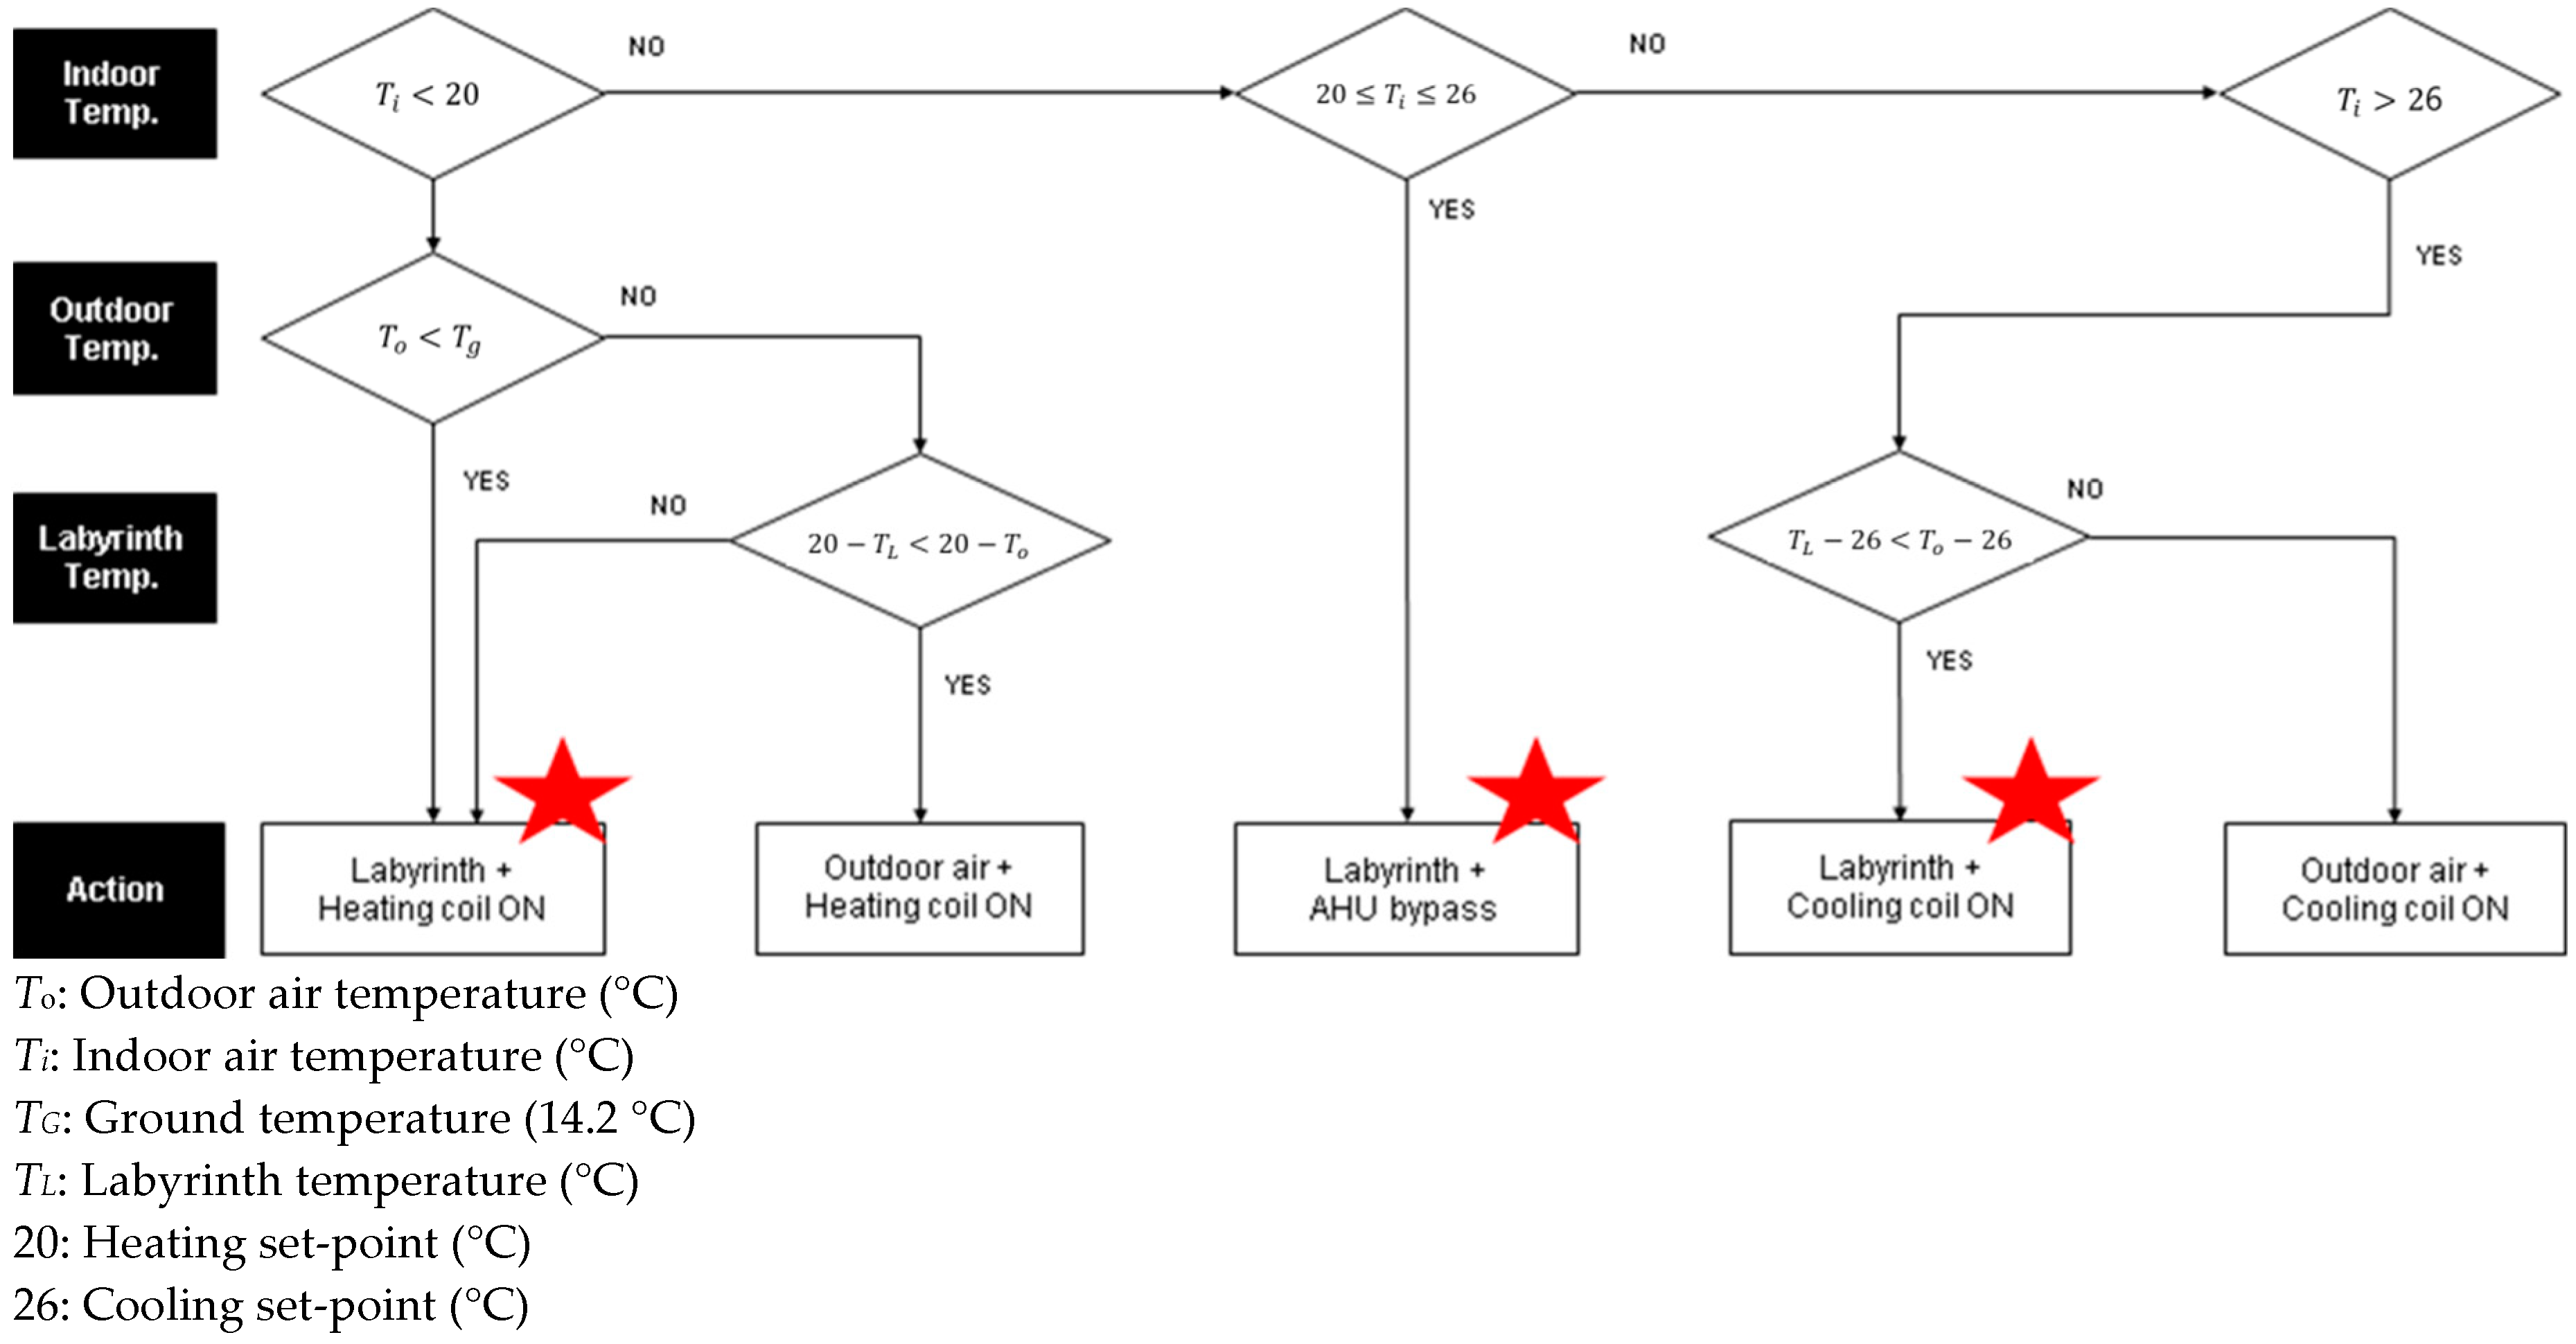
Figure 11.
Thermal labyrinth system operational algorithm.
Figure 11.
Thermal labyrinth system operational algorithm.
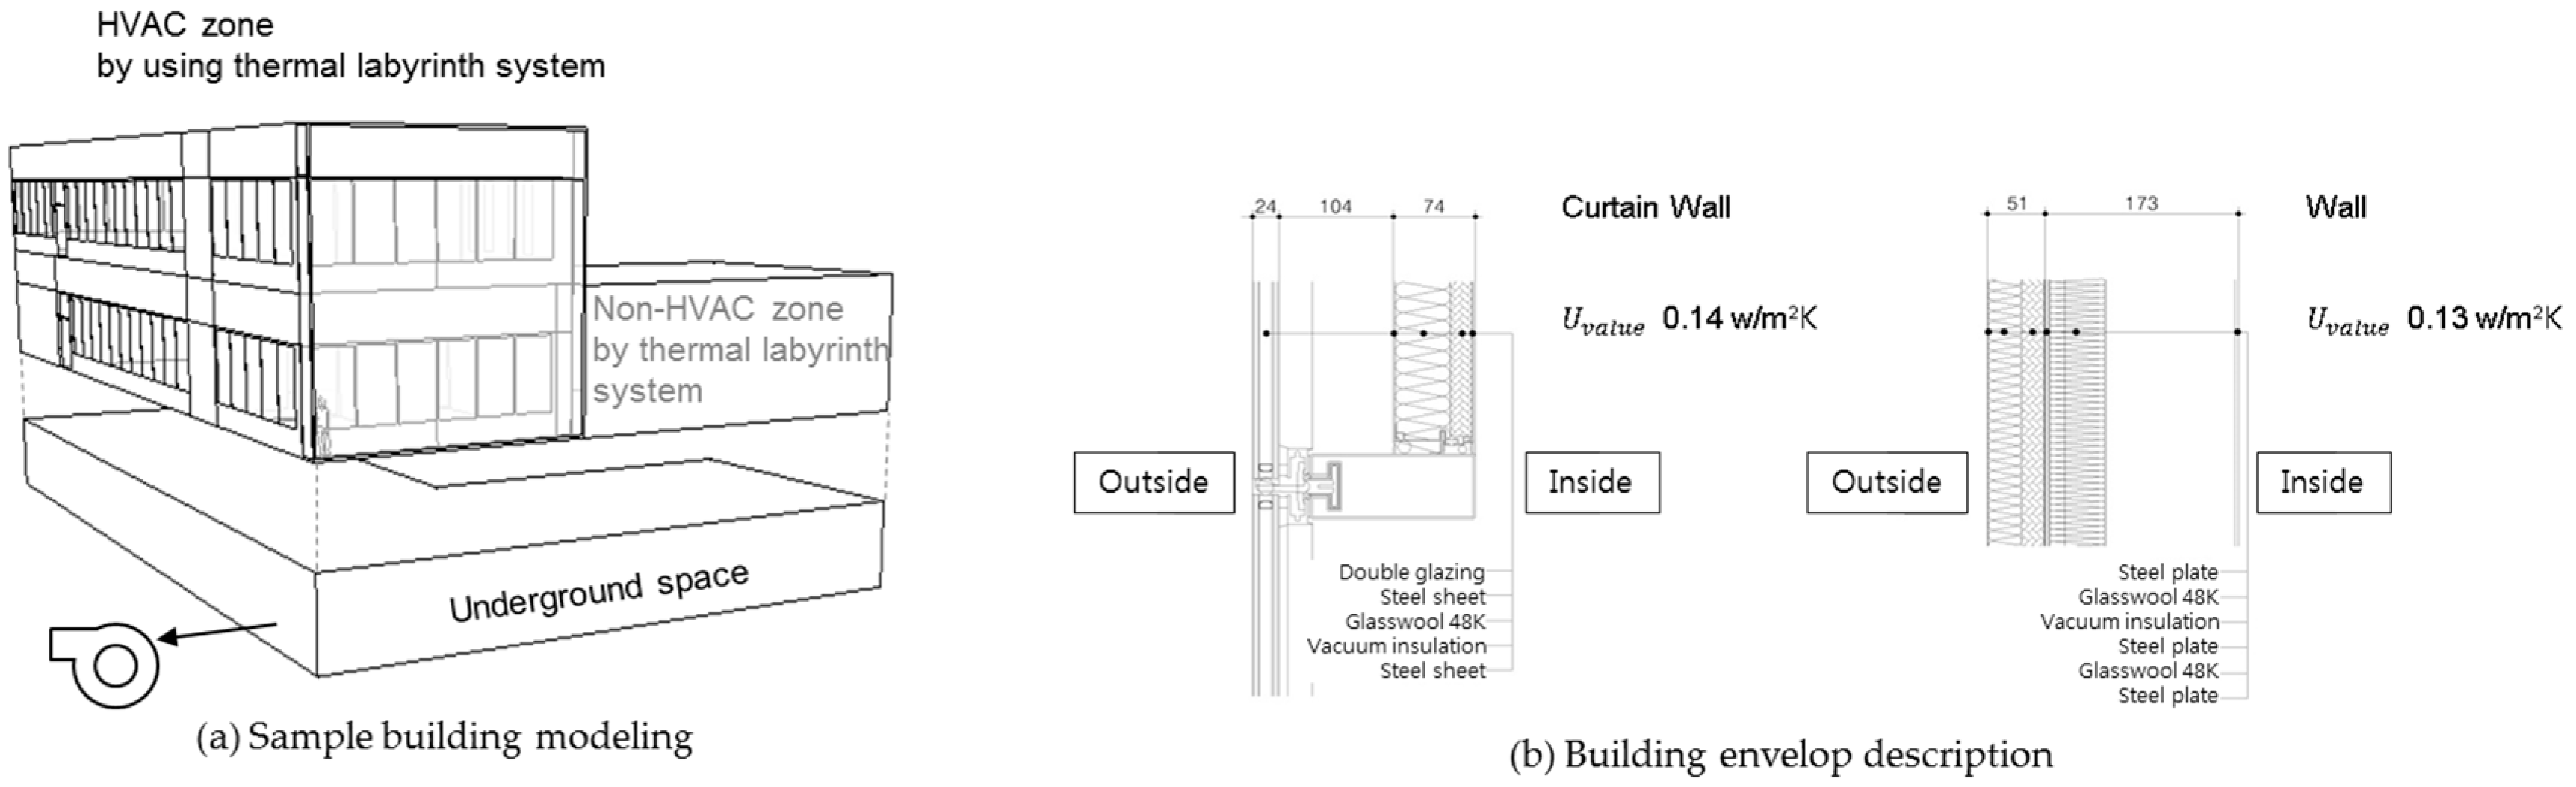
Figure 12.
Sample building modeling and building envelop description.
Figure 12.
Sample building modeling and building envelop description.
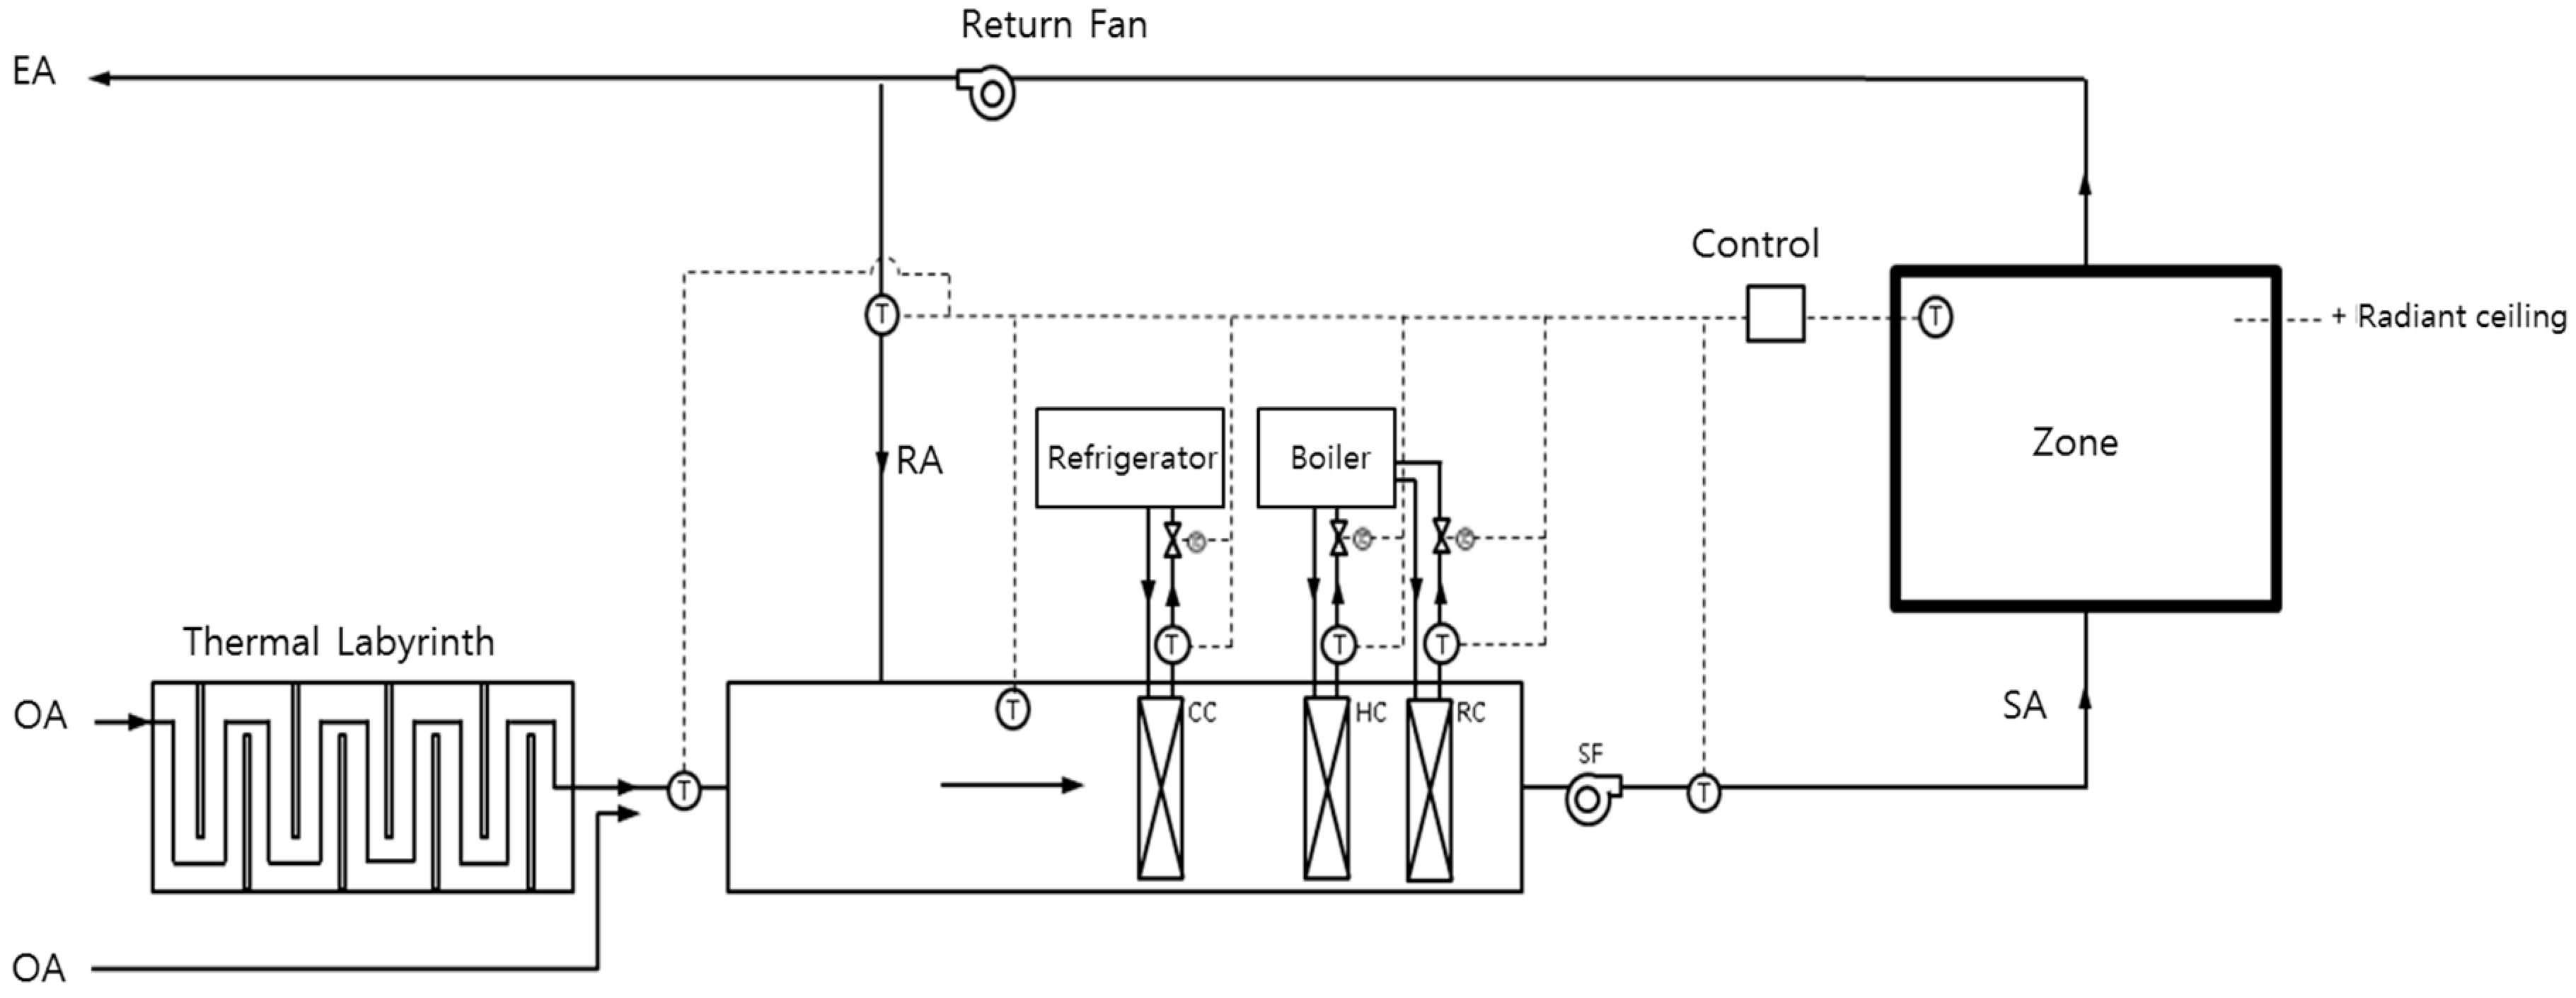
Figure 13.
System construction in the studied building.
Figure 13.
System construction in the studied building.
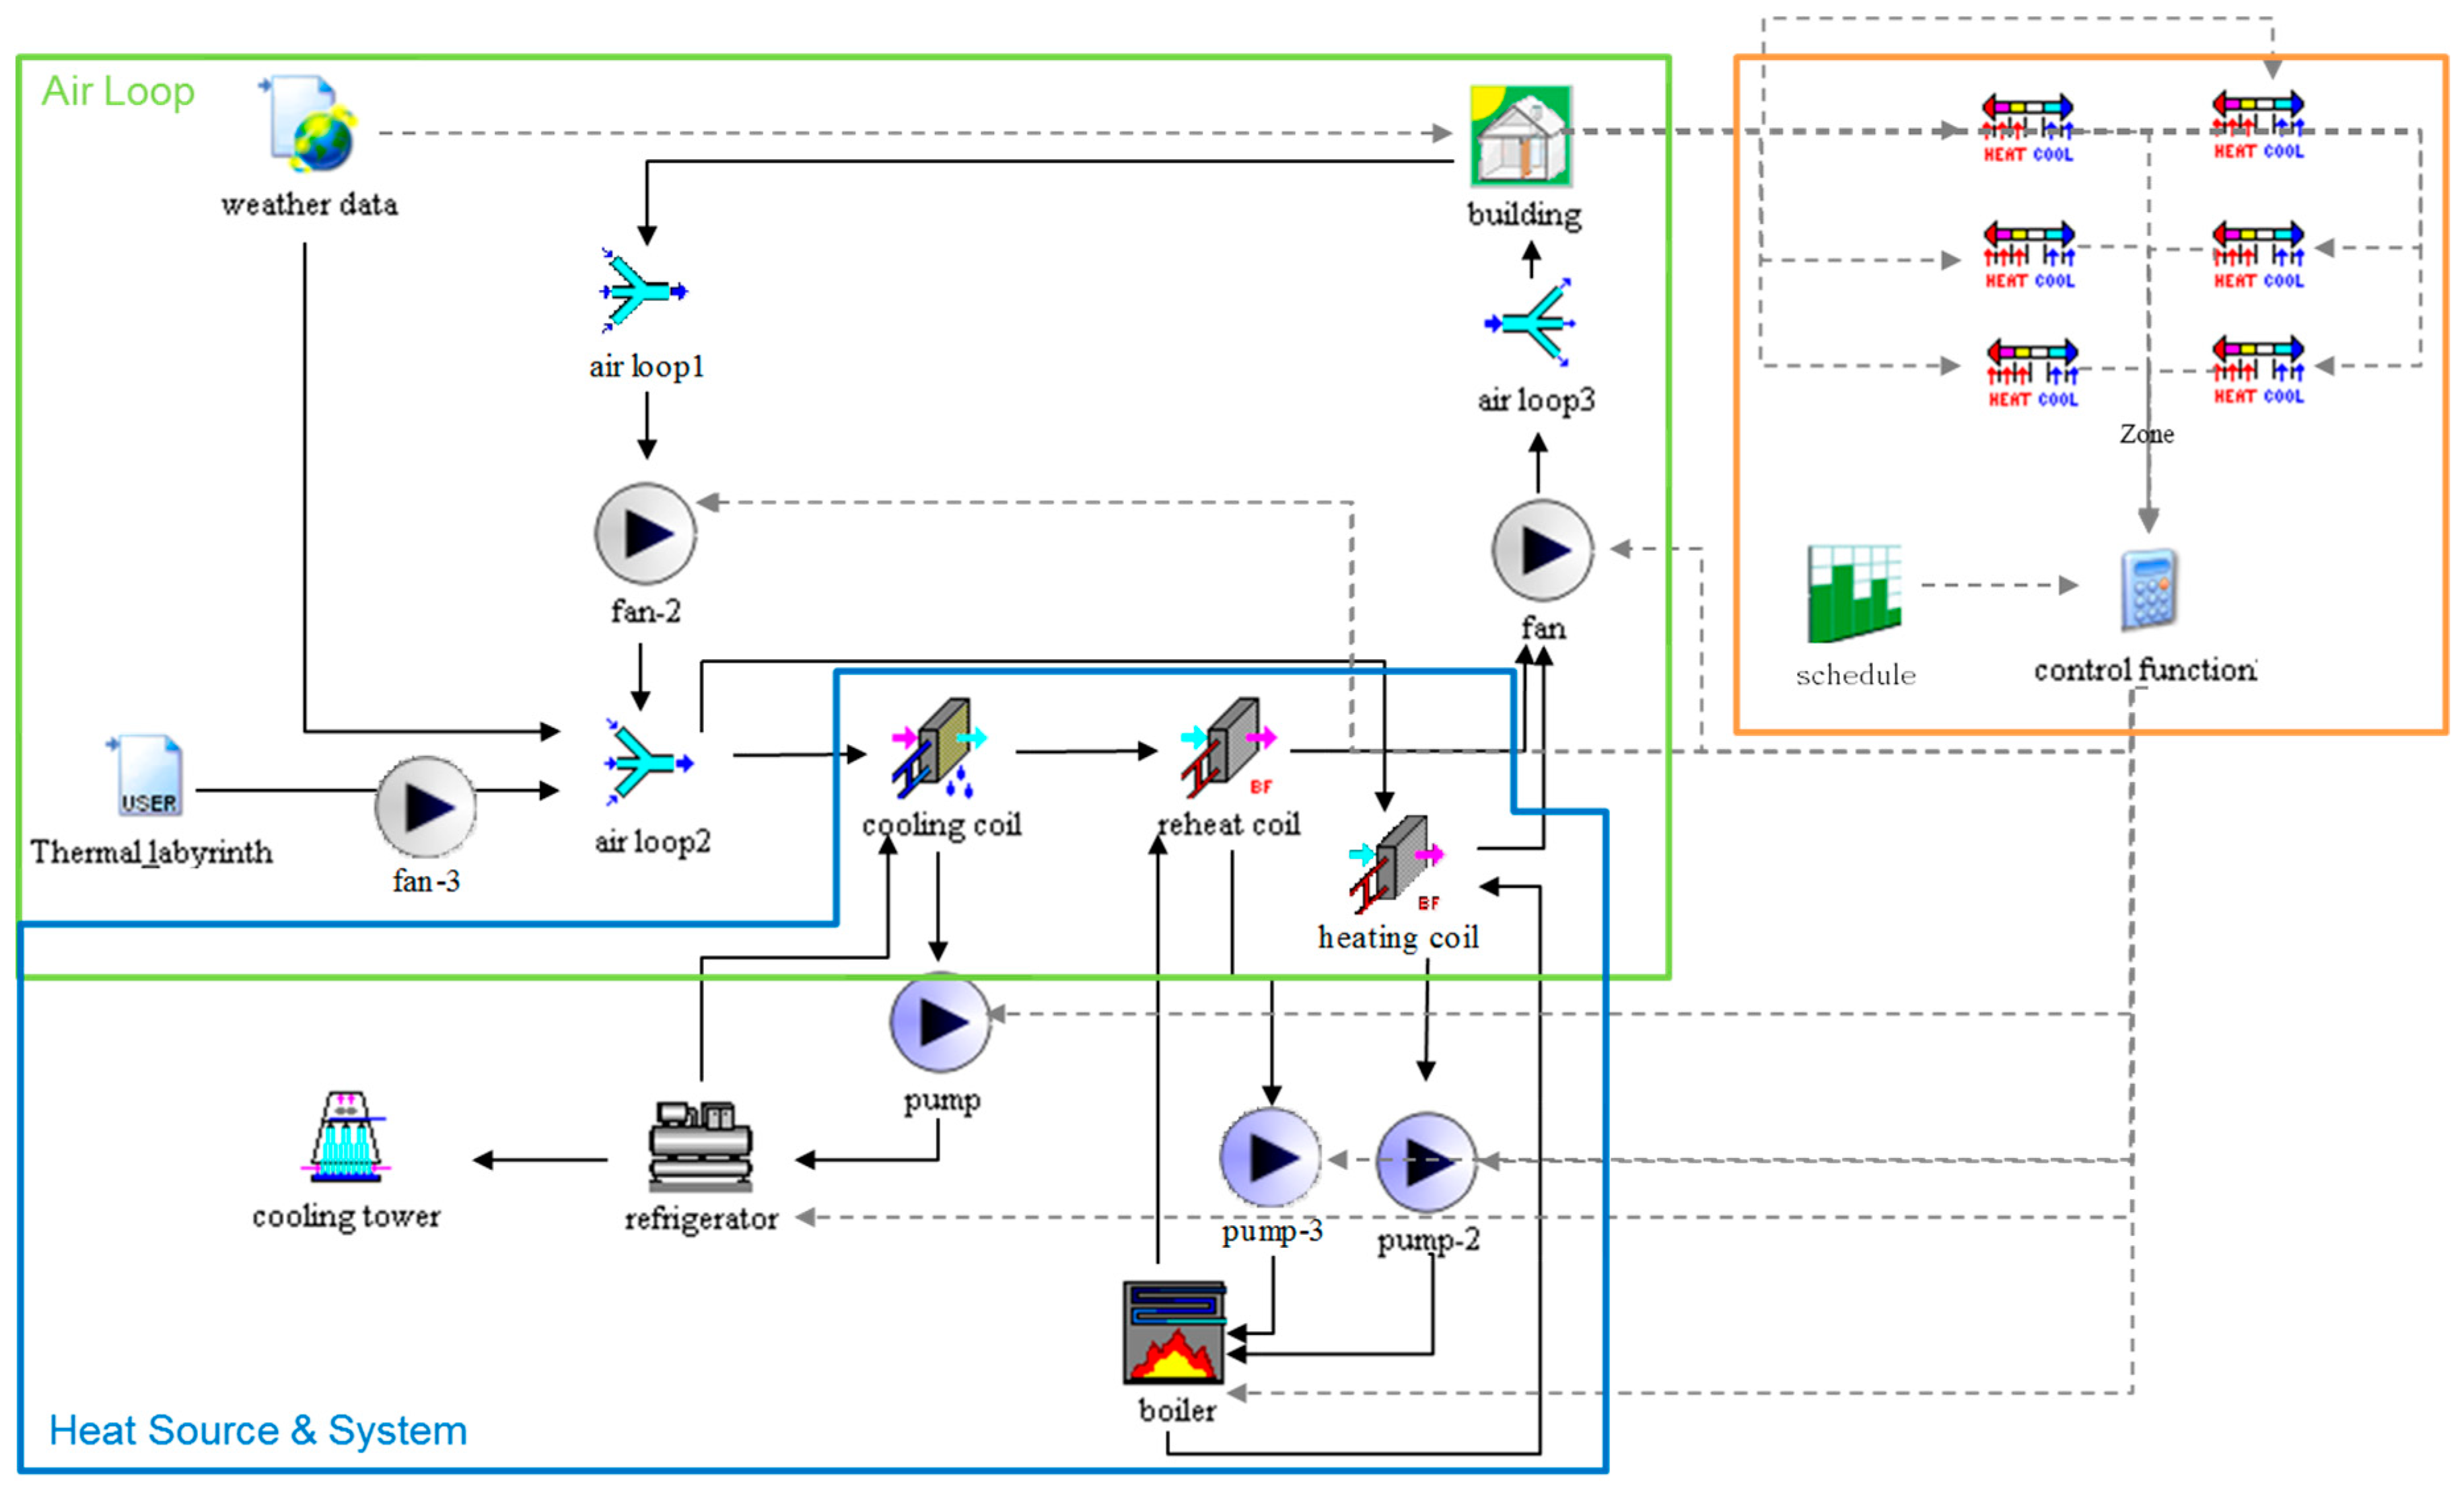
Figure 14.
TRNSYS modeling of the system with the building.
Figure 14.
TRNSYS modeling of the system with the building.
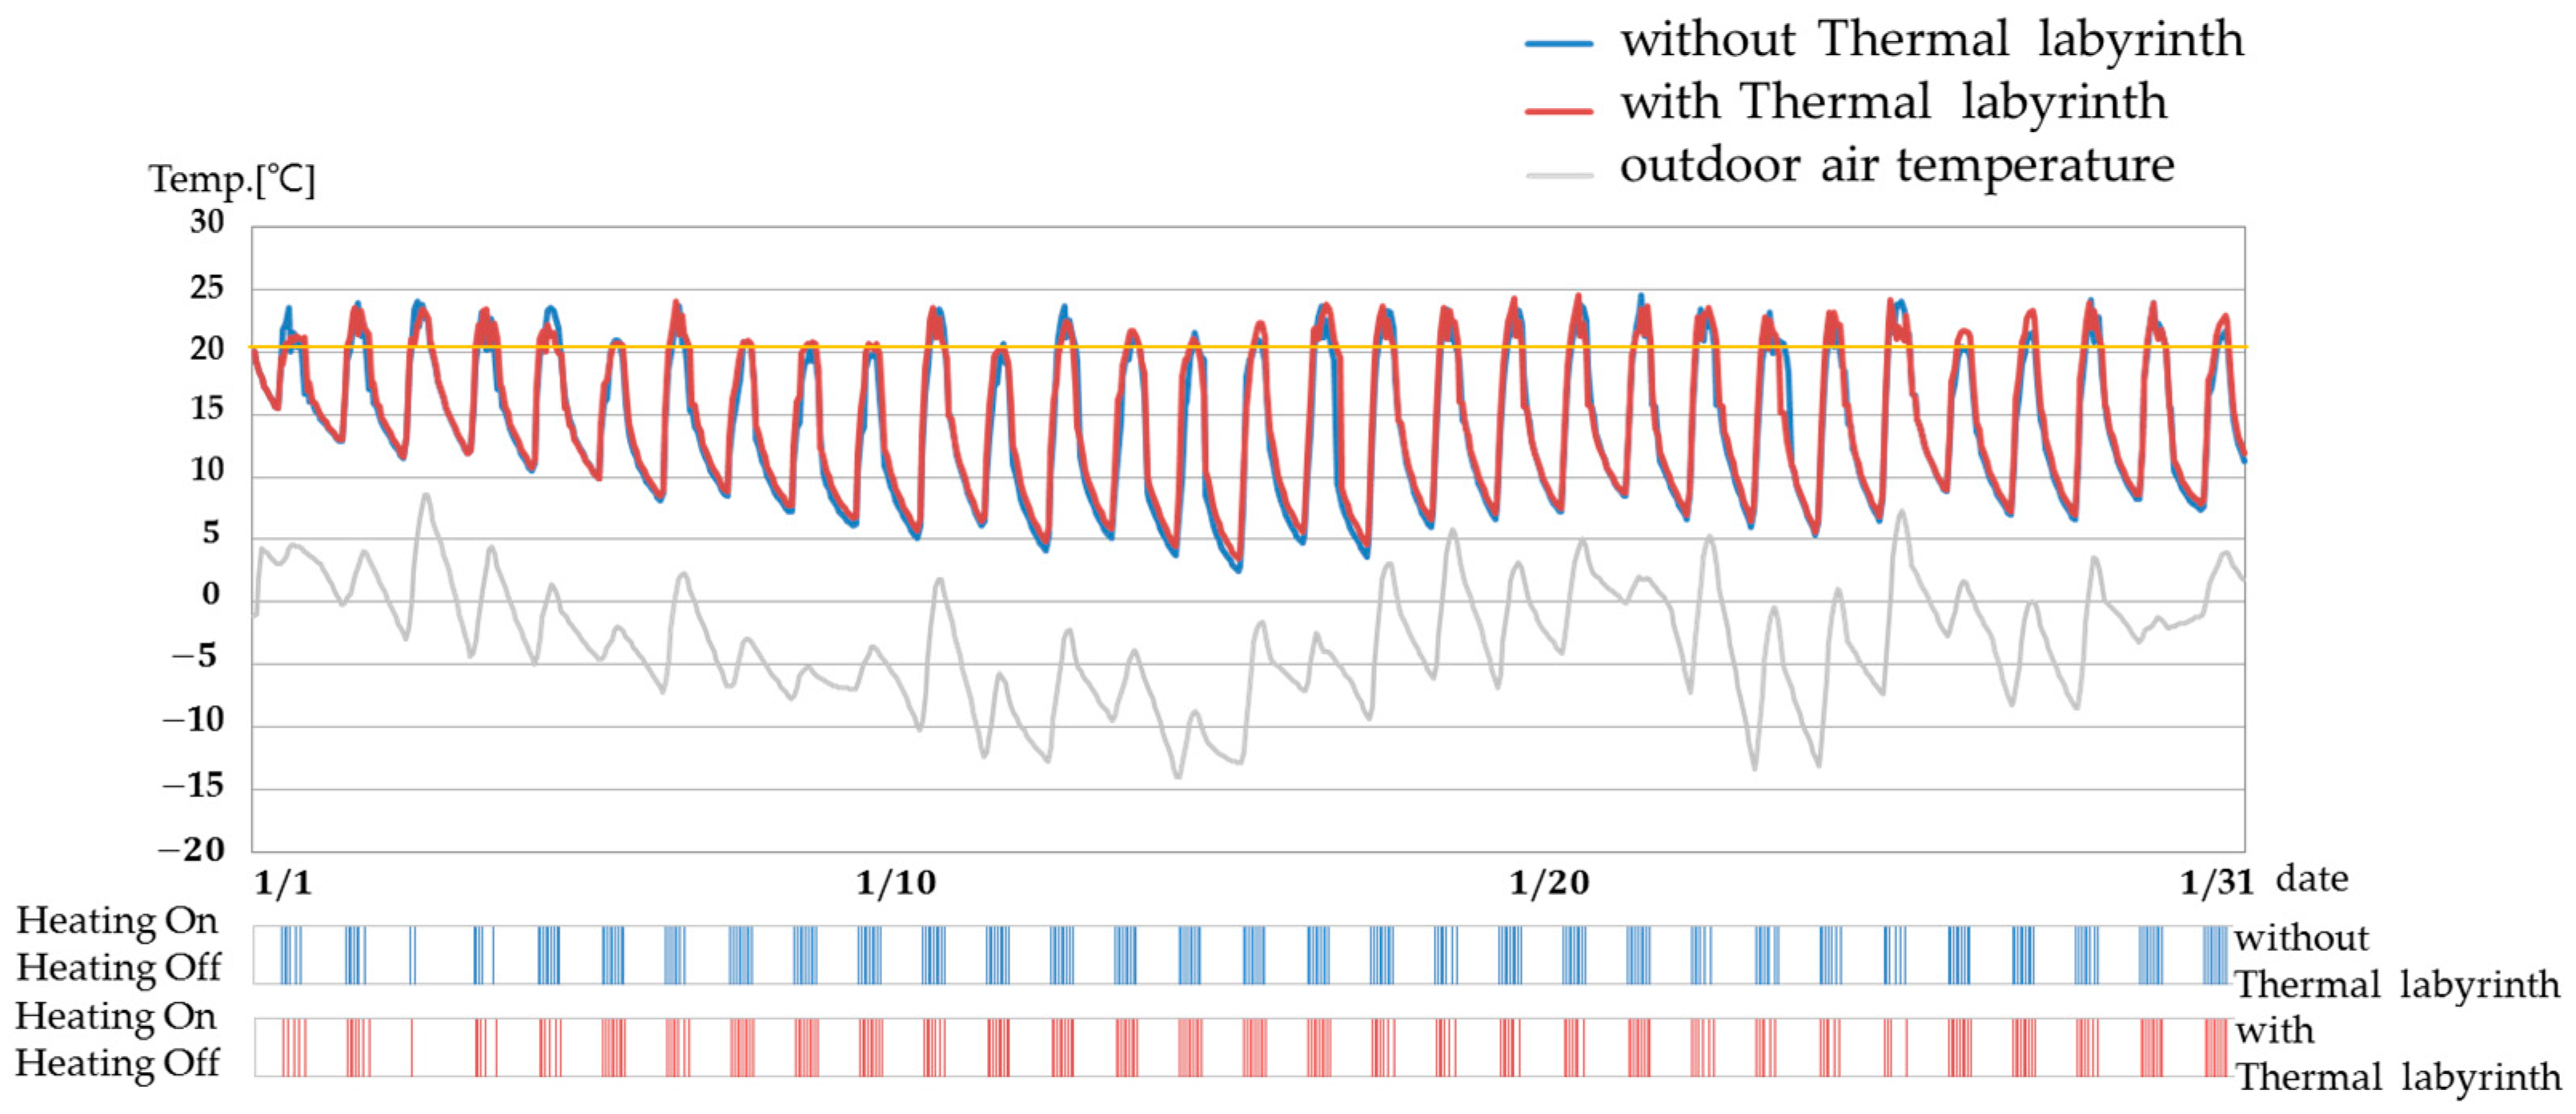
Figure 15.
Outdoor and indoor air temperature distributions during heating.
Figure 15.
Outdoor and indoor air temperature distributions during heating.
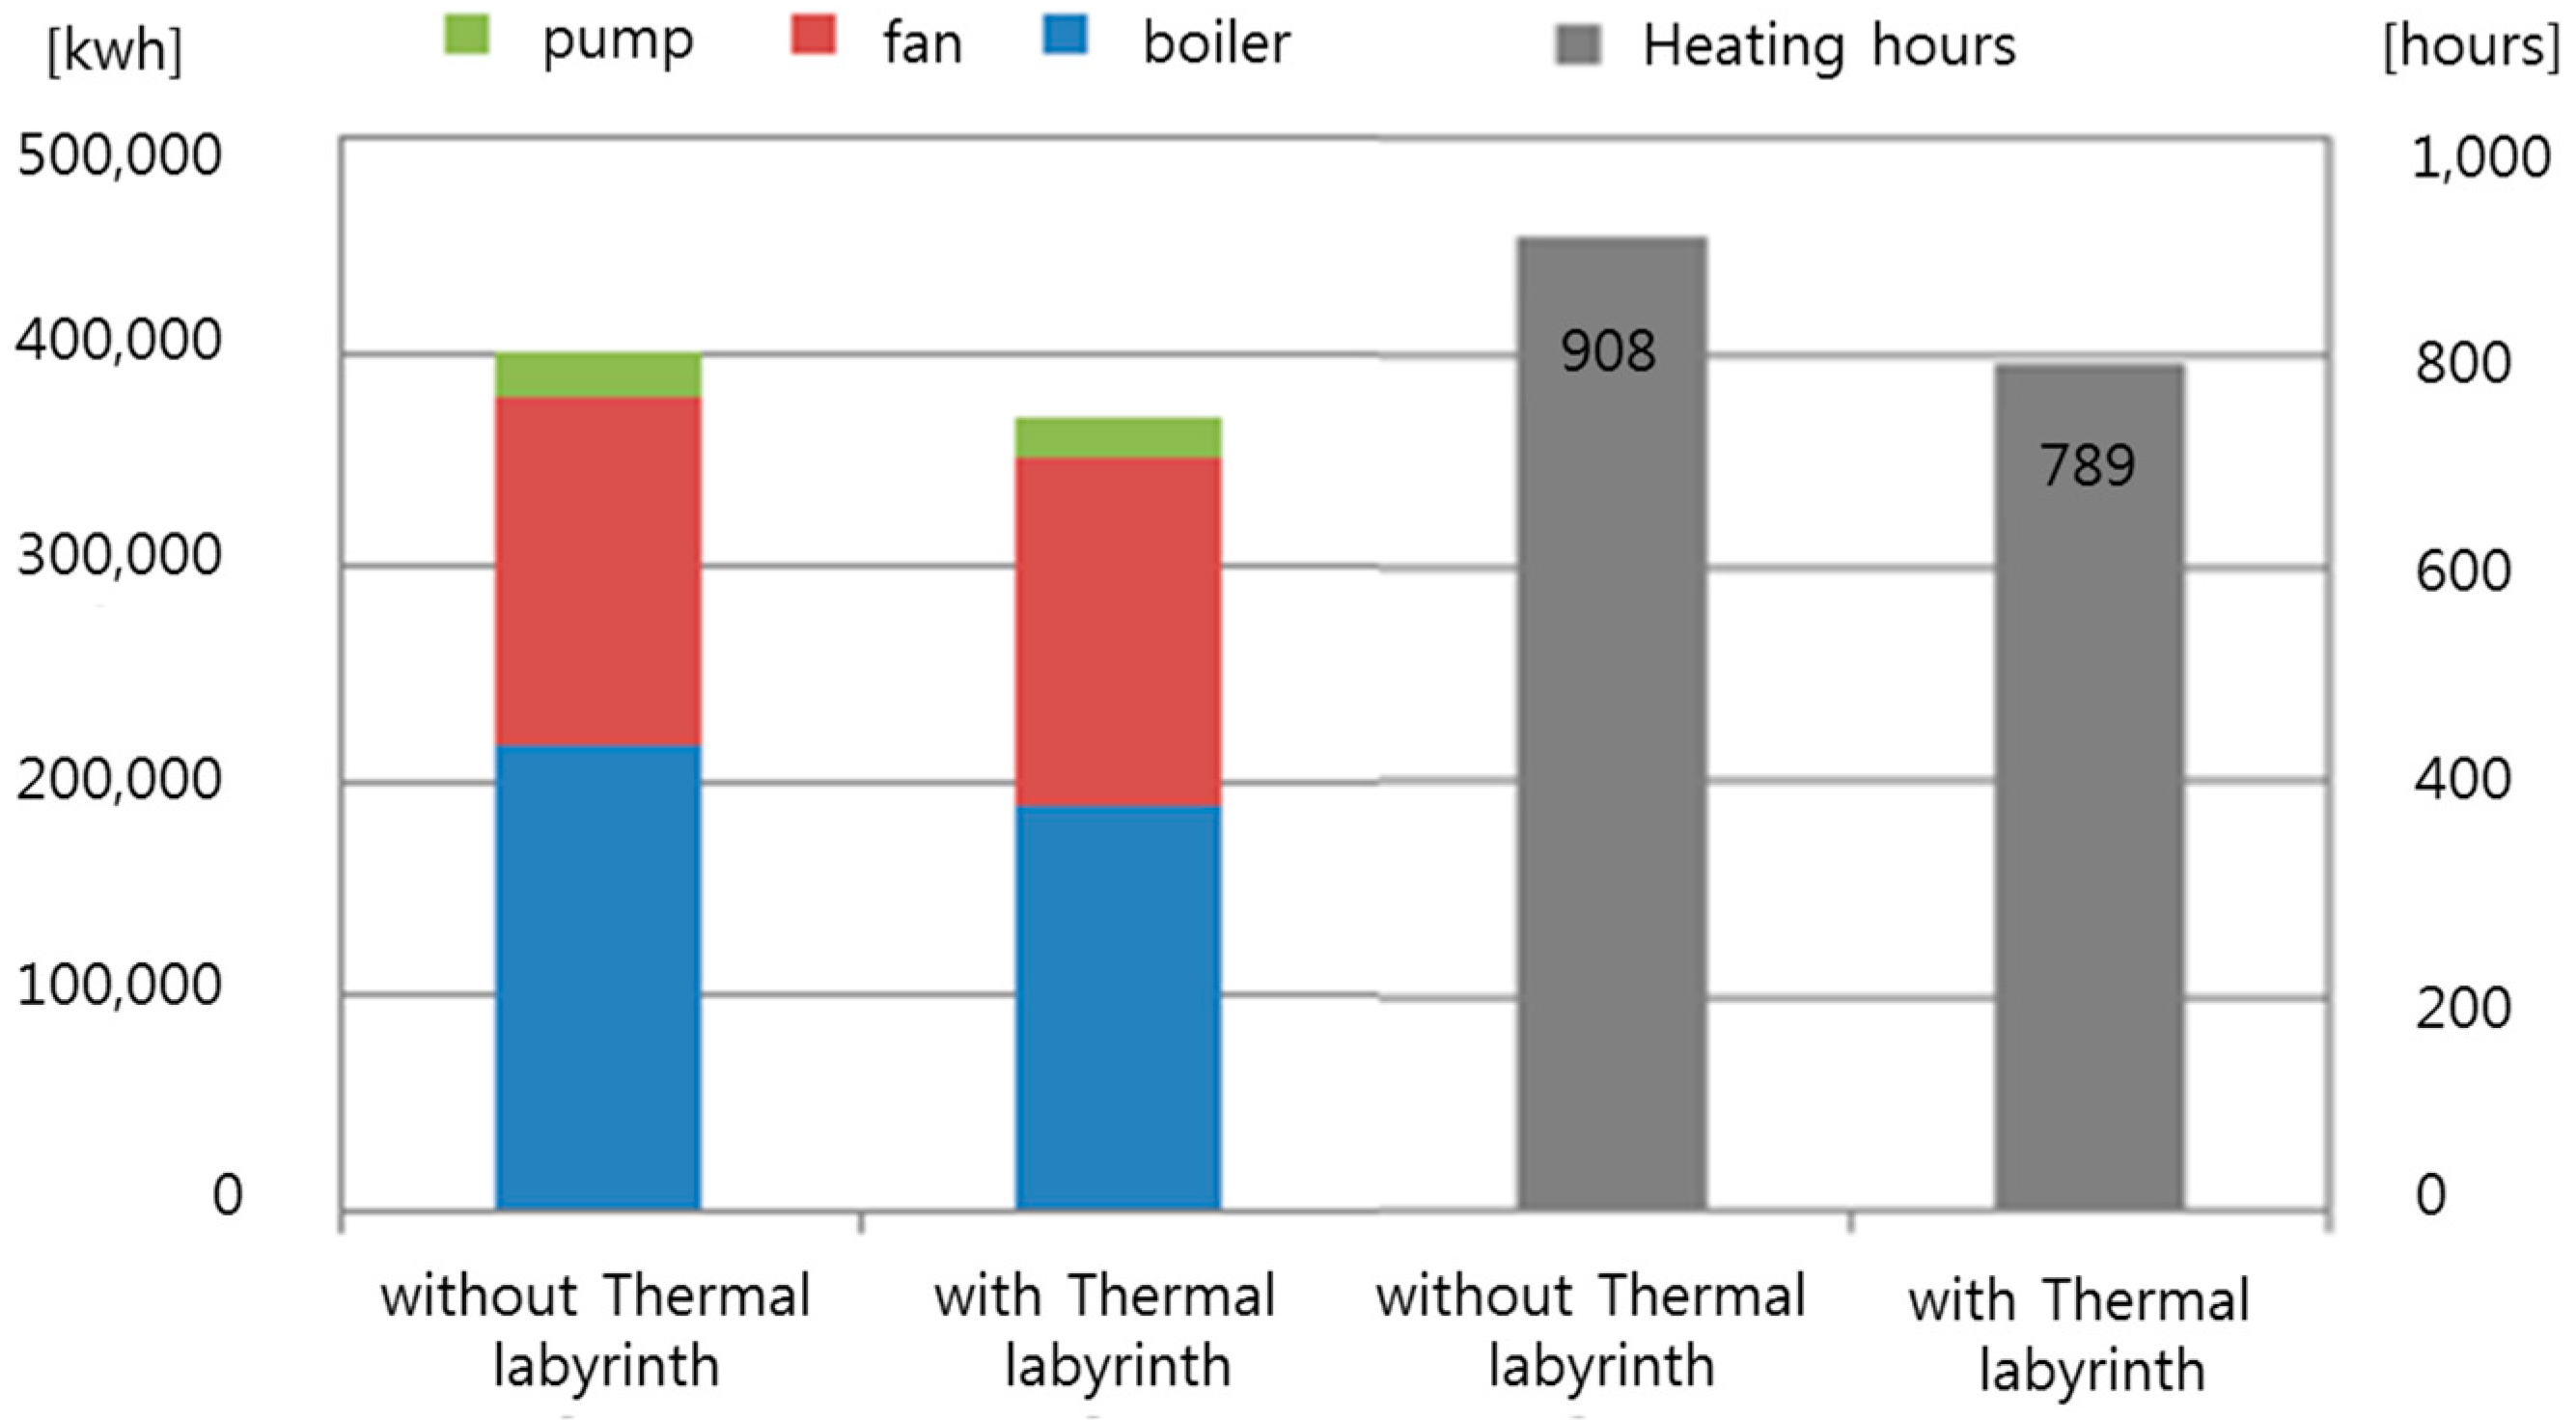
Figure 16.
Heating energy consumption and heating hours.
Figure 16.
Heating energy consumption and heating hours.
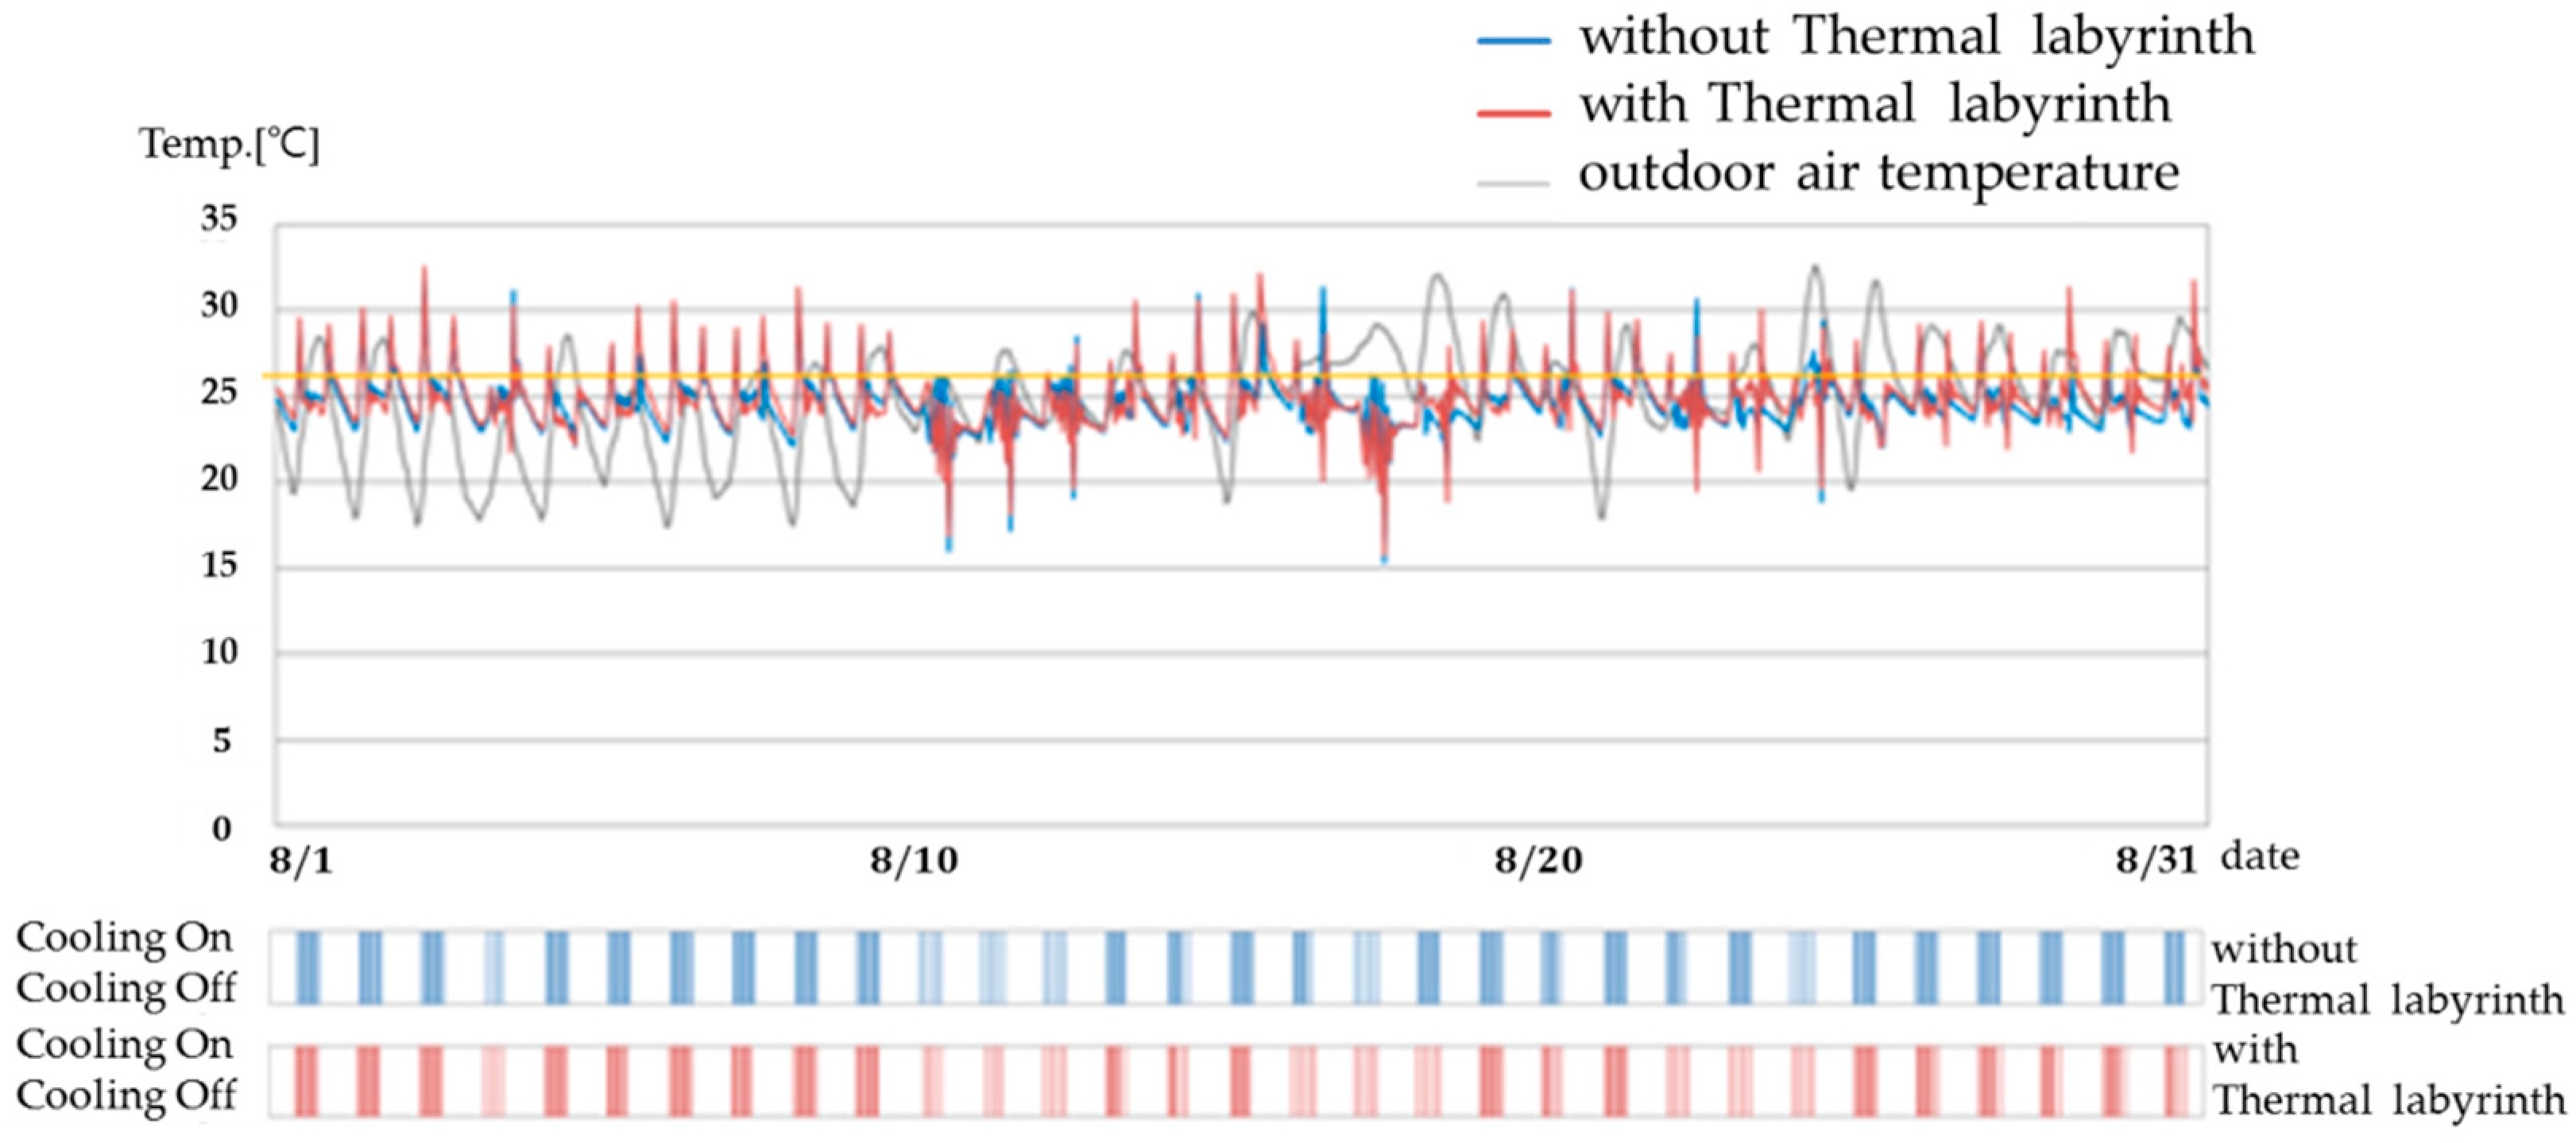
Figure 17.
Outdoor and indoor air temperature distributions during cooling.
Figure 17.
Outdoor and indoor air temperature distributions during cooling.
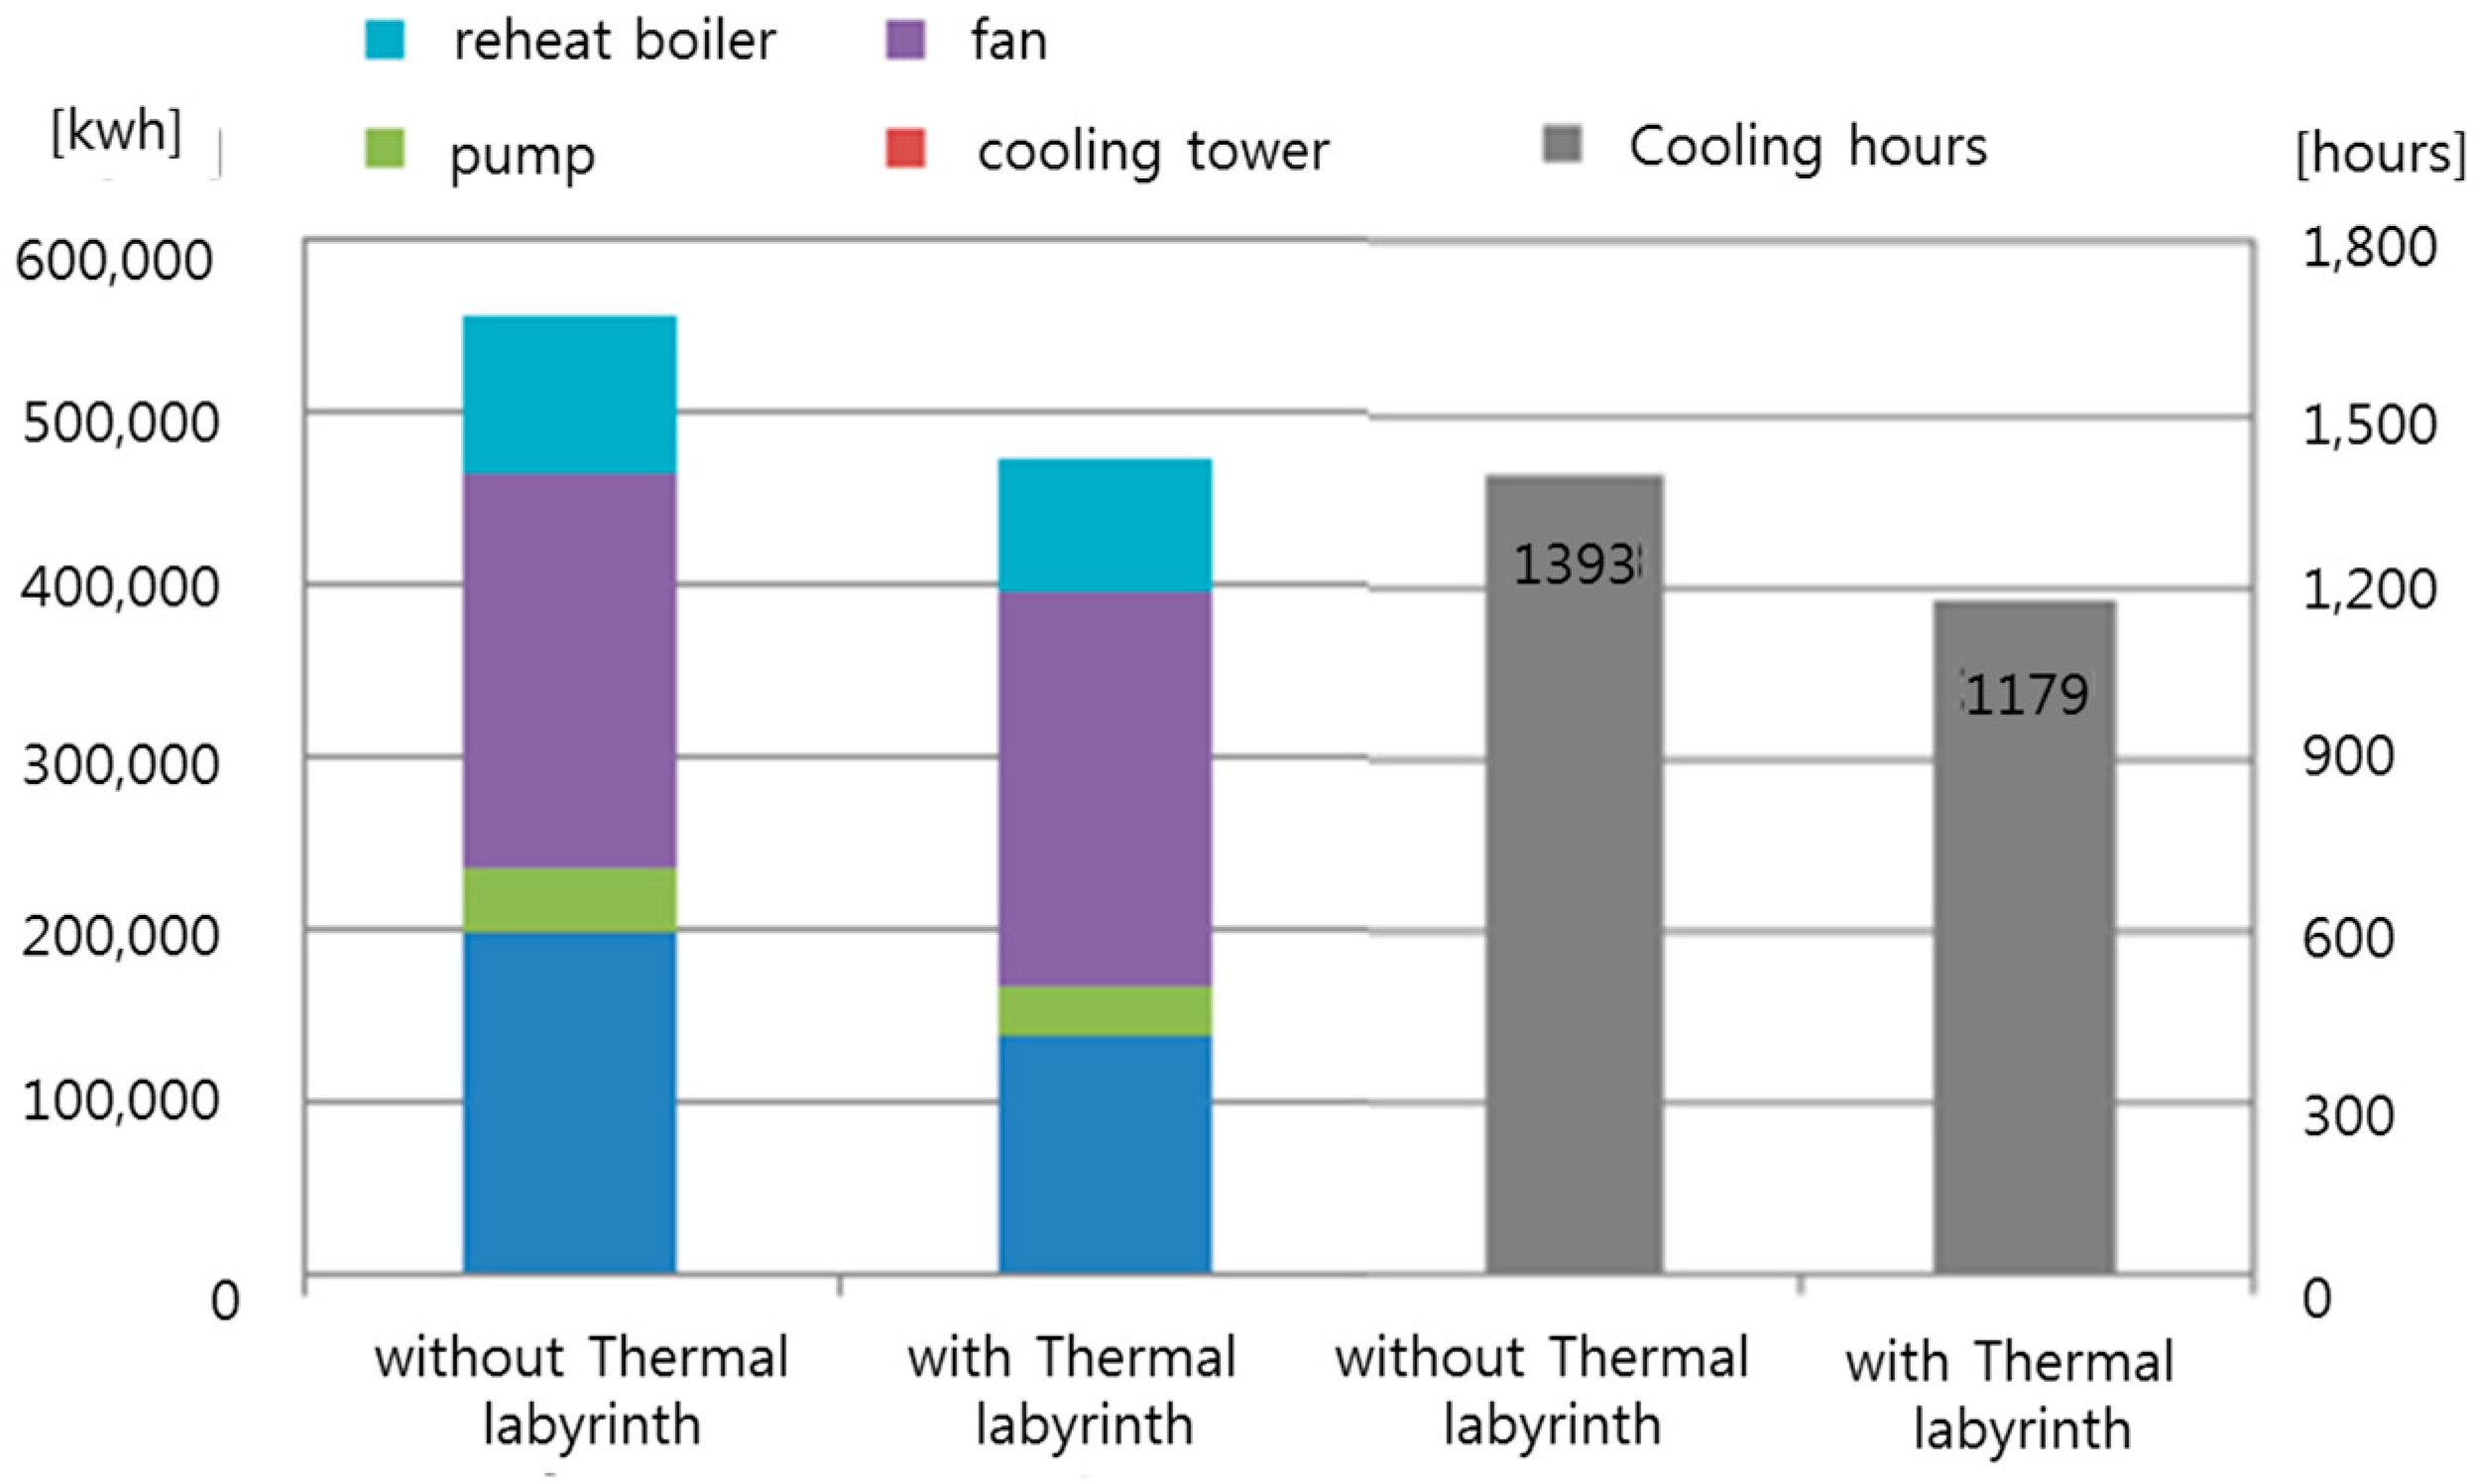
Figure 18.
Cooling energy consumption and cooling hours.
Figure 18.
Cooling energy consumption and cooling hours.
Table 1.
Conditions of the studied building and thermal labyrinth system.
Table 1.
Conditions of the studied building and thermal labyrinth system.
| General Information | Site | Incheon, South Korea |
|---|
| HVAC ** zone Information | Building type | Office |
| System | AHU * with thermal labyrinth, radiant ceiling |
| Area | 605.55 m2 |
| Ventilation requirement | 7400 m3/h |
| Minimum outdoor air requirement | 2200 m3/h |
| Thermal labyrinth space conditions | Depth | 3 m |
| Area | 412.68 m2 |
| Material | Concrete |
| Fan information used with thermal labyrinth | Fan type | Air foil |
| Air flow rate | 2200 m3/h |
| Efficiency | 63% |
| Fan static pressure | 246.97 mmAq |
| COP *** calculation | Quantity of heat/ shaft power |
Table 2.
Cases set considered for the simulation.
Table 2.
Cases set considered for the simulation.
| Variable | Case | Condition |
|---|
| 1. Length variation | 1-1 | Short (126 m) |
| 1-2 | Medium (162 m) |
| 1-3 | Long (257 m) |
| 2. Surface shape variation | 2-1 | No fin |
| 2-2 | Fin on the wall |
| 2-3 | Fin on the wall and floor (3000 mm gap) |
| 2-4 | Fin on the wall and floor (1500 mm gap) |
Table 3.
Coefficients used in the calculation of the ground temperature distribution.
Table 3.
Coefficients used in the calculation of the ground temperature distribution.
| Tm | As | z | t0 | α |
|---|
| 14.2 (°C) | 14.65 (°C) | 0–20 (m) | 30 | 0.076 (m2/day) |
Table 4.
Properties of the material applied to the simulation.
Table 4.
Properties of the material applied to the simulation.
| Material | Thermal Conductivity | Specific Heat | Density |
|---|
| Soil | 1.3 W/m·k | 800 J/kg·K | 1599 kg/m3 |
| Concrete | 0.93 W/m·k | 653 J/kg·K | 2300 kg/m3 |
Table 5.
Simulation constants.
Table 5.
Simulation constants.
| D | 1.0 | E | 0.00375 |
| Cμ | 0.09 | C€1 | 1.44 |
| C€2 | 1.92 | σk | 1.0 |
| σ€ | 1.3 | F1 | 1.0 |
| F2 | |
Table 6.
Simulation input conditions.
Table 6.
Simulation input conditions.
| Item | Condition |
|---|
| Mesh conditions | Mesh model | Polyhedral |
| Base size | 0.5 |
| Surface growth | 1.3 (slow) |
| Physical conditions | Turbulence model | Standard k-ε low Reynolds number model |
| Wall treatment | low-y+ (y ≤ 1) |
| Convection scheme | Second S-order upwind scheme |
| Inlet temperature | −2.4 °C |
| Outlet velocity | 0.34 m/s |
| Soil temperature | 14.2 °C |
| Air flow rate | 2200 m3/h |
Table 7.
The studied cases for analyzing the impact of the change in the length on the heat transfer efficiency.
Table 8.
The studied cases for analyzing the impact of the internal form change on the heat transfer efficiency.
Table 9.
The optimized conditions of the thermal labyrinth design.
Table 9.
The optimized conditions of the thermal labyrinth design.
| Velocity (m/s) | Length (m) | Surface Shape |
|---|
| 0.34 | 126 | Fin on the wall and floor (500 mm gap) |
Table 10.
Input conditions of TRNSYS simulation.
Table 10.
Input conditions of TRNSYS simulation.
| System | Single Duct CAV System |
|---|
| Set point | Heating: 20 °C | Cooling: 26 °C |
| Schedule | 09:00~18:00 |
| Ventilation | 7400 m3/h |
| Outdoor air | 2200 m3/h |
| Internal heat | Person: 0.2 W/m2, Computer: 20 W/m2 Light: 10 W/m2 |
Table 11.
Energy saving ratio for air conditioning.
Table 11.
Energy saving ratio for air conditioning.
| Item | Without Thermal Labyrinth | With Thermal Labyrinth | Reduction Rate |
|---|
| Heating energy consumption [kwh] | 400,754 | 369,413 | 8% |
| Cooling energy consumption [kwh] | 557,966 | 474,700 | 15% |
| Annual total energy consumption [kwh] | 958,721 | 844,114 | 12% |
Table 12.
Reduction in the annual energy costs.
Table 12.
Reduction in the annual energy costs.
| Item | Without Thermal Labyrinth [A] | With Thermal Labyrinth [B] | [A] − [B] |
|---|
| Heating | Cooling | Heating | Cooling | Heating | Cooling |
|---|
| Electricity use [kwh] | 400,754 | 557,966 | 369,413 | 474,700 | 31,341 | 83,266 |
| Electricity cost [Korean won] | 33,807,607 | 47,070,012 | 31,163,681 | 40,045,692 | 2,643,926 | 7,024,320 |
| Total cost [Korean won] | 80,877,619 | 71,209,373 | 9,668,247 |


