Policy Implications of Power Exchanges on Operational Scheduling: Evaluating EUPHEMIA’s Market Products in Case of Greece

Energy and Environmental Policy Laboratory, Department of International and European Studies, School of Economics, Business and International Studies, University of Piraeus, 18532 Piraeus, Greece
*
Author to whom correspondence should be addressed.
Energies 2018, 11(10), 2715; https://doi.org/10.3390/en11102715
Submission received: 14 August 2018
/
Revised: 26 September 2018
/
Accepted: 9 October 2018
/
Published: 11 October 2018
(This article belongs to the Special Issue Model Coupling and Energy Systems)
Abstract
:A vital component for the development of a functioning internal electricity market is the adoption by each European member state of the Pan-European Hybrid Electricity Market Integration (EUPHEMIA) for the day-ahead market solution. The consideration of the national power market’s characteristics enables more realistic market design towards the implementation of the so-called “Target Model”. This work considers a series of factors, including the EUPHEMIA order types, their use by market participants, the relative competitiveness of power generators, the impact of interconnected markets, the existence of market players with dominant positions, and the existence of specific regulations such as the minimum average variable cost restriction on offers by producers, as well as the strategy adopted by market participants. The main goal of this paper is to provide a comprehensive analysis on the adoption of EUPHEMIA’s algorithm in case of the Greek wholesale market, based on a relevant research project funded by the Joint Research Centre of the European Commission to support the Hellenic Regulatory Authority of Energy on its decision-making. The paper contributes to the relevant literature on the quantification of the impacts of the EUPHEMIA algorithm in the case of the Greek wholesale market, providing insights on the crucial aspects affecting realistic, market-based decision-making.
1. Introduction
The development of a functioning internal energy market stands as one of the priorities of the European Commission. The adoption of the so-called “Target Model”, namely an “informal” reference model through framework guidelines, comitology guidelines, network codes, and other instruments, is a common point in the energy policy of each EU member state. The European Commission Regulation (EU) 2015/1222 of 24 July 2015 has established a Guideline on Capacity Allocation and Congestion Management (CACM), which obliges National Regulatory Authorities (NRAs) to decide unanimously on the adoption of identical legal acts in all national legal systems. Following CACM, the Association of Energy Regulators (ACER) has adopted several decisions, the most recent concerning the algorithm is ACER Decision No 08/2018 26 July 2018 on the Nominated Electricity Market Operators’ proposal for the price coupling algorithm and the continuous trading matching algorithm, where details on the requirements of the common algorithm is provided in the Annexes to this ACER Decision. A vital component of this process is the adoption of the same algorithm for the solution of the day-ahead market. The Price Coupling of Regions (PCR) project of the European Power Exchanges has developed an algorithm called EUPHEMIA (acronym of Pan-European Hybrid Electricity Market Integration Algorithm), which allocates cross-border transmission capacity and calculates day-ahead electricity prices across Europe. This algorithm has been adopted by the majority of the power exchanges and market operators in the EU, as the algorithm’s developer [1] and the European Network Association of Transmission System Operators in Electricity (ENTSOE) report [2] that it has already been implemented in more than 20 European countries.
An important characteristic of this algorithm is the fact that it is a simple economic algorithm, compared to more techno-economic methodologies, such as the unit commitment problem. A considerable advantage of those approaches, is the provision of more robust scheduling, enhancing power system reliability and stability. The unit commitment problem is important, not only for short-term dispatching of power units, but also for the medium-term [3,4] and long-term [5] planning of power systems, as well as for risk management for market participants [6,7].
However, the vision of the development of a harmonized and integrated electricity market in the EU, has identified that transparency, common rules, and liquidity are very important. This has led to the adoption of an energy-only algorithm for the day-ahead market coupling, which is expected to enhance the efficient allocation of capacity and to maximize social welfare. Ringler et al. [8] examined the benefits of a common European electricity market design, simulating the Central Western European (CWE) market coupling with an agent-based model. The paper recommends that European energy policy forms a stable and transparent regulatory framework, in order to alleviate opposition from member states, as there exist conflicts between national and regional energy policy. Newbery et al. [9] examined the benefits of integrating European electricity markets, providing evidence that the total benefits could be €3.4 bn/year, for all day-ahead, intraday and balancing markets. Boffa and Sapio [10] identified the importance of geography in shaping the regulatory approaches, pointing out that fostering regional integration is based on the assumption that increased cross-border trade enhances social welfare. Newbery [11] conclude that energy-only markets, adopting the electricity “Target Model”, can work if they avoid missing money and missing market problems. Gomez [12], when examining the North Western Europe (NEW) and SWE regions, identified the following direct consequences of market coupling: more efficient allocation of cross-border capacity, price convergence between different areas, and more reliable price signals.
The integration of the European electricity markets is a major challenge, which is attracting interest from many researchers to quantify its consequences. Glachant and Ruester [13] point out that the long-term process of the development of the internal market is subject to several adverse dynamics. Oggioni and Smeers [14] examined the market failures of market coupling in Europe, concluding that it is less efficient than the nodal pricing system. Moreover, Grimm et al. [15] examined the long run effects of market splitting, identifying the reasons for the decreased welfare of introducing prices zones. In addition, Santos et al. [16] presented a multi-agent simulation of competitive electricity markets, demonstrating the advantages of the integration of various market models for the study of the electricity markets’ evolution. In the same context, Lam et al. [17] developed a Mix Integer Quadratic Constraint Problem (MIQCP) model, in order to examine the European day-ahead electricity market coupling. The model incorporates an iterative procedure, aiming to mitigate the nonconvexity of electricity prices, as a result of the different EUPHEMIA order types and conditions, such as the “fill or kill” condition of block orders, complex orders, and Prezzo Unico Nazionale (PUN) orders. Also, Chatzigiannis et al. [18] developed a European day-ahead electricity market clearing model, which explicitly incorporates all the different types of market orders, besides Merit and PUN orders, that are available in European power exchanges, as well as the transmission constraints, containing elements of both the Flow Based (FB) and Available Transfer Capacity (ATC) network representations. The model incorporates an iterative algorithm for the efficient handling of Paradoxically Accepted Orders (PAO) and complex Minimum Income Conditions (MIC). The model has been tested in a European day-ahead electricity market test-case. Finally, Sleisz and Raisz [19] present a model to examine load gradient conditions on the European power exchanges. The proposed methodology, implementing complex supply order types with ramping limitations, provides useful insights, such as the shadow prices, which represent hidden costs of ramping limits.
The EUPHEMIA algorithm was adopted as a simple economic approach, omitting techno-economic characteristics of the power systems. However, it is characterized by complexity concerning the understanding of market solutions, resulting from the different order types of the EUPHEMIA algorithm. This is further enhanced by the alternative order types that are proposed so as to capture more technical aspects of the power system’s operation, aiming at more robust simulations of the power system. Within that context, Sleisz and Raisz [20] present an integrated mathematical model for uniform purchase prices on European multizonal power exchanges, proposing a new formulation to avoid nonconvex formulation. Moreover, Meeus et. al. [21] examined the block order restrictions in combinatorial electric energy auctions for simulating nonconvex costs of power generators, in particular startup costs and minimum run levels. The paper concludes that the restrictions could be relaxed, both concerning the block size restrictions as well as on the number of blocks that a participant can submit per day. Madani and Vyve [22] present a market model to examine nonconvex uniform price auctions, where bidders, either consumers or producers, can specify a minimum profit or maximum payment condition. Those conditions are similar to EUPHEMIA order types, however when compared to the MIC orders of the OMIE power exchange, they have advantages, including faster implementation of the methodology and better representation of the operating constraints of the power units.
The creation of an integrated and harmonized market requires the redesign of market structure in the member states of the EU, including the adoption of the EUPHEMIA algorithm. Several researchers focus on the examination of national power markets, either on their design so as to comply with the provisions of the European “Target Model”, or the effect of the implementation of the new market design. A recent paper [23] focuses on the high-level design of the Hellenic wholesale market, examining the specifications for the creation of a day-ahead, intraday, and forward and balancing market for Greece. The power market coupling between Greece and Italy has been examined in an earlier research [24], which focused on the volume-coupling between a power exchange and a mandatory power pool. The paper argues, in contradiction to several papers, that the rules’ harmonization is a precondition for a successful EU electricity market’s integration, each market could retain its regional/national rules and mechanisms, without threatening the overall market coupling efficiency. Nepal and Jamasb [25] examine the market integration in the Irish Single Electricity Market (SEM), indicating the importance of liquidity in wholesale markets in the market integration process. Cosmo and Lynch [26] examine the evolution of the Irish SEM in order to comply with the European “Target Model”, identifying the crucial role of a competitive and liquid forward market, as it will enhance competition on both spot and retail markets. Tanrisever et al. [27] provide an overview of the Dutch market, describing the organization of financial trading and clearing mechanism for the day-ahead and the intraday markets, as well as for the supplementary markets in the Netherlands, including a futures exchange, the imbalance market, and the reserve capacity management. Using an agent-based simulation model for the German electricity market, Keles et al. [28] analyzed the design options for the German electricity market, concluding that an energy-only market extended with a strategic reserve can provide sufficient incentives for investments. Pape et al. [29] examine the price variations in the German day-ahead and intraday power markets. The paper implements fundamental modeling analysis, which explains a high share of electricity spot price variance, while also identifying the influence from other factors such as (avoided) start up-costs, market states, and trading strategies. Graf and Wozabal [30] investigated the efficiency of the German spot market for electricity, while Pellini E. [31] estimated the impact of market coupling on the Italian electricity market. Finally, Figueiredo et al. [32] evaluated the market splitting determinants of the Iberian spot electricity prices.
The literature review shows that an increasing number of papers on the EUPHEMIA algorithm lean towards the integration of European electricity markets. The review also identifies the need for market design research at the national/regional level, as the consideration of the characteristics of the power systems and market participants enable a more realistic representation of the implementation of the “Target Model”. The EUPHEMIA order types, their use by market participants, the relative competitiveness of power generators, the impact of interconnected markets, the existence of specific regulations such as the minimum variable cost restriction on offers by producers, the existence of market players with a dominant position, and the strategy by market participants depending on their relative competitiveness are important factors that should be considered by regulators in their real decision-making. This paper aims to provide a comprehensive analysis on the adoption of EUPHEMIA’s algorithm in the case of the Greek wholesale market, based on a relevant research project funded by the Joint Research Centre of the European Commission to support the Hellenic regulator on its decision-making. Therefore, the paper contributes to the relevant literature on the quantification of the impacts of the EUPHEMIA algorithm in the case of the Greek wholesale market, providing insights on the crucial aspects affecting real decision-making.
In order to implement this analysis, the authors have developed a model that simulates the EUPHEMIA algorithm, based on its public description [33]. The authors have also developed an extension of the “EUPHEMIA” model [34], that incorporates the EUPHEMIA algorithm and further extends it for more technically robust solutions. For the needs of this paper, which is a policy paper aiming to provide policy recommendations for actual market reform of the Greek wholesale market concerning the application of the EUPHEMIA algorithm, the authors have used the model that simulates the EUPHEMIA algorithm.
The remainder of the paper is organized as follows. Section 2 provides the methodology and Section 3 describes the process for the formation of the scenarios. Section 4 provides the scenarios that have been examined, while their results are provided in Section 5. Finally, Section 6 provides the concluding remarks and policy recommendations.
2. Methodology
This paper uses a model that has been developed by the Energy and Environmental Policy Laboratory at the University of Piraeus to simulate the EUPHEMIA algorithm, according to its public description [33]. The algorithm takes into account all the block and complex orders being available in the European Power Exchanges, which have adopted the EUPHEMIA algorithm. The overall problem is formulating a Mixed Integer Linear Programming (MILP) model, whose objective is the minimization of the system’s total net cost (total offer cost minus the total load utility) and is subject to a series of constraints including demand balance and the constraints accounting for the representation of hourly offers/bids with complex orders, block orders, linked block orders, exclusive group of block orders, as well as flexible hourly orders. More specifically, the model considers:
- Stepwise hourly orders subject to the conditions of minimum income, load gradient, and scheduled stop (complex orders), providing the option to each power unit to activate them or not. Linear piecewise curves can be also easily incorporated in the model.
- Block orders are defined by: (i) type (supply or demand), (ii) submitted price limit (uniform across all time periods), (iii) hourly intervals, (iv) volume (can be different in each hourly interval), and (v) minimum acceptance ratio (can be equal to or less than 1, thus including both regular and profile block orders).
- Linked Block orders (with a “tower”-based parental relationship, in which each parent has up to one linked block, called child block), i.e., the acceptance of individual block orders can be achieved contingent on the acceptance of other block orders. The block whose acceptance depends on the acceptance of another block is called a “child block”, whereas the block that has conditions of acceptance of other blocks is called a “parent block”. The rules of acceptance are the same with those provided in the EUPHEMIA Pubic Description Document.
- Exclusive group of block orders, defined as a set of block orders for which the sum of the accepted ratios of all block orders cannot exceed 1.
- Flexible Hourly Orders (supply and/or demand), defined as a block order with a fixed price limit, fixed volume, minimum acceptance ratio of 1, with duration of 1 h.
2.1. Offers/Bids Strategy
2.1.1. Thermal Units—Interconnections
The methodology adopted for the handling and the formation of the offers/bids submitted by thermal units (lignite-fired units, natural gas-fired units, as well as imports and exports) is described in the scenario analysis. Note that the available transmission capacity and the border price per interconnection, representative day and hour, as well as a potential thermal units’ maintenance schedule per representative day comprise input data.
2.1.2. Hydroelectric Units
The power contribution from hydroelectric units is divided into two parts: (i) nonpriced (mandatory injection) and (ii) priced. The model enables the option for hydro units to apply nonpriced energy offers, in such cases regulatory provisions exist in the examined power system, such as in the case of mandatory injection.
The large hydro units, besides providing electricity to the power system, can be responsible for providing other services to regional communities, such as water supply for urban/rural areas and for irrigation purposes. In such cases, the owners of the large hydro units are obliged to provide a declaration to the Transmission System Operator, concerning the mandatory hydro sources that are needed for providing those supplementary services. This declaration should be publicized, as it affects the wholesale marginal price, so therefore market participants must be informed. This power injection from the mandatory hydro sources has dispatch priority, meaning that its power injection is nonpriced, while the rest hydro power is provided through priced energy offers.
2.1.3. Renewable Energy Sources
The renewable energy generation per technology (wind, photovoltaics, biomass, small hydroelectric, and high-efficiency combined heat and power units) is also divided into two parts: (i) nonpriced (mandatory injection), and (ii) priced. The model enables the option for renewable units to apply nonpriced energy offers, in such cases regulatory provisions exist in the examined power system, such as in the case of renewables with dispatch priority.
The Renewable Energy Sources (RES) with a Feed-In-Tarif system have priority in dispatching. The Transmission System Operator provides an estimation of their hourly power injection, which is also publicized, as they affect the market price and the flexibility needs [35]. This power is also nonpriced. However, as the levelized cost of energy for the RES become very competitive compared to the conventional thermal power plants, the RES can enter in the market without an approved state aid scheme. The power of such RES installations provide priced energy offers in the competitive day-ahead market. Therefore, we have incorporated the capability for RES to participate in the wholesale market through priced bids. We have also incorporated this capability for the high-efficiency combined heat and power units, where part of its capacity is characterized as priority capacity, participating with nonpriced bids.
2.1.4. Injection Losses
The assumptions regarding the hourly losses of each market participant are calculated based on the coefficients currently used by the market operators. They are determined per hour in a deterministic way based on the load level, the zone in which each market participant operates, assuming that priced demand is to be accepted at a 100% level.
2.2. Complex Orders
2.2.1. Minimum Income Condition
The Minimum Income Condition (MIC) constraint is defined by:
- A fix term (FT) in Euros, typically accounting for the shutdown cost of the unit in our study.
- A variable term (VT) in Euros per accepted MWh, typically representing the minimum variable cost plus a desired cost coefficient (can be also zero).
In the final solution, MIC orders are activated or deactivated (as a whole).
In case a MIC order is activated, each of the hourly suborders of the MIC behaves like any other hourly order, which means that they are accepted if they are in-the-money (meaning the achieved revenues are greater than the required by the MIC ones), and rejected if they are out-of-the-money (meaning the achieved revenues are less than the required by the MIC ones), and can be either accepted (fully or partially), or rejected when at-the-money (meaning the achieved revenues are equal to the required by the MIC ones).
In case a MIC order is deactivated, each of the hourly suborders of the MIC is fully rejected, even if it is in-the-money. For the units that were initially accepted by the optimization process and failed to satisfy the MIC, the unit with the least cost-efficient welfare is withdrawn from the Order Book and the model is iteratively solved again without its incorporation.
2.2.2. Scheduled Stop
For the avoidance of a situation where production unit stopped abruptly in case the MIC is deactivated, the sender of a MIC has the possibility to define a “scheduled stop”, which alters the deactivation of the MIC: the deactivation will not imply the automatic rejection of all the hourly suborders. On the contrary, the first hourly suborder in the periods that contain scheduled stop (up to period 3) will not be rejected but will be treated as any hourly order. We mimic the desynchronization process, i.e., a linear decrease according to the rate technical minimum/desynchronization time, submitted as a nonpriced offer without checking if is at- or in-the-money. To sum up, for the units that were initially accepted by the optimization process and failed to satisfy the MIC, their submission offer is converted into a new offer according to the above description, and the model is solved again with that modification.
2.2.3. Load Gradient
Complex orders (with their set of hourly suborders) on which a load gradient constraint applies are called Load Gradient Orders. There is a maximum increment/decrement allowed (the same value for all periods) among time intervals. This constraint represents the ramp up/down constraints. Note that this constraint (activation/deactivation) is incorporated in the main optimization process, thus there is no need for a post-optimization check.
2.3. Block Orders
2.3.1. Paradoxically Accepted Block Orders
In case a block order has been accepted and its calculated welfare (implemented in the post-optimization process) is negative, i.e., the required revenues exceed the achieved ones, then this block order is designated as a paradoxically accepted block and it is withdrawn from the Order Book. After that, the model is solved again without considering the paradoxically accepted block order with the least cost-efficient welfare.
2.3.2. Paradoxically Rejected Block Orders
In case a block order has been rejected and its calculated welfare (implemented in the post-optimization process) is positive, i.e., the achieved revenues exceed the required ones, then this block order is designated as a paradoxically rejected block and it is given another opportunity to be normally accepted by the optimization process, on the grounds that there will be more favorable for acceptance conditions in the next iterations, since some hourly offers/block orders may have been definitely rejected. After that, the model is solved again without considering all the paradoxically accepted block orders.
2.4. Estimation of Solution
2.4.1. Solution Algorithm
The solution of the MILP model is executed within an iterative process so as to deal with the Paradoxically Accepted/Rejected block orders, and the orders that do not satisfy the minimum income condition. Initially, the MILP problem is solved, and the model determines the hourly market clearing prices of each representative day and for each bidding area, as well as the achieved welfare of each block order. After that, a post-optimization algorithm is employed to check the existence of paradoxically accepted/rejected block and complex orders.
2.4.2. Final Solution
When the final solution does not include any paradoxically accepted block orders and/or hourly offers that do not satisfy the minimum income condition, the model has successfully completed its execution and the final model outputs are provided (all the initial and intermediate solutions are also available).
3. Case Study: Greece
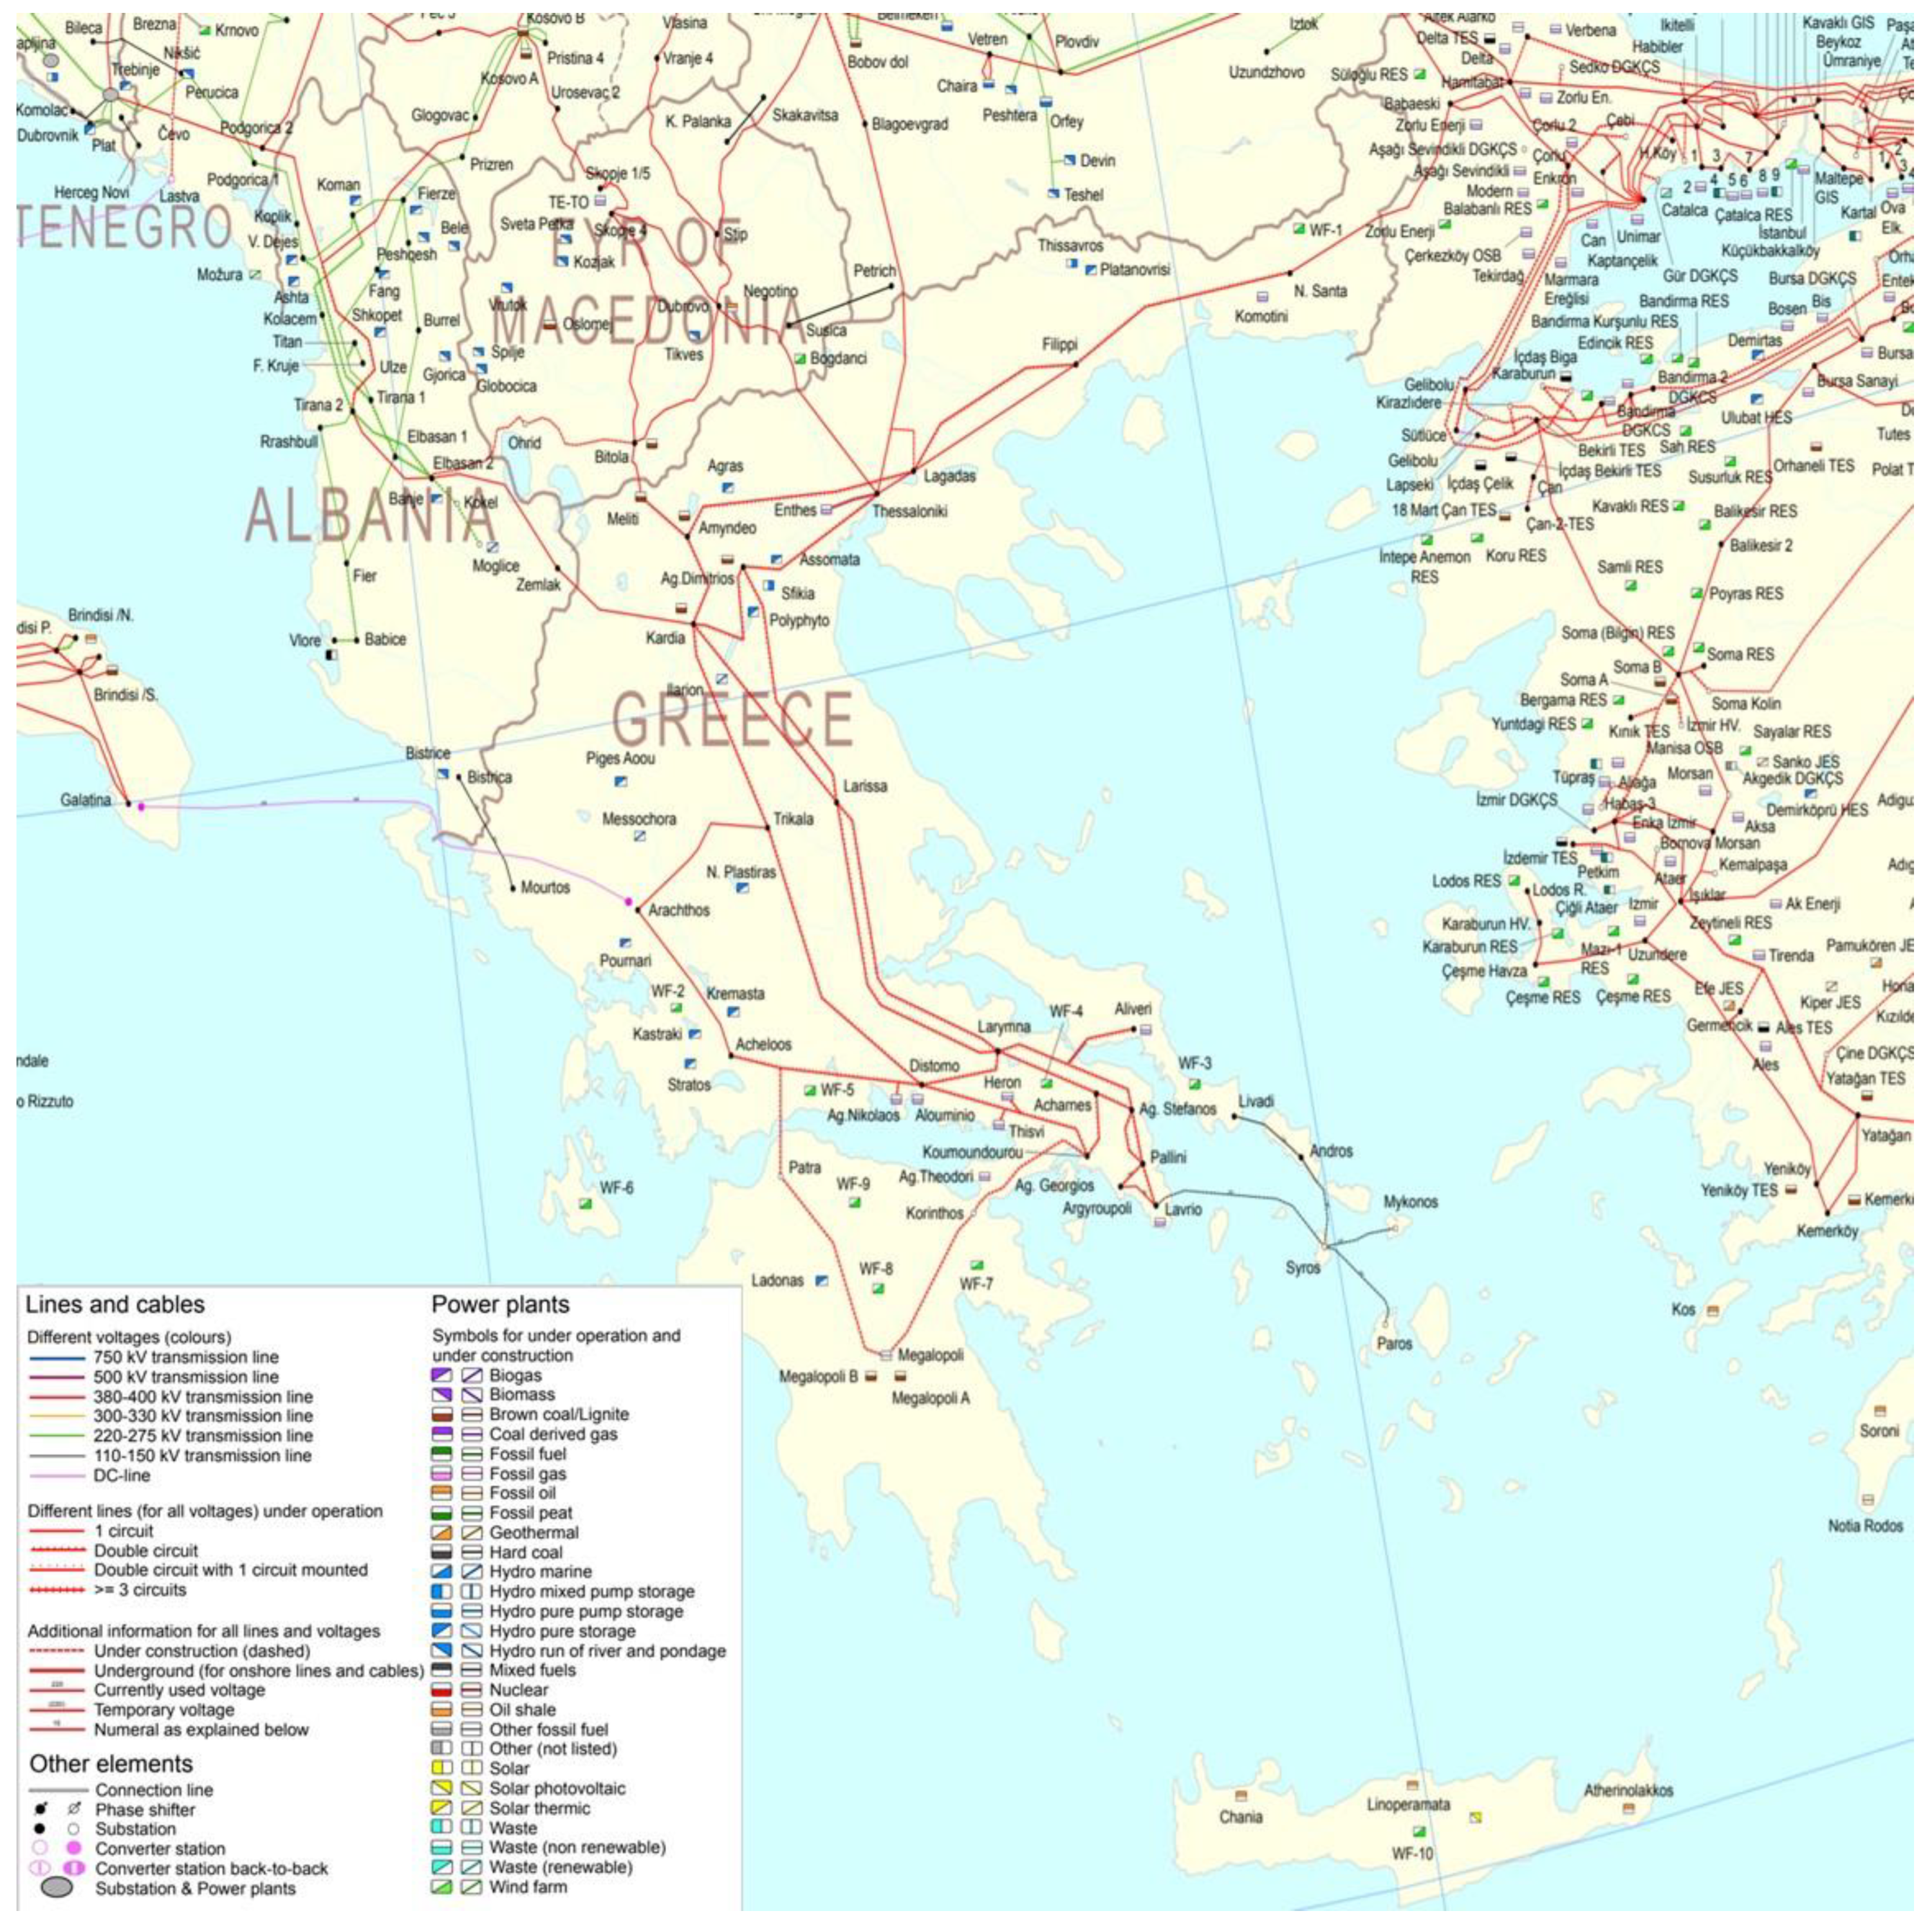
The model has been applied to examine the day-ahead power market in Greece. Figure 1 provides a graphical representation of the Greek electricity transmission system, showing also the installed power plants and interconnections with neighboring countries. According to the TSO’s register of power units [36] the installed thermal and large hydro capacity is about 12 GW in the Greek interconnected system. There are sixteen large hydro units, all approximately 3.2 GW, owned by the Public Power Corporation (PPC). PPC is also the owner of the fourteen lignite units, with a total capacity of approximately 3.9 GW. PPC also owns another five natural gas combined cycle units, with total capacity of approximately 2.3 GW. Independent Power Producers (IPPs) own another six natural gas combined cycle units, with total capacity of approximately 2.4 GW, as well as three open cycle natural gas units with capacity of 0.15 GW. The dominant position of PPC, due to its share of the installed capacity as well as its power units’ portfolio mix, is a critical issue for the important regulatory decision on market reform by the Regulatory Authority of Energy (RAE). The renewables have a considerable share in the installed capacity, with approximately 5.3 GW of 17.3 GW of the total installed capacity of the Greek interconnected system. More specifically, there is approximately 2.4 GW of wind, 2.5 GW of photovoltaics, and 0.4 GW of the remaining renewables, including small hydro, biomass, and Combined Heat and Power (CHP) installations. The penetration of renewables, and especially of wind and photovoltaics, is high, as the RAE with Decision 321/2018 has decided to implement auctions for additional renewables with a capacity of 2.6 GW over the period 2018 to 2020. Moreover, according to the TSO six lignite units are to be decommissioned due to the limited operating hours for environmental reasons, while a new lignite unit is under construction. Those developments, concerning the decommissioning and commissioning of power units, as well the penetration potential or renewables, have been considered in the scenario analysis carried out.
The formation of the scenarios has been implemented according to the following.
- Select one typical day of each season where the different scenarios of orders types and variable cost restriction will be examined and
- select different scenarios of EUPHEMIA order types and variable cost restriction, as described below.
3.1. Selection of the Typical Days
The formation of the typical days assumptions require assumptions on the hourly load curve, RES production, and hydro and fossil fuel availability, providing insights on the potential impact of order types and variable cost restriction. Scenarios on real market data of typical days of the year 2017 of the Greek wholesale market have been constructed.
The data for the final scenarios, presented in this paper, have been provided by LAGIE. More specifically, LAGIE provided actual data of the day-ahead market of representative weeks in each season in 2017:
- 9–15 January 2017 and 23–29 January 2017
- 8–14 May 2017
- 10–16 July 2017
- 9–15 October 2017
From the above five weeks, it was chosen to examine Wednesday as a typical day. Different conditions, i.e., in demand and RES in other weekdays and weekends have been indirectly tackled through sensitivity analyses.
The data provided by LAGIE for each typical day include:
- Priced energy offers and load declarations of imports and exports, for each hour of the day,
- nonpriced energy offers for RES injections, for each hour of the day,
- nonpriced energy offers for mandatory hydro, for each hour of the day,
- priced energy offers by hydro power units, for each hour of the day,
- priced load declarations by market participants, for each hour of the day, and
- minimum average variable cost for all thermal and hydro plants for that day.
Moreover, the power plants’ availability has been used for each typical day, as they were published on the website of the Transmission System Operator (ADMIE).
3.2. Selection of the Scenarios
- The different scenarios have been organized in two generic categories:
- Consideration of minimum average variable cost constraint as minimum price offer level of producers and no limit for the maximum price offer level for the orders.
- Consideration of no limit for the orders of all market participants (without minimum average variable cost constraint).
- A second classification of scenarios is based on the orders types. For each typical day and for each category of scenarios (i.e., with minimum variable cost constraint), the following order types were examined.
- The impact of hourly orders, where all market participants bid with hourly orders.
- All hourly orders are formed as stepwise orders.
- The impact of block orders, linked block orders, and complex orders (i.e., Minimum Income Condition), examining different combinations of using those options by the producers.
- The rest market participants that do not use the available bidding options (block, linked block, and MIC), are bidding with simple hourly orders.
Bidding Strategy Assumptions in the Scenarios
Another critical issue in all the above-mentioned scenarios is the formation of the bidding strategy of power plants and imports/exports in interconnections. The consideration of different strategies (as described below), multiplies the number of scenarios to more than 100. This creates a problem of overdose of results that could not easily be handled, the formation of some unrealistic scenarios, or the provision of results with similar outcomes for each typical day. Therefore, from all those scenarios examined, it was decided to organize the scenarios and the results as shown in the scenario analysis section.
4. Scenario Analysis
The list of scenarios examined is provided in Table 1, Table 2 and Table 3 in Section 4.1. Considering that the list of scenarios is extensive, indicative scenarios are analyzed in Section 4.2 and Section 4.3. However, the concluding remarks in Section 5, with results, and Section 6, with concluding results, are based on all examined scenarios.
4.1. List of Scenarios
In an all of the above-mentioned examined scenarios, the following assumptions have been made:
- Demand aggregators use hourly orders that are based on the actual load declarations in the Day Ahead Schedule in each typical day.
- RES and mandatory hydro units use nonpriced hourly orders practically reducing the net load. The model incorporates the capability for bidding with priced hourly orders. Considering that those orders are expected to be at near 0 euro/MWh levels and preliminary results showed that they don’t affect price formation, it was decided to incorporate them with nonpriced orders.
- Overmandatory hydro have been based on their actual bidding in the typical days, based on the data provided by LAGIE The consideration of different bidding strategy for overmandatory hydro generation, would multiply considerably the number of potential scenarios. Therefore, it was agreed to assume the existing methodology, so as to focus on the thermal units.
- Open Cycle Gas Turbines use hourly orders, based on their MAVC.
- Import and exports have been considered as mentioned above in the scenarios.
- ○
- In the tables with “hourly orders scenarios”, orders been based on the actual imports/exports orders in the Day Ahead Schedule in each typical day.
- ○
- In the tables with “combined orders scenarios” and with “block orders scenarios”, orders been dynamically incorporated in the program code, based on comparison of day ahead price of each typical day in foreign interconnected systems and MAVC of thermal power plants in the Hellenic interconnected system in each typical day.
Dynamic Updates on Bidding in Interconnections
Imports and exports in interconnections are set based on the expected price (for each hour) in each interconnected country compared to the minimum average variable cost of thermal units (lignite and natural gas combined-cycle gas turbines, CCGT units are considered).
- i.e., GME = 30 €/MWh and cheapest minimum average variable cost of thermal units = 40 €/MWh,
- i.
- then half the interconnection capacity imports are bid at 0 €/MWh and the rest in nine equal steps between 0 and 40 × 1.25 (up to 25% higher than the minimum average variable cost) €/MWh.
- ii.
- then exports are bid in ten equal steps between 0 and 30 €/MWh, downwards.
- i.e., GME = 60 €/MWh and more expensive minimum average variable cost of thermal units = 50 €/MWh,
- iii.
- then interconnection capacity is divided in ten steps, and imports bid increased by 0.50 €/MWh for each step equal step, between 60.5 and 65 €/MWh.
- iv.
- then interconnection capacity is divided in ten steps, and exports bid decreased by 0.50 €/MWh for each step equal step, between 60 and 50.001€/MWh.
- i.e., GME = 45 €/MWh, and the cheapest and most expensive minimum average variable cost of thermal units are 40 and 50 €/MWh, respectively,
- v.
- then interconnection capacity is divided in ten steps, and imports bid increased by 0.50 €/MWh for each step equal step, between 45.5 and 49.999 €/MWh.
- vi.
- then interconnection capacity is divided in ten steps, and exports bid decreased by 0.50 €/MWh for each step equal step, between 40.01 and 44.5 €/MWh.
4.2. Scenarios with Hourly Orders, Examining the Impact of Minimum Variable Cost Restriction
In these scenarios, all market participants bid with hourly orders, which are formed as stepwise orders. Moreover, the RES, mandatory hydro, and availability assumptions are based on actual LAGIE and ADMIE data of the typical days.
For the generic category, considering the minimum average variable cost condition, the following assumptions have been considered to form the “simple hourly with MAVC” scenario:
- PPC lignite-fired and natural gas plants bid at minimum variable cost.
- Independent Power Producers (IPPs) bid considering the comparison of each power plant’s cost with lignite units, adopting a scarcity pricing strategy, as described in Annex I.
- Overmandatory hydro units offer energy with hourly orders, based on their actual bidding in the typical days, based on the data provided by LAGIE.
- Importers and exporters bid with hourly orders, based on their actual bidding in the typical days, based on the data provided by LAGIE.
For the generic category, when not considering the minimum average variable cost condition, the following assumptions have been considered the “simple hourly without MAVC” scenarios.
- Three bidding strategies (and therefore three “simple hourly without MAVC” scenarios) of the thermal power units, as described in Annex I.
- Overmandatory hydro units offer energy with hourly orders, based on their actual bidding in the typical days, based on the data provided by LAGIE.
- Importers and exporters bid with hourly orders, based on their actual bidding in the typical days, based on the data provided by LAGIE.
Sensitivity Analysis
In the above “simple hourly with MAVC” and “simple hourly without MAVC” scenarios, a sensitivity analysis was carried out to examine the impact of demand, of RES, of decommissioning and commissioning of power units.
More specifically, six (6) further scenarios have been examined:
- High demand (volumes in load orders are increased by 15% in all hours)
- Low demand (volumes in load orders are decreased by 15% in all hours)
- High RES, where the increased RES production follow the same production profile as the existing one, which “roughly” means that almost similar PV and wind capacity are installed. This scenarios considers that volumes of RES production are increased by 15% in all hours with High demand conditions (as described above)
- High RES, where volumes of RES production are increased by 15% in all hours with Low demand conditions (as described above)
- Six lignite units are decommissioned (for reference demand and RES production). Note also that some of them may already not be available in the reference case, due to maintenance reasons during the selected typical days.
- Six lignite units are decommissioned and a new proposed lignite-fired one is commissioned (for reference demand and RES production)
4.3. Scenarios with other Order Types, Examining the Impact of Minimum Variable Cost Restriction
In this part, the impacts of block orders, linked block orders and complex orders (Minimum Income Condition—MIC) have been examined, in alliance with the impact of the minimum average variable cost restriction.
There are several potential combinations of strategies, namely which units use each option (block order, linked block order, and MIC order). Therefore, initially the study examined scenarios where all thermal units use one option,
- Block orders scenario, where all thermal power plants (besides natural gas open-cycle gas turbines and OCGT units) bid with block orders. Block orders are assumed to be regular blocks, where power plants bid their whole capacity in one block for all hours 1–24, with Minimum Acceptance Ratio equal to the ratio of Technical limit/NCAP of each unit.
- Linked block orders scenario, where all thermal power plants (besides OCGT units) bid with linked block orders. Linked block orders are organized in three block orders, where the first block order is set at the technical minimum capacity for all hours 1–24, while the other two linked-blocks are set for hours 9–24 and 18–23.
- MIC orders scenario, where all thermal power plants (besides OCGT units) bid with MIC orders. MIC orders are set to have one fixed and one variable term. The latter is the minimum variable cost, while the first to be the shutdown cost of each unit.
The condition that all units bid with one option (i.e., block orders), in alliance with the fact that imports and exports are not dynamically estimated, but based on the orders at that typical day in LAGIE, which includes the limited availability of capacity or even “exports ban” by the TSO (in 11 January 2017)), creates limited flexibility in dispatching of the units, in combination with the fact that imports/exports offers/bids as well as hydro offers are fixed based on the real data used during these selected typical days.
Therefore, the results with block borders are only presented to depict the impact of the potential “overuse” of one option, which is the provision of an unrealistic schedule and of high fluctuating system marginal prices, from extremely negative to very high prices. The results are also similar for linked-block orders.
In case of MIC orders, the results show that the shutdown cost cannot easily be compensated from power plants in the day-ahead market. Therefore results with MIC orders, including the shutdown cost as fixed term, have led to curtailment of demand in several hours and high system marginal prices. This conclusion enhances the logic under which we formed the scenarios, namely power plants to bid at low prices their technical minimum in order to avoid the shutdown cost.
4.3.1. Updating Assumptions to Examine other Order Types
Those results, have led to a restructure of scenarios, in order to be able to more realistically capture the impacts of other than hourly order types. For this reason, the model has been extended to dynamically form the import/export orders in interconnections, compared to the previous scenarios where orders were based on actual orders provided by LAGIE. Based on the updates on interconnections bidding strategy, as described in Annex I, from the generic category of other order types, the following two set of scenarios have been examined and presented.
Block Orders Scenarios with Dynamic Interconnections’ Orders
With updated import/export orders, block, linked block, and MIC orders have been re-examined. A special focus was made to the block orders, as they are the only order types, besides hourly, within the code of the day-ahead market. Therefore, different combinations of block orders have been set. For those scenarios and for simplicity reasons, we have chosen to present results for one typical day, namely 10 May 2017. The subscenarios of block orders examine the differences when different power plants use this option. Block orders are set to bid their whole capacity in blocks of 24 h period, with minimum acceptance ratio being equal to the ratio of technical minimum to technical maximum for each unit.
The block orders scenarios examine the differences when:
- only PPC lignite units bid with block orders
- only PPC natural gas units with block orders
- only IPPS natural gas units (except OCGT) with block orders
- all thermal power plants (except OCGT)
Combined Orders Scenarios with Dynamic Interconnections’ Orders
A combined orders scenario (and more realistic scenario) has also been formed for all the typical days and for both cases (with and without MAVC), where power plants are set to use different order types:
- Block orders are used by lignite-fired units owned by PPC.
- Linked block orders are used by natural gas-fired combined cycle units owned by PPC.
- Minimum Income Condition orders are used by natural gas-fired combined cycle units owned by IPPs.
- Simple hourly orders are used by OCGT units.
5. Results
This section provides the results derived from the model execution for a series of case studies and the different representative day types. The problem has been solved using the ILOG CPLEX 12.6.0.0 solver within the General Algebraic Modeling System tool [37]. An integrality gap of 0% has been achieved in all cases.
The scenarios provide insights on the effects of:
- the hourly system’s marginal price,
- the hourly energy mix,
- the hourly participants mix, i.e., Public Power Corporation (PPC) and Independent Power Producers (IPPs), and
- the number of shutdowns of the power units.
The results are organized in two sections as described above, namely “scenarios with hourly orders” and “scenarios with other order types” respectively. The latter category is split, as described above, into two subcategories, namely “scenarios with block orders” and “scenarios with combined orders”, respectively.
5.1. Scenarios with Hourly Orders Examining the Impact of Minimum Variable Cost Restriction
The results are presented per typical day. For comparison reasons, the actual results of the Day-Ahead Schedule (DAS) results of each typical day is provided. From the two winter typical days examined, we have chosen to present the results for the 25 January 2017. It was also chosen to present results concerning the price evolution and the energy mix for only one typical day, the typical spring day. However, conclusions were derived from all typical days.
5.1.1. Typical Winter Day: Wednesday, 25 January 2017
Table 4 provides the number of thermal power units that have been shutdown and/or started-up, for the typical day of 25 January 2017 in scenarios with hourly orders. It has to be noted that this table represents the number of units and not the number of shutdowns and start-ups, as there exist cases where a unit has more than one shutdowns and/or starts-up within a typical day. Considering that the power units aim to avoid “shutdown” cost, information on how many units need to be shutdown is crucial. Therefore, this information is more useful than the total number of shutdowns and/or start-ups, which exceed 10 in a few results in the following typical days. The first column concerns the actual solution of the Day Ahead Scheduling (DAS), with the current unit commitment algorithm operated by LAGIE.
5.1.2. Typical Spring Day: Wednesday, 10 May 2017
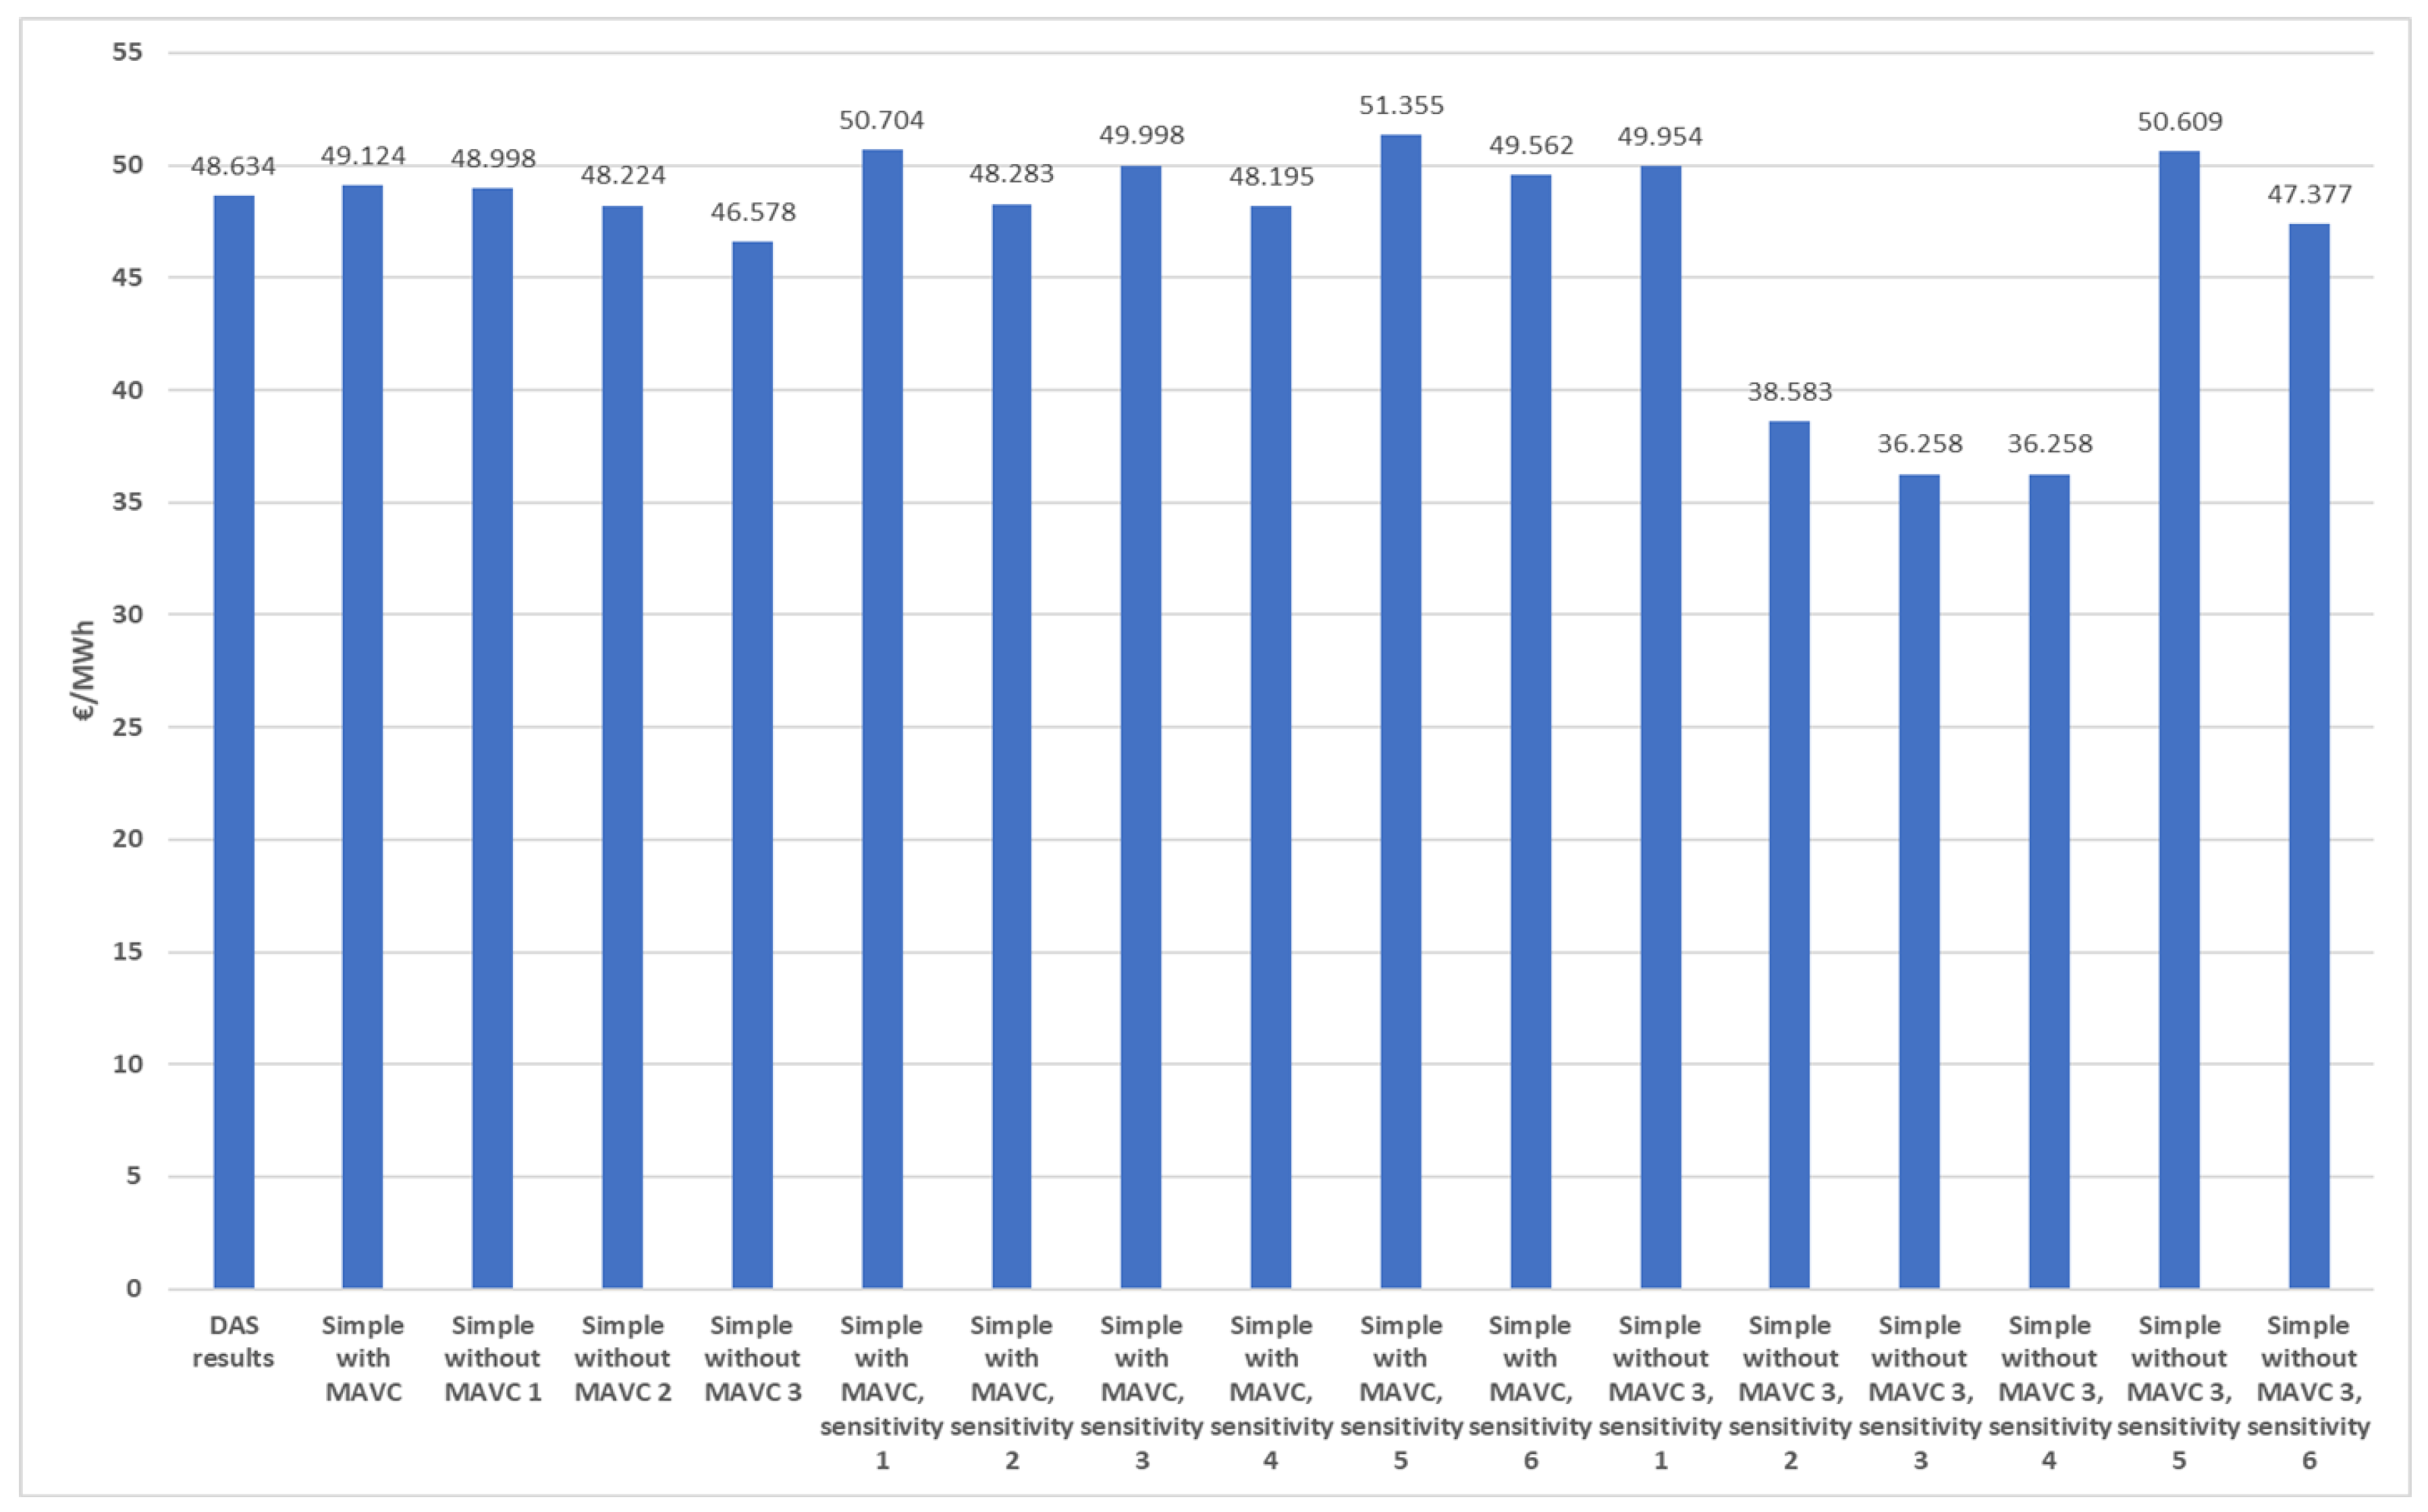
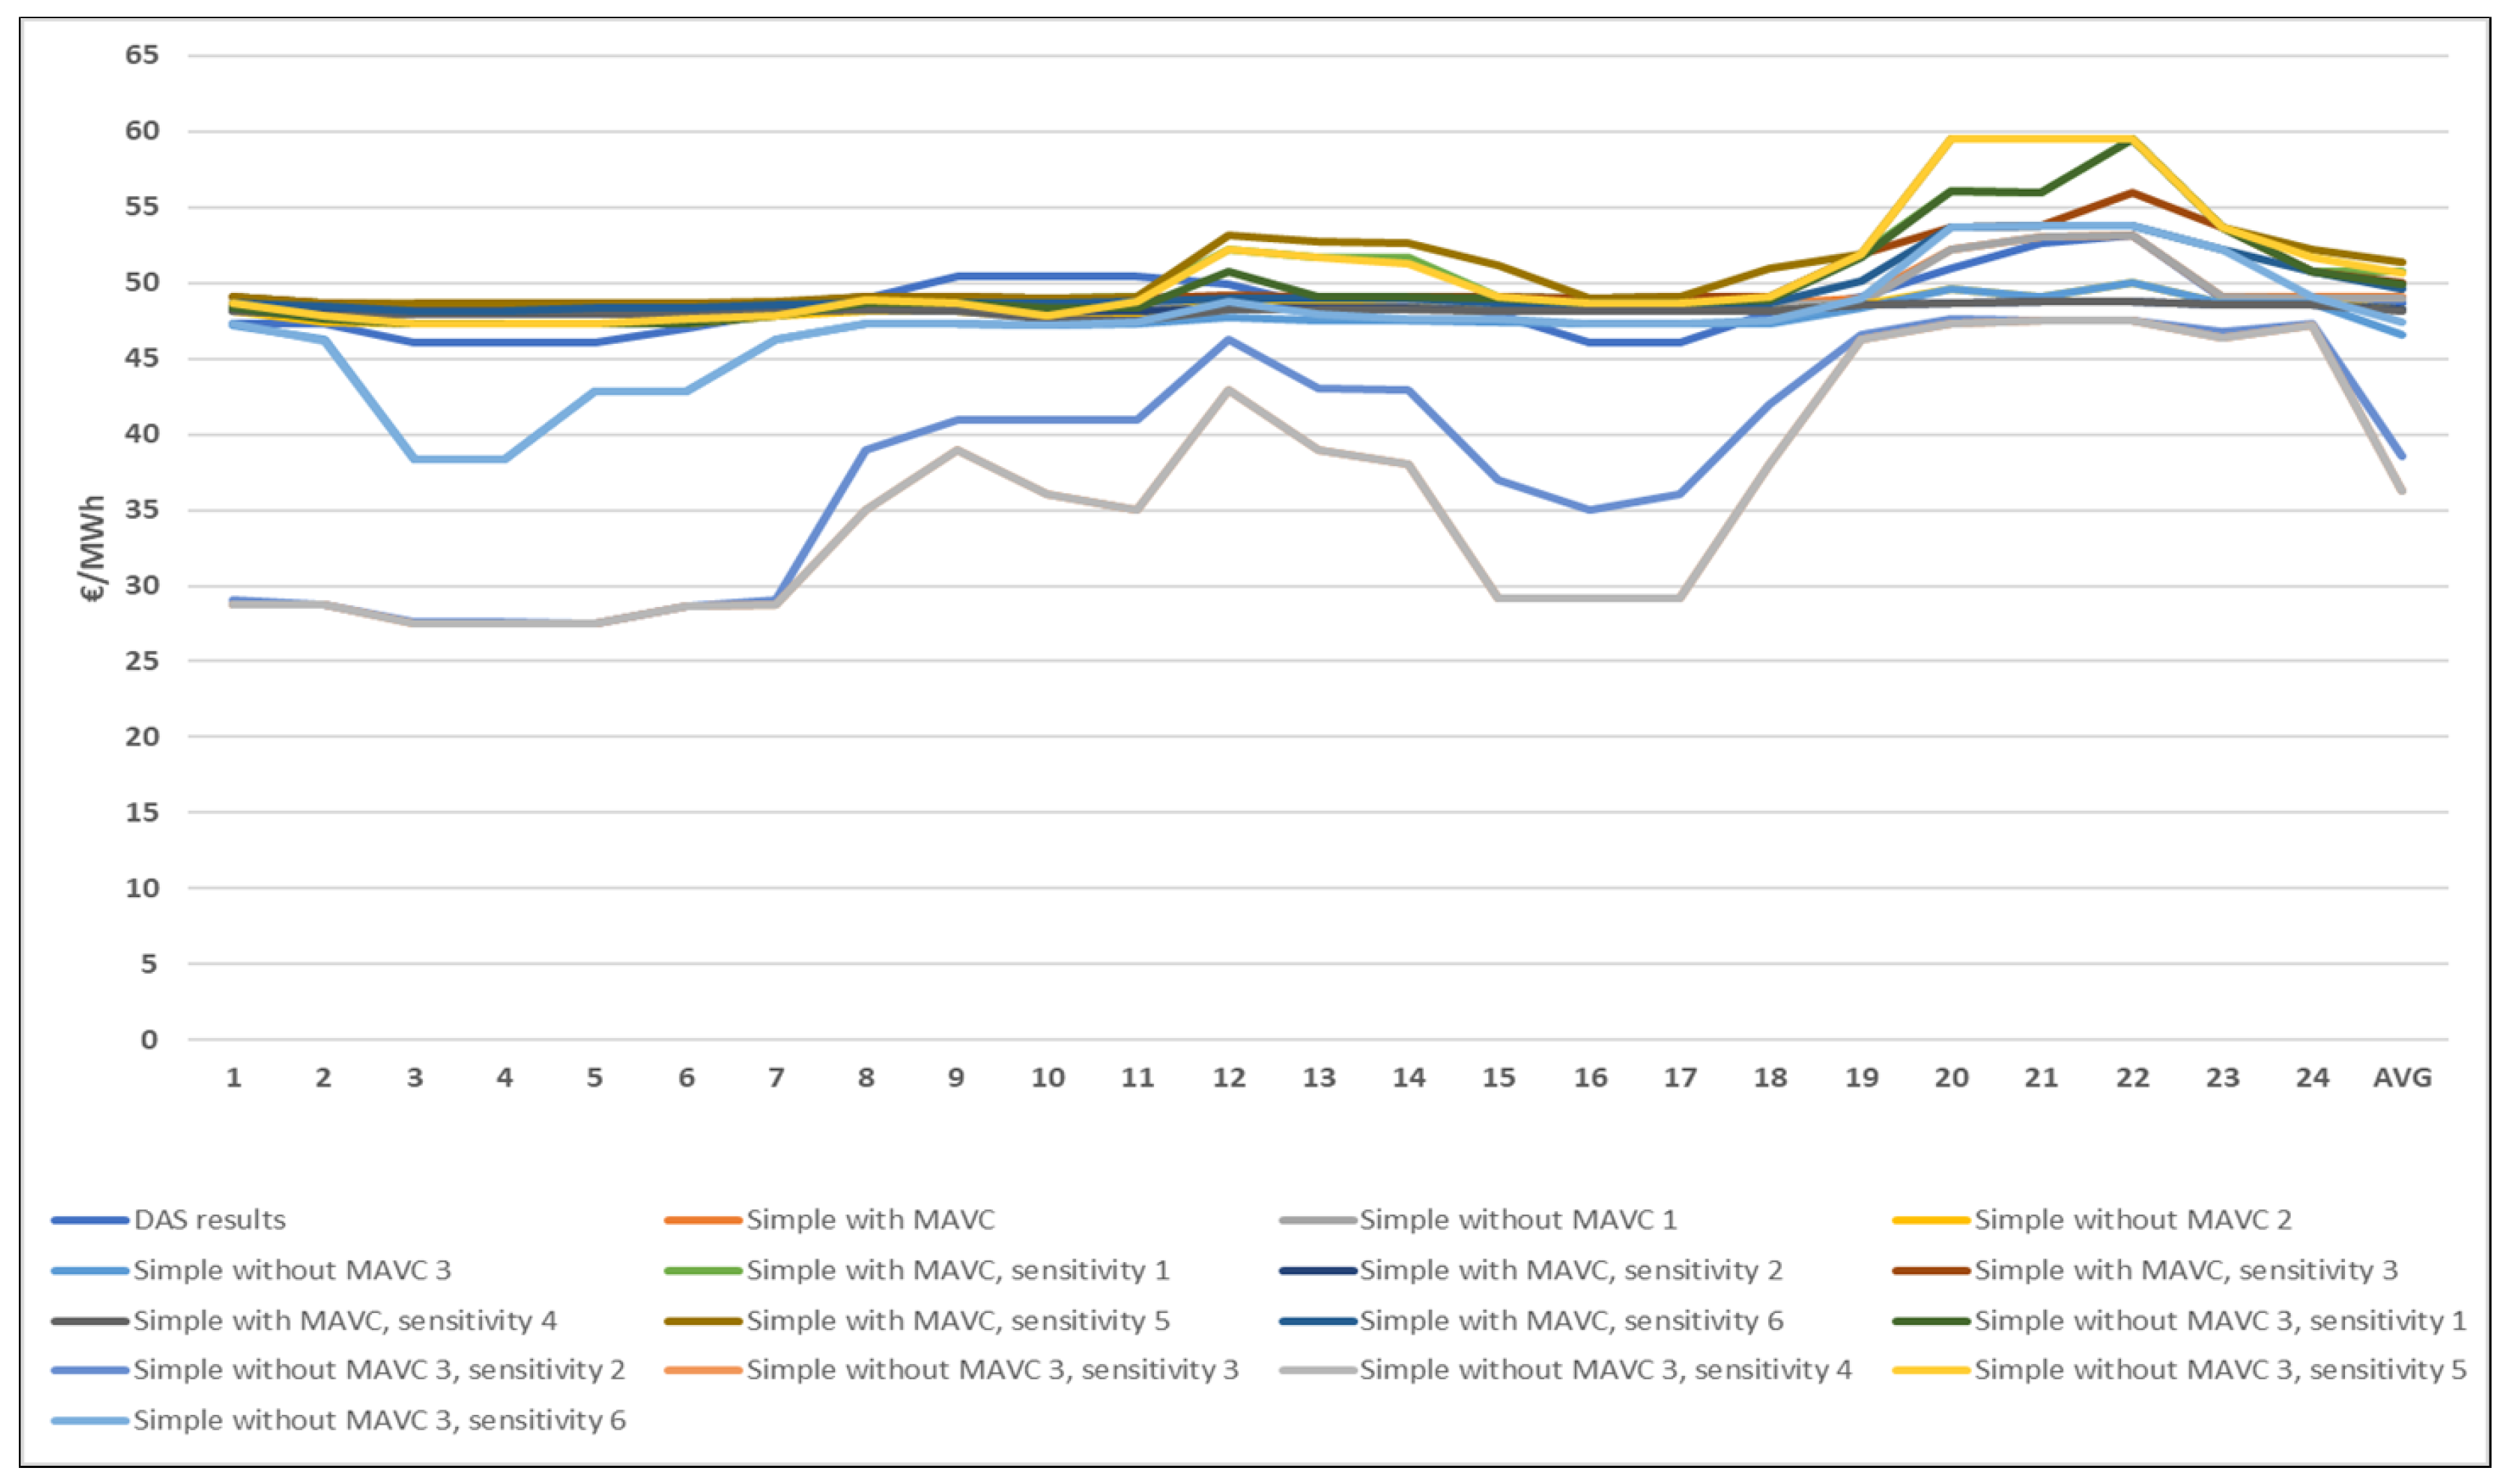
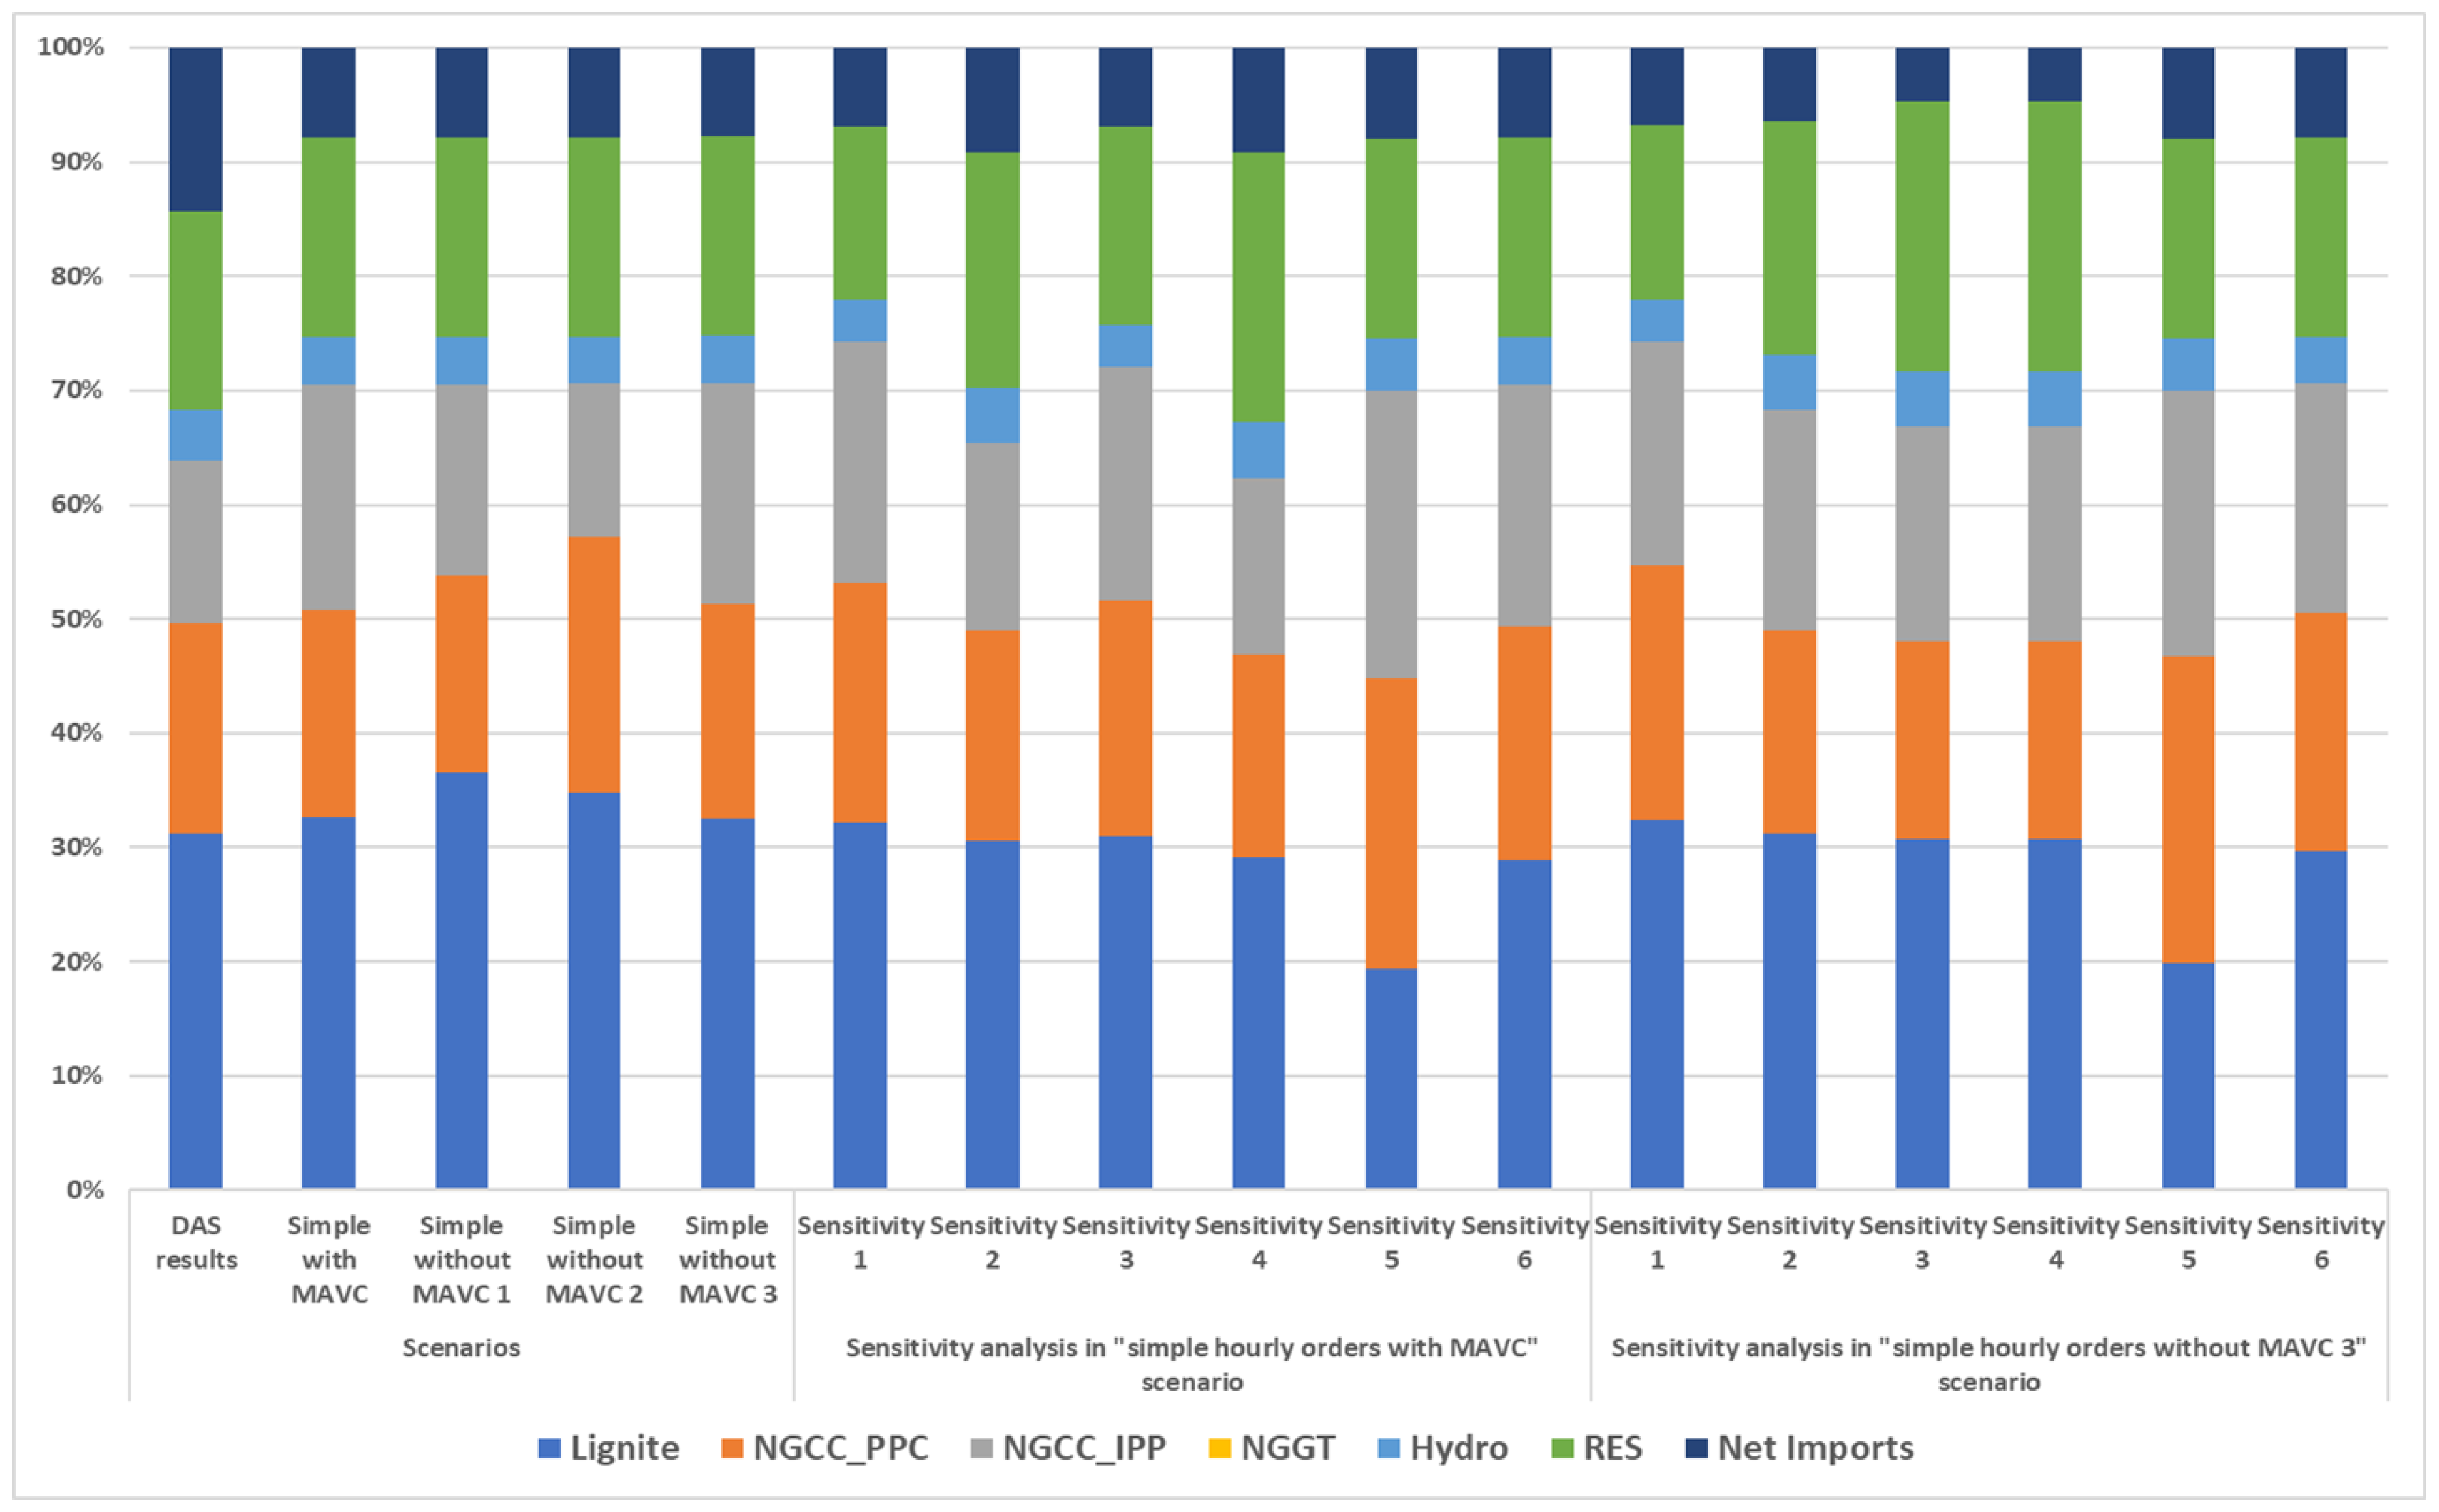
Table 5 provides the number of thermal power units that have been shutdown and/or started-up for the typical day of 10 May 2017, in scenarios with hourly orders. Figure 2 provide the evolution of hourly system marginal price, for the typical day of 10 May 2017. Figure 3 provides the evolution of hourly system marginal price, for the typical day of 10 May 2017, in scenarios with hourly orders. Figure 4 provides the evolution of daily energy mix shares (in %), for the typical day of 10 May 2017, in scenarios with hourly orders.
5.1.3. Typical Summer Day: Wednesday, 12 July 2017
Table 6 provides the number of thermal power units that have been shutdown and/or started-up, for the typical day of 12 July 2017, in scenarios with hourly orders.
5.1.4. Typical Autumn Day: Wednesday, 11 October 2017
Table 7 provides the number of thermal power units that have been shutdown and/or started-up, for the typical day of 11 October 2017, in scenarios with hourly orders.
From Table 4, Table 5, Table 6 and Table 7, it can easily be derived that simple hourly orders, in their process to provide the cost optimum solution, lead to more unrealistic dispatch schedules, as there can be up to nine thermal units shutdown and/or started-up, while the number of start-ups and shutdowns in total can exceed 10 in a typical day for the scenarios examined, highlighting the importance of other order types and bilateral contracts.
From Figure 2, Figure 3 and Figure 4, as well as all the relevant examined scenarios for other typical days, it can be derived that the consideration of the MAVC restriction in bids by units does not considerably affect the average System Marginal Price (SMP). The difference in similar scenarios when considering or not considering the MAVC is not considerable in several scenarios at the average daily level. Exceptions are few cases examined in the sensitivity analyses, for typical days in seasons with low demand, autumn, and spring. More specifically, differences are considerable at the level of 10 €/MWh in cases with “low demand”, “high RES and low demand”, and “high RES and low demand” scenarios. However, the deviations of hourly prices, as well as for the energy mix, are considerable, both at peak and off-peak hours.
5.2. Scenarios with Other Order Types, Examining the Impact of Minimum Variable Cost Restriction
Although hourly orders provide a cost-optimum solution, their unrealistic scheduling leads to the need for examination of the other scenarios, as described above. Block, linked-block, and MIC order types are options for producers that enable power plants to avoid shutdown of their units and allow for realistic dispatch schedules. The results concerning the energy mix for indicative scenarios using other than hourly order types are presented below.
5.2.1. Blocks Orders
Figure 5 provides the evolution of daily energy mix shares (in %), for the typical day of 10 May 2017, in scenarios focusing on block orders.
5.2.2. Combined Orders
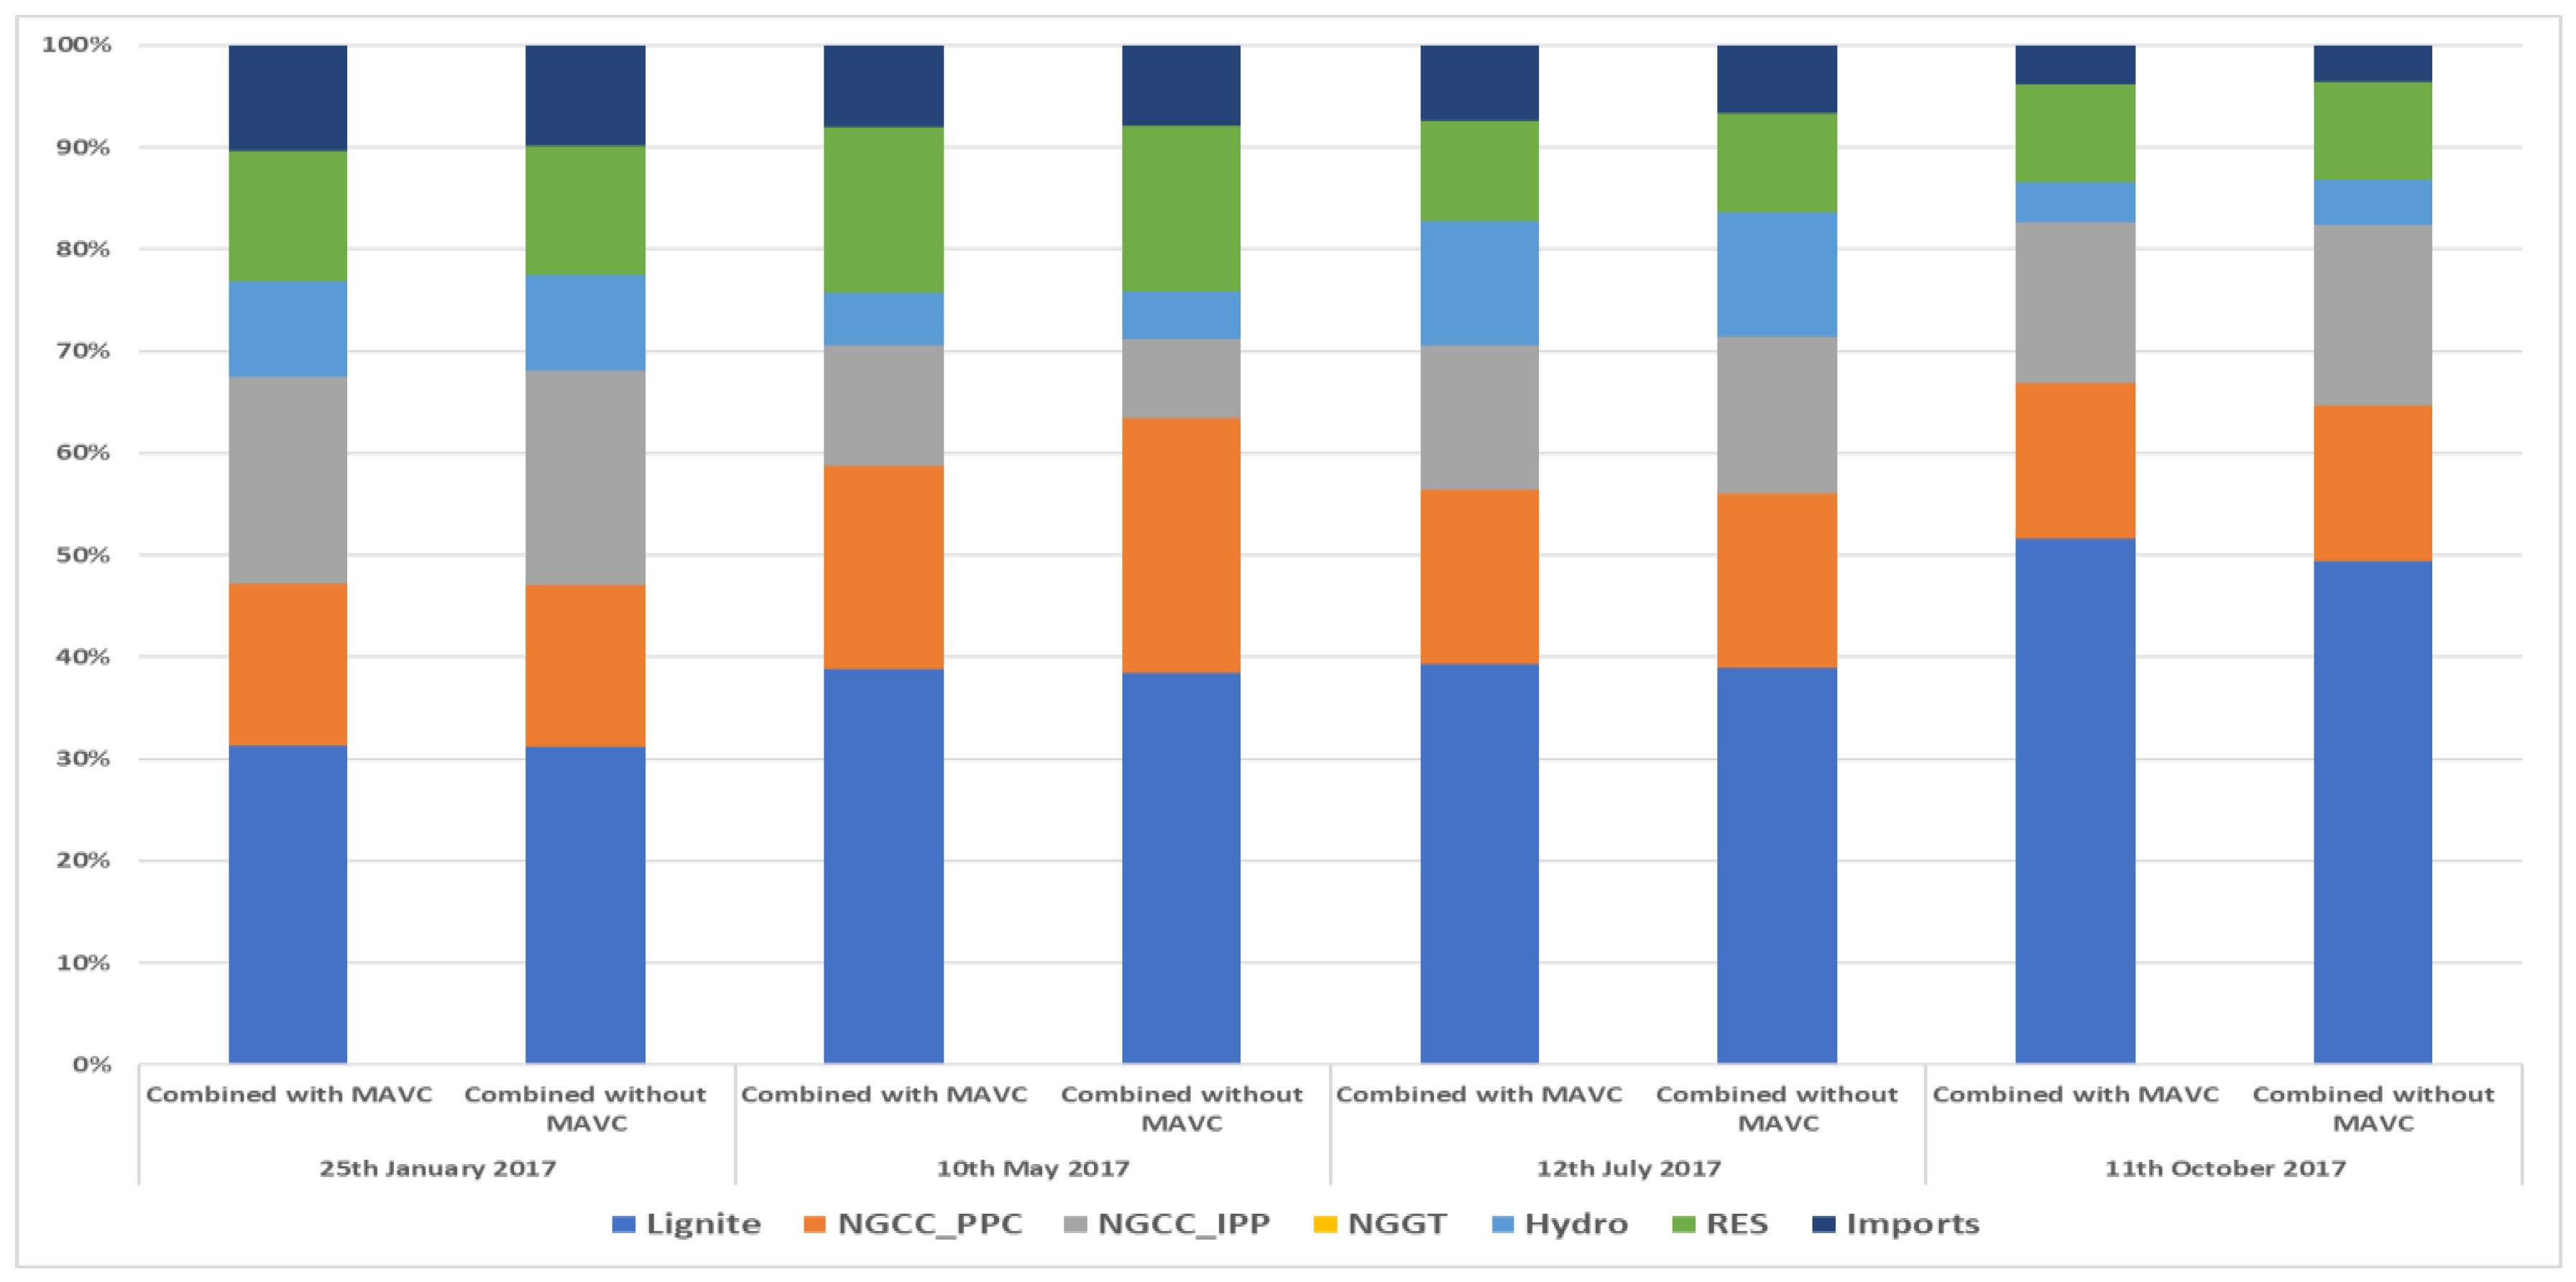
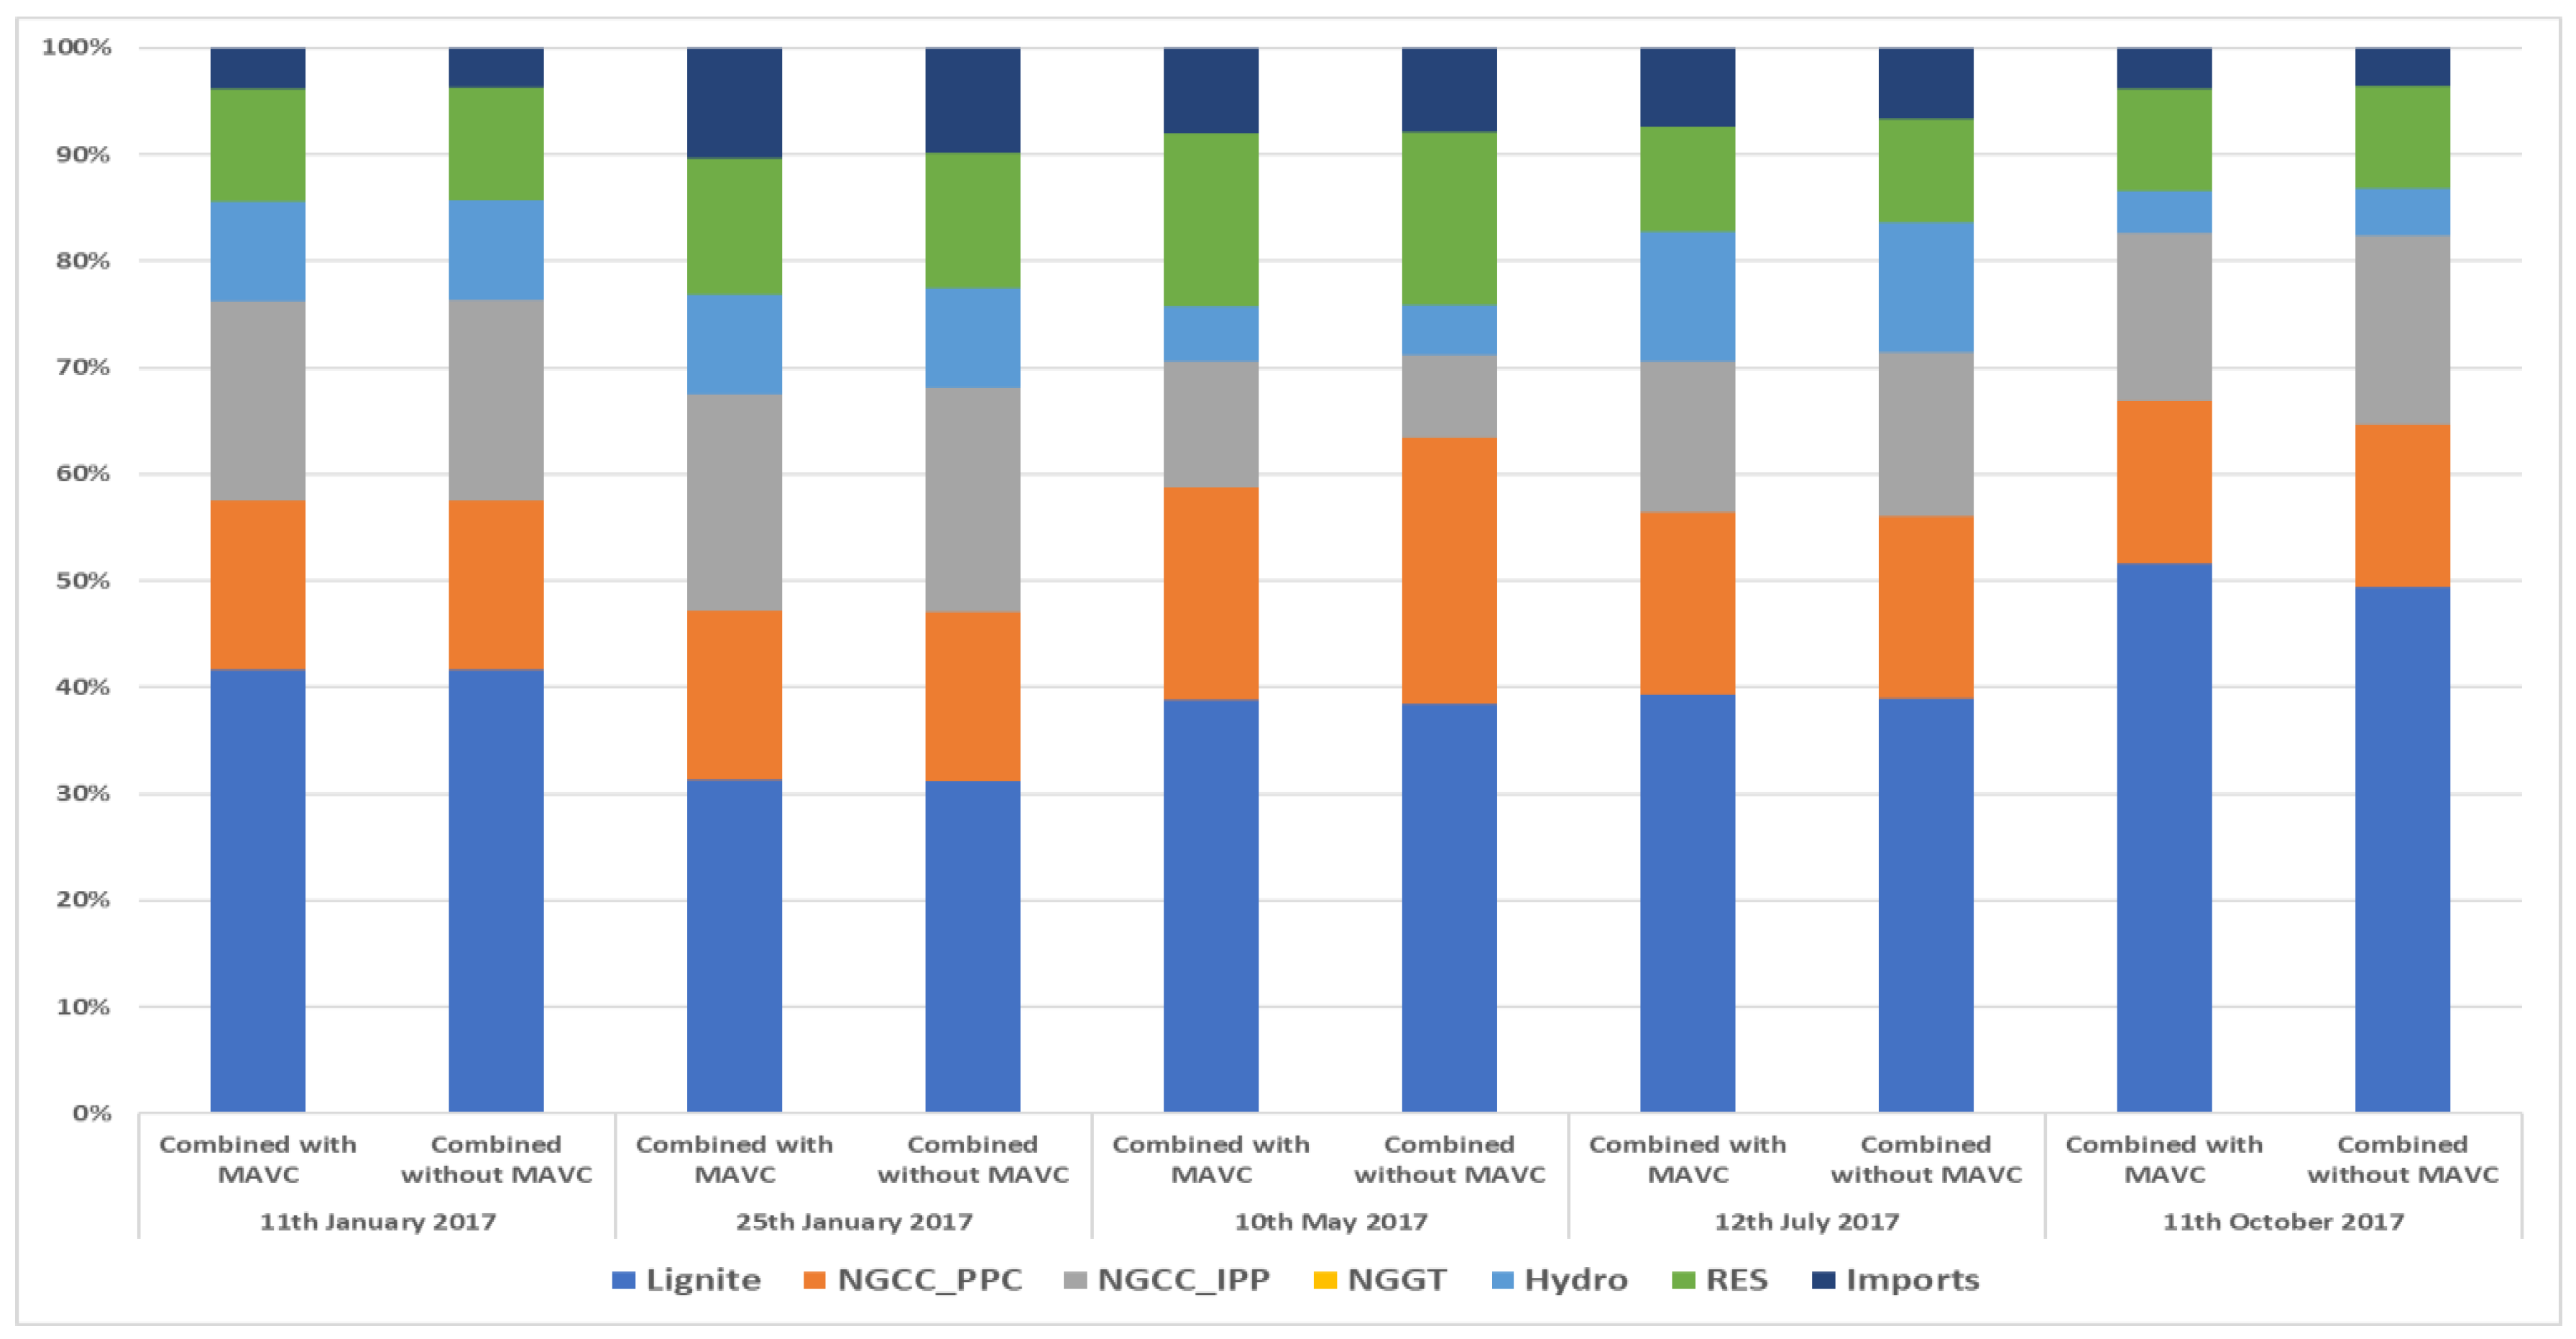
Figure 6 provides the evolution of daily energy mix shares (in %) in scenarios focusing on complex orders, for the typical days of 25 January, 10 May 2017, 12 July, and 11 October 2017, respectively.
5.3. Results Analysis and Policy Recommendations
From the examined scenarios, the following conclusions can be derived.
- The consideration of MAVC restriction in bids by units does not considerably affect the average System Marginal Price (SMP) for the examined scenarios. The difference in similar scenarios when considering or not the MAVC is negligible is several scenarios, with the vast majority of differences being up to 2 €/MWh.
- Exceptions are few cases examined in the sensitivity analyses, for typical days in seasons with low demand, autumn, and spring. More specifically, differences are considerable, at the level of 10 €/MWh in cases with “low demand”, “high RES and low demand”, “high RES and low demand” scenarios.
- The effect of MAVC in SMP was also noted to be considerable in preliminary results, i.e., at the level of 10 €/MWh, in cases where all PPC thermal units are available. However, those conditions were not evident in the examined cases.
- The effect of MAVC constraint on the energy mix is similar to the effect on the SMP, namely that there are no considerable changes in the dispatch schedules in the majority of the examined scenarios, with the exceptions of sensitivity analyses.
- The enhancement of exports is in line with lower SMP prices.
- Sensitivity analysis provides useful insights for the examined scenarios, especially concerning the level of SMP, in alliance with the net demand evolution.
- A key conclusion from the sensitivity analysis is that in the case where six lignite units are “decommissioned”, they complete their minimum operating hours for environmental restrictions. This stands as a possible scenario in the upcoming years, leading to a situation with limited availability of capacity and therefore increased possibility for considerable increase of SMP. Moreover, for the period up to the commissioning of a new lignite unit, RAE and ADMIE could explore the consideration of their operation and compensation for cold-reserve services, to enhance the security of supply.
- There were big differences between the actual DAS results and the examined simple hourly scenarios in some typical days, resulting from the differences in the bidding strategy adopted for the thermal units and the actual bidding strategy on those typical days. The implementation of the same bidding strategy, as in the DAS results, would lead to a decrease—but relatively small-in SMP—as the simple hourly orders lead to elimination of the whole energy system cost, compared to the unit commitment problem, which incorporates techno-economic constraints.
- PPC, as a net consumer, has more benefits and fewer risks from a market without MAVC restriction. The abolishment of MAVC enhances its capability to eliminate the risk of shutdowns of thermal units. IPPs have more risks without MAVC restriction, concerning the profitable dispatching of their units, especially in days with low demand.
- In the scenario with MAVC and the decommissioning of six lignite units, net consumers (PPC and alternative suppliers whose retail activity exceeds their “supply” portfolio) face the risk of a potential increase in SMP.
- Although simple hourly orders result in the cost optimum solution, they lead to more unrealistic dispatch schedule, as there can be up to nine thermal units shutdown and/or started-up, while the number of start-ups and shutdowns in total can exceed 10 in a typical day for the scenarios examined, highlighting the importance of other order types and bilateral contracts.
- Block, linked-block, and MIC order types are options for producers that enable power plants to avoid shutdown of their units and maintain realistic dispatch schedules. However, the inclusion of several order types (blocks, linked blocks, and MICs) in the Day-Ahead Market, increases the complexity and computational cost of the solution and enhances nonlinear evolution of SMP. The potential use of those options from all thermal units (overuse of options) eliminate flexibility in offered energy and create a risk for unfavorable solutions i.e., demand curtailment, as well as unrealistic schedules (for providing ancillary services) in the balancing market and huge deviations in hourly SMP prices within a typical day. This has led to the examination of combined scenarios, where results show more “normal” schedules.
- The abolishment of uplifts accounts, for compensating shutdown costs and minimum variable cost recovery mechanism, creates a risk of profitless operation of thermal units.
- Thermal units cannot easily compensate the “shutdown cost” from wholesale markets, as it is high. The consideration of MIC orders (with shutdown cost as the fixed term) leads to unrealistic solutions, due to this incapability of units to compensate this cost.
- For the examined scenarios, the risk of all thermal units of compensating their MAVC is lower compared to the risk of covering their shutdown cost.
- We consider that the highest risk for profit-less operation for all thermal power plants, both from PPC and IPPs, in the new wholesale market is their incapability to recover “shutdown cost” considering the actual techno-economic declarations made in the DAS. Therefore, we identified that an important priority of thermal power plants, besides Open Cycle Gas Turbines (OCGT), is to “guarantee” their operation at least at their technical minimum for all 24 h in each typical day in profitable conditions.
- Towards this direction, thermal power plants can explore different strategies:
- Using of block, linked-block, and Minimum Income Condition orders which, however,
- ○
- leads to operation of fewer units, and creates higher uncertainty of hourly SMP evolution (nonlinear evolution of SMP)
- In the case without MAVC and hourly orders, units can also eliminate this phenomenon by bidding lower of their MAVC for their first step (technical minimum), which causes them to operate at least at the technical minimum for the whole day;
- ○
- in the case where all thermal units, both from PPC and IPPs (besides OCGT), bid at the “shutdown avoidance cost”, there is not a single shutdown in simple “hourly orders without MAVC 3” scenario
- For the examined scenarios, the risk of compensating MAVC is eliminated, compared to preliminary results with all PPC thermal units available, which has led to profitless operation of units.
- IPPs can explore potential strategies in increasing their profitability in the intraday and especially in the balancing market (price spikes), taking advantage of deviations in demand, RES production, and potential partial unavailability or unexpected outages of PPC lignite units, irrespectively of the existence of the MAVC restriction.
The analysis undertaken manages to provide insights on the features of the EUPHEMIA algorithm, also considering crucial aspects that affect decision-making, such as the market share of market participants, the power capacity developments, the potential of renewables, the strategy by market participants, as well potential regulatory constraints on bidding strategy. However, it is also important to examine this analysis from other perspectives. The regulator, as well as any decision-maker that aims at increasing the social welfare of an energy market, has the overall objective of reducing the cost for the final consumer and the economy. Within this objective, the analysis undertaken provides a clear signal that the consideration only of hourly orders, from the different EUPHEMIA order types, leads to a reduction in day-ahead wholesale price. Although reductions in wholesale prices do not always lead to relevant reductions in retail market, we can judge that this is a positive effect, especially for the high voltage industrial consumers, which follow the developments in the wholesale market. However, the adoption of hourly orders creates a risk for producers, not only because of the expected wholesale price reductions, but also for the unrealistic dispatch schedules. This creates threats for potential profit losses, as the shutdown cost is not compensated through supplementary accounts, as in the regulated mandatory pool. The threat for profitless operation can be high enough, as producers might not only be in danger of compensating their capital cost but also their short-term variable cost. This fact, especially if it is long-lasting, is not welcome by the regulator and/or the social planner. The reason is that the producers are not motivated to participate in a market that creates considerable and long-lasting profit losses for them, leading even to decisions to de-invest. This creates a risk for security of supply and for attracting new investments. Therefore, the reduction in wholesale price should not be the only aim of a decision-maker, as social welfare should concern that all market participants do not have long-lasting viability threats from the market operation.
The consideration of other order types aims to tackle those problems, as they enhance the capability for provision of realistic dispatch schedules. However, the inclusion of several order types (blocks, linked blocks, MICs) in the day-ahead market increases the complexity and computational cost of the solution and enhances nonlinear evolution of the wholesale price. The potential use of those options from all thermal units (overuse of options) can eliminate flexibility in offered energy and create a risk for unfavorable solutions, i.e., demand curtailment, as well as unrealistic schedules (for providing ancillary services) in the balancing market and huge deviations in hourly wholesale prices. Therefore, it is suggested that the regulator provides options for the producers, but it should monitor the market to examine potential abuse of those options, that might affect system stability, as well as a stochastic evolution of wholesale price. The reason is that the provision of clear price signals is important for the operation of all connected markets, namely intraday, balancing, and forward markets. The provision of “wrong” or highly uncertain price signal affect investments and the security of supply in the long-term.
The regulator has the role to establish an efficient and competitive market. Regulatory interventions should be avoided, as this allows the provision of clear price signals. Therefore, market interventions through regulatory restrictions, such as on bidding strategy, should be considered in relation to domestic market conditions, such as portfolios and market power by market participants, but also in relation to regional market conditions, such as the process of market coupling with neighboring markets, adopting identical market conditions for enhancing regional competition. In the long-term, regional integration offsets and supplements characteristics in the domestic market. Therefore, the provision of clear rules in the long-term is the main way for the regulator to enhance market competition.
In this framework, regulatory interventions should be avoided and be limited, not only concerning short-term market operation but also long-term energy planning. The provision of support for new technologies, such as renewables, storage, and electric vehicles, should be in consideration of the national economic policy. If a support scheme works against national balances, through balances of trade or considerable increase of energy cost for consumers and companies, they should be eliminated. The case of Greece, which is a technology importer and not exporter, belongs in this category, so any support schemes in new technologies should be limited until the market conditions of those technologies become more mature. The potential rapid reduction in their capital cost, as happened in the case of photovoltaics, show that the delayed implementation of such policies can be smart and beneficial. Regulatory or policy interventions should also consider the effect on short-term market operation, as the penetration of new technologies should consider the need for supplementary services, such as balancing and ramping capability. There can be cases, where the fast penetration of technologies, create need for further infrastructure to provide supplementary services, which leads to overcapacity and therefore increase the overall energy cost for final consumers or create conditions where investments are not profitable. The technology and market developments provide clear insights that the evolution of a low carbon economy has strong potential for Greece. However, the pathway towards this direction should be done, under the consideration of the overall economic situation.
6. Conclusions
A vital component in the process of development of a functioning internal electricity market in the EU is the adoption by each member state of the same algorithm for the solution of the day-ahead market: EUPHEMIA. However, the efficient market design of electricity wholesale markets is done at national/regional level, as the consideration of the characteristics of the power systems and of the market participants enables a more realistic representation of the implementation of the “Target Model”.
The literature review shows an increasing number of papers on the EUPHEMIA algorithm and towards the integration of European electricity markets. The review also identifies the need for market design research at national/regional level, as the consideration of the characteristics of the power systems and market participants enables a more realistic representation of the implementation of the “Target Model”.
The decision-making of the market design is done at national level, considering the local power system and power market characteristics. This paper aims to provide a comprehensive analysis on the adoption of EUPHEMIA’s algorithm on the Greek wholesale market, based on a relevant research project funded by the Joint Research Centre of the European Commission to support the Hellenic Regulatory Authority of Energy on the decision making. It examines different EUPHEMIA order types, their use by market participants, the relative competitiveness of power generators, the impact of interconnected markets, the existence of market players with dominant positions, the existence of specific regulation, such as the minimum average variable cost restriction on offers by producers, and the strategy of market participants depending on their relative competitiveness, which are important factors in real decision making.
In a running economic dispatch model that the Energy & Environmental Policy laboratory operates, different types of orders of the EUPHEMIA algorithm have been incorporated, such as hourly orders, block orders, flexible blocks, and complex orders with a minimum income condition. A considerable number of scenarios have been created, examining different combinations of order types and bidding strategy by the thermal power plants and market participants (PPC and IPPs), as well as the consideration of the Minimum Average Variable Cost (MAVC) restriction.
The paper provides insights on the effect of MAVC constraints and on the EUPHEMIA order types. The main conclusions, from the analysis undertaken, are:
- In the examined scenarios (where only technical minimum is bid below MAVC), the impact of consideration of MAVC constraint is not considerable, being at the level of 0 to 2 €/MWh in the vast majority of scenarios.
- Block, linked-block, and MIC order types are options that enable the power plants to avoid shutdown of their units and have realistic dispatch schedules. However, they enhance the nonlinear evolution of SMP, while the overuse of those options by market participants eliminate flexibility in offered energy and, therefore, might lead to high deviations in hourly SMP and unrealistic schedules (for providing ancillary services) in the balancing market.
The paper contributes to the relevant literature on the quantification of the impacts of the EUPHEMIA algorithm in case of the Greek wholesale market, providing insights on the crucial aspects affecting real decision-making. Although the examined scenarios are numerous and indicative of potential and realistic scenarios, there are always eliminations that could be further explored, such as the consideration of different bidding strategies for hydro plants and/or the consideration of bilateral contracts in the Day Ahead Market.
The paper also analyses the role of the regulator and/or the social planner, as regulatory reforms should be considered from different perspectives. The overall target is the provision of affordable energy services to final consumers; however, this should not undermine potential threats for security of supply and lack of investments in the long-term. Regulatory interventions should be avoided or eliminated, as they do not allow the provision of clear price signals. Regulatory reforms and energy policy should provide clear rules for the long-term, considering the characteristics of the domestic and regional energy systems and markets. Under this framework, it is important that in planning the evolution towards low carbon economy to consider the characteristics of national economy, as well as the short-term and long-term characteristics of the power system.
Author Contributions
N.K. and A.D. performed the research and wrote the paper.
Acknowledgments
The research is based on a project funded by the Joint Research Centre, European Commission to support the Hellenic Regulatory Authority of Energy in their decisions toward adopting the target model in the Greek wholesale electricity market. We would like to thank for the comments and suggestions provided by JRC staff (Tilemachos Efthimiadis), Hellenic Regulatory Authority of Energy (RAE) staff (Nektaria Karakatsani, Olga Filippopoulou, Vassilis Papandreou), and Hellenic Electricity Market Operator (LAGIE) staff: Aristides Tassoulis, Christoforos Zoumas, Nikolaos Ziogos, and Christos Nakos.
Conflicts of Interest
The authors declare no conflict of interest.
Abbreviations
| ACER | Association of Energy Regulators |
| ADMIE | Hellenic Independent Transmission System Operator |
| ATC | Available Transfer Capacity |
| CACM | Capacity Allocation and Congestion Management |
| CCGT | Combined Cycle Gas Turbine |
| CWE | Central Western Europe |
| DAS | Day Ahead Schedule |
| E2PL | Energy and Environmental Policy Laboratory |
| ENTSOE | European Network Association of Transmission System Operators in Electricity |
| EUPHEMIA | Pan-European Hybrid Electricity Market Integration Algorithm |
| FB | Flow Based |
| FT | Fixed Term |
| FYROM | Former Yugoslav Republic of Macedonia |
| GME | Gestore dei Mercati Energetici SpA |
| IPP | Independent Power Producers |
| JRC | Joint Research Centre |
| LAGIE | Hellenic Electricity Market Operator |
| MAVC | Minimum Average Variable Cost |
| MIC | Minimum Income Condition |
| MILP | Mix Integer Linear Programming |
| NCAP | Net Capacity |
| NG | Natural Gas |
| NGCC | Natural Gas Combined Cycle units |
| NRA | National Regulatory Authority |
| NWE | North Western Europe |
| OCGT | Open Cycle Gas Turbines |
| PAO | Paradoxically Accepted Orders |
| PPC | Public Power Corporation SA |
| RAE | Hellenic Regulatory Authority of Energy |
| RES | Renewable Energy Sources |
| SMP | System Marginal Price |
| TSO | Transmission System Operator |
| UPRC | University of Piraeus Research Centre |
| VT | Variable Term |
References
- N-SIDE. Available online: https://www.n-side.com/pcr-euphemia-algorithm-european-power-exchanges-price-coupling-electricity-market/ (accessed on 10 October 2018).
- PCR Status Update: European Stakeholder Committee. Available online: https://docstore.entsoe.eu/Documents/Network%20codes%20documents/Implementation/stakeholder_committees/MESC/2017-06-08/Background%20info%20-%20EuphemiaPerformance_MESC_JUN_2017.pdf (accessed on 10 October 2018).
- Koltsaklis, N.E.; Dagoumas, A.S.; Georgiadis, M.C.; Papaioannou, G.; Dikaiakos, C. A mid-term, market-based power systems planning model. Appl. Energy 2016, 179, 17–35. [Google Scholar] [CrossRef]
- Koltsaklis, N.E.; Nazos, K. A stochastic MILP energy planning model incorporating power market dynamics. Appl. Energy 2017, 205, 1364–1383. [Google Scholar] [CrossRef]
- Koltsaklis, N.E.; Liu, P.; Georgiadis, M.C. An integrated stochastic multi-regional long-term energy planning model incorporating autonomous power systems and demand response. Energy 2015, 82, 865–888. [Google Scholar] [CrossRef]
- Dagoumas, A.S.; Koltsaklis, N.E.; Panapakidis, I.P. An integrated model for risk management in electricity trade. Energy 2017, 124, 350–363. [Google Scholar] [CrossRef]
- Dagoumas, S.D.; Polemis, M.L. An integrated model for assessing electricity retailer’s profitability with demand response. Appl. Energy 2017, 198, 49–64. [Google Scholar] [CrossRef]
- Ringler, P.; Keles, D.; Fichtner, W. How to benefit from a common European electricity market design. Energy Policy 2017, 101, 629–643. [Google Scholar] [CrossRef]
- Newbery, D.; Strbac, G.; Viehoff, I. The benefits of integrating European electricity markets. Energy Policy 2016, 94, 253–263. [Google Scholar] [CrossRef] [Green Version]
- Boffa, F.; Sapio, A. Introduction to the special issue “The regional integration of energy markets”. Energy Policy 2015, 85, 421–425. [Google Scholar] [CrossRef]
- Newbery, D. Missing money and missing markets: Reliability, capacity auctions and interconnectors. Energy Policy 2016, 94, 401–410. [Google Scholar] [CrossRef]
- Gómez, P.M. Benefits of market coupling in terms of social welfare. In Regulation and Investments in Energy Markets Solutions for the Mediterranean; Rubino, A., Campi, M.T.C., Lenzi, V., Ozturk, I., Eds.; Academic Press: Cambridge, MA, USA, 2016; pp. 185–198. [Google Scholar]
- Glachant, J.-M.; Ruester, S. The EU internal electricity market: Done forever? Utilities Policy 2014, 31, 221–228. [Google Scholar] [CrossRef] [Green Version]
- Oggioni, G.; Smeers, Y. Market failures of Market Coupling and counter-trading in Europe: An illustrative model based discussion. Energy Econ. 2013, 35, 74–87. [Google Scholar] [CrossRef]
- Grimm, V.; Martin, A.; Weibelzahl, M.; Zöttl, G. On the long run effects of market splitting: Why more price zones might decrease welfare. Energy Policy 2016, 94, 453–467. [Google Scholar] [CrossRef]
- Santos, G.; Pinto, T.; Morais, H.; Sousa, T.M.; Pereira, I.F.; Fernandes, R.; Praça, I.; Vale, Z. Multi-agent simulation of competitive electricity markets: Autonomous systems cooperation for European market modeling. Energy Convers. Manag. 2015, 99, 387–399. [Google Scholar] [CrossRef]
- Lam, L.H.; Ilea, V.; Bovo, C. European day-ahead electricity market coupling: Discussion, modeling, and case study. Electr. Power Syst. Res. 2018, 155, 80–92. [Google Scholar] [CrossRef]
- Chatzigiannis, D.I.; Dourbois, G.A.; Biskas, P.N.; Bakirtzis, A.G. European day-ahead electricity market clearing model. Electr. Power Syst. Res. 2016, 140, 225–239. [Google Scholar] [CrossRef]
- Sleisz, A.; Raisz, D. Complex supply orders with ramping limitations and shadow pricing on the all-European day-ahead electricity market. Int. J. Electr. Power Energy Syst. 2016, 83, 26–32. [Google Scholar] [CrossRef]
- Sleisz, A.; Raisz, D. Integrated mathematical model for uniform purchase prices on multizonal power exchanges. Electr. Power Syst. Res. 2017, 147, 10–21. [Google Scholar] [CrossRef]
- Meeus, L.; Verhaegen, K.; Belmans, R. Block order restrictions in combinatorial electric energy auctions. Eur. J. Oper. Res. 2009, 196, 1202–1206. [Google Scholar] [CrossRef] [Green Version]
- Madani, M.; Vyve, M.V. Revisiting minimum profit conditions in uniform price day-ahead electricity auctions. Eur. J. Oper. Res. 2018, 266, 1072–1085. [Google Scholar] [CrossRef] [Green Version]
- Biskas, P.N.; Marneris, I.G.; Chatzigiannis, D.I.; Roumkos, C.G.; Bakirtzis, A.G.; Papalexopoulos, A. High-level design for the compliance of the Greek wholesale electricity market with the Target Model provisions in Europe. Electr. Power Syst. Res. 2017, 152, 323–341. [Google Scholar] [CrossRef]
- Biskas, P.N.; Chatzigiannis, D.I.; Bakirtzis, A.G. Market coupling feasibility between a power pool and a power exchange. Electr. Power Syst. Res. 2013, 104, 116–128. [Google Scholar] [CrossRef]
- Nepal, R.; Jamasb, T. Interconnections and market integration in the Irish Single Electricity Market. Energy Policy 2012, 51, 425–434. [Google Scholar] [CrossRef]
- Cosmo, V.D.; Lynch, M.Á. Competition and the single electricity market: Which lessons for Ireland? Utilities Policy 2016, 41, 40–47. [Google Scholar] [CrossRef] [Green Version]
- Tanrisever, F.; Derinkuyu, K.; Jongen, G. Organization and functioning of liberalized electricity markets: An overview of the Dutch market. Renew. Sustain. Energy Rev. 2015, 51, 1363–1374. [Google Scholar] [CrossRef] [Green Version]
- Keles, D.; Bublitz, A.; Zimmermann, F.; Genoese, M.; Fichtner, W. Analysis of design options for the electricity market: The German case. Appl. Energy 2016, 183, 884–901l. [Google Scholar] [CrossRef]
- Pape, C.; Hagemann, S.; Weber, C. Are fundamentals enough? Explaining price variations in the German day-ahead and intraday power market. Energy Econ. 2016, 54, 376–387. [Google Scholar] [CrossRef] [Green Version]
- Graf, C.; Wozabal, D. Measuring competitiveness of the EPEX spot market for electricity. Energy Policy 2013, 62, 948–958. [Google Scholar] [CrossRef]
- Pellini, E. Measuring the impact of market coupling on the Italian electricity market. Energy Policy 2012, 48, 322–333. [Google Scholar] [CrossRef]
- Figueiredo, N.C.; Silva, P.P.; Cerqueira, P.A. Evaluating the market splitting determinants: Evidence from the Iberian spot electricity prices. Energy Policy 2015, 85, 218–234. [Google Scholar] [CrossRef]
- PCR. EUPHEMIA Public Description. December 2016. Available online: https://www.nordpoolspot.com/globalassets/download-center/pcr/euphemia-public-documentation.pdf (accessed on 15 September 2018).
- Koltsaklis, N.; Dagoumas, A. Incorporating unit commitment aspects to the European electricity markets algorithm: An optimization model for the joint clearing of energy and reserve markets. Appl. Energy 2018, 231, 235–258. [Google Scholar] [CrossRef]
- Koltsaklis, N.E.; Dagoumas, A.S.; Panapakidis, I.P. Impact of the penetration of renewables on flexibility needs. Energy Policy 2017, 109, 360–369. [Google Scholar] [CrossRef]
- ADMIE Power Units Register. Available online: http://www.admie.gr/en/operations-data/registers/generation-unit-register/production-units-in-units-register (accessed on 10 October 2018).
- GAMS Development Corporation. GAMS—A User’s Guide. Available online: https://www.gams.com/24.8/docs/userguides/GAMSUsersGuide.pdf (accessed on 14 August 2018).
Figure 1.
Graphical representation of the Greek interconnected power system (source: ENTSOE).

Figure 2.
Evolution of average system marginal price, for the typical day of 10 May 2017, in scenarios with hourly orders.
Figure 2.
Evolution of average system marginal price, for the typical day of 10 May 2017, in scenarios with hourly orders.

Figure 3.
Evolution of hourly system marginal price, for the typical day of 10 May 2017, in scenarios with hourly orders.
Figure 3.
Evolution of hourly system marginal price, for the typical day of 10 May 2017, in scenarios with hourly orders.

Figure 4.
Evolution of the daily energy mix shares (in %), for the typical day of 10 May 2017, in scenarios with hourly orders.
Figure 4.
Evolution of the daily energy mix shares (in %), for the typical day of 10 May 2017, in scenarios with hourly orders.

Figure 5.
Evolution of daily energy mix shares (in %), for the typical day of 10 May 2017, in scenarios focusing on block orders.
Figure 5.
Evolution of daily energy mix shares (in %), for the typical day of 10 May 2017, in scenarios focusing on block orders.

Figure 6.
Evolution of daily energy mix shares (in %), in scenarios with combined orders, for different typical days.
Figure 6.
Evolution of daily energy mix shares (in %), in scenarios with combined orders, for different typical days.


Table 1.
List of hourly orders scenarios.
| Hourly Orders Scenarios | Short Description |
|---|---|
| DAS results | Actual solution of the Day Ahead Schedule solved by LAGIE |
| Simple with MAVC | All thermal units bid with hourly orders and Minimum Average Variable Cost restriction. PPC lignite-fired and natural gas plants bid at minimum variable cost plus a minor increase (+0.001 €/MWh) in each of ten steps. IPP NGCC units bid with the scarcity price method (based on comparison of its MAVC with PPC lignite units’ MAVC, and considering demand, RES, net imports, and PPC thermal unit availability). The scarcity pricing strategy is defined as:
|
| Simple without MAVC 1 | PPC lignite-fired plants bid at their “shutdown cost avoidance price” (here set at 0 €/MWh) for their technical minimum, while the rest of their capacity is bid in nine equal blocks at their minimum variable cost +0.001 €/MWh for each block. All the other units bid with the same methodology as in the “Simple with MAVC” scenario. |
| Simple without MAVC 2 | PPC NGCC plants bid at their “shutdown cost avoidance price”, while the rest of their capacity is bid in nine equal blocks at their minimum variable cost +0.001 €/MWh for each block. PPC lignite-fired plants bid with the same methodology as in “Simple without MAVC 1” scenario. All the other units bid with the same methodology as in the “Simple with MAVC” scenario. |
| Simple without MAVC 3 | IPP NGCC plants bid their technical minimum at their “shutdown cost avoidance price”, while the rest of their capacity with the scarcity pricing method described above. All the other units bid with the same methodology as in the “Simple without MAVC 2” scenario. |
| Simple with MAVC, sensitivity 1 | “Simple with MAVC” scenario with high demand (volumes in load orders are increased by 15% in all hours) |
| Simple with MAVC, sensitivity 2 | “Simple with MAVC” scenario with low demand (volumes in load orders are decreased by 15% in all hours) |
| Simple with MAVC, sensitivity 3 | “Simple with MAVC” scenario with high RES (volumes of RES production are increased by 15% in all hours) with high demand (as described above) |
| Simple with MAVC, sensitivity 4 | “Simple with MAVC” scenario with high RES (volumes of RES production are increased by 15% in all hours) with low demand (as described above) |
| Simple with MAVC, sensitivity 5 | “Simple with MAVC” scenario with six lignite units (Amyntaio 1–2 and Kardia 1–4) are decommissioned (for reference demand and RES production) |
| Simple with MAVC, sensitivity 6 | “Simple with MAVC” scenario with six lignite units (Amyntaio 1–2 and Kardia 1–4) are decommissioned and Ptolemaida V is commissioned (for reference demand and RES production) |
| Simple without MAVC 3, sensitivity 1 | “Simple without MAVC 3” scenario with high demand (volumes in load orders are increased by 15% in all hours) |
| Simple without MAVC 3, sensitivity 2 | “Simple without MAVC 3” scenario with low demand (volumes in load orders are decreased by 15% in all hours) |
| Simple without MAVC 3, sensitivity 3 | “Simple without MAVC 3” scenario with high RES (volumes of RES production are increased by 15% in all hours) with high demand (as described above) |
| Simple without MAVC 3, sensitivity 4 | “Simple without MAVC 3” scenario with high RES (volumes of RES production are increased by 15% in all hours) with low demand (as described above) |
| Simple without MAVC 3, sensitivity 5 | “Simple without MAVC 3” scenario with six lignite units (Amyntaio 1–2 and Kardia 1–4) are decommissioned (for reference demand and RES production) |
| Simple without MAVC 3, sensitivity 6 | “Simple without MAVC 3” scenario with six lignite units (Amyntaio 1–2 and Kardia 1–4) are decommissioned and Ptolemaida V is commissioned (for reference demand and RES production |
Table 2.
List of block orders scenarios.
| Block Orders | Short Description |
|---|---|
| Updated simple with MAVC | All thermal units bid with the same methodology as in the “Simple with MAVC” scenario. Bids in interconnections are dynamically formulated (as described below), and not incorporated as they have actually bid in the DAS. |
| Only lignite bid with blocks (with MAVC) | Lignite-fired units bid with block orders which are assumed to be regular blocks, where power plants bid their whole capacity in one block for all hours 1 to 24 at their MAVC, with the Minimum Acceptance Ratio equal to the ratio of the technical minimum/NCAP of each unit. The rest thermal units (NGCC-PPC, NGCC-IPP, and OGCT) bid with hourly orders as in the “Simple with MAVC” scenario. Bids in interconnections are dynamically formulated, and not incorporated as they actually bid in the DAS |
| Only PPC NGCC units bid with blocks (with MAVC) | Natural gas-fired combined cycle units owned by PPC bid with block orders which are assumed to be regular blocks, where power plants bid their whole capacity in one block for all hours 1 to 24 at their MAVC, with the Minimum Acceptance Ratio equal to the ratio of the technical minimum/NCAP of each unit. The rest thermal units bid with hourly orders (Lignite, NGCC-IPP, and OGCT) as in the “Simple with MAVC” scenario. Bids in interconnections are dynamically formulated, and not incorporated as they actually have bid in the DAS. |
| Only IPPs NGCC units bid with blocks (with MAVC) | Natural gas-fired combined cycle units owned by IPPs bid with block orders which are assumed to be regular blocks, where power plants bid their whole capacity in one block for all hours 1 to 24 at their MAVC, with the Minimum Acceptance Ratio equal to the ratio of the technical minimum/NCAP of each unit. The rest thermal units bid with hourly orders (Lignite, NGCC-PPC, and OGCT) as in the “Simple with MAVC” scenario. Bids in interconnections are dynamically formulated, and not incorporated as they have actually bid in the DAS. |
| Lignite, PPC NGCC, and IPPs NGCC units bid with blocks (with MAVC) | Lignite-fired and natural gas-fired combined cycle units bid with block orders which are assumed to be regular blocks, where power plants bid their whole capacity in one block for all hours 1 to 24 at their MAVC, with Minimum Acceptance Ratio equal to the ratio of the technical minimum/NCAP of each unit. The rest thermal units (OGCT) bid with hourly orders as in the “Simple with MAVC” scenario. Bids in interconnections are dynamically formulated, and not incorporated as they have actually bid in the DAS. |
| Updated simple without MAVC 3 | All thermal units bid with the same methodology as in the “Simple without MAVC 3” scenario. Bids in interconnections are dynamically formulated, and not incorporated as they have actually bid in the DAS. |
| Only lignite bid with blocks (without MAVC 3) | Each of the lignite-fired units bids its capacity with block orders in three independent blocks, which are assumed to be regular blocks. In particular, the first block, being equal to the unit’s technical minimum in all cases, is bid with the unit’s shutdown cost avoidance price, while the rest of its capacity is bid at its minimum variable cost plus a minor increase (+0.001 €/MWh) in each of the two remaining blocks. The rest thermal units bid with the same methodology as in the “Simple without MAVC 3” scenario. Bids in interconnections are dynamically formulated, and not incorporated as they have actually bid in the DAS. |
| Only PPC NGCC units bid with blocks (without MAVC 3) | Each of the natural gas-fired combined cycle units owned by PPC bids with the same methodology as the lignite-fired units in the previous scenario “Only lignite bid with blocks (without MAVC 3)”. The rest thermal units bid with the same methodology as in the “Simple without MAVC 3” scenario. Bids in interconnections are dynamically formulated, and not incorporated as they have actually bid in the DAS. |
| Only IPPs NGCC units bid with blocks (without MAVC 3) | Each of the natural gas-fired combined cycle units owned by IPPs, follows the same methodology of PPC’s natural gas-fired combined cycle units as in the previous scenario “Only PPC NGCC units bid with blocks (without MAVC 3)” for its first block (technical minimum). The unit’s second block is bid at its MAVC plus an increase of 5 €/MWh, while the third block is bid at its MAVC plus an increase of 25 €/MWh. The rest thermal units bid with the same methodology as in the “Simple without MAVC 3” scenario. Bids in interconnections are dynamically formulated, and not incorporated as they have actually bid in the DAS. |
| Lignite, PPC NGCC and IPPs NGCC units bid with blocks (without MAVC 3) | Lignite-fired units bid as in the “Only lignite bid with blocks (without MAVC 3)” scenario. Natural gas-fired units owned by PPC bid as in the “Only PPC NGCC units bid with blocks (without MAVC 3)” scenario, while natural gas-fired units owned by PPC bid as in the “Only IPPs NGCC units bid with blocks (without MAVC 3)” scenario. Open cycle gas turbines bid with simple hourly orders as in the “Simple with MAVC” scenario. Bids in interconnections are dynamically formulated, and not incorporated as they have actually bid in the DAS. |
Table 3.
List of combined orders scenarios.
| Combined Orders Scenarios | Short Description |
|---|---|
| Combined with MAVC | Lignite-fired units bid with block orders with the same methodology as in the “Only lignite bid with blocks (with MAVC)” scenario. Natural gas-fired units owned by PPC bid with linked block orders. In particular, a parental and two linked block orders are employed. Parental order is set for technical minimum capacity at MAVC, where two linked-blocks are set for hours 9 to 24 and 18 to 23 for IPPs. The prices of those two linked blocks are given at its MAVC plus a minor increase (+0.001 €/MWh for the first linked block and +0.002 €/MWh for the second linked block). Natural gas-fired units owned by IPPs bid with the same methodology as in the “Simple with MAVC” scenario, requiring also the cost recovery of their MAVC (variable term) and their shutdown cost (fixed term) imposing Minimum Income Conditions in several combinations. OGCT units bid with the same methodology as in the “Simple with MAVC” scenario. Bids in interconnections are dynamically formulated, and not incorporated as they actually have bid in the DAS. Bids for overmandatory hydroelectric production based on their actual bidding in the typical days. |
| Combined without MAVC | Lignite-fired units bid with block orders with the same methodology as in the “Only lignite bid with blocks (without MAVC 3)” scenario. Natural gas-fired units owned by PPC bid with linked block orders. In particular, a parental and two linked block order are employed for each unit. The parental order is set for technical minimum capacity at the unit’s shutdown cost avoidance price, while two linked-blocks are set for hours 9 to 24 and 18 to 23 for IPPs. The prices of those two linked blocks are given at its MAVC plus a minor increase (+0.001 €/MWh for the first linked block and +0.002 €/MWh for the second linked block). Natural gas-fired units owned by IPPs bid with the same methodology as in the “Simple without MAVC 3” scenario, requiring also the cost recovery of their MAVC (variable term) and their shutdown cost (fixed term) imposing Minimum Income Conditions in several combinations. OGCT units bid with the same methodology as in the “Simple with MAVC” scenario. Bids in interconnections are dynamically formulated, and not incorporated as they actually have bid in the DAS. Bids for overmandatory hydroelectric production based on their actual bidding in the typical days. |
Table 4.
Number of thermal power units that have been shutdown and/or started-up, for the typical day of 25 January 2017, in scenarios with hourly orders.
Table 4.
Number of thermal power units that have been shutdown and/or started-up, for the typical day of 25 January 2017, in scenarios with hourly orders.
| DAS Results | Simple with MAVC | Simple with MAVC 1 | Simple with MAVC 2 | Simple with MAVC 3 | |
|---|---|---|---|---|---|
| Lignite | 0 | 1 | 0 | 0 | 0 |
| NGCC_PPC | 0 | 2 | 2 | 0 | 0 |
| NGCC_IPP | 2 | 4 | 4 | 4 | 0 |
| Total | 2 | 7 | 6 | 4 | 0 |
Table 5.
Number of thermal power units that have been shutdown and/or started-up, for the typical day of 10 May 2017, in scenarios with hourly orders.
Table 5.
Number of thermal power units that have been shutdown and/or started-up, for the typical day of 10 May 2017, in scenarios with hourly orders.
| DAS Results | Simple with MAVC | Simple with MAVC 1 | Simple with MAVC 2 | Simple with MAVC 3 | |
|---|---|---|---|---|---|
| Lignite | 0 | 2 | 0 | 0 | 0 |
| NGCC_PPC | 0 | 2 | 2 | 0 | 0 |
| NGCC_IPP | 2 | 2 | 3 | 3 | 0 |
| Total | 2 | 6 | 5 | 3 | 0 |
Table 6.
Number of thermal power units that have been shutdown and/or started-up, for the typical day of 12 July 2017, in scenarios with hourly orders.
Table 6.
Number of thermal power units that have been shutdown and/or started-up, for the typical day of 12 July 2017, in scenarios with hourly orders.
| DAS Results | Simple with MAVC | Simple with MAVC 1 | Simple with MAVC 2 | Simple with MAVC 3 | |
|---|---|---|---|---|---|
| Lignite | 0 | 4 | 0 | 0 | 0 |
| NGCC_PPC | 1 | 3 | 3 | 0 | 0 |
| NGCC_IPP | 4 | 0 | 0 | 1 | 0 |
| Total | 5 | 7 | 3 | 1 | 0 |
Table 7.
Number of thermal power units that have been shutdown and/or started-up, for the typical day of 11 October 2017, in scenarios with hourly orders.
Table 7.
Number of thermal power units that have been shutdown and/or started-up, for the typical day of 11 October 2017, in scenarios with hourly orders.
| DAS Results | Simple with MAVC | Simple with MAVC 1 | Simple with MAVC 2 | Simple with MAVC 3 | |
|---|---|---|---|---|---|
| Lignite | 0 | 8 | 0 | 0 | 0 |
| NGCC_PPC | 0 | 0 | 1 | 0 | 0 |
| NGCC_IPP | 2 | 1 | 3 | 3 | 0 |
| Total | 2 | 9 | 4 | 3 | 0 |
© 2018 by the authors. Licensee MDPI, Basel, Switzerland. This article is an open access article distributed under the terms and conditions of the Creative Commons Attribution (CC BY) license (http://creativecommons.org/licenses/by/4.0/).
Share and Cite
MDPI and ACS Style
Koltsaklis, N.; Dagoumas, A. Policy Implications of Power Exchanges on Operational Scheduling: Evaluating EUPHEMIA’s Market Products in Case of Greece. Energies 2018, 11, 2715. https://doi.org/10.3390/en11102715
AMA Style
Koltsaklis N, Dagoumas A. Policy Implications of Power Exchanges on Operational Scheduling: Evaluating EUPHEMIA’s Market Products in Case of Greece. Energies. 2018; 11(10):2715. https://doi.org/10.3390/en11102715
Chicago/Turabian StyleKoltsaklis, Nikolaos, and Athanasios Dagoumas. 2018. "Policy Implications of Power Exchanges on Operational Scheduling: Evaluating EUPHEMIA’s Market Products in Case of Greece" Energies 11, no. 10: 2715. https://doi.org/10.3390/en11102715
Note that from the first issue of 2016, this journal uses article numbers instead of page numbers. See further details here.