Optimal Operation Modes of Virtual Power Plants Based on Typical Scenarios Considering Output Evaluation Criteria

1
State Key Laboratory of Alternate Electrical Power System with Renewable Energy Sources (North China Electric Power University), Baoding 071003, China
2
HUANENG Power International, Inc., Beijing 100031, China
3
State Nuclear Electric Power Planning Design & Research Institute Co., Ltd., Beijing 100095, China
*
Authors to whom correspondence should be addressed.
Energies 2018, 11(10), 2634; https://doi.org/10.3390/en11102634
Submission received: 12 July 2018
/
Revised: 25 September 2018
/
Accepted: 25 September 2018
/
Published: 2 October 2018
Abstract
:Stimulated by the severe energy crisis and the increasing awareness about the need for environmental protection, the efficient use of renewable energy has become a hot topic. The virtual power plant (VPP) is an effective way of integrating distributed energy systems (DES) by effectively deploying them in power grid dispatching or electricity trading. In this paper, the operating mode of the VPP with penetration of wind power, solar power and energy storage is investigated. Firstly, the grid-connection requirements of VPP according to the current wind and solar photovoltaic (PV) grid-connection requirements, and analyzed its profitability are examined. Secondly, under several typical scenarios grouped by a self-organization map (SOM) clustering algorithm using the VPP’s output data, a profit optimization model is established as a guideline for the VPP’s optimal operation. Based on this model, case studies are performed and the results indicate that this model is both feasible and effective.
1. Introduction
With the development of the economy, the demand for energy is increasing, and people’s awareness about energy conservation and environmental protection has gradually increased too. Considering the limitation and negative impact of fossil fuels, renewable energy has become the focus of the global energy industry. Distributed energy systems (DES) offer promising solutions in this context, and their impact on urban power grids has drawn the attention of scholars [1,2]. Distributed generation (DG) has developed rapidly owing to its advantages, such as low pollution, high efficiency, and cost savings in power transmission and transformation infrastructure [3]. However, DGs’ output is random, intermittent and volatile. In addition, DES typically have low capacity and are geographically disperse, which makes it difficult for them to directly participate in power grid dispatch or other activities. Therefore, without proper management schemes, DG resources will have significantly negative impacts on power systems’ security and reliability as their penetration rate increases. In this case, the virtual power plant (VPP) has been proposed as a solution [4]. A VPP integrates multiple types of DG resources through fine control methods and energy management, and can package multiple small-scale DG resources to provide stable and large-scale power output. The objective is to maximize the interests of the power supply customers. VPPs also provide an effective regional platform to integrate large-scale renewable energy systems [5,6,7]. The typical components of a VPP are shown in Figure 1.
A VPP integrates DG resources, energy storage devices, and flexible loads to make them participate in the power grid dispatching and transaction, which can optimize the use of resources and improve the reliability of the power supply [8]. A large number of research studies have been conducted on DG systems. Ali and Azizivahed have taken the collaborative work and operation of DG into consideration, but they did not give a VPP operation model [9,10]. A framework from the distribution system operator’s perspective for the optimal utilization of demand response between DG shedding mitigation and network management has been offered by Ali [9]. A novel approach for optimal operation of distribution networks at the presence of DG resources and battery energy storage system has also been introduced by Azizivahed [10]. Besides, a hybrid evolutionary algorithm, the hybrid grey wolf optimizer-particle swarm optimization algorithm, has been proposed to solve the problem. Xie et al. have made a great contribution for the case when a large number of DG resources are integrated into a VPP, and to the study of optimal VPP dispatching, however, the benefits of the VPP participating in the power grid dispatching and auxiliary services are not taken into account [11,12,13,14]. The economic dispatch model of VPP is established, and a distributed randomized gradient-free algorithm is used to solve the economic dispatch problem of a VPP, which was becoming non-convex for distributed generators’ characteristics of valve-point loading effects, prohibited operating zones, and multiple fuel options [11]. A fully distributed approach has been proposed for a class of VPP problems. Through analyzing two specific virtual power plant problems, a comprehensive formula has been obtained, which could maximize the economic benefits of all DG resources under the conditions of energy balance, the transmission line limits, and the local constraints [12]. Coordinating the operation of a VPP and traditional voltage regulators, and improving the static voltage stability of distribution networks by using a multi-agent frame has been proposed by Ye. Using the IEEE 33 node test system for testing, the simulation results have shown that the proposed method is both feasible and effective [13]. A single VPP operation scheduling model and a joint operation scheduling model of a VPP alliance have been put forward by Tan, and the related profit distribution models have also been established. The feasibility and effectiveness of the model are verified through an example study [14]. As for how VPP participates in power grid dispatching and auxiliary services, these problems have been discussed and some feasible solutions proposed, but they does not consider the uncertainty of DG included in the VPP [15,16,17]. The optimal bidding strategy problem of a commercial VPP, which is comprised of distributed generation resources, battery storage systems, and electricity consumers, and participates in the day-ahead electricity market has been addressed by Kardakos [15]. A three-stage stochastic bi-level optimization model has been formulated and solved by using the Karush–Kuhn–Tucker optimality conditions and the strong duality theory. A negotiation method for optimizing distributed generation resources scheduling in coupled energy systems has also been proposed [16]. Distributed generation resources in VPP actively participate in the real-time electricity market and natural gas wholesale market in the next day. The cooperation on congestion management in the distribution network is highlighted as a solution to relieve network constraints via the optimal adjustment of active and reactive power of VPP resources while maximizing renewable energy integration across the pool under management [17]. And the results confirm the added value of the proposed VPP in enhancing the integration of wind and solar power. A day-ahead scheduling framework for VPP in a joint energy and regulation reserve (RR) markets has been presented by Shayegan-Rad [18].
Distributed wind power generation and distributed solar PV power generation are mature technologies, especially in China, and have significant huge commercial value potential [19]. Considering that the wind power generation and PV power generation contained in a VPP are significantly affected by environmental and climatic factors, their output curves are highly unpredictable. The day-ahead scheduling strategy of wind power generation, photovoltaic power generation and power grid were first investigated in power systems by Ju and Reddy [20,21]. An optimization model of power generation in a VPP with large number of wind power generation and electrical vehicles has also been established by Alvarez [22]. The object of this model is to maximize the combined income and the constraints of power balance and other factors. Therefore, this paper proposes an optimal operation strategy of VPP participating in power grid dispatching and ancillary services based on output evaluation criteria.
Considering the uncertainty of wind turbine (WT) and PV outputs, their weak ability for adjusting active power and the characteristics like easily being affected by weather and other factors, in order to enhance the management of the WT and PV output, relevant evaluation criteria have been set.
Applications are mandatorily required before WTs can participate in the grid dispatching. Generally, operators submit an application for connection to the power grid dispatching agency three months in advance, and then must submit detailed information related to the wind farm. The data should be verified by the dispatch department to ensure it meets the relevant requirements. In order to promote the wind power forecasting technology in wind farms, the requirements for evaluating the forecast results are put forward. The forecast curve reported by the power grid dispatching agency is evaluated and released on a daily basis, and the limited time period of the wind power field is not used in the assessment.
When PV participates in on-grid power generation, one should strictly implement the daily power generation plan curve (or real-time scheduling curve) and operation mode of the dispatching agency. The dispatching agency shall notify the photovoltaic power station 30 min in advance when the power generation curve of the grid-connected photovoltaic power station is to be modified according to the grid situation. When the delivery is blocked due to various reasons, the PV power plant should strictly implement the 96-point daily power generation plan curve (or a real-time scheduling curve) or scheduling command issued by the dispatching agency. Therefore, it is recommended that the VPP containing a distributed power supply should set relevant assessment criteria when participating in grid dispatching.
A VPP, as a large power supply, usually participates mainly in the power grid dispatching. However, under the ongoing thorough reform the requirements for safety are improving, and the auxiliary service market has gradually opened in China [23]. Therefore, the output of the VPP in this paper participates not only the day-ahead market, but also the auxiliary service market. The distribution of power generation capacity between the two markets has been discussed, and an output distribution curve suitable for power generation companies to participate in bidding can be obtained by modeling and solving through utility and risk analysis [24]. Similarly, the output of virtual power plants also needs an optimal distribution strategy, so that it can be properly allocated to the day-ahead market and auxiliary market in order to maximize the benefits. Considering the nature of wind and PV power generation is intermittent, volatile, and uncertain, and they do not apply to the auxiliary service market, therefore, the power output in the VPP will be fully invested in the day-ahead market for scheduling, so as to obtain network generation revenue. The interruptible load and energy storage are stable and storable. They can participate in the day-ahead market or the auxiliary service market. Therefore, the interruptible load and store energy can participate in the day-ahead market in coordination with wind and photovoltaic power generation to maximum energy efficiency. They can also participate in the auxiliary service market to obtain peak-to-valley earnings.
This paper mainly focuses on VPPs that include some DG resources (WT and PV), interruptible loads and energy storage. The main purpose is to study the optimal allocation of the power output between the power grid dispatching and the auxiliary service for the VPP, hence maximizing its economic benefits. The paper proposes an operational strategy of a VPP, also known as a business operation or an operation model, which is based on a portfolio strategy. In order to achieve this goal, this paper refers to the historical output data of wind power plants and photovoltaic power plants, finds the output data of VPPs by superposition, and performs self-organization map (SOM) cluster analysis on the output of VPP to generate different typical scenarios. Meanwhile, the evaluation criteria for VPP participating in power grid dispatching are established. Based on the output situation and evaluation criteria of virtual power plants in different typical scenarios, the potential total revenue of virtual power plants is obtained. With the goal of maximizing the overall revenue, the optimal power supply strategy is formulated, i.e., the optimal VPP operation strategy and this strategy can be used as guideline reference for the future operation of the VPP.
2. Basic Components of Virtual Power Plants
2.1. Virtual Power Plant Evaluation Criteria for Participating Network Generation
The wind farm should deploy a wind power forecasting system, which can provide day-ahead and ultra-short-term (next 15 min to 4 h) forecasting data to the dispatching agency. The wind farm should predict and declare the network generation power according to the daily wind power forecast results, and submit the wind power curve of the next day to the dispatching agency before the prescribed reporting time. According to the wind power planning curve reported by the wind farm, with power system operation reliability as the priority, the power dispatching agency will finally compile the wind farm power generation plan curve for the next day, and hand it over to the wind farm.
According to the Implementation Rules for the Operation of Wind Power Field in the Southern Region and the Management of Auxiliary Services [25], the changes in active power of wind farm were evaluated on a daily basis, and the average data of the difference in power changes per minute within 10 min was used to calculate the evaluation indicators, which was rolling calculation, and should be assessed on a daily basis. The rate of change exceeds the limit value needs to be assessed according to the following formula:
where, Pi is the power change value of the i-th minute; Plim is the power change limit:
When PV penetrates into the power system, it is considered to be unqualified when the actual power generation output of the power plant sampled by the energy management system (EMS) system is more than 2% different from the planned curve. The absolute value of the monthly deviation is counted. When the deviation exceeds 5%, the excess part is multiplied by 3 and then the absolute value of the monthly deviation is counted. The assessment is based on the monthly deviation integral power.
According to the Measures for the Evaluation and Management of Photovoltaic Power Stations Connected to the Qinghai Power Grid [26], the PV power stations should submit a day-ahead and ultra-short-term (4 h) solar irradiation prediction curve to the power dispatching agency on time, and this is evaluated by the power dispatching agency according to the optical power prediction deviation. The average monthly root-mean-square (RMS) error of the optical power forecast should be less than 20%. If it fails to meet the standards, each percentage point increase should be assessed according to the total installed capacity ×6 points/10,000 kilowatts; if it is up to the standard, each percentage point will be rewarded with a total installed capacity of ×2 m/10,000 kilowatts. The average monthly RMS error of the wind power forecast for the ultra-short term (within 4 h) should be less than 15%. If it fails to meet the standards, each percentage point increase should be assessed according to the full installed capacity × 6 points/10,000 kilowatts; if it is up to the standard, each percentage point will be rewarded with a total installed capacity of ×2 m/10,000 kilowatts.
As WT and PV in the VPP are highly unpredictable, the VPP output curve also becomes volatile, intermittent, and uncertain obviously. In this scenario where wind power field and PV power stations are participating in power grid dispatching, it is necessary to set up an assessment for VPP, which can manage it more accurately and schedule the output more strictly.
The principle of this assessment is that VPP should ensure that the deviation between the reported output prediction curve and the actual output curve is as small as possible, and strictly implement the daily power generation plan curve or scheduling command issued by the dispatching agency. Therefore, if VPP’s actual power output deviates from the reported output prediction curve, different reward-punishment factor αass will be set according to different deviation ranges.
The formula for calculating the RMS error is:
where, RMSEvpp is the predicted RMS error; Pvpp(i) is generation power of the VPP at the moment i; Pvpp-fore(i) is the predicted generation power of the VPP at the moment i; Cap is the average boot capacity of the VPP; n is the total number of sampling times in a day.
The reward-punishment benefit is:
where, Rass is the reward-punishment benefit; αass is the corresponding reward-punishment factor; Qvpp is the amount of electricity with which the virtual power plant participates in the network generation.
When the wind and photovoltaic power output in the VPP fluctuate greatly, the prediction accuracy of the power generation output will be reduced, and there will be a large deviation between the predicted value and the actual value, and the reward-punishment benefit will appear negative. The greater of the volatility, with the greater of the punishment received, affecting the return seriously. In order to achieve steady returns, stable distributed generation resources (interruptible load, distributed energy storage, electric vehicles, etc.) of the corresponding capacity can be invested to make up for the fluctuation of the output curve, and to offset the uncertainty of new energy generation (such as WT and PV) to some extent. Meanwhile, distributed generation resources can also make VPP external characteristics smoother through improving the assessment of rewards and penalties.
2.2. Analysis on the Profit Path of a Virtual Power Plant
According to Item 18 of the Measures for the Management of Distributed Power Generation [27]: according to various DG characteristics and related policies, DG projects can not only conduct direct transactions with power users, but also entrust power grid enterprises to sell electricity on their behalf, and network access is also available; and Item 19: as users are participating in the auxiliary service market, DGs are encouraged to participate in the auxiliary service market, and third-party auxiliary service providers allowed to provide auxiliary services for the system in conjunction with DGs.
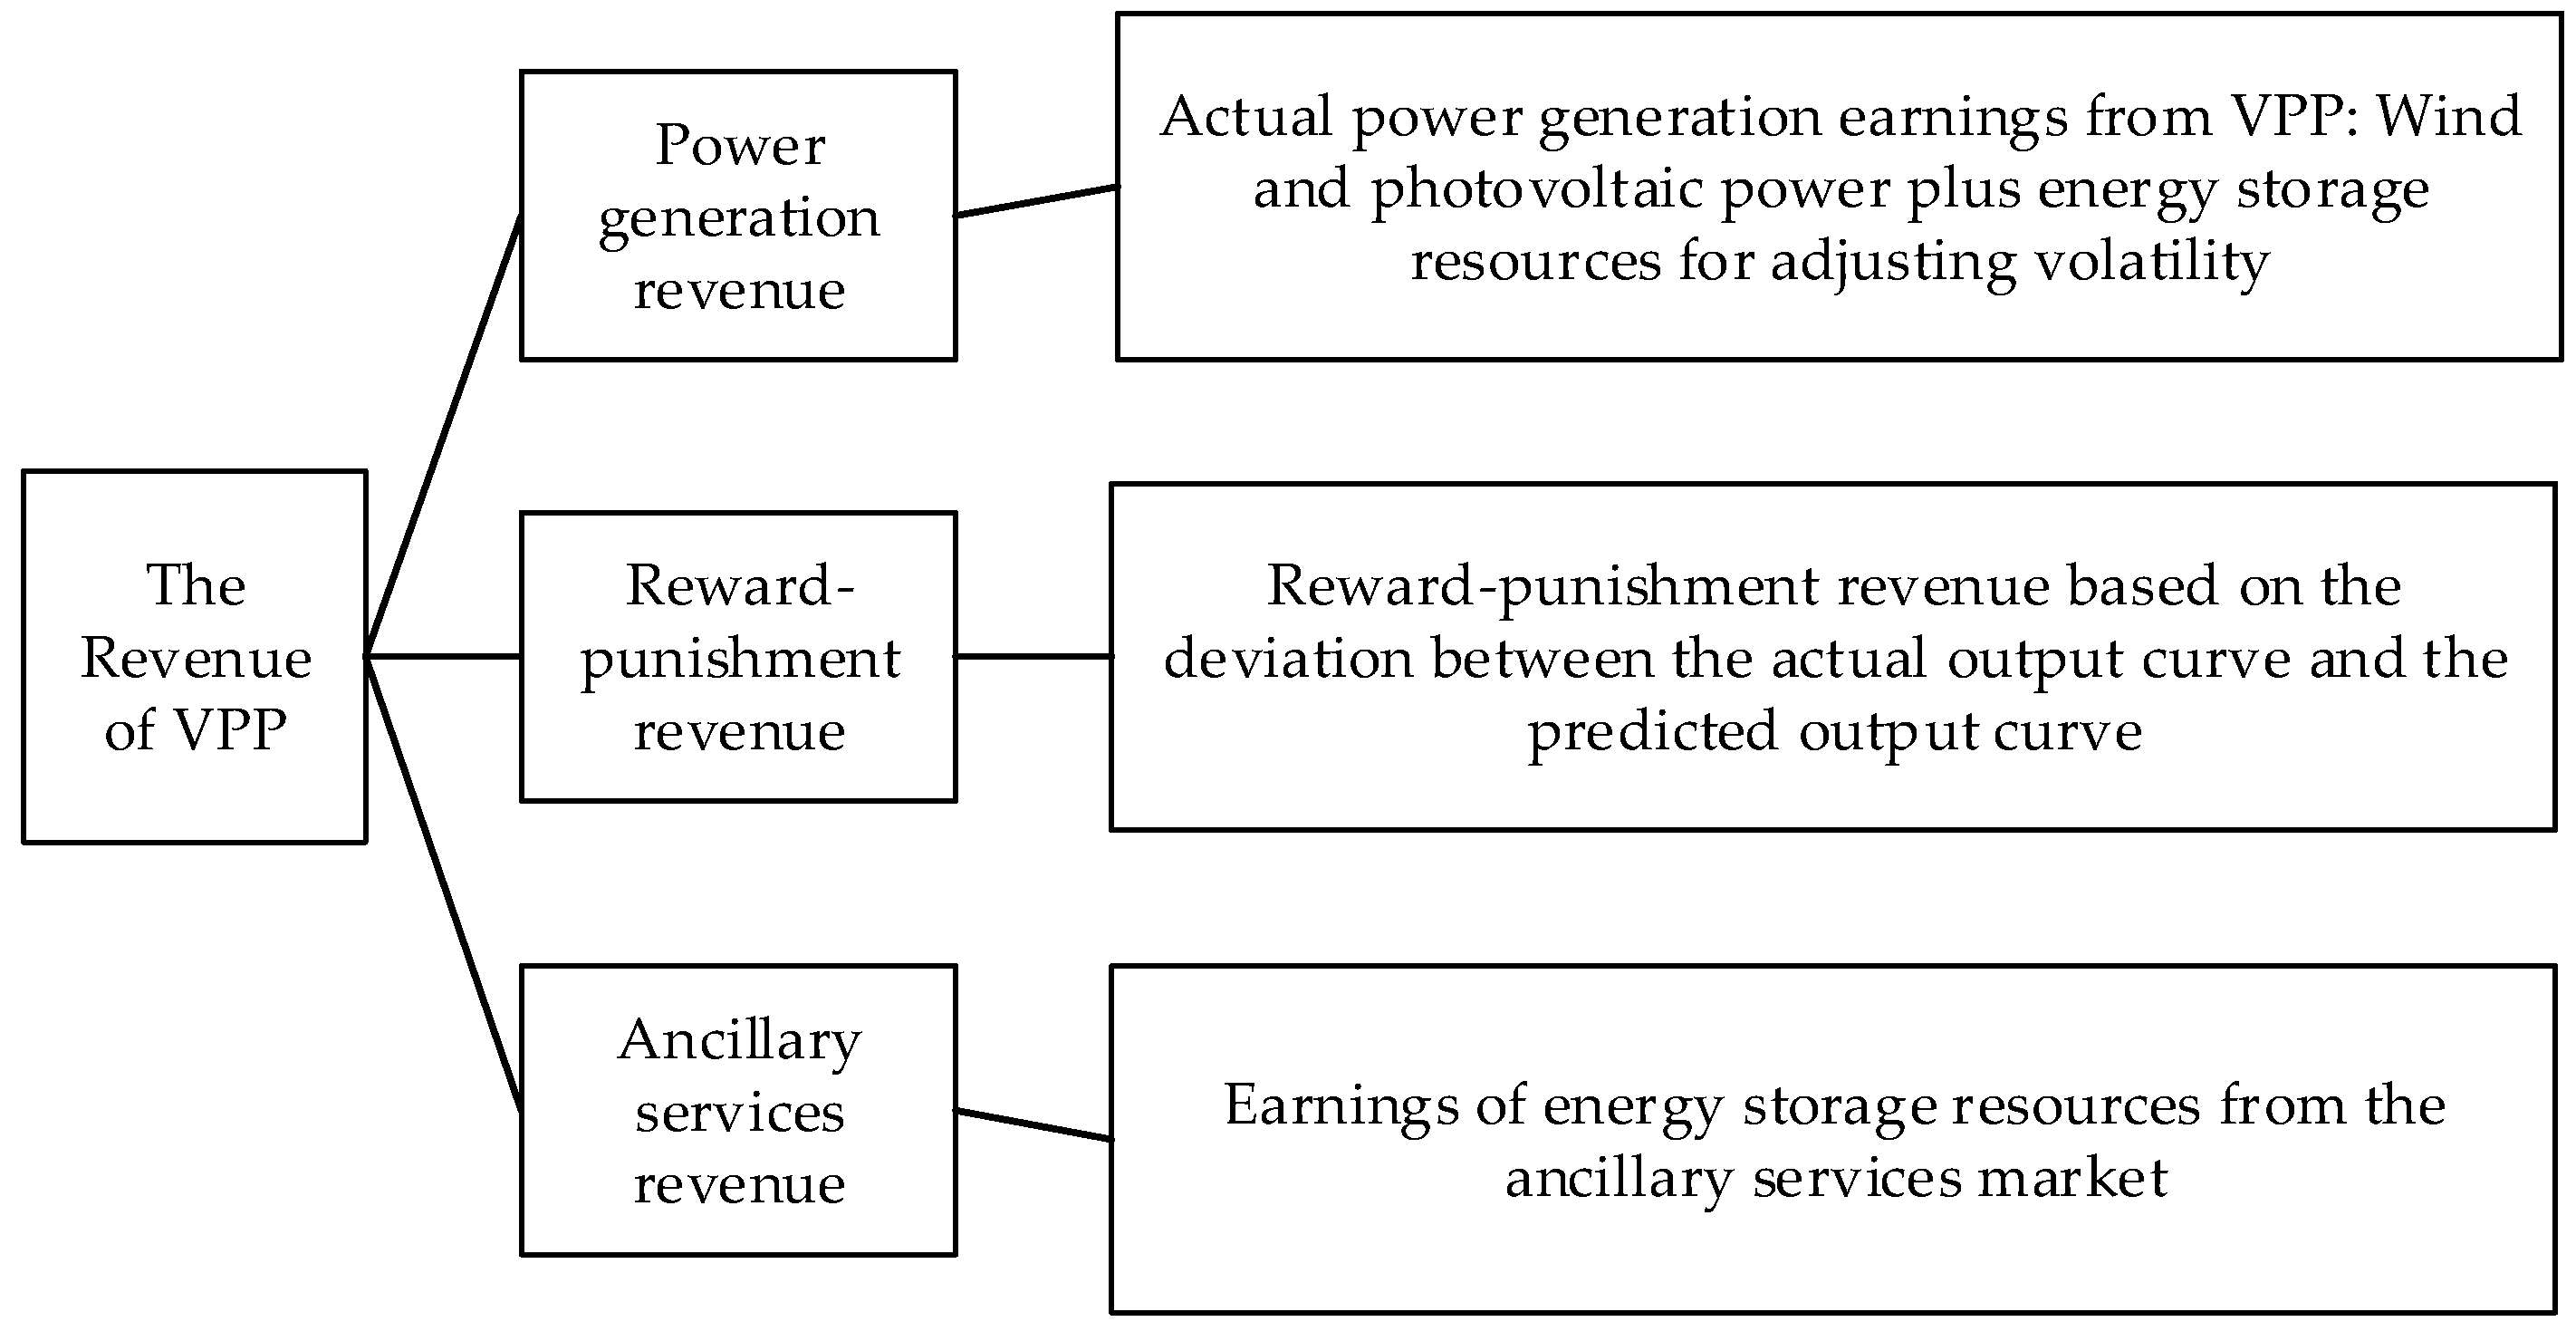
Therefore, two profitable operation modes for VPP are discussed in this paper: First, VPP participates in scheduling, connects to the power grid, and obtains income; the other is when the VPP participates in the auxiliary service market, provides ancillary services and obtains benefits.
For the profit path 1: the VPP provides an output prediction curve for power grid scheduling, and strictly implements the power generation plan according to the scheduling instructions issued by the higher dispatching organization. In this mode of operation, distributed energy such as wind power and PV are involved. However, the output of wind power and PV power is mainly determined by the wind power and solar irradiation conditions, and therefore greatly affected by weather factors. Therefore, considering their uncertainty and volatility, wind power and PV generation is volatile, intermittent, and uncertain. The actual output curve of the VPP and the forecast output curve of the report will inevitably deviate. In order to urge the VPP to predict and control the output accurately, a corresponding assessment of rewards and punishments is formulated. This scheme system derives the rewards and punishments according to the deviation of actual output curve from the forecast output curve, the corresponding assessment of rewards and punishments are obtained. VPP will be rewarded when the deviation is within a certain threshold and vice versa.
For the profit path 2, participation in the auxiliary service market, auxiliary service refers to the services provided by peak adjustment, frequency modulation (FM), backup and black start except power production in order to ensure the security, stable operation of the system and the supply quality of the electricity. It runs through every link of the power production process and has a close relationship with the power market. Stable energy resources such as energy storage plants and interruptible loads are well suited for ancillary services. At the same time, considering the integrity of the virtual power plant, it is also possible to use part of the stable energy resources to make up for the volatility of the wind and photovoltaic power output, and to ensure the assessment while participating in the auxiliary service market, thus increasing revenue.
VPPs should be treated differently according to the specific profit path. For example, the power supply VPP based on DG, especially renewable energy power generation, is mainly involved in network power generation, supplemented by participating in auxiliary services; a standby or balanced VPP with controllable load and a small amount of DG, mainly participates in auxiliary services, supplemented by participating in network power generation.
The main content of this section discusses how to reasonably allocate these distributed generation resources so that the entire VPP benefits are maximized. The revenue path of a virtual power plant is shown in Figure 2.
3. Optimal Operation Model for Virtual Power Plant
Since a VPP’s generation cannot remain stable due to the uncertainty of its penetrated wind and PV generation, its income is also unpredictable. In order to assess the income of the virtual power plant reasonably, we can analyze the output of virtual power plant in annual cycle. Besides, the output power of VPP is also heavily dependent on the weather factors. Therefore, the virtual power plant is analyzed year round, and each season is divided into three typical scenarios, for a total of 12 typical scenarios in a year.
3.1. Typical Scenarios of Virtual Power Plant Output
For the uncertainty of DG output, the output characteristics of DG can be studied by using the method of typical scenarios. Using a self-organization map (SOM) clustering algorithm, the output of DGs is cluster analyzed to generate typical scenarios. By analyzing the income of the virtual power plant in typical scenarios, the best virtual power plant operation strategy is obtained.
The differences between the forecasted power generation from both PVs and WTs, and the total output of the VPP are mainly caused by the low grid connection rate of WT and PV, but in this paper, the energy storage resource can improve the output of VPP, the difference is small and has not been considered. Therefore, the output of VPP is obtained by superimposing the outputs of WT and PV. The output vector consisting of scenery output data, PW = [Pw(1), Pw(2), …, Pw(n)], is trained as an input vector for the SOM network. Its topology is shown in Figure 3:
By normalizing the input output vector according to Equation (5), we can get:
In order to best match each input vector, the Euclidean distance needs to be calculated:
Among them, the smallest nerve element j* is the winning neuron.
Adjust the connection vector to update the connection vector of neurons within j* and Nj*(t). Repeat the learning process until the daily wind and photovoltaic are trained. Finally, the typical output scenarios of virtual power plant power generation are obtained.
3.2. Optimized Income Model of Virtual Power Plant under Typical Scenarios
The objective function of the model is the maximum revenue of VPP, which consists of three parts: power grid dispatching revenue, reward-punishment revenue, and revenue from participating in auxiliary services. According to different typical scenarios, the energy storage capacity, used to optimize photovoltaic power generation and participate in auxiliary services, is sought to make the virtual power plant gain the most in this scenario.
● The power grid dispatching revenue:
where, Relc is the generation income (CNY) of the VPP; Pvpp(i) is the generation power (kW) of the VPP at the moment i; ρ(i) is the electricity price at the moment I (CNY); Pwind(i) is the generation power (kW) of the wind turbine at the moment i; Ppv(i) is the generation power (kW) of the photovoltaic unit at the moment i; Pbest(i) is the generation power (kW) of the interruptible load, distributed energy storage involved in adjusting the power grid dispatching curve at the moment i; Δt is the sampling time interval (h) and N is the number of sampling points.
● The reward-punishment revenue:
where, RMSEvpp is the reward-punishment revenue (CNY) of the VPP; Pvpp-fore(i) is the predicted generation power (kW) of the VPP at the moment i; Pwind-fore(i) is the predicted generation (power kW) of the WT unit at the moment i; Ppv-fore(i) is the predicted generation power (kW) for the PV unit at the moment i; Pbess-fore(i) is the predicted generation power (kW) of interruptible load, distributed energy storage at the moment i.
The reward-punishment revenue of virtual power plants can be expressed as:
where, Rass is the reward-punishment revenue (CNY); αass is the reward-punishment factor (CNY/kWh). The value of αass can be set according to different regions.
● The ancillary service revenue:
where, Rser is the income of the VPP participating in auxiliary services (CNY); ρser is the peak-to-valley time-sharing voltage difference (CNY/kWh), Pbess(i) is the power (charging power or discharge power, kW) of the VPP that is put into the auxiliary service market at the moment i.
Based on the above analysis, the total revenue under the typical scenario of a virtual power plant is:
and the objective function is:
where, Rsum is the total income (CNY) of a typical scenario of a virtual power plant.
4. Model Solution and Application
4.1. Model Solution
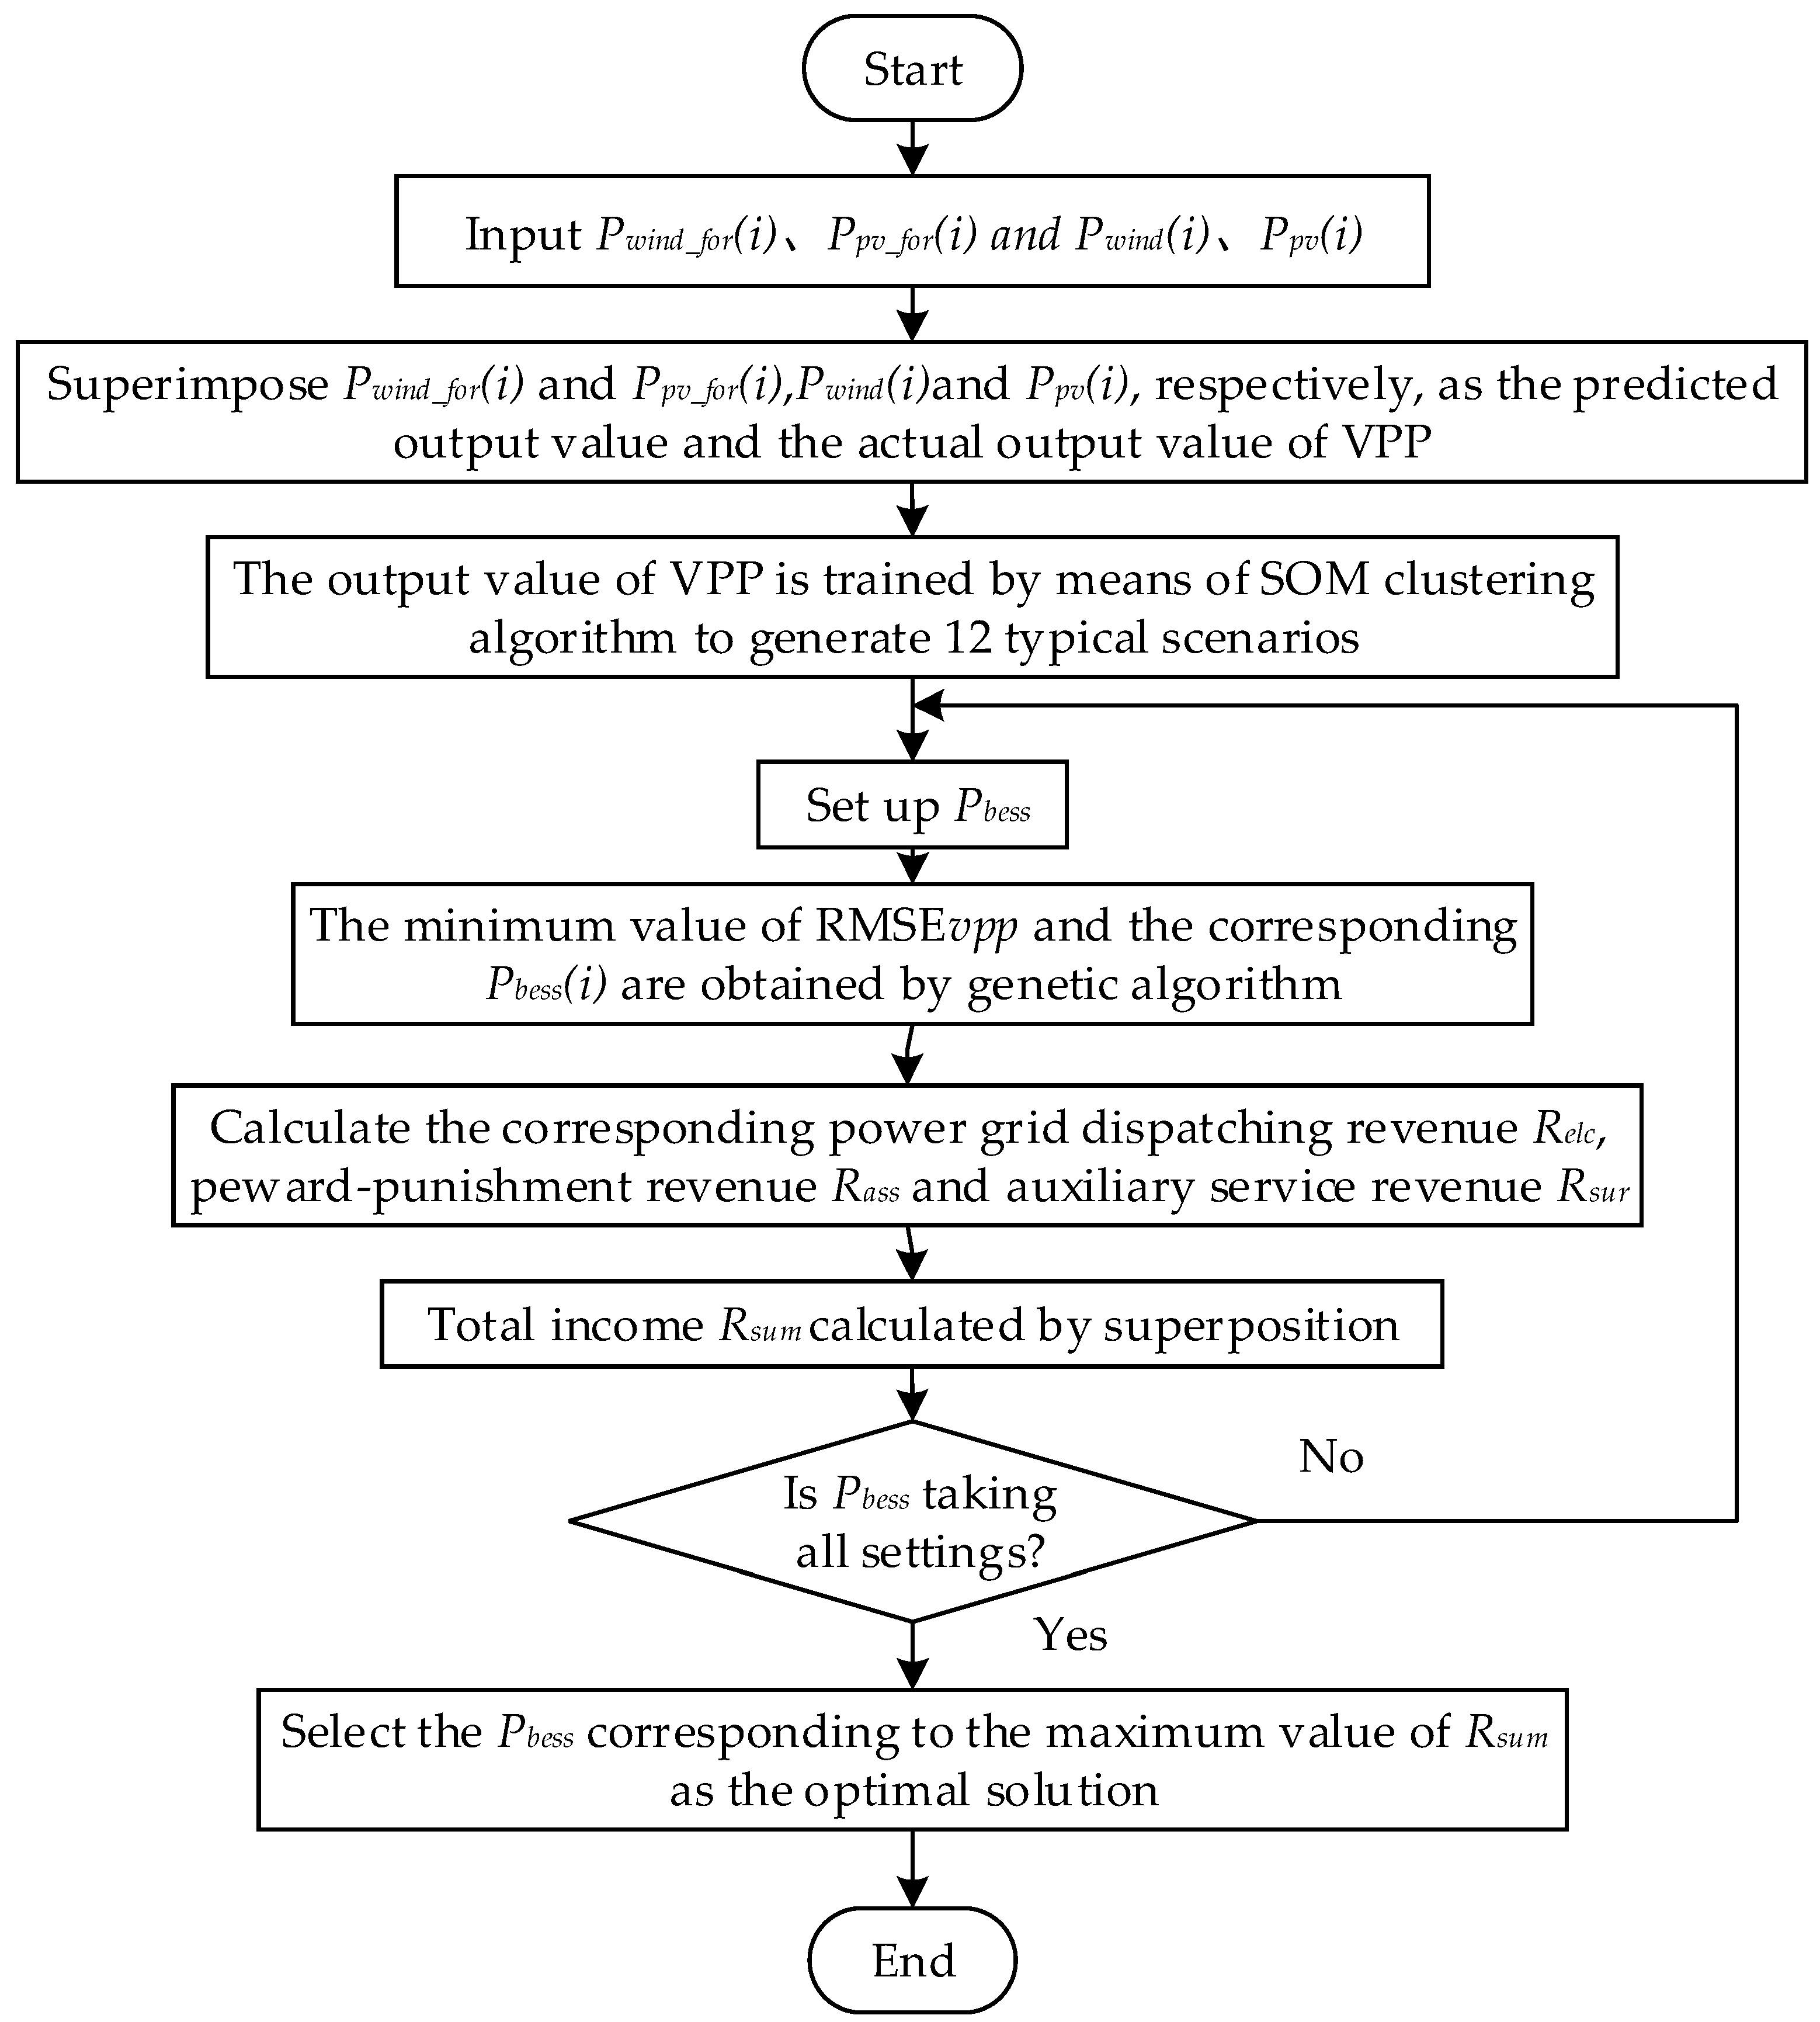
The above model is mainly designed to distribute the output of virtual power plant and maximize its revenue. The internal output of virtual power plant can be divided into wind and photovoltaic output, storage energy output and interruptible load output. In distributed generation resources, the wind and photovoltaic power generation’s output are uncertain, however storage energy and interruptible load’s output are stable. Considering that power grid dispatching revenue involves assessing, it is appropriate to dispatch stable power generation resources such as energy storage and interruptible load to participate in power grid dispatching, minimize assessment payments, or even turn it into reward income. In order to achieve the expected optimal revenue, it is necessary to determine the optimal capacity of energy storage and interruptible load in different scenarios. The energy storage capacity is self-set. When the energy storage resources participate in power grid dispatching or auxiliary services, the distribution ratio is adjustable. By adjusting the distribution ratio, the optimal income distribution ratio is found as much as possible. The process of solving the model is as follows:
- Input calculation parameters such as Pwind-fore(i) and Pwind(i).
- Add the WT output and PV output to obtain the VPP output value.
- The output curve of VPP is cluster analyzed under the SOM algorithm. Based on a year period, it is divided into 12 typical scenarios and the VPP output curves under different typical scenarios are obtained.
- Use the capacity Pbess of the energy storage and interruptible load which can participate in the power grid dispatching as an input variable. Then, use the genetic algorithm to obtain the minimum value of RMSEvpp and the corresponding Pbess(i).
- The power grid dispatching revenue Relc(i), the reward-punishment revenue Rass(i), and the auxiliary services revenue Rser(i) are calculated under the corresponding conditions based on the obtained Pbess(i).
- Calculate the total income of typical scenarios of the VPP: Rsum(i) = Relc(i) + Rass(i) + Rser(i).
- Adjust Pbess(i) and repeat the steps (4–6) to obtain the optimal Pbess and the corresponding virtual power plant’s best total revenue maxRsum.
The model solution flow diagram is shown as Figure 4.
4.2. Model Application
According to the previous section, a total of 12 typical scenarios are acquired based on a year period. Based on the above result, build a scenario model library consists of these 12 typical output scenarios and the corresponding VPP optimal operation models. The steps for the VPP operator to deploy the scenario model library are as follows:
- Predict the output curve of the VPP in the coming day;
- The obtained output curve is compared to the scenario model library, and the RMS method is used to find the typical scenario output curve with the smallest deviation, i.e., to find the best matching scenario in the library;
- According to the optimal operation mode of the VPP in the typical scenario obtained from the step 2, schedule the VPP for the next day.
5. Case Studies and Numerical Results
5.1. Basic Data
The installed capacity of the VPP constructed in this case is 140 MW, of which WT and PV stations each takes 50 MW, while other stable energy storage capacity takes 40 MW. This case uses the Distributed energy systems distributed offer promising solutions in this context, and historical power generation data of a certain wind power plant and a PV power plant. The historical DG power generation data of a virtual power plant is obtained through the sum of their historical power generation data. Some of the relevant parameter settings for distributed generation resources are shown in Table 1:
where, is the rated capacity of the VPP; is the rated capacity of the stable output resources contained in the VPP. The reward-punishment factor is set up as Table 2 shows.
5.2. Generation and Analysis of Typical Scenarios
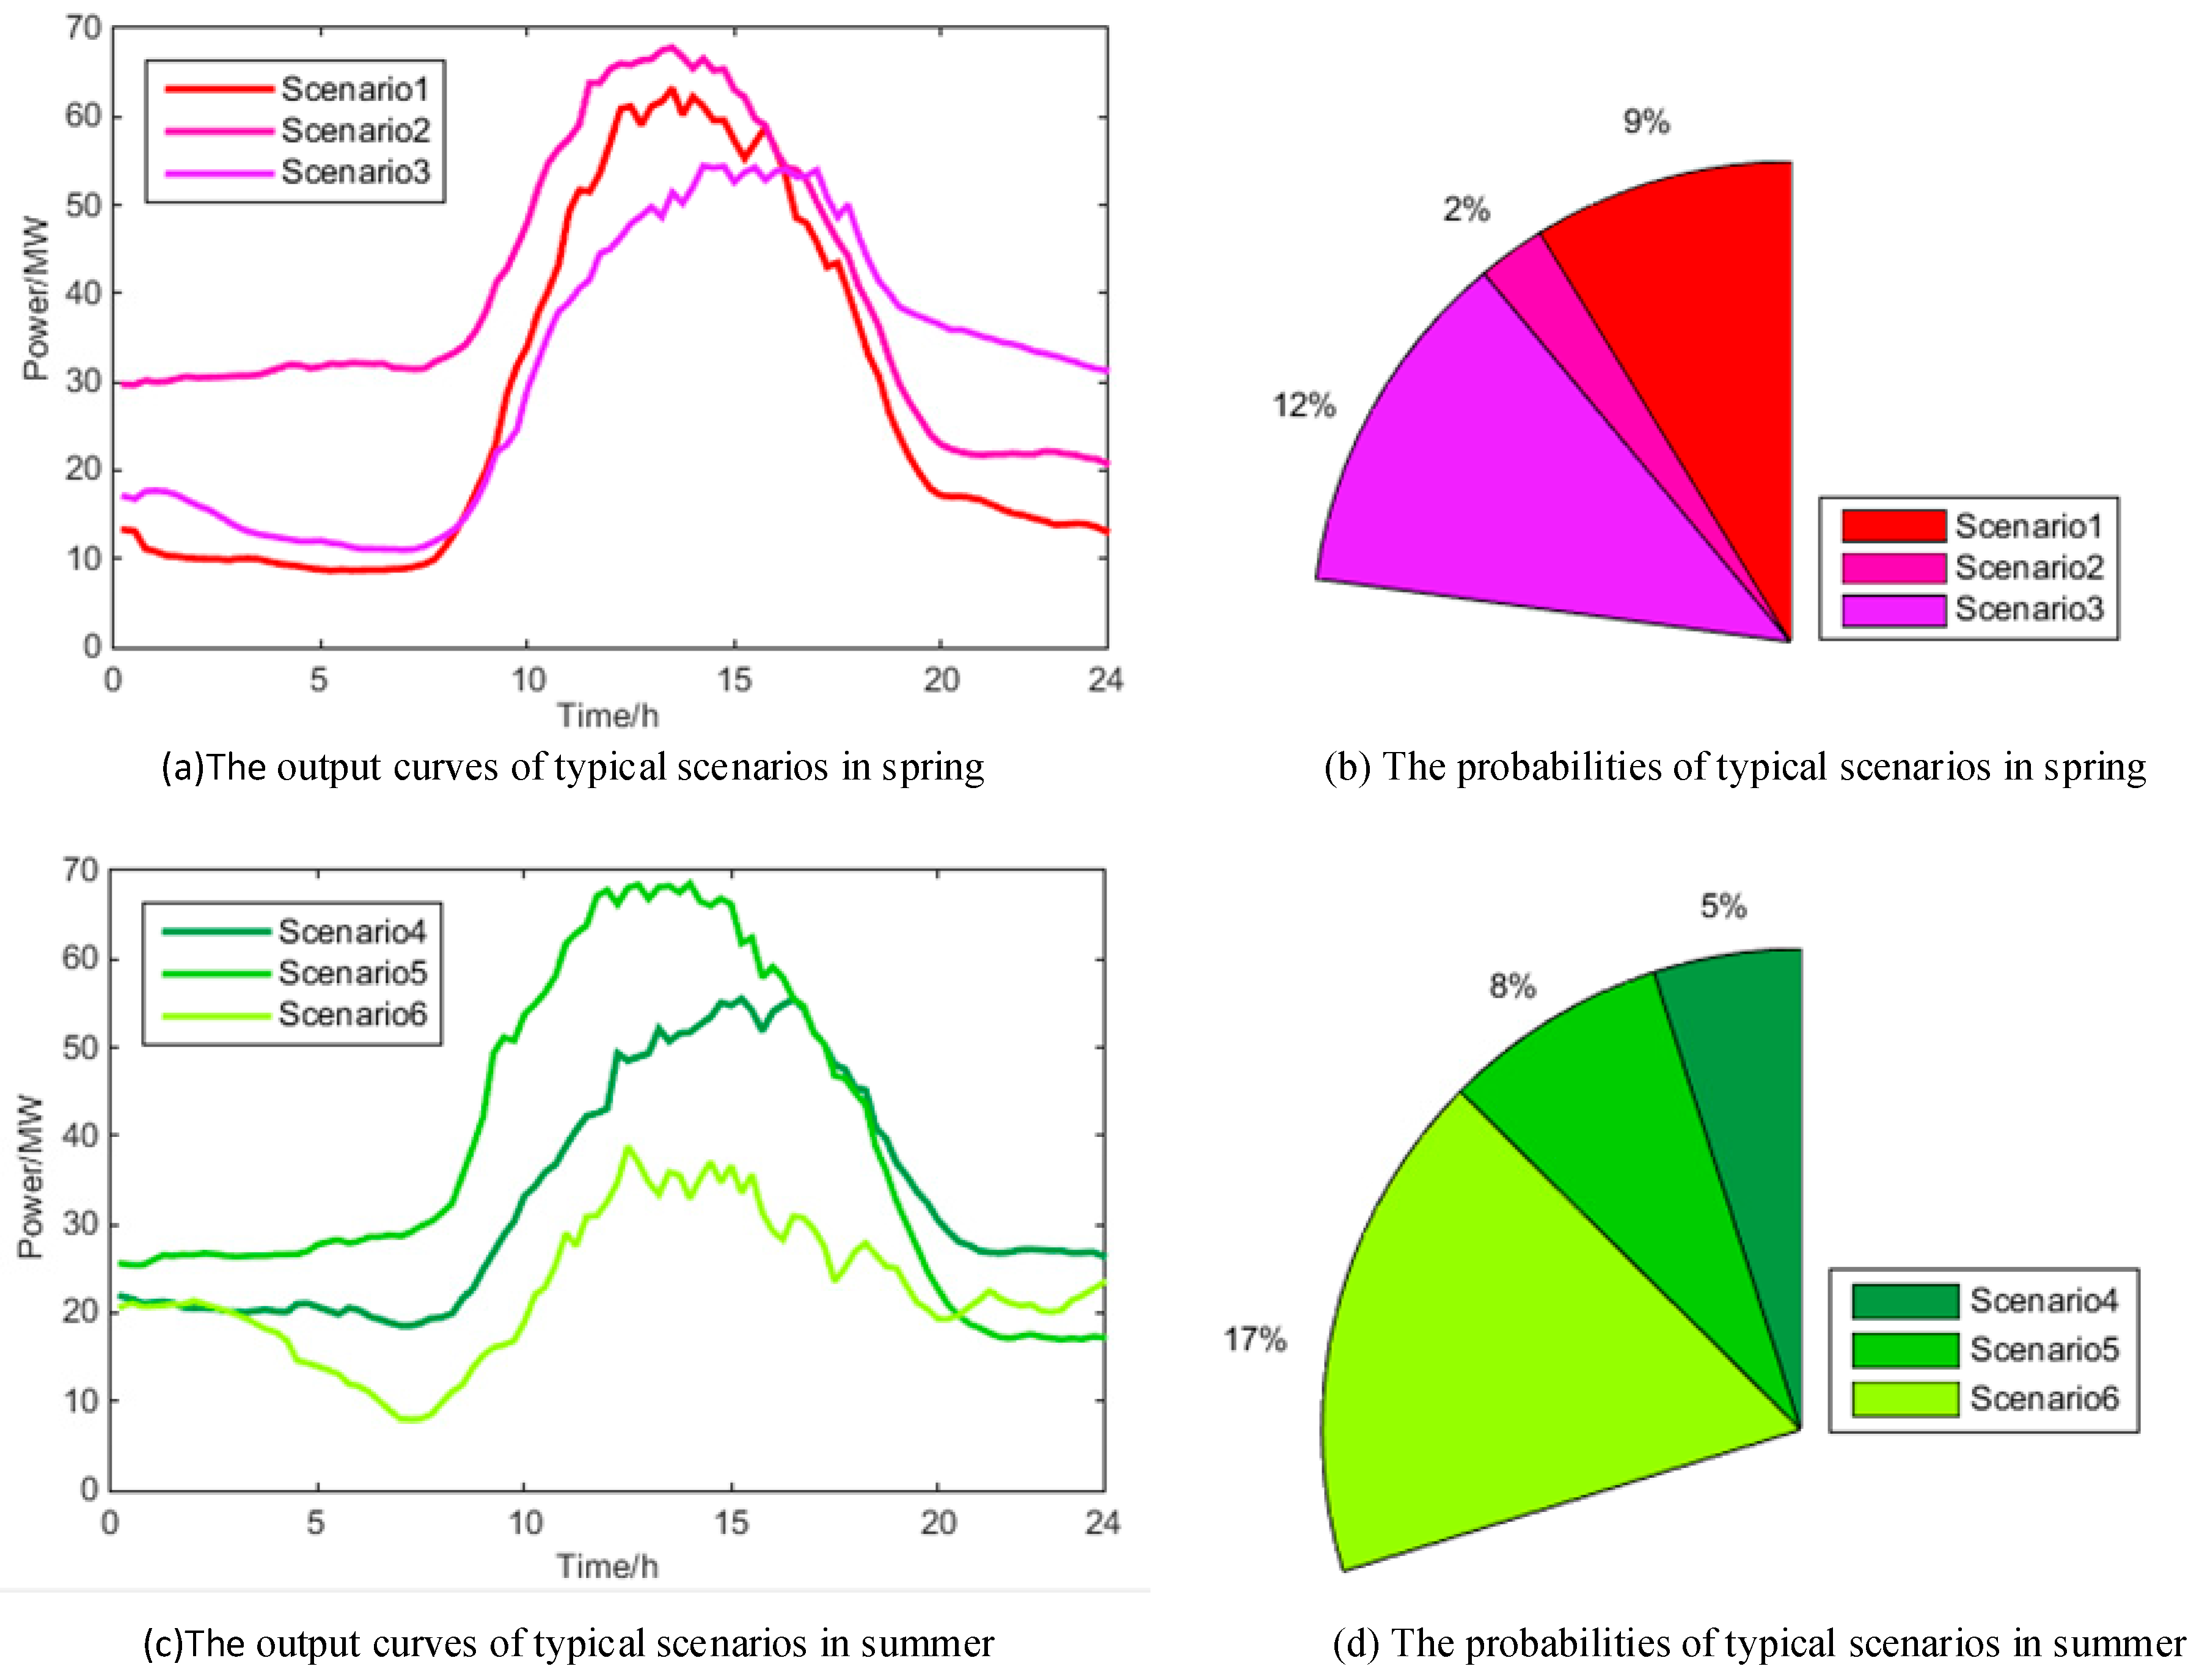
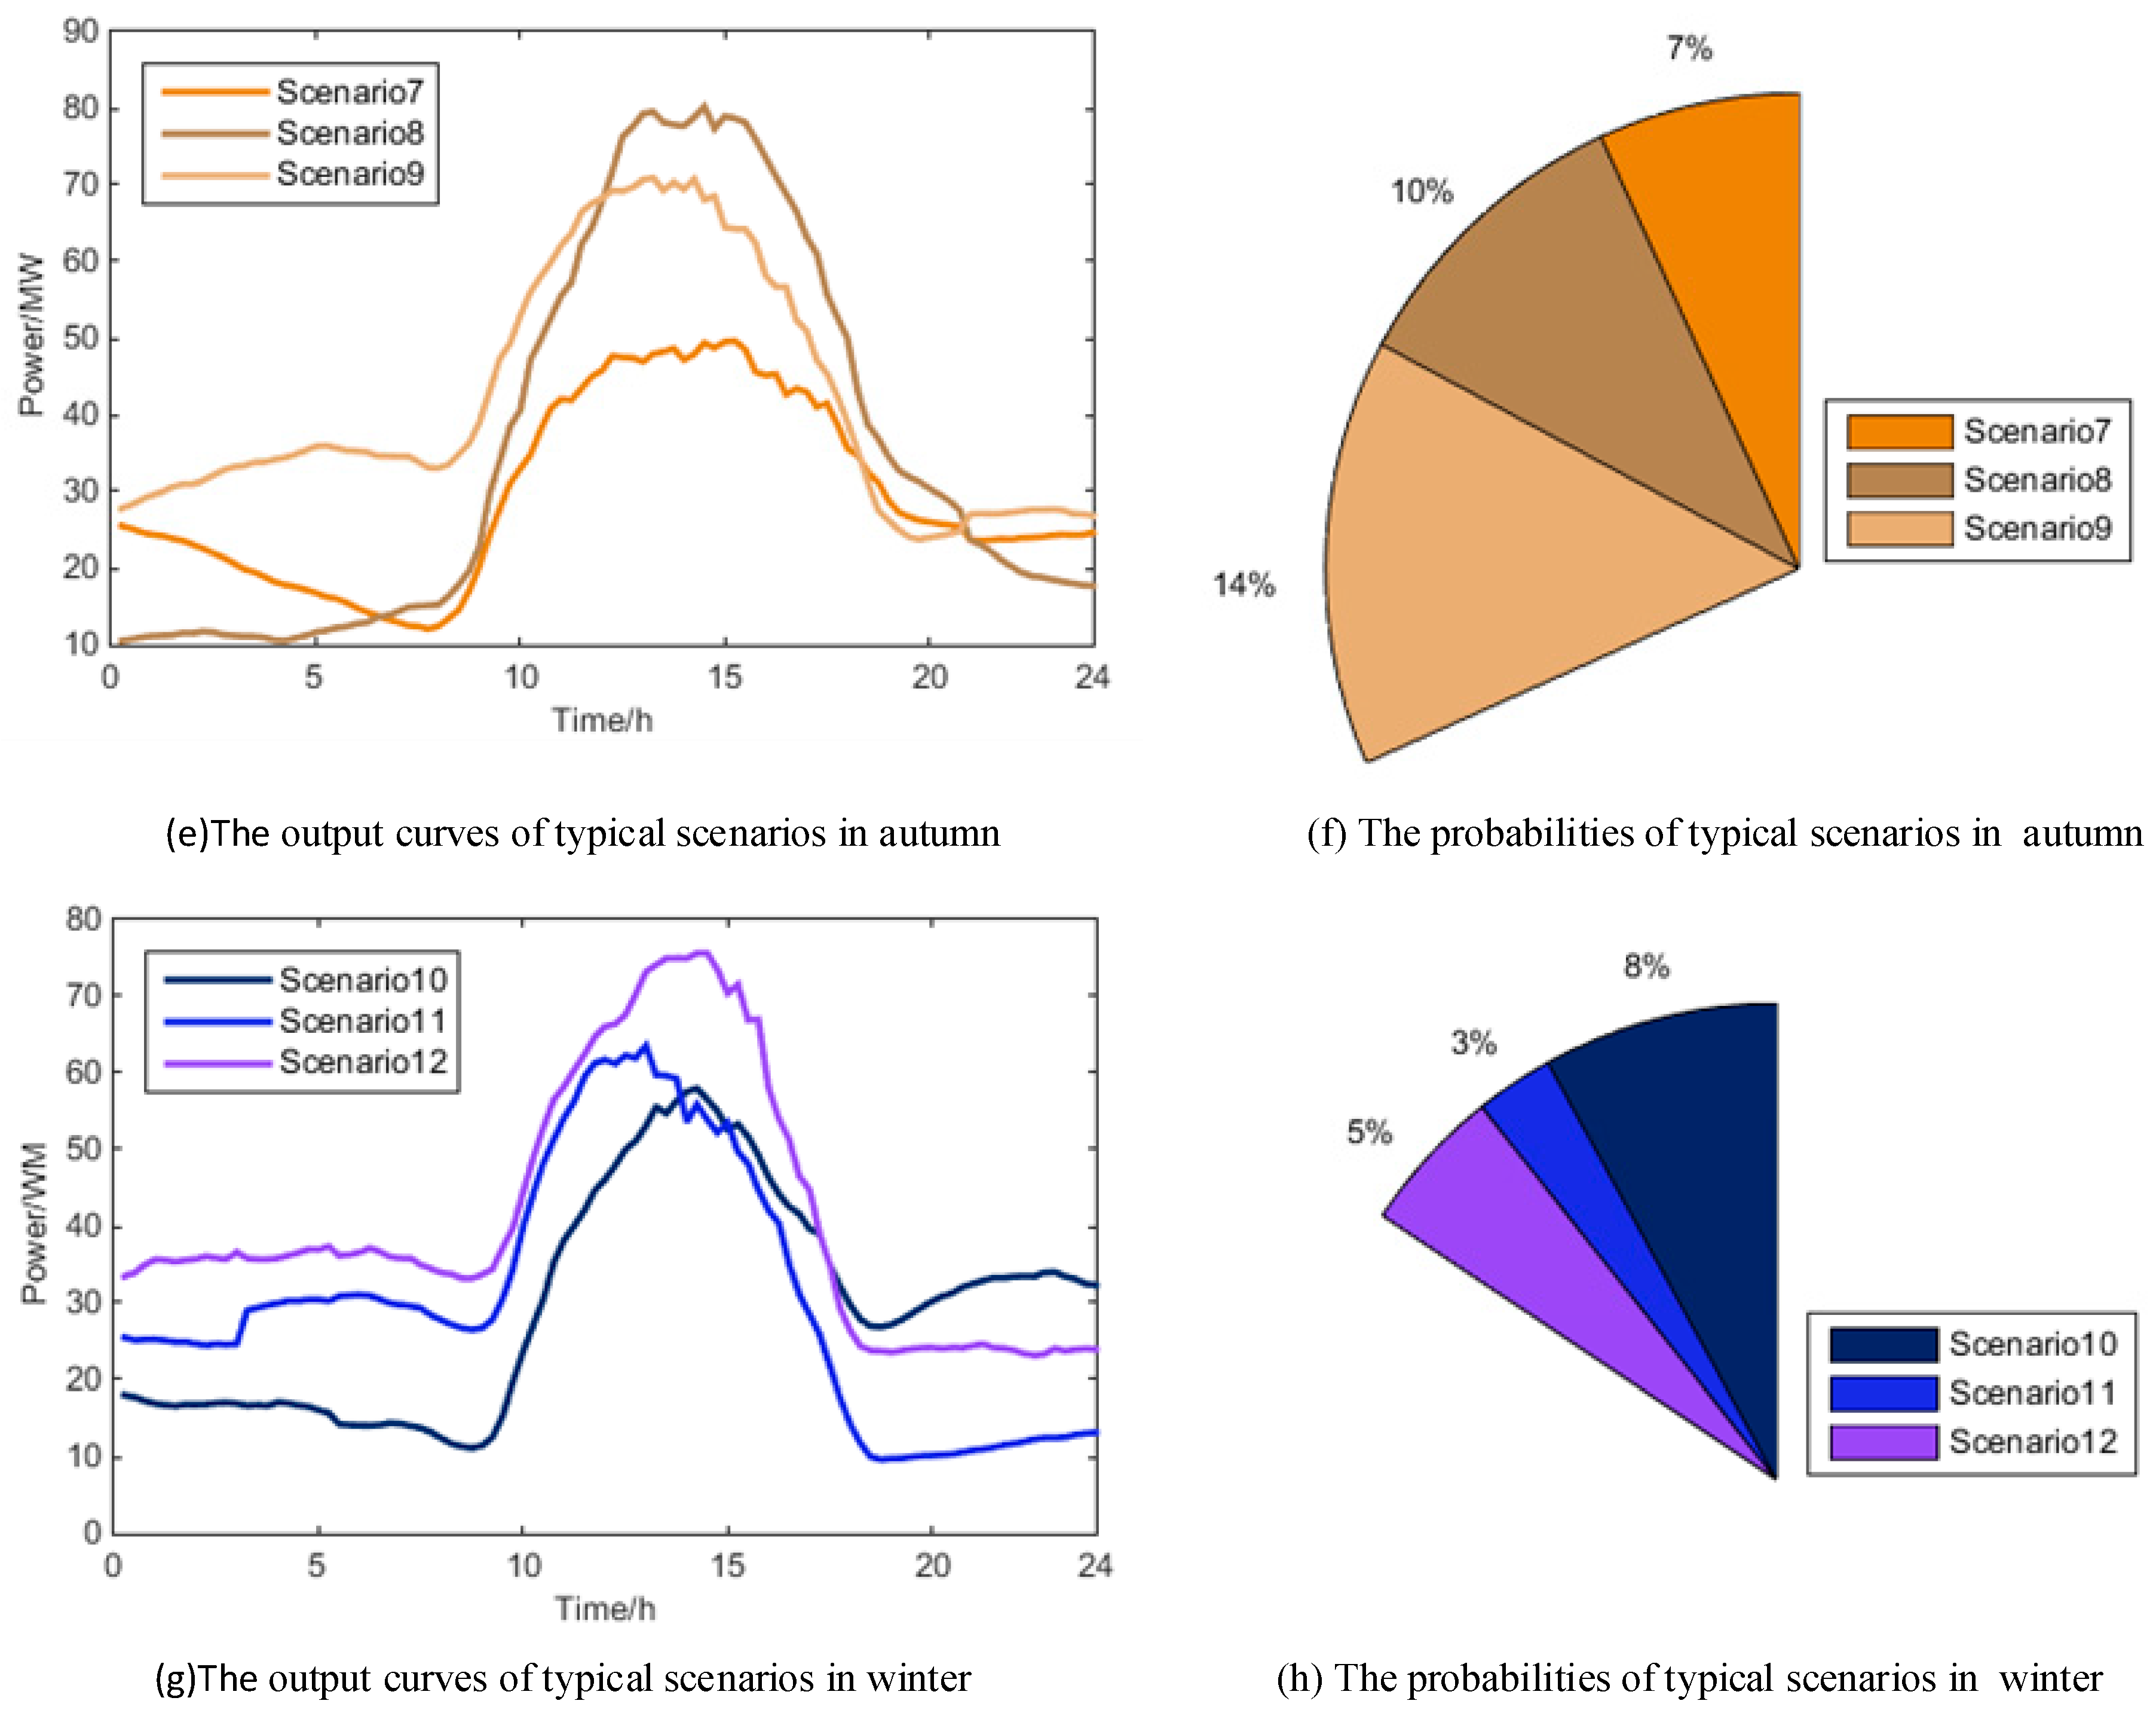
Using the SOM clustering algorithm to analyze the historical DG power generation data of virtual power plants, 12 typical scenarios (numbered scenario 1 to 12) and their probabilities are obtained by seasons, respectively, in Figure 5.
The left figure in Figure 5 shows 12 typical VPP output curves dominated by wind and photovoltaic power output, while the right side are the probabilities that the typical scenarios appear in the annual cycle. The colors are corresponding.
Photovoltaic output is concentrated between 8 a.m. and 8 p.m., which is determined by the lighting time. Wind power output is continuous 24 h a day. Therefore, VPP reaches the maximum at noon and entirely depends on wind power in the morning and evening every day. In addition, due to the limited illumination time and bad weather in spring and winter the valid data ratio is significantly lower than in summer and autumn.
5.3. Optimization Analysis of Typical Scenario Output of Virtual Power Plant
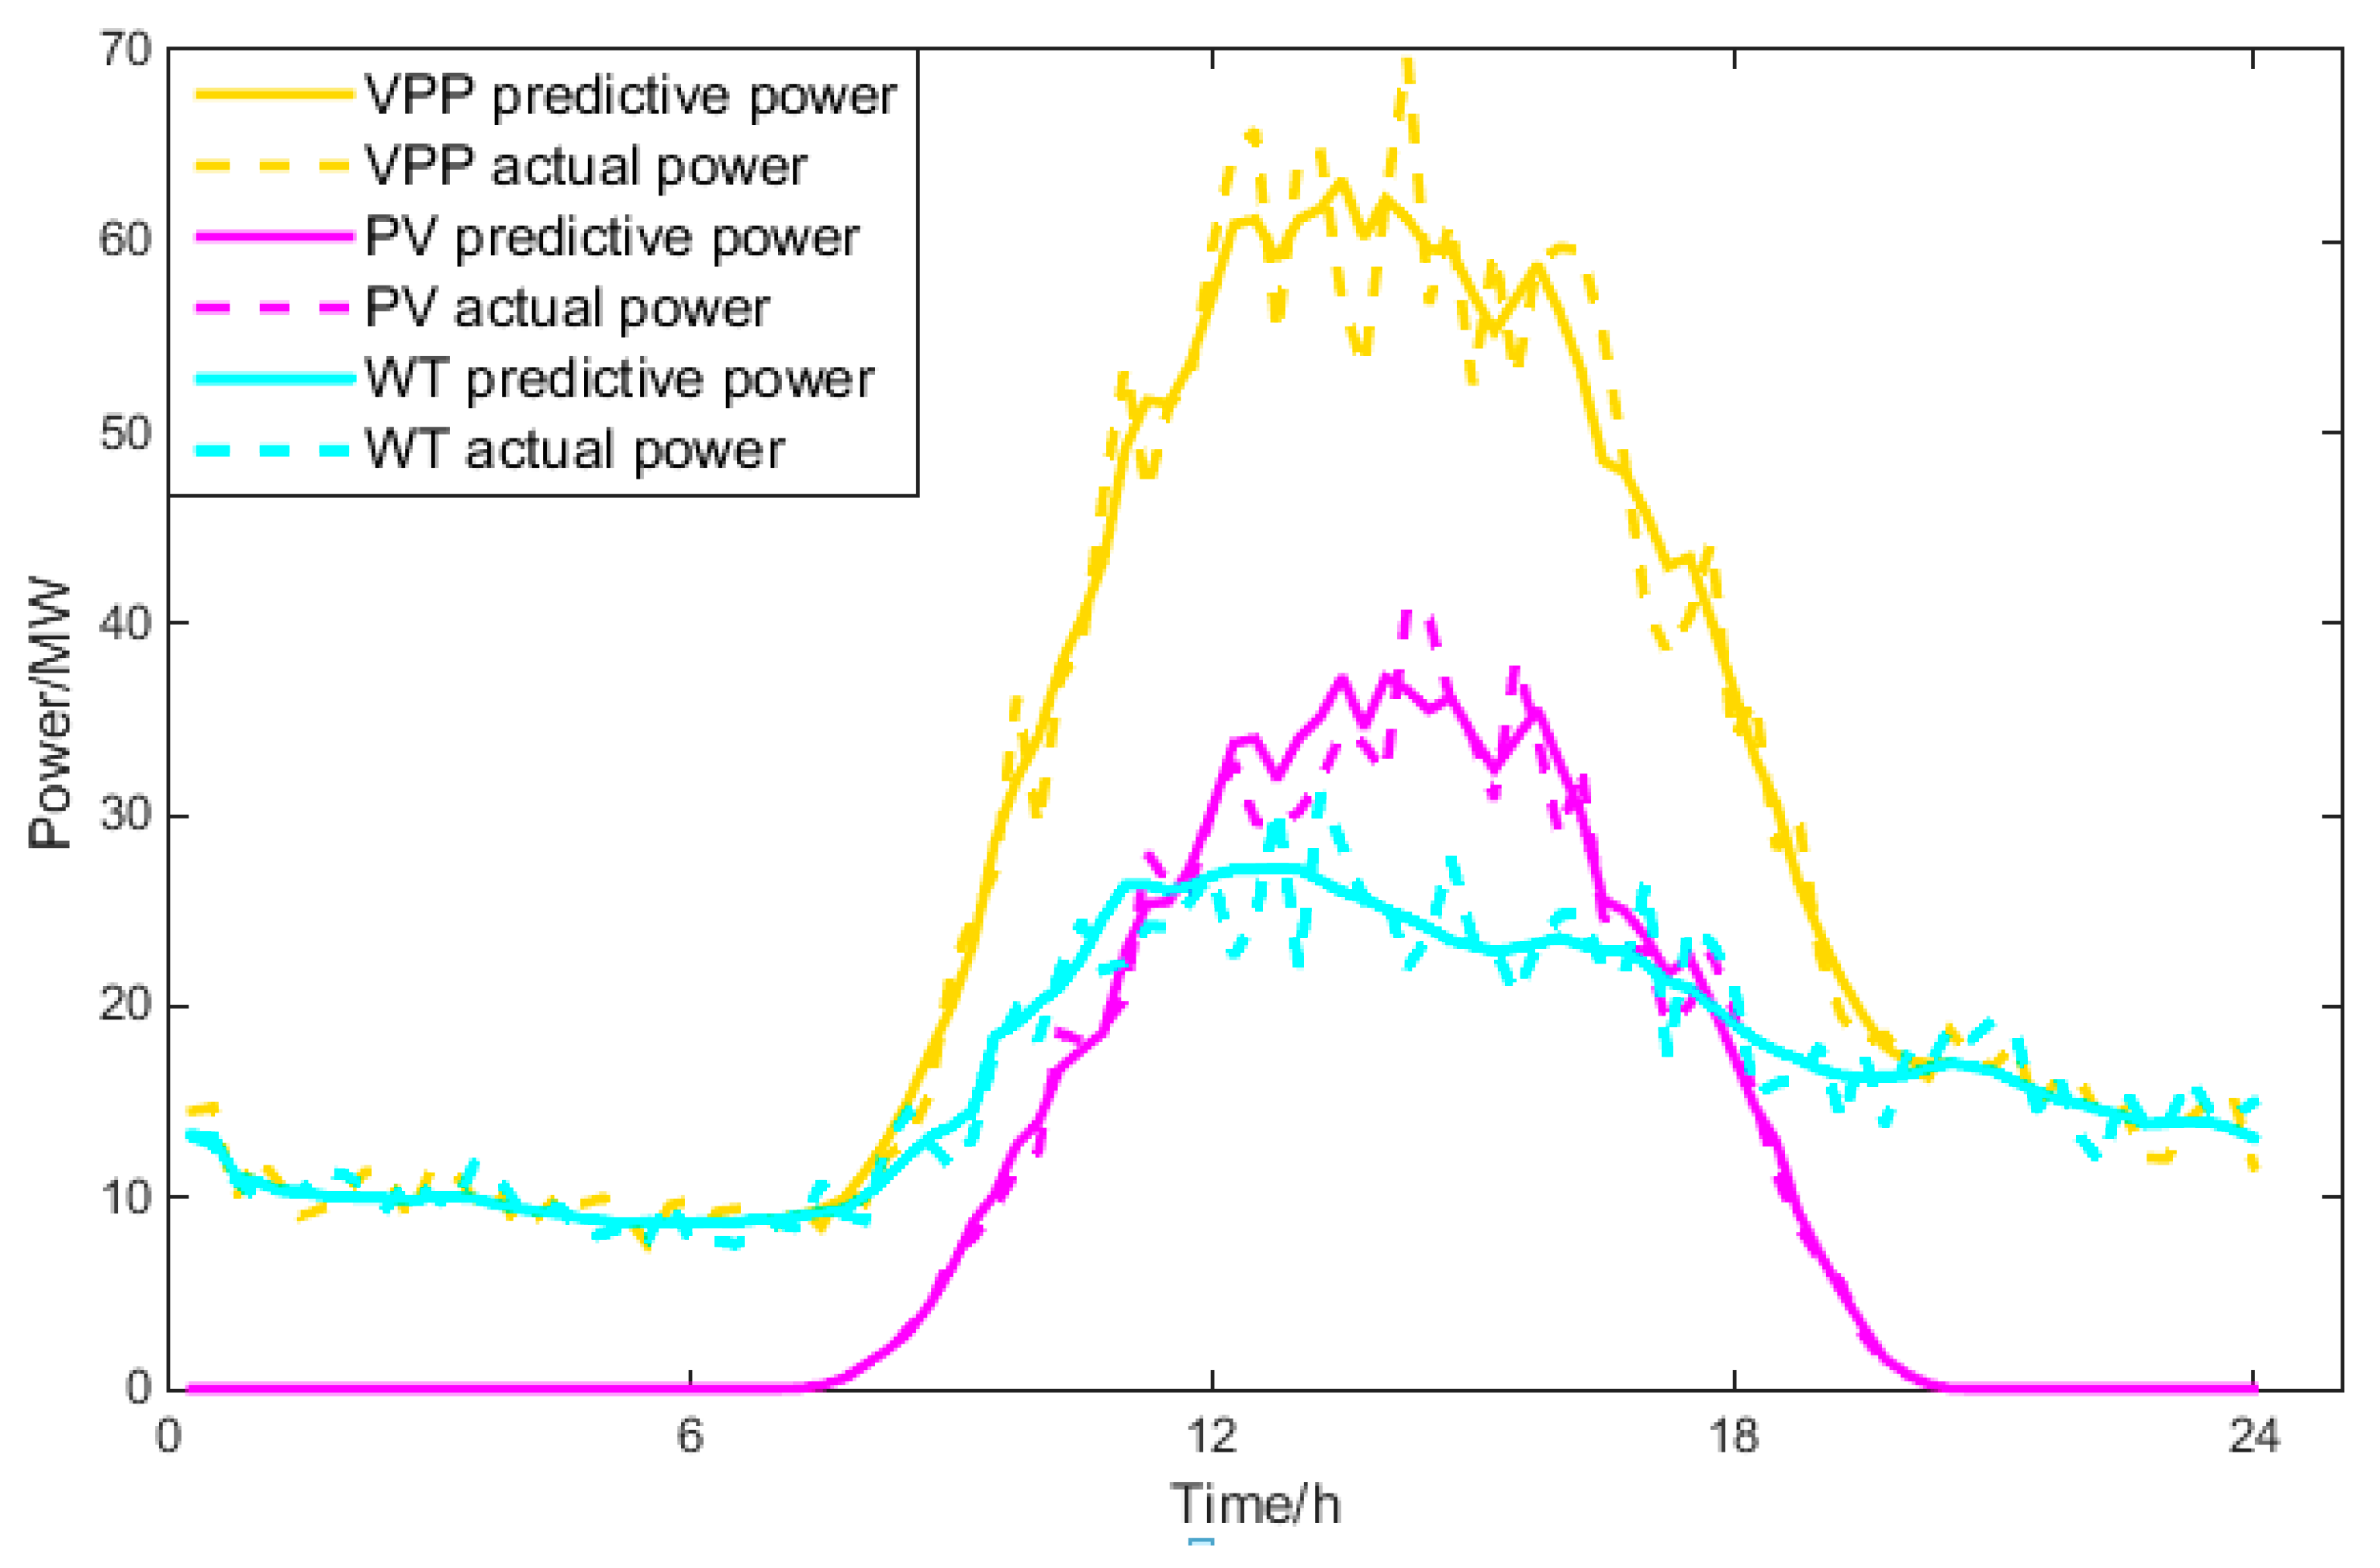
The output of the VPP is volatile and uncertain, so there is always a gap between the predicted output and the actual output. The renewable energy sources, such as WT and PV, are easily affected by the weather. Therefore, the fluctuation between the predicted output and the actual output of the VPP will have obvious differences under different typical scenarios in different seasons. The following is a detailed analysis of the optimal output of the VPP in typical scenarios 2 and 12.
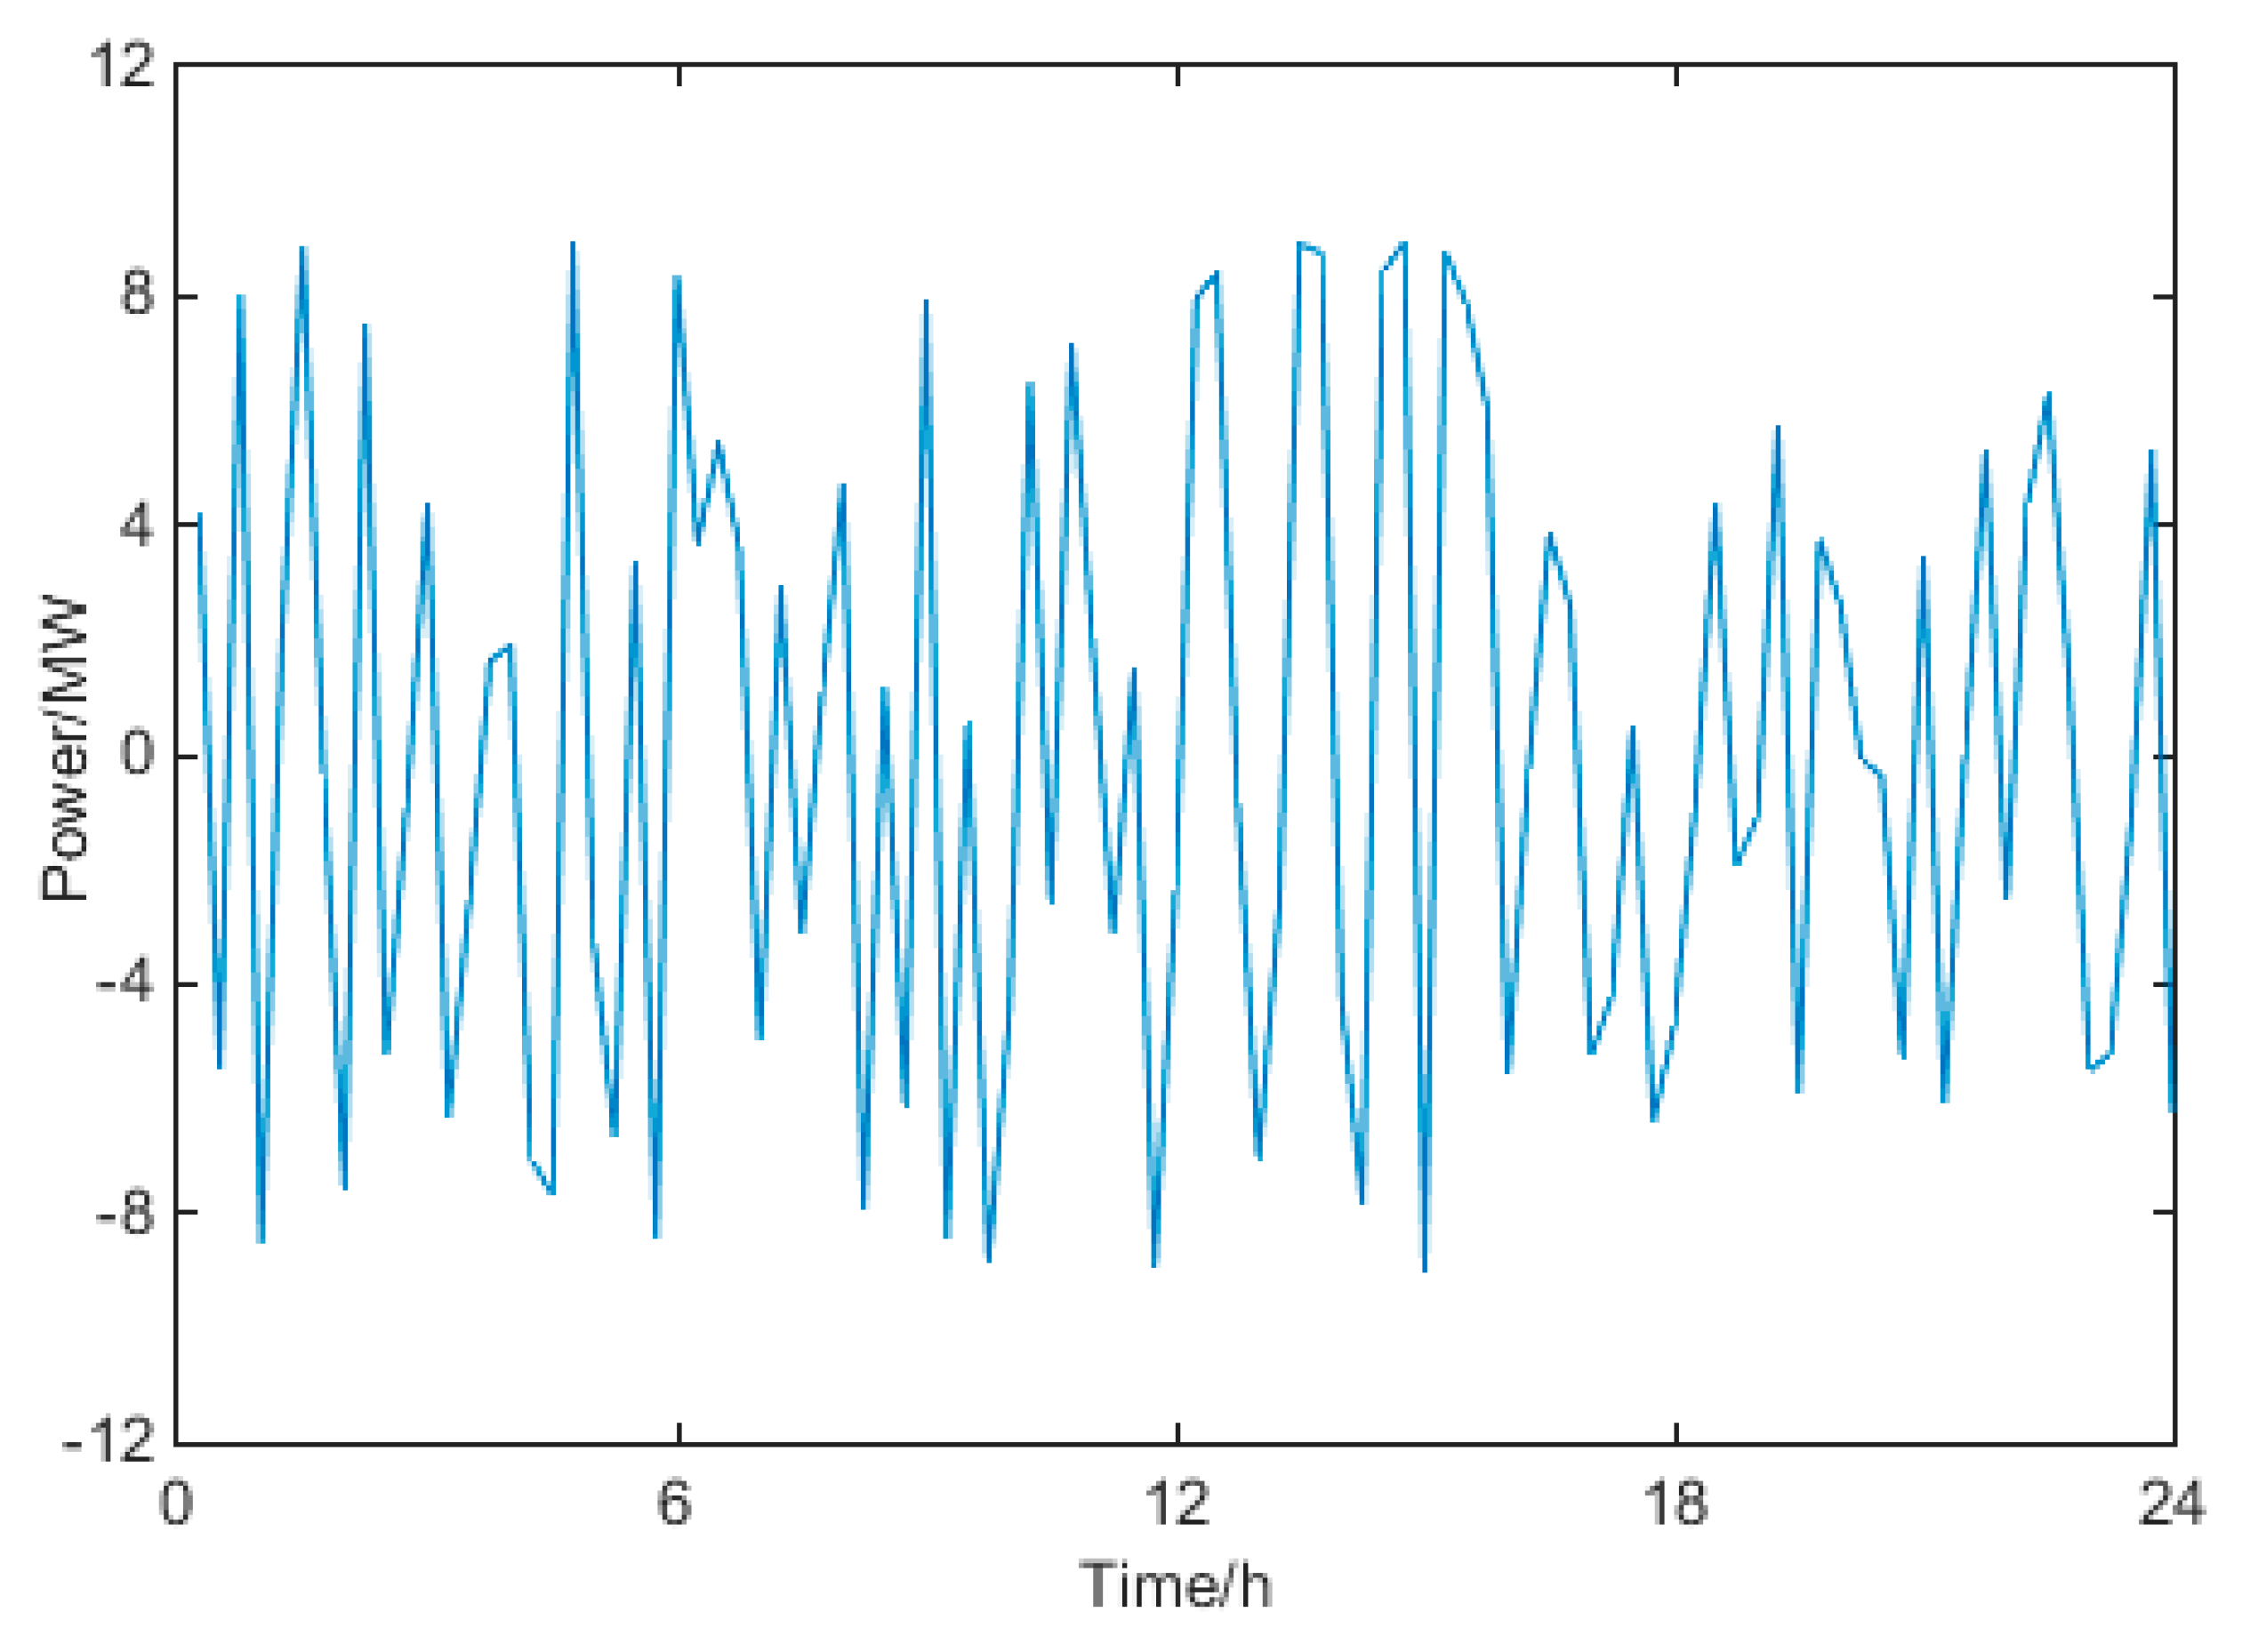
Figure 6 shows the WT and PV forecast and actual output, and VPP predictive and actual output under typical scenario 2. It can be clearly seen that the fluctuation of WT and PV output and the deviation between the predicted output and the actual output. The deviation directly affects the reward-punishment revenue of the VPP. In order to reduce the deviation between the predicted output and the actual output, energy storage resources (interruptible load and distributed energy storage, etc.) can be invested to make up the gap between the two. The energy storage has charging and discharging within 24 h, and its output curve is shown in Figure 7 (positive number is charging, negative number is discharging).
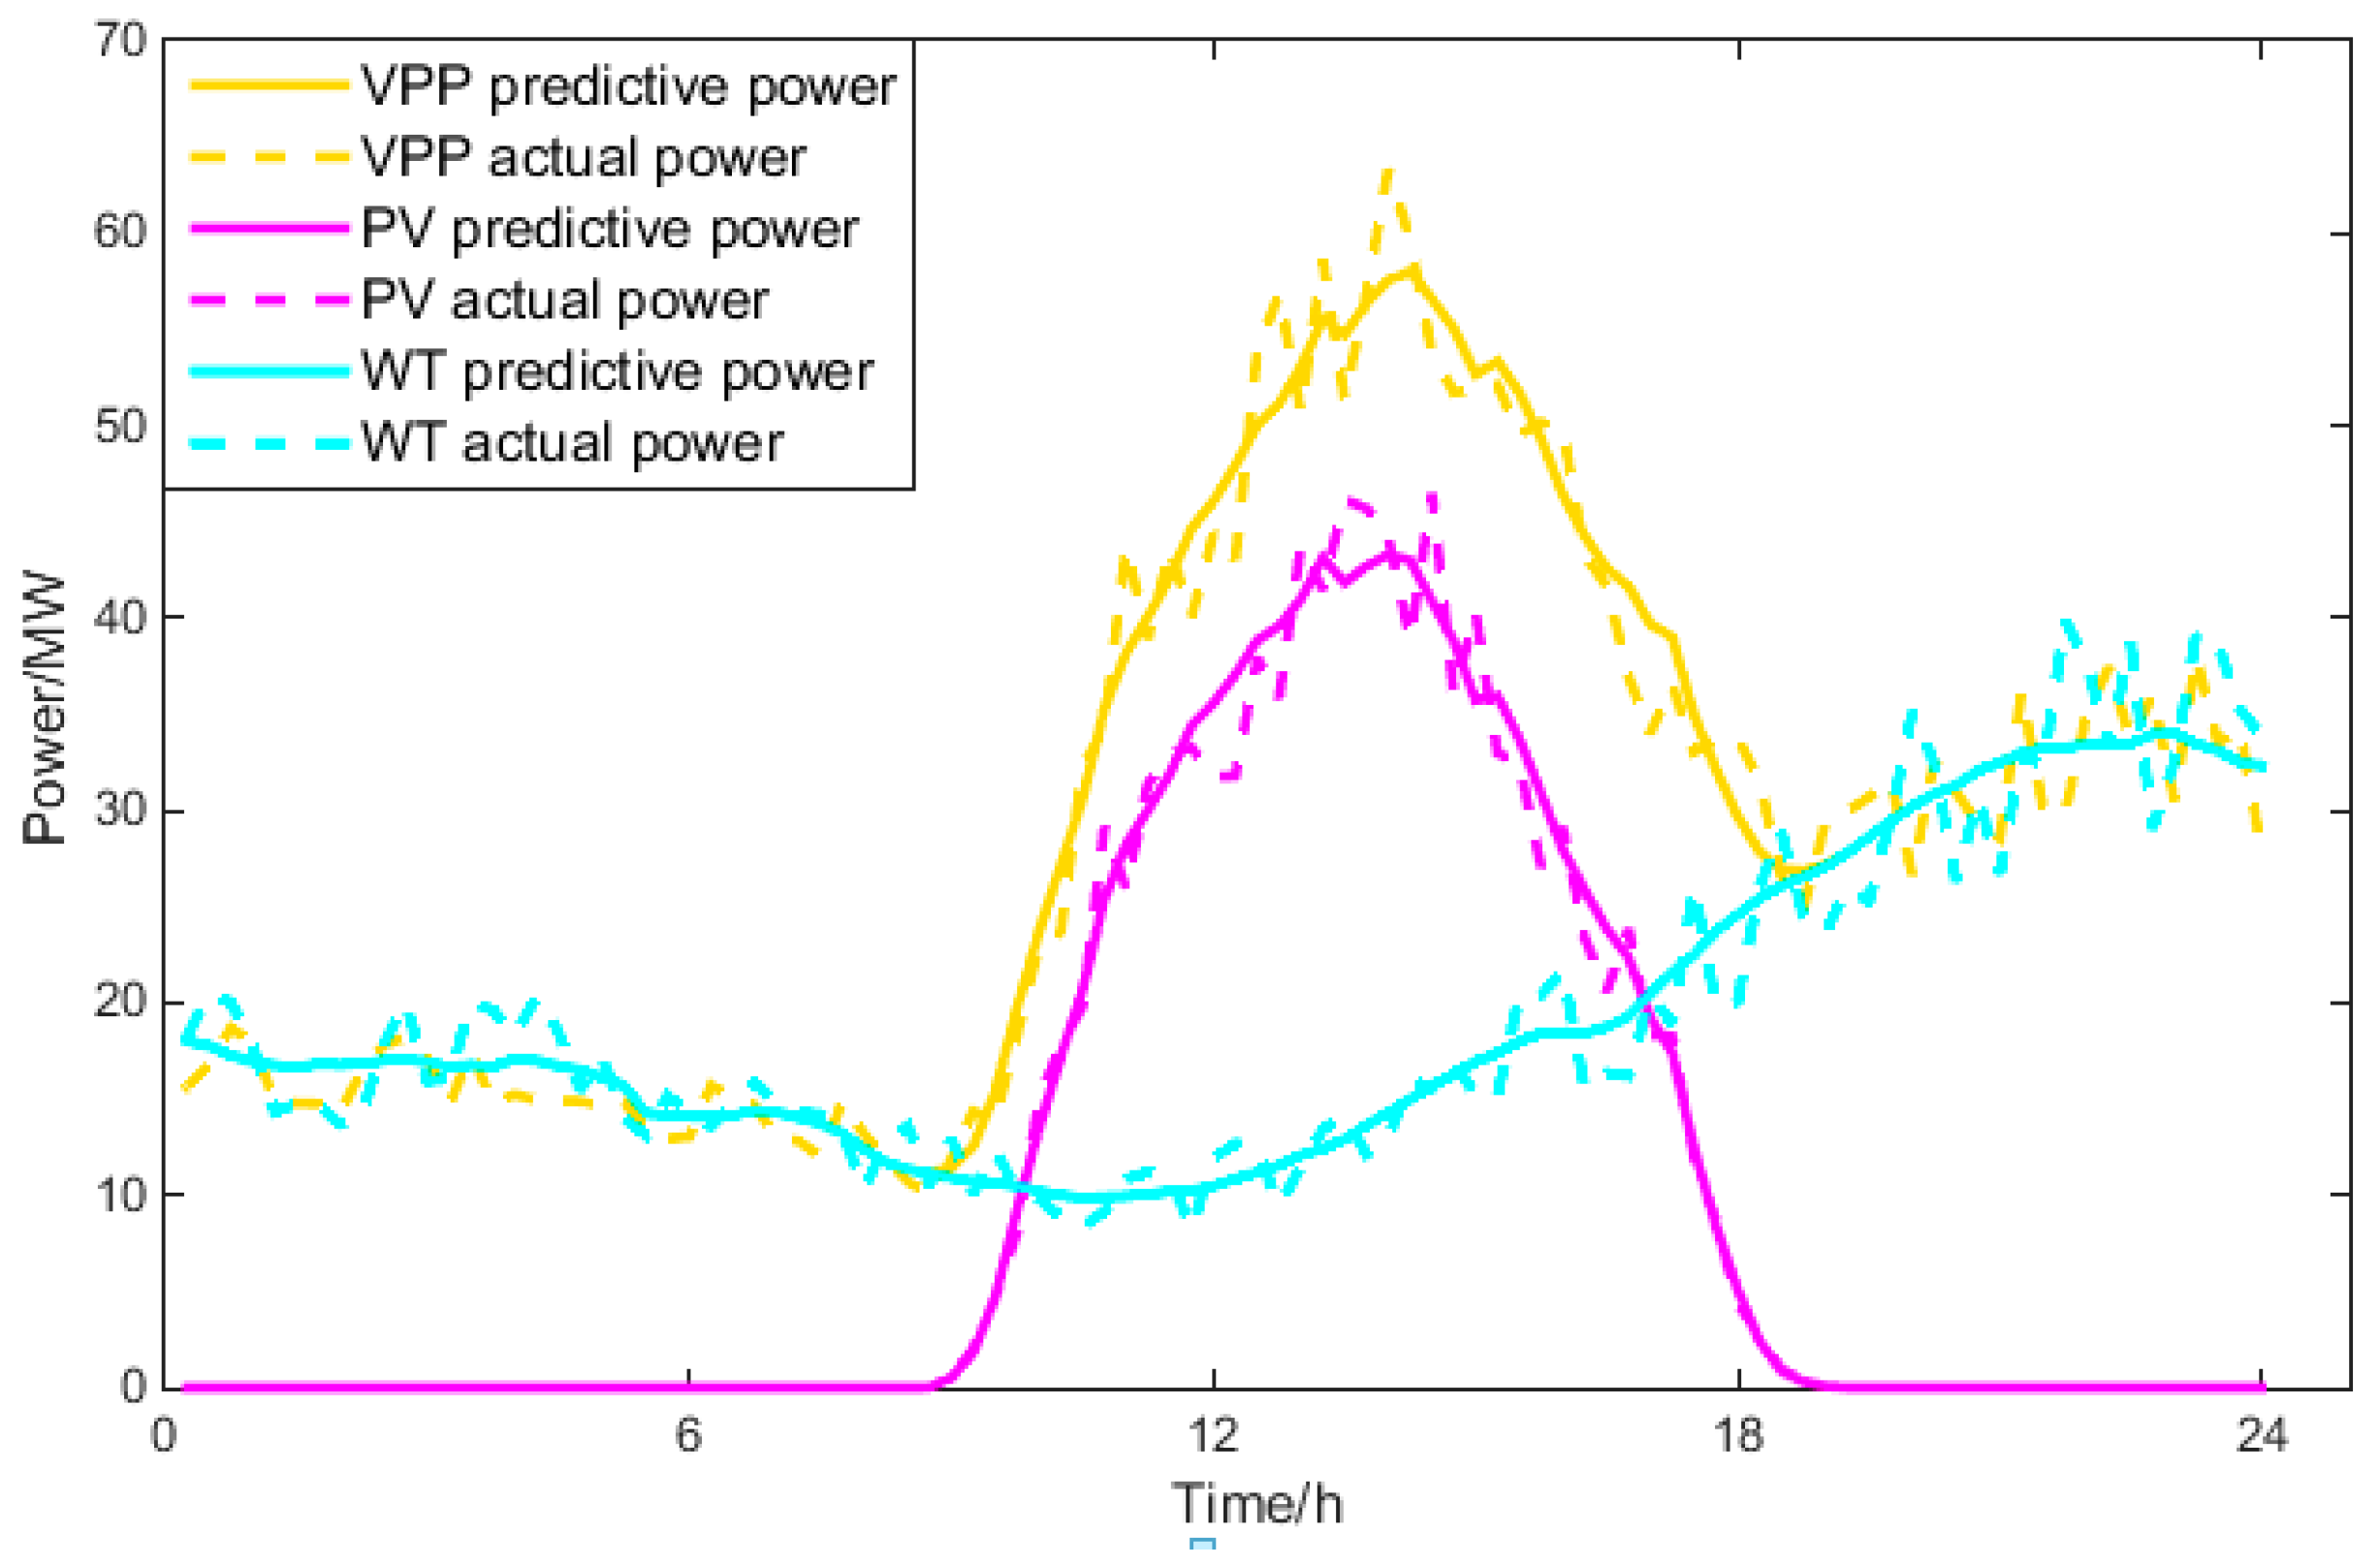
The output curve of VPP under typical scenario 12 is shown in Figure 8, and the output curve of energy storage invested to smooth the output curve of VPP is shown in Figure 9.
Figure 8 shows the forecast and actual output of the WT and PV power output and the forecast and actual output of the VPP in typical scenario 12. From this, it can be clearly seen that the volatility of WT and PV power output is slightly larger than that of the typical scenario 2, and the deviation between the corresponding predicted output and the actual output has also increased slightly. Therefore, the energy storage resources needed to smooth the output of the VPP also increases, just as shown in Figure 9.
To improve the output curves and acquire more revenue, the optimal stable energy storage capacity needed in different typical scenarios is listed in Table 3. It can be seen in the table that the energy storage capacity used to balance the output of VPP to participating in the power grid dispatching is no more than 15 MW, which is one-half. However, in reality, there may be a large deviation between the predictive output and the actual output, as shown in Figure 10 (named scenario 13). It may be necessary to put most of the energy storage capacity into the power grid dispatching.
5.4. Optimization Analysis of Typical Scenario Revenue of Virtual Power Plant
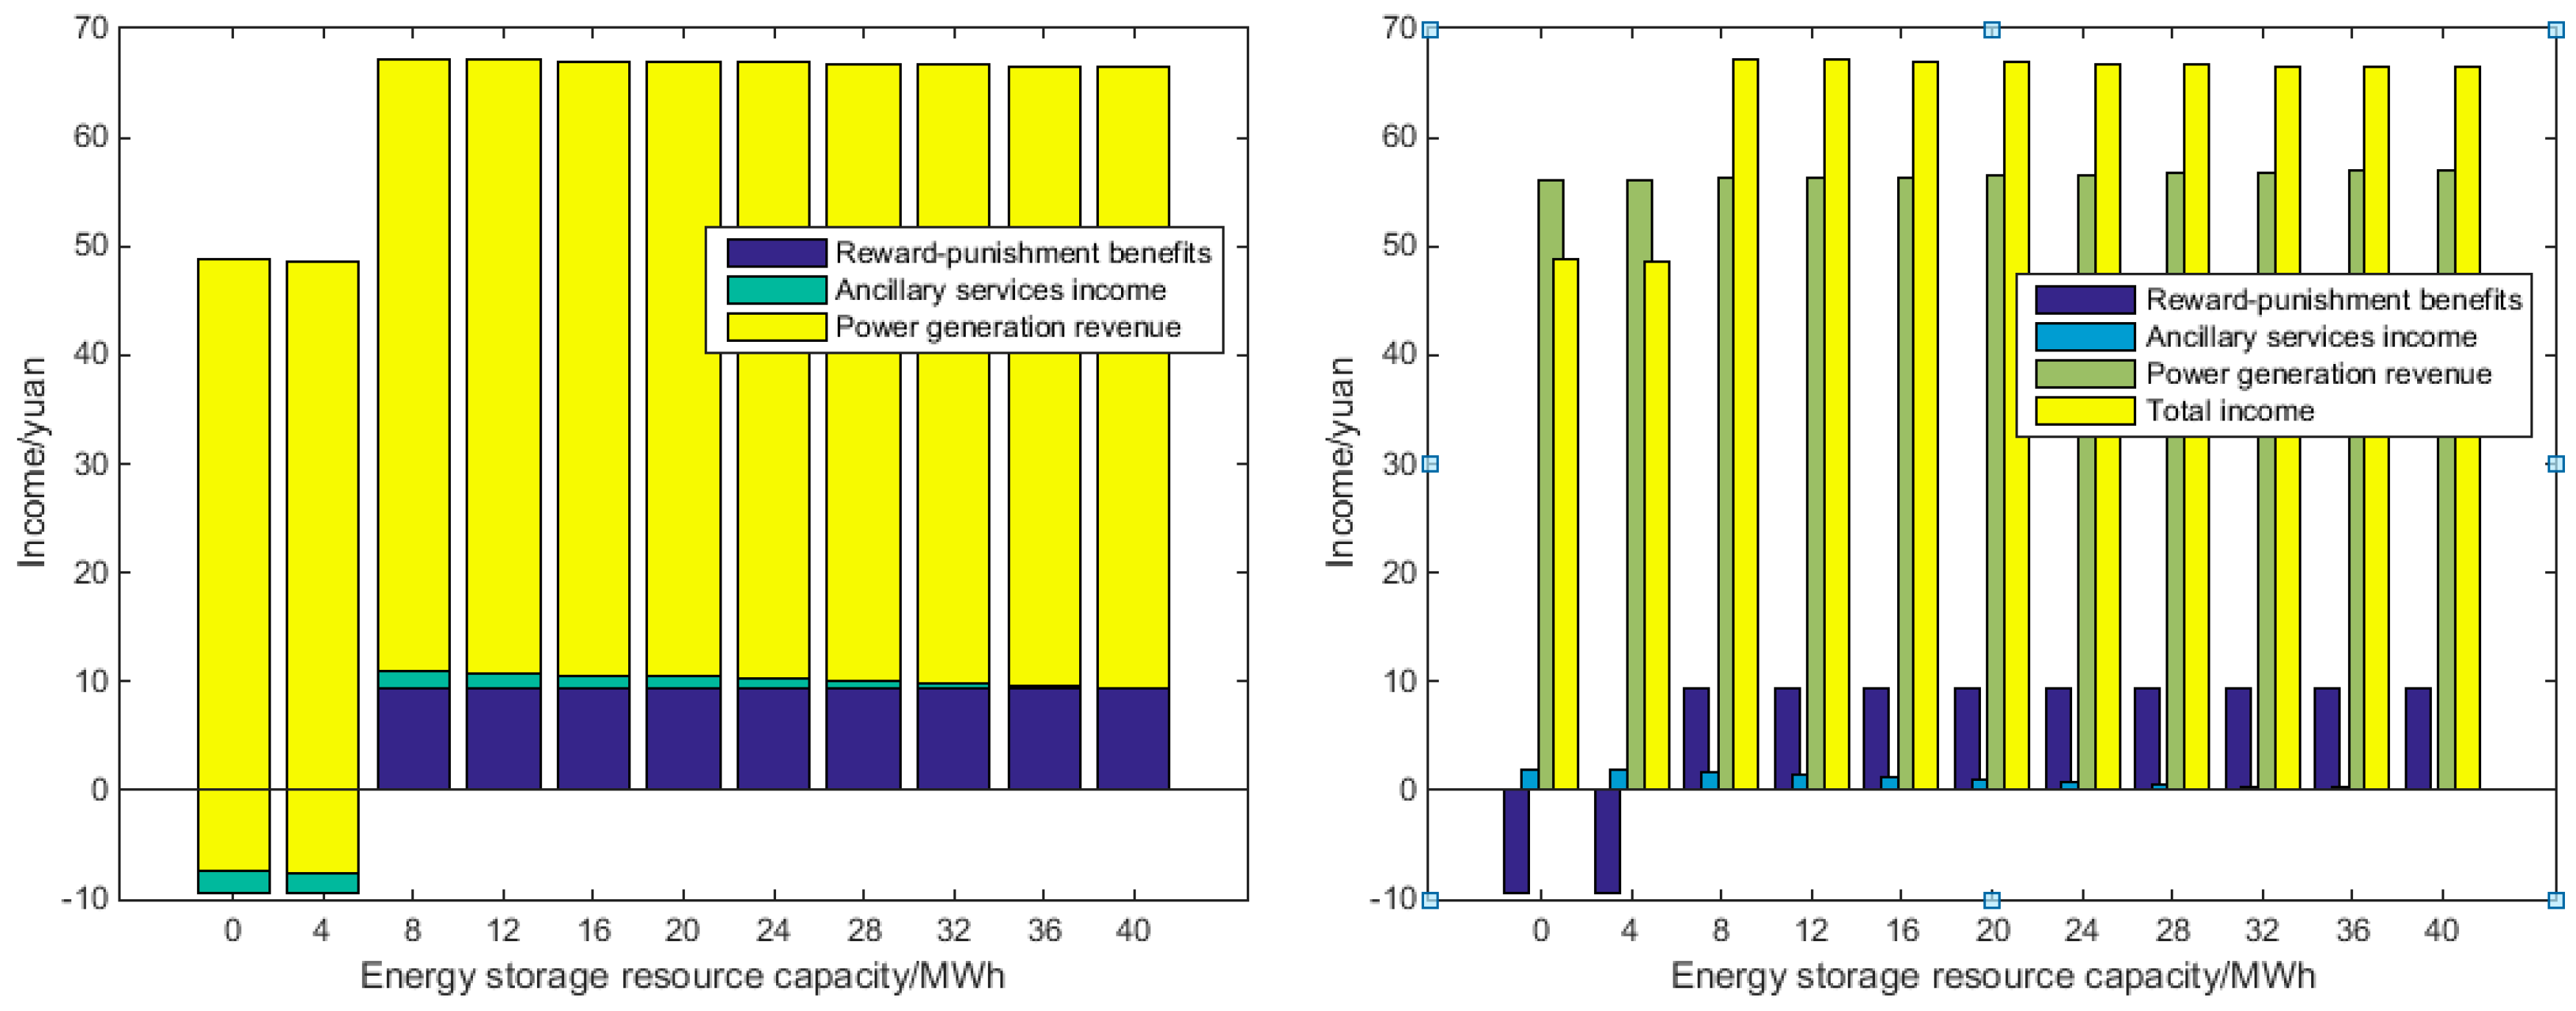
The revenue of a VPP consists of three parts: power grid dispatching revenue, reward-punishment revenue, and auxiliary services revenue. Through optimizing the output curves of VPP, the deviation between the predicted output and the actual output are obviously reduced, but the reward-punishment revenue is increased. Then we take typical scenarios 2 and 12 as examples to analyze the revenue in detail. After optimizing the output of VPP participating in the power grid dispatching in the previous chapter, the various benefits of VPP when investing energy storage resources of different capacities are shown in Table 4 and Figure 11.
Combined with Table 4 and Figure 11, it can be seen that with the increase of the capacity of the energy storage resources invested in the adjustment of VPP output curve, the power grid dispatching revenue and auxiliary service revenue of the VPP change slowly, and the power grid dispatching revenue has a less obvious increase. Revenue from ancillary services is decreased slightly. The reward-punishment revenue and total revenue of the VPP show a very obvious upward trend when the capacity of energy storage resources is 8 MW, which has increased significantly. And the output balance of VPP participating in power grid dispatching is guaranteed as much as possible. This greatly increases the reward-punishment revenue, and also changes the total revenue of the VPP.
Under typical scenario 12, the various benefits of VPP are shown in Table 5 and Figure 12 when investing energy storage resources of different capacities.
According to Table 5 and Figure 12, it can be seen that with the increase of the capacity of the energy storage resources invested in the adjustment of the VPP output curve, the power grid dispatching revenue has a less obvious increase. Revenue from ancillary services decreased slightly. The reward-punishment revenue and total revenue of the VPP show a very obvious upward trend when the capacity of energy storage resources is 12 MW, which has increased significantly.
The benefits of the 12 typical scenarios are shown in Table 6.
In Table 6 and Figure 13, it is shown that the revenues of the VPP in 12 typical scenarios in spring, summer, autumn and winter only participate in the power grid dispatching or in the power grid dispatching and auxiliary service markets at the same time, which is called the initial and optimal revenue. From the above, it can be seen that the optimal revenue shows a significant increase over the initial revenue. The revenue of scenario 1 increases from 285,000 CNY to 479,000 CNY, the revenue of scenario 2 increases from 487,000 CNY to 671,000 CNY, the revenue of scenario 3 increases from 321,000 CNY to 537,000 CNY, and other scenarios also increase, and the increase amplitude ranges from 100,000 CNY to 300,000 CNY. It indicates that the rational distribution of energy storage and other stable resources can effectively improve the profits efficiency of VPP.
For the scenarios where the deviations between the actual output and the predicted output are large, as in scenario 13, the more energy storage resources required to be invested, and the corresponding revenue is shown in Table 7.
It can be seen from Table 7 that when the energy storage capacity reaches 36 MWh, that is, 90% of the total energy storage capacity, the reward-punishment revenue can be changed from a negative value to a positive value, and the total revenue can also be increased significantly. In addition, in some cases, even if all the energy storage is put into the power grid dispatching, the output curve of VPP cannot be effectively improved, and the higher revenue cannot be obtained. At this time, the energy storage is no longer put into the power grid dispatching, and all participate in the ancillary services, the maximum revenue of VPP is the goal of the optimization.
5.5. Optimization Analysis of Annual Revenue of Virtual Power Plant
The output curves of spring, summer, autumn and winter each season are clustered into three representative typical scenarios, a total of 12 typical scenarios. The probability of each typical scenario appearing in a year can be seen from Figure 5. According to 365 days a year, the number of days of each typical scenario appearing in a year can be figure out. And multiply the revenue of the VPP in each typical scenario to get the annual revenue. This paper can analyze the annual operating revenue of this VPP on an annual basis. The corresponding data is shown in Table 8.
It can be seen from the increased revenue in Table 8 that after the reasonable scheduling of the power generation resources of the VPP, the revenue of each period in the whole year can be effectively improved, although some revenue increases are small, but there is an overall upward trend, which is a way to promote the operation of VPPs. By comparing the initial revenue of 130 million CNY and optimal revenue 203 million CNY in one year, it can be known that using the typical scenario optimal operation mode proposed in this paper can increase the annual revenue of the VPP, which is about 0.73 billion CNY.
Above all, it indicates that the VPP is suitable for allocating energy storage resources, participating in both the power grid dispatching and the auxiliary service. According to VPP’s output fluctuations, energy storage and other stable resources are reasonably allocated to obtain more profits, which provides a reference for the optimal operation strategy of the virtual power plant.
5.6. Application of VPP Optimization Model
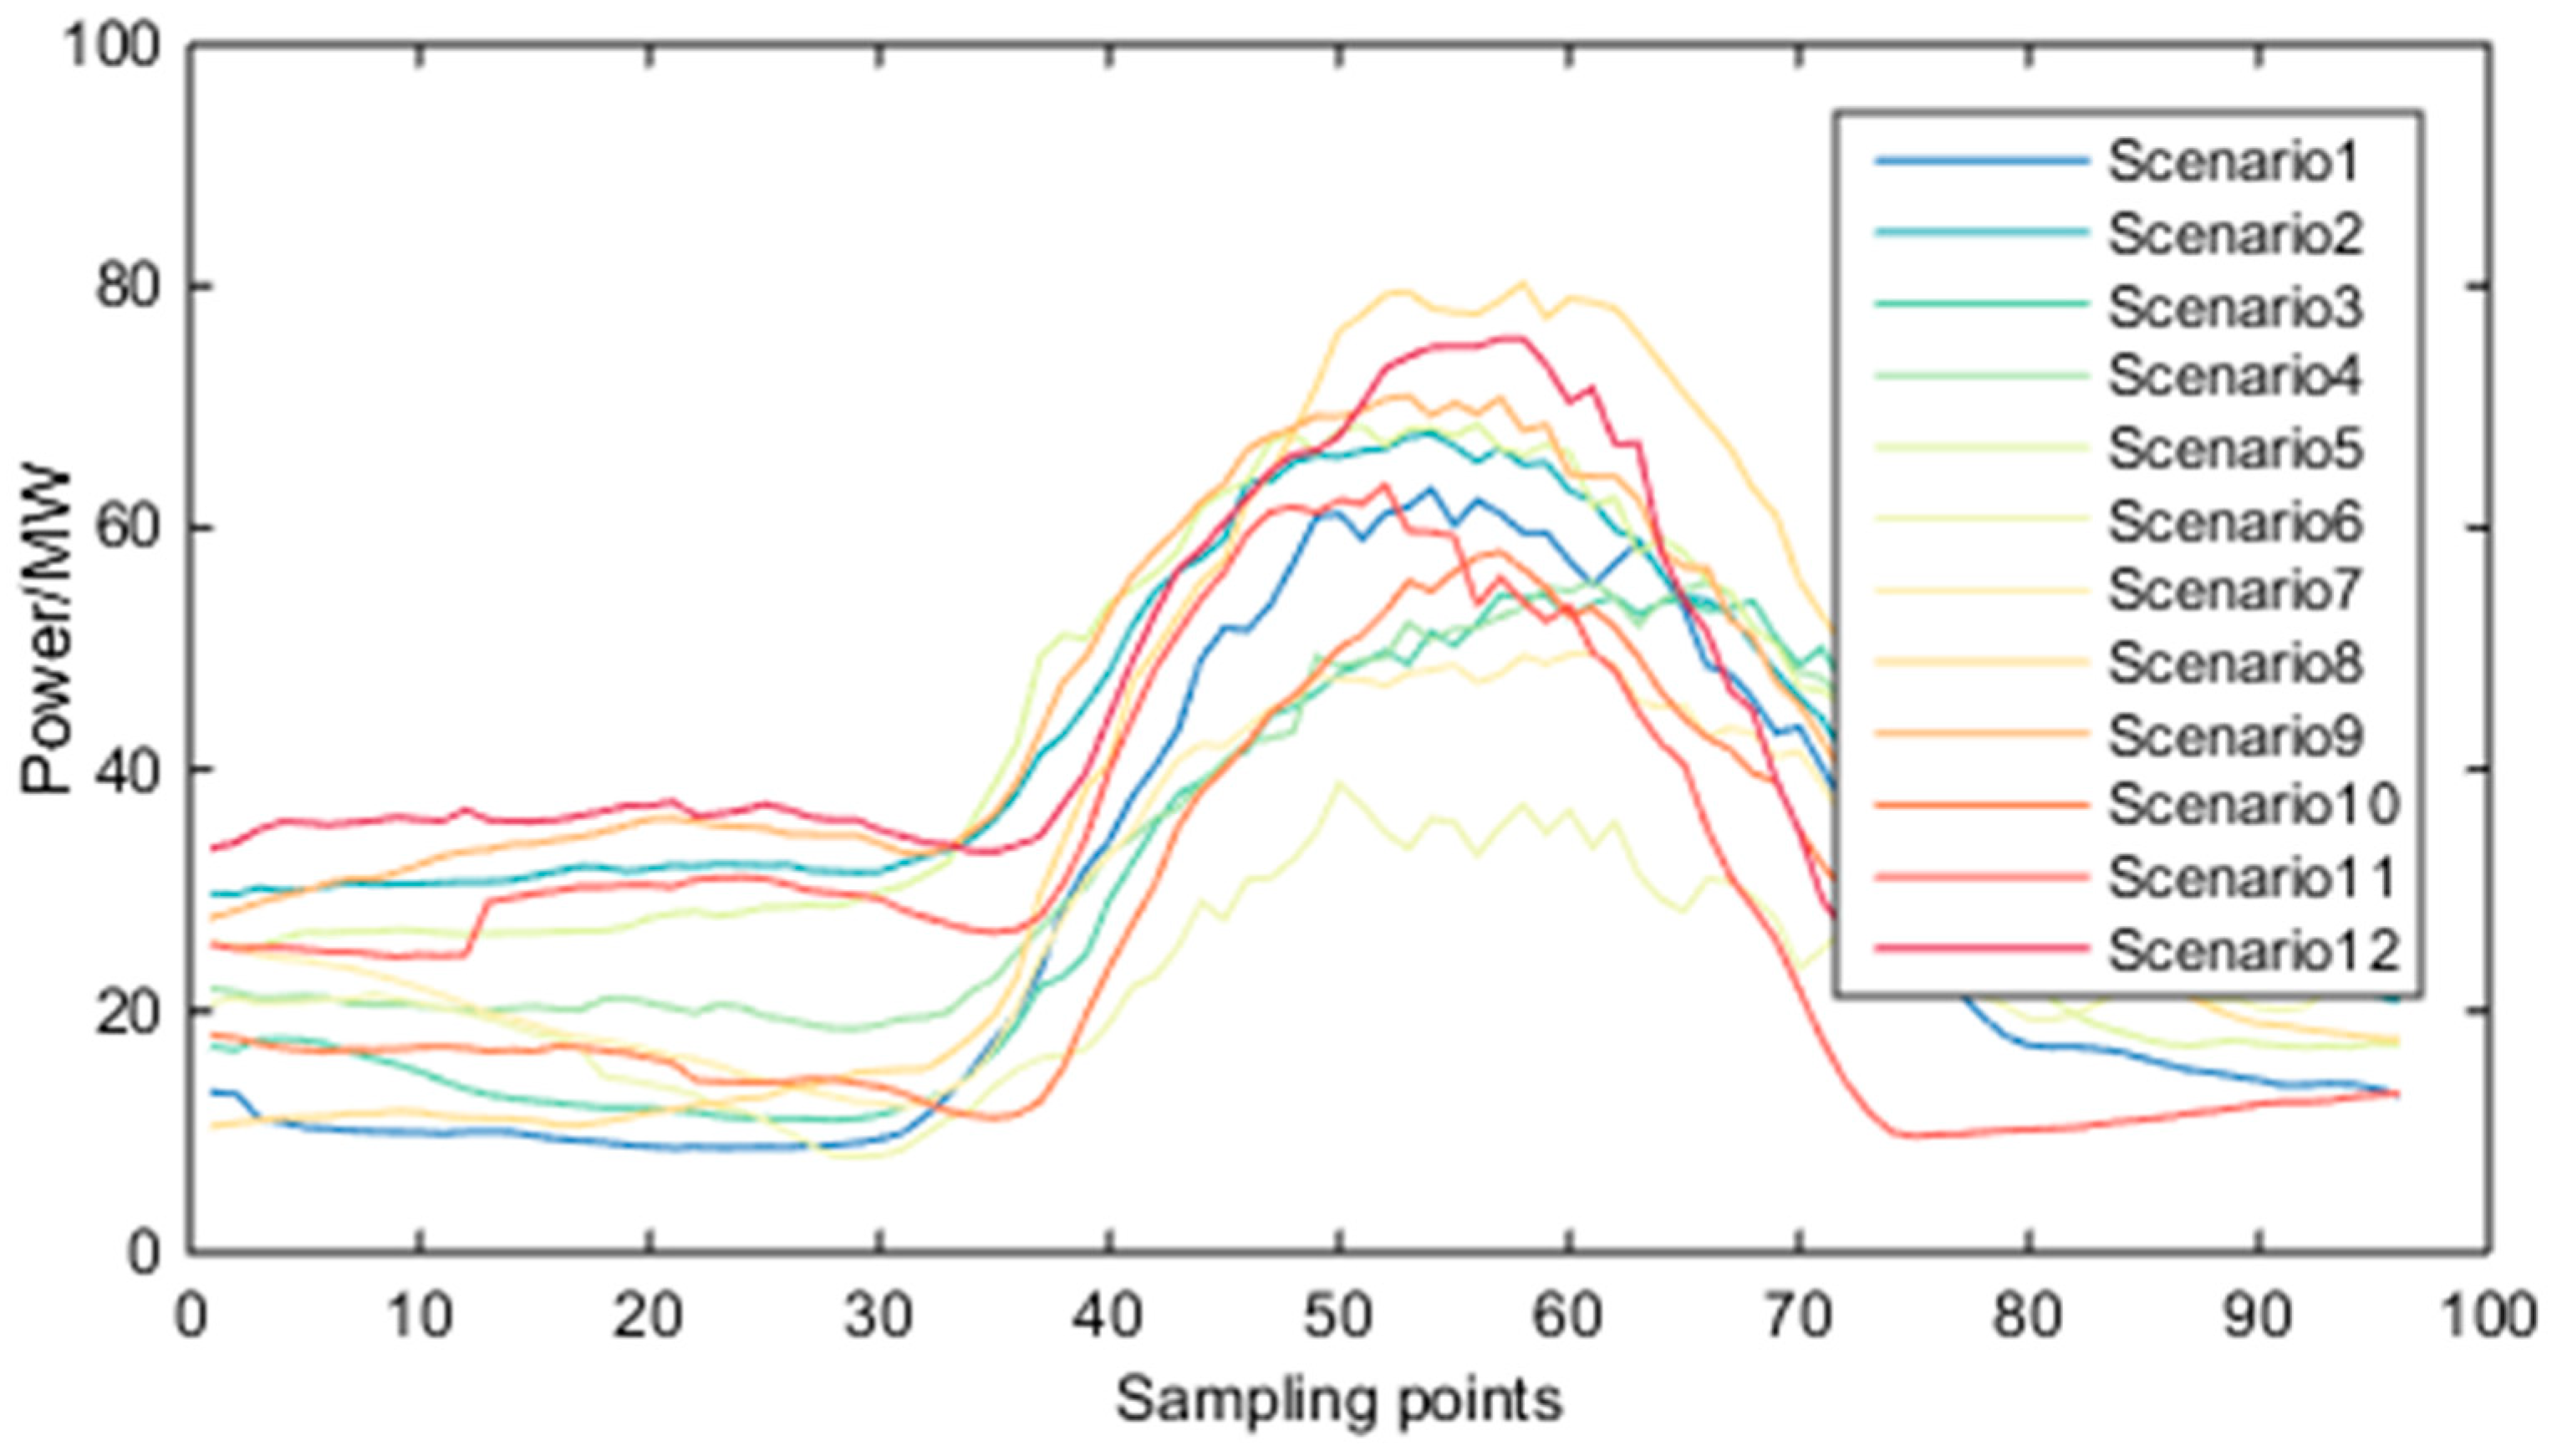
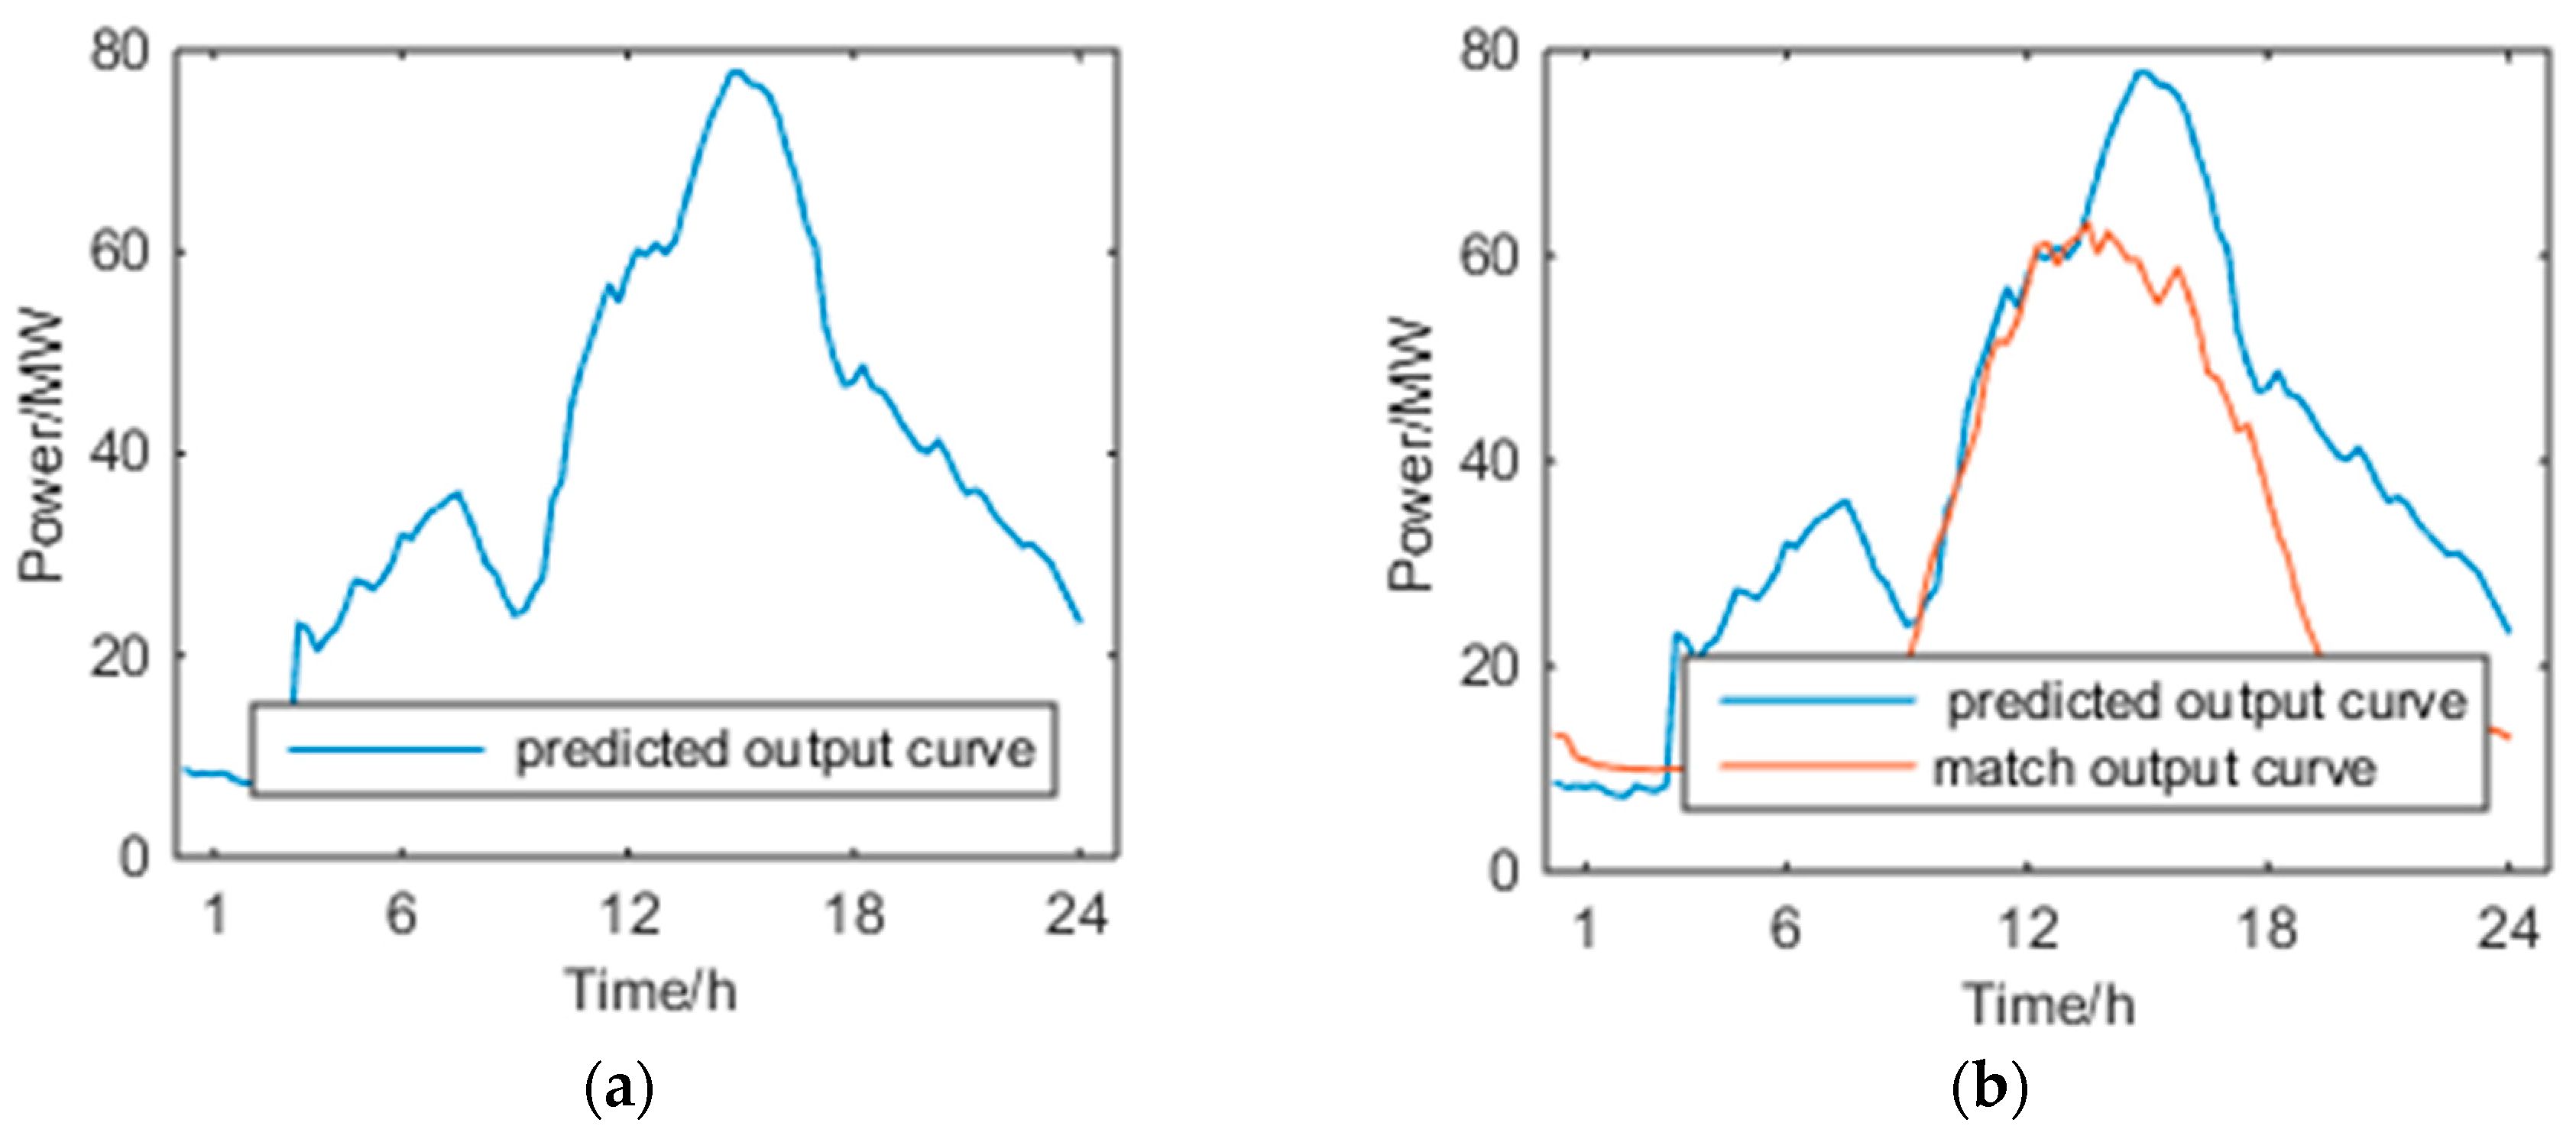
The typical scenario model library composed of the above 12 typical scenarios is shown in Figure 14. Taking the predicted output curve of the VPP as an example, the output curve is shown in Figure 15a. Compare it with the 12 typical output scenario curves in the typical scenario model library, and use the RMS algorithm to find the corresponding deviation errors, as shown in Table 9.
It can be seen from Table 9 that the predicted output curve has the smallest deviation, which is 106.16, from the scene in the model database, that is, the two are most similar. This is shown in Figure 15b, where blue is the predicted output curve and red is the typical scenario 8 output curve.
Referring to the energy storage ratio and operation strategy of scenario 8 in Table 5, the operator should use 12 MWh of energy storage capacity for power grid dispatching the next day to obtain the optimal revenue. The benefit of not using the optimized operation strategy is 21,870 CNY, the optimized income is 23,330 CNY, and the income is increased by 1460 CNY.
6. Conclusions
Based on the background of China, the revenue path of a VPP in our paper is mainly participating in power grid dispatching and auxiliary services. When participating in power grid dispatching, renewable sources like WT and PV are greatly affected by weather factors, and their output is unstable. This instability directly affects the reward-punishment revenue. Through proper scheduling of energy storage resources, the reward-punishment revenue can be effectively improved, thereby adjusting the expected revenues. All in all, the uncertainty of the output of WT and PV affects the expected revenues of VPP, and the rational allocation of energy storage resources can effectively improve this uncertainty and increase the revenue. This paper analyzes the profit model of the VPP with WT, PV power and energy storage, studies its operation strategy and puts forward the corresponding optimization operation strategy. In the course of the study, the following three conclusions can be drawn:
- When VPP participates in power grid dispatching, it will be constrained by the evaluation criteria. On the one hand, it is conducive to urging VPP to control the accuracy of the prediction results of participating in power grid dispatching output. On the other hand, it provides a reference basis for the optimal distribution of VPP power generation resources.
- The output curve of VPP is divided into 12 different typical scenarios through clustering, which helps to intuitively describe the output situation of VPP. At the same time, it can also digitize the output situation and provide convenience for the establishment of the next income model.
- From the typical scenario model library, the operators of the VPP can obtain the corresponding optimal operation mode by comparing the predicted output of the day-ahead into the model library, which greatly increases the calculation accuracy and improves the scheduling efficiency.
- The income optimization model of VPP can eliminate the intermittent and random influence of renewable generation on external systems through the combination optimization of internal energy resources, improve the power quality, and achieve the efficient use of renewable energy power generation. At the same time, through the optimization model, the best strategy for VPP operations can be obtained. Meanwhile, operators can obtain the maximum benefit, which engages their motivation.
This paper discusses the operation strategy of VPP containing WT, PV and distributed energy storage, and constructs typical output scenarios and a corresponding income optimization model for VPP. The feasibility of the model is verified by an example, and the typical operation scenarios of VPP are established. It is also proved that the income model can improve the income of VPP and provide a strategic reference for the operation of it.
Author Contributions
The author J.L. carried out the main research tasks and wrote the full manuscript, and Y.G. proposed the original idea, analysed and double-checked the results and the whole manuscript. W.Y. contributed to data processing and to writing and summarizing the proposed ideas, while Y.Y. and Z.Z. provided technical and financial support throughout. S.T. modified the English grammar and polished the whole manuscript.
Acknowledgments
This work is supported in part by the Nature Science Foundation of China (51607068), the Fundamental Research Funds for the Central Universities (2018MS082) and the Fundamental Research Funds for the Central Universities (2017MS090).
Conflicts of Interest
The authors declare no conflict of interest.
References
- Perera, A.T.D.; Coccolo, S.; Scartezzini, J.-L.; Mauree, D. Quantifying the impact of urban climate by extending the boundaries of urban energy system modeling. Appl. Energy 2018, 222, 847–860. [Google Scholar] [CrossRef] [Green Version]
- Morvaj, B.; Evins, R.; Carmeliet, J. Decarbonizing the electricity grid: The impact on urban energy systems, distribution grids and district heating potential. Appl. Energy 2017, 191, 125–140. [Google Scholar] [CrossRef]
- Chinabaogao. Analysis on Consumption Status and Structure of China Energy Industry in 2018. Available online: http://free.chinabaogao.com/nengyuan/201803/03133243912018.html (accessed on 13 March 2018).
- Zamani, A.G.; Zakariazadeh, A.; Jadid, S. Day-ahead resource scheduling of a renewable energy based virtual power plant. Appl. Energy 2016, 169, 324–340. [Google Scholar] [CrossRef]
- Ehsan, A.; Yang, Q. Optimal integration and planning of renewable distributed generation in the power distribution networks: A review of analytical techniques. Appl. Energy 2017, 210, 44–59. [Google Scholar] [CrossRef]
- Robu, V.; Chalkiadakis, G.; Kota, R.; Rogers, A.; Jennings, N.R. Rewarding cooperative virtual power plant formation using scoring rules. Energy 2016, 117, 19–28. [Google Scholar] [CrossRef] [Green Version]
- Nosratabadi, S.M.; Hooshmand, R.A.; Gholipour, E. Stochastic profit-based scheduling of industrial virtual power plant using the best demand response strategy. Appl. Energy 2016, 164, 590–606. [Google Scholar] [CrossRef]
- Fang, X.; Yang, Q.; Wang, W.; Yan, W. Coordinated dispatch in multiple cooperative autonomous islanded microgrids. Appl. Energy 2016, 162, 40–48. [Google Scholar] [CrossRef]
- Ali, M.; Millar, R.J.; Lehtonen, M. A Framework to Split the Benefits of DR Between Wind Integration and Network Management. IEEE Trans. Power Syst. 2018, 33, 1443–1450. [Google Scholar] [CrossRef]
- Azizivahed, A.; Naderi, E.; Narimani, H.; Fathi, M.; Narimani, M.R. A New Bi-Objective Approach to Energy Management in Distribution Networks with Energy Storage Systems. IEEE Trans. Sustain. Energy 2018, 9, 56–64. [Google Scholar] [CrossRef]
- Xie, J.; Cao, C. Non-Convex Economic Dispatch of a Virtual Power Plant via a Distributed Randomized Gradient-Free Algorithm. Energies 2017, 10, 1051. [Google Scholar] [CrossRef]
- Chen, G.; Li, J. A fully distributed ADMM-based dispatch approach for virtual power plant problems. Appl. Math. Model. 2017, 58, 300–312. [Google Scholar] [CrossRef]
- Ye, X.; Le, J.; Liu, Y.; Zhou, W.; Liu, K. A coordinated consistency voltage stability control method of active distribution grid. J. Mod. Power Syst. Clean Energy 2018, 6, 85–94. [Google Scholar] [CrossRef]
- Tan, Z.; Li, H.; Ju, L.; Tan, Q. Joint Scheduling Optimization of Virtual Power Plants and Equitable Profit Distribution Using Shapely Value Theory. Math. Probl. Eng. 2018, 2018, 1–13. [Google Scholar] [CrossRef] [Green Version]
- Kardakos, E.G.; Simoglou, C.K.; Bakirtzis, A.G. Optimal Offering Strategy of a Virtual Power Plant: A Stochastic Bi-Level Approach. IEEE Trans. Smart Grid 2016, 7, 794–806. [Google Scholar] [CrossRef]
- Qiu, J.; Zhao, J.; Yang, H.; Dong, Z.Y. Optimal Scheduling for Prosumers in Coupled Transactive Power and Gas System. IEEE Trans. Power Syst. 2017, 33, 1970–1980. [Google Scholar] [CrossRef]
- Koraki, D.; Strunz, K. Wind and Solar Power Integration in Electricity Markets and Distribution Networks Through Service-Centric Virtual Power Plants. IEEE Trans. Power Syst. 2018, 33, 473–485. [Google Scholar] [CrossRef]
- Shayegan-Rad, A.; Badri, A.; Zanganeh, A. Day-ahead scheduling of virtual power plant in joint energy and regulation reserve markets under uncertainties. Energy 2017, 121, 114–125. [Google Scholar] [CrossRef]
- Asif, M.; Muneer, T. Energy supply, its demand and security issues for developed and emerging economies. Renew. Sustain. Energy Rev. 2007, 11, 1388–1413. [Google Scholar] [CrossRef]
- Ju, L.; Tan, Z.; Yuan, J.; Tan, Q.; Li, H.; Dong, F. A bi-level stochastic scheduling optimization model for a virtual power plant connected to a wind–photovoltaic–energy storage system considering the uncertainty and demand response. Appl. Energy 2016, 171, 184–199. [Google Scholar] [CrossRef] [Green Version]
- Reddy, S.S.; Bijwe, P.R. Day-Ahead and Real Time Optimal Power Flow considering Renewable Energy Resources. Int. J. Electr. Power Energy Syst. 2016, 82, 400–408. [Google Scholar] [CrossRef]
- Alvarez, C.; Gabaldon, A.; Molina, A. Assessment and simulation of the responsive demand potential in end-user facilities: Application to a university customer. Power Syst. IEEE Trans. 2004, 19, 1223–1231. [Google Scholar] [CrossRef]
- Zhang, J.; Li, W.; Yang, H. Study on menu-pricing of controllable load demand response considering different demand and preference. J. Electr. Power Technol. 2015, 30, 111–118. [Google Scholar]
- Zeng, C.; Zhang, B.; Xie, P.; Cao, N. Risk management based optimal allocation of generation capacity between open access energy market and reserve market. Power Syst. Technol. 2004, 28, 70–74. [Google Scholar]
- South China Energy Regulatory Office of National Energy Administration. Implementation Rules for the Operation of Wind Power Field in the Southern Region and the Management of Auxiliary Services (2017 Edition). 2017. Available online: http://120.31.132.37:8085/SCSERC_OUTER/temp/examples/upfileattch/70228872_wz_towaiwang.pdf (accessed on 25 December 2017).
- Northwest China Energy Regulatory Office of National Energy Administration. Measures for the Evaluation and Management of Photovoltaic Power Stations Connected to the Qinghai Power Grid (Trial). 2013. Available online: http://www.docin.com/p-711717878.html (accessed on 6 June 2014).
- National Energy Administration. Measures for the Management of Distributed Power Generation (Consultation Draft). 2018. Available online: http://zfxxgk.nea.gov.cn/auto87/201803/t20180323_3132.htm. (accessed on 20 March 2018).
Figure 1.
Components of a virtual power plant (VPP).

Figure 2.
Virtual power plant revenue.

Figure 3.
Solar energy output curve clustering recognition based on self-organization map (SOM).

Figure 4.
Model solution flow diagram.

Figure 5.
The output curves and probabilities of typical scenarios of all seasons. (a) The output of typical scenarios in spring; (b) The probabilities of typical scenarios in spring; (c) The output of typical scenarios in summer; (d) The output of typical scenarios in autumn; (e) The output of typical scenarios in autumn; (f) The probabilities of typical scenarios in autumn; (g) The output of typical scenarios in winter; (h) The output of typical scenarios in winter.


Figure 6.
The output curves of typical scenario 2.

Figure 7.
The output curve of energy storage resources of typical scenario 2.

Figure 8.
The output curves of typical scenario 12.

Figure 9.
The output curve of energy storage resources of typical scenario 12.

Figure 10.
VPP predictive power and actual power of typical scenario 13.

Figure 11.
The revenue of VPP of typical scenario 2.

Figure 12.
The revenue of VPP of typical scenario 12.

Figure 13.
Virtual power plant initial revenue and optimal revenue comparison chart ().

Figure 14.
12 Typical output scenario curves in the typical scenario model library.

Figure 15.
Output curves: (a) The predicted output curve of someday; (b) The predicted output curve of someday and most similar typical scenario output curve.
Figure 15.
Output curves: (a) The predicted output curve of someday; (b) The predicted output curve of someday and most similar typical scenario output curve.


Table 1.
Calculation parameters.
| Parameters | Parameter Value |
|---|---|
| 140 MWh | |
| 40 MWh | |
| 0.6 CNY/kWh | |
| 0.5 CNY/kWh |
Table 2.
Reward-punishment factors.
| 0~5 (%) | 5~10 (%) | 10~30 (%) | 30~50 (%) | >50 (%) | |
|---|---|---|---|---|---|
| (CNY/kWh) | 0.1 | −0.1 | −0.2 | −0.3 | −0.5 |
Table 3.
The stable energy storage capacity allocated to improve VPP output.
| Scenarios | Spring | Summer | Autumn | Winter | ||||||||
|---|---|---|---|---|---|---|---|---|---|---|---|---|
| 1 | 2 | 3 | 4 | 5 | 6 | 7 | 8 | 9 | 10 | 11 | 12 | |
| Pser-max (MW) | 6 | 6 | 9 | 3 | 6 | 3 | 6 | 9 | 12 | 9 | 15 | 12 |
| Eser-max (MWh) | 8 | 8 | 12 | 4 | 8 | 4 | 8 | 12 | 16 | 12 | 20 | 16 |
P is the stable energy storage power; E is the stable energy storage capacity.
Table 4.
The revenue of VPP of typical scenario 2.
| (MWh) | 0 | 4 | 8 | 12 | 16 | 20 | 24 | 28 | 32 | 36 | 40 |
|---|---|---|---|---|---|---|---|---|---|---|---|
| Rass (×104 CNY) | −9.34 | −9.35 | 9.36 | 9.38 | 9.40 | 9.41 | 9.43 | 9.44 | 9.46 | 9.48 | 9.49 |
| Rser (×104 CNY) | 2.00 | 1.80 | 1.60 | 1.40 | 1.20 | 1.00 | 0.80 | 0.60 | 0.40 | 0.20 | 0.00 |
| Relc (×105 CNY) | 5.61 | 5.61 | 5.62 | 5.63 | 5.64 | 5.65 | 5.66 | 5.67 | 5.68 | 5.69 | 5.69 |
| Rsum (×105 CNY) | 4.87 | 4.85 | 6.71 | 6.71 | 6.70 | 6.69 | 6.68 | 6.67 | 6.66 | 6.65 | 6.64 |
Table 5.
The revenue of VPP of typical scenario 12.
| Eser-max (MWh) | 0 | 4 | 8 | 12 | 16 | 20 | 24 | 28 | 32 | 36 | 40 |
|---|---|---|---|---|---|---|---|---|---|---|---|
| Rass (×104 CNY) | −19.85 | −19.81 | −9.90 | 9.91 | 9.93 | 9.91 | 9.90 | 9.88 | 9.88 | 9.88 | 9.89 |
| Rser (×104 CNY) | 2.00 | 1.80 | 1.60 | 1.40 | 1.20 | 1.00 | 0.80 | 0.60 | 0.40 | 0.20 | 0.00 |
| Relc (×105 CNY) | 5.96 | 5.94 | 5.94 | 5.95 | 5.96 | 5.95 | 5.94 | 5.93 | 5.93 | 5.93 | 5.93 |
| Rsum (×105 CNY) | 4.17 | 4.14 | 5.11 | 7.08 | 7.07 | 7.04 | 7.01 | 6.98 | 6.95 | 6.94 | 6.92 |
Table 6.
Virtual power plant initial revenue and optimal revenue.
| Season | Scenarios | Initial Revenue (×105 CNY) | Optimal Revenue (×105 CNY) |
|---|---|---|---|
| Spring | 1 | 2.85 | 4.79 |
| 2 | 4.87 | 6.71 | |
| 3 | 3.21 | 5.37 | |
| Summer | 4 | 4.17 | 5.72 |
| 5 | 4.80 | 6.61 | |
| 6 | 2.32 | 3.89 | |
| Autumn | 7 | 3.00 | 5.06 |
| 8 | 3.61 | 6.07 | |
| 9 | 5.17 | 7.14 | |
| Winter | 10 | 2.98 | 5.02 |
| 11 | 3.14 | 5.32 | |
| 12 | 4.17 | 7.08 |
Table 7.
The revenue of VPP of typical scenario 13.
| Eser-max (MWh) | 0 | 4 | 8 | 12 | 16 | 20 | 24 | 28 | 32 | 36 | 40 |
|---|---|---|---|---|---|---|---|---|---|---|---|
| Rass (×104 CNY) | −20.03 | −19.99 | −19.95 | −19.91 | −19.87 | −19.83 | −9.89 | −9.87 | −9.85 | 9.83 | 9.83 |
| Rser (×104 CNY) | 2.00 | 1.80 | 1.60 | 1.40 | 1.20 | 1.00 | 0.80 | 0.60 | 0.40 | 0.20 | 0.00 |
| Relc (×105 CNY) | 6.01 | 6.00 | 5.98 | 5.97 | 5.96 | 5.95 | 5.94 | 5.92 | 5.91 | 5.90 | 5.90 |
| Rsum (×105 CNY) | 4.21 | 4.18 | 4.15 | 4.12 | 4.09 | 4.07 | 5.03 | 5.00 | 4.97 | 6.90 | 6.88 |
Table 8.
The annual revenue of the VPP.
| Scenario | Annual Probability | Number of Days | Initial Revenue/Day (×105 CNY) | Optimized Revenue/Day (×105 CNY) | Initial Revenue/Year (×105 CNY) | Optimized Revenue/Year (×105 CNY) |
|---|---|---|---|---|---|---|
| 1 | 0.09 | 32.85 | 2.85 | 4.79 | 93.6225 | 157.3515 |
| 2 | 0.02 | 7.3 | 4.87 | 6.71 | 35.551 | 48.983 |
| 3 | 0.12 | 43.8 | 3.21 | 5.37 | 140.598 | 235.206 |
| 4 | 0.05 | 18.25 | 4.17 | 5.72 | 76.1025 | 104.39 |
| 5 | 0.08 | 29.2 | 4.8 | 6.61 | 140.16 | 193.012 |
| 6 | 0.17 | 62.05 | 2.32 | 3.89 | 143.956 | 241.3745 |
| 7 | 0.07 | 25.55 | 3 | 5.06 | 76.65 | 129.283 |
| 8 | 0.1 | 36.5 | 3.61 | 6.07 | 131.765 | 221.555 |
| 9 | 0.14 | 51.1 | 5.17 | 7.14 | 264.187 | 364.854 |
| 10 | 0.08 | 29.2 | 2.98 | 5.02 | 87.016 | 146.584 |
| 11 | 0.03 | 10.95 | 3.14 | 5.32 | 34.383 | 58.254 |
| 12 | 0.05 | 18.25 | 4.17 | 7.08 | 76.1025 | 129.21 |
| sum | 1 | 365 | - | - | 1300.0935 | 2030.057 |
Table 9.
Virtual power plant initial return and optimal return.
| Scenario | 1 | 2 | 3 | 4 | 5 | 6 |
|---|---|---|---|---|---|---|
| RMS | 146.50 | 122.42 | 123.88 | 111.63 | 122.85 | 218.28 |
| Scenario | 7 | 8 | 9 | 10 | 11 | 12 |
| RMS | 149.69 | 106.16 | 126.44 | 137.85 | 184.80 | 141.28 |
© 2018 by the authors. Licensee MDPI, Basel, Switzerland. This article is an open access article distributed under the terms and conditions of the Creative Commons Attribution (CC BY) license (http://creativecommons.org/licenses/by/4.0/).
Share and Cite
MDPI and ACS Style
Luo, J.; Gao, Y.; Yang, W.; Yang, Y.; Zhao, Z.; Tian, S. Optimal Operation Modes of Virtual Power Plants Based on Typical Scenarios Considering Output Evaluation Criteria. Energies 2018, 11, 2634. https://doi.org/10.3390/en11102634
AMA Style
Luo J, Gao Y, Yang W, Yang Y, Zhao Z, Tian S. Optimal Operation Modes of Virtual Power Plants Based on Typical Scenarios Considering Output Evaluation Criteria. Energies. 2018; 11(10):2634. https://doi.org/10.3390/en11102634
Chicago/Turabian StyleLuo, Jingjing, Yajing Gao, Wenhai Yang, Yongchun Yang, Zheng Zhao, and Shiyu Tian. 2018. "Optimal Operation Modes of Virtual Power Plants Based on Typical Scenarios Considering Output Evaluation Criteria" Energies 11, no. 10: 2634. https://doi.org/10.3390/en11102634
Note that from the first issue of 2016, this journal uses article numbers instead of page numbers. See further details here.