Article

Thermodynamic Modeling of CO2-N2-O2-Brine-Carbonates in Conditions from Surface to High Temperature and Pressure

1
State Key Laboratory of Geomechanics and Geotechnical Engineering, Institute of Rock and Soil Mechanics, Chinese Academy of Sciences, Wuhan 430071, China
2
Dimue Technology Ltd. Co., Wuhan 430000, China
*
Author to whom correspondence should be addressed.
Energies 2018, 11(10), 2627; https://doi.org/10.3390/en11102627
Submission received: 22 August 2018 / Revised: 25 September 2018 / Accepted: 27 September 2018 / Published: 1 October 2018

Abstract

:
Nitrogen (N2) and oxygen (O2) are important impurities obtained from carbon dioxide (CO2) capture procedures. Thermodynamic modeling of CO2-N2-O2-brine-minerals is important work for understanding the geochemical change of CO2 geologic storage with impurities. In this work, a thermodynamic model of the CO2-N2-O2-brine-carbonate system is established using the “fugacity-activity” method, i.e., gas fugacity coefficients are calculated using a cubic model and activity coefficients are calculated using the Pitzer model. The model can calculate the properties at an equilibrium state of the CO2-N2-O2-brine-carbonate system in terms of gas solubilities, mineral solubilities, H2O solubility in gas-rich phase, species concentrations in each phase, pH and alkalinity. The experimental data of this system can be well reproduced by the presented model, as validated by careful comparisons in conditions from surface to high temperature and pressure. The model established in this work is suitable for CO2 geologic storage simulation with N2 or O2 present as impurities.

1. Introduction

Carbon emission reduction is becoming a more and more important topic for the sustainable development of human beings. Carbon capture and storage (CCS) has been validated as a useful method for reducing carbon emission and the clean use of fossil energy. High cost is one of the main barriers for commercial use of CCS. In the whole chain of CCS, more than half of the cost is consumed by carbon dioxide (CO2) capture, because a high purity of CO2 is usually used for real CO2 storage projects [1]. Lowering the CO2 purity could be a way to reduce the CO2 capture cost.
According to an International Energy Agency Greenhouse Gas R&D Programme (IEAGHG) report [2], even though there are various impurities obtained from CO2 capture techniques, the main impurities are nitrogen (N2) and oxygen (O2). When CO2 is injected with impurities, fluid properties such as gas density, viscosity and gas-water-mineral interactions could be different [3,4] compared to the injection of pure CO2. The presence of impurities decreases CO2 solubility in brine and also affects H2O contents in non-aqueous phase. A change in fluid property also affects fluid migration and CO2 storage capacity in subsurface porous media. When O2 is injected with CO2 into the subsurface reservoir, the oxidation-reduction environment is changed, which triggers related water-mineral interactions. In this case, water properties (such as composition, pH and alkalinity), porosity and permeability vary consequently [5,6].
Thermodynamic modeling of CO2-impurities-brine systems is essential work for understanding subsurface fluid transport. It mainly consists of the modeling of phase partitioning, density and viscosity. Soreide and Whitson [7] constructed mutual solubility of multi-gases (including CO2, CH4, H2S and N2) and brine systems. The model shows good accuracy at low temperature and pressure with a salinity less than 2 (molal). Li et al. [3] made modifications and achieved good accuracy at wider ranges of temperature, pressure and salinity for CO2-CH4-H2S-brine systems. Gas solubility modeling of CO2, N2 and O2 in water and brine has been performed by Duan and Sun [8], Mao and Duan [9] and Geng and Duan [10] based on comprehensive reviews of experimental data. These models can reproduce most of the experimental data over wide ranges of temperature, pressure and salinity. However, they can only consider single gas component cases, and cannot calculate multi-gas and brine system equilibria. Tan et al. [11] developed a model for CO2, SO2 and brine system equilibria using a “cubic plus association” (CPA) method. Sun and co-workers developed an improved “Statistical Associating Fluid Theory” (SAFT) model for CO2-brine and water-hydrocarbon systems by introducing a Lennard-Jones (LJ) term (SAFT-LJ models, [12,13,14]). CPA and SAFT type models usually have high computation accuracy, but are time-consuming and are not practical for reservoir simulation implementations.
Carbonates (including calcite, magnesite and dolomite) are important minerals for CO2 geologic storage. When CO2 is injected into porous media with carbonate minerals, dissolution of carbonates into aqueous phase is enhanced. Water property (such as pH, ion concentration, density and viscosity), porosity and permeability are affected consequently. Thermodynamic modeling work for CO2-brine-mineral systems began in the 1980s. Harvie and Weare [15] and Harvie et al. [16] used the Pitzer model to predict mineral solubility in the system Na-K-Mg-Ca-H-Cl-SO4-OH-HCO3-CO3-CO2-H2O. Moller [17], Greenberg and Moller [18], and Christov and Moller [19] further consider the temperature effects for model parameters of the system. The pressure effects are not considered in these models. Duan and Li [20] proposed a thermodynamic model for the quaternary system CO2-H2O-NaCl-CaCO3 which predicts the solubility of calcite, CO2 and other properties over wide ranges of temperature and pressure. Li and Duan [21] extended the model to a quinary system with CaSO4 included. Gypsum and anhydrite dissolution, precipitation and interactions with CO2 and H2O can be considered in the model.
This work discusses the phase partitioning modeling of the CO2-N2-O2-brine system based on careful review and validation with experimental data at high temperature, pressure and salinity. The model is then extended to CO2-N2-O2-brine-carbonates phase equilibria. Calcite, magnesite and dolomite are considered to be carbonate minerals of this system. The calculation results given by the model are compared with existing experimental data such as mineral solubilities with CO2 contained, CO2 solubility in brine saturated with minerals, water pH, and ion concentrations at various pressures and temperatures.

2. Thermodynamic Modeling of CO2-N2-O2-Brine Equilibria

When gas components (CO2, N2 and O2) are dissolved in brine, chemical potentials approach equality, and the whole system approaches an equilibrium state. The Henry constant [21] is defined as:
K H = f i a i
where KH is the Henry constant; fi is the gas fugacity of component i; ai is activity of component i in water phase. This equation is valid only when the system is at equilibrium state.
Furthermore, f i = P y i ϕ i , where y i is the mole fraction of component i in gas phase and ϕ i is fugacity coefficient of component i in gas phase. For activity a i = m i γ i , where mi is the molality of component i in aqueous phase, and γ i is the activity coefficient of component i in aqueous phase. From Duan and Li [20], KH is the function of temperature and pressure:
K H ( T , P ) = K H ( T , P r e f ) × exp ( P F )
where P r e f is pressure at reference state and is usually set as 1 atm. PF is Poynting factor, which is defined as,
P F = P r e f P V m R T d P = V m R T ¯ ( P P r e f )
R is gas constant and V m is partial molar volume. V m ¯ is average partial molar volume. From Equations (1) to (3), solubility of component i can be calculated as,
m i = P y i ϕ i γ i K H ( T , P r e f ) exp ( V m , i ¯ ( P P r e f ) R T )
In this work, fugacity coefficients are calculated based on the Peng-Robinson (PR) [22] equation. The related parameters for CO2, N2, O2, and H2O can be found in Table 1 and Table 2. Activity coefficients are calculated by the Pitzer [23] model. The model parameters, as well as KH and V m , are discussed in Section 2. The related experimental work of the concerned fluid system is used for the parameterization of the model.

2.1. Fugacity Coefficients

The two-parameter cubic form equation of state has been widely used in the oil and gas industry for phase properties and flash calculations [22,24,25], and has shown good accuracy for non-polar molecules. In this work, fugacity coefficients of gaseous species are calculated using the Peng-Robinson [22] model of the form as follows:
P = R T V m b a ( T ) V m ( V m + b ) + b ( V m b )
where a ( T ) = a ( T c ) α ( T r , ω ) ; a(Tc) is the Van der Waals’ attraction factor at a critical temperature defined as a ( T c ) = 0.45724 R 2 T c 2 P c , where Pc is critical pressure; b = 0.07780 R T c P c ; T r is reduced temperature T r = T T c ; T c is critical temperature; ω is acentric factor; α ( T r , ω ) is a dimensionless function of relative temperature and acentric factor.
When gaseous phase has more than one component, the mixing rule is considered for parameters “a” and “b”.
a = i j y i y j a i j
b = i b i y i
where a i j = a i a j ( 1 δ i j ) and δ i j is binary interaction coefficient of species i and j; yi is mole fraction of species i in gaseous phase.
The parameters (critical temperature Tc, critical pressure Pc, and acentric factor ω ) used in PR [22] EOS for each individual component are listed in Table 1.
The binary interaction parameters ( δ i j ) used PR EOS are listed in Table 2.

2.2. Equilibrium Constant

From Equations (2) and (3), equilibrium constant can be expressed as,
K i = K H ( T , P r e f ) exp ( V m , i ¯ ( P P r e f ) R T )
where i denotes a component (i = H2O, CO2, N2, and O2).
For H2O, the equation from previous work [3,4] is used,
K H 2 O = ( a 1 + a 2 T + a 3 T 2 + a 4 T 3 + a 5 T 4 ) exp ( ( P 1 ) ( a 6 + a 7 T ) R T )
where a1 – a7 are the parameters found in Li et al. [3].
For CO2, N2 and O2, Equation (8) is used for the equilibrium constant. K H ( T , P r e f ) is calculated following Appelo [30]:
log ( K H ( T , P r e f ) ) = A 0 + A 1 T + A 2 T + A 3 log ( T ) + A 4 T 2 + A 5 T 2
where A0 – A5 are the parameters found in Appelo [30], listed in Table 3. Also, V m , i ¯ is calculated as follows:
V m , i ¯ = 41.84 ( 0.1 a 1 , i + 100 a 2 , i 2600 + P + a 3 , i ( T 288 ) + 10 4 a 4 , i ( 2600 + P ) ( T 288 ) ω i × Q B r n )
where a1,i – a4,i and ωi are the parameters found in Appelo [30], listed in Table 3, and QBrn is the Born function, which can be found in Helgson et al. [31].

2.3. Activity Model

Activity or activity coefficient is an important parameter to describe the deviation of solvent and aqueous species from ideal solution at a given temperature and pressure. The Pitzer [23,32,33] model is an accurate model for calculating the activity of water and various aqueous species especially to high salinity of brine. This activity model has wide application to water-salt-mineral system computation and modeling at different temperatures and pressures [16,17,18,19,20,21,34]. These applications have shown the success of the Pitzer [23] model. In this work, the Pitzer [23] model is used to calculate aqueous species activity coefficients. The details of Pitzer [23] equations have been discussed in previous research papers [20,21]. When gas components are dissolved in water, it is assumed that they are in the form of neutral species in aqueous phase. The Pitzer [23] equation of neutral species is as follows [8]:
ln γ i = c 2 m c λ i c + a 2 m a λ i a + c a m c m a ζ i a c
where γ i is the activity coefficient of component i; i = CO2, N2, or O2; λ i c , λ i a and ζ i a c are the Pitzer interaction parameters; m c and m a are the aqueous species molality; “c” denotes cation species and “a” denotes anion species. In this work, λ i c , λ i a and ζ i a c are parameterized from the gas solubility experimental data.
The fitting equation of Pitzer interaction parameters follows Appelo [30]:
P a r a m = b 0 + b 1 × ( 1 T 1 T R ) + b 2 × ln ( T T R ) + b 3 × ( T T R ) + b 4 × ( T 2 T R 2 ) + b 5 × ( 1 T 2 1 T R 2 )
where b0 – b5 are fitting parameters; T is temperature in (K); TR = 298.15 (K). The parameters are listed in Table 4.

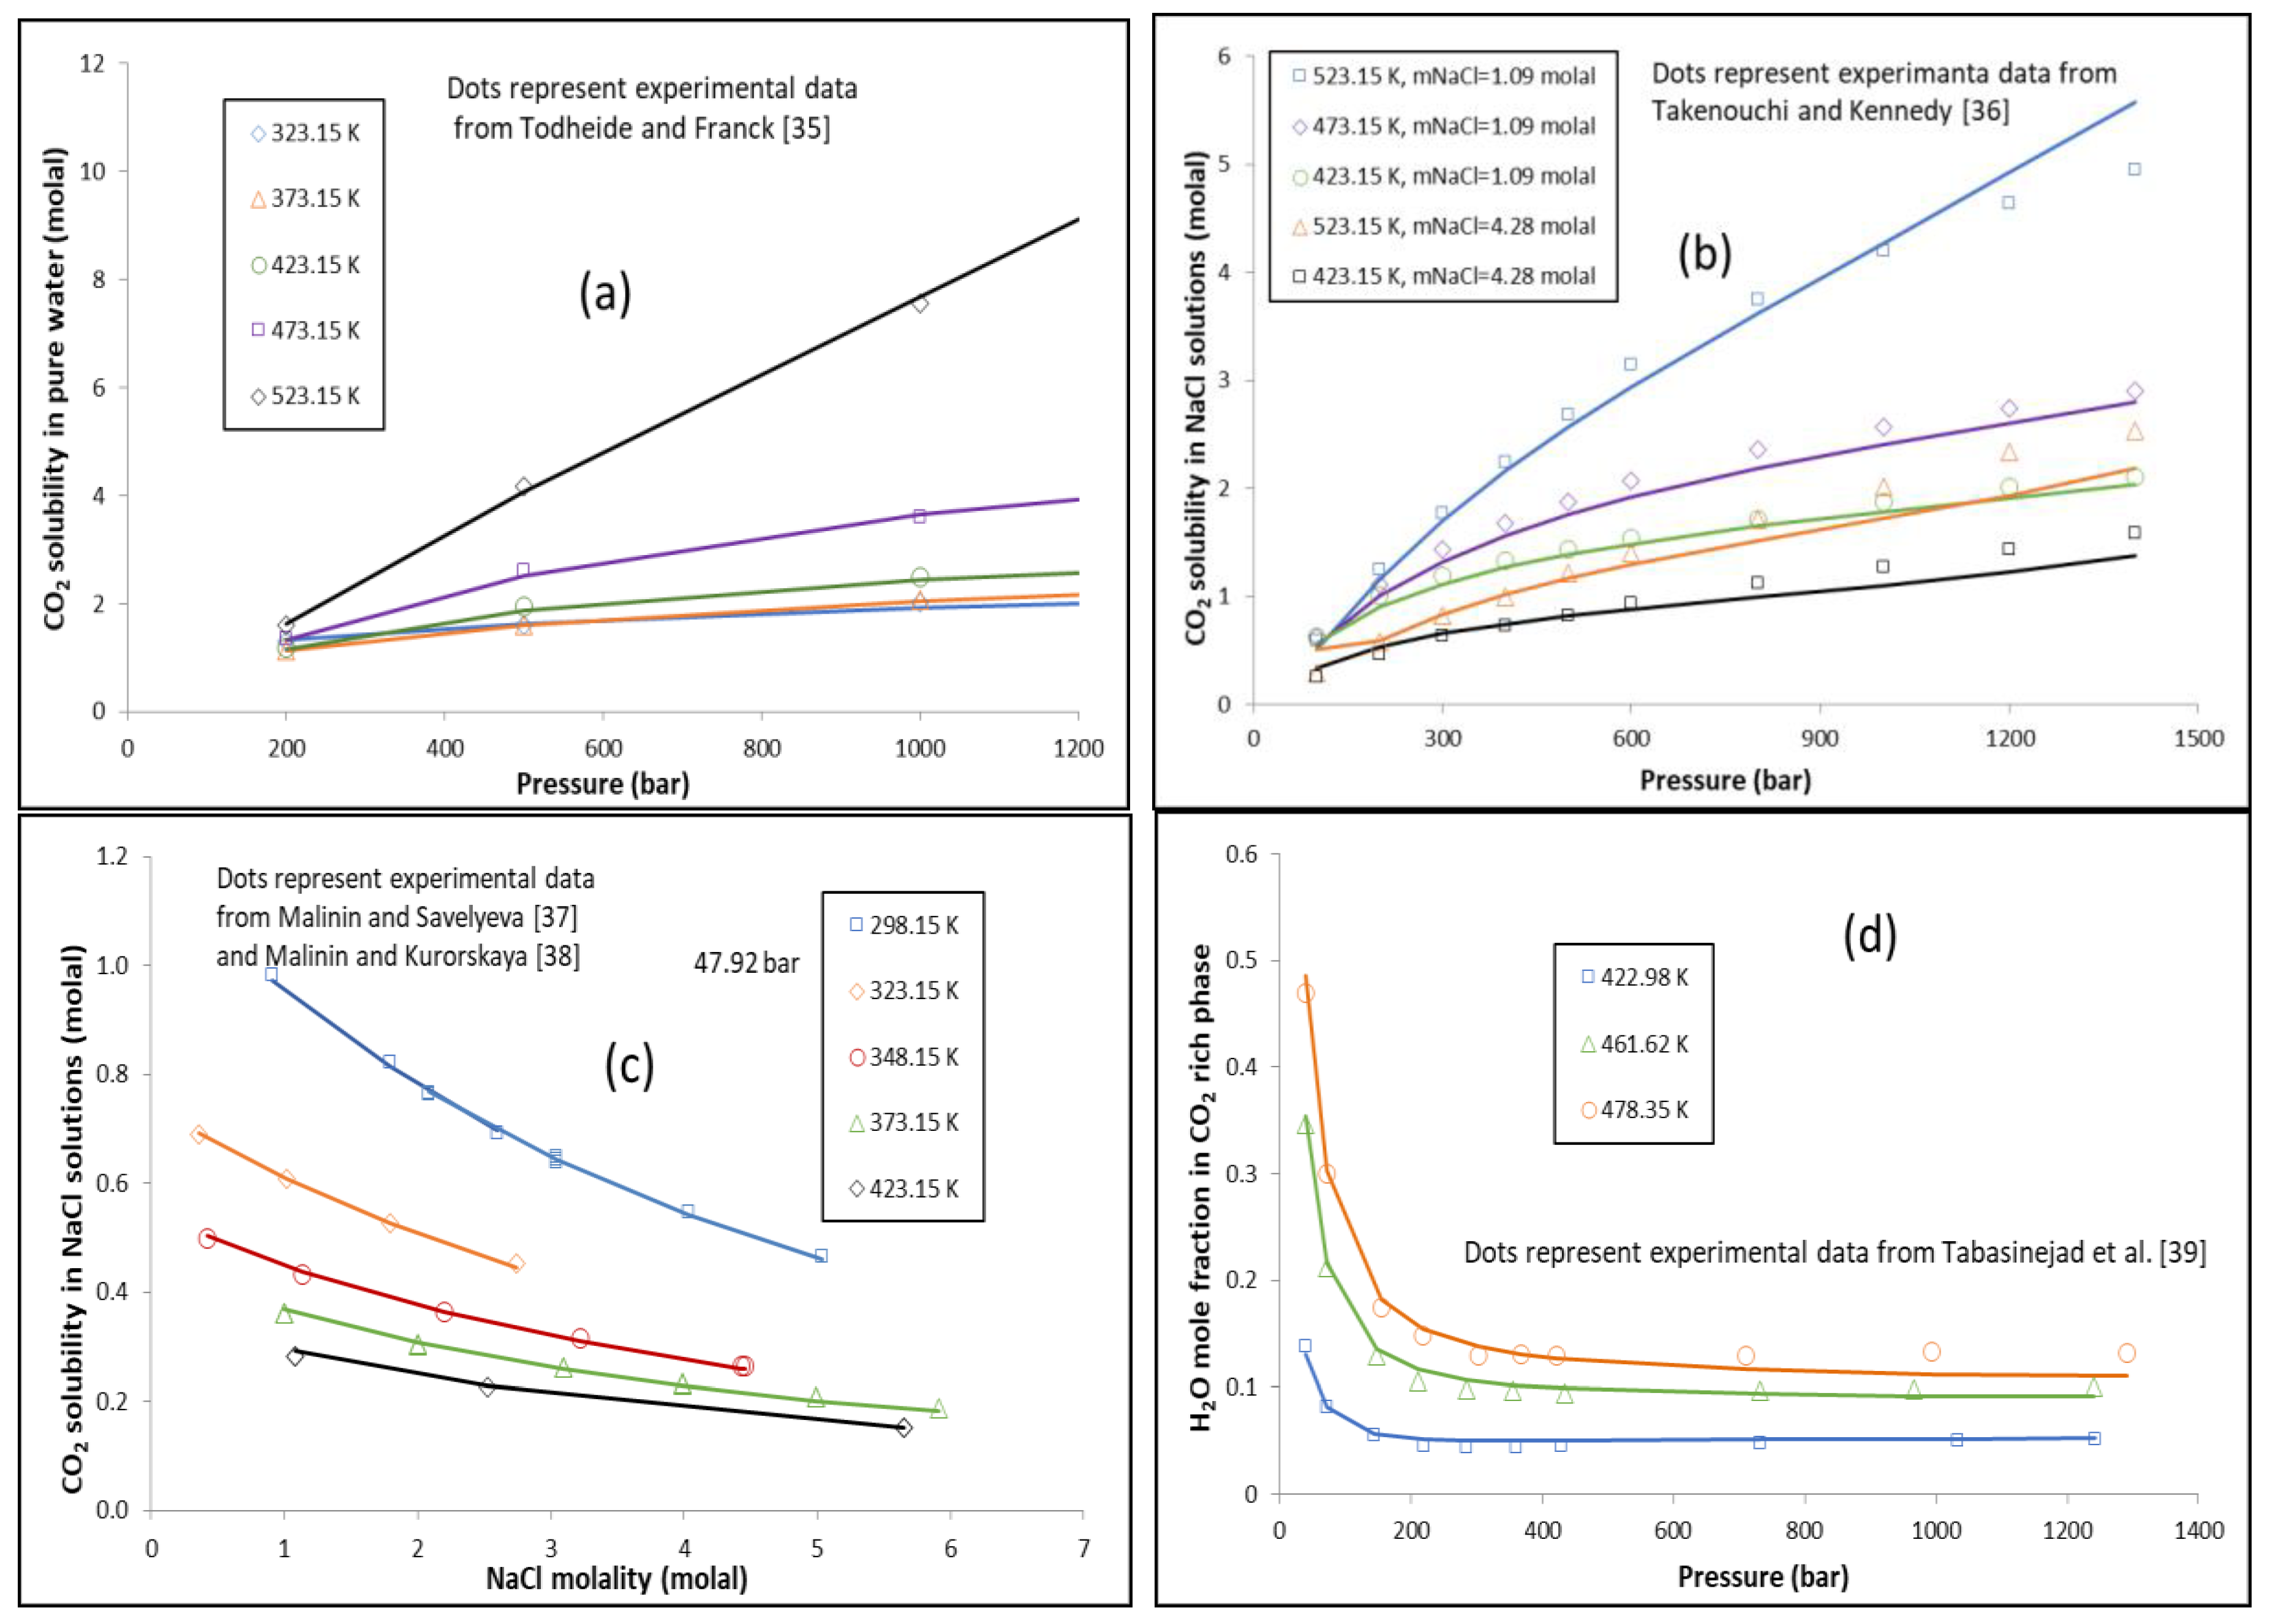
2.4. Gas-Brine Mutual Solubility Reproduction

To validate the above thermodynamic model, comparisons are made between the gas-brine mutual solubility calculated from this model and existing experimental data including CO2-brine, N2-brine, O2-brine and multi-gas-brine systems.
The experimental work for CO2-brine system is extensive and substantial, with a wide range of temperatures, pressures and water salinities. A comparison of the CO2-brine system mutual solubility obtained from the experimental data and the model proposed in this work is shown in Figure 1. The experimental data for validation was mainly obtained from Todheide and Franck [35], Takenochi and Kennedy [36], Malinin and Savelyeva [37], Malinin and Kurorskaya [38], Tabasinejad et al. [39]. As shown in the comparison, the model can well reproduce CO2 solubility in aqueous phase with pressure ranging from 1 to more than 1000 (bar), temperature range from 0 to more than 250 (°C), NaCl molality range from 0 to more than 6 (molal). The H2O solubility in CO2-rich phase can also be well reproduced by this model.
A comparison of the mutual solubility of N2-brine obtained from the experimental data and the results calculated by this work, is shown in Figure 2. The experimental data of N2 solubility in water or NaCl solutions are from Weibe et al. [40] and Mishnima et al. [41]. The experimental data of H2O in N2-rich phase is from Althaus [42] and Namiot and Bondareva [43]. It is shown that the model of this work can well reproduce the experimental work at a wide range of temperatures, pressures and salinities.
The experimental work on the O2-brine system is not as comprehensive as on the CO2-brine and N2-brine systems. The temperature is lower than 100 (°C), and pressure is below 200 (bar). A comparison of the model results and experimental data obtained from Stephen et al. [44], Pray and Stephen [45], and Yasunishi [46] is shown in Figure 3. The model can well reproduce the existing experimental data.
For multi-component gas mixture and brine systems, the experimental work is rare. Liu et al. [47] proposed CO2-N2-H2O equilibrium experiments at two temperatures and three pressures with different CO2-N2 gas mixture compositions. As shown in Figure 4, the experimental results can accurately be predicted by this model.

3. Gas-Brine-Mineral Equilibria

In this section, the modeling and validation of gas-brine-mineral equilibria are discussed. When CO2 is injected into a saline aquifer in industrial CO2 geologic storage projects, CO2 existence significantly influences the water-carbonate mineral equilibrium. The commonly found carbonate minerals in sedimentary environments are calcite (CaCO3), magnesite (MgCO3), and dolomite (CaMg(CO3)2). The above three minerals are considered in this work even though there are many other kinds of carbonate minerals in natural environments. The gas-brine equilibrium model was explained in detail in Section 2. This section will focus on brine-mineral equilibrium modeling and its coupling with the gas-brine model. When the above carbonate minerals reach an equilibrium state with water/brine at a given temperature and pressure, the following chemical reactions are observed.:
CaCO3(Calcite) = CO32− + Ca2+
MgCO3(Magnesite) = CO32− + Mg2+
CaMg(CO3)2(Dolomite) = 2CO32− + Ca2+ + Mg2+
CaCO3(0) = CO32− + Ca2+
MgCO3(0) = CO32− + Mg2+
H2O = H+ + OH
HCO3 = H+ + CO32−
CO2(0) = 2H+ + CO32−
MgOH+ = Mg2+ + OH
CaOH+ = Ca2+ + OH
where superscript (0) denotes neutral aqueous species.
Similar to Equation (1), when an equilibrium state is reached, the following equation for each of the above chemical reactions is applicable [30]:
K r = i a υ i
where K r is the equilibrium constant of a chemical reaction “r”; υ i is the stoichiometric coefficient of species i of a chemical reaction “r”; a i is the activity of species i of a chemical reaction “r”. For aqueous species i, a i = m i γ i , where m i is the molality of species i, and γ i is the activity coefficient of species i. Activity of minerals is 1.
To solve the speciation of the brine-mineral system at equilibrium state at a given temperature and pressure, K or log K and the activity coefficients of all related reactions and species should be specified. The equilibrium constant is calculated by Equation (8) using the equilibrium constant (Kref) at reference pressure (1 bar or water saturation pressure) and mole volume (Vm) of the related reaction. Kref is a function of temperature and can be expressed by Equation (10). Vm is a function of temperature and pressure and can be expressed by Equation (11). For all the above reactions, the related parameters required for Kref and Vm are obtained from PHREEQC database [30].
Activity coefficients ( γ i ) of the aqueous species are calculated from the Pitzer [23] model. The expressions of the Pitzer [23] model can be found in Li and Duan [21]. The Pitzer parameters fall into three categories: (1) β M X ( 0 ) , β M X ( 1 ) , β M X ( 2 ) and C M X φ for each cation-anion pair of the species; (2) θ i j for each cation-cation or anion-anion pair of the species; (3) ψ i j k for each cation-cation-anion or anion-anion-cation triplet of the species, λ n i for ion-neutral pairs of the species, and ζ n i j for cation-anion-neutral triplets of the species. The Pitzer parameters of various water-salt-mineral system have been studied since the 1980s via thermodynamic modeling in conjunction with experimental work. Table 5 lists the sources of the Pitzer parameters for the calculations of this work system.

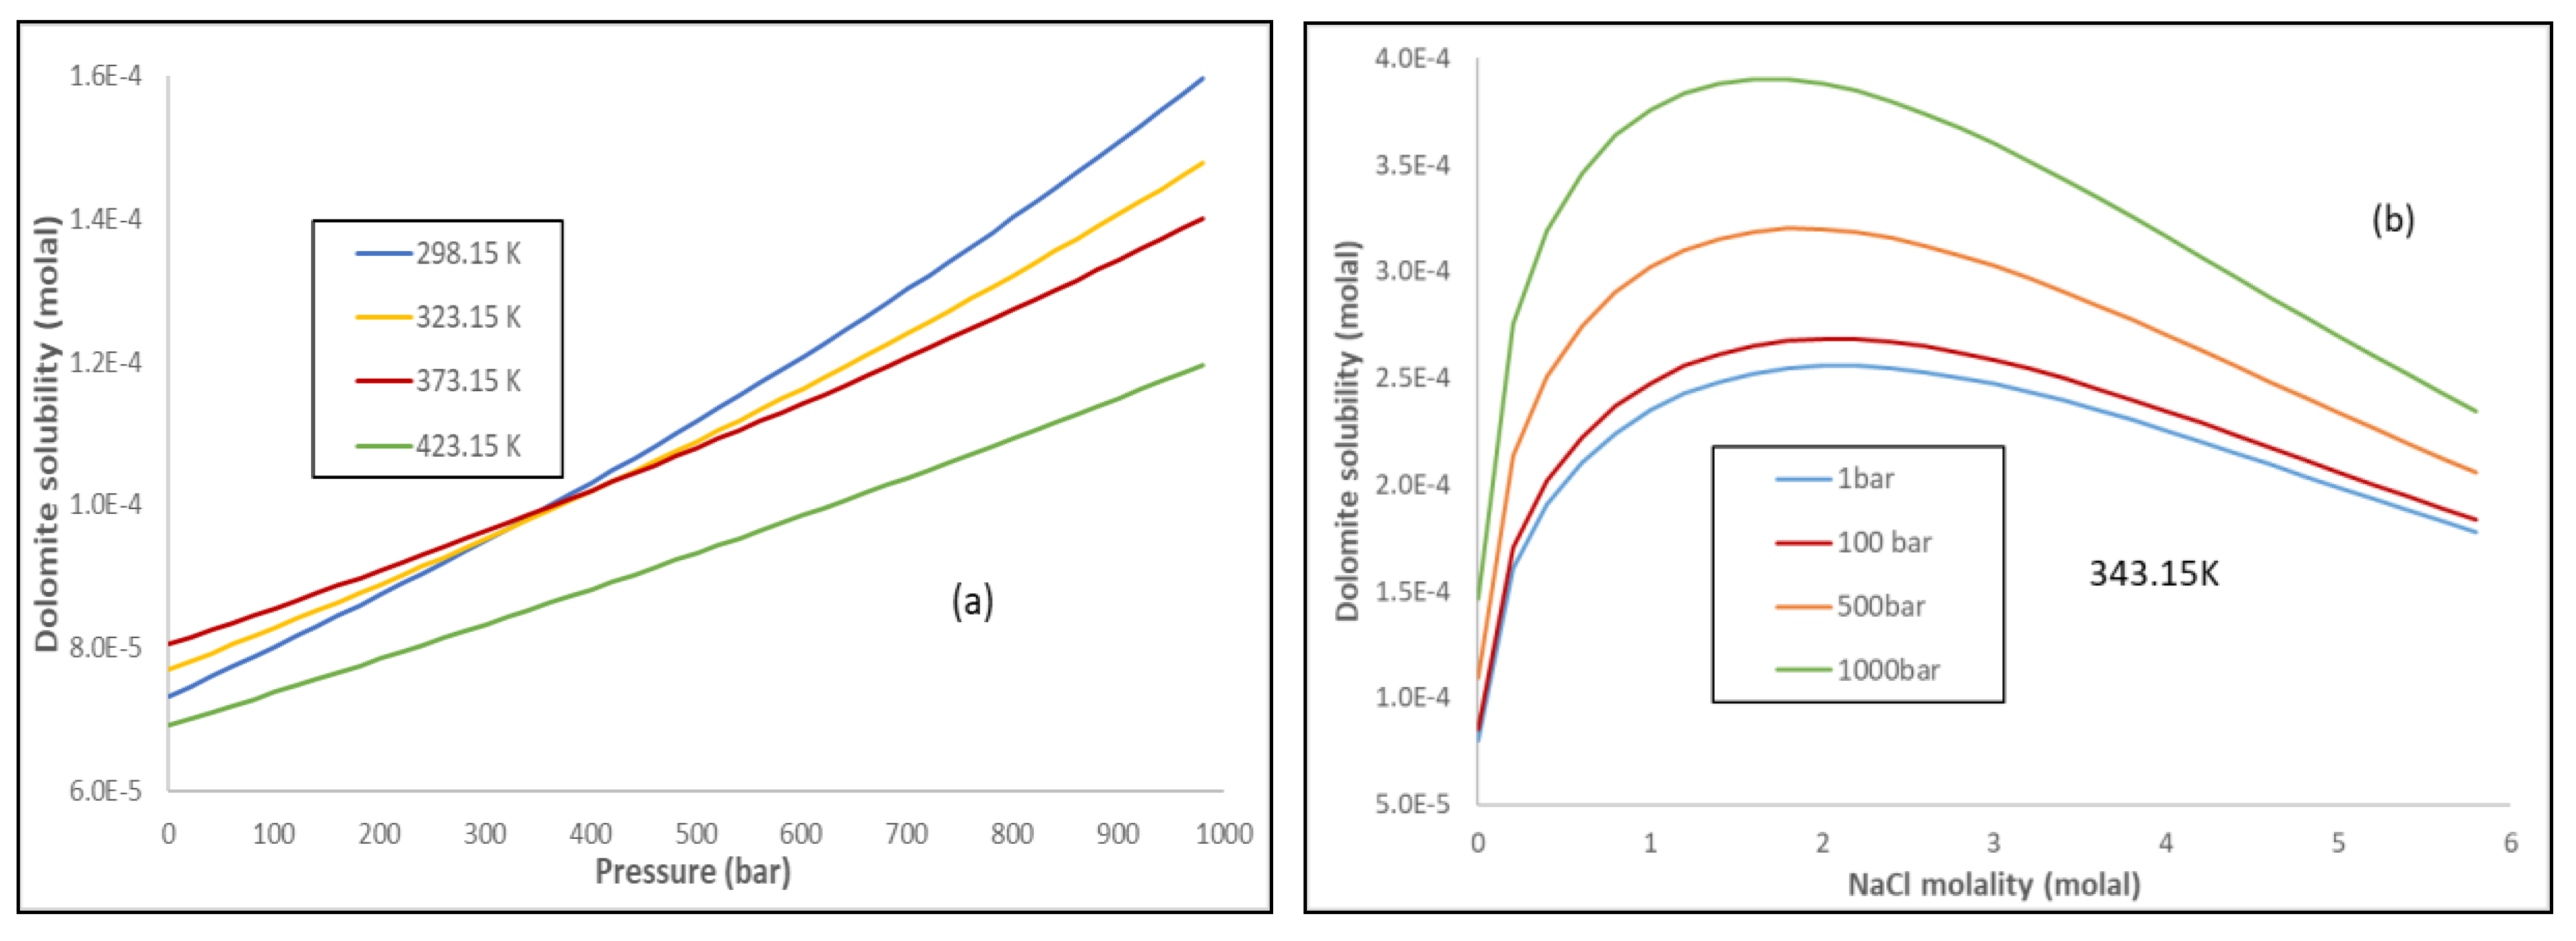
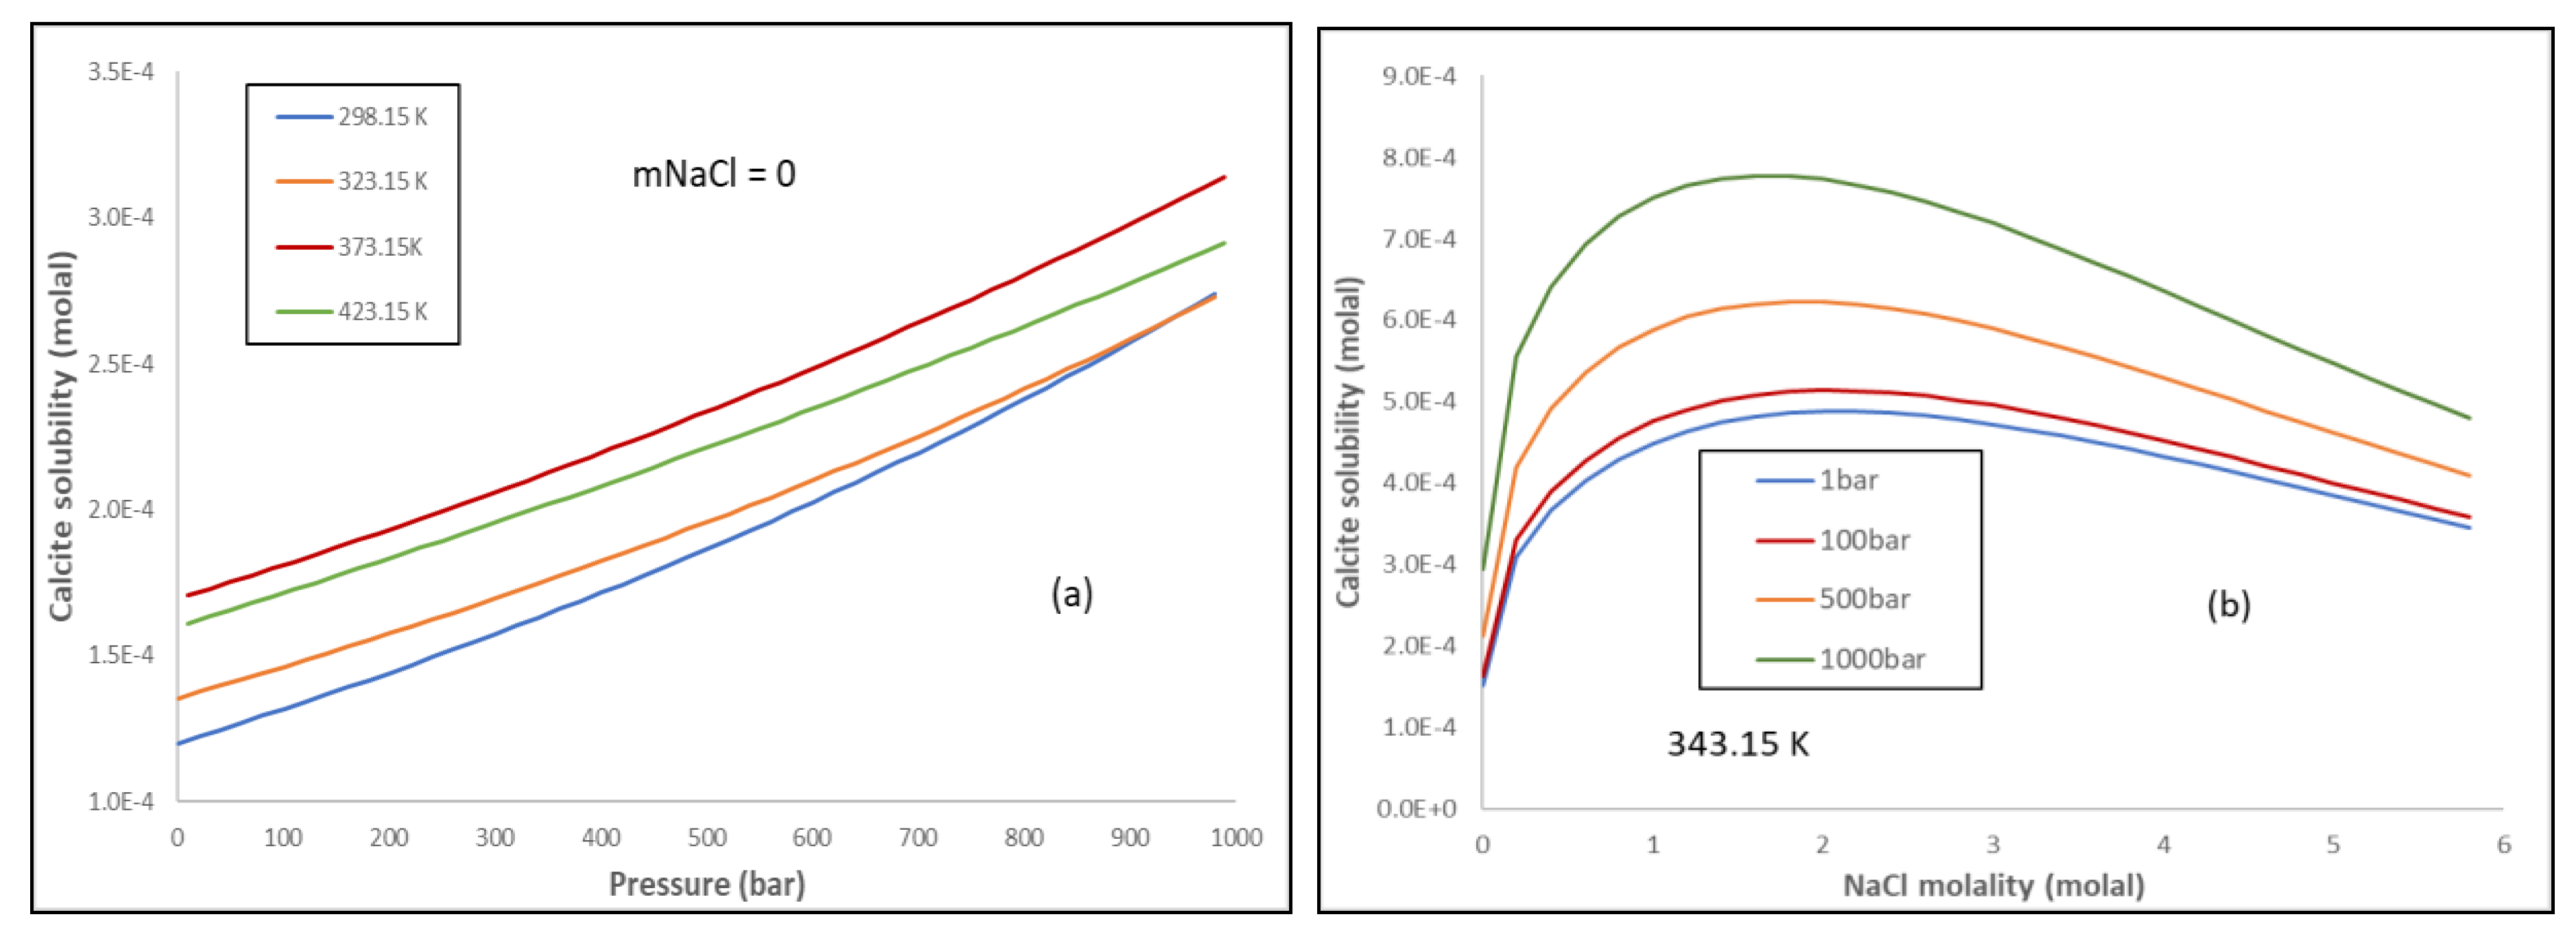
3.1. Mineral Solubility

With the thermodynamic model discussed above, the solubility of carbonate minerals (calcite, magnesite and dolomite) can be calculated in aqueous phase (with/without gases in equilibrium) at various temperatures and pressures. To validate the thermodynamic model, the existing experimental data of carbonate mineral-gas-water equilibria should be reproduced. Predictions of mineral solubilities are also made at various values of temperature, pressure and NaCl molality.
Calcite solubility experiments have usually been conducted with CO2 in equilibrium. A comparison of the values of calcite solubility obtained from experimental data and those calculated by the proposed model at a CO2 partial pressure of 12 (bar) at different temperatures and NaCl molalities is shown in Figure 5. This model can well reproduce the experimental data of calcite solubility, as shown in the comparison.
Calcite solubility in pure water and in NaCl solutions at various values of pressure, temperature and NaCl salinity are shown in Figure 6. Calcite solubility in pure water increases with pressure and decreases with temperature. At a given temperature and pressure, within the lower NaCl molality range (0–1.5), calcite solubility increases with NaCl molality, but decreases in the higher NaCl molality range (1.5–6).
Experimental data for magnesite solubility is rare. Bénézeth et al. [53] conducted synthetic magnesite solubility product measurements at temperatures ranging from 50 to 200 (°C) with 0.1 (molal) NaCl solutions, and with CO2 partial pressure under 30 (bars). A comparison of Mg2+ molality of the solution in equilibrium with magnesite between the experimental data and calculated results is shown in Figure 7. Generally, the calculated values and measurements are comparable with calculated values a little bit higher than the measurements. Magnesite solubility in pure water or NaCl solutions at various temperatures, pressures and NaCl molalities of the solutions are shown in Figure 8. The magnesite solubility in pure water increases with pressure and decreases with temperature. In NaCl solutions, magnesite solubility increases with NaCl molality in the lower salinity range (0–1.5) but decreases in the higher salinity range (1.5–6).
To address the so-called “dolomite problem”, Bénézeth et al. [54] measured natural dolomite (CaMg(CO3)2) solubility with a temperature range of 50 to 253 (°C) with 0.1 (molal) NaCl solutions using a hydrogen electrode concentration cell. The logarithmic concentrations of Mg2+, Ca2+ and H+ in the solution at equilibrium with dolomite are provided in the literature [54]. A comparison between the experimental results from Bénézeth et al. [54] and the results calculated using this model is shown in Figure 9. The trends of the measurements varying with temperature are also obtained by this model.
The presented model is used for the calculation of dolomite solubility at various values of temperature, pressure and NaCl molality, as shown in Figure 10. From the figure, it is shown that dolomite solubility in water increases with pressure and decreases with temperature. In NaCl solutions, dolomite solubility increases with NaCl molality in the lower salinity range (0–1.5) but decreases in the higher salinity range (1.5–6).

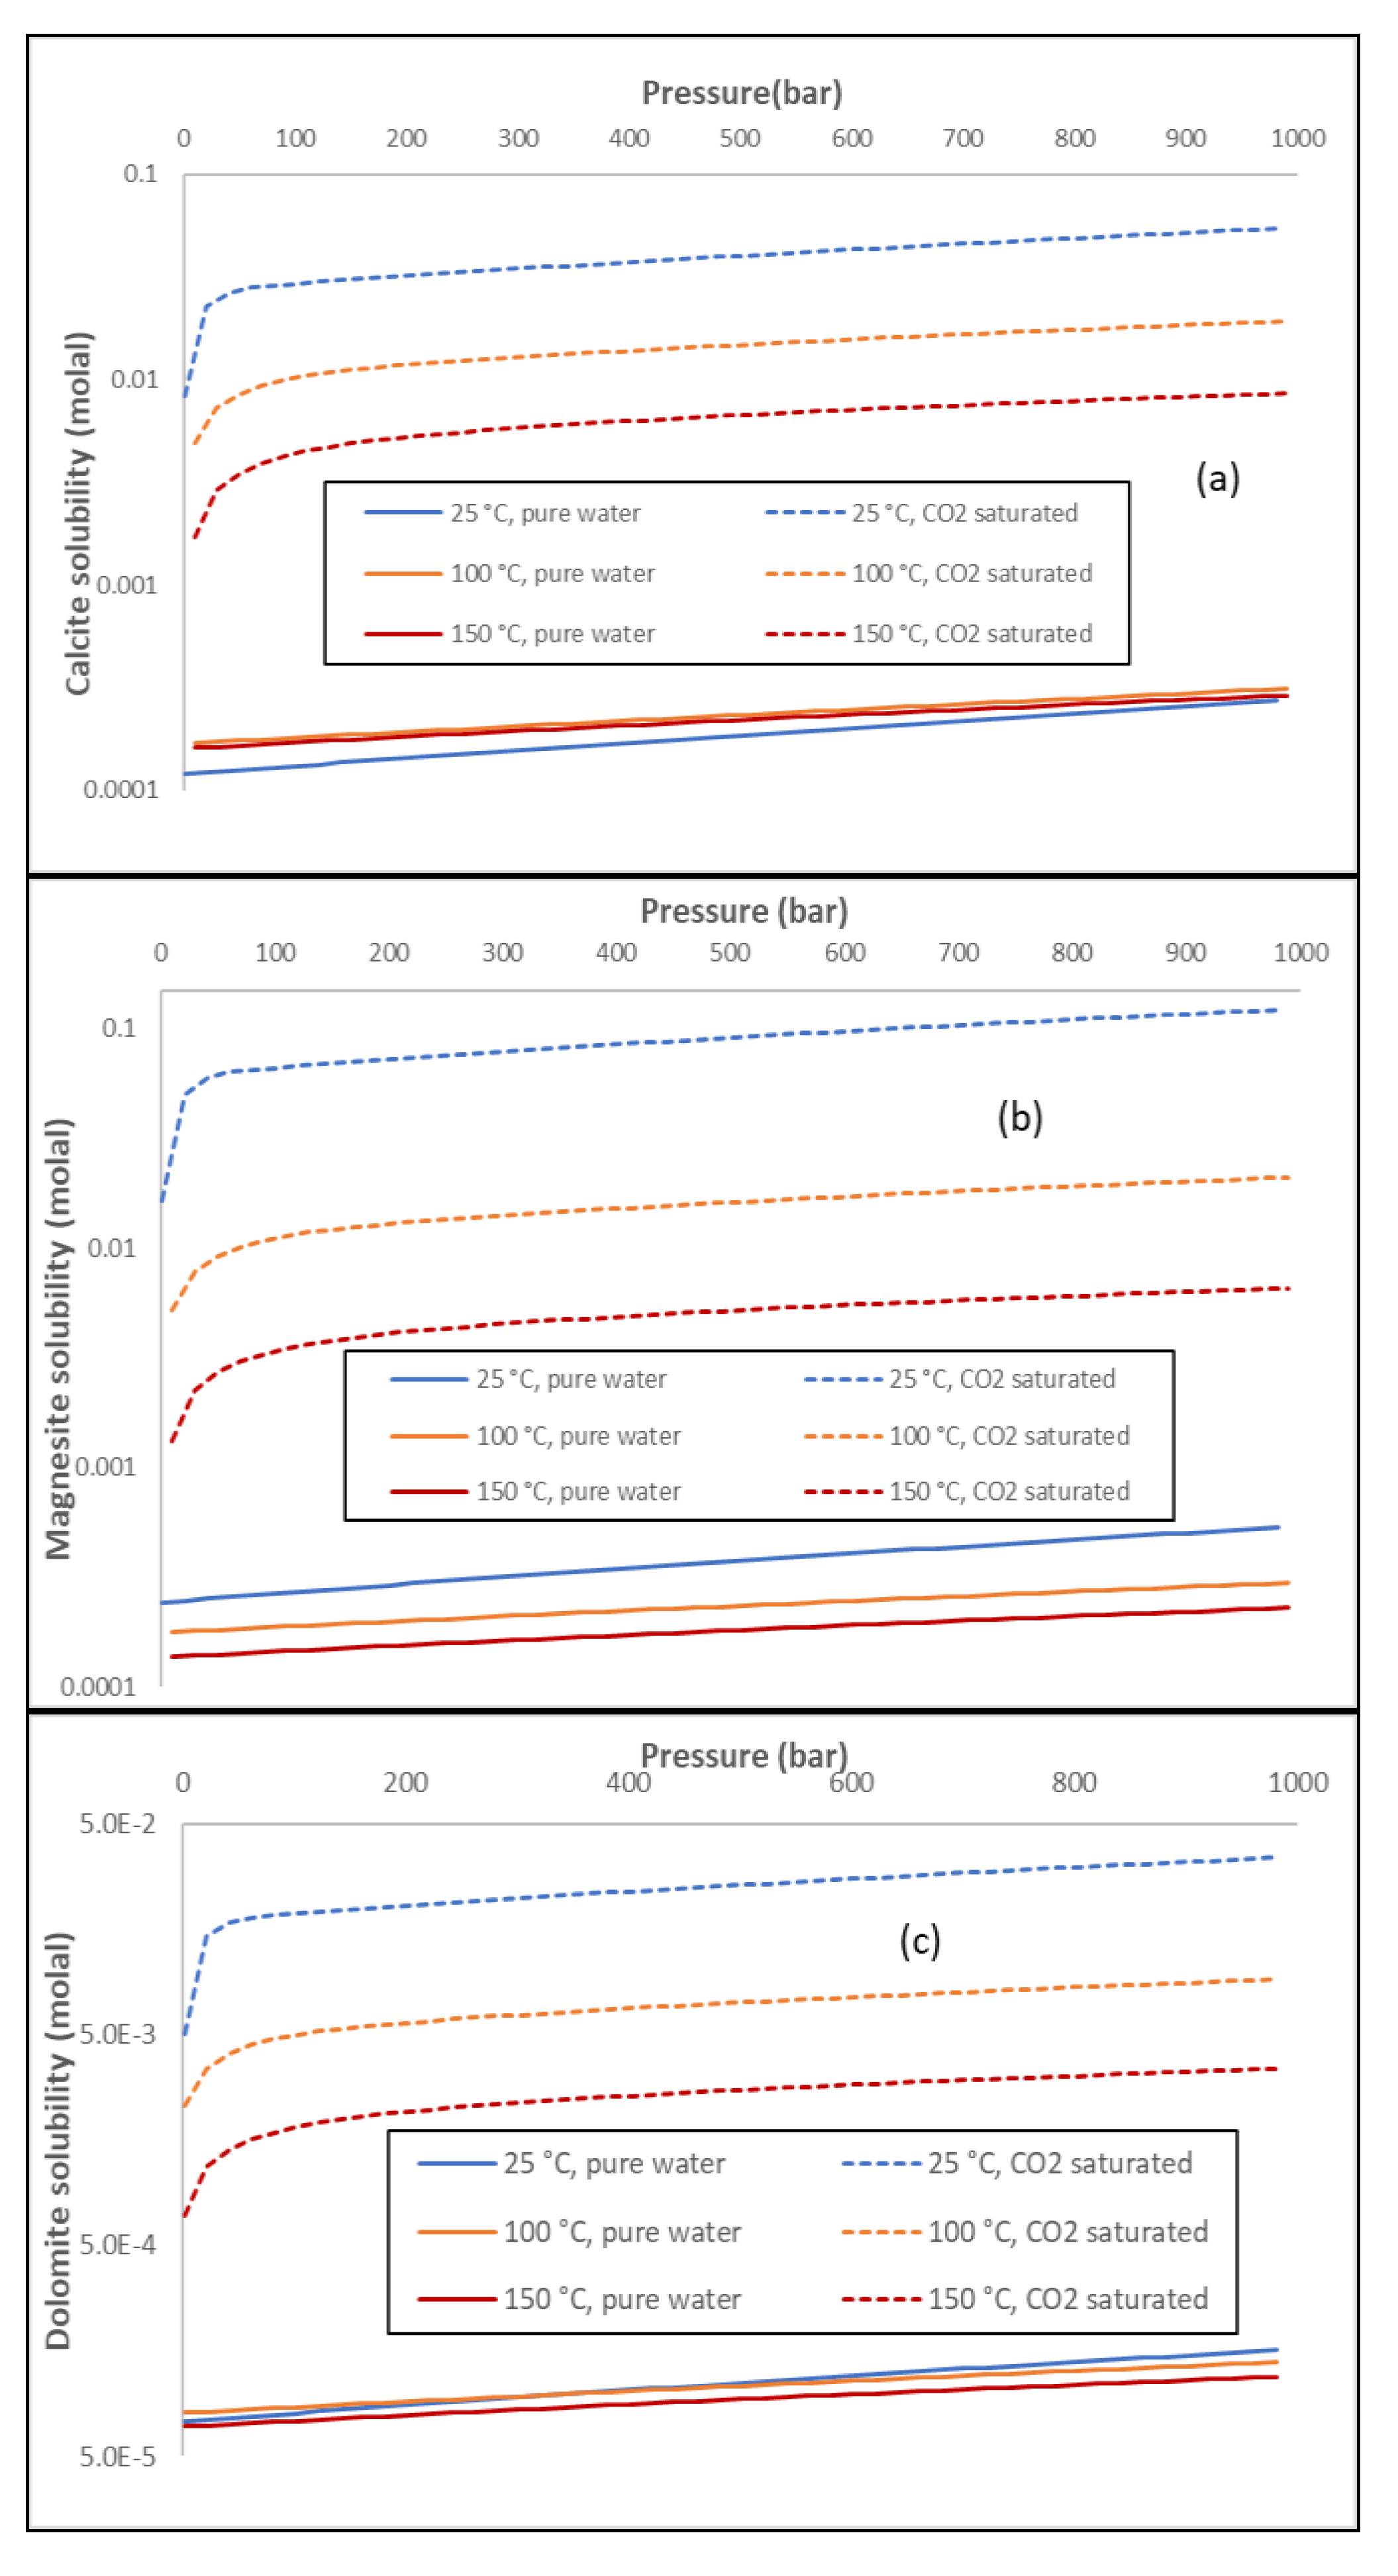
3.2. Mutual Effects of Dissolutions of Gases and Minerals

When CO2 is injected into a carbonate aquifer, CO2 and carbonate mineral solubility in water are affected by each other. It has been observed in subsurface hot water recovery projects that carbonate mineral deposition usually triggers a decrease in permeability, and the subsurface fluid can be blocked [2]. CO2 injection into water can re-dissolve the carbonate minerals. The geochemical model constructed in the previous sections can be used to evaluate the solubility effects of CO2 and carbonated minerals. The CO2 solubility in pure water and carbonate mineral (calcite and magnesite) saturated solutions at various values of temperature and pressure is shown in Figure 11. The results show that the dissolved mineral effects on the CO2 solubility in water are insignificant. This is because the solubility of carbonate minerals is not significant to change the solution properties.
To evaluate the effects of CO2 on solubilities of carbonate mineral influenced by CO2, carbonate mineral (calcite, magnesite and dolomite) solubilities in pure water and CO2 saturated solutions are calculated using the presented model at various values of temperature and pressure (Figure 12). It is evident from the comparison that the solubility of all three carbonate minerals in water with dissolved CO2 is significantly increased. The increase is higher at the lower temperature (25 °C) than at the higher temperature (150 °C).

3.3. Impurity Effects on Gas-Water-Mineral Equilibria

In CO2 geologic projects, the evaluation of the effects of impurities (such as N2, O2) in terms of water properties (density, viscosity, pH), gas-water-mineral equilibria, and reservoir property change (porosity and permeability) is an important topic, since decreasing CO2 purity efficiently reduces the cost of CO2 capture. Compared to CO2-water-mineral systems, N2 or O2 affects the CO2 dissolution and solute concentration in water. At the same temperature and pressure, the presence of N2 or O2 in gas phase changes the fugacity of CO2, and the CO2 solubility in water (Figure 13). The carbonate dissolution is significantly affected by CO2 concentration in water as shown from the calculations in the previous section.

4. Conclusions

CO2 geologic storage with impurities (such as N2 and O2) is an important choice for reducing the cost of the full chain of CCS. However, the phase behavior of CO2-impurities-mineral systems is key to understanding the migration, storage capacity and safety when CO2 and impurities are injected into subsurface porous media. Rodrigues et al. [55] analyzed the CO2 utilization and storage mechanisms of different technologies (such as CO2 enhanced coal seam recovery and shale gas recovery). From the analysis in their work, fluid-mineral interactions and CO2 storage capacities are dramatically different in CO2 utilization and storage projects with different technologies. Fluid equilibrium modeling is a basis for the analysis. In this work, a thermodynamic model of CO2-N2-O2-brine system equilibria is established with a temperature range from 0–250 (°C), a pressure range from 1–1000 (bar) and a NaCl molality range from 0 to more than 6 (molal). The model is validated with existing experimental data from subsystems, such as CO2-brine, N2-brine, O2-brine, and CO2-N2-brine, in terms of gas solubility in brine and H2O solubility in gas phase. The comparison shows that the experimental data can be well reproduced by the presented model.
When CO2 is dissolved in an aquifer, water properties are changed in terms of pH, alkalinity, cation and anion concentrations. Mineral dissolution and precipitation are affected by the water property change. In this work, the thermodynamic model of CO2-N2-O2-brine system is extended to CO2-N2-O2-brine-carbonate (mainly calcite, magnesite and dolomite) systems. With the new gas-water-mineral geochemical model, the following calculations can be performed:
The mineral solubility can be calculated with CO2 and/or other impurity gas components (N2 and O2) dissolved. The comparisons with existing experimental data show that carbonate (calcite, magnesite and dolomite) solubility can be reproduced well by the presented model. It is also shown by the calculations at various values of temperature and pressure that carbonate solubilities raise considerably with CO2 dissolved in brine.
Gas solubility in brine affected by carbonate dissolution in water is evaluated by the model. The effects of carbonate dissolution are not significant, because there is a lower level of mineral solubility in water.
Ion concentrations and pH can be calculated by the model at various temperatures, pressures and salinities. The effects of gas impurities on pH and Ca2+ concentration are evaluated in this work. When CO2 is mixed with N2 or O2, less mineral dissolution, lower Ca2+ concentration and higher pH can be observed from the calculation. The change is mainly because of the CO2 fugacity reduction in gas phase with the presence of N2 or O2, and the effect of N2 or O2 dissolution is not significant.
To address the validation of the model, future work should supply experimental measurements of phase behaviors of more complex systems at various temperatures and pressures, such as phase equilibrium of CO2-O2-brine and CO2-N2-O2-brine, and carbonate dissolved water properties (i.e., different ion concentrations, pH and/or alkalinity) with different levels of CO2, N2 and/or O2 in the system. In real geologic systems, geochemical reactions are much more complicated. More work is still needed to assess the impurity effects on gas-water-mineral geochemical behaviors, especially when there are redox reactions in the systems. In future work, minerals with different chemical valences such as sulfides and sulfates will be considered to evaluate influences of oxygen.

Author Contributions

J.L. conducted the modeling work, wrote and revised the manuscript. R.A. worked on part of the coding and reviewed the manuscript. X.L. reviewed and revised the manuscript.

Funding

This research was funded by National Natural Science Foundation of China (Grant No. 41502246) and National Key R&D Program of China (Grant No. 2016YFE0102500).

Acknowledgments

Thanks to two anonymous reviewers for constructive suggestions.

Conflicts of Interest

The authors declare no conflict of interest.

References

  1. Xie, J.; Zhang, K.; Hu, L.; Wang, Y.; Chen, M. Understanding the carbon dioxide sequestration in low-permeability saline aquifers in the Ordos basin with numerical simulations. Greenh. Gases 2015, 5, 558–576. [Google Scholar] [CrossRef]
  2. IEAGHG. Effects of Impurities on Geological Storage of CO2; Global CCS Institute: Melbourne, Australia, 2011. [Google Scholar]
  3. Li, J.; Wei, L.; Li, X. An improved cubic model for the mutual solubilities of CO2–CH4–H2S–brine systems to high temperature, pressure and salinity. Appl. Geochem. 2015, 54, 1–12. [Google Scholar] [CrossRef]
  4. Li, J.; Zhang, Z.; Luo, X.; Li, X. Modelling of phase equilibria in CH4–C2H6–C3H8nC4H10–NaCl–H2O systems. Appl. Geochem. 2015, 56, 23–36. [Google Scholar] [CrossRef]
  5. Pearce, J.K.; Dawson, G.K.W.; Law, A.C.K.; Biddle, D.; Golding, S.D. Reactivity of micas and cap-rock in wet supercritical CO2 with SO2 and O2 at CO2 storage conditions. Appl. Geochem. 2016, 72, 59–76. [Google Scholar] [CrossRef]
  6. Pearce, J.K.; Golab, A.; Dawson, G.K.W.; Knuefing, L.; Goodwin, C.; Golding, S.D. Mineralogical controls on porosity and water chemistry during O2-SO2-CO2 reaction of CO2 storage reservoir and cap-rock core. Appl. Geochem. 2016, 75, 152–168. [Google Scholar] [CrossRef]
  7. Søreide, I.; Whitson, C.H. Peng-Robinson predictions for hydrocarbons, CO2, N2, and H2S with pure water and NaCl brine. Fluid Phase Equilib. 1992, 77, 217–240. [Google Scholar] [CrossRef]
  8. Duan, Z.; Sun, R. An improved model calculating CO2 solubility in pure water and aqueous NaCl solutions from 273 to 533 K and from 0 to 2000 bar. Chem. Geol. 2003, 193, 257–271. [Google Scholar] [CrossRef]
  9. Mao, S.; Duan, Z. A thermodynamic model for calculating nitrogen solubility, gas phase composition and density of the N2–H2O–NaCl system. Fluid Phase Equilib. 2006, 248, 103–114. [Google Scholar] [CrossRef]
  10. Geng, M.; Duan, Z. Prediction of oxygen solubility in pure water and brines up to high temperatures and pressures. Geochim. Cosmochim. Acta 2010, 74, 5631–5640. [Google Scholar] [CrossRef]
  11. Tan, S.P.; Yao, Y.; Piri, M. Modeling the solubility of SO2 + CO2 mixtures in brine at elevated pressures and temperatures. Ind. Eng. Chem. Res. 2013, 52, 10864–10872. [Google Scholar] [CrossRef]
  12. Sun, R.; Dubessy, J. Prediction of vapor–liquid equilibrium and PVTx properties of geological fluid system with SAFT-LJ EOS including multi-polar contribution. Part I: Application to H2O–CO2 system. Geochim. Cosmochim. Acta 2010, 74, 1982–1998. [Google Scholar] [CrossRef]
  13. Sun, R.; Dubessy, J. Prediction of vapor–liquid equilibrium and PVTx properties of geological fluid system with SAFT-LJ EOS including multi-polar contribution. Part II: Application to H2O–NaCl and CO2–H2O–NaCl system. Geochim. Cosmochim. Acta 2012, 88, 130–145. [Google Scholar] [CrossRef]
  14. Sun, R.; Lai, S.; Dubessy, J. Calculation of vapor–liquid equilibrium and PVTx properties of geological fluid system with SAFT-LJ EOS including multi-polar contribution. Part III. Extension to water–light hydrocarbons systems. Geochim. Cosmochim. Acta 2014, 125, 504–518. [Google Scholar] [CrossRef]
  15. Harvie, C.E.; Weare, J.H. The prediction of mineral solubilities in natural waters: The Na-K-Mg-Ca-Cl-SO4-H2O system from zero to high concentration at 25 °C. Geochim. Cosmochim. Acta 1980, 44, 981–997. [Google Scholar] [CrossRef]
  16. Harvie, C.E.; Møller, N.; Weare, J.H. The prediction of mineral solubilities in natural waters: The Na-K-Mg-Ca-H-Cl-SO4-OH-HCO3-CO3-CO2-H2O system to high ionic strengths at 25 °C. Geochim. Cosmochim. Acta 1984, 48, 723–751. [Google Scholar] [CrossRef]
  17. Møller, N. The prediction of mineral solubilities in natural waters: A chemical equilibrium model for the Na-Ca-Cl-SO4-H2O system, to high temperature and concentration. Geochim. Cosmochim. Acta 1988, 52, 821–837. [Google Scholar] [CrossRef]
  18. Greenberg, J.P.; Møller, N. The prediction of mineral solubilities in natural waters: A chemical equilibrium model for the Na-K-Ca-Cl-SO4-H2O system to high concentration from 0 to 250 °C. Geochim. Cosmochim. Acta 1989, 53, 2503–2518. [Google Scholar] [CrossRef]
  19. Christov, C.; Moller, N. Chemical equilibrium model of solution behavior and solubility in the H-Na-K-OH-Cl-HSO4-SO4-H2O system to high concentration and temperature. Geochim. Cosmochim. Acta 2004, 68, 1309–1331. [Google Scholar] [CrossRef]
  20. Duan, Z.; Li, D. Coupled phase and aqueous species equilibrium of the H2O–CO2–NaCl–CaCO3 system from 0 to 250 °C, 1 to 1000 bar with NaCl concentrations up to saturation of halite. Geochim. Cosmochim. Acta 2008, 72, 5128–5145. [Google Scholar] [CrossRef]
  21. Li, J.; Duan, Z. A thermodynamic model for the prediction of phase equilibria and speciation in the H2O–CO2–NaCl–CaCO3–CaSO4 system from 0 to 250 °C, 1 to 1000 bar with NaCl concentrations up to halite saturation. Geochim. Cosmochim. Acta 2011, 75, 4351–4376. [Google Scholar] [CrossRef]
  22. Peng, D.-Y.; Robinson, D.B. A new two-constant equation of state. Ind. Eng. Chem. Fundam. 1976, 15, 59–64. [Google Scholar] [CrossRef]
  23. Pitzer, K.S. Thermodynamics of electrolytes. I. Theoretical basis and general equations. J. Phys. Chem. 1973, 77, 268–277. [Google Scholar] [CrossRef]
  24. Redlich, O.; Kwong, J.N.S. On the thermodynamics of solutions. V. An equation of state. Fugacities of gaseous solutions. Chem. Rev. 1949, 44, 233–244. [Google Scholar] [CrossRef] [PubMed]
  25. Soave, G. Equilibrium constants from a modified Redlich-Kwong equation of state. Chem. Eng. Sci. 1972, 27, 1197–1203. [Google Scholar] [CrossRef]
  26. Appelo, C.A.J.; Parkhurst, D.L.; Post, V.E.A. Equations for calculating hydrogeochemical reactions of minerals and gases such as CO2 at high pressures and temperatures. Geochim. Cosmochim. Acta 2014, 125, 49–67. [Google Scholar] [CrossRef]
  27. Ziabakhsh-Ganji, Z.; Kooi, H. An equation of state for thermodynamic equilibrium of gas mixtures and brines to allow simulation of the effects of impurities in subsurface CO2 storage. Int. J. Greenh. Gas Control 2012, 11, S21–S34. [Google Scholar] [CrossRef]
  28. Wang, J.; Ryan, D.; Anthony, E.J.; Wigston, A. Effects of impurities on geological storage of carbon dioxide. In Proceedings of the 1st EAGE Sustainable Earth Sciences (SES) Conference and Exhibition, Valencia, Spain, 8–11 November 2011. [Google Scholar]
  29. Li, H.; Yan, J. Evaluating cubic equations of state for calculation of vapor–liquid equilibrium of CO2 and CO2-mixtures for CO2 capture and storage processes. Appl. Energy 2009, 86, 826–836. [Google Scholar] [CrossRef]
  30. Appelo, C.A.J. Principles, caveats and improvements in databases for calculating hydrogeochemical reactions in saline waters from 0 to 200 °C and 1 to 1000 atm. Appl. Geochem. 2015, 55, 62–71. [Google Scholar] [CrossRef]
  31. Helgeson, H.C.; Kirkham, D.H.; Flowers, G.C. Theoretical prediction of the thermodynamic behavior of aqueous electrolytes at high pressures and temperatures: Calculation of activity coefficients, osmotic coefficients, and apparent molal and standard and relative partial modal properties to 600 °C and 5 Kb. Am. J. Sci. 1981, 281, 1249–1516. [Google Scholar] [CrossRef]
  32. Pitzer, K.S.; Mayorga, G. Thermodynamics of electrolytes. Ii. Activity and osmotic coefficients for strong electrolytes with one or both ions univalent. J. Phys. Chem. 1973, 77, 2300–2308. [Google Scholar] [CrossRef]
  33. Pitzer, K.S.; Kim, J.J. Thermodynamics of electrolytes. Iv. Activity and osmotic coefficients for mixed electrolytes. J. Am. Chem. Soc. 1974, 96, 5701–5707. [Google Scholar] [CrossRef]
  34. Li, D.; Duan, Z. The speciation equilibrium coupling with phase equilibrium in the H2O–CO2–NaCl system from 0 to 250 °C, from 0 to 1000 bar, and from 0 to 5 molality of NaCl. Chem. Geol. 2007, 244, 730–751. [Google Scholar] [CrossRef]
  35. Tödheide, K.; Franck, E. Das zweiphasengebiet und die kritische kurve im system kohlendioxid–wasser bis zu drucken von 3500 bar. Z. Phys. Chem. 1963, 37, 389–401. [Google Scholar] [CrossRef]
  36. Takenouchi, S.; Kennedy, G.C. The solubility of carbon dioxide in NaCl solutions at high temperatures and pressures. Am. J. Sci. 1965, 263, 445–454. [Google Scholar] [CrossRef]
  37. Malinin, S.D.; Savelyeva, N.I. The solubility of CO2 in NaCl and CaCl2 solutions at 25, 50, and 75 °C under elevated CO2 pressures. Geokhimiya 1972, 6, 643–653. [Google Scholar]
  38. Malinin, S.D.; Kurovskaya, N.A. Investigation of CO2 solubility in a solution of chlorides at elevated temperatures and pressures of CO2. Geokhimiya 1975, 4, 547–551. [Google Scholar]
  39. Tabasinejad, F.; Moore, R.G.; Mehta, S.A.; Van Fraassen, K.C.; Barzin, Y.; Rushing, J.A.; Newsham, K.E. Water solubility in supercritical methane, nitrogen, and carbon dioxide: Measurement and modeling from 422 to 483 K and pressures from 3.6 to 134 MPa. Ind. Eng. Chem. Res. 2011, 50, 4029–4041. [Google Scholar] [CrossRef]
  40. Wiebe, R.; Gaddy, V.L.; Heins, C. The solubility of nitrogen in water at 50, 75 and 100 °C from 25 to 1000 atmospheres. J. Am. Chem. Soc. 1933, 55, 947–953. [Google Scholar] [CrossRef]
  41. Mishnina, T.A.; Avdeeva, O.I.; Bozhovskaya, T.K. Solubility of gases in natural waters depending on temperature, pressure and salt composition. Mater. Vses. Nauchn. Issled. Geol. Inst. 1961, 46, 93–110. [Google Scholar]
  42. Althaus, K. Messung und Berechnung von Wassergehalten Kohlenwasserstoffhaltiger Gasgemische; Progress Reports VDI; VDI-Verlag: Düsseldorf, Germany, 1999; p. 590. [Google Scholar]
  43. Namiot, A.Y.; Bondareva, M.M. Solubility of Gases in Water; Gostekhizdat: Moscow, Russia, 1959. [Google Scholar]
  44. Stenphan, E.L.; Hatfield, N.S.; Peoples, R.S.; Pray, H.A.H. Solubility of Gases in Water and in Aqueous Uranyl Salt Solutions at Elevated Temperatures and Pressures; BMI-1067; Battelle Memorial Inst.: Columbus, OH, USA, 1956. [Google Scholar]
  45. Pray, H.A.; Stephan, E.F. Solubility of Hydrogen in Uanyl Sulphate Solutions at Elevated Temperatures; BMI-840; Battelle Memorial Inst.: Columbus, OH, USA, 1953. [Google Scholar]
  46. Yasunishi, A. Solubility of Oxygen in Aqueous Electrolyte Solutions. Kagaku Kogaku Rombunshu 1978, 4, 185–189. [Google Scholar] [CrossRef]
  47. Liu, Y.; Hou, M.; Yang, G.; Han, B. Solubility of CO2 in aqueous solutions of NaCl, KCl, CaCl2 and their mixed salts at different temperatures and pressures. J. Supercrit. Fluids 2011, 56, 125–129. [Google Scholar] [CrossRef]
  48. Polya, D.A.; Woolley, E.M.; Simonson, J.M.; Mesmer, R.E. The enthalpy of dilution and thermodynamics of Na2CO3(aq) and NaHCO3(aq) from T = 298 K to T = 523.15 K and pressure of 40 MPa. J. Chem. Thermodyn. 2001, 33, 205–243. [Google Scholar] [CrossRef]
  49. Pabalan, R.T.; Pitzer, K.S. Thermodynamics of NaOH(aq) in hydrothermal solutions. Geochim. Cosmochim. Acta 1987, 51, 829–837. [Google Scholar] [CrossRef]
  50. Pitzer, K.S. Thermodynamic properties of aqueous sodium chloride solutions. J. Phys. Chem. Ref. Data 1984, 13, 1–102. [Google Scholar] [CrossRef]
  51. Ellis, A.J. 750. The effect of pressure on the first dissociation constant of “carbonic acid”. J. Chem. Soc. (Resumed) 1959, 3689–3699. [Google Scholar] [CrossRef]
  52. Ellis, A.J. The solubility of calcite in sodium chloride solutions at high temperatures. Am. J. Sci. 1963, 261, 259–267. [Google Scholar] [CrossRef]
  53. Bénézeth, P.; Saldi, G.D.; Dandurand, J.-L.; Schott, J. Experimental determination of the solubility product of magnesite at 50 to 200 °C. Chem. Geol. 2011, 286, 21–31. [Google Scholar] [CrossRef]
  54. Bénézeth, P.; Berninger, U.-N.; Bovet, N.; Schott, J.; Oelkers, E.H. Experimental determination of the solubility product of dolomite at 50–253 °C. Geochim. Cosmochim. Acta 2018, 224, 262–275. [Google Scholar] [CrossRef]
  55. Rodrigues, C.F.A.; Dinis, M.A.P.; Lemos de Sousa, M.J. Review of European energy policies regarding the recent “carbon capture, utilization and storage” technologies scenario and the role of coal seams. Environ. Earth Sci. 2015, 74, 2553–2561. [Google Scholar] [CrossRef]
Figure 1. CO2-brine system mutual solubility from experimental data [35,36,37,38,39] (dots) and results calculated by this model (lines) at various temperatures, pressures and salinities. (a) CO2 solubility in pure water. (b) CO2 solubility in NaCl solutions varying with pressure at different temperature and NaCl molality. (c) CO2 solubility in NaCl solutions varying with NaCl molality at different temperatures and pressures. (d) H2O solubility in CO2-rich phase at different pressures and temperatures.
Energies 11 02627 g001
Figure 2. N2-brine mutual solubility obtained from experimental data [40,41,42,43] (dots) and the results calculated by the model at various values of temperature, pressure and salinity. (a) N2 solubility in water. (b) N2 solubility in NaCl solutions varying with pressure. (c) N2 solubility in NaCl solutions varying with NaCl molality at 1 atm. (d) H2O solubility in N2-rich phase.
Energies 11 02627 g002
Figure 3. O2-brine mutual solubility obtained from experimental data [44,45,46] (dots) and the results calculated by the model (lines) at various values of temperature, pressure and salinity. (a) O2 solubility in water. (b) O2 solubility in NaCl solutions.
Energies 11 02627 g003
Figure 4. CO2-N2-H2O equilibria (i.e., CO2 and N2 mole fractions in brine varying with N2 mole fractions in gas) obtained from experimental work (Liu et al. [47], dots) and the calculated results (lines) by the model in this work at various values of temperature and pressure. (a) at P=80 bar and T=308.15 K; (b) at P=120 bar and 308.15 K; (c) at P=160 bar and T=308.15 K; (d) at P=80 bar and T=318.15 K; (e) at P=120 bar and T=318.15 K; (f) P=160 bar and T=318.15 K.
Energies 11 02627 g004
Figure 5. Calcite solubility in aqueous solution with CO2 in equilibrium obtained from experimental data [51,52] and the calculated results using this model. (a) Calcite solubility varying with NaCl molality at different temperatures. (b) Calcite solubility varying with temperature at different NaCl molalities.
Energies 11 02627 g005
Figure 6. Calcite solubility in pure water or NaCl solutions calculated by this model at different temperature, pressure and NaCl molality. (a) Calcite solubility in pure water varying with pressure at different temperatures. (b) Calcite solubility in NaCl solutions varying with NaCl molality at 343.15 (K) and various pressures.
Energies 11 02627 g006
Figure 7. Magnesite solubility calculated by this model (lines) and obtained from the experimental work of Benezeth et al. [53] (dots).
Energies 11 02627 g007
Figure 8. Magnesite solubility in pure water or NaCl solutions calculated by this work at various values of pressure, temperature and NaCl molality of the solution. (a) Magnesite solubility in pure water varying with pressure at different temperature. (b) Magnesite solubility in NaCl solutions varying with NaCl molality at 343.15 (K) and various pressures.
Energies 11 02627 g008
Figure 9. Aqueous species concentration in equilibrium with dolomite obtained from experimental results [54] and the calculated results by this model at various temperatures.
Energies 11 02627 g009
Figure 10. Dolomite solubility in pure water or NaCl solution calculated by this work at various temperatures, pressures and NaCl molalities. (a) Dolomite solubility varying with pressure at different pressures. (b) Dolomite solubility varying with NaCl molality at 343.15 (K) and various pressures.
Energies 11 02627 g010
Figure 11. CO2 solubility in pure water or carbonate mineral saturated solutions at different temperatures and pressures. Solid lines are CO2 solubility in pure water. Dashed lines represent calcite saturated solutions. Dash-dot lines represent magnesite saturated solutions.
Energies 11 02627 g011
Figure 12. Carbonate mineral solubility in pure water or in CO2 saturated solutions. (a) Calcite solubility. (b) Magnesite solubility. (c) Dolomite solubility.
Energies 11 02627 g012
Figure 13. Phase equilibria of CO2-brine-calcite and CO2-N2-brine-calcite at 100 (°C) and 300 (bar). (a) CO2 molality varying with NaCl molality. (b) Ca2+ molality and pH varying with NaCl molality; solid lines are Ca2+ molality, and dashed lines are pH.
Energies 11 02627 g013
Table 1. Parameters of each component for PR EOS.
Tc (K)Pc (bar) ω
CO2304.2 a73.83 a0.2236 a
N2126.2 b34.0 b0.0377 b
O2154.6 b49.8 b0.021 b
H2O647.3 a221.2 a0.3434 a
a: from Soreide and Whitson [7]; b: from PHREEQC database [26].
Table 2. Binary interaction parameters for PR EOS.
δijH2OCO2N2O2
H2O-0.1896 a0.32547 b0.20863 c
CO20.1896 a-−0.007 d0.1140 d
N20.32547 b−0.007 d-−0.0119 c
O20.20863 c0.1140 d−0.0119c-
a: from Soreide and Whitson [7]; b: from Ziabakhsh-Ganji and Kooi [27]; c: from Wang et al. [28]; d: from Li and Yan [29].
Table 3. Parameters for equilibrium constants of CO2, N2 and O2.
A0A1A2A3A4A5a1a2a3a4ω
CO2−10.526242.3547 × 10−23972.80−5.8746 × 10⁵−1.9194 × 10−57.290.922.07−1.23−1.6
N258.453−1.818 × 10⁻³−3199−17.90927,460070000
O27.5001−7.8981 × 10−300−2.0027 × 10505.78896.35363.2528−3.0417−0.3943
Table 4. Parameters of Pitzer interaction equations for gas components and main ion species.
.b0b1b2b3b4b5
λ C O 2 N a + a0.085
λ C O 2 M g + 2 a0.183
λ C O 2 C a + 2 a0.183
λ C O 2 S O 4 2 a0.075
λ C O 2 K + a0.051
λ N 2 N a + b0.1402−595−4.0250.01044−2.131 × 10−649,970
λ N 2 M g + 2 b0.2804−1190−8.050.02088−4.262 × 10−699,940
λ N 2 C a + 2 b0.2804−1190−8.050.02088−4.262 × 10−699,940
λ N 2 K + b0.1402−595−4.0250.01044−2.131 × 10−649,970
λ N 2 S O 4 2 b0.0371
λ O 2 N a + c0.19997
λ O 2 M g + 2 c0.31715
λ O 2 C a + 2 c0.35135
λ O 2 K + c0.15022
λ O 2 S O 4 2 c0.14383
ζ C O 2 N a + S O 4 2 b−0.015
ζ N 2 N a + S O 4 2 b−1.16 × 10⁻²
ζ N 2 N a + C l b−0.58 × 10⁻²
ζ N 2 K + C l b−0.58 × 10⁻²
ζ N 2 K + S O 4 2 b−1.16 × 10⁻²
ζ N 2 C a + 2 C l b−1.16 × 10⁻²
ζ N 2 C a + 2 S O 4 2 b−2.32 × 10⁻²
ζ N 2 M g + 2 C l b−1.16 × 10⁻²
ζ N 2 M g + 2 S O 4 2 b−2.32 × 10⁻²
a: from Appelo [30]; b: this work; c: from Geng and Duan [10].
Table 5. Literature sources of Pitzer parameters.
Pitzer ParametersLiterature Sources
β C a C O 3 ( 0 ) , β C a C O 3 ( 1 ) , β C a C O 3 ( 2 ) , C C a C O 3 φ Duan and Li [20]
β C a H C O 3 ( 0 ) , β C a H C O 3 ( 1 ) Appelo [30]
β C a C l ( 0 ) , β C a C l ( 1 ) , C C a C l φ Christov and Moller [19]
β M g C l ( 0 ) , β M g C l ( 1 ) , C M g C l φ Christov and Moller [19]
β M g H C O 3 ( 0 ) , β M g H C O 3 ( 1 ) Greenberg and Moller [18], Christov and Moller [19]
β C a O H ( 0 ) , β C a O H ( 1 ) , β C a O H ( 2 ) Christov and Moller [19]
β H C l ( 0 ) , β H C l ( 1 ) , C H C l φ Christov and Moller [19]
β N a C O 3 ( 0 ) , β N a C O 3 ( 1 ) , C N a C O 3 φ Polya et al. [48]
β N a H C O 3 ( 0 ) , β N a H C O 3 ( 1 ) , C N a H C O 3 φ Polya et al. [48]
β N a O H ( 0 ) , β N a O H ( 1 ) , C N a O H φ Pabalan and Pitzer [49]
β N a C l ( 0 ) , β N a C l ( 1 ) , C N a C l φ Pitzer [50]
θ H N a , θ O H C l , θ O H C O 3 , θ C l C O 3 , θ C l H C O 3 , θ H C O 3 C O 3 Li and Duan [34]
θ C a H , θ C a N a Christov and Moller [19]
θ C a M g Pabalan and Pitzer [49]
ψ O H C l N a , ψ O H H C O 3 N a , ψ C O 3 C l N a , ψ C O 3 H C O 3 N a , ψ C O 3 C l C a , ψ O H C l C a , ψ C O 3 N a O H Li and Duan [34], Duan and Li [20]
ψ C l M g C a , ψ C l N a C a , ψ C l H C a , ψ C l H M g Appelo [30]

