The Way Forward in Quantifying Extended Exergy Efficiency


Abstract
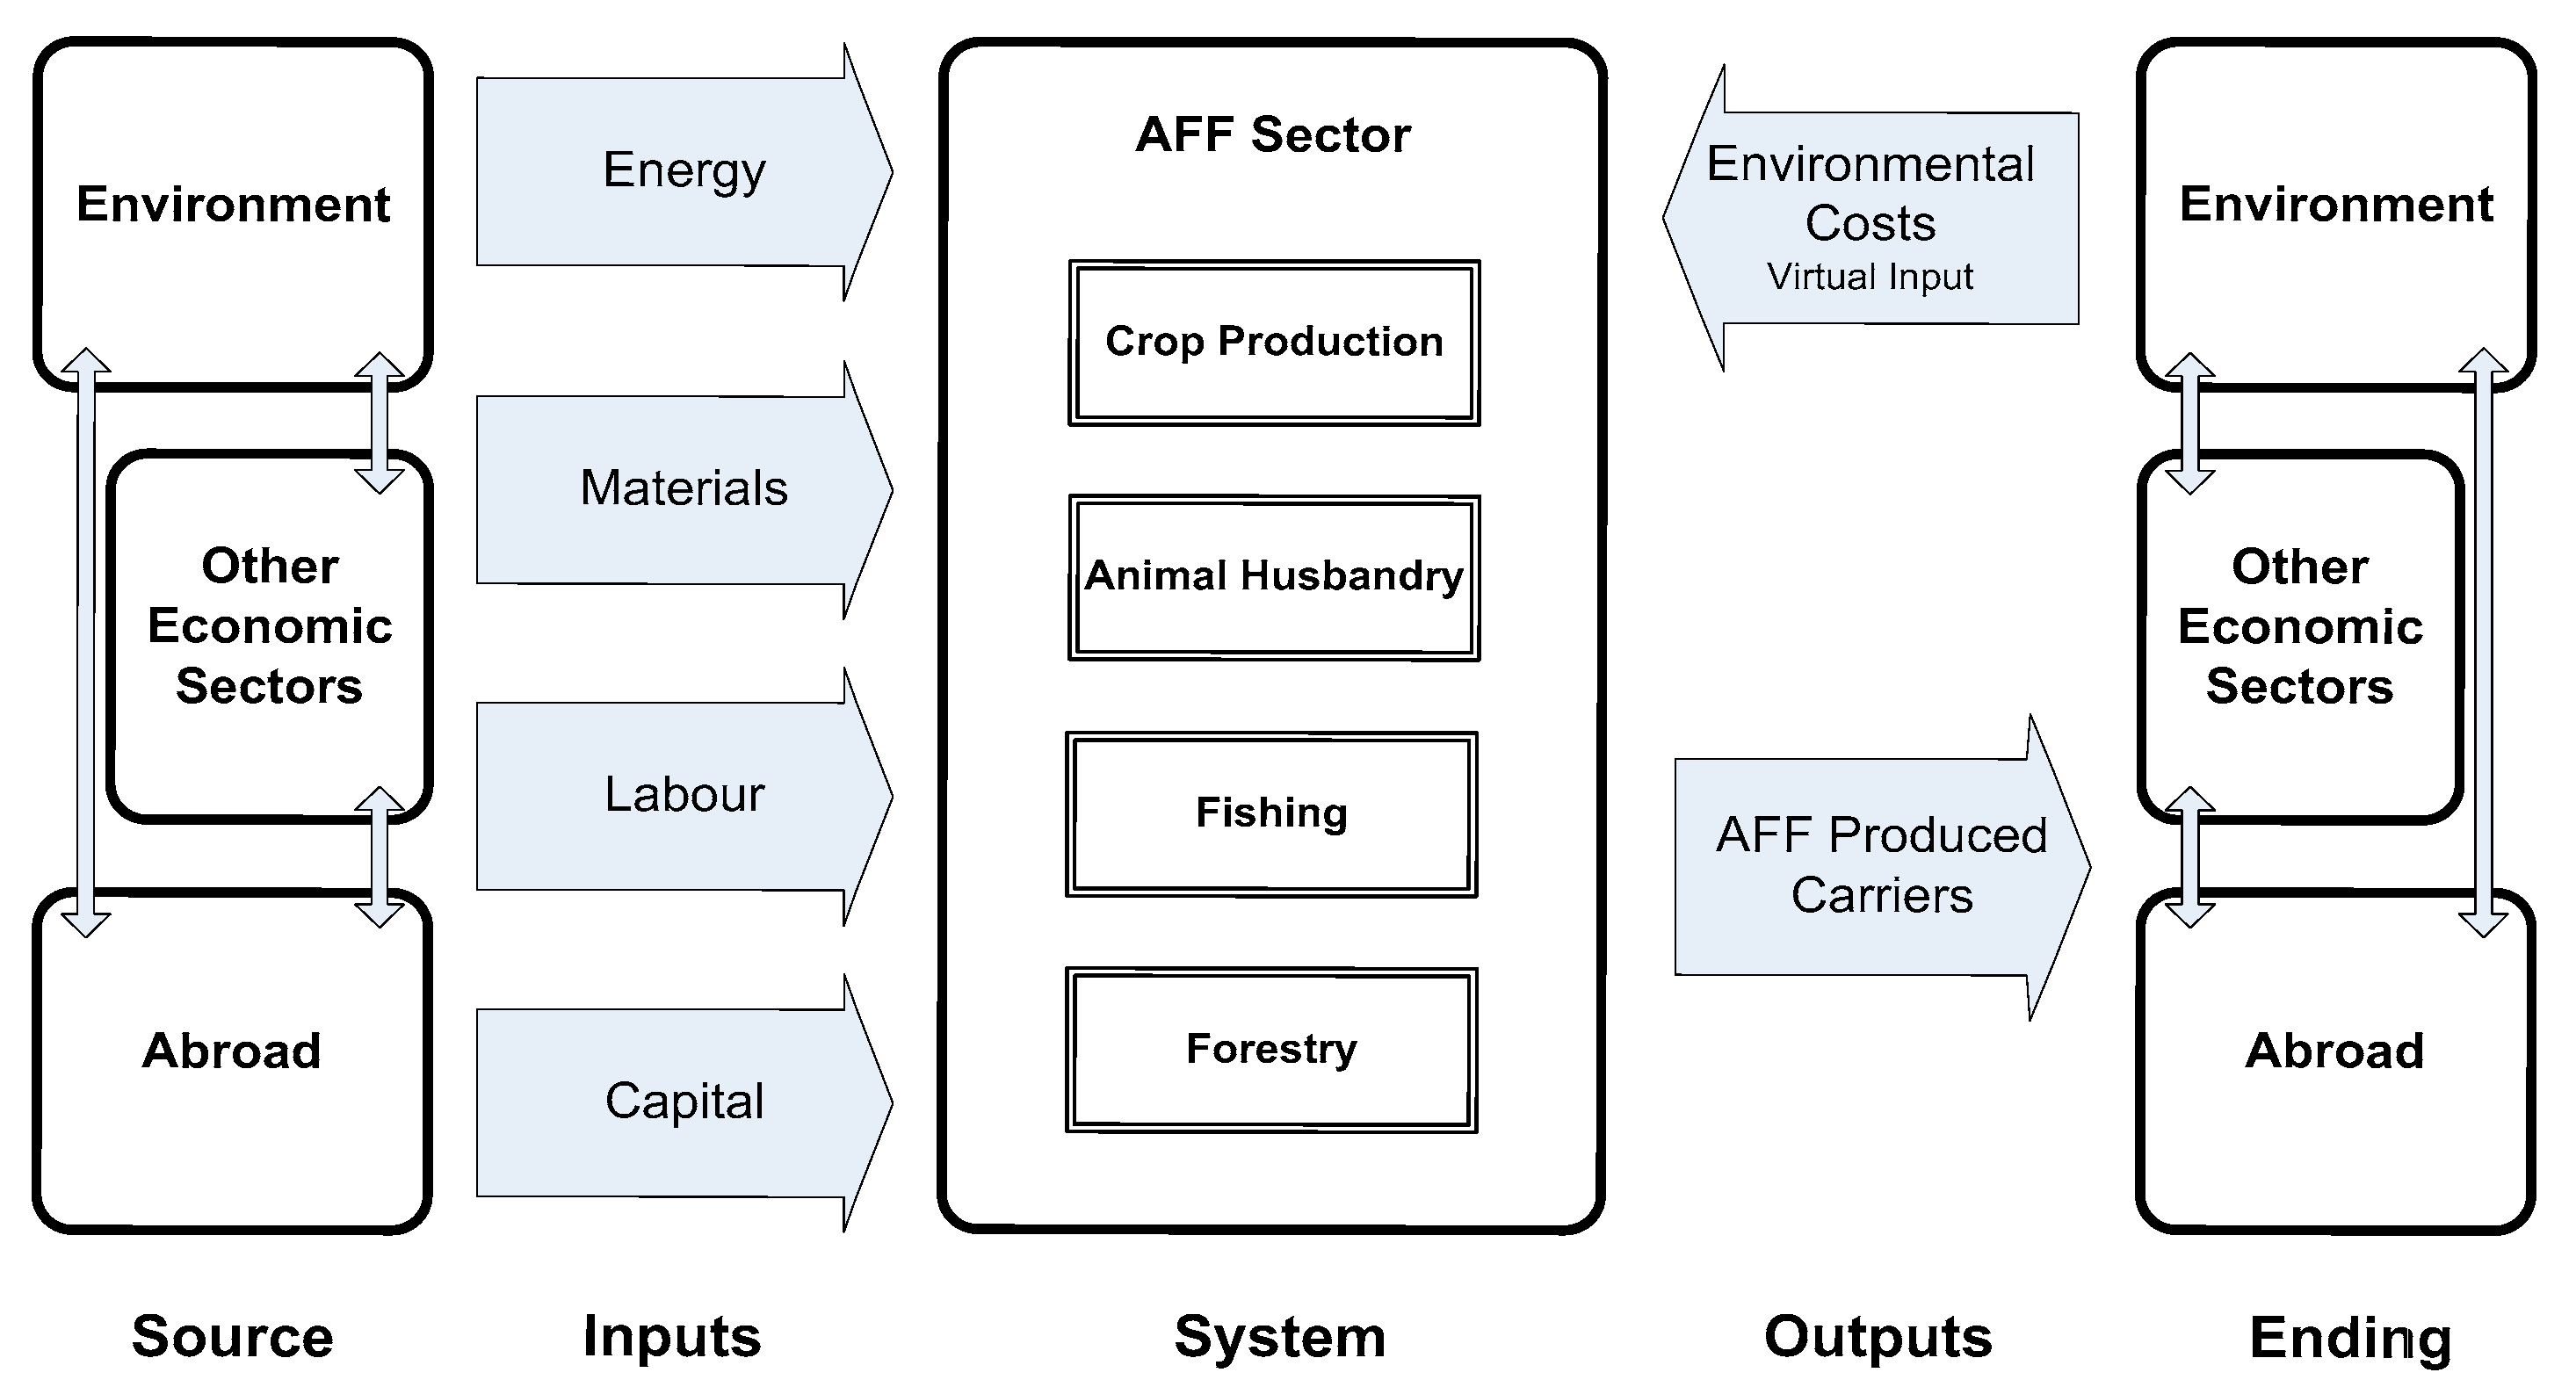
:1. Introduction
2. EEA Methodologies: Review and Synthesis
2.1. Input and Output Exergies for Material and Energy Flows
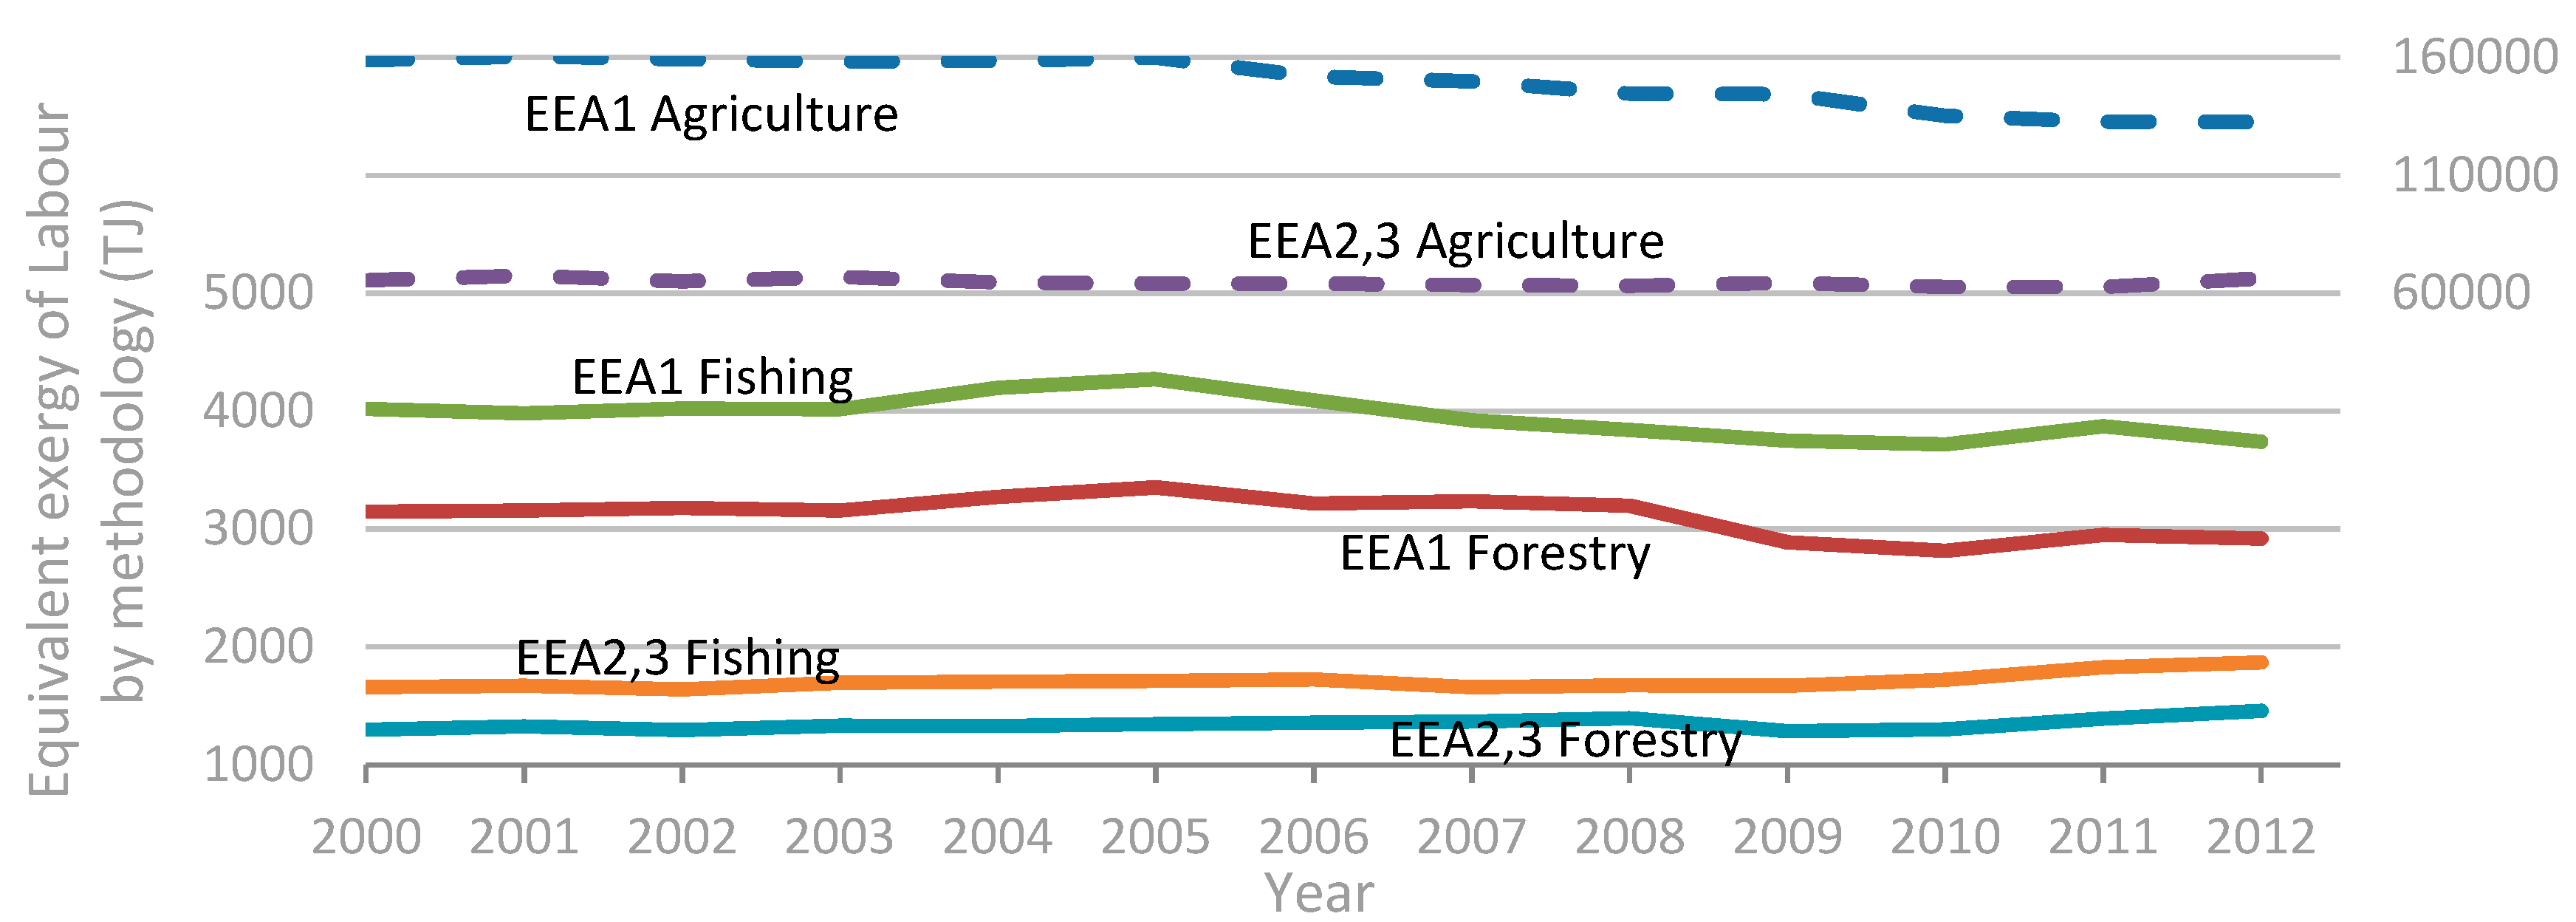
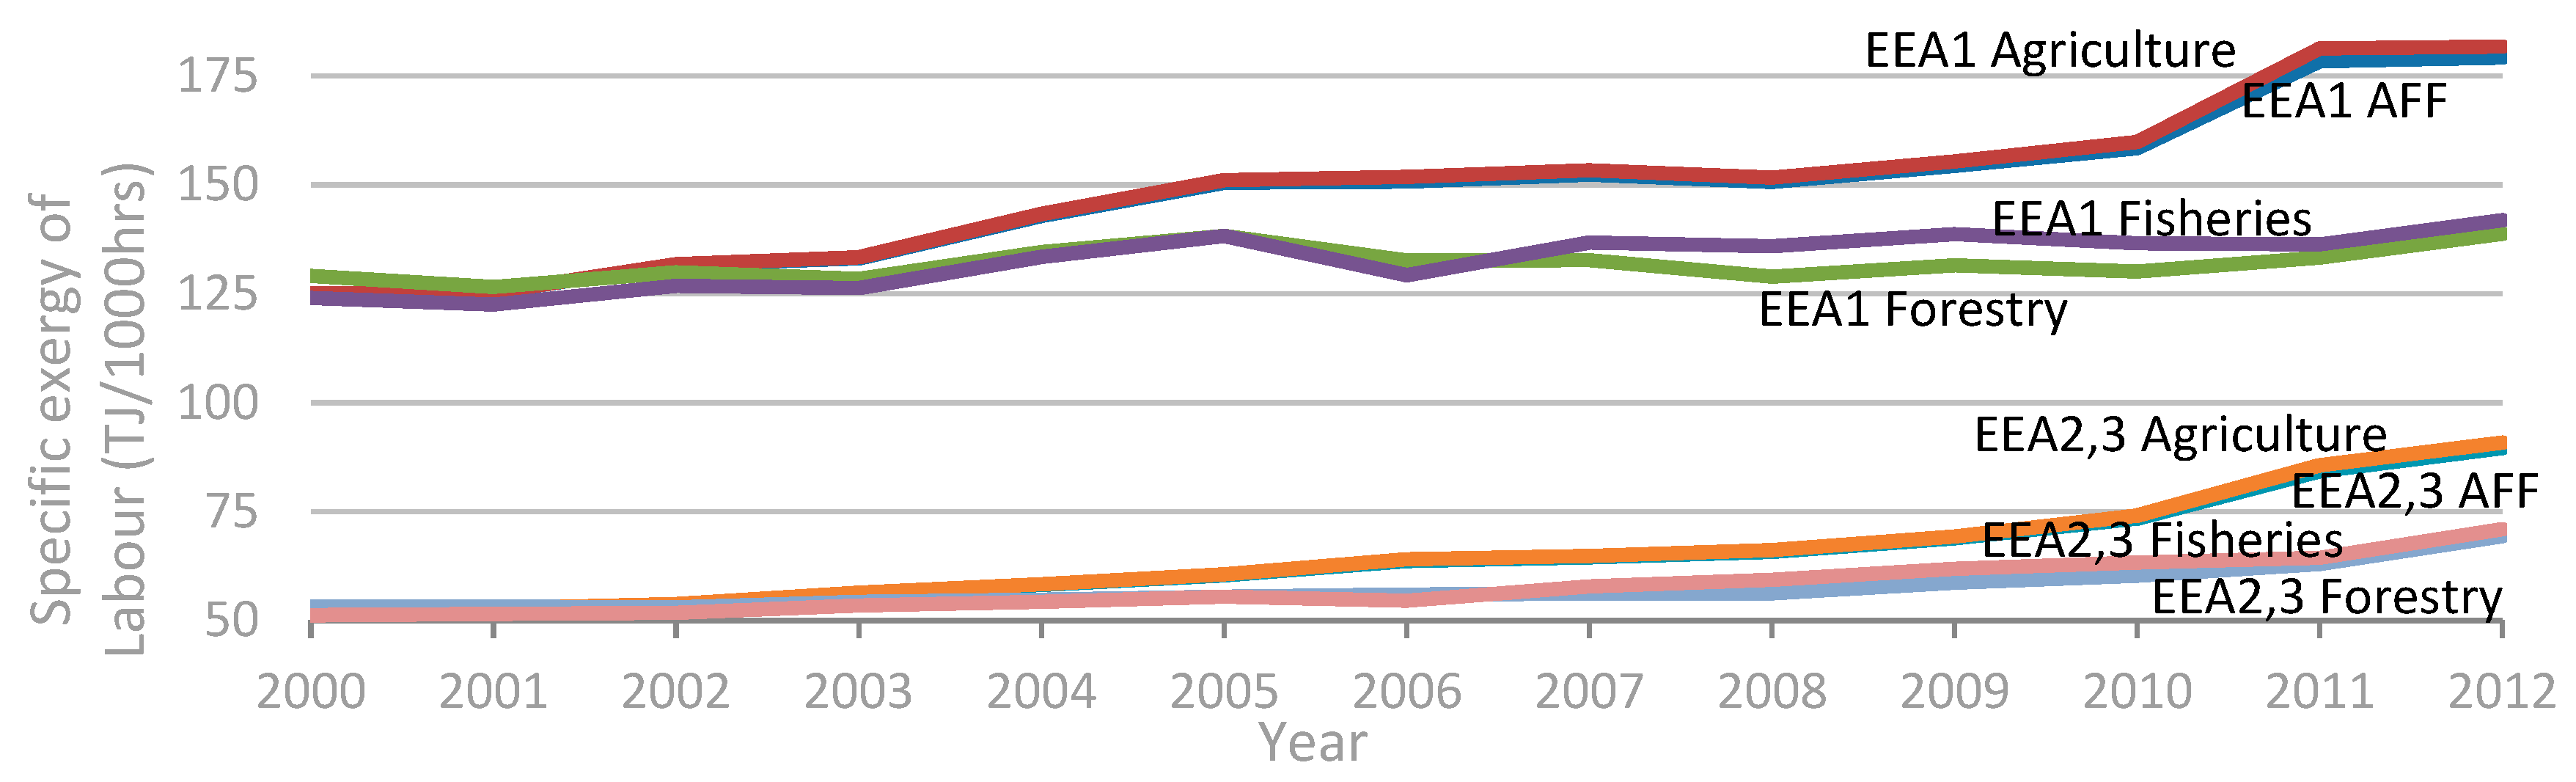
2.2. Labour
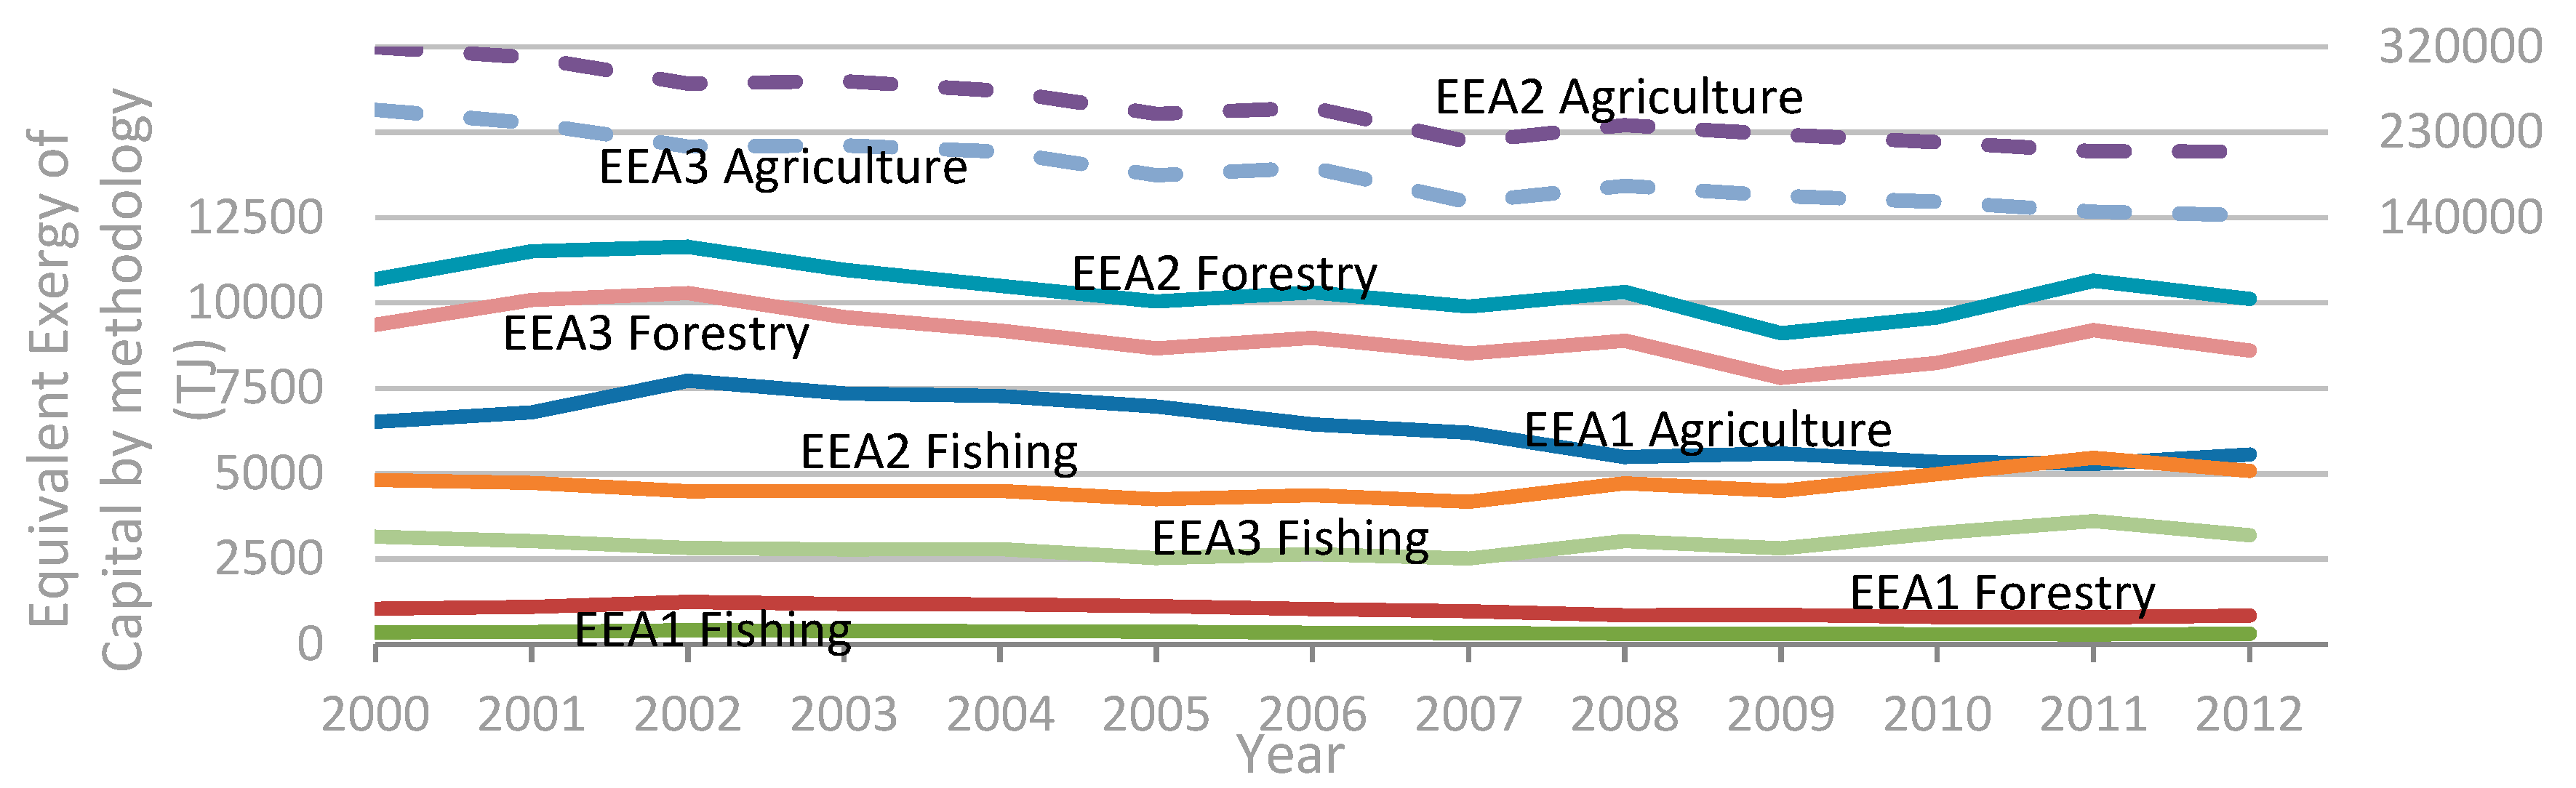
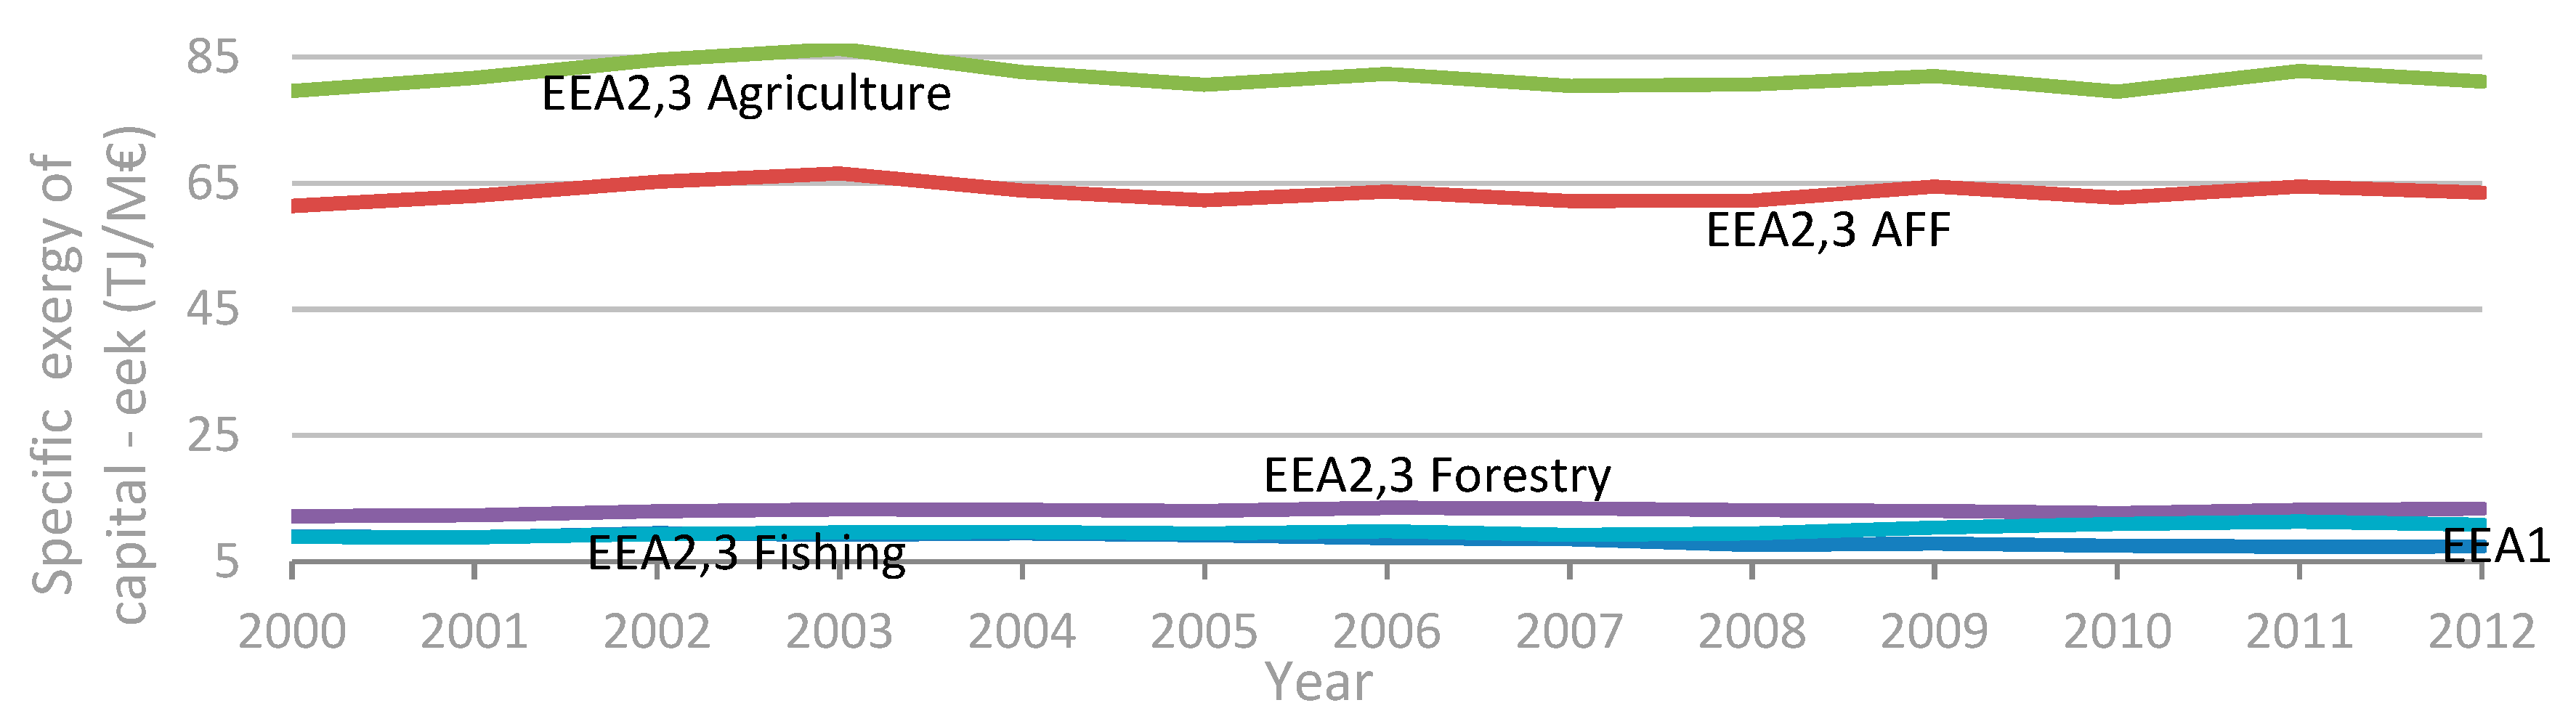
2.3. Capital
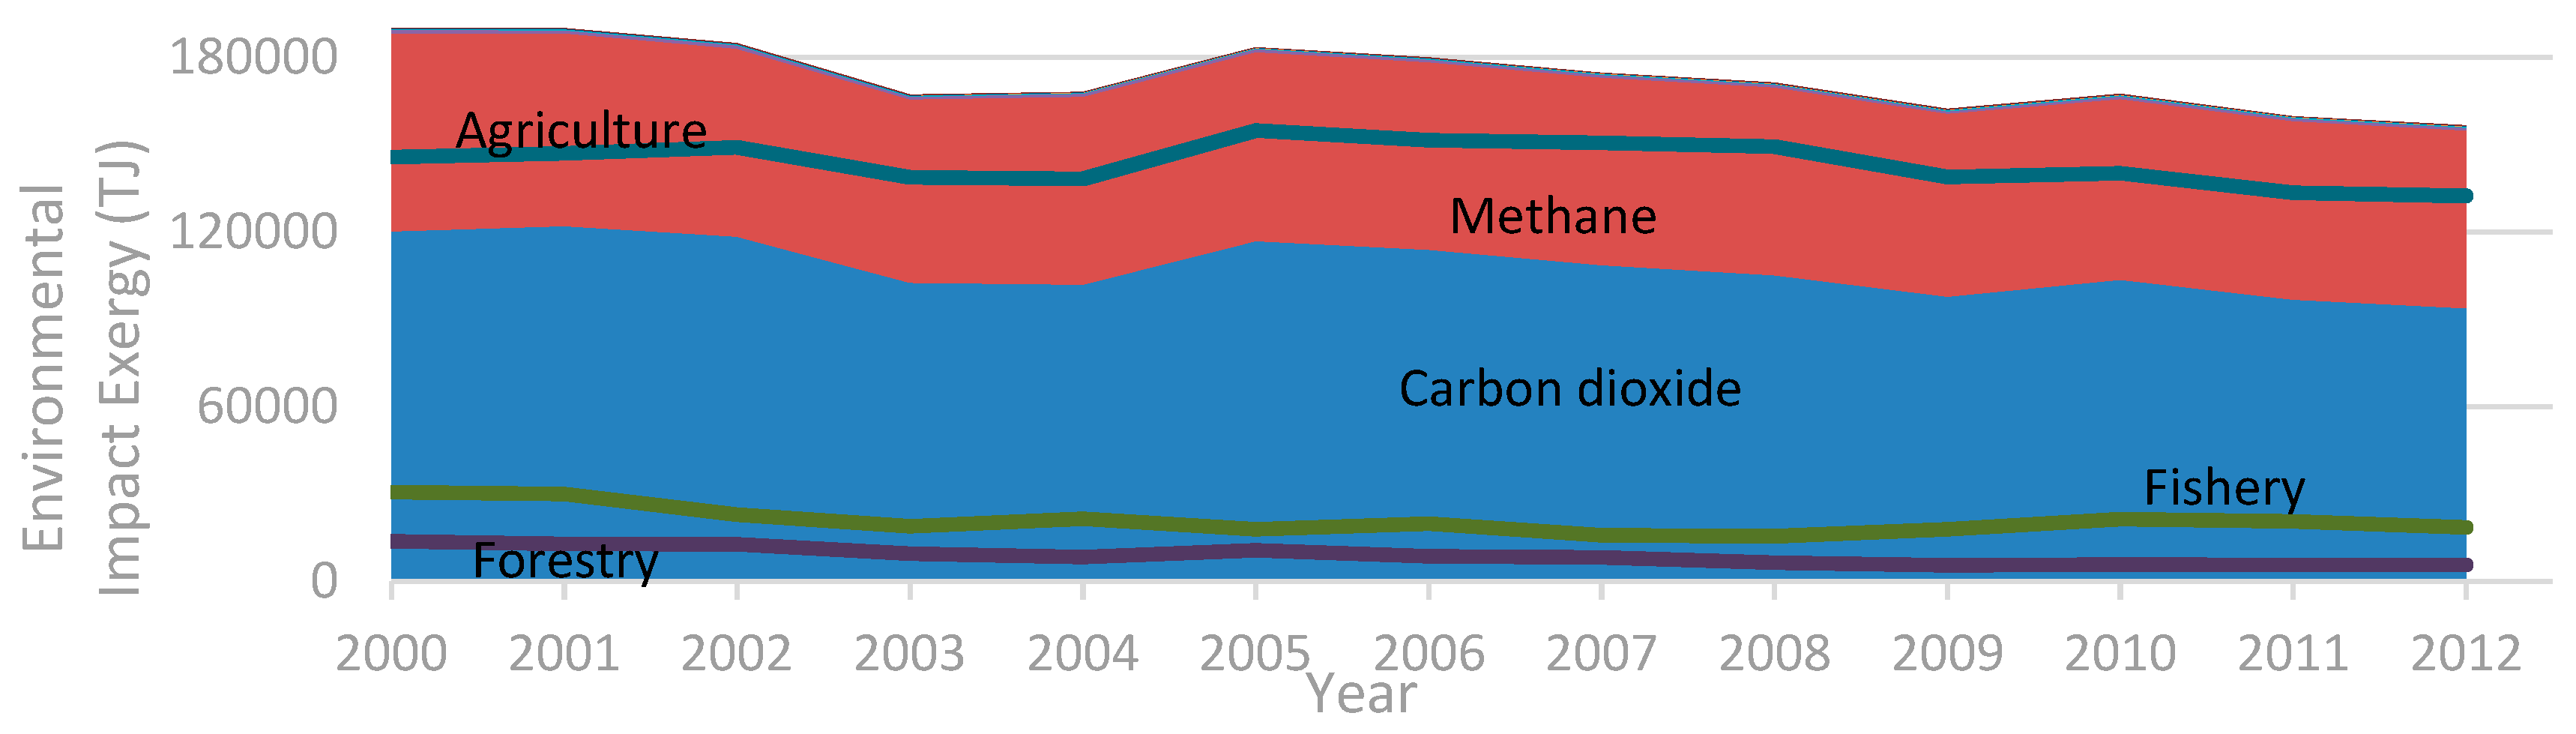
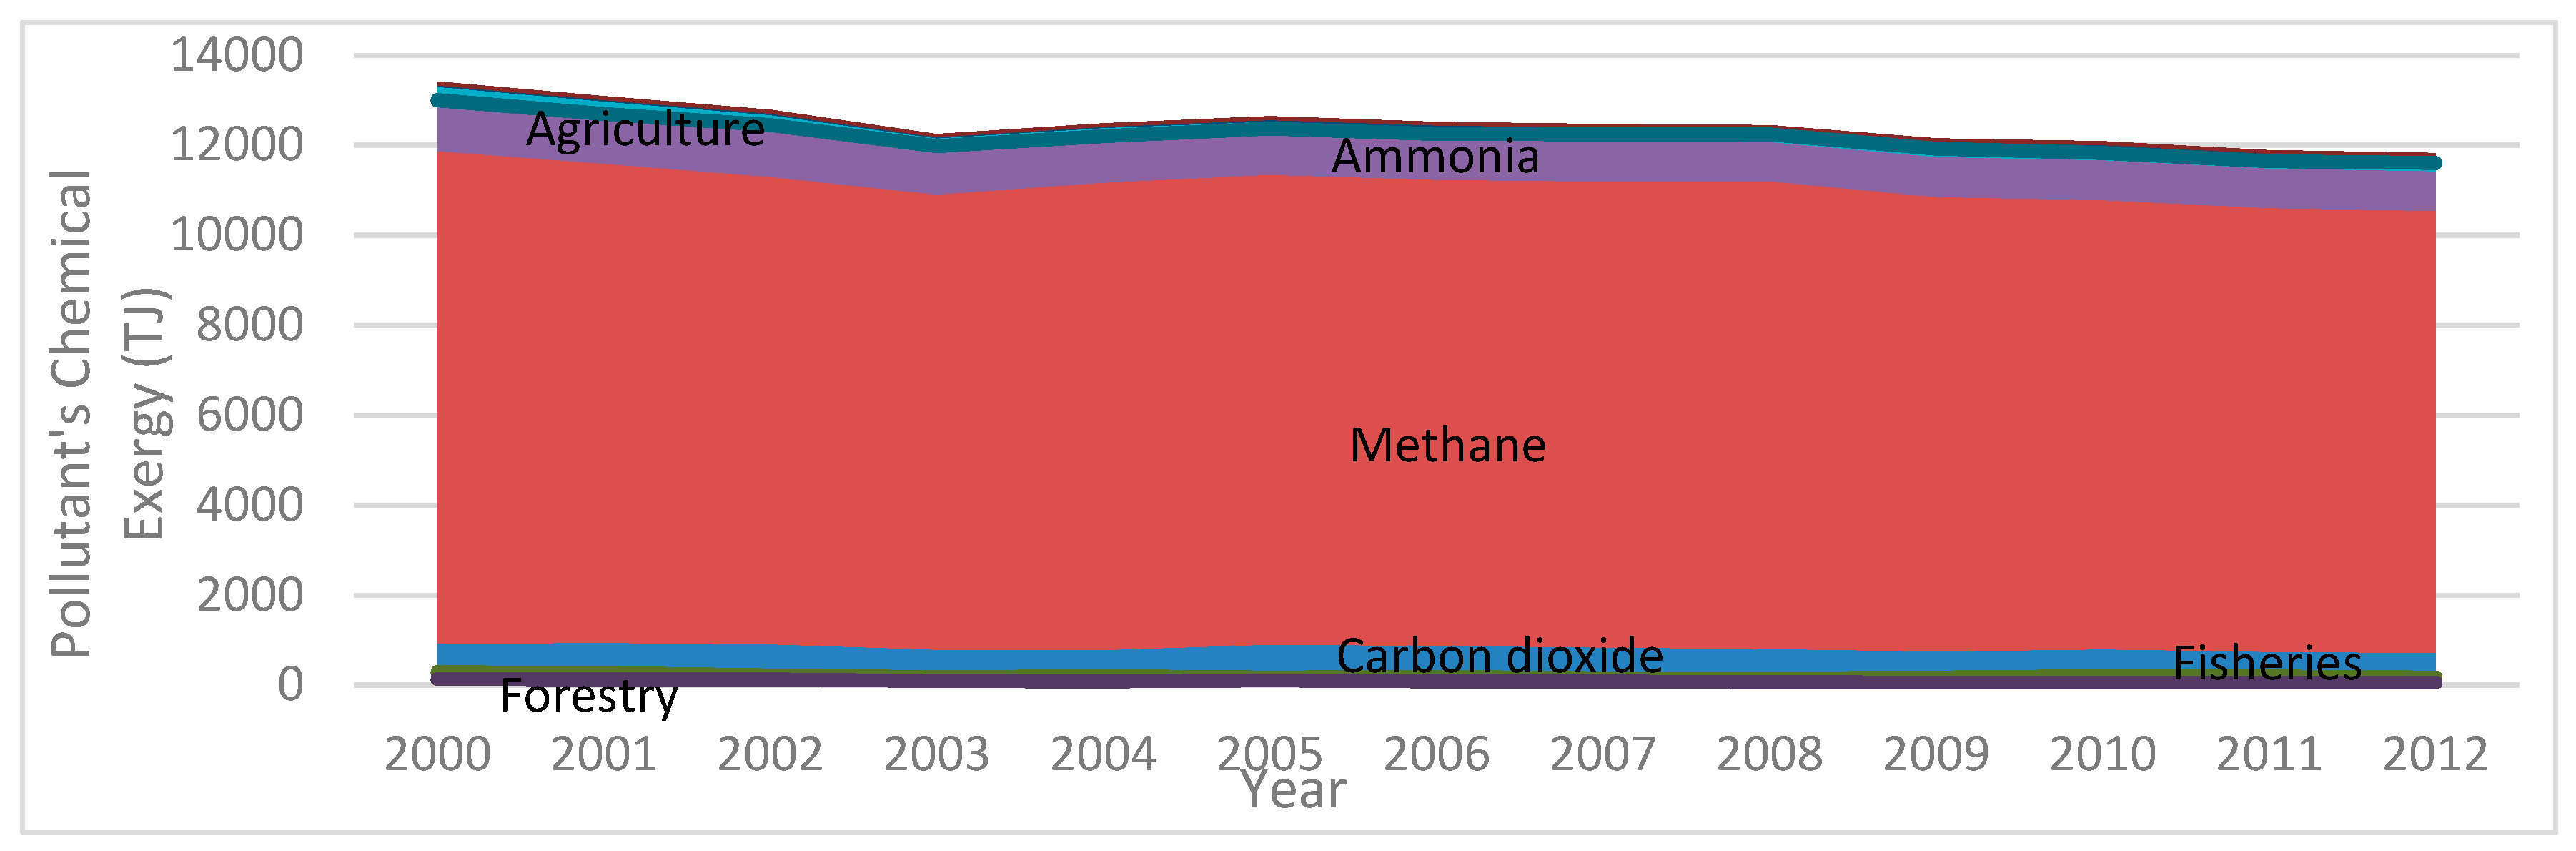
2.4. Environmental Impact
3. EEA Methodologies: A Case Study
4. Results, Comparison, and Discussion
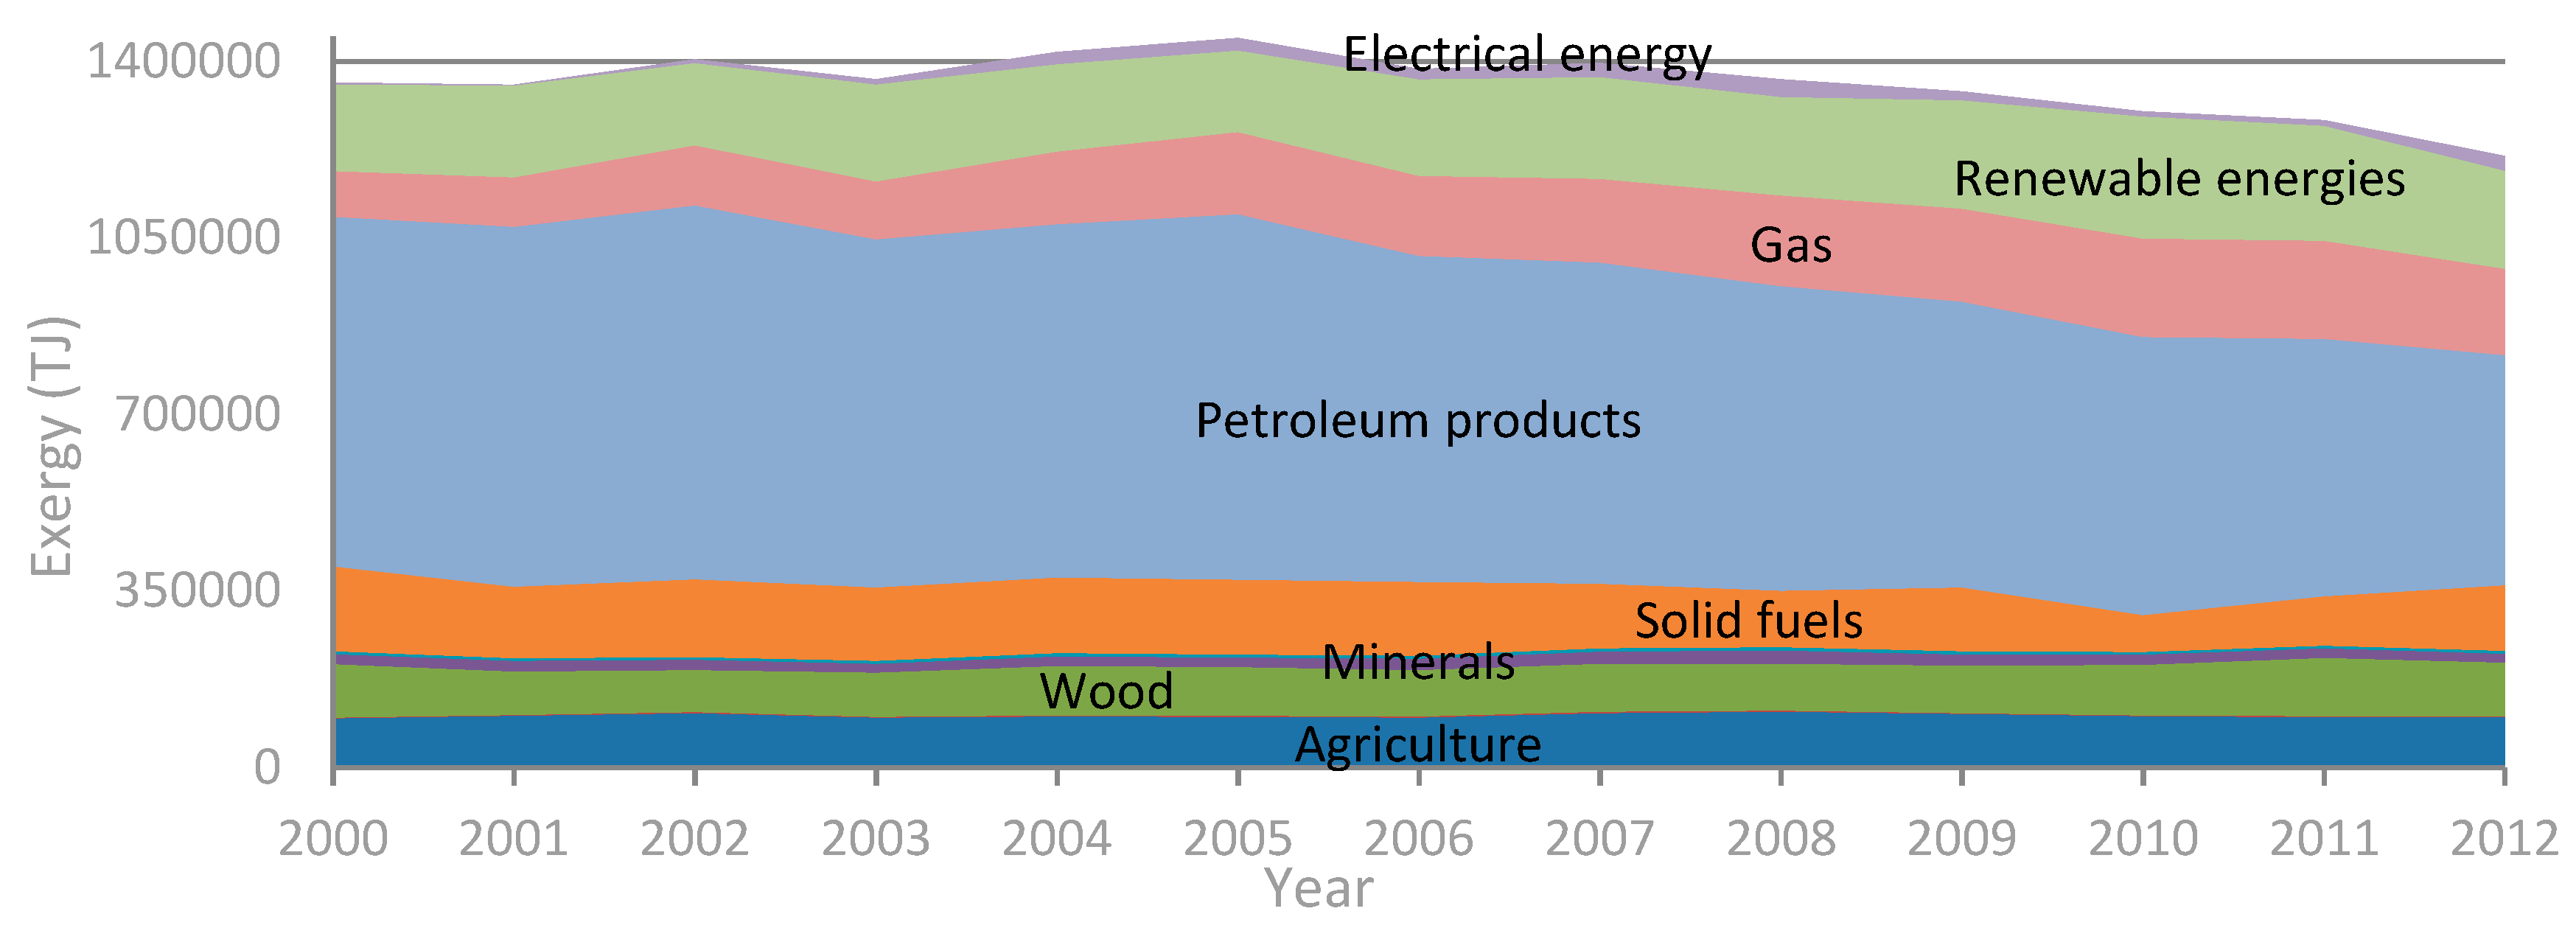
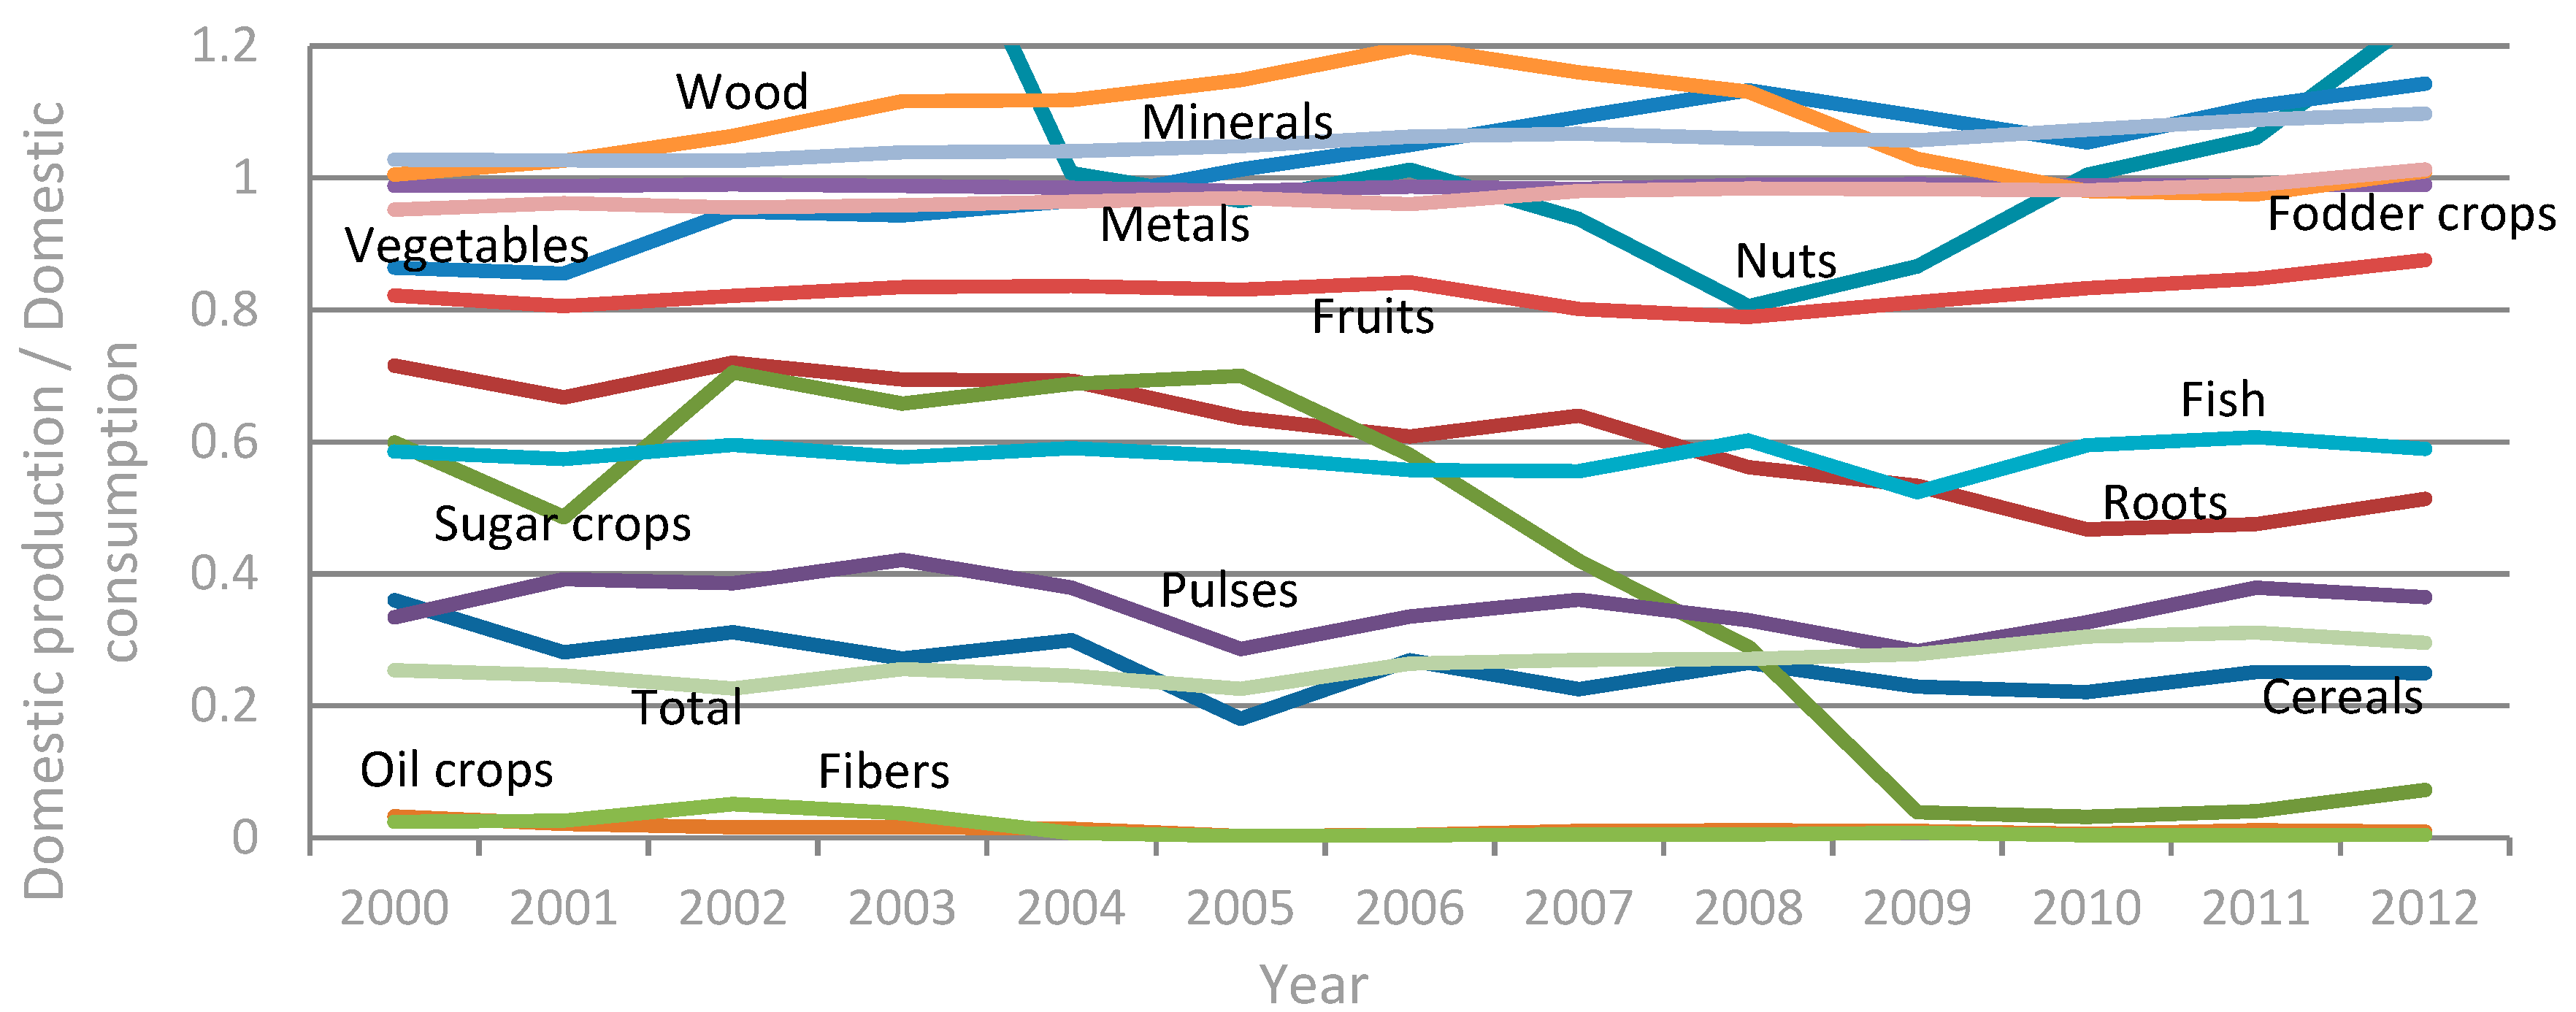
4.1. The Exergy of Material Fluxes
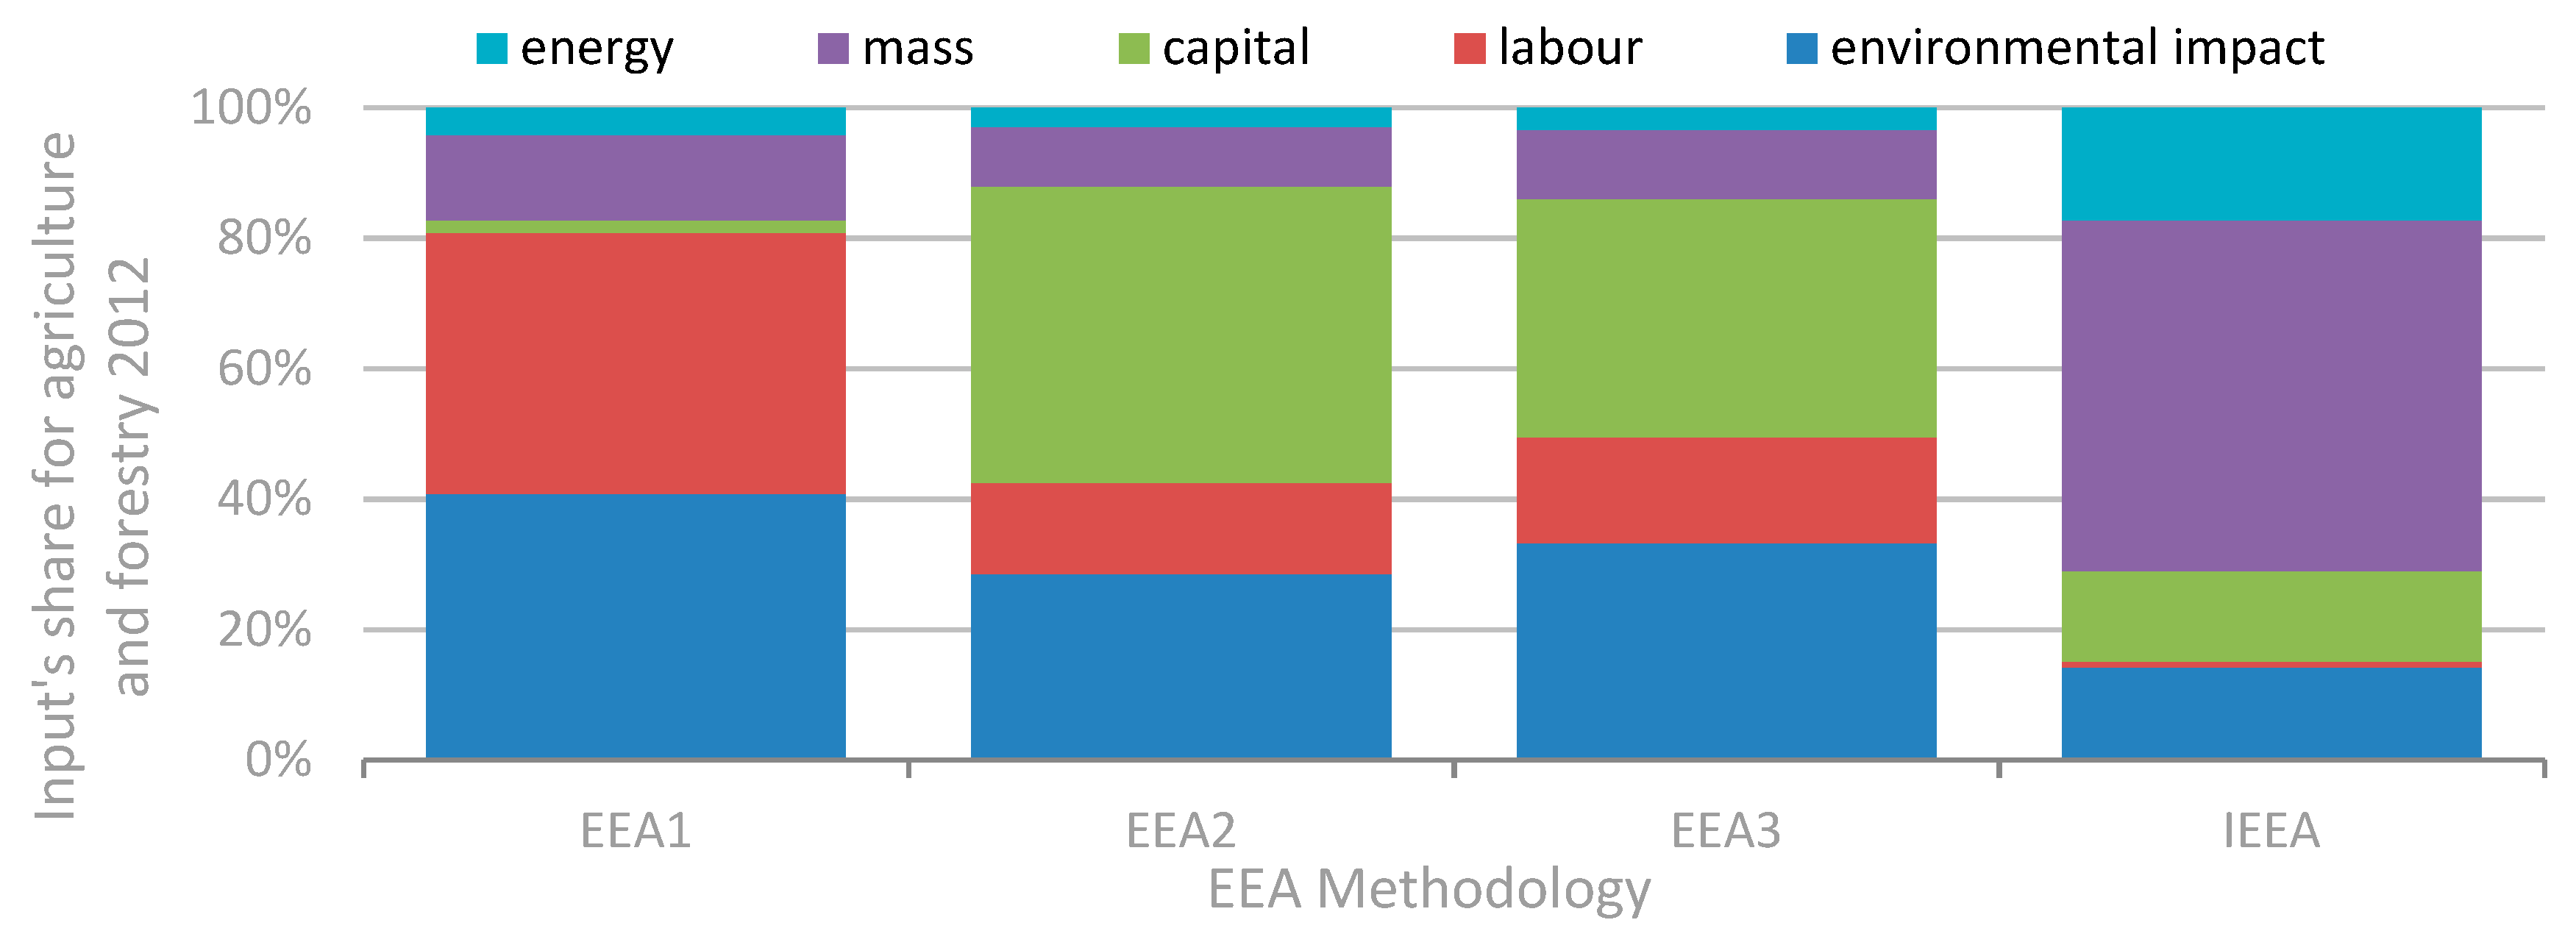
4.2. The Exergy of Immaterial Fluxes with EEA1, EEA2, and EEA3
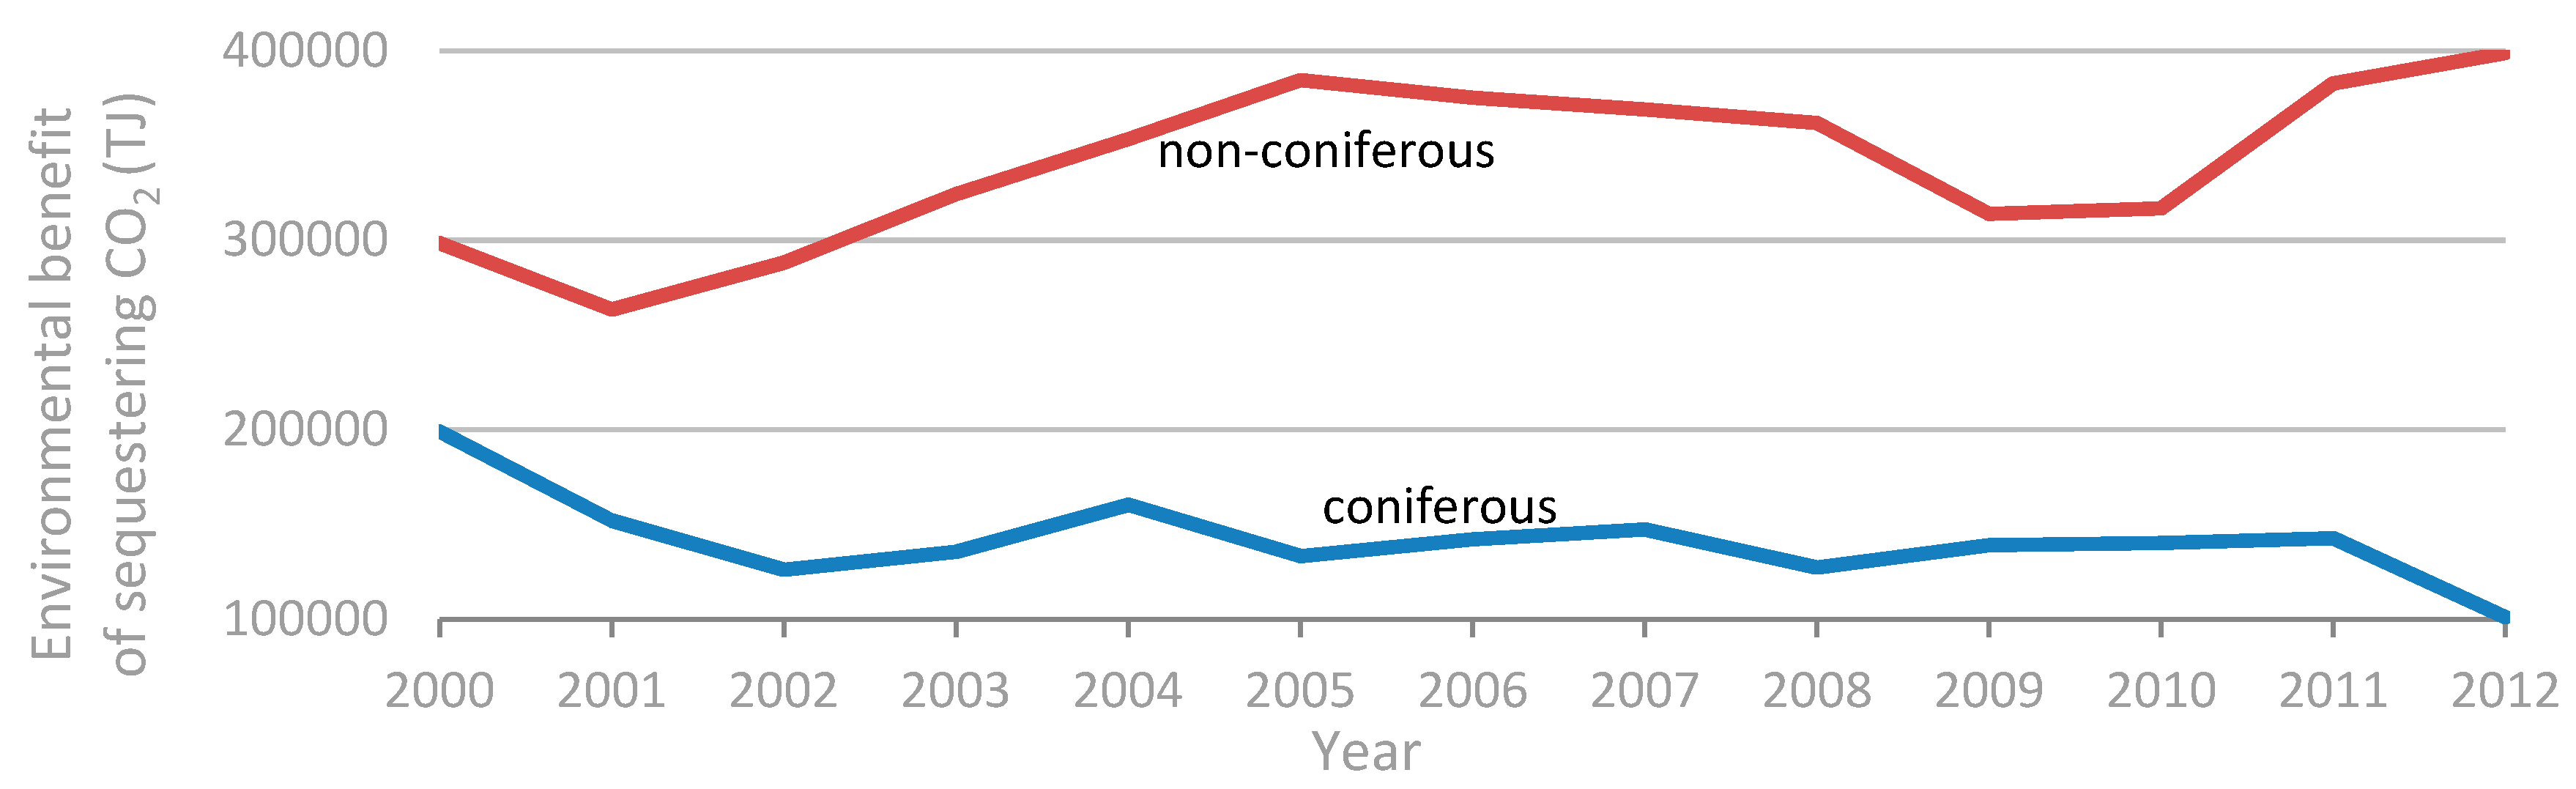
4.3. The Additional Immaterial Flux: The Environmental Benefit (EB)
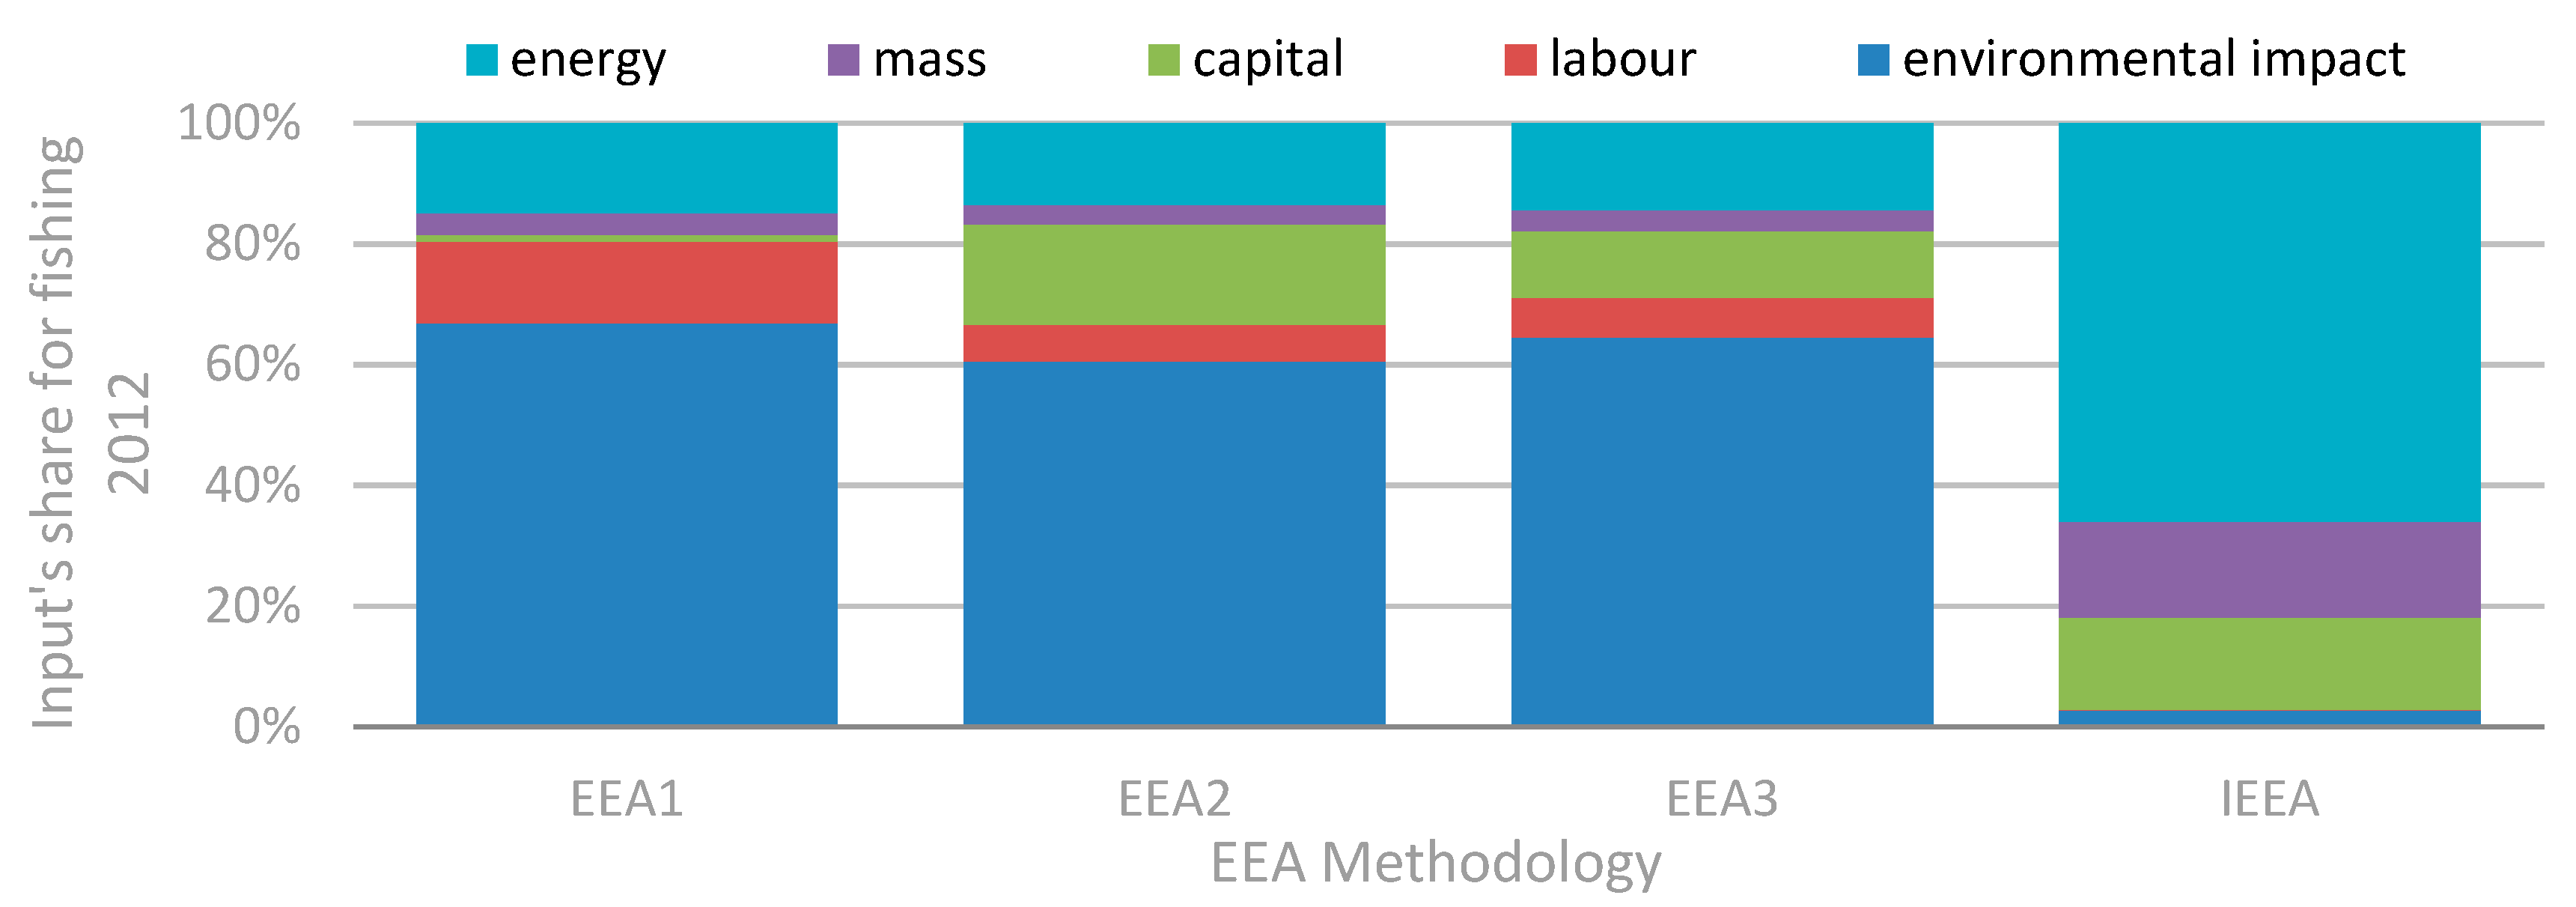
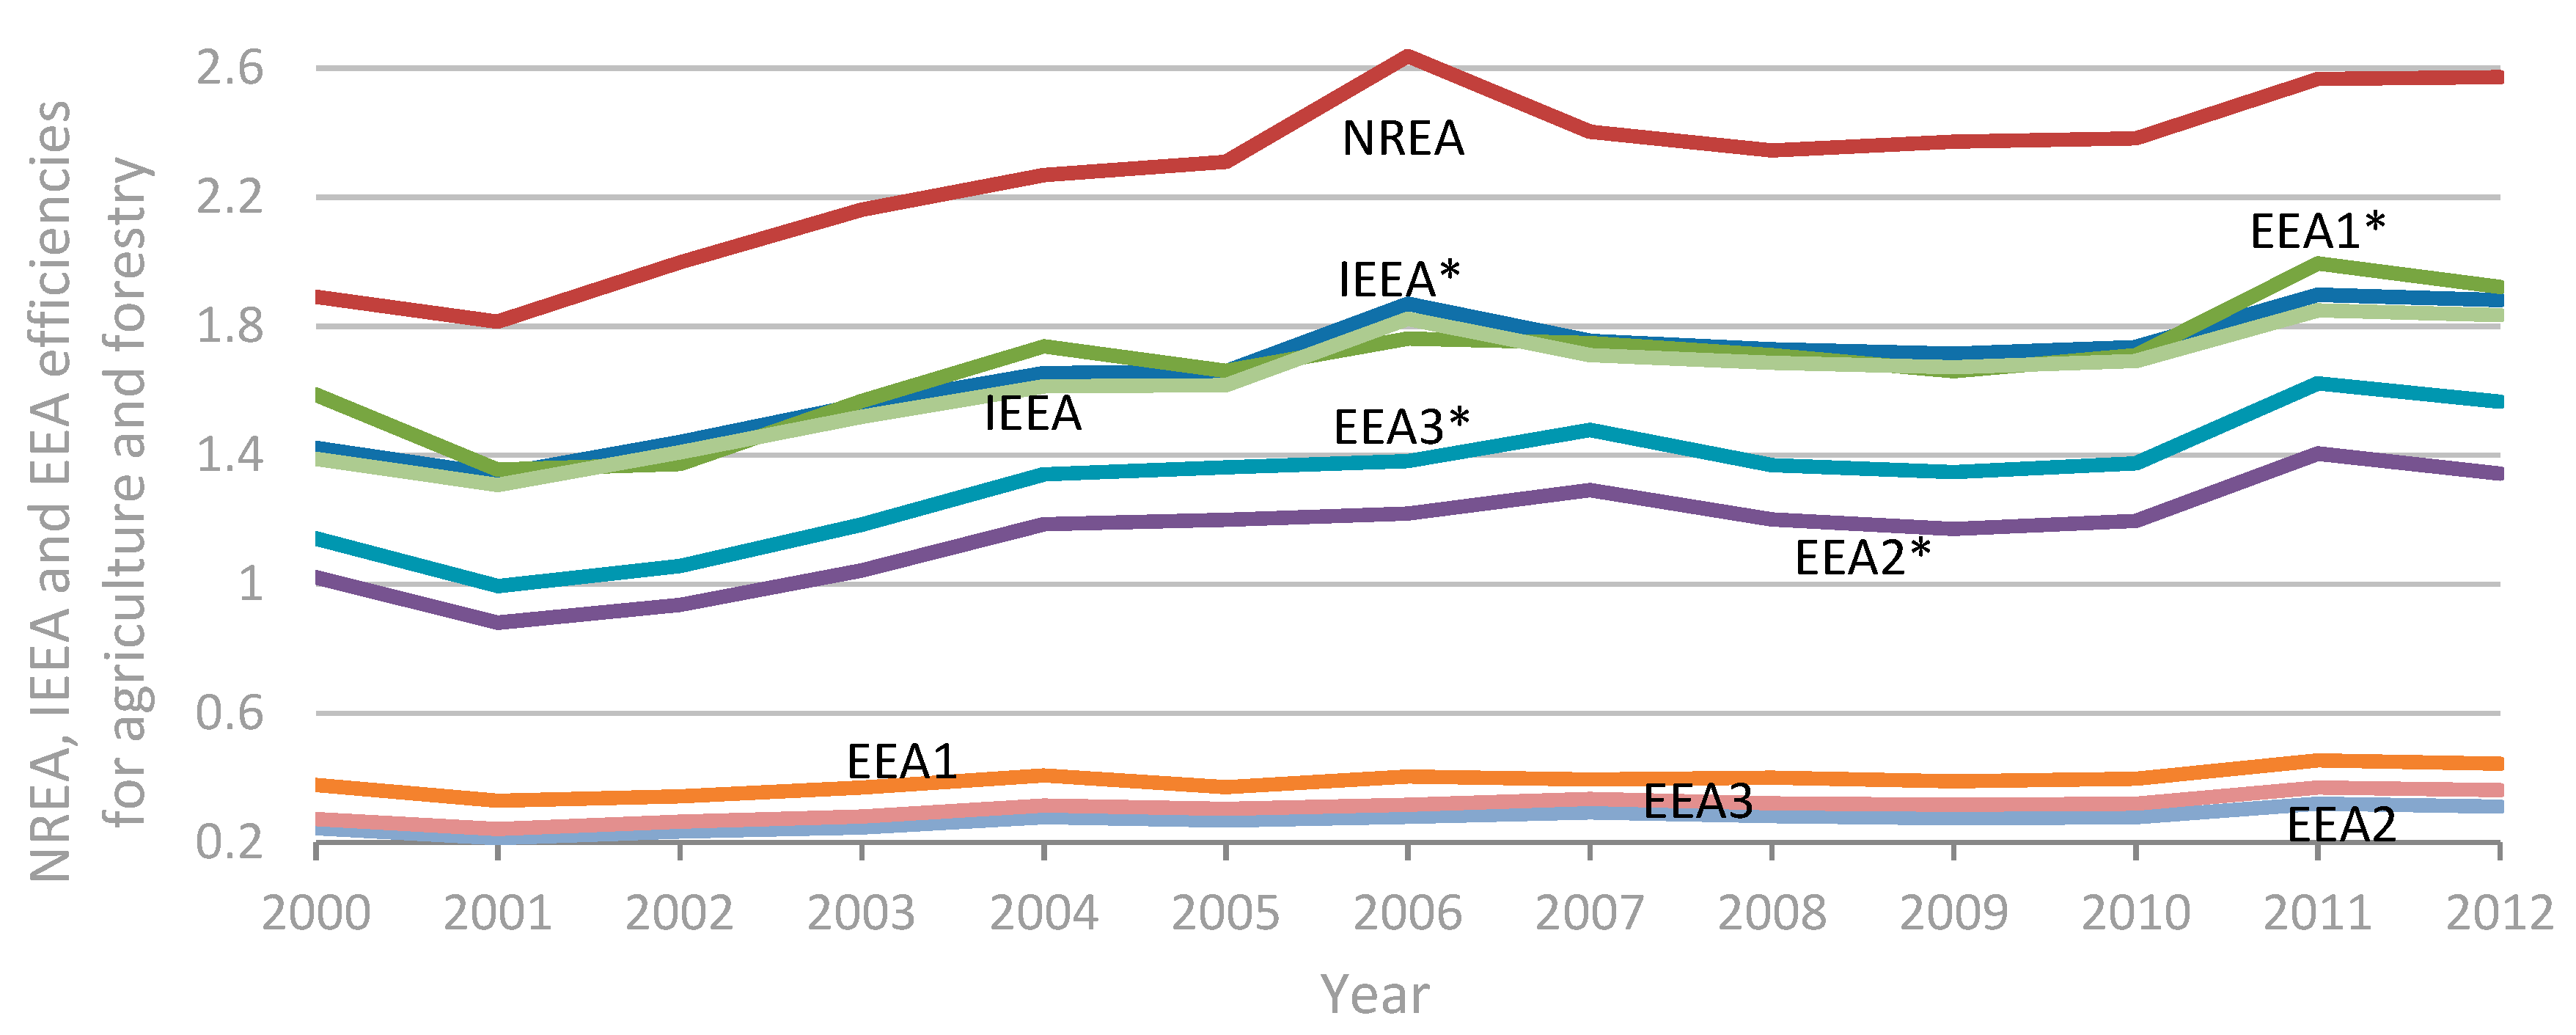
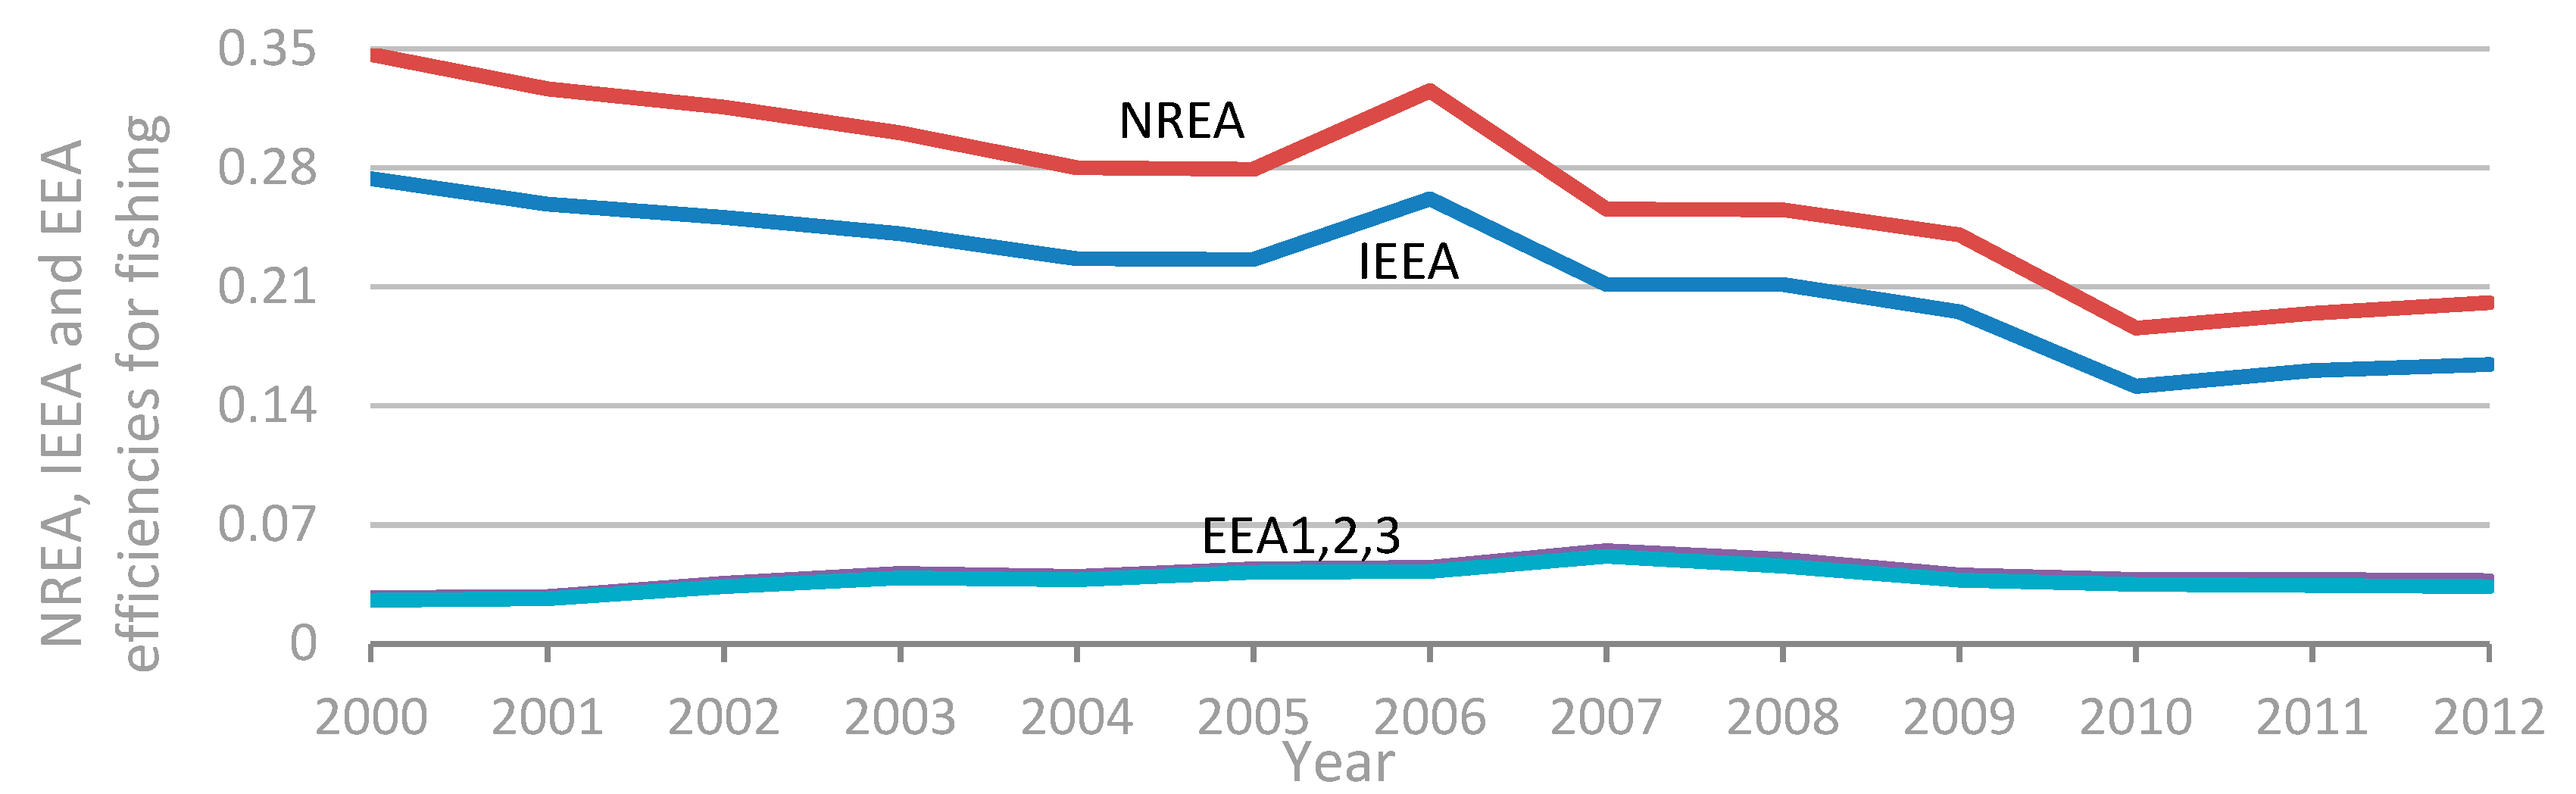
4.4. The Exergy of Immaterial Fluxes—Comparison between IEEA and EEA1, EEA2, and EEA3
5. Conclusions
Author Contributions
Funding
Acknowledgments
Conflicts of Interest
Abbreviations
| AFF | Agriculture, Forestry and Fisheries |
| CEENE | Cumulative Exergy Extraction from the Natural Environment |
| CExC | Cumulative Exergy Consumption |
| CFC | Consumption of Fixed Capital |
| EB | Environmental Benefit |
| EEA | Extended Exergy Accounting |
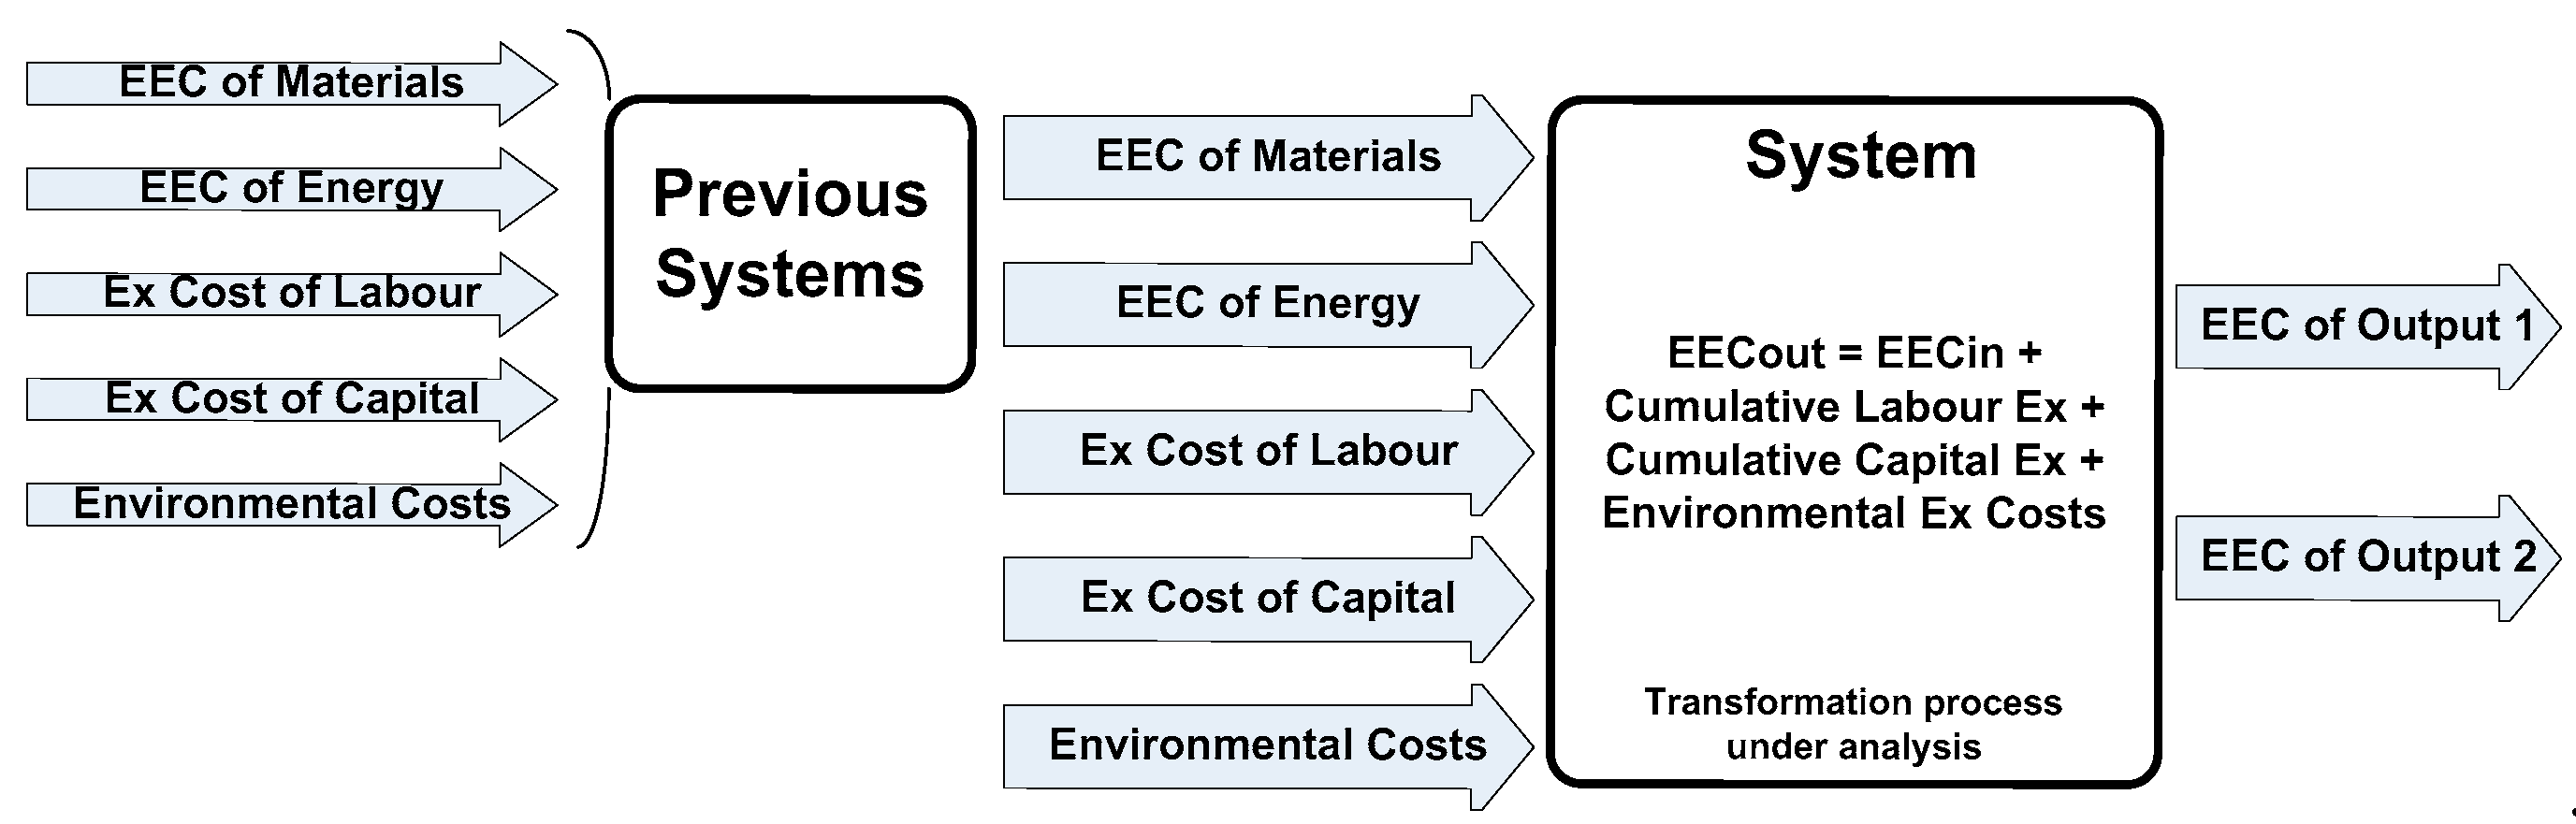
| EEC | Extended Exergy Cost |
| eeK | Specific Exergy of Capital |
| eeL | Specific Exergy of Labour |
| EI | Environmental Impact |
| Ein | Exergy entering the society |
| EK | Equivalent exergy of Capital |
| EL | Equivalent exergy of Labour |
| EREA | Energy Resources Exergy Accounting |
| GVA | Gross Value Added |
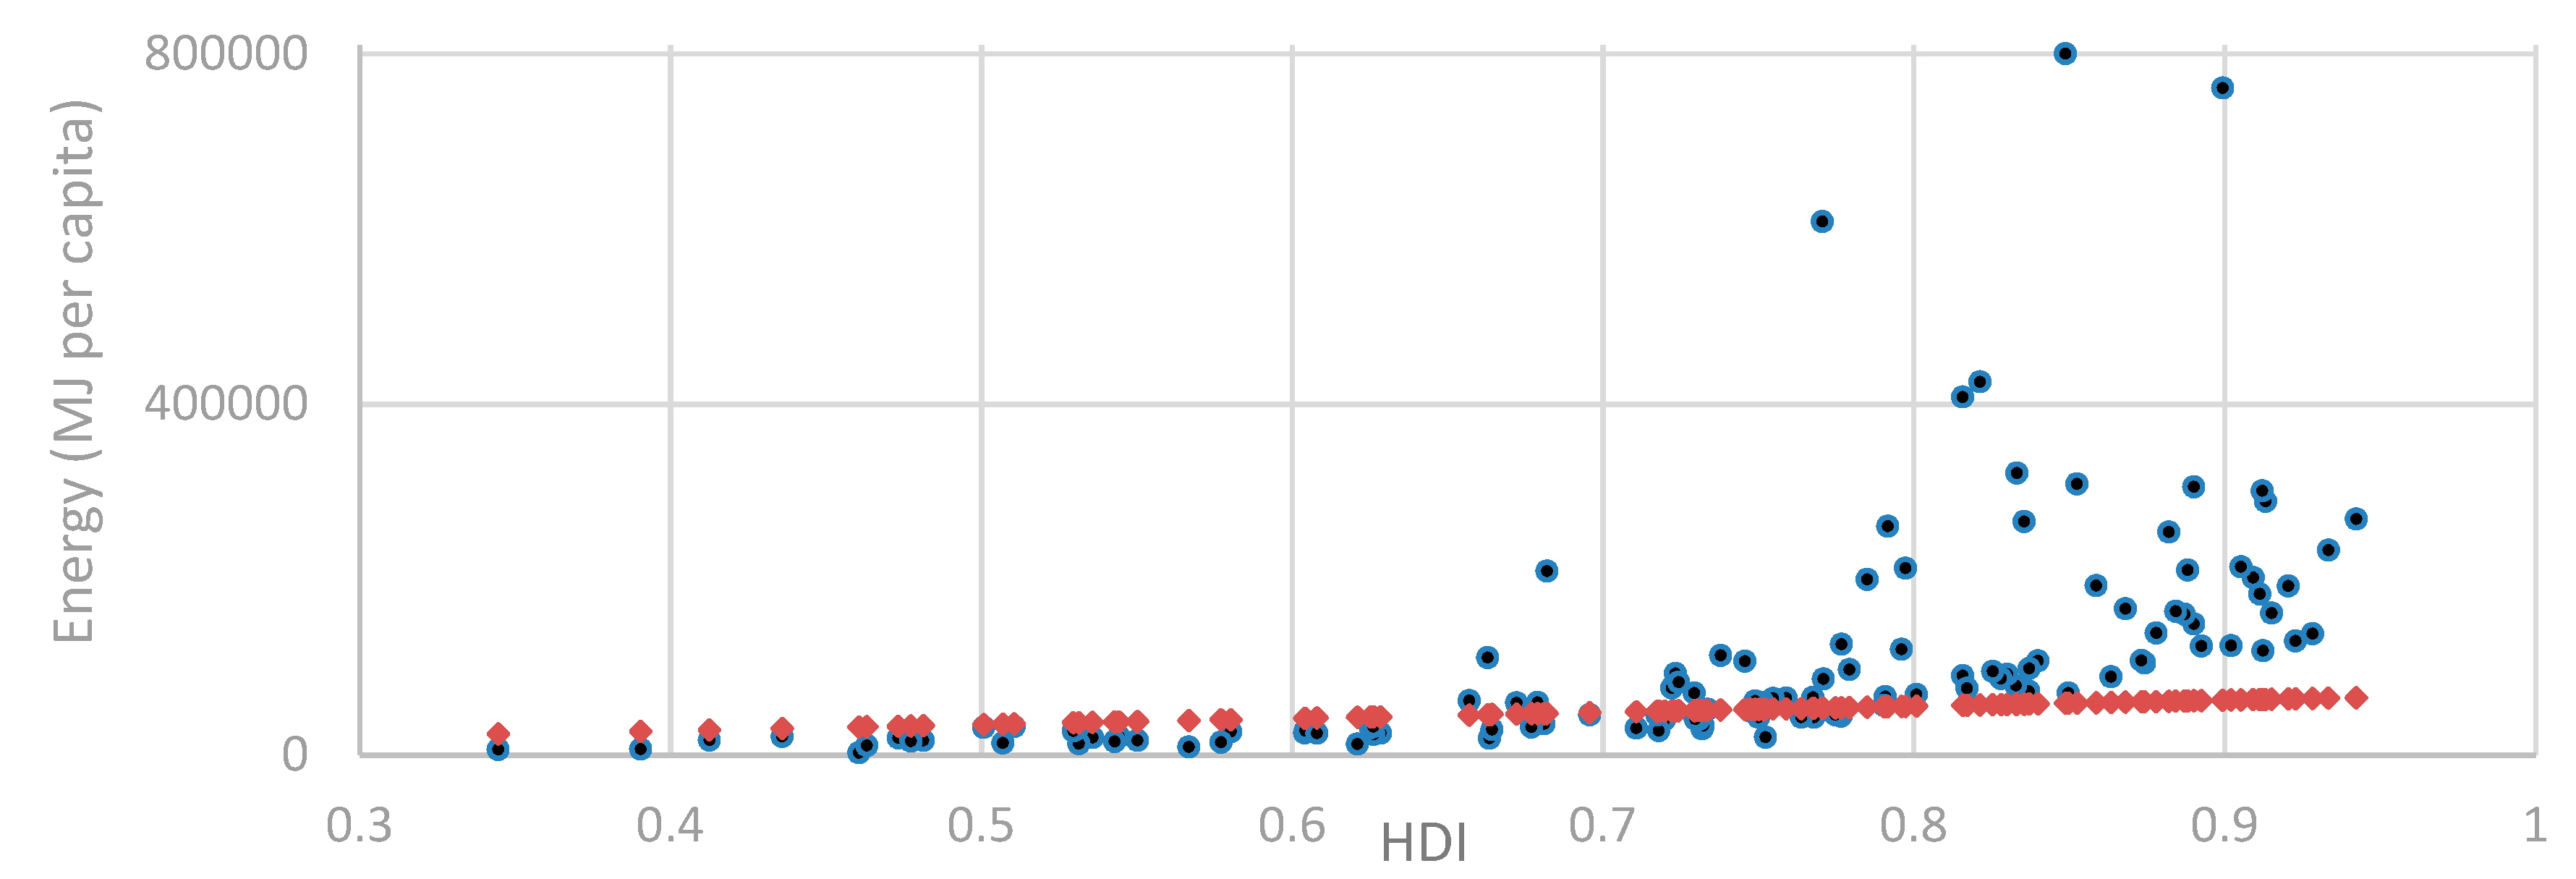
| HDI | Human Development Index |
| IC | Intermediate Consumption |
| IEEA | Intrinsic Extended Exergy Accounting |
| M2 | intermediate monetary aggregate |
| NREA | Natural Resources Exergy Accounting |
| S | Compensation of Employees |
Appendix A. Data Sources and Values for the AFF Sector

| Energy Carrier | Factor | Energy Carrier | Factor | Energy Carrier | Factor |
|---|---|---|---|---|---|
| Biodiesels | 1.11 | Gasoline | 1.07 | Natural gas | 1.04 |
| Derived Heat | 0.6 | Kerosene | 1.07 | Solid biofuels | 1.107 |
| Electrical Energy | 1 | Liquified petroleum gas (LPG) | 1.07 | Total fuel oil | 1.07 |
| Gas/Diesel Oil | 1.07 | - | - | - | - |
| Fertilizer | ChemicalFormula | MolecularMass g/mol | ExergykJ/mol | ExergykJ/kg | Alternatively [55] | Exergy kJ/kg |
| Potassium/Potash | K2O | 94.203 | 413.1 | 4385 | 4400 | |
| Nitrogen | NH4NO3 | 80.04348 | 294.8 | 3682 | 3680 | |
| Phosphorus/Phosphate | P2O5 | 141.9446 | 319.5 | 2251 | 2700 |
| Pesticide Type | Exergy kJ/kg | Reference |
|---|---|---|
| Fungicides and bactericides | 27,900 | [55] |
| Herbicides, haulm destructors and moss killers | 24,100 | [56] |
| Insecticides and acaricides | 19,900 | |
| Molluscicides, total | 19,900 | |
| Other plant protection products | 24,100 | |
| Plant growth regulators, total | 24,100 |
| Seed | SNE | Seed | SNE | Seed | SNE | Seed | SNE |
|---|---|---|---|---|---|---|---|
| Barley | 1473 | Cow peas, dry | 1432 | Oats | 1628 | Sesame seed | 2399 |
| Beans, dry | 1427 | Grain, mixed | 1455 | Oilseeds | 1800 | Sorghum | 1377 |
| Broad and horse beans | 1436 | Groundnuts | 1733 | Peas, dry | 1448 | Soybeans | 614 |
| Buckwheat | 1381 | Hempseed | 1800 | Poppy seed | 2231 | Sunflower seed | 1289 |
| Cabbages and brassicas | 150 | Lentils | 1448 | Potatoes | 321 | Taro (cocoyam) | 360 |
| Canary seed | 1624 | Linseed | 2076 | Pulses | 1423 | Triticale | 1406 |
| Castor oil seed | 1800 | Lupins | 1633 | Rapeseed | 2068 | Vegetables, fresh | 150 |
| Cereals | 1455 | Maize | 1527 | Rice, paddy | 1172 | Vetches | 1360 |
| Chick peas | 1499 | Millet | 1582 | Rye | 1414 | Wheat | 1418 |
| Cottonseed | 1059 | Mustard seed | 1963 | Safflower seed | 1314 | Yams | 422 |
| Feed Product | SNE | Feed Product | SNE | Feed Product | SNE | Feed Product | SNE |
|---|---|---|---|---|---|---|---|
| Apples | 218 | Fats, Animals, Raw | 3257 | Oil crops, Other | 1639 | Rye | 1414 |
| Aquatic Plants | 180 | Fish Body Oil | 3776 | Olive Oil | 3700 | Sesame seed | 2399 |
| Bananas | 371 | Fish, Liver Oil | 3776 | Onions | 166 | Sesame seed Oil | 3700 |
| Barley | 1473 | Freshwater Fish | 400 | Palm kernels | 2152 | Sorghum | 1377 |
| Beans | 368 | Fruits, Other | 203 | Peas | 339 | Soya bean Oil | 3700 |
| Butter, Ghee | 3001 | Groundnuts | 1733 | Pelagic Fish | 400 | Soya beans | 614 |
| Cassava | 667 | Maize | 1527 | Potatoes | 321 | Sugar beet | 293 |
| Cephalopods | 343 | Marine Fish Other | 400 | Poultry Meat | 979 | Sugar cane | 135 |
| Cereals Other | 1488 | Meat, Other | 858 | Pulses | 354 | Sunflower seed | 1289 |
| Coconuts | 770 | Milk | 353 | Rape and Mustard Oil | 3700 | Sweet potatoes | 359 |
| Cottonseed | 1059 | Millet | 1582 | Rape and Mustard seed | 2068 | Tomatoes | 74 |
| Crustaceans | 300 | Oats | 1628 | Rice | 1548 | Vegetables Other | 226 |
| Demersal Fish | 400 | Offal, Edible | 486 | Roots Other | 449 | Wheat | 1418 |
| Eggs | 682 | Oil crops, Oil, Other | 3700 | - | - | - | - |
| Eggs | SNE | Mass (g) | Eggs | SNE | Mass (g) | Eggs | SNE | Mass (g) |
|---|---|---|---|---|---|---|---|---|
| Duck Eggs | 776 | 70 | Guinea fowl eggs | 663 | 9 | Turkey eggs | 716 | 79 |
| Geese Eggs | 775 | 144 | Hen eggs | 599 | 53 |
| Crop | SNE | Crop | SNE | Crop | SNE | Crop | SNE |
|---|---|---|---|---|---|---|---|
| Almonds | 2423 | Mushrooms | 130 | Oranges | 197 | Radishes | 66 |
| Apples | 218 | Eggplants | 104 | Other berries | 225 | Raspberries | 220 |
| Apricots | 201 | Eggplants | 104 | Other brassicas | 150 | Red pepper | 166 |
| Bananas | 371 | Endives | 71 | Other citrus fruits | 180 | Rice | 1548 |
| Barley | 1473 | Figs | 310 | Other fresh vegetables | 100 | Rye and maslin | 1414 |
| Beans | 368 | Garlic | 623 | Other fruits | 369 | Sour cherries | 209 |
| Black currants | 264 | Grain maize | 1527 | Other leafy or stalked vegetables | 117 | Spinach | 97 |
| Broad and field beans | 1377 | Hazelnuts | 2629 | Other nuts | 2170 | Strawberries | 136 |
| Cabbage (white) | 103 | Kiwis | 255 | Other pulses | 354 | Sugar beet | 293 |
| Carrots | 173 | Leeks | 255 | Peaches | 165 | Sunflower seed | 1289 |
| Cauliflower and broccoli | 140 | Lemons and acid limes | 126 | Pears | 239 | Tomatoes | 74 |
| Celeriac | 176 | Lettuces | 65 | Peas | 339 | Triticale | 1406 |
| Cherries | 263 | Melons | 141 | Plums | 192 | Vineyards | 288 |
| Chestnuts | 891 | Oats and mixed grain | 1628 | Pomelos and grapefruit | 134 | Walnuts | 2738 |
| Chicory | 96 | Olive trees | 481 | Potatoes | 321 | Watermelons | 127 |
| Courgettes | 80 | Onions | 166 | Quinces | 238 | Wheat | 1418 |
| Cucumbers | 65 | - | - | - | - | - | - |
| Meat | SNE | Meat | SNE | Meat | SNE |
|---|---|---|---|---|---|
| Meat of Bovine Animals | 979 | Meat of rabbits | 569 | Pig meat | 995 |
| Meat of Horses, Asses, Mules, or Hinnies | 556 | Meat of sheep and goats | 1067 | Poultry meat | 979 |
| Fish | SNE | Fish | SNE | Fish | SNE |
|---|---|---|---|---|---|
| Abalones, winkles, conchs | 439 | Lobsters, spiny-rock lobsters | 469 | Mussels | 360 |
| Aquatic mammals | 462 | Marine fishes not identified | 500 | Oysters | 213 |
| Carps, barbels, and cyprinids | 531 | Miscellaneous aquatic animals | 500 | River eels | 770 |
| Clams, cockles, arkshells | 360 | Miscellaneous coastal fishes | 500 | Salmon, trout, smelt | 594 |
| Cods, hakes, haddocks | 343 | Miscellaneous demersal fishes | 500 | Scallops, pectens | 289 |
| Crabs, sea-spiders | 364 | Miscellaneous diadromous fishes | 650 | Shads | 824 |
| Flounders, halibuts, soles | 294 | Miscellaneous freshwater fishes | 465 | Sharks, rays, chimaeras | 544 |
| Freshwater crustaceans | 300 | Miscellaneous marine crustaceans | 300 | Shrimps, prawns | 297 |
| Herrings, sardines, anchovies | 661 | Miscellaneous marine molluscs | 330 | Squids, cuttlefishes, octopuses | 343 |
| King crabs, squat-lobsters | 377 | Miscellaneous pelagic fishes | 500 | Tunas, bonitos, billfishes | 602 |
| Milk | SNE | Milk | SNE | Milk | SNE |
|---|---|---|---|---|---|
| Cows’ milk | 268 | Ewes’ milk | 451 | Goats’ milk | 288 |
| Eggs | SNE | Eggs | SNE |
|---|---|---|---|
| Hen eggs | 599 | Other bird’s eggs | 776 |
| Wood | Exergy (MJ/kg) | Exergy (GJ/m3) | Wood | Exergy (MJ/kg) | Exergy (GJ/m3) |
|---|---|---|---|---|---|
| Coniferous | 17.688 | 7.9596 | Non-coniferous | 17.608 | 11.4452 |
| Pollutant | SEEC | Ex,ch | Pollutant | SEEC | Ex,ch | Pollutant | SEEC | Ex,ch |
|---|---|---|---|---|---|---|---|---|
| Ammonia | 19,841 | 19,841 | methane | 322,400 | 51,810.7 | nitrous oxide | 10,600 | 2430 |
| Carbon dioxide | 57,600 | 442.6 | nitrogen oxides | 3610 | 2963 | sulphur oxides | 5890 | 4892 |
| Carbon monoxide | 11,800 | 9825 | - | - | - | - | - | - |
| 2012 | 2011 | 2010 | 2009 | 2008 | 2007 | 2006 | 2005 | 2004 | 2003 | 2002 | 2001 | 2000 | |
|---|---|---|---|---|---|---|---|---|---|---|---|---|---|
| Population | 10,514 | 10,557 | 10,573 | 10,568 | 10,558 | 10,542 | 10,522 | 10,503 | 10,483 | 10,458 | 10,419 | 10,362 | 10,289 |
| Agriculture | 497.2 | 489.8 | 508.8 | 534.3 | 542.2 | 546.2 | 556.9 | 557.3 | 566.7 | 591 | 585.9 | 604.3 | 584.6 |
| Forestry | 10.9 | 10.9 | 10.6 | 10.7 | 12.0 | 11.8 | 11.8 | 11.7 | 11.7 | 11.8 | 11.7 | 11.9 | 11.6 |
| Fishery | 14.0 | 14.3 | 14.0 | 13.9 | 14.4 | 14.3 | 15.0 | 14.9 | 15.0 | 15.0 | 14.8 | 15.0 | 14.8 |
| 2012 | 2011 | 2010 | 2009 | 2008 | 2007 | 2006 | 2005 | 2004 | 2003 | 2002 | 2001 | 2000 | |
|---|---|---|---|---|---|---|---|---|---|---|---|---|---|
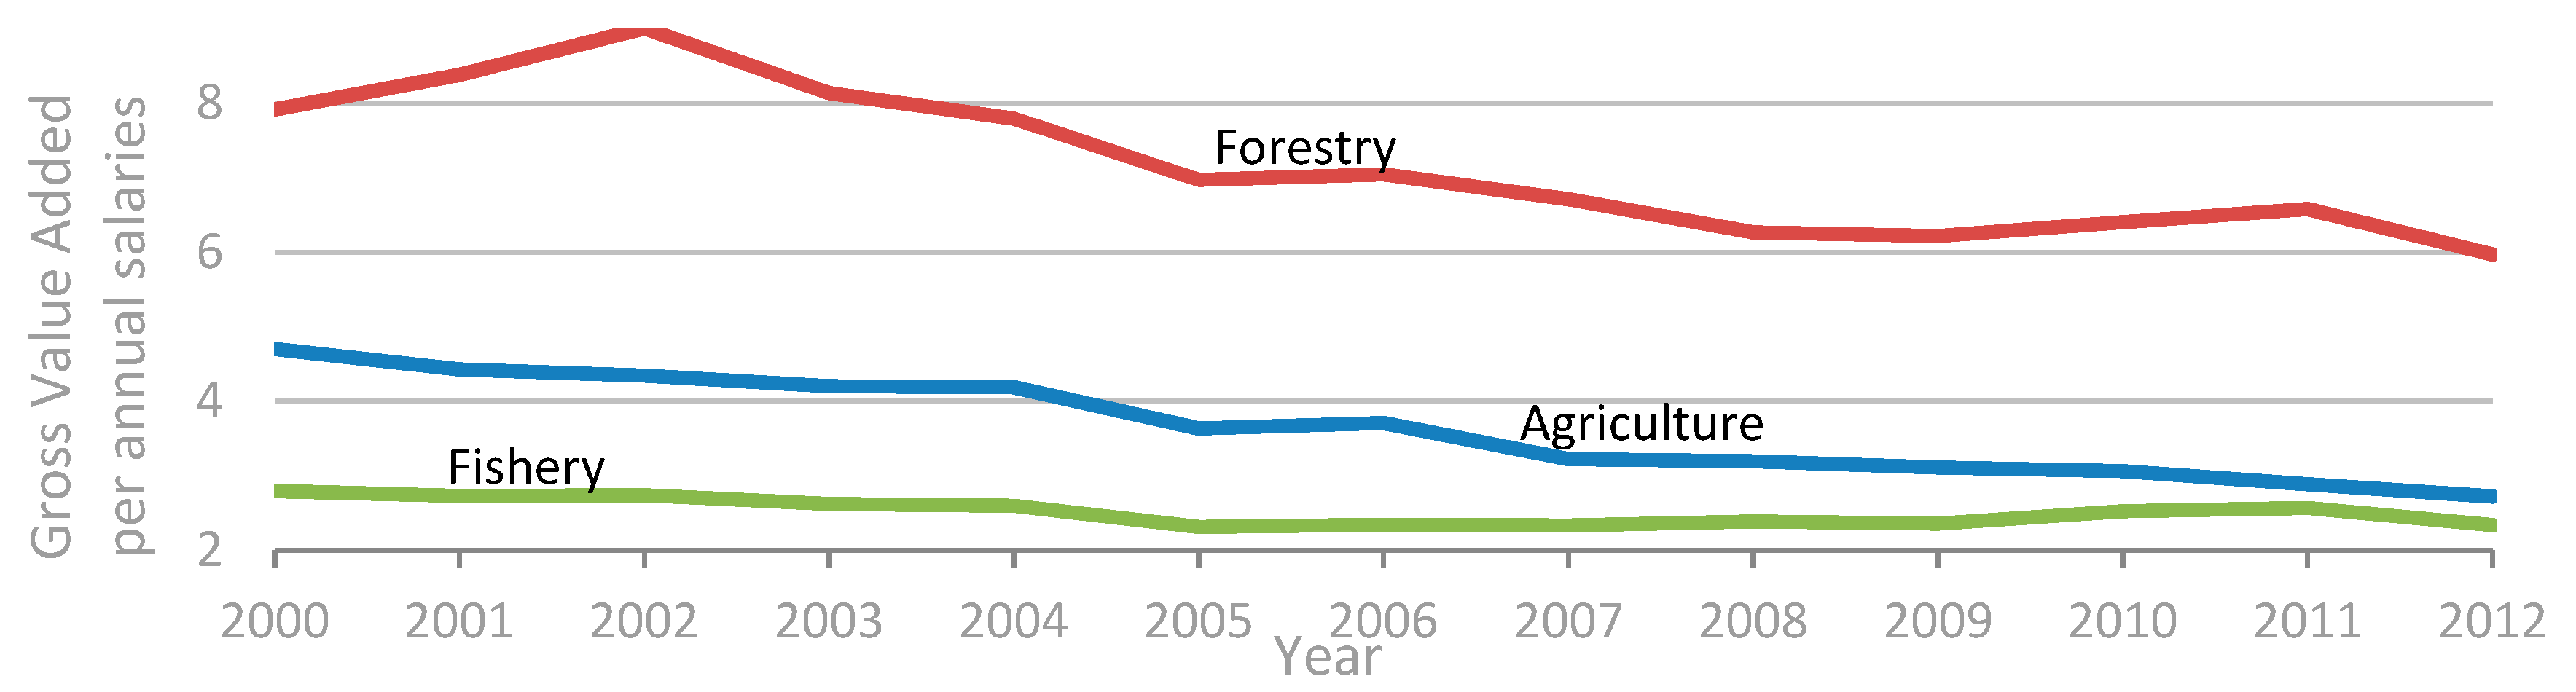
| Total GVA | 141 | 149 | 151 | 149 | 151 | 151 | 147 | 146 | 148 | 145 | 147 | 147 | 145 |
| Total M2 | 163 | 174 | 173 | 170 | 179 | 163 | 159 | 157 | 150 | 147 | 147 | 153 | 151 |
| Agriculture GVA | 2224 | 2184 | 2413 | 2440 | 2497 | 2538 | 2887 | 2891 | 3272 | 3260 | 3337 | 3655 | 3869 |
| Agriculture M2 | 2585 | 2537 | 2765 | 2776 | 2946 | 2735 | 3113 | 3097 | 3312 | 3294 | 3327 | 3784 | 4019 |
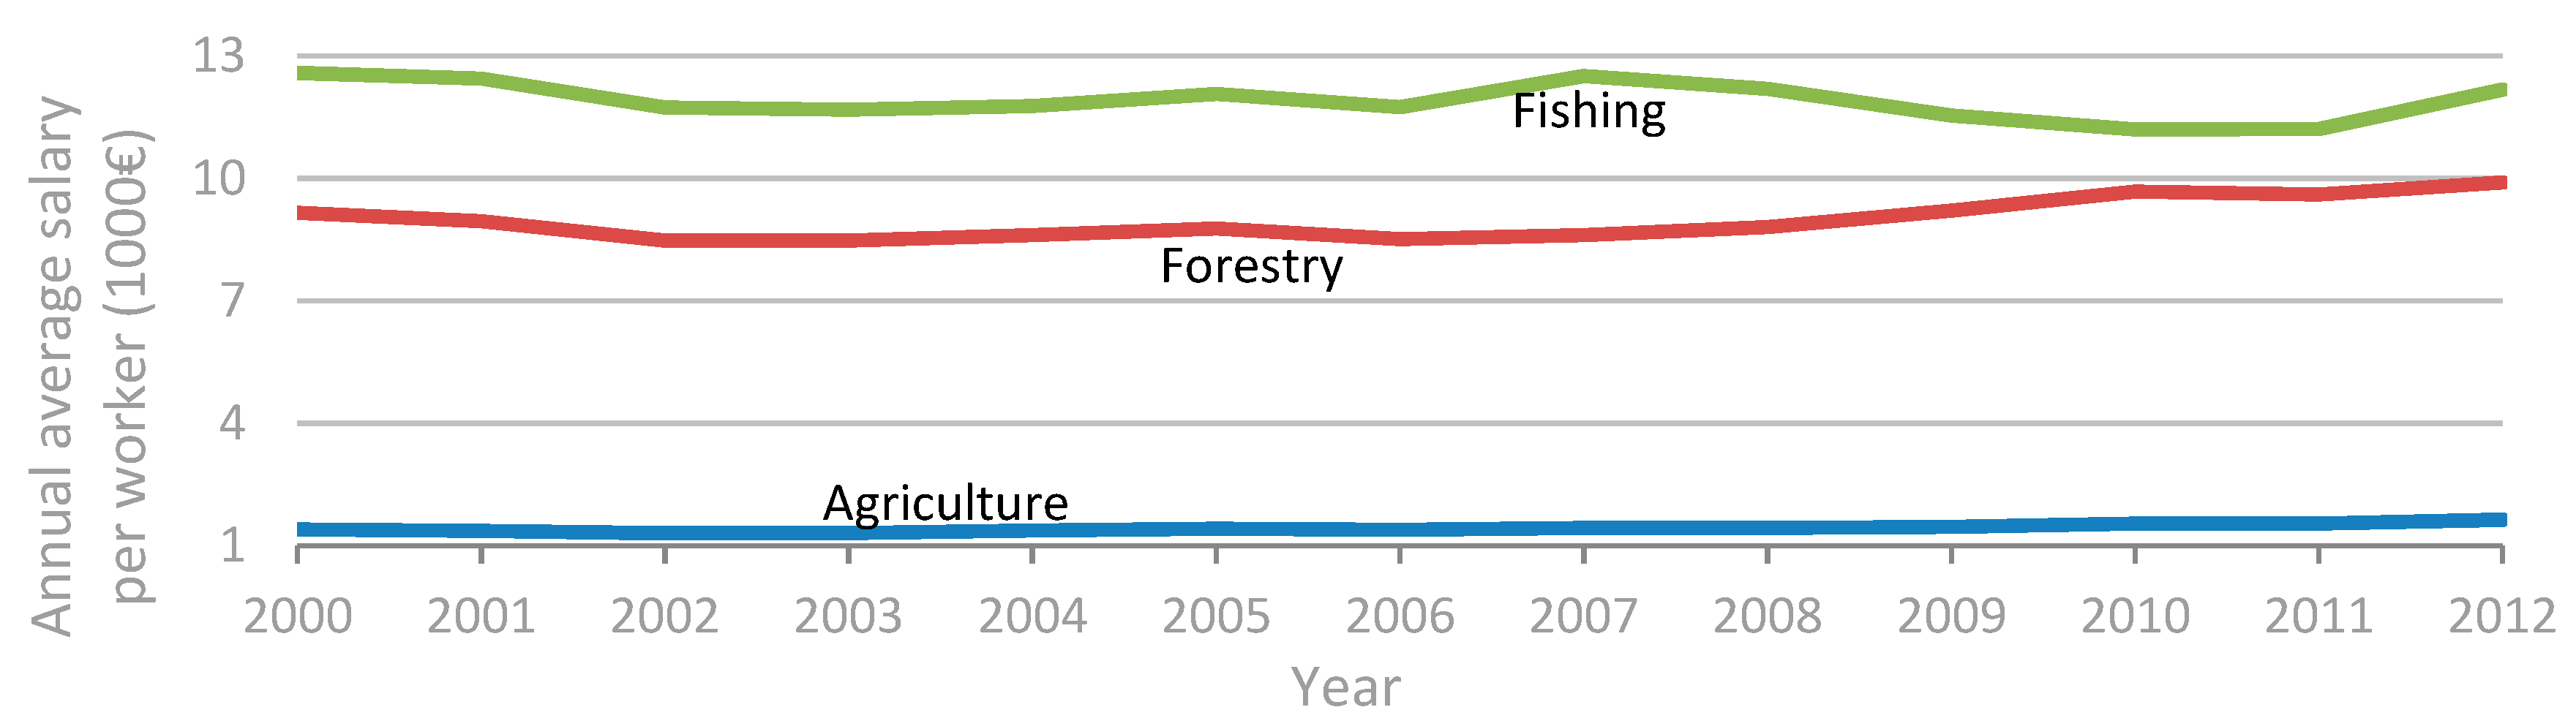
| Agriculture Wages | 817 | 756 | 787 | 784 | 782 | 787 | 778 | 795 | 780 | 775 | 768 | 825 | 823 |
| Forestry GVA | 647 | 689 | 657 | 613 | 662 | 682 | 708 | 716 | 785 | 814 | 893 | 893 | 841 |
| Forestry M2 | 752 | 800 | 753 | 697 | 782 | 735 | 763 | 767 | 795 | 822 | 890 | 924 | 874 |
| Forestry Wages | 108 | 104 | 102 | 98 | 105 | 101 | 100 | 102 | 100 | 100 | 99 | 106 | 106 |
| Fishery GVA | 399 | 412 | 396 | 378 | 419 | 418 | 413 | 416 | 459 | 459 | 476 | 509 | 521 |
| Fishery M2 | 464 | 478 | 454 | 430 | 494 | 450 | 445 | 446 | 464 | 464 | 474 | 527 | 541 |
| Fishery Wages | 170 | 160 | 156 | 160 | 175 | 178 | 176 | 179 | 176 | 175 | 173 | 186 | 186 |
| 2012 | 2011 | 2010 | 2009 | 2008 | 2007 | 2006 | 2005 | 2004 | 2003 | 2002 | 2001 | 2000 |
|---|---|---|---|---|---|---|---|---|---|---|---|---|
| 99.333 | 99.730 | 100 | 99.360 | 98.283 | 96.604 | 93.809 | 90.913 | 87.984 | 85.925 | 83.068 | 79.714 | 76.859 |
| 2012 | 2011 | 2010 | 2009 | 2008 | 2007 | 2006 | 2005 | 2004 | 2003 | 2002 | 2001 | 2000 |
|---|---|---|---|---|---|---|---|---|---|---|---|---|
| 0.827 | 0.824 | 0.818 | 0.812 | 0.809 | 0.804 | 0.797 | 0.793 | 0.79 | 0.792 | 0.789 | 0.788 | 0.782 |
Appendix B. Exergy Input to Society
| Mineral | Exergy kJ/kg | Metal Ore | Exergy kJ/kg |
|---|---|---|---|
| Marble, granite, sandstone | 820.96 | Iron | 79.77 |
| Chalk and dolomite | 81.88 | Copper | 523.09 |
| Slate | 131.49 | Zinc | 1237.83 |
| Salt | 244.7 | Bauxite and other aluminium | 1114.16 |
| Limestone and gypsum | 49.95 | - | - |
| Clays and kaolin | 697.99 | - | - |
| Sand and gravel | 131.49 | - | - |
| Energy Carrier | Factor | Energy Carrier | Factor | Energy Carrier | Factor |
|---|---|---|---|---|---|
| Biodiesels | 1.11 | Electrical energy | 1 | Natural gas | 1.04 |
| Biogas | 1.04 | Gas works gas | 1 | Petroleum products | 1.07 |
| Biogasoline | 1.11 | Geothermal energy | 0.6 | Solar photovoltaic | 1 |
| Bituminous coal | 1.06 | Hydro power | 1 | Solar thermal | 0.25 |
| Charcoal | 1.11 | Industrial wastes | 1.1 | Solid biofuels | 1.107 |
| Coke oven coke | 1.05 | Liquid biofuels | 1.11 | Waste (non-renewable) | 1.1 |
| Coking coal | 1.06 | Municipal waste | 1.1 | Wind power | 1 |
Appendix C. NREA and EEA Efficiencies of Previous Studies
| Study | Agriculture | Extraction | Conversion | Industry | Transport | Tertiary | Domestic |
|---|---|---|---|---|---|---|---|
| [10] | > ԐNREA < ԐEEA | > ԐNREA > ԐEEA | > ԐNREA < ԐEEA | > ԐNREA < ԐEEA | > ԐNREA < ԐEEA | > ԐNREA < ԐEEA | > ԐNREA < 1 < ԐEEA |
| [22] | < ԐNREA > ԐEEA | > ԐNREA = ԐEEA | > ԐNREA > ԐEEA | < ԐNREA < ԐEEA | > ԐNREA < ԐEEA | < ԐNREA > ԐEEA | = = 0 0 = ԐNREA << ԐEEA |
| [23] | > ԐNREA > ԐEEA | > ԐNREA > ԐEEA | > ԐNREA > ԐEEA | < ԐNREA < ԐEEA | < ԐNREA < ԐEEA | > ԐNREA < ԐEEA | > 0 = ԐNREA << ԐEEA |
| [11] | > ԐNREA > ԐEEA | > ԐNREA > ԐEEA | < ԐNREA < ԐEEA | < ԐNREA < ԐEEA | < ԐNREA < ԐEEA | < ԐNREA < ԐEEA | - - |
| [24] | > ԐNREA < ԐEEA | > ԐNREA > ԐEEA | > ԐNREA < ԐEEA | > ԐNREA < ԐEEA | > ԐNREA < ԐEEA | > ԐNREA < ԐEEA | > = 0 ԐNREA << ԐEEA |
| [25] | < ԐNREA < ԐEEA | < ԐNREA < ԐEEA ≈1 | = ԐNREA < ԐEEA | < ԐNREA < ԐEEA | < ԐNREA < ԐEEA | > = 0 ԐNREA < 1 < ԐEEA |
References
- Sciubba, E.; Wall, G. A brief commented history of exergy from the beginnings to 2004. Int. J. Thermodyn. 2007, 10, 1–26. [Google Scholar]
- Reistad, G. Available Energy Conversion and Utilization in the United States. ASME Trans. Ser. J. Eng. Power 1975, 97, 429–434. [Google Scholar] [CrossRef]
- Wall, G. Exergy conversion in the Swedish society. Resour. Energy 1987, 9, 55–73. [Google Scholar] [CrossRef] [Green Version]
- Szargut, J. Analysis of cumulative exergy consumption. Int. J. Energy Res. 1987, 11, 541–547. [Google Scholar] [CrossRef]
- Sciubba, E. Extended exergy accounting: Towards an exergetic theory of value. In Proceedings of the International Symposium on Eco Design (ECOS ’99), Tokyo, Japan, 30 June 1999; pp. 85–94. [Google Scholar]
- Sciubba, E. Beyond thermoeconomics? The concept of Extended Exergy Accounting and its application to the analysis and design of thermal systems. Exergy Int. J. 2001, 1, 68–84. [Google Scholar] [CrossRef]
- Sciubba, E. From Engineering Economics to Extended Exergy Accounting: A Possible Path from Monetary to Resource-Based Costing. J. Ind. Ecol. 2004, 8, 19–40. [Google Scholar] [CrossRef]
- Seckin, C.; Bayulken, A.R. Extended Exergy Accounting (EEA) analysis of municipal wastewater treatment—Determination of environmental remediation cost for municipal wastewater. Appl. Energy 2013, 110, 55–64. [Google Scholar] [CrossRef]
- Ertesvåg, I.S. Energy, exergy, and extended-exergy analysis of the Norwegian society 2000. Energy 2005, 30, 649–675. [Google Scholar] [CrossRef]
- Gasparatos, M.E.; Horner, M. Assessing the sustainability of the UK society using thermodynamic concepts: Part 2. Renew. Sustain. Energy Rev. 2009, 13, 956–970. [Google Scholar] [CrossRef]
- Seckin, E.S.; Bayulken, A.R. An application of the extended exergy accounting method to the Turkish society, year 2006. Energy 2012, 40, 151–163. [Google Scholar] [CrossRef]
- Guevara, Z.; Domingos, T. The multi-factor energy input–output model. Energy Econ. 2017, 61, 261–269. [Google Scholar] [CrossRef]
- Manso, R.; Sousa, T.; Domingos, T. Do the Different Exergy Accounting Methodologies Provide Consistent or Contradictory Results? A Case Study with the Portuguese Agricultural, Forestry and Fisheries Sector. Energies 2017, 10, 1219. [Google Scholar] [CrossRef]
- Szargut, J.; Ziębik, A.; Stanek, W. Depletion of the non-renewable natural exergy resources as a measure of the ecological cost. Energy Convers. Manag. 2002, 43, 1149–1163. [Google Scholar] [CrossRef]
- Utlu, Z.; Hepbasli, A. A review on analyzing and evaluating the energy utilization efficiency of countries. Renew. Sustain. Energy Rev. 2007, 11, 1–29. [Google Scholar] [CrossRef]
- Sousa, T.; Brockway, P.E.; Cullen, J.M.; Henriques, S.T.; Miller, J.; Serrenho, A.C.; Domingos, T. The need for robust, consistent methods in societal exergy accounting. Ecol. Econ. 2017, 141, 11–21. [Google Scholar] [CrossRef]
- Ptasinski, K.J.; Koymans, M.N.; Verspagen, H.H.G. Performance of the Dutch Energy Sector based on energy, exergy and Extended Exergy Accounting. Energy 2006, 31, 3135–3144. [Google Scholar] [CrossRef]
- Rocco, M.V.; Colombo, E.; Sciubba, E. Advances in exergy analysis: A novel assessment of the Extended Exergy Accounting method. Appl. Energy 2014, 113, 1405–1420. [Google Scholar] [CrossRef]
- Ecoinvent Version 3. Available online: https://www.ecoinvent.org/database/database.html (accessed on 20 February 2015).
- Dai, J.; Chen, B.; Sciubba, E. Extended exergy based ecological accounting for the transportation sector in China. Renew. Sustain. Energy Rev. 2014, 32, 229–237. [Google Scholar] [CrossRef]
- Seckin, C.; Sciubba, E.; Bayulken, A.R. Extended exergy analysis of Turkish transportation sector. J. Clean. Prod. 2013, 47, 422–436. [Google Scholar] [CrossRef]
- Milia, D.; Sciubba, E. Exergy-based lumped simulation of complex systems: An interactive analysis tool. Energy 2006, 31, 100–111. [Google Scholar] [CrossRef]
- Sciubba, E.; Bastianoni, S.; Tiezzi, E. Exergy and extended exergy accounting of very large complex systems with an application to the province of Siena, Italy. J. Environ. Manag. 2008, 86, 372–382. [Google Scholar] [CrossRef] [PubMed]
- Chen, G.Q.; Chen, B. Extended-exergy analysis of the Chinese society. Energy 2009, 34, 1127–1144. [Google Scholar] [CrossRef]
- Bligh, D.C.; Ugursal, V.I. Extended exergy analysis of the economy of Nova Scotia, Canada. Energy 2012, 44, 878–890. [Google Scholar] [CrossRef]
- Kamp, F.M.; Ostergard, H. Development of concepts for human labour accounting in Emergy Assessment and other Environmental Sustainability Assessment methods. Ecol. Indic. 2016, 60, 884–892. [Google Scholar] [CrossRef]
- Wall, G. Exergy: A Useful Concept; Chalmers University of Technology: Göteborg, Sweden, 1986. [Google Scholar]
- Hoang, V.-N.; Alauddin, M. Analysis of agricultural sustainability: A review of exergy methodologies and their application in OECD countries. Int. J. Energy Res. 2011, 35, 459–476. [Google Scholar] [CrossRef]
- Dewulf, J.; Bösch, M.E.; Meester, B.D.; Vorst, G.V.; Langenhove, H.V.; Hellweg, S.; Huijbregts, M.A. Cumulative Exergy Extraction from the Natural Environment (CEENE): A comprehensive Life Cycle Impact Assessment method for resource accounting. Environ. Sci. Technol. 2007, 41, 8477–8483. [Google Scholar] [CrossRef] [PubMed]
- Sciubba, E. A revised calculation of the econometric factors α- and β for the Extended Exergy Accounting method. Ecol. Model. 2011, 222, 1060–1066. [Google Scholar] [CrossRef]
- Human Development Index (HDI)|Human Development Reports. Available online: http://hdr.undp.org/en/content/human-development-index-hdi (accessed on 18 September 2014).
- Sciubba, E. Cost analysis of energy conversion systems via a novel resource-based quantifier. Energy 2003, 28, 457–477. [Google Scholar] [CrossRef]
- Sciubba, E. Extended exergy accounting applied to energy recovery from waste: The concept of total recycling. Energy 2003, 28, 1315–1334. [Google Scholar] [CrossRef]
- Dai, J.; Chen, B. Extended exergy-based ecological accounting of China during 2000–2007. Proc. Environ. Sci. 2011, 5, 87–95. [Google Scholar] [CrossRef]
- Sciubba, E. A Thermodynamically Correct Treatment of Externalities with an Exergy-Based Numeraire. Sustainability 2012, 4, 933–957. [Google Scholar] [CrossRef] [Green Version]
- Dai, J.; Fath, B.; Chen, B. Constructing a network of the social-economic consumption system of China using extended exergy analysis. Renew. Sustain. Energy Rev. 2012, 16, 4796–4808. [Google Scholar] [CrossRef]
- Sciubba, E. Can an Environmental Indicator valid both at the local and global scales be derived on a thermodynamic basis? Ecol. Indic. 2013, 29, 125–137. [Google Scholar] [CrossRef]
- Chen, B.; Dai, J.; Sciubba, E. Ecological accounting for China based on extended exergy. Renew. Sustain. Energy Rev. 2014, 37, 334–347. [Google Scholar] [CrossRef]
- Jawad, H.; Jaber, M.Y.; Bonney, M. The Economic Order Quantity model revisited: An Extended Exergy Accounting approach. J. Clean. Prod. 2015, 105, 64–73. [Google Scholar] [CrossRef]
- International Energy Agency. Available online: https://www.iea.org/ (accessed on 20 April 2014).
- Stanhill, G. Agricultural Labour: From Energy Source to Sink. In Energy and Agriculture; Stanhill, G., Ed.; Springer: Berlin/Heidelberg, Germany, 1984; Volume 14, pp. 113–130. [Google Scholar]
- Food and Agriculture Organization of the United Nations; United Nations University; World Health Organization (Eds.) Human Energy Requirements: Report of a Joint FAO/WHO/UNU Expert Consultation: Rome, 17–24 October 2001; Food and Agricultural Organization of the United Nations: Rome, Italy, 2004. [Google Scholar]
- Rocco, M.V.; Colombo, E. Internalization of human labor in embodied energy analysis: Definition and application of a novel approach based on Environmentally extended Input-Output analysis. Appl. Energy 2016, 182, 590–601. [Google Scholar] [CrossRef]
- Norman, M.J.T. Energy inputs and outputs of subsistence cropping systems in the tropics. Agro-Ecosystems 1978, 4, 355–366. [Google Scholar] [CrossRef]
- Leach, G. Energy and Food Production; IPC Science and Technology Press for the International Institute for Environment and Development: Guildford, UK, 1976. [Google Scholar]
- OECD Glossary of Statistical Terms—Intermediate consumption Definition. Available online: https://stats.oecd.org/glossary/detail.asp?ID=1429 (accessed on 21 November 2014).
- European Central Bank, Eurosystem Statistics. Available online: https://www.ecb.europa.eu/stats/money_credit_banking/monetary_aggregates/html/hist_content.en.html (accessed on 13 June 2015).
- Earth’s CO2 Home Page. CO2.Earth. Available online: https://www.co2.earth/ (accessed on 7 March 2016).
- National Nutrient Database for Standard Reference. Available online: https://www.ars.usda.gov/northeast-area/beltsville-md-bhnrc/beltsville-human-nutrition-research-center/nutrient-data-laboratory/docs/usda-national-nutrient-database-for-standard-reference/ (accessed on 20 August 2018).
- Food and Agriculture Organization of the United Nations. Food Energy—Methods of Analysis and Conversion Factors; Food and Agriculture Organization of the United Nations: Rome, Italy, 2003. [Google Scholar]
- Database—Eurostat. Available online: http://ec.europa.eu/eurostat/data/database (accessed on 10 January 2015).
- Szargut, J.; Morris, D.R.; Steward, F.R. Exergy Analysis of Thermal, Chemical, and Metallurgical Processes; Hemisphere: New York, NY, USA, 1988. [Google Scholar]
- Szargut, J. Exergy Method: Technical and Ecological Applications; WIT Press: Southampton, UK; Boston, MA, USA, 2005. [Google Scholar]
- Kotas, T.J. The Exergy Method of Thermal Plant Analysis; Butterworths: London, UK; Boston, MA, USA, 1985. [Google Scholar]
- Özilgen, M.; Öner, E.S. Biothermodynamics: Principles and Applications; CRC Press: Boca Raton, FL, USA, 2017. [Google Scholar]
- Dewulf, J.; van Langenhove, H.; van de Velde, B. Exergy-Based Efficiency and Renewability Assessment of Biofuel Production. Environ. Sci. Technol. 2005, 39, 3878–3882. [Google Scholar] [CrossRef] [PubMed]
- FAOSTAT. Available online: http://www.fao.org/faostat/en/#home (accessed on 23 January 2015).
- ESS: Nutritive Factors. Available online: http://www.fao.org/economic/the-statistics-division-ess/publications-studies/publications/nutritive-factors/en/ (accessed on 11 July 2015).
- Weight Equivalents: Eggs. Available online: Hannaone.com (accessed on 13 July 2016).
- EUROPA—Economic and Financial Affairs—Indicators—AMECO Database. Available online: http://ec.europa.eu/economy_finance/ameco/user/serie/SelectSerie.cfm (accessed on 13 March 2015).


| Study, Region and Year | Input Exergy | Aims | Labour Methodology | Capital Methodology | Environmental Impact Method | ||
|---|---|---|---|---|---|---|---|
| Sciubba (2001) [6] Italy 1994 | Intrinsic exergy | Efficiency1 | Equivalent Exergy of Labour : Specific exergy of labour : | 52.7 | Equivalent Exergy of Capital : Specific exergy of capital : | 18.2 | 3 times intrinsic exergy |
| Sciubba (2003a) [32] Italy 1998 | Intrinsic exergy | Efficiency1 | 235.5 | 18.2 | Discharge intrinsic exergy | ||
| Sciubba (2003b) [33] | - | - | - | - | Theoretical | ||
| Sciubba (2004) [7] Italy 1998 | Not explicit | Efficiency1 EEC2 | 235.5 | 18.2 | T&D intrinsic exergy3 | ||
| Ertesvag (2005) [9] Norway 2000 | Intrinsic exergy | Efficiency1 | 525.8 | 20.1 | T&D intrinsic exergy3 | ||
| Milia and Sciubba (2006) [22] Italy 1996 | Not explicit | Efficiency1 | 198.5 | 18.2 | T&D intrinsic exergy3 | ||
| Sciubba et al. (2008) [23] Italy 2000 | Intrinsic exergy | Efficiency1 | 253.0 | 16.0 (€) | T&D intrinsic exergy3 | ||
| Gasparatos et al. (2009) [10] UK 2004 | Intrinsic exergy | Efficiency1 | 248.3 | 10.0 (£) | T&D intrinsic exergy3 | ||
| Chen and Chen (2009) [24] China 2005 | Intrinsic exergy | Efficiency1 | 71.9 | 23.7 | G&W processing cost4 | ||
| Dai and Chen (2011) [34] | Not explicit | EEC2 | - | - | G&W processing cost4 | ||
| Bligh and Ugursal (2012) [25] Canada 2006 | Intrinsic exergy | Efficiency1 | 406.5 | 20.7 (C$) | T&D intrinsic exergy3 | ||
| Ptasinski et al. (2006) [17] Netherlands, 1996 | CExC, Intrinsic exergy | Efficiency1 | - | 197–621 (€) | G&W processing cost4 | ||
| Hoang and Alauddin (2011) [28] | CExC, Intrinsic exergy | Efficiency1 | Equivalent Exergy of Labour : | - | - | - | Not applied. |
| Sciubba (2011) [30] | - | - | Equivalent Exergy of Labour : Specific exergy of labour : | - | Equivalent Exergy of Capital : Specific exergy of capital : | - | Not applied. |
| Sciubba (2012) [35] | - | - | - | - | Theoretical | ||
| Dai et al. (2012) [36] | Not explicit | EEC2 | - | G&W cost4 and T&D exergy3 | |||
| Sciubba (2013) [37] | - | - | - | - | Theoretical. | ||
| Dai et al. (2014) [20] | Manufacture cost | EEC2 | - | - | EEC of CO, NOX and SO2. | ||
| Chen et al. (2014) [38] China 2000–2007 | Intrinsic exergy | EEC2 | 52–76 | 42–23 | G&W processing cost4 | ||
| Jawad et al. (2015) [39] | Intrinsic exergy | EEC2 | - | - | G&W processing cost4 | ||
| Seckin et al. (2012) [11] Turkey 2006 | Intrinsic exergy | Efficiency1 | 153.9 | Equivalent Exergy of Capital: Specific exergy of capital : | 25.5 | G&W processing cost4 | |
| Seckin et al. (2013) [21] Turkey 2006 | Intrinsic exergy | Efficiency1 | 153.9 | 25.5 | EEC of CO2, N2O and CH4. | ||
| Seckin and Bayulken (2013) [8] Turkey 2006 | Intrinsic exergy | EEC2 | 153.9 | 25.5 | G&W cost4 and intrinsic exergy | ||
| Rocco et al. (2014) [18] | CExC | EEC2 | - | - | Theoretical. |
| Working Time | Total Time | Total Population | |
|---|---|---|---|
| Net energy cost of labour [44] | - | - | |
| Total energy expenditure [45] | - | - | |
| Survival energy | |||
| Metabolized food energy |
| EEA Method | AFF Labour Exergy | AFF Capital Exergy | AFF Mass, Energy and Environmental Impact Exergies |
|---|---|---|---|
| EEA 1 | M&E-Intrinsic Exergy EI-EEC | ||
| EEA 2 | M&E-Intrinsic Exergy EI-EEC | ||
| EEA 3 | M&E-Intrinsic Exergy EI-EEC | ||
| IEEA | Intrinsic Exergy |
© 2018 by the authors. Licensee MDPI, Basel, Switzerland. This article is an open access article distributed under the terms and conditions of the Creative Commons Attribution (CC BY) license (http://creativecommons.org/licenses/by/4.0/).
Share and Cite
Manso, R.; Sousa, T.; Domingos, T. The Way Forward in Quantifying Extended Exergy Efficiency. Energies 2018, 11, 2522. https://doi.org/10.3390/en11102522
Manso R, Sousa T, Domingos T. The Way Forward in Quantifying Extended Exergy Efficiency. Energies. 2018; 11(10):2522. https://doi.org/10.3390/en11102522
Chicago/Turabian StyleManso, Ricardo, Tânia Sousa, and Tiago Domingos. 2018. "The Way Forward in Quantifying Extended Exergy Efficiency" Energies 11, no. 10: 2522. https://doi.org/10.3390/en11102522
APA StyleManso, R., Sousa, T., & Domingos, T. (2018). The Way Forward in Quantifying Extended Exergy Efficiency. Energies, 11(10), 2522. https://doi.org/10.3390/en11102522