1. Introduction
To realize a sustainable green future, it is imperative to reduce internal combustion engine vehicles in the transportation sector whose exhausts contribute a substantial portion in global warming and depletion of fossil fuels [
1]. A cleaner alternative is the electric vehicle (EV) [
2] and automakers are keen in seizing this new market opportunity. The heart of an EV is an electric motor [
3]. Electric motors with high efficiency, high power factor, wide range of constant power operating capability and high intermittent overload capability are of paramount importance in realization of an EV dominant locomotive market [
4,
5]. The reliability of EV is intricately related to the reliability of the electric motor and has motivated many researchers to study the performance of electric motors in detail. Studies on thermal effects of electric motors in EVs have reported that the heat generation in motor decreases the efficiency of the motor and even threatens its safe operation [
6,
7,
8,
9]. Despite the importance of motor thermal design on the potential and significant improvements in overall motor performance, there have been surprisingly less studies on the thermal behavior compared to the traditional electromagnetic design of electric motors. In general practice, the heat generated inside the motor is dissipated through the finned outer surface of the motor [
10,
11,
12,
13,
14]. However, the overall electric and magnetic utilization dictates the frame size of a motor and ensuring that the maximum temperature inside the motor such that it operates without failure is of paramount importance [
12].
For a particular cooling of a given temperature class of regular industrial motors, the area of finned surface defines the maximum heat flow achievable [
15]. To enhance cooling of an electric motor in turn requires more dissipation of heat through its surface through an increase in the diameter of the motor, which in most cases is neither possible nor desirable. For a fixed diameter of the motor, higher cooling rate can be achieved by improving the overall heat transfer coefficient either through an increase in the coolant flow velocity or by using a coolant with a higher thermal capacity and by employing an optimized cooling jacket configuration [
16,
17]. Many researchers have focused on the thermal simulation of totally enclosed fan-cooled machines to understand the complex heat exchange phenomenon prevailing in motors and to identify the most important thermal parameters in the motors in order to achieve high performance and robust design [
10,
11,
12,
13]. In the scope of EVs, the electric motor has to withstand the load exceeding its rated value for short periods of time. This is limited by the maximum temperature rise allowed which can be relaxed when more heat is removed and that has led to the implementation of cooling jackets [
16,
17,
18].
In order to design effective electric motor cooling jackets an accurate prediction of their thermal behavior is essential. For regular motors, the rated operating conditions govern the thermal equilibrium with maximum temperatures within the allowed limit and hence no extra cooling is necessary. In contrast to a regular motor, the operating conditions of an electric motor for EV is more complex requiring a more thorough investigation of its thermal behavior. In addition to regular operation, these motors may undergo overload periods with currents exceeding the rated value [
19]. The cooling jacket design should ensure that the maximum temperature does not exceed the allowed limit [
20,
21]. Also in designing cooling jacket for EV motors it is important to consider the pumping power requirement for the coolant flow. A water cooling system for EV motors requires a separate pump exclusively for coolant flow and its power requirement should be kept to a minimum.
In view of the above discussion, the importance of focusing on the thermal design of electric motors is obvious and can be rewarded by considerable improvements in its performance. The complicated interaction of heat exchange modes in electric motors warrants the use of a 3-D numerical analysis to calculate the complete temperature field within the motor, thereby allowing us to identify the location of hot spots and to study the effects of different design and operating conditions of cooling jackets on the temperature field. In order to be able to make a reliable assessment of the motor heating during start-up or intermittent short periods of acceleration, transient analysis should be carried out according to specified time functions of the load cycles. In this study, a steady state analysis is carried out at motor maximum power output to ascertain its safe operation with the objective of finding an optimal design and operating conditions by performing a parametric study on the effect of cooling. A 3-D steady state model of a 90-kW electric induction motor for EV is generated and investigated with three different cooling jacket layouts and four different numbers of coolant flow passes. The end windings and bearings are not considered in order to simplify the motor model which can show hotspots in the windings. Numerical analysis on each scenario is performed with five different water flow rates with special emphasis on the maximum motor temperature and the pumping power. The detailed understanding of the effects of these parameters on the motor’s temperature field will help us in designing the optimal cooling jacket configuration for the electric motor.
2. 3-D Thermal Model of a Water-Cooled Induction Motor
The induction motor analyzed in this paper has an outer water-cooled peripheral casing structure with induced air flow from end side to the other. The main parameters of the motor are: maximum power of 90 kW operating at 1000 rpm with 30 stator slots, 26 rotor slots and the model dimensions are given in
Table 1.
The following assumptions are made to simplify the model:
Thermal conductivities of motor materials are isotropic;
Rotor and stator iron losses remain constant with uniform heat generation;
Rotor slot and stator slot material are the same and windings are completely covered by the insulating material.
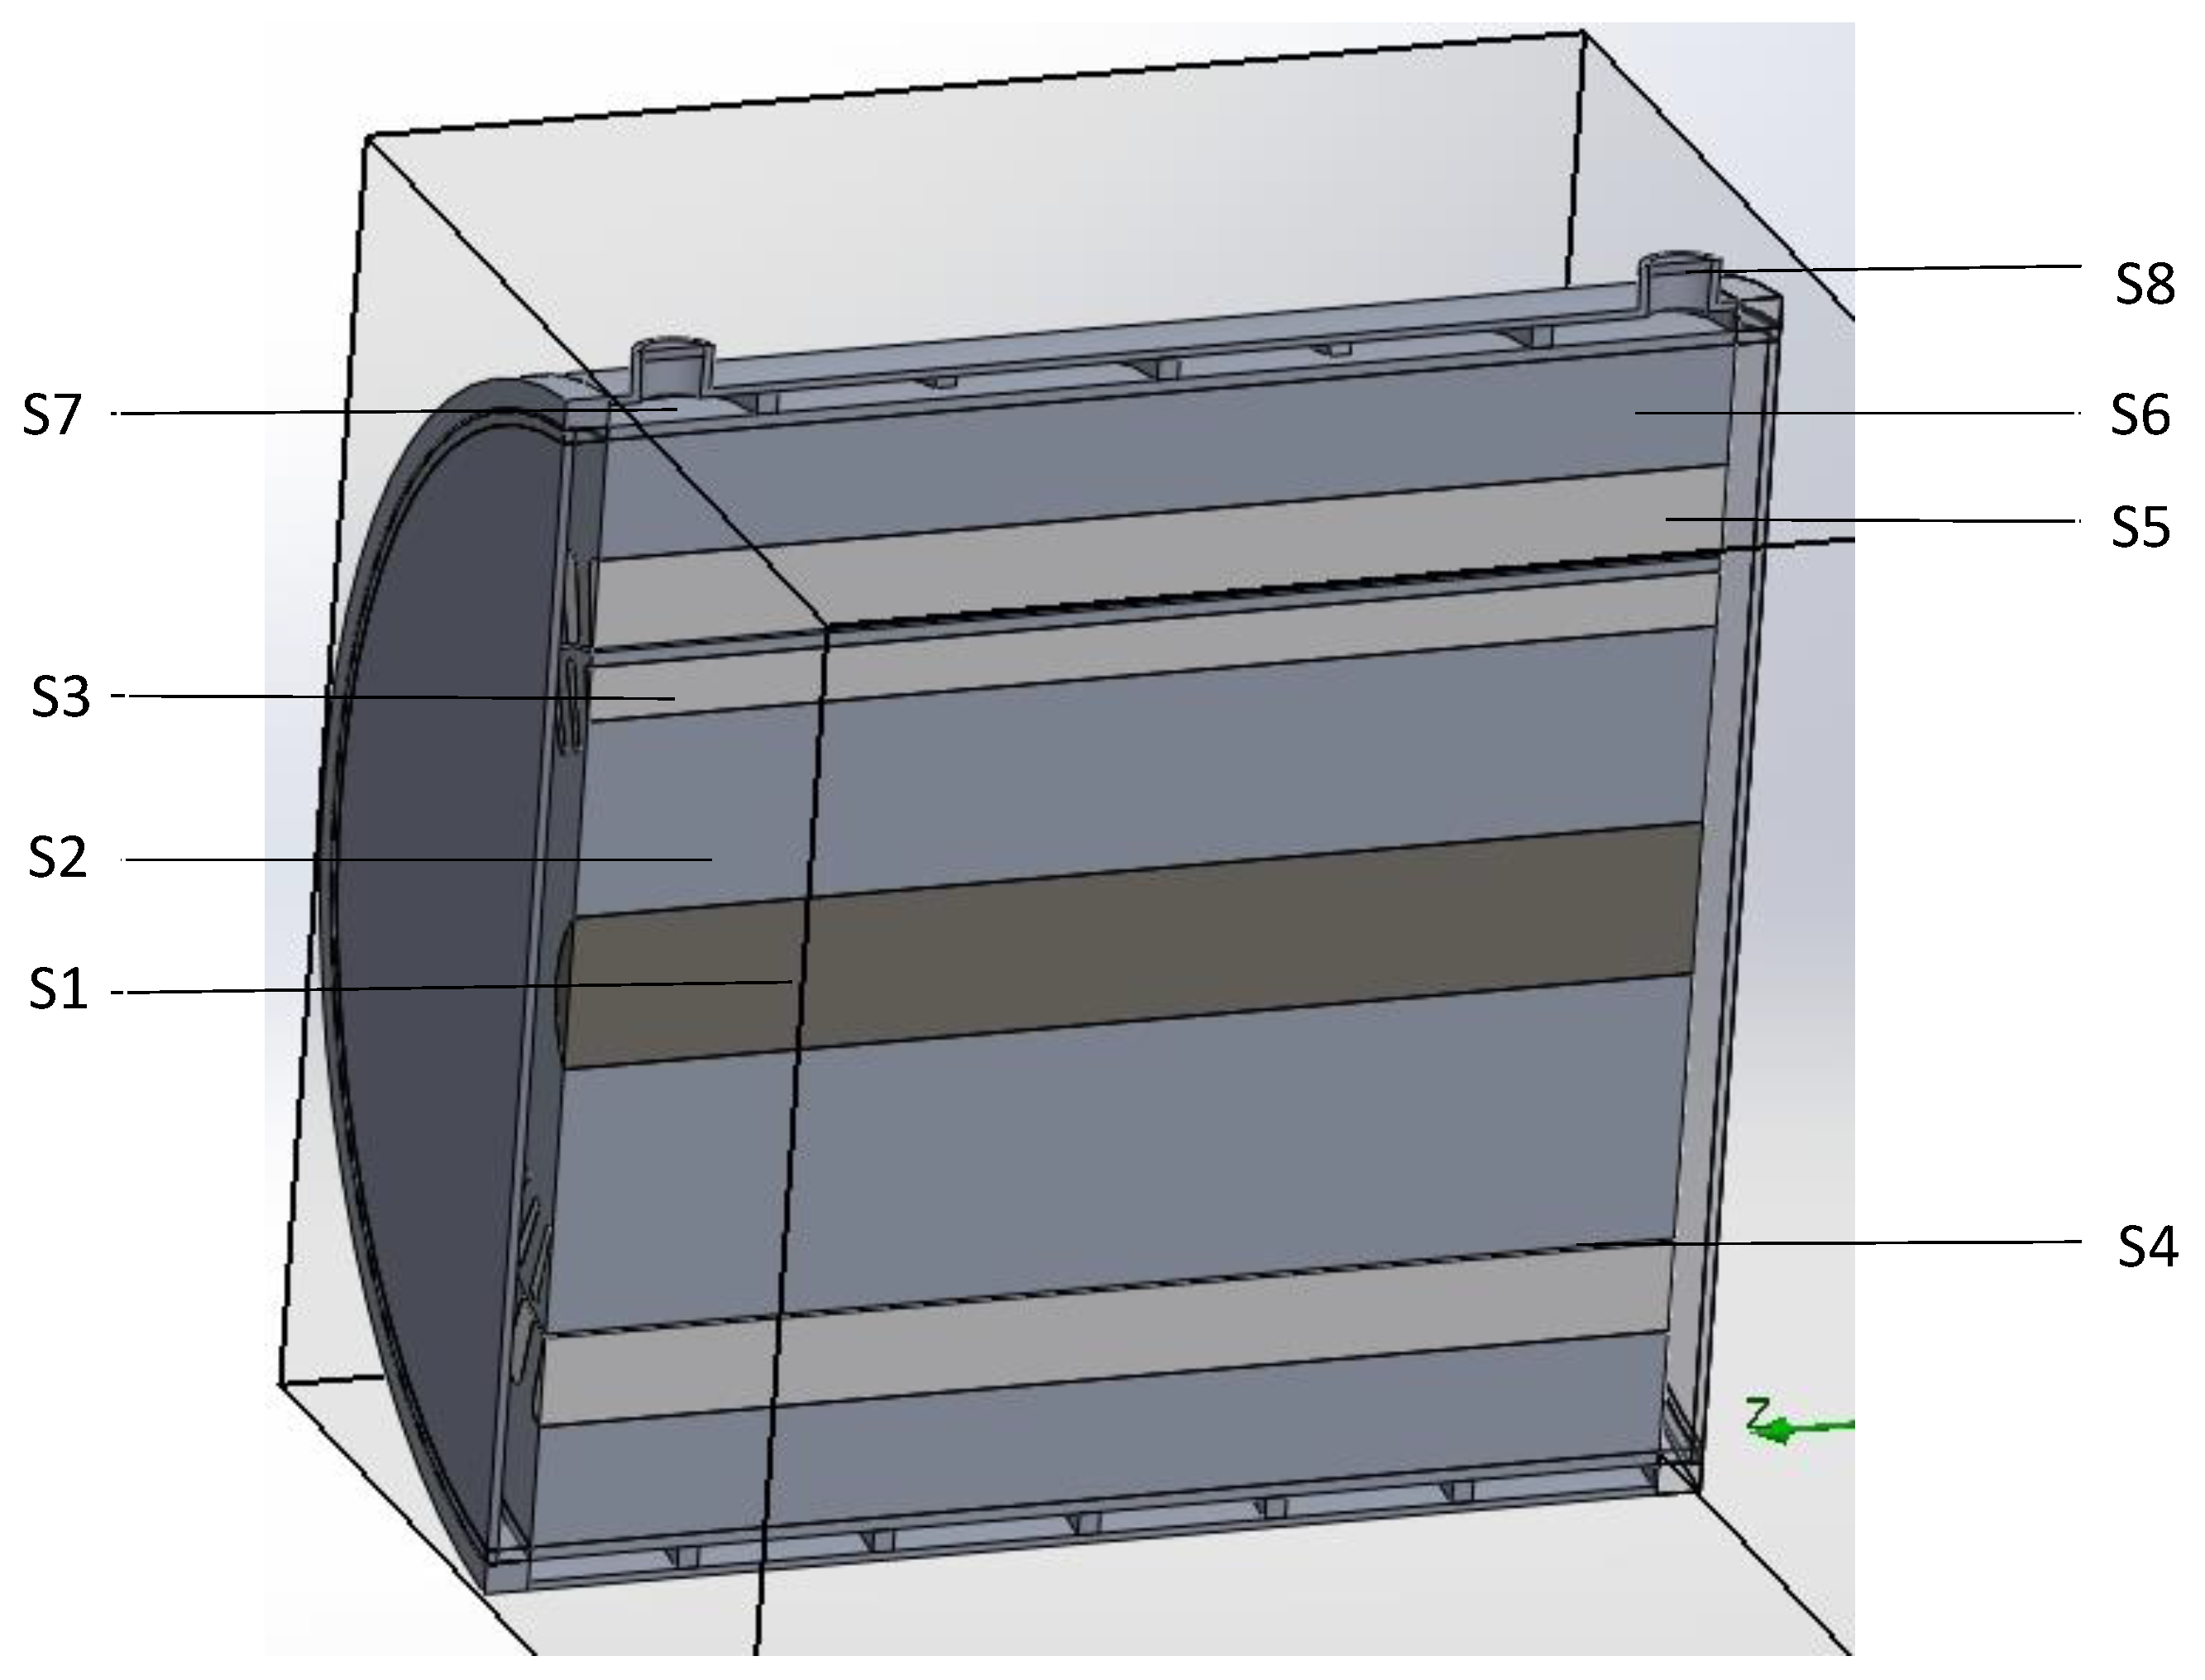
Based on these assumptions the cross-sectional view of the motor’s solving domain is shown in
Figure 1.
In
Figure 1, S1 indicates the motor shaft, S2 the rotor core section, S3 the rotor slot lining, S4 the air gap between rotor and stator, S5 the stator lining, S6 the stator core, S7 the cooling water flow passage and S8 the cooling water inlet and outlet ports.
Water flowing in the cooling jacket is governed by the laws of conservation of mass, momentum and energy which are respectively represented by the continuity equation, the Navier–Stokes equation and the heat equation. Water is treated as an incompressible fluid with constant material properties.
3. Cooling Jacket Design Parameters
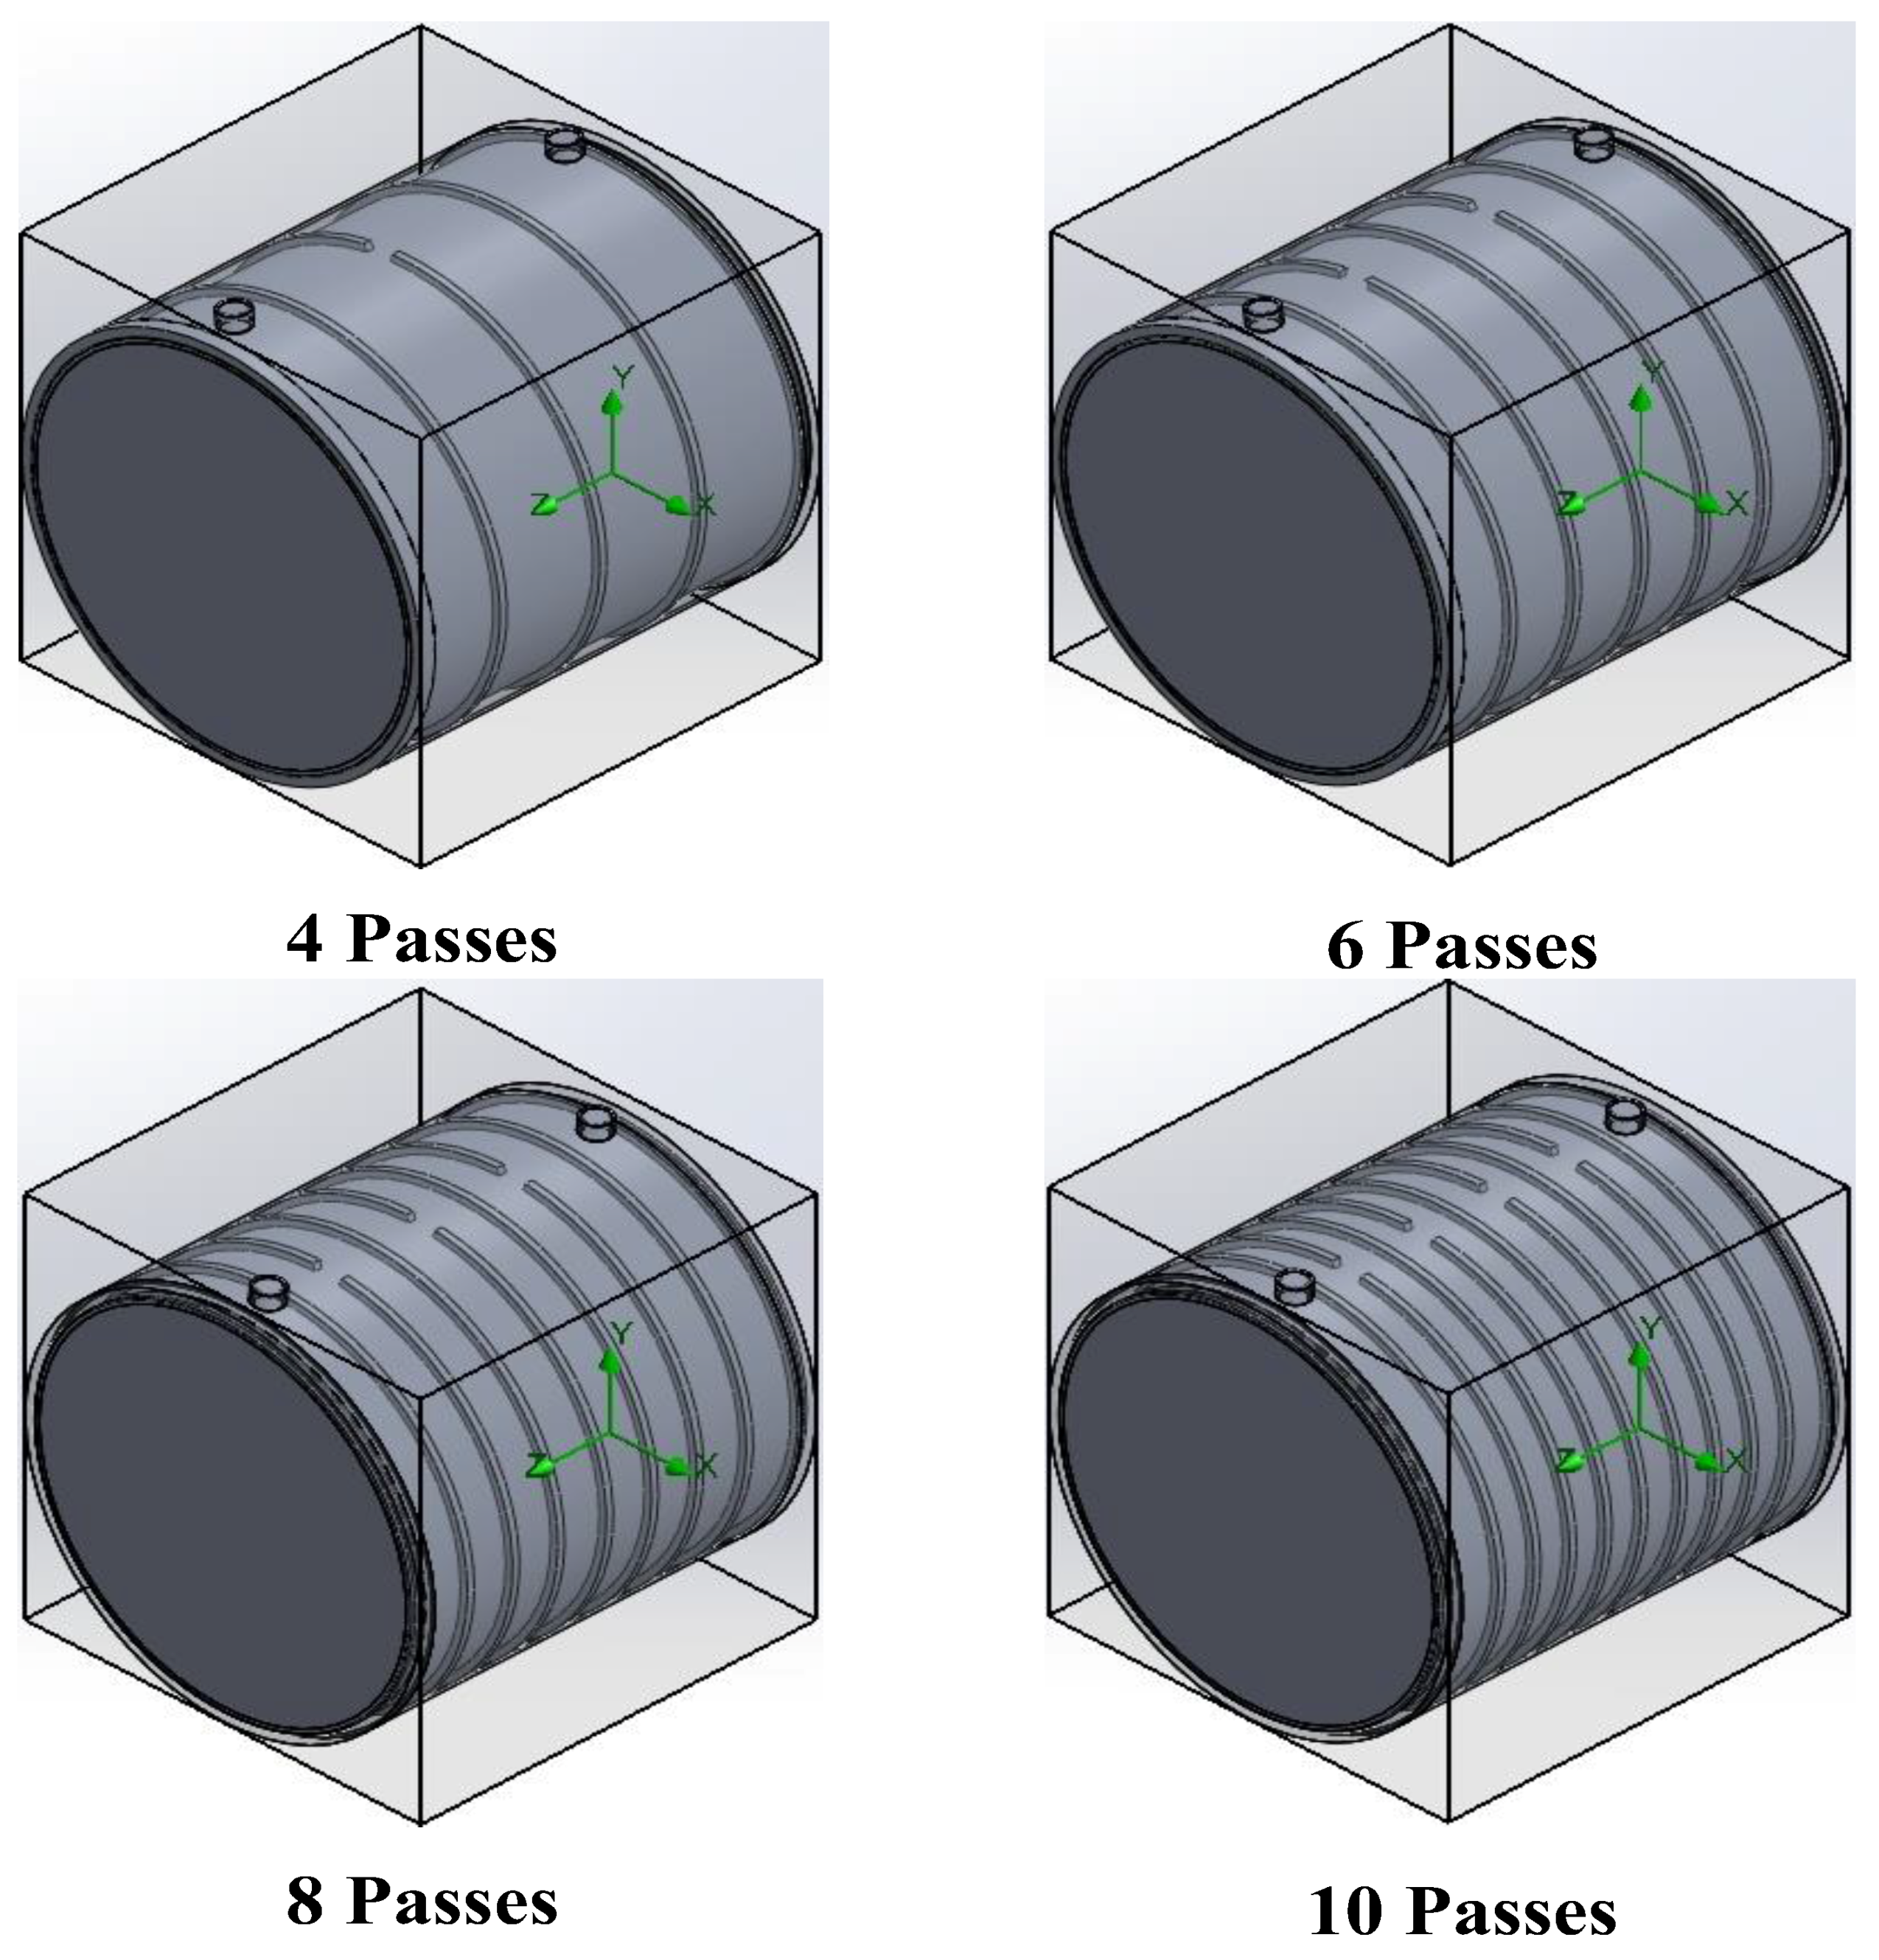
Lowering the motor’s maximum temperature below the critical value without incurring an increase in pumping power and coolant load is the main objective of the cooling jacket. For this purpose, jacket layouts are modeled with the following two parameters. One is the number of flow passes in the cooling jacket as shown in
Figure 2, where the number of passes ranges from four to ten with an increment of two passes.
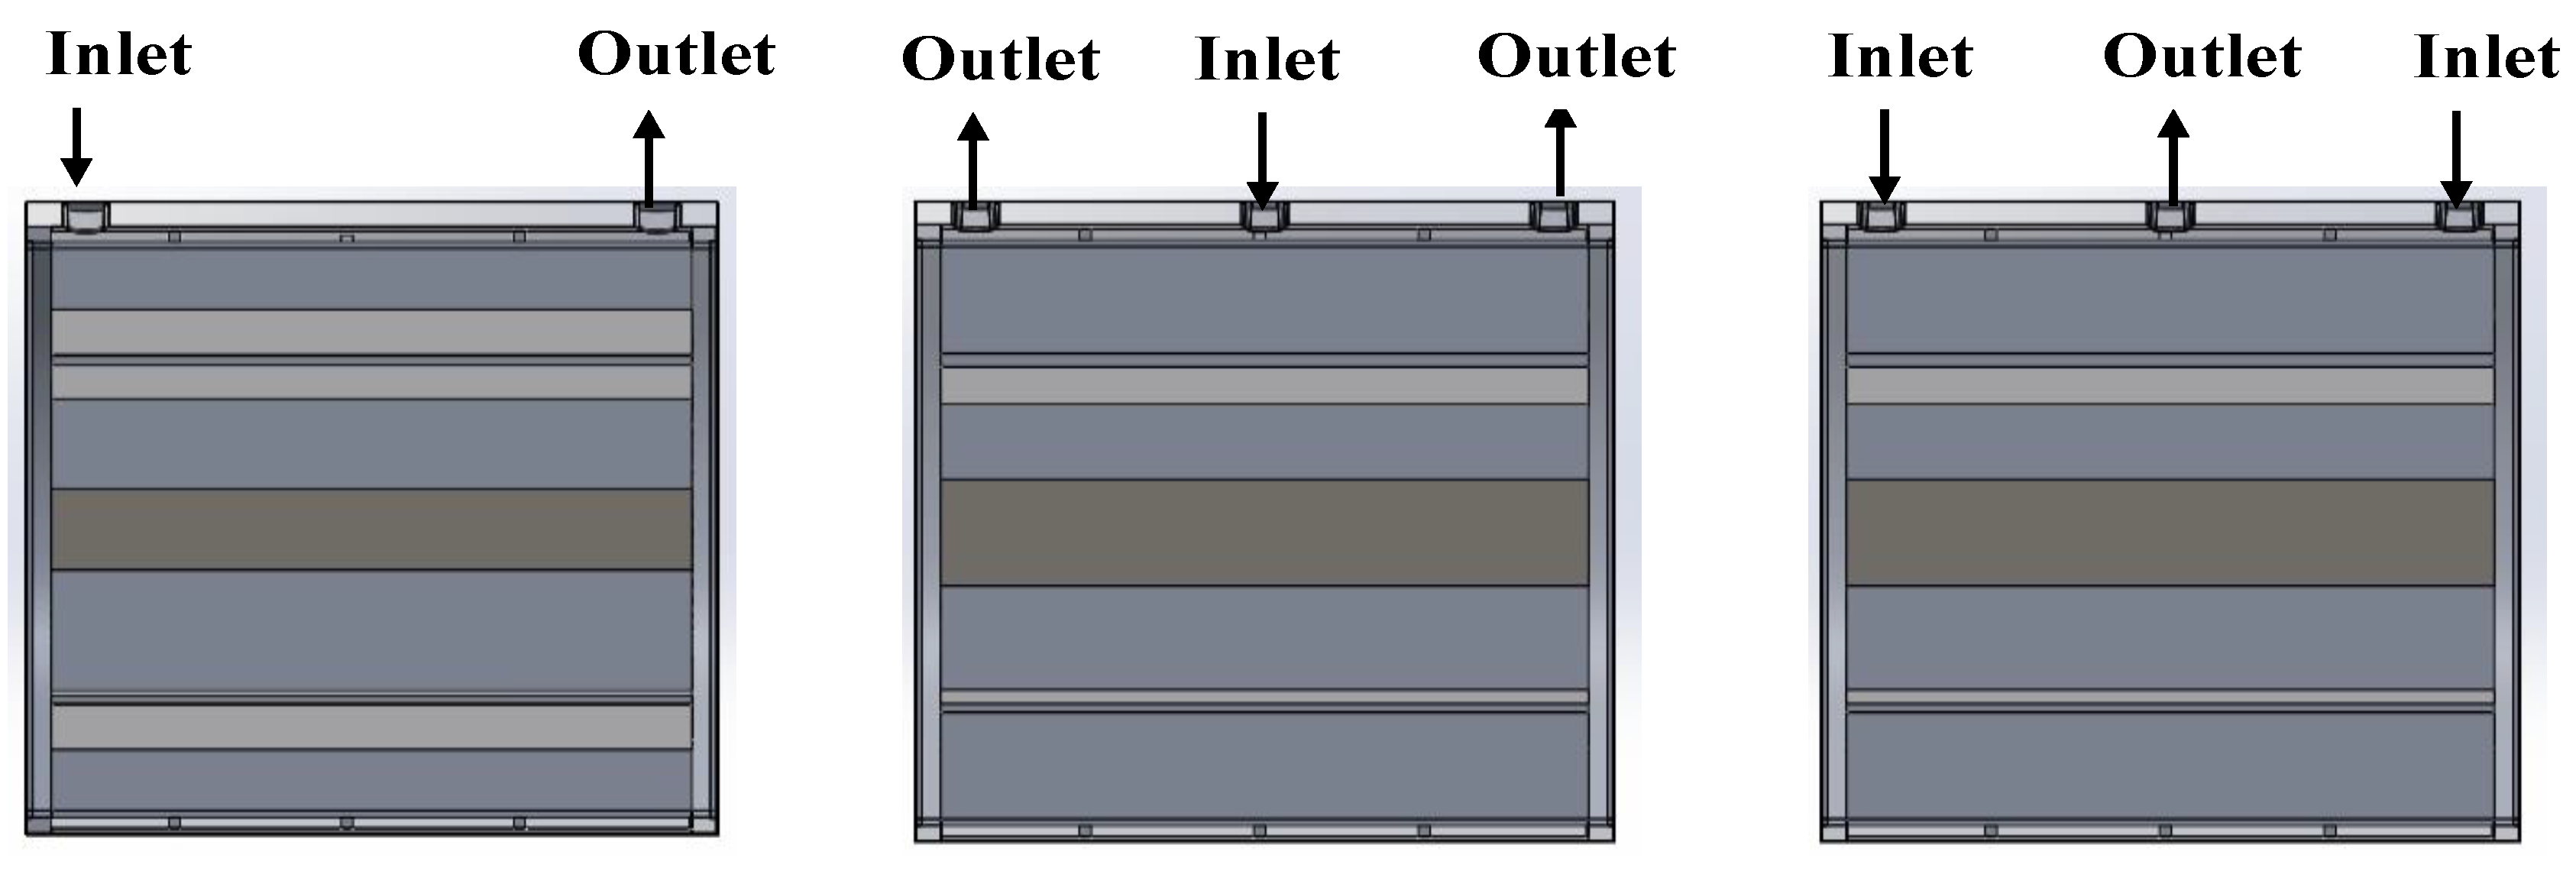
The other parameter in the jacket design is the cooling water inlet and outlet port configuration, where the following three configurations have been selected as shown in
Figure 3.
Two ports with one inlet at one end and one outlet at the other end.
Three ports with one center inlet and two outer outlets.
Three ports with two outer inlets and one center outlet.
Simulations are performed with flow rates ranging from five to 30 LPM on four, six, eight and ten flow passes where all three-jacket inlet and outlet port configurations are employed for every case.
4. Determination of Simulation Parameters
4.1. Internal Heat Sources in the Motor
All electrical losses while the motor is running act as heat sources leading to a temperature rise of the motor. Total loss including winding loss, iron loss, mechanical loss and additional loss can be represented as Equation (1) [
22]:
where iron core loss includes both the tooth and the yoke iron losses.
PCu1,
PCu2 and
Pfw are obtained through loss density distribution model of Bousbaine [
23].
4.2. Equivalent Model of Stator and Rotor Windings
Complex geometry of stator and rotor winding and insulation material in the stator slot makes it almost impossible to model the actual physical geometry. This problem was addressed by considering all insulating materials in the slots as a single insulating layer attached to the slot wall [
24]. Resulting in an equivalent model of the stator ant rotor slot as shown in
Figure 4.
For multilayered components such as stator and rotor slot lining, the equivalent thermal conductivity
λeq can be represented as [
25]:
4.3. Effective Thermal Conductivity of Air Gap
Rotor rotation induces external air into the gap between the stator and the rotor from the end side of the motor resulting in a forced convection between the stator and the rotor causing a coupling of temperature and flow field within the air gap. Due to the complexity of the geometry and the complicated interaction between flow and heat transfer, an effective thermal conductivity
λeff, which is a measure of the heat transfer capacity of the flowing air in the gap, is utilized. Steps involved in calculating the effective thermal conductivity are as follows [
25]:
The air-gap Re
g is 1081 and the Re
c is 526 for our model. When Re
g < Re
c, the air flow is laminar and the heat transfer mode is primarily that of conduction where
λeff can be treated as being equal to that of air
λair. However, for our model the flow is turbulent and the effective thermal conductivity
λeff as expressed by Equation (5) [
25] is used:
where
η =
R2/
Ri1.
4.4. Heat Transfer Coefficients at Motor Ends
Rotor rotation induces air from one end of the motor to produce an axial flow resulting in the coupling of the flow and the temperature fields. At the end region of the motor the heat transfer includes heat convection between the air in the stator-rotor gap, end of the stator and the rotor, and also between the end of the windings. The convection heat transfer coefficient at the end of the motor is a function of many parameters such as the geometrical features of the end windings and the rotor surface roughness. In this paper, these coefficients are determined using the following empirical formulas [
25,
26].
5. Numerical Simulation Scheme
Boglietti et al. [
27] studied thermal analysis of electric machines based on three different techniques in order to highlight their relative advantages and disadvantages. Their thermal analyses were based on lumped-parameter thermal network, finite-element analysis and computational fluid dynamics. They reported that the main strength of CFD tools lies in predicting the flow in complex regions and is recommended for big motors and generators. The geometrical modelling is carried out on SolidWorks using adaptive mesh generation and numerical computation using SolidWorks flow simulation. Heat generation from copper losses and iron losses are given as heat generation input in stator slot, stator winding, rotor slot and rotor winding. Equivalent thermal conductivities for stator lining and rotor lining models were employed in the model as represented by Equation (2). The effective thermal conductivity of air gap is calculated using Equation (5). The effective heat transfer coefficient for different motor parts such as stator winding, end surface of the stator and rotor core and rotor end windings are given at appropriate locations as boundary conditions, where Equations (6)–(9) were employed to calculate the respective values. These values are then passed on to the software and along with the three simplifying assumptions of
Section 3. The governing equations for the flow and thermal field in the motor are then solved using SolidWorks flow simulation module.
6. Numerical Simulation Results
The 90-kW induction motor analyzed has an outer water-cooled peripheral casing structure exposed to an ambient air temperature of 30 °C. Coolant water flow rate in the water jacket ranges from five to 30 LPM at an inlet temperature of 40 °C. Pumping power for coolant circulation is obtained from the pressure drop between the inlet and the outlet. The maximum motor temperature allowed for the cooling jacket design is set to 373 K [
20]. Kral et al. [
17] studied thermal model of totally enclosed water-cooled induction machine for the purpose of traction applications. Their thermal analysis of an induction motor, which compared well with experimental measurements, showed that the highest temperature rise occurs in the stator windings. Their qualitative results show that high temperature zones are similar to the results of the current study. The number of flow passes, flow rates and the jacket design configurations will have different effects on the motor temperature distribution and the pumping power and are discussed in the subsequent sections.
6.1. Effect of Number of Passes
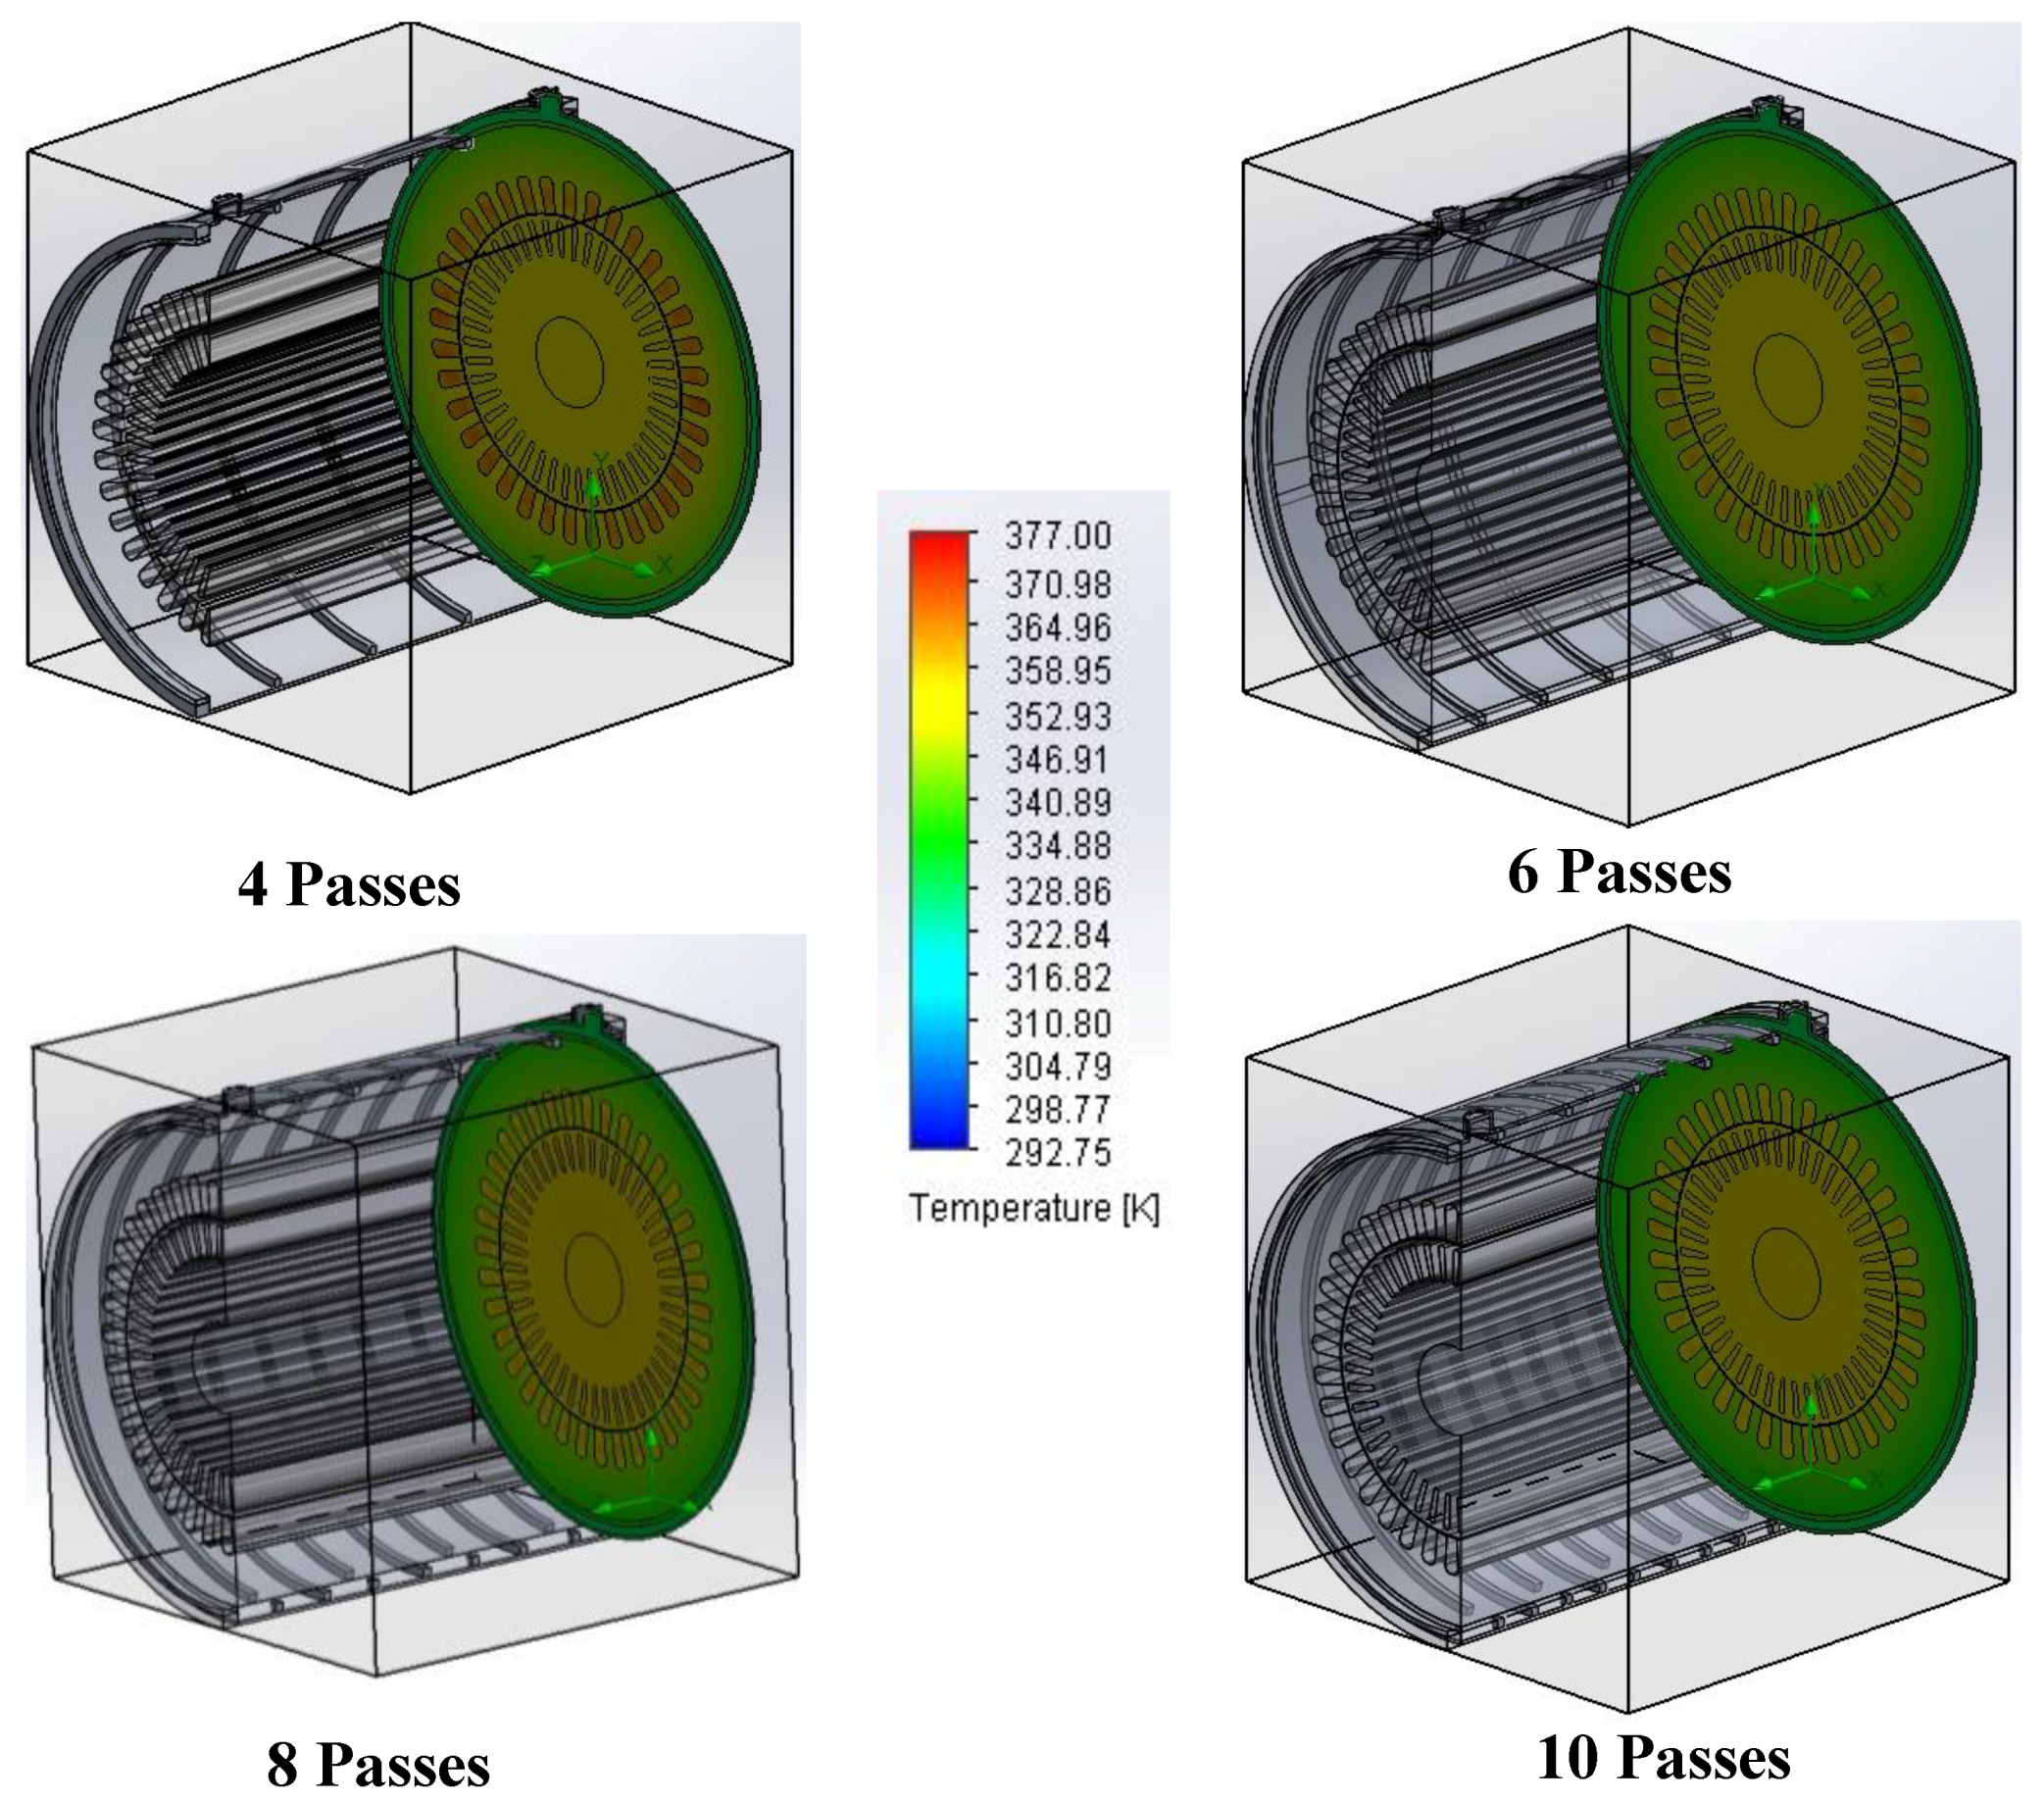
Three-D numerical simulations are performed with four different numbers of passes; four, six, eight and ten.
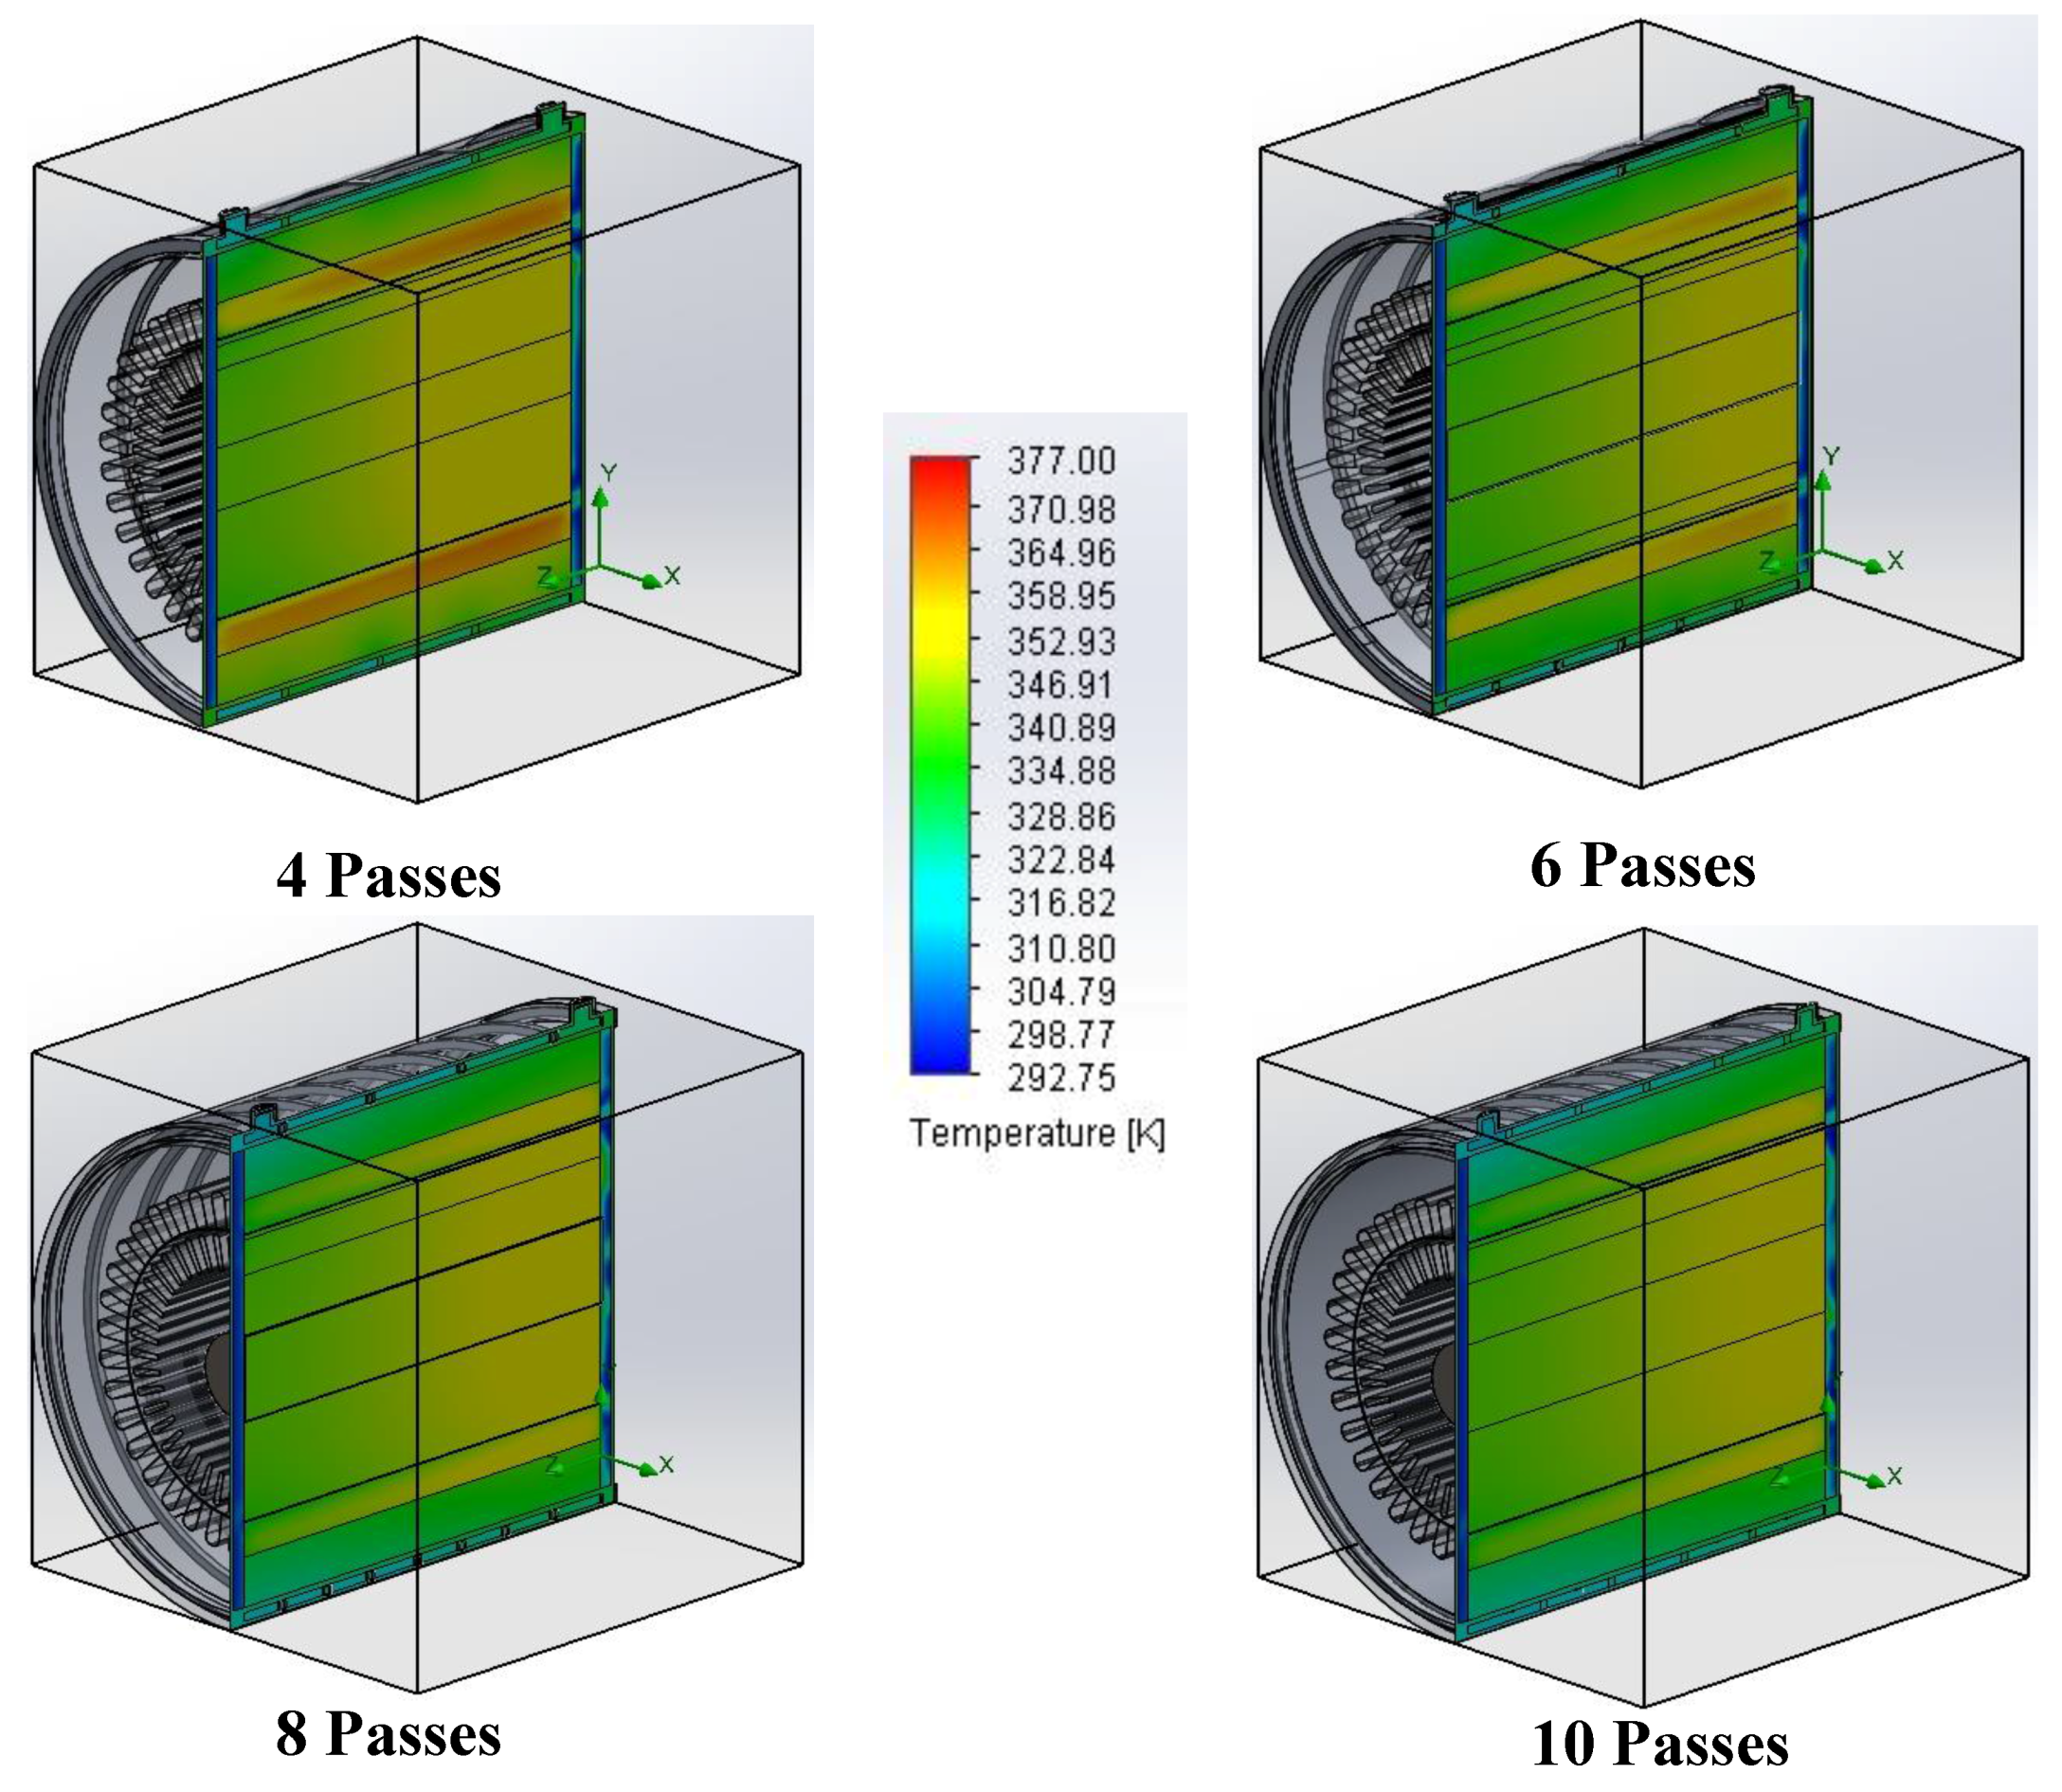
Figure 5 and
Figure 6 show the temperature results for a water flow rate of 10 LPM and for a cooling jacket with one inlet and one outlet port, where the coolant enters from the left end of the motor.
Figure 5 shows the mid plane cross sectional temperature profile of a two-port cooling jacket configuration. The increase in the number of passes at a fixed water flow rate increases the average velocity of the water over the motor surface resulting in an increase of the heat transfer coefficient. This results in the lowering of the overall temperature field and also the maximum temperature inside the motor as shown in
Figure 5. The stator core is in direct contact with the cooling water and hence is at the lowest temperatures.
Figure 5 also shows the maximum temperature zone inside the motor, which is at the stator winding near the right end where the water exits the cooling jacket. The rate of heat transfer is directly proportional to the temperature difference and as the water flows from the inlet towards the outlet it absorbs heat which increases its temperature. This leads to lesser temperature differences towards the end, hence the reduced amount of heat transfer as water flows toward the exit port resulting in the maximum temperature zone towards the end of coolant flow loop.
Figure 6 shows the cutaway section near the exit port at the same axial location where the maximum temperature zone occurs. For all cases of 4–10 passes the highest temperature rise occurs in stator windings which can be attributed to high heat generation from winding losses and its lower equivalent thermal conductivity. Similar results have been reported by other researchers [
17,
21]. The maximum temperatures in the stator winding decrease as the number of passes are increased, although the lowering of the temperature becomes less effective as the number of passes are increased beyond six passes. There is little difference between eight and ten passes.
Figure 7 displays the maximum temperature inside the motor, which occurs at stator windings, as a function of the number of flow passes for one inlet and one outlet port configuration. It can be seen that increasing the number of passes results in a decrease in the maximum temperature. Apart from 5 LPM for all number of passes and 10 LPM at four passes, all other configurations satisfy the cutoff temperature of 373 K.
The downside of increasing the number of passes is that it increases the motor pumping power as presented in
Figure 8. The mean velocity of the coolant is directly proportional to the number of passes resulting in an increase in the jacket surface friction losses. At a fixed number of flow passes, increasing the flow rate results in an increase in the pressure loss. The increase in the pressure loss is partly due to the increase in the average velocity in the passage and partly from the complex secondary flows between passes as will be shown later in
Figure 13. Cuiping et al. [
18] studied the cooling of induction motor by varying the flow passes in axial direction from 1 to 50 and came up with an optimized flow pass number between 18 and 24 based on pressure drop and temperature of the motor. The coolant flow in this study is in the circumferential direction and based on our cut off temperature of 373 K, a minimum of 4 passes can satisfy the cut off temperature at a flowrate of about 15 LPM. At this flow rate the pumping power is in the range of 10 W, which is a reasonable value. The lowest pumping power is for 5 LPM, but as discussed earlier it does not satisfy the cut off temperature limit.
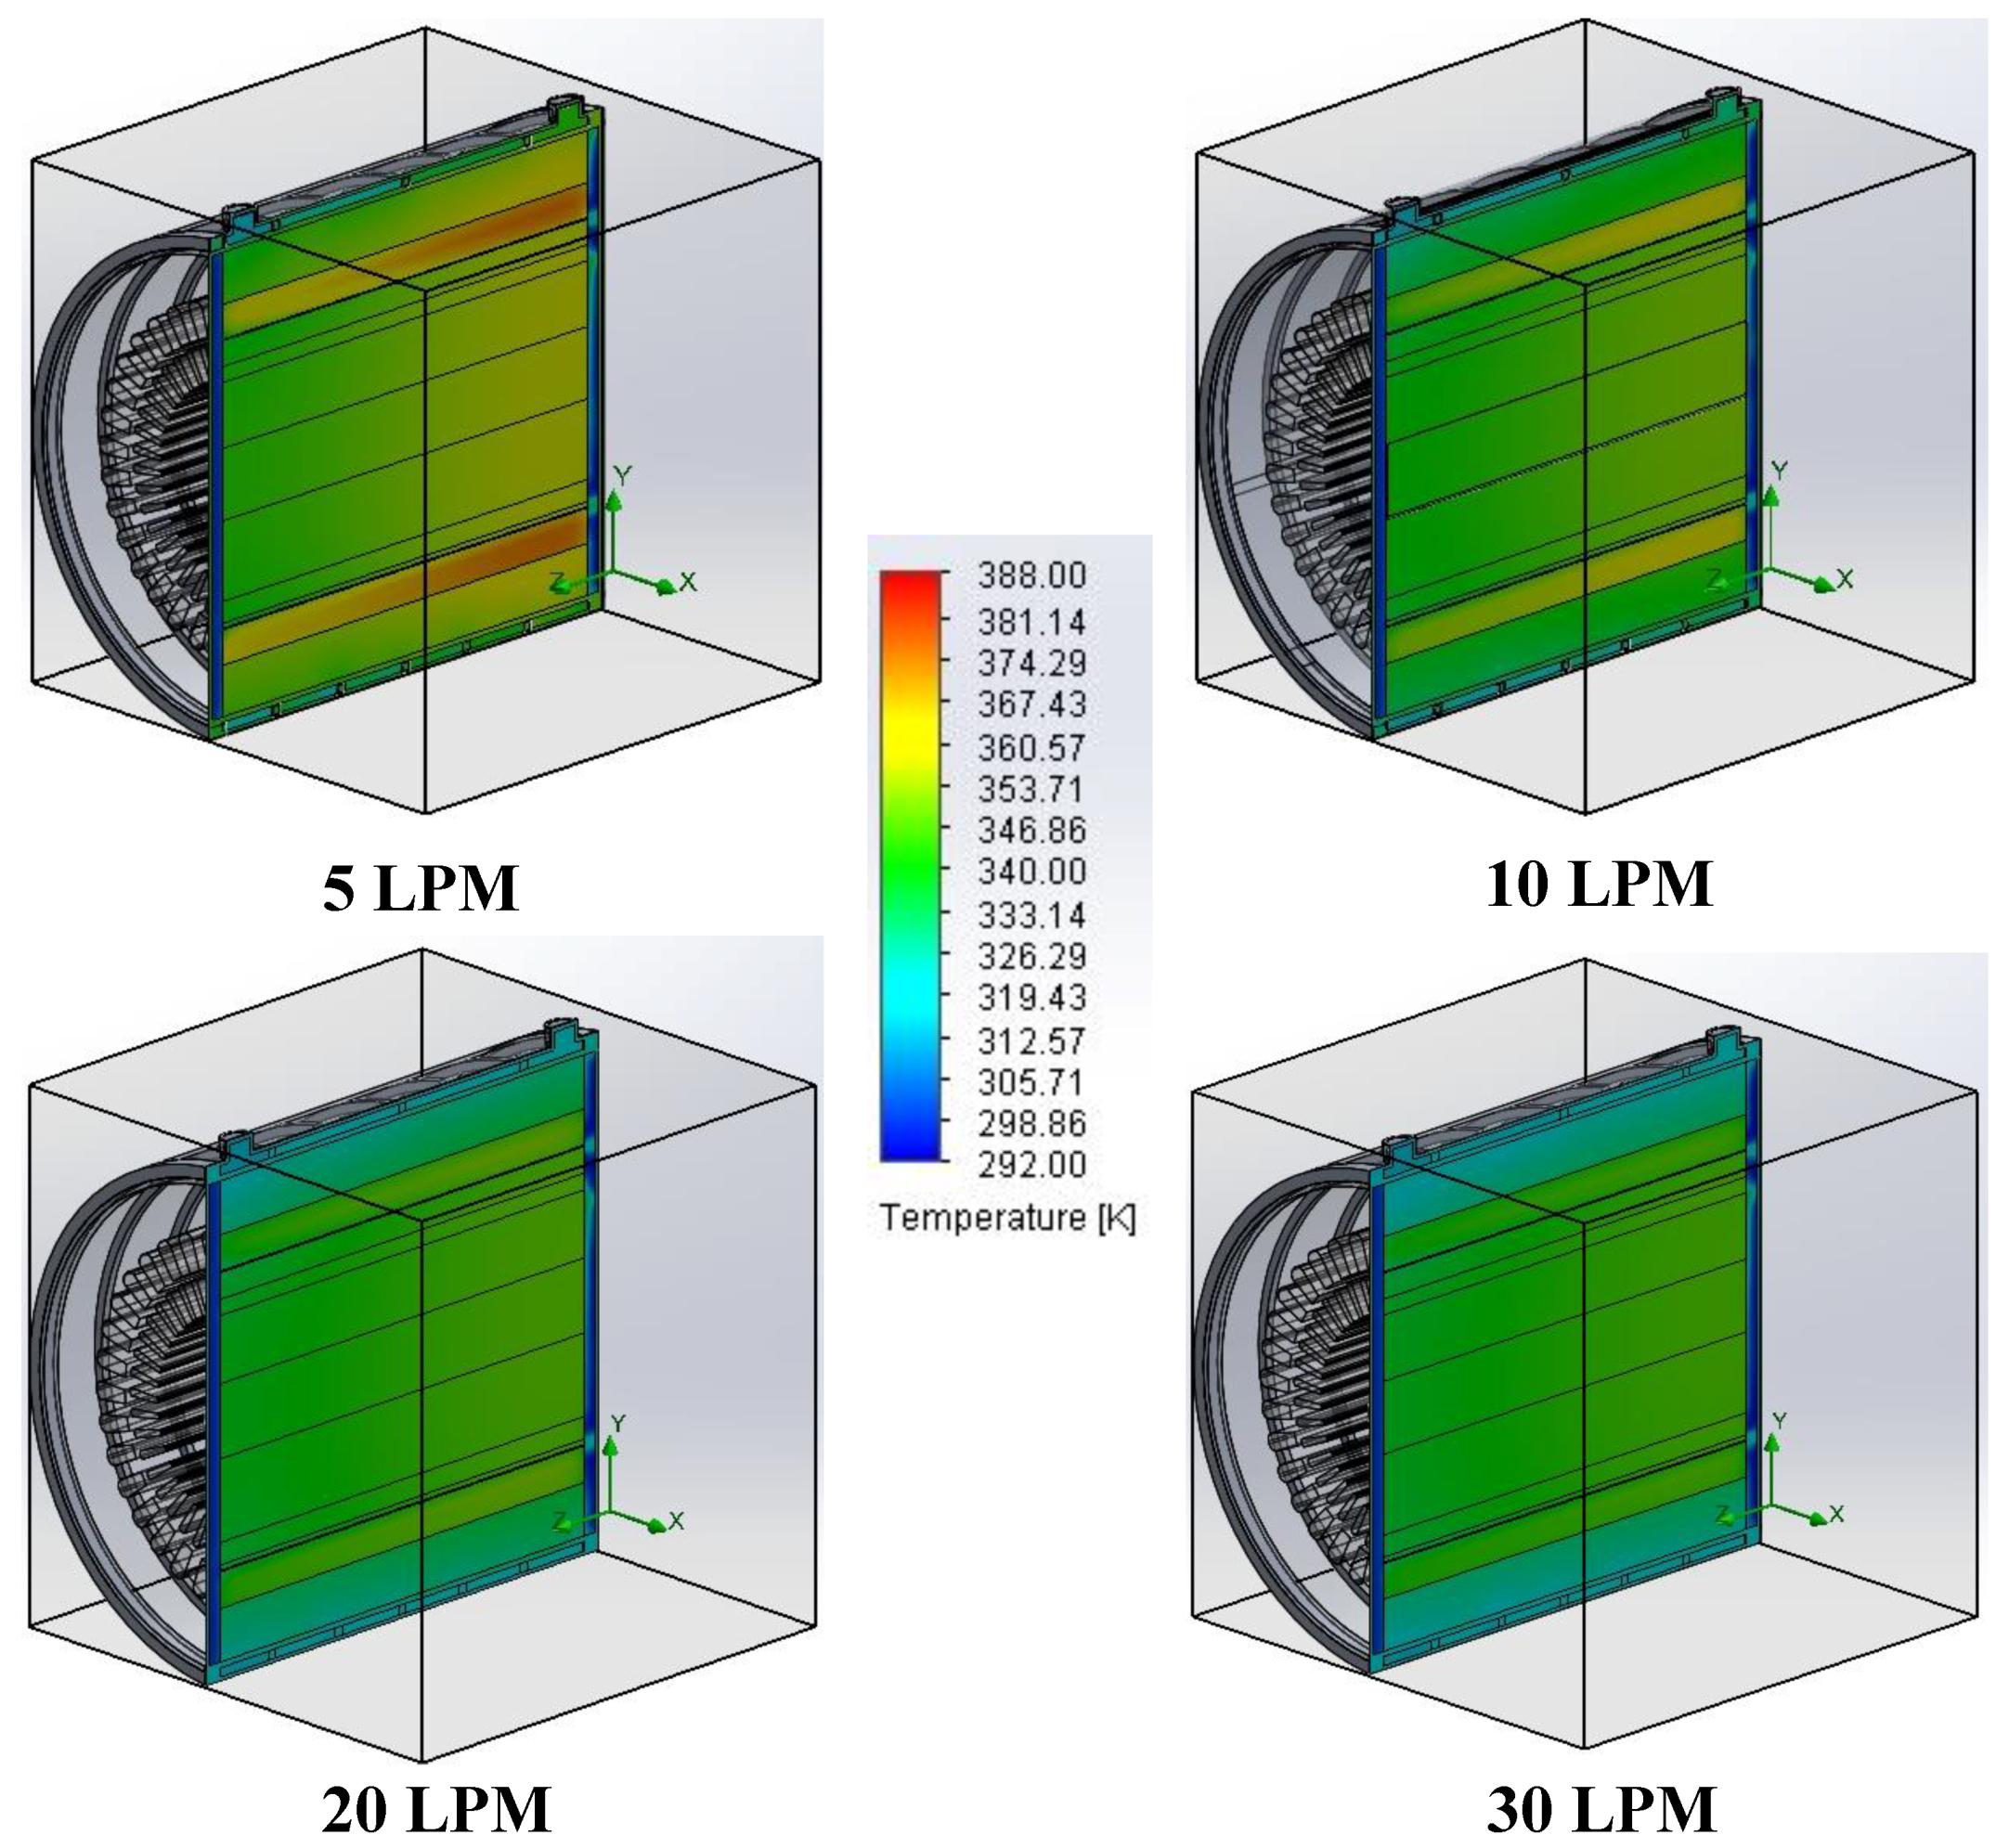
6.2. Effect of Flow Rate
Another major parameter for study is the coolant flow rate through the cooling jacket. An increase in the flow rate increases the heat transfer coefficient improving the heat transfer rate from the motor.
Figure 9 compares the mid-plane cross sectional temperature field as the coolant flow rate is increased from five to 30 LPM while keeping the number of flow passes constant at six. The jacket configuration is one inlet on the left and one outlet port on the right.
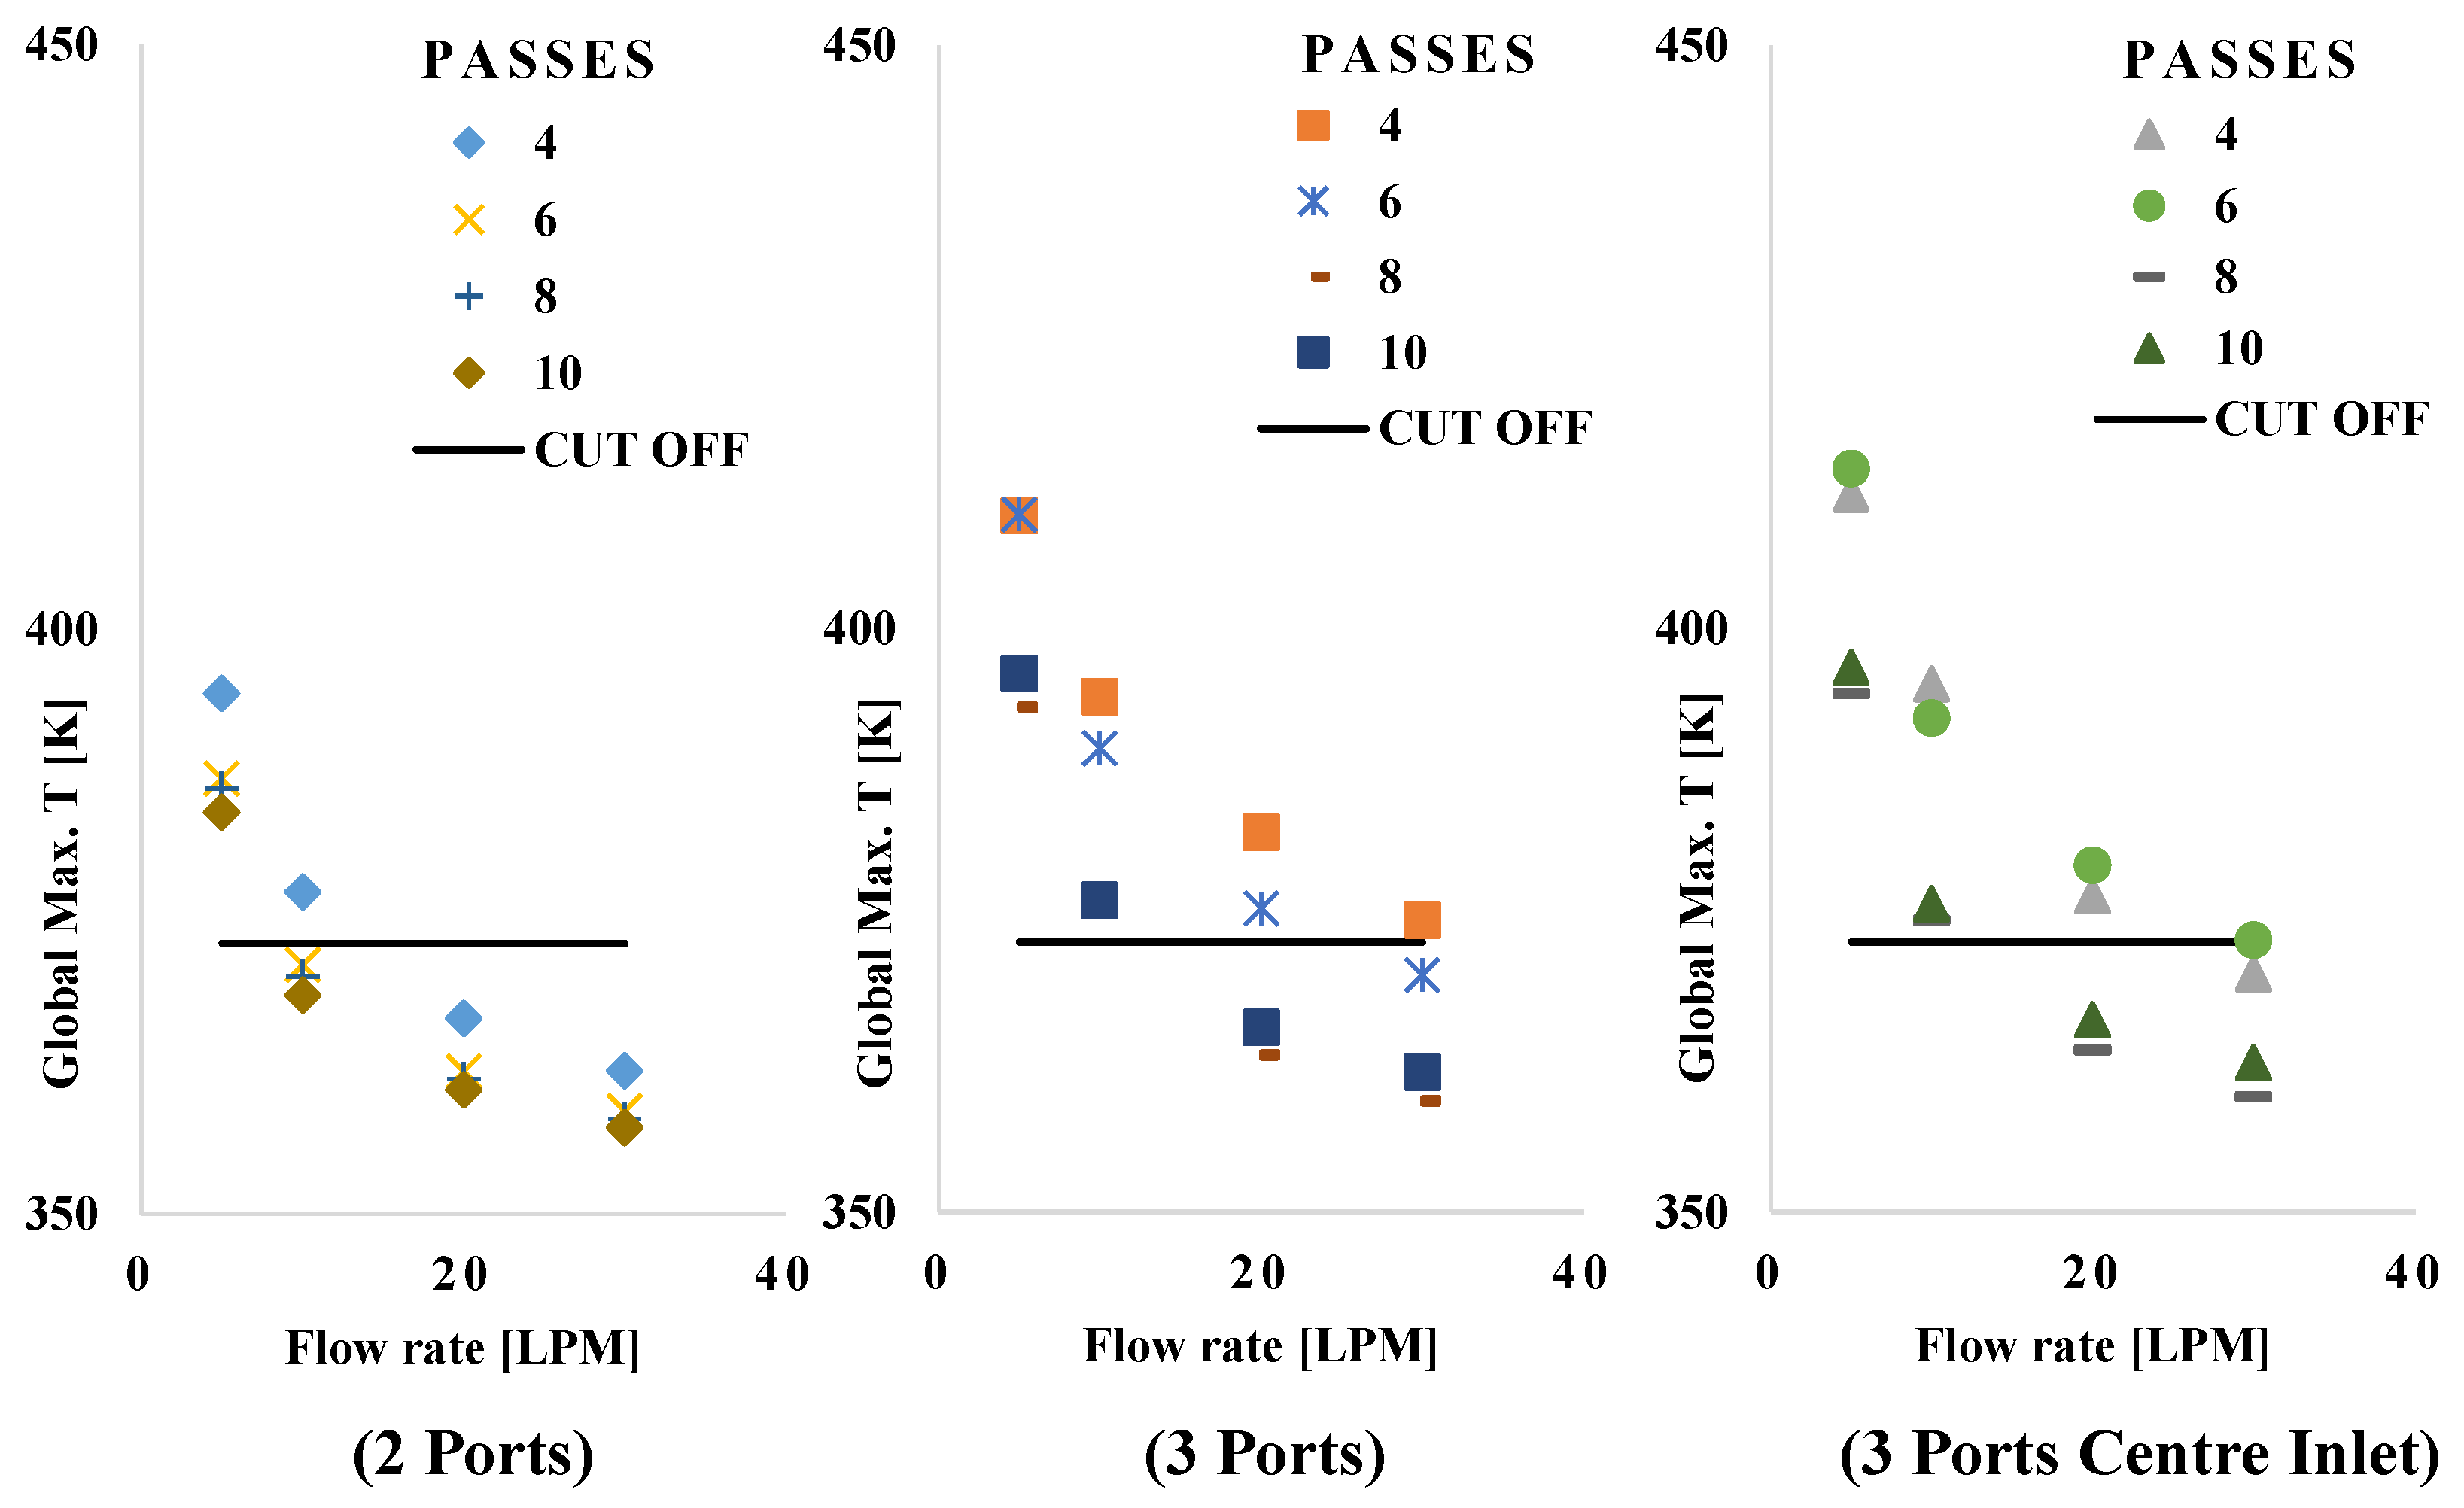
Figure 10 shows the maximum temperature inside the motor as a function of flow rate for all scenarios studied. It can be seen from
Figure 10 for all scenarios that increasing the coolant flow rate drastically decreases the maximum motor temperature and the rate of decrease is higher at low flow rates. Compared with
Figure 7, increasing the flow rate is more effective in lowering the maximum temperature than increasing the number of passes. Similar results were observed for all scenarios. For a flow rate of 5 LPM no jacket configuration satisfied the cut off temperature as was also shown in
Figure 7. For a flow rate of 10 LPM, six, eight and ten passes with two ports satisfy the cut off temperature. For 20 LPM, apart from multiple ports of four and six passes all other configurations satisfy the cut off temperature. For 30 LPM, only the four passes and three ports configuration does not satisfy the cutoff limit. As seen in this figure the multiple port configuration has a higher global maximum temperature for the same number of passes and at the same flow rate. This effect will be discussed in the next section.
Increasing the flow rate will require more pumping power as shown in
Figure 11. The pumping power is maximum for a two-port configuration followed by a three-port center inlet and is minimum for a three-port center outlet configuration for all flow rates. In some scenarios, the increase in the flow rate results in almost an exponential increase in the pumping power, especially in cases where the jacket has two ports.
Figure 11 shows that for same flow rate and number of passes the pumping power requirement is lower for multiple port configurations as compared to the two-port system. This is due to the fact that for multiple ports the entering flow is divided into two equal portions and hence in multiple port configurations the average velocity in the passage is reduced to half compared to the two-port configuration resulting in a lower pumping power requirement. From the results shown in
Figure 10 and
Figure 11 we can deduce that, the optimum jacket configuration is a two-port system with a flow rate of 10 LPM with 6 number of passes, which satisfies the cut off temperature with a minimum pumping power. For a flow rate of 10 LPM with six number of passes the power requirement is 3 W, which is a quite reasonable value.
6.3. Effect of Jacket Layout
Figure 12 shows the effect of jacket layout on temperature profile of the motor. The effect of the jacket layout design is that it changes the heat zones in the motor assembly. For the same number of passes and the same flow rate there is a higher temperature zone in multiple ports configurations as compared to a two-port configuration. In
Figure 12 the results are shown for six passes and at a flow rate of 10 LPM. For a three-port center inlet water enters at the center of the jacket layout and exits at both ends of the jacket thereby diving the inlet water into two passages. When the flow is divided into two flow passages the average velocity is halved and the heat transfer coefficient is decreased resulting in a higher temperature. The asymmetry of both the three-port configuration is due to extra cooling due to the induced air from the left end of the motor. The maximum temperature in this configuration should be towards the end of coolant flow loop but this is not the case as there are large stagnant zones right below where water enters the cooling jacket as shown in
Figure 13. This is the reason the maximum temperature is at the center of the motor as shown in
Figure 12. For three ports center outlet, water enters from both ends and leaves the cooling jacket at the center. The coolant input was 5 LPM at both ends to achieve total flow rate of 10 LPM. This again results in a lower average velocity as compared to a two-port configuration with the same flow rate, resulting in a lower heat transfer coefficient, causing higher temperatures as shown in
Figure 12.
Figure 14 shows the effect of the flow rate on jacket configuration. It is evident from the figure that the two-port jacket configuration is the optimal layout for the lowest global maximum temperatures. Similar trends were observed for all numbers of passes.
7. Conclusions
A three-dimensional steady state numerical analysis of an induction motor with cooling jacket installed on the surface with water as a coolant under maximum load was performed. The temperature field distribution under various flow rates, flow passes and jacket configuration was obtained along with pressure drops between the inlet and the outlet ports. Increasing the number of flow passes decreases maximum motor temperature but also increases the amount of power required for pumping. The same effect was found with increasing the flow rate of the coolant. A multiple port system did not help in lowering the global maximum motor temperature. The global maximum temperature was higher for multiple ports as compared to a two-port configuration at the same operating conditions. Considering the maximum temperature cutoff value of 373 K and a reasonable pumping power, it is recommended that a cooling jacket with six water passes and one inlet and one outlet port configuration with a flow rate of 10 LPM be used in effectively lowering the maximum motor temperature while keeping coolant pumping power to a minimum value.


