Article

Optimal Operation of Interdependent Power Systems and Electrified Transportation Networks

by
M. Hadi Amini
1,2,* and
Orkun Karabasoglu
3
1
Department of Electrical and Computer Engineering, Carnegie Mellon University, Pittsburgh, PA 15213, USA
2
School of Electronics and Information Technology, Sun Yat-sen University, Guangzhou 510006, China
3
Department of Industrial Engineering, Yasar University, Izmir, 35100, Turkey
*
Author to whom correspondence should be addressed.
Energies 2018, 11(1), 196; https://doi.org/10.3390/en11010196
Submission received: 2 January 2018 / Revised: 11 January 2018 / Accepted: 13 January 2018 / Published: 14 January 2018
(This article belongs to the Special Issue Distribution System Operation and Control)

Abstract

:
Electrified transportation and power systems are mutually coupled networks. In this paper, a novel framework is developed for interdependent power and transportation networks. Our approach constitutes solving an iterative least cost vehicle routing process, which utilizes the communication of electrified vehicles (EVs) with competing charging stations, to exchange data such as electricity price, energy demand, and time of arrival. The EV routing problem is solved to minimize the total cost of travel using the Dijkstra algorithm with the input from EVs battery management system, electricity price from charging stations, powertrain component efficiencies and transportation network traffic conditions. Through the bidirectional communication of EVs with competing charging stations, EVs’ charging demand estimation is done much more accurately. Then the optimal power flow problem is solved for the power system, to find the locational marginal price at load buses where charging stations are connected. Finally, the electricity prices were communicated from the charging stations to the EVs, and the loop is closed. Locational electricity price acts as the shared parameter between the two optimization problems, i.e., optimal power flow and optimal routing problem. Electricity price depends on the power demand, which is affected by the charging of EVs. On the other hand, location of EV charging stations and their different pricing strategies might affect the routing decisions of the EVs. Our novel approach that combines the electrified transportation with power system operation, holds tremendous potential for solving electrified transportation issues and reducing energy costs. The effectiveness of the proposed approach is demonstrated using Shanghai transportation network and IEEE 9-bus test system. The results verify the cost-savings for both power system and transportation networks.

1. Introduction

1.1. Motivation

Electrified vehicles (EVs) can help reduce national gasoline consumption, greenhouse gas emissions and dependency on foreign oil since they operate partly or entirely on inexpensive electricity. Electricity needed to charge the EVs can be potentially obtained from local, renewable, and less carbon-intensive energy sources [1,2]. However, the incorporation of a large number of EVs into existing power and transportation infrastructures remains a challenging task that needs to be addressed soon [3]. According to [4], China has increased EV utilization vigorously since 2009. The target production and sales numbers of battery-only EVs and plug-in hybrid EVs are expected to be 0.5 million until 2015 and 5 million until 2020 [4]. Furthermore, in the U.S., the government has pledged US $115 million for the installation of electric vehicle charging infrastructure around the states. This ever-increasing use of electric vehicles and charging stations, may affect both power and transportation networks.
Electrified transportation networks and power systems are mutually coupled networks. In the power systems literature, transportation network dynamics has not been comprehensively considered. For instance, electricity price is a function of charging demand, which is a transportation- based parameter. Similarly, optimal power system operation might have a significant impact on transportation, i.e., the availability of battery energy is a function of charging transactions. Battery energy in EVs determines the electric range impacting the transportation network dynamics. At the same time, location of EV parking lots that serve as charging stations also has the potential to change the routes of EVs that need to be charged. Therefore, power and transportation networks should be controlled and optimized together to operate optimally because the decoupled optimization of each standalone network might lead to locally optimum operation. In other words, joint optimization of these networks obtains a more optimum operation point and leads to cost reductions. In this study, we aim to develop a comprehensive framework and methodologies which considers the constraints of both networks to achieve the joint optimal operation. Following, we review the related literature and present our contributions.

1.2. Literature Review

Relevant work can be classified into: (1) EV charging demand estimation; (2) optimal power systems operation with large-scale penetration of EVs; (3) Electrified transportation and route optimization; (4) Interdependent networks. We review each category with detail in the following paragraphs. Finally, we explain our contributions.
Increased energy demand due to EV charging might lead to unwanted peaks in the electricity consumption [5]. Clement-Nyns et al. studied the effect of EV charging on a residential distribution grid in [5], but the effect of EV charging on transportation networks was not addressed. Zhang and Grijalva [6] proposed a data-driven queuing model for residential EV charging demand by performing big data analytics on smart meter measurements. Alizadeh et al. [7] proposed a stochastic model based on queuing theory for the electric vehicle charging demand. Deilami et al. [8] worked on a real-time load management solution for coordinating the charging of multiple plug-in electric vehicles in a smart grid system. Mingfei and Jilai [9] studied the behavior process regularity of the private electric vehicle cluster to model the clusters charging load. Donadee et al. [10] developed a method for optimal autonomous charging of EVs for the estimated energy demand that is based on collected driving patterns. Power system operation requires accurate estimation of the increased energy demand due to EV charging. Hence, we need to quantify the EV charging demand to help power system operator for obtaining more optimal solutions.
EVs have been considered as advantageous resources to improve power system operation [11]. They can act as adjustable energy storage resources and participate in ancillary services procurement [12]. Hence, EV can provide distributed energy storages for power systems [13]. In this context, Yazdani et al. studied the impact of optimal operation of these distributed energy storages on the electricity demand of smart grids including multi-energy systems [14]. In [15], Amini et al. developed an accurate EV charging demand forecaster for stochastic optimal operation of power systems. In [16], a reliability constrained optimization problem is modeled for allocation of EV parking lots in distribution networks. In [17] a two-stage model to allocate EV parking lots in distribution systems considering power loss, network reliability, and voltage deviation is presented. Mohsenzadeh et al. [18] proposed a novel approach to find the optimal location and size of EV public charging stations while considering the distribution network reliability. In [19] demand response strategies are used to offer financial benefits for EVs to optimize charging fees. Although EVs can ameliorate the performance of power systems, they are mobile loads and this should be taken into account while studying the large scale integration of EVs.
Electric vehicles can be seen as mobile loads in a geographic region that will eventually connect to a power system via charging stations. Vehicle routing is the process that connects vehicles with their destinations but also with the power system. There are works that focus on optimal routing through the shortest path for conventional vehicles [20,21,22,23]. Traditionally, route optimization for conventional vehicles has been done through solving shortest path problems. For the solution of shortest path problems, different algorithms have been proposed such as Dijkstra’s Algorithm [20], A* Algorithm, Genetic Algorithms [21], Improved Bellman–Ford Successive Approximation Algorithm [22], Particle Swarm Optimization [23] and Column Generation techniques [24]. Shortest path does not however guarantee the least cost path [25]. There are other factors including traffic, driving patterns, terrain, vehicle load, and air conditioner load, which affect the efficiency of the vehicle and change the cost of travel. Karabasoglu and Michalek [26] investigated the effect of driving patterns on the life cycle cost and emissions of different categories of powertrains under various scenarios and simulated driving conditions. They found that driving patterns matters and have the potential to change the ranking of advanced powertrains for their benefits. Zhang [27] integrated information of road terrain with the energy management systems of hybrid vehicles and showed that the incorporation of terrain review can help reducing the fuel consumption in electric vehicles. Xiao et al. [28] investigated the impact of vehicle load on the classical capacitated vehicle routing problem and found that load is an important factor to consider. Tavares et al. [29] showed that vehicle weight and the inclination of roads affects the efficiency of the vehicle. Their routing strategy increased cost savings by 8%. Artmeier et al. [30] proposed extensions to general shortest-path algorithms, which addressed the problem of energy-based-optimal routing in the presence of rechargeable batteries.
There are studies focused on power system optimization problem while considering the impact of EVs on the electricity demand. Yang et al. in [31] proposed a distributed mixed optimization approach to solve the joint scheduling problem of large-scale smart appliances and batteries. Their objective is to minimize electricity payment, user’s dissatisfaction and battery loss considering the corresponding constraints. Furthermore, they formulated the battery scheduling problem as a mixed-integer linear program which is solved using Benders decomposition technique. In [32], You et al. moved one step further and proposed a model of a battery switching station (BSS) for electric buses (EBs) to solve the EV battery charging scheduling problem. In their model, every EB determines a battery available for switching. In order to compute the optimal schedule, they utilized the dual decomposition to decouple the charging decisions at various charging boxes [32]. The main advantage of our proposed method compared with this study is considering the transportation network model by deploying the optimal routing to determine the EV charging demand. Bashash et al. evaluated the charge pattern optimization of plug-in EVs by defining the timing and rate of obtaining electricity from the power systems. Although they minimized the total cost of electricity and gas as well as the battery health degradation simultaneously [33], the interdependent effects of power and transportation networks are not captured in their proposed solution. Xiong et al. proposed a systematic simulation framework to analyze the effect of plug-in EV charging stations on the power distribution system and transportation networks [34]. Although their method considered some aspects of power and transportation networks, the optimal vehicle routing and the traffic conditions have not taken into account while simulating the transportation network. Further, the communication between EVs and charging stations regarding the charging transactions based on different price schemes was not considered in these studies, which is one of the major contributions of this paper.
There are studies that focused on interdependent power and transportation networks. A comprehensive review of available benchmarks for transportation electrification (TE) simulation is provided in [35]. Viswanath and Farid proposed a holistic transportation-electricity nexus to model the coupled kinematic and electrical states. The proposed hybrid dynamic system model was built on marked petri-net model with the continuous time kinematic and electrical state evolution [36]. Although their model takes both networks into account, it has not considered the information exchange between charging stations, EVs, and power system operator to further achieve cost optimal operation of both networks. Farid in [37] developed a hybrid dynamic system model for transportation electrification. His proposed model included multimodality and multiagency-based transportation network models. Similar to [36], a Petri-net model superimposed on the continuous time kinematic and electrical state evolution was deployed for the hybrid dynamic system modeling purpose. In our proposed method, we provide each EV driver with cost-effective charging stations which are also near the optimal route. The drivers then choose between the candidate charging stations. Farid in [38], argued the requirement for a large scale TE test case, and proposed Symmetrica for modern transportation electrification studies. To this end, Farid defined transportation-electricity Nexus as a system-of-systems including two benchmarks for power system topology and transportation network.

1.3. Contribution of This Paper

In this paper, we introduce a novel framework and methodology to integrate electrified transportation with power system network to obtain a more optimum operating point that reduces costs. Compared to the previous aforementioned studies, we propose a bidirectional information exchange mechanism between power and transportation networks by modeling the interaction of EVs and charging stations; develop a novel routing strategy that considers location and electricity price of charging stations, changing efficiencies of EVs under different traffic situations; and optimize the power system operation with the more accurate electricity demand of EVs and finally feeding the electricity prices back to charging stations in the transportation network which closes the loop. We also implement our methodology using a more realistic model of transportation network with different traffic information and a power network topology. Figure 1 represents the general overview of the proposed framework. We explain the proposed framework in Section 2.
The main contributions of this paper is threefold:
(1)
We propose a novel framework for coupled electrified transportation and power networks to achieve optimal operation. We consider the shared variables between the interdependent networks to evaluate the interaction of two networks;
(2)
We develop a least cost routing strategy for electric vehicles to connect them with competing charging stations and their destinations: Our routing strategy considers charging costs, transportation cost, and traffic situation;
(3)
We analyze the cost benefits of the proposed framework by the simulations using a model of Shanghai transportation and power network. Although the proposed simulation framework captures the interdependent nature of power and transportation networks, there is still some future works to improve the practical aspect of this study. For instance, we use a snapshot of power system load demand for this study, however, future works can be extended to consider the problem in a real-time or near real-time fashion.

1.4. Organization of the Paper

The rest of this paper is organized as follows: Section 2 presents the methodology for the interdependent operation of power and transportation networks. We introduce least cost routing optimization and the details of optimal power flow to determine the locational marginal prices. Case study and simulation results are provided in Section 3. In Section 4 a summary and conclusions are given.

2. Methodology

In this section, we elaborately provide a description of the interdependent nature of power and transportation networks. As we have shown in Figure 1, the transportation network includes the electric vehicles, charging stations and the proposed data aggregators as its basic components. The data aggregators collect the vital information such as the current location, destination, battery size, state of charge, and routing preferences from the electric vehicles and the location, price of electricity from the charging stations. The data aggregators send the charging load demand to the charging stations and the optimal routing solutions to the electric vehicles once the routing problem is solved on the cloud. The charging stations send the total electricity demand to the power network and get the wholesale electricity prices in return. The optimal routes are provided to the electric vehicles based on the traffic and the electricity price at any particular charging station. Our framework not only looks into minimizing the transportation cost for the electric vehicles but also considers the charging cost and value of time. Least cost routing serves as the function that connects EVs (mobile loads on transportation network) with charge stations on power network. By connecting the interdependent networks, the system can estimate the electricity demand for each charging station more accurately so that the power system can optimally balance power generation and consumption to provide a more reliable service.
Here, we summarize three key problems that are addressed in our paper:
  • EVs have stochastic nature on the transportation network and it is difficult to accurately estimate EV charging load for power network.
  • Electric vehicle routing decisions are difficult considering limited energy storage, traffic conditions and multiple charging stations with different price alternatives.
  • Linking the electrified transportation network with the power network is complex and it is difficult to optimize the operation of both networks.
To solve the mentioned issues, we formulate a two-stage optimization problem to perform the route optimization and the power system optimization simultaneously.

2.1. Integration of Interdependent Power and Transportation Networks

The general framework of two-stage optimization problem is shown in Figure 2. As illustrated in the figure, electricity prices are communicated from electric power network to the transportation network. Furthermore, the expected charging demand of each EV charging station is communicated to the power network for updating the results of optimal power flow problem. A more detailed model of our proposed framework is represented in Figure 3. According to this figure, physical network layer includes three main elements and one sub-level element. Power generation units, conventional load demand (before adding parking lots with EV charging capability), and charging stations connected to power network are the main elements. EVs are considered as the sub-level element. After the charging stations receive the locational marginal electricity price from the independent system operator (ISO), send the charging price based on their incentivizing strategy to EVs. The transportation layer is coupled with power network via EVs with different sizes of battery packs. The price signals and EV demand at each charging station are the shared variables. Once, EVs receive the electricity prices from the charging stations, cost-optimal routing is done using traffic information, battery initial state of charge, battery size, and changing EV powertrain efficiency under different traffic conditions.

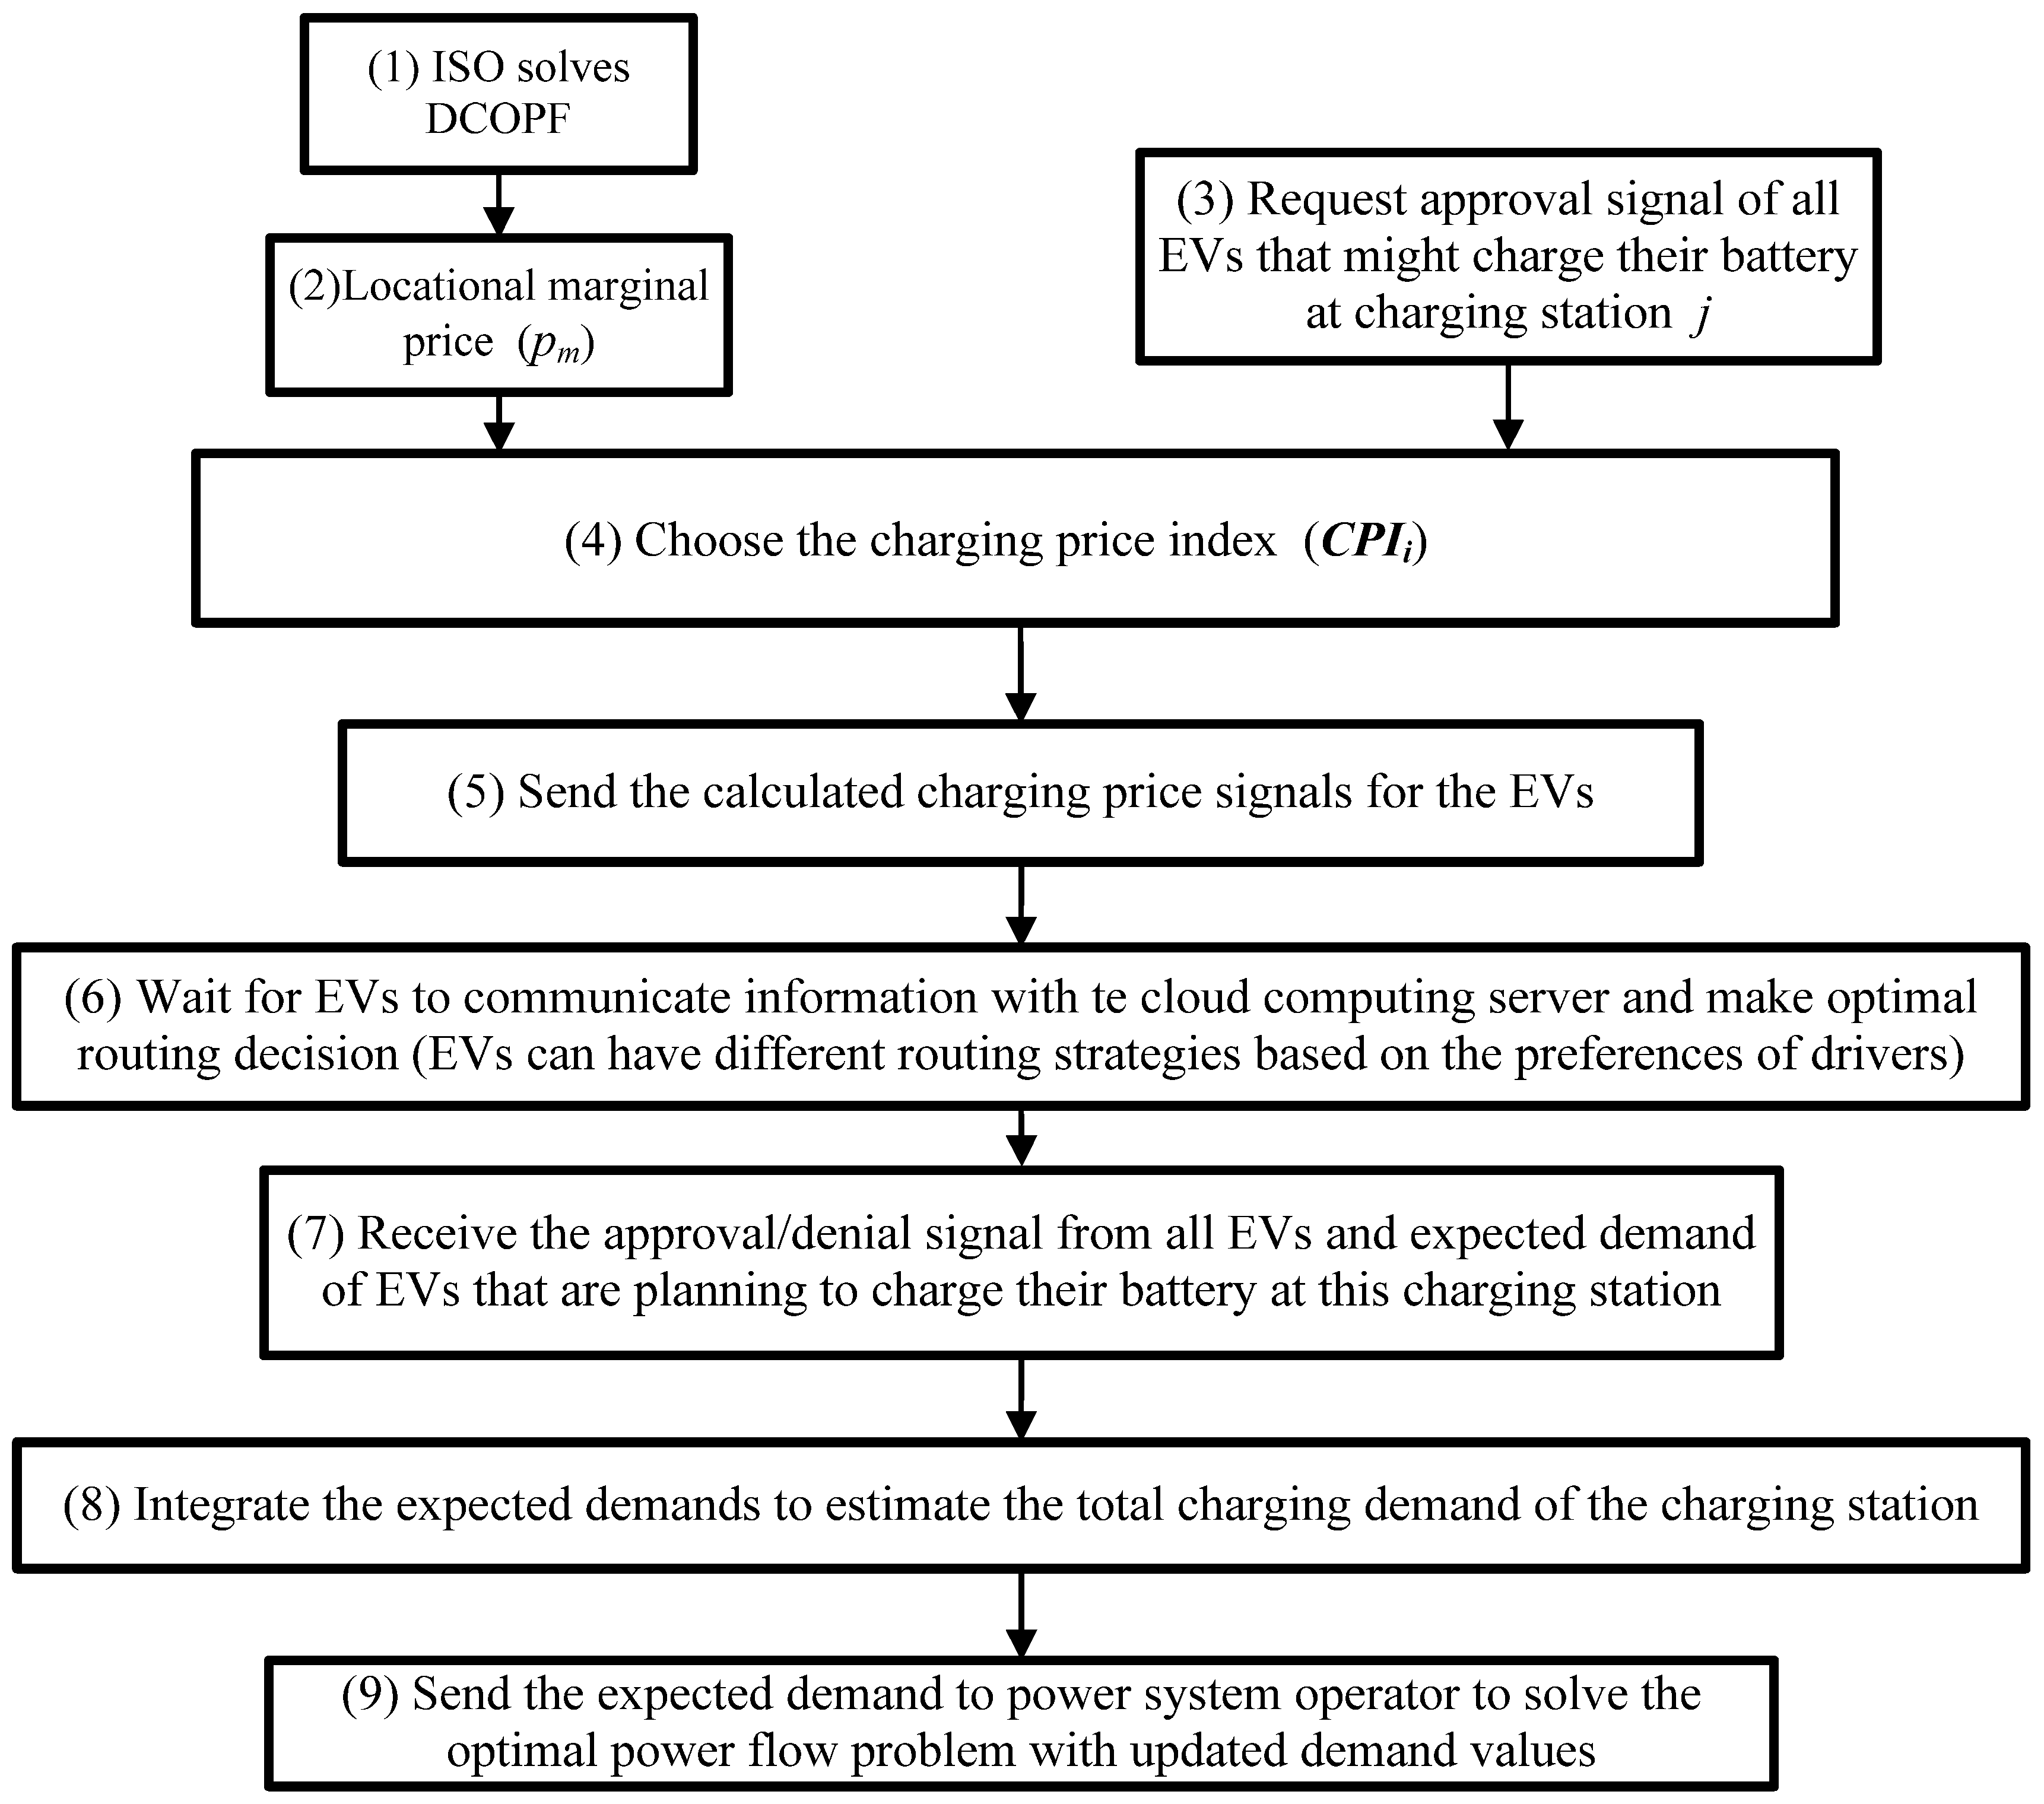
2.2. An Information Exchange Mechanism for EVs and Charging Stations

Algorithms 1 and 2 represent the detailed procedure for the charging stations and EVs to determine the charging electricity price and the optimal route. Note that the EVs have a two stage routing optimization: (1) Primary one-level routing from starting point to the destination; (2) Secondary bi-level routing optimization to determine the optimal routes from current location to the charging station and from the charging station to the destination.
Algorithm 1: Interaction of the charging stations with electric vehicles (EVs) to determine the price signals.
  1. EV charging stations receive the locational marginal prices from the independent system operator (ISO)
  2. EV charging stations receive the signal from each potential EV via cloud computing server whether the EV wants to potentially charge its battery at the charging station
  3. EV charging station receives the expected duration, amount of charge required and distance from each EV
  4. EV charging station determines the electricity price for each EV and communicates the price
   -  go to {Algorithm 2}
  5. Charging stations aggregate the expected EV charging demand based on the approved signals from EV to arrive at the charging station
  6. Charging stations send their expected demands to the ISO for updating price signals for next time step
  7. ISO solved DC Optimal Power Flow (DCOPF) to determine the nodal electricity prices
  8. Go to step 1
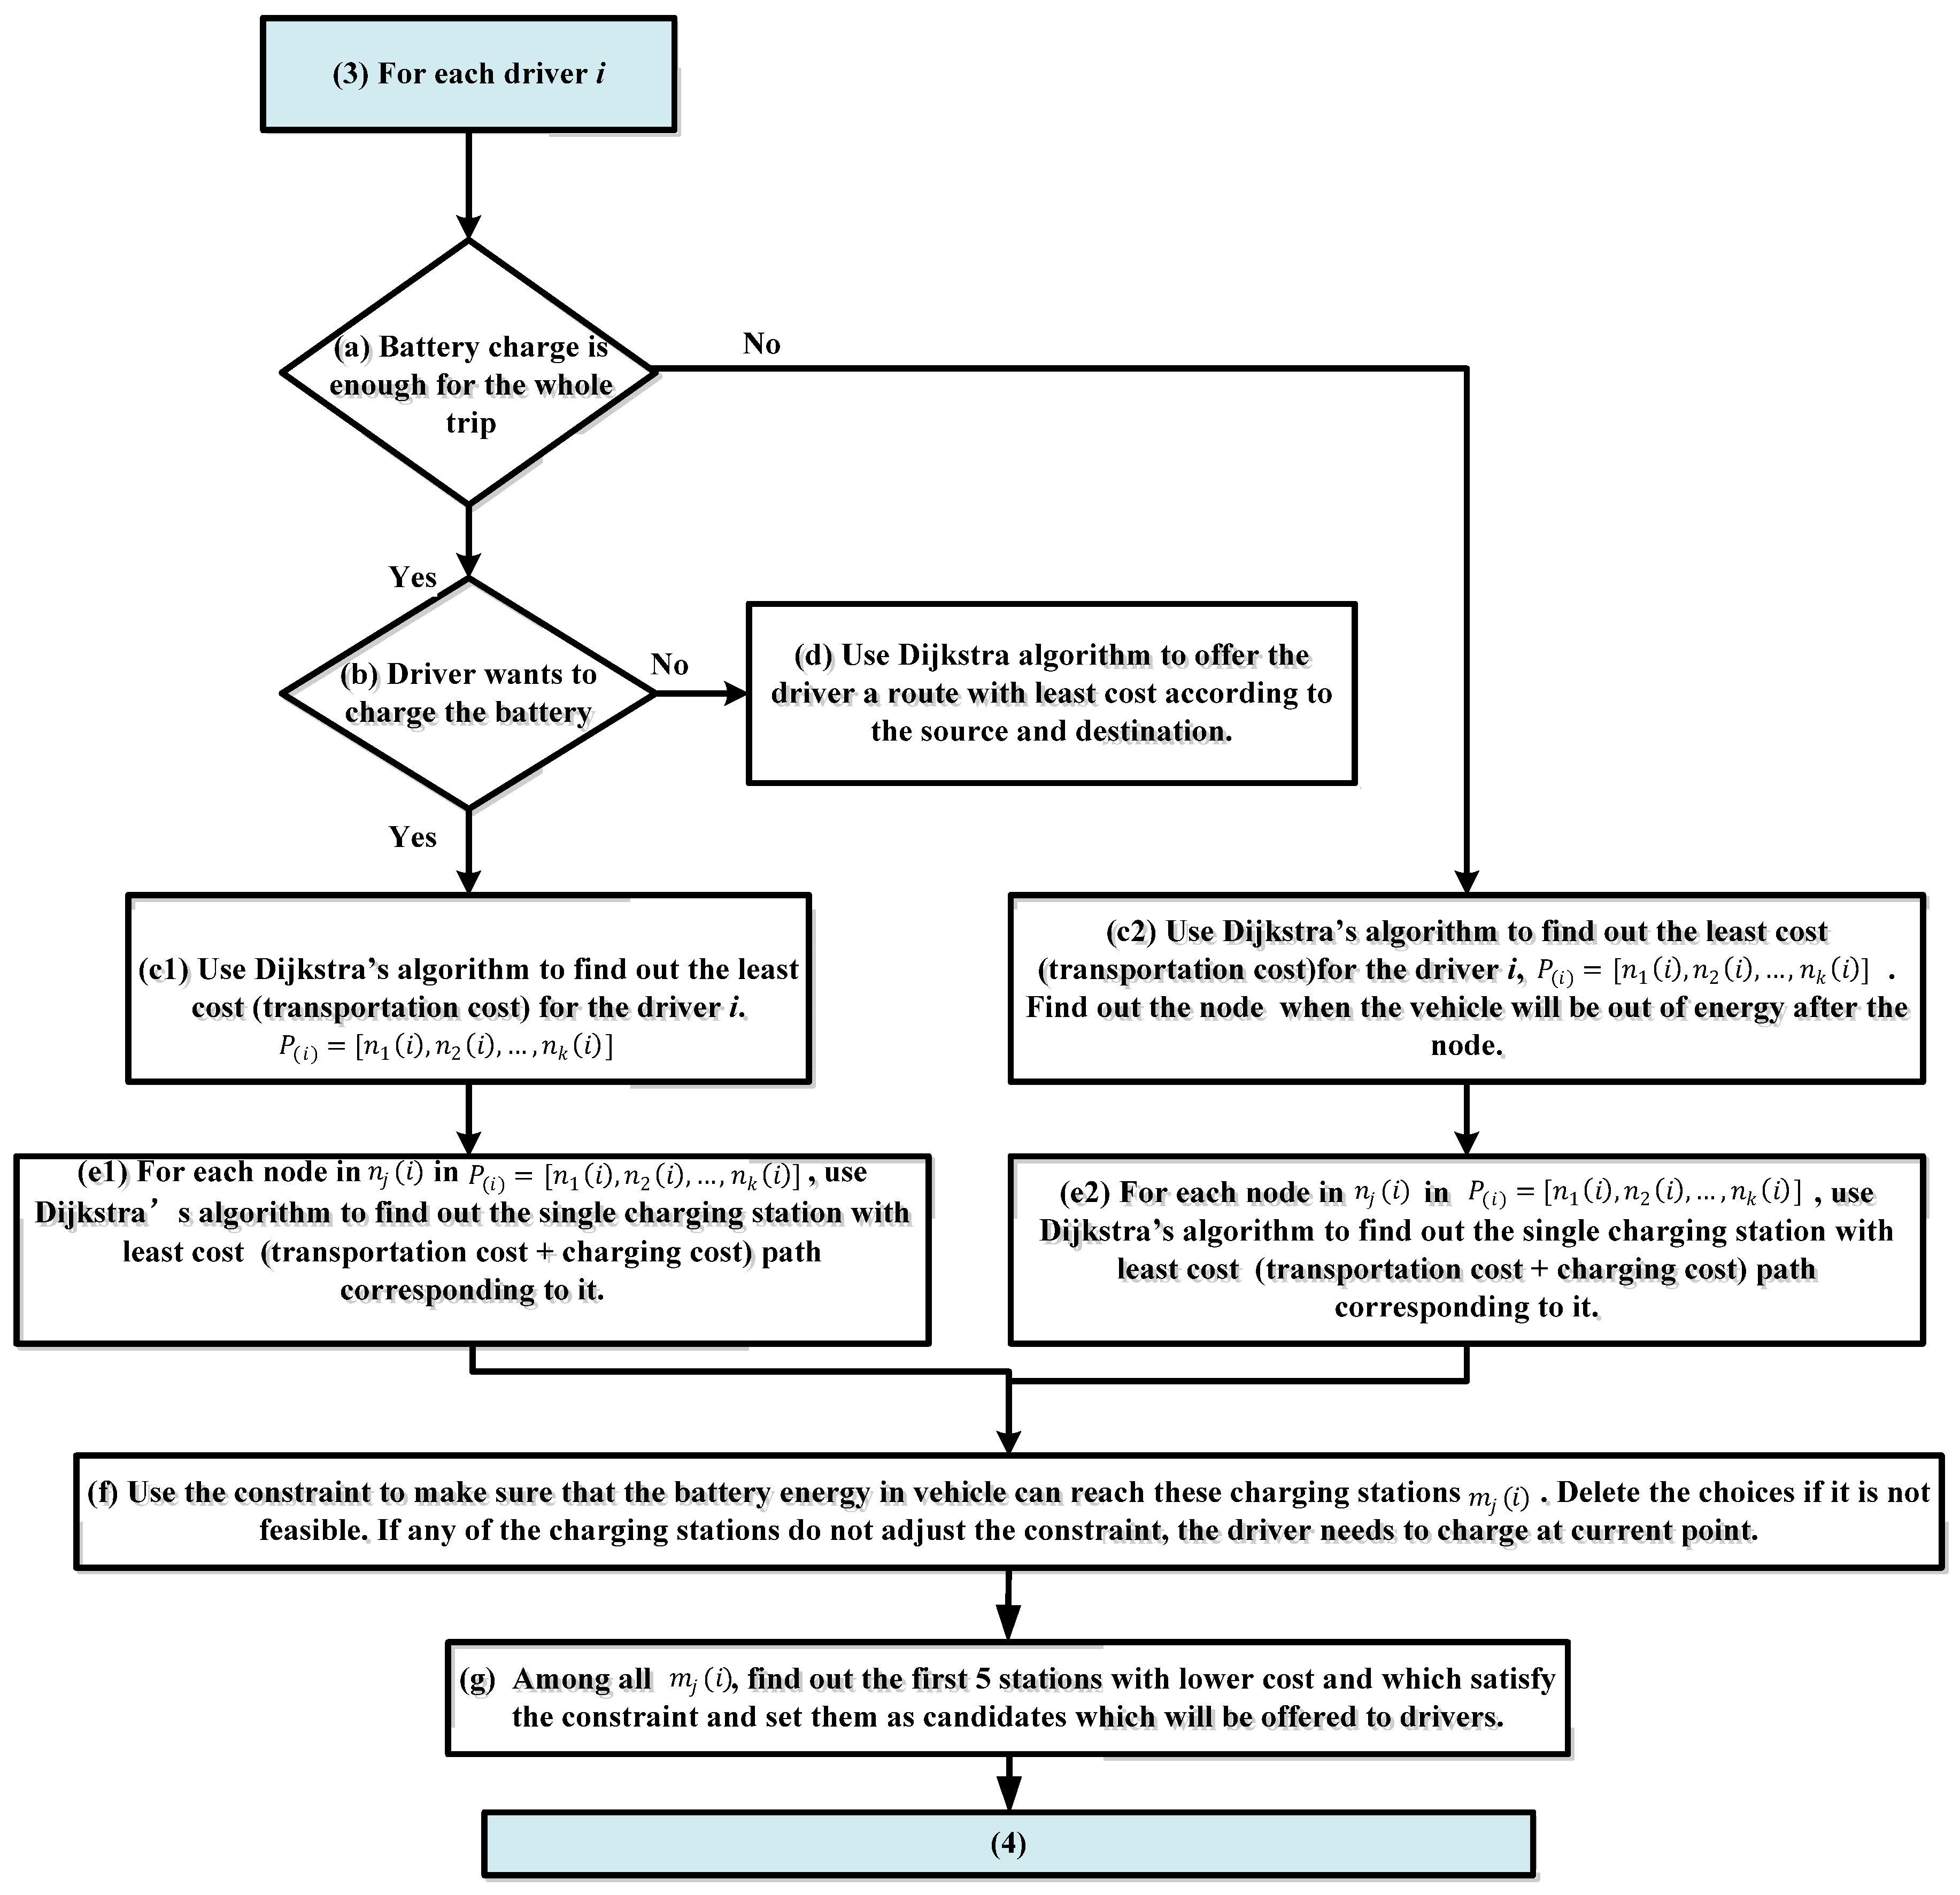
Algorithm 2: EVs to determine the optimal route utilizing bi-level routing scheme.
  1. EVs receive the price signals from all charging stations via cloud computing server
  2. Optimal routing system receives the traffic data from transportation network database
  3. Primary route optimization: EVs receive the optimal route and send a charging request signal to the candidate charging stations
  4. EVs receive the approval signal from charging station
  5. Secondary route optimization: EVs send the data set to the cloud computing server for the purposes of bi-level optimal routing from the starting point to charging station and from the charging station to the destination
  6. EVs receive the suggested optimal routes from cloud computing server

2.2.1. Electric Vehicle Module

The EV module represented in Figure 4, includes the information flow inside each single EV and the data communication between charging stations and cloud EV data center. The Routing Optimization Algorithm which is mentioned in Figure 4, will be elaborately introduced in Figure 5.

2.2.2. Charging Station Module

This module receives the traffic information from the transportation network database and the electricity price signal from the power system operator, denoted by pm. Based on this information the charging station determines the charging price. Figure 6 represents the generalized charging station module. According to this module, EV charging stations receive the locational marginal prices from the ISO. Then, the EV charging stations receive the signal from each potential EV via cloud computing server whether the EV wants to potentially charge its battery at the charging station. In next step, EV charging station determines the electricity price for each EV and communicates the price. The price signals broadcast to EVs so that they can determine the optimal route using the proposed method, referred to as Charging Station Strategy-Vehicle Powertrain Connected Routing Optimization (CSS-VPCRO) method. Charging stations aggregate the expected EV charging demand based on the approved signals from EV to arrive at the charging station. They send their expected demands to the ISO for updating price signals for next time step.
We assume that each charging station uses a fixed charging price which is determined by the charging station facility based on the number of charging requests, the location of charging station (downtown, vicinity, or residential area) and other factors of interest. We define the Charging station Profit-margin Index to represent the profit margin of charging stations as the difference between the price determined by the charging station and the locational marginal price sent by ISO. This index shows the percentage of the price deviation for the profit of charging station. If the locational marginal price at the charging station bus is shown as p i and the offered price to EVs by the ith parking lot is denoted by p i CS then the Charging station Profit-margin Index, denoted by C P I i can be calculated using the following equation:
C P I i = p i CS p i p i × 100
Charging stations can apply different price incentives and change p i to maximize their profits depending on various factors such as capacity usage, parking space limitations, wholesale electricity price, and competition strategy against other charging stations.

2.3. Vehicle Powertrain Connected Route Optimization Considering Charging Stations with Price Incentives

In this section, we introduce the methodology for our proposed least cost optimal routing strategy for EVs considering charging stations with different price incentives. Our methodology builds on the vehicle powertrain connected routing optimization (VPCRO) proposed in [25]. Qiao and Karabasoglu proposed a novel routing approach considering the interaction between vehicle powertrains and traffic situations and their impact on the segment cost of the traffic network. They showed that shortest path is not necessarily the least-cost path and least cost paths can significantly change based on the powertrain type. If the vehicle powertrain is electrified, then battery capacity and initial battery state of charge also affect the least cost routes [25]. In this paper, we build on VPCRO and considers the bidding mechanism between EVs and charging stations while determining the least-cost route in a dynamically changing traffic network where network segments have different traffic levels (traffic levels change the efficiency of vehicle powertrain components, thus transportation cost). We refer to this approach as “Charging Station Strategy-Vehicle Powertrain Connected Routing Optimization (CSS-VPCRO)”.
The percentage of the trip that will efficiently be covered on electricity before the need for a recharge or battery swap depends on the vehicle type, battery size, initial battery state of the charge (SOC) and traffic conditions [25]. The proposed routing strategy in this paper, illustrated in Figure 5, takes into account all the aforementioned factors and provides least-cost optimal path. The Battery Management System (BMS) provides the battery information via the wired or wireless On Board Diagnostics (OBD) scanner that can access the information on the Control Area Network (CAN) bus of the vehicle. The data collection unit sends the vehicle data (location, destination, current state of charge, and battery size.) to the data aggregator. Data collection device can be a smart phone or GPS device. The data aggregator sends the vehicle and the transport network information to the cloud server and gets the electricity price and the optimized routes to the destination passing through the optimum charging station for each individual EV. This information is then send to the EV’s data collection unit and the driver is informed about the optimal routes.
The routing process for electrified vehicles is illustrated in Figure 7. After the origin and the destination are determined for each trip, the vehicle is examined to see if its battery carries enough energy for the intended trip. If there is enough energy, then the optimal path is found using VPCRO and noted as P ( i ) = [ n 1 ( i ) ,   n 2 ( i ) ,   ,   n k ( i ) ] . Then for each node, n j ( i ) on the path, the nearest charging station m j is found. The algorithm chooses n charging stations with the least cost along the route. These options are presented to the driver and driver chooses one of them. If there is not enough charge in the battery to cover the whole trip, the vehicle should be charged either at the origin, or at one point during the trip before it runs out of the energy. Our algorithm determines the node at which the vehicle runs out of charge and offers the routing solution to the driver. Note that this Routing Optimization Algorithm is used in the EV module presented in Figure 4.
The VPCRO method was proposed in [25]. It is based on the algorithm which was firstly introduced by Dijkstra [39] and was later utilized for different applications including optimal routing in transportation networks. The theoretical details of this method are thoroughly introduced in [40]. The transportation network is represented by a graph, consisting of n nodes, niN, where N is the set of all nodes in the network. Transportation network graph is directed and the segment, s i j S, connects node n i to n j , where S is the set of all segments in the network. We use Shanghai transportation network for the case study where the set N consists of 352 nodes denoted by n i and each node is assigned an index number i and associated with the corresponding 2-D coordinates collected from Google Maps. The 2-D coordinates are shown as longitude n i lon and latitude n i lat in unit meters for the node n i . The set S contains 615 segments s i j of the network. Each segment is associated with weight information w s i j d   and   w s i j c which correspond to the distance, d s i j , and the transportation cost of the segment in terms of energy consumption, respectively.
We choose the traffic conditions on Monday 8:30 a.m. for city of Shanghai which is categorized into three states: heavy, normal and low traffic jam. These traffic conditions can be mimicked by certain driving patterns since traffic flow organizes the speed of the vehicle over time. It is assumed that the traffic conditions of each segment can be approximated by certain driving patterns. For low traffic conditions, the Highway Fuel Economy Test (HWFET) driving cycle is employed which means that the road condition is similar to driving on highway. For normal traffic conditions, the Urban Dynamometer Driving Schedule (UDDS) driving cycle is chosen. For the segments with high traffic, the New York City (NYC) driving cycle is used since it reflects the conditions of driving in heavy traffic just like New York City with frequent stop and go.
For our study, we have considered four types of electrified vehicles: plug-in hybrid electric vehicles (PHEVs) with three different battery sizes and a Battery Electric Vehicle (BEV). PHEVx stands for a PHEV that can cover x miles by using only electricity. After x miles, PHEV switches to charge sustaining mode which means that gasoline is used as the energy source to cover the rest of the trip. BEV100 stands for a BEV that can travel 100 miles on electricity before needing a recharge. Table 1. Represents the detail information of these PHEV types. As well as BEV.
Range extended PHEVs can be operated in two modes: the charge-depleting mode (CD) and charge-sustaining mode (CS). CD refers to a mode of electrified vehicle operation which relies on energy from the battery. Once the battery is depleted reaching at the target state of charge, the electrified vehicle changes its operation mode to CS, in which gasoline is used to provide all net propulsion energy and the electrical energy is utilized only as momentary storage to improve fuel economy [26]. The vehicle efficiencies under different driving patterns comes from the literature for CD and CS operation modes and details of simulations can be found in [26].
The distance between two nodes ni and nj on the transportation network is defined by the equation below:
d s i j = { C d ( n i lon n j lon ) 2 + ( n i lat n j lat ) 2 , If   n i   and   n j   are   connected ,   Else
where C d = 62.137 mile/m is the scaling factor used to convert latitude and longitude data gathered from Google Maps from meters to miles.
Cost of each segment c s i j on the transportation network depends on the vehicle type (PHEVx or BEV), unit energy cost (pgas and pele for gasoline and electricity, respectively), vehicle efficiencies (µCD and µCS under CD mode and CS mode, respectively) and the remaining available battery energy of electric vehicles E s i j r e m when they enter the segment s i j .
We give the cost equations for an arbitrary segment s i j for different kinds of electrified vehicles below:
w s i j = c { p g a s d s i j µ C S , if   E s i j r e m 0 ,   for   PHEVs p e l e d s i j µ C D , if   E s i j r e m d s i j µ C D ,   for   PHEVs ( p ele E s i j r e m +   p gas d s i j µ CD E s i j r e m µ CS ) ,   else   for   PHEVs p ele d s i j µ C D ,   for   BEVs
E s i j i n i is the initial available energy which is calculated by using the sensory information from the battery (battery capacity, current SOC and battery swing) at the beginning of the segment s i j [25,26]. The remaining energy in the battery after leaving segment s i j is denoted by E s i j r e m . For the road segment between node i and j, the relation between these values can be represented as (4):
E s i j r e m = E s i j i n i d s i j µ C D
The calculation of least cost path is much more complicated due to the trade-off between using motor or engine, which use gasoline and electricity that has different costs, and also factors like traffic conditions, vehicle powertrain type and initial battery SOC. The main difference for energy consumption between these vehicles is the efficiency of vehicles when they are driving under different road conditions. We can define the path-finding problem as an optimization problem with the following objective functions:
Least   travel   cost :   min ( ( i , j ) R w s i j c )
where R is the set of possible paths from the initial node to the goal node, i and j are the indices of the nodes in the path. Using the algorithm and methods in [25], we determine the least cost paths for each type of vehicles for each Origin-Destination (O-D) pairs. In addition to the objective function in (5) which is used for least cost optimal routing, we consider the expected charging cost of each EV at each candidate charging station as the charging cost.

Breadth First Search Algorithm

When the travel path is determined for drivers using VPCRO [25], Breadth-first-search (BFS) algorithm [41] is applied to search nearby charging stations for drivers. BFS is a method for exploring a graph/tree data structures. It begins at the tree root (initial point for the EV drivers) and explores the neighbor nodes first, before moving to the next level neighbors. For each node among the travel path, we find the nearest charging station to reach one located on the optimal route. Then we choose five candidate charging stations among these cases. Offering several charging stations helps the drivers to have more options to decide for charging their battery. After finding five nearest charging stations, we proceed with choosing the charging station with least cost.
For the searching part, the beginning point is the passing node along the whole path of the trip. We use (6) which applies the equations of distance, the scaling factor of the search radius (k), and the search radius denoted by d s e a r c h =   100   m . n i lon and n i lat are the longitude and latitude of the current node on the obtained optimal route, and k = 1 . Then we can get the longitude and latitude range of charging stations for the first searching area. If there is no qualified charging station then k = k + 1 until we find out the first charging station candidate for this passing node. The level of cost effectiveness of the set that contains the possible charging stations for each node depends on the search radius and the number of charging stations considered as candidates. Equation (6) verifies that whether the corresponding charging station is located in the search area. n c h j lat and n c h j lon denote the latitude and longitude of the charging station j. Furthermore, C d = 62.137 mile/m is the scaling factor used to convert latitude and longitude data gathered from Google Maps from meters to miles:
C d ( n i lon n c h j lon ) 2 + ( n i lat n c h j lat ) 2 k × d s e a r c h

2.4. Solving Optimal Power Flow Problem for Locational Marginal Electricity Prices

Balancing between load and supply is the main task of the independent system operator (ISO) to find the generation levels given the predicted load [42,43]. Optimal power flow (OPF) problem is solved to determine the economically-optimal operating points of the power systems and to calculate the output power of each generator [42,44]. In order to use DC optimal power flow (DCOPF) we need to make some assumptions [45,46] such as: voltage angle differences being small, line resistance being negligible, and voltage profiles being flat. After solving DCOPF problem, ISO determines the locational marginal prices (LMPs). LMPs can be used as a pricing index to determine the value of electricity at each node [47]. It has been widely-used for energy pricing to reflect the value of electricity at each node [48].
In order to minimize the total power system generation cost, we solve DCOPF problem [43]. The updated load demand (compared with conventional load demand without EV charging demand) includes the EV charging demand. Hence, in order to achieve an accurate EV charging demand estimation, we consider EVs’ routing optimization problem. To this end, we add the total hourly-estimated charging demand of EVs to the demand. Then, we solve the DCOPF problem, which is a minimization problem of the general form shown in (7):
min x f ( X ) s . t . g ( X ) = 0 h ( X ) 0
In this problem, the control variables are the active power outputs, while the state variables are the voltage angles at the buses. Given the following notations for the parameters and variables, we define the optimization problem as (8).
s y s : Set of buses in the system; G : Set of all generators; G i : Set of generators at the ith bus; L i : Set of lines in the system incident on ith bus (all buses connected to bus i); D : Set of buses to which loadis connected; P G i : Output of generator i; P D i : Demand at bus i; C i ( P G i ) : Quadratic cost function of generator i; B i j : The element in the susceptance matrix in ith row and jth column; θ i : Voltage angle at the ith bus; and F i j : Flow in the line joining ith bus and jth bus:
min P g i , θ i i G ( a i + b i P g i + c i P g i 2 )
s . t .   k G i P g i P L i j L i B i j × ( θ i θ j ) = 0 , i s y s
P G i m i n P G i P G i m a x , i G
| B i j × ( θ i θ j ) | F i j m a x , i , j s y s
θ 1 = 0
where (8.1) is the total cost of generation of the entire system, (8.2) shows the nodal power balance of all buses, (8.3) enforces the generation limits, (8.4) represents the line flow limits, and (8.5) ensures the fact that slack bus has zero voltage angle. The Lagrange function for the general form shown in (7) is defined as (9):
( X , λ , μ ) = f ( X ) + λ T g ( X ) + μ T h ( X )
where λ and μ are the Lagrange multiplier vectors for equality and inequality constraints respectively and g ( X ) and h ( X ) are set of equality and inequality constraints, respectively.
The Lagrange multiplier vector, which corresponds to the equality constraint, includes the negative value of the LMP at each bus. The LMP values are then used as the inputs for the charging station pricing strategy. We assume that all charging stations at each region are connected to an electrical power bus. This corresponding bus broadcast the obtained electricity price to its connected charging stations. The loop is closed here, i.e., charging stations communicate with EVs regarding the electricity bids and update the expected demand of each EV. After performing one iteration, the expected electricity demand is broadcasted to power system operator which is used to solve the optimal power flow problem and update the LMPs iteratively.

3. Case Study and Simulation Results

In this section, we present our results in three categories: we introduce the analyzed power and transportation network topologies. Then we evaluate the power systems and transportation network operation with and without using the proposed framework.

3.1. Proposed Power and Transportation Network Test Systems

The one line diagram of modified IEEE 9-bus test system before load demand modifications is depicted in Figure 8 and updated parameters are shown in Table 2. As shown in the figure, there are six regions for charging stations. These regions are connected to the power system using six distinct buses.
We modify the load demand values at the load points. The updated values are shown in Table 2. This table also includes the maximum number of EVs that can be served (parked and charged) in each region. Charging stations at each region are connected to the power network via specific load points as shown in Figure 8.
According to [49], the number of EVs in China is estimated to be 0.3 million in 2015. 15% of these vehicles are estimated to be used in Shanghai [49]. In order to obtain a practical test system, we evaluate our proposed framework by considering 45,000 EVs. The details of the modeling of the Shanghai transportation network is given in Section 2.3. Figure 9 illustrates the Shanghai constructed traffic network for the simulation purposes based on Google map information and Figure 10 shows the charging stations in each region based on their electrical connection point to the power network. The light, medium and heavy conditions are denoted with three colors: green, orange, and purple, respectively and charging stations are represented with squares.
We use randomly-generated stochastic origin and destination (O-D) pairs to simulate traffic. Furthermore, we consider the penetration level of PHEV20, PHEV40, PHEV60, and BEV100 to be 16%, 16%, 16%, and 52%, respectively. The distribution of utilized charging profit index (CPI) values for all of the 50 charging stations is presented in Figure 11. In this study we assumed that the efficiency of charging stations is 100%.

3.2. Power Systems and Transportation Network Operation With and Without Using the Proposed Framework in Presence of PHEVs

In order to evaluate the effectiveness of our proposed framework, we compare the optimal routes for three randomly chosen trips in our case study. Further, we find the total transportation cost of each region for both scenarios: with and without the proposed methods. Finally, the electricity price values and total power system operation cost is compared.

3.2.1. Impact of the Simultaneous Optimization on Vehicle Routing

The key contribution of this study is to propose a comprehensive framework that takes the interdependent nature of power and transportation networks into account and the routing strategy is only one part of the proposed framework. Further, we developed a novel routing strategy which is competitive with the current applications in the EV market for the routing purpose, such as Tesla Model S traffic-based routing software [50], in terms of considering practical constraints from both power and transportation networks, e.g., varying electricity price signals and traffic conditions. Figure 12 shows the impact of our proposed methodology for the optimal joint operation of transportation and power networks on the cost-optimal routes of randomly selected three electrified vehicles from our case study. Columns of the Figure 12 show (1) the traffic conditions of the transportation network; (2) cost-optimal routing result using VPCRO and finally (3) cost-optimal routing result using CSS-VPCRO from left to right. Rows a–c in Figure 12 denote the cases for three different EVs. The blue points represent the available charging stations and the squared blue points represent the selected charging station on the cost optimal path. For the first randomly selected EV (Figure 12a) in the first scenario that is shown in the middle map, charging stations 39, 40, 41, and 42 have the same electricity price (5 cents/kWh) because they are located in the same region. Thus, CPI = 0% for all charging stations. VPCRO chooses charging station 41 since it is in the proximity of the cost optimal route. The reason for not choosing charging stations 39 and 40 (while having the same charging cost as 41) is the maximum achievable SOC at the destination. In other words, if the driver charges its EV at 39 or 40 to a certain level, the battery SOC will be less that the case of charging at 41 to the same SOC. In the second scenario for the first EV (right map), the CPI values for charging stations 6, 39, 40, 41, and 30 are 9.9%, 10.8%, 11.3%, 7.6%, and 1.1%, respectively. The new routing result shows that although there are three charging station located on the optimal route, our algorithm selected charging station 30 as the optimal one to purchase electricity. The reason for not choosing charging station 6 with the lower price (4.8 cents/kWh) is the heavy traffic conditions. As the left map in Figure 12a represents, the whole path to reach charging station 6 is under heavy traffic condition (purple color). However, some parts of the path towards charging station 50 have average traffic which makes it a more optimal option. Similar explanations hold for the second EV (Figure 12b). For the third EV, the CPI value of charging stations 33 and 24 in the second scenario are 1.5% and 9.2%, respectively. Hence, the routing algorithm chooses charging station 33. Results show that interaction of EVs with charging stations during vehicle routing changes the optimal routes. It is also worth noting that there is a trade-off between travel time and charging cost for some cases, for instance, the shortest distance routing strategy provides a faster route compared with the case that we consider the charging station pricing strategy in Figure 12c.

3.2.2. Impact of the Simultaneous Optimization on EV Charging Demand and Electricity Price

Figure 13 and Figure 14 show the total charging demand and total transportation cost for six regions under three scenarios: (1) without charging station pricing strategy under fixed electric price signals from power systems, i.e., the results of DCOPF does not affect the optimal route; (2) with charging station pricing strategy under fixed electric price signals from power systems, i.e., each charging station updates its price signal independently but still the DCOPF is not considered; and (3) with charging station pricing strategy and considering electricity price signals based on DCOPF.
The proposed optimal operation strategy of the interdependent power and transportation networks reduces the total transportation cost of each region, as well as the total charging demand as shown in Figure 13 and Figure 14. It also validates the performance of our strategy in terms of motivating EVs to use the cost-effective routes which passes through the charging stations with lower price signals.
Figure 13 shows that the fixed price signals without charging station pricing strategy (Scenario I) will lead to higher charging demand compared to the cases where the charging stations modify the price signals to attract the EV drivers. Furthermore, for the scenarios II and III (with a charging station pricing strategy), after considering the price variations of power systems, the charging demand of some regions will increase, while some regions experience charging demand reduction. This reveals the effect of power system price signals on EV drivers to change their route to use more cost effective charging stations at another region. For instance, power system price variation will reduce the electricity price in region 3. Consequently, more EVs will charge their battery in this region and it will increase the total charging demand of this region. In other words, ignoring the effect of EV charging demand on the electricity price will deteriorate the optimal operation point of both power and transportation networks. Scenario I highlights the effect of fixed electricity prices (ignoring power systems reaction to load increase incurred by EV charging stations) on the total EV charging demand. Note that higher EV charging demand leads to the following consequences: (1) increasing the transportation cost; and (2) increasing the total power system operation cost. One of the main advantages of our proposed framework is modeling the interdependency of power and transportation networks to obtain a more realistic optimal operating point for both networks. Our framework considers the effect of EV charging demand on the electricity price in power systems. It also models the effect of the electricity price variations on the optimal routing of EVs in transportation network by deploying the novel CSS-VPCRO routing approach. There are two influential reasons for the considerable electricity demand reduction due to the deployment of our proposed CSS-VPCRO by the EV drivers:
(1)
We consider the penetration level of PHEV20, PHEV40, PHEV60, and BEV100 to be 16%, 16%, 16%, and 52%, respectively. This will lead to more flexibility for the PHEVs, who are 48% of total cars in this study, to reduce their electricity consumption to optimize their transportation cost. In other words, 48% of the vehicles are capable of using fuel as an alternative for electricity if the offered charging electricity price from the charging stations is comparatively high.
(2)
Although the shortest path method only takes the distance into account, our CSS-VPCRO takes the traffic conditions into account as well. Consequently, it may choose a longer distance with light traffic condition which leads to energy saving, rather than a shorter distance with congested traffic which leads to higher energy consumption.
According to Figure 14, fixed price signals without a charging station pricing strategy will lead to higher charging cost compared to the cases where the charging stations change the price signals. Furthermore, for scenarios II and III (with a charging station pricing strategy), after considering the price variations of power systems, the charging cost of some regions will increase. It shows the impact of different electricity price values on the optimal routing strategy of EV drivers. In other words, when there is a cheaper charging station in another region, EVs prefer to choose a more energy-consuming route to charge their battery more economically. As we mentioned, the EV drivers optimize their charging cost. Hence, they might choose a longer distance which leads to a lower charging cost by using a cheaper charging station. The price difference between scenarios II and III is not considerable. The reason is the small variations of electricity price due to charging demand effect on the power systems operation.
Our analysis validates the effectiveness of the proposed framework in terms of reducing total power systems cost as well as transportation networks costs as shown in Table 3. It also includes the additional cost incurred by integrating electric vehicle charging stations into the power networks. Note that we consider the total payment of all EVs corresponding to electricity cost as the total transportation cost. The total power systems cost due to conventional load before integration of EV charging is $15,308.
According to results of Table 3 and Figure 15 our proposed framework for optimal operation of power and transportation networks reduced the additional power system cost introduced by the EV charging demand. In other words, using a charging station pricing strategy while finding the optimal route will reduce both power systems and transportation network costs occurred by electricity consumption. It also helps drivers charge their EVs at lower price. Furthermore, we showed the effect of neglecting electricity price variations due to the additional EV charging demand (Scenario I) on the total incurred cost for both networks. Eventually, the effect of charging station strategy on the additional cost for power systems is presented. As the results show, comparing Scenarios I and II reflects the effect of charging station strategy on the total EV charging cost. It is worth noting that when both charging stations and power systems price variations are considered (Scenario III), total EV charging cost is increased compared to the case where we neglect power systems price variations (Scenario II). It verifies the fact that optimizing the interdependent networks with more details and considering different agents’ objective functions will affect the total cost for both networks.

3.3. Power Systems and Transportation Network Operation With and Without Using the Proposed Framework in Absence of PHEVs

As we mentioned in the simulation platform description, we consider the penetration level of PHEV20, PHEV40, PHEV60, and BEV100 to be 16%, 16%, 16%, and 52%, respectively. This assumption may affect the results due to the availability of an alternative energy source for PHEVs to maintain their required energy while the electricity price is increased. In order to evaluate the effect of the proposed framework on battery-only EVs we performed the simulation assuming that 100% of the electrified vehicles are only using the electricity as their source of energy for driving.
Figure 16 shows that the fixed price signals without charging station pricing strategy (Scenario I) can lead to higher or lower charging demand at different regions compared to the cases where the charging stations modify the price signals to attract the EV drivers. Furthermore, the total charging demand in the second scenario is reduced by 1.82% that reflects the effect of charging station strategy on the charging demand of battery-only EVs. It is worth noting that in some regions the demand is reduced which means the charging stations’ strategies of those regions were not successful to attract EV drivers. On the other hand, the regions with an increase in the EV charging demand in the second scenario, such as regions 2 and 6, include promising strategies to motivate EV drivers. Hence, some drivers updated their route to take advantage of cheaper charging stations in another region while maintaining the optimal decision from their origin to the destinations. It usually happens for the drivers who are passing from the border of two neighboring regions. Furthermore, for the scenarios II and III (with charging station pricing strategy), after considering the price variations of power systems, the charging demand of some regions will increase, while some regions experience charging demand reduction. This reveals the effect of power system price signals on EV drivers to change their route to use more cost effective charging stations at another region. For instance, power system price variation will reduce the electricity price in region 5. Consequently, more EVs will charge their battery in this region and it will increase the total charging demand of this region. In other words, ignoring the effect of EV charging demand on the electricity price will deteriorate the optimal operation point of both power and transportation networks, i.e., we will find a more feasible and near-optimal solution by taking the interdependent effects of the two networks into account. This will make the obtained solution more practical and realistic compared with the available methods in the literature that ignore the interdependent effects of EV routing decisions, charging stations, and power system operators on each other’s solution. In other words, our method provides each entity with a more realistic solution which leads to a triple-win situation. In this context, our optimal solution may not converge exactly to the same solution as finding the optimal operation of each network independently and ignoring the mutual effects of each network’s operation point on the other networks.
It is also worth noting that the total charging demand in scenario III is reduced by 3.32% compared with scenario I. It also is reduced by 1.53% compared with scenario II. This reveals the effect of power systems electricity price on the EVs routing decision.
According to results of Table 4, when all of the electrified vehicles are battery-only vehicles our proposed framework for optimal operation of power and transportation networks reduced the additional power system cost introduced by the EV charging demand. Compared with the previous case that we considered the presence PHEVs, the total power systems cost and the total transportation cost due to the charging cost have less reduction.

4. Conclusions

In this paper we propose a novel framework for interdependent power and electrified transportation networks. To this end we have proposed an iterative least cost vehicle routing process that utilizes the communication of electric vehicles (EVs) with competing charging stations to exchange data such as electricity price, energy demand, and time of arrival. Charging station strategy—vehicle power train connected routing optimization (CSS-VPCRO) is utilized for the least cost routing optimization purpose. In order to find the electricity price at each region we solved the DC optimal power flow problem. Charging stations communicate the updated electricity prices (based on their pricing strategy and locational marginal prices from optimal power flow) to EVs. Nodal electricity price acts as the shared parameter among the two optimization problems, i.e., optimal power flow and optimal routing problem. Electricity price depends on power demand which is affected by charging of EVs. Location of EV charging stations and their different price schemes might affect the routing decisions of EVs.
The effectiveness of the proposed approach is evaluated using Shanghai transportation network and IEEE 9-bus test system. We divided the transportation network into 6 regions. Each of these regions assumed to be supplied from one of the load points of the IEEE 9-bus test system. The simulations results for 45,000 EVs validates the outperformance of the proposed framework in terms of both total cost and total energy demand. The additional cost incurred by electrifying the transportation network is reduced from 14.1% (for the conventional routing schemes) to 8.8% for the proposed simultaneous optimization of power and transportation networks in the presence of PHEVs. Consequently, the simulation results validated the performance of our framework in three main directions:
  • Reducing the transportation cost by 40.9% for the analyzed electrified transportation network in the presence of PHEVs;
  • Reducing the transportation cost by 8.6% for the analyzed electrified transportation network in the absence of PHEVs (in this case we only have battery-only EVs in the transportation network);
  • Total power system cost is reduced: Our framework considers the locational marginal price of electricity to obtain the optimal route. However, in the conventional shortest path method the EVs only consider traffic conditions to find the optimal route.
Although this study proposed a comprehensive framework for the interdependent operation of power and transportation networks, there are some simplifying assumptions. Hence, future work can focus on modeling of the uncertainties in the transportation networks and stochastic traffic situation. We plan to extend this work in the following two major directions:
  • Real-time/near real-time simulation of the proposed interdependent power and transportation network framework
  • Considering both inter-area and intra-area time resolutions for economic dispatch in power systems while performing the simulation results. This will make the study more realistic in terms of considering different time-scales from power systems perspective.

Acknowledgments

The authors would like to acknowledge the valuable inputs and fruitful comments from Marija D. Ilić from MIT (Carnegie Mellon University (CMU)) to the main idea of this article. The quality of this paper has substantially improved based on her insightful inputs. We also would like to thank Zhiqian Qiao from CMU for her help with the transportation system simulation and members of the Laboratory for Intelligent Vehicles and Energy Systems (LIVES) for their useful comments. M. Hadi Amini would like to thank Paul Weng for his continuous support at the School of Electronics and Information Technology, Sun Yat-sen University from November 2016 to December 2017.

Author Contributions

Authors have worked on this manuscript together.

Conflicts of Interest

The authors declare no conflict of interest.

References

  1. Bradley, T.H.; Frank, A.A. Design, demonstrations and sustainability impact assessments for plug-in hybrid electric vehicles. Renew. Sustain. Energy Rev. 2009, 13, 115–128. [Google Scholar] [CrossRef]
  2. Samaras, C.; Meisterling, K. Life cycle assessment of greenhouse gas emissions from plug-in hybrid vehicles: Implications for policy. Environ. Sci. Technol. 2008, 42, 3170–3176. [Google Scholar] [CrossRef] [PubMed]
  3. Amini, M.H.; Moghaddam, M.P.; Karabasoglu, O. Simultaneous allocation of electric vehicles’ parking lots and distributed renewable resources in smart power distribution networks. Sustain. Cities Soc. 2017, 28, 332–342. [Google Scholar] [CrossRef]
  4. Zhou, G.; Ou, X.; Zhang, X. Development of electric vehicles use in China: A study from the perspective of life-cycle energy consumption and greenhouse gas emissions. Energy Policy 2013, 59, 875–884. [Google Scholar] [CrossRef]
  5. Clement-Nyns, K.; Haesen, E.; Driesen, J. The impact of charging plug-in hybrid electric vehicles on a residential distribution grid. IEEE Trans. Power Syst. 2010, 25, 371–380. [Google Scholar] [CrossRef] [Green Version]
  6. Zhang, X.; Grijalva, S. An advanced data driven model for residential electric vehicle charging demand. In Proceedings of the IEEE Power & Energy Society General Meeting, Denver, CO, USA, 26–30 July 2015; pp. 1–5. [Google Scholar]
  7. Alizadeh, M.; Scaglione, A.; Davies, J.; Kurani, K.S. A scalable stochastic model for the electricity demand of electric and plug-in hybrid vehicles. IEEE Trans. Smart Grid 2014, 5, 848–860. [Google Scholar] [CrossRef]
  8. Deilami, S.; Masoum, A.S.; Moses, P.S.; Masoum, M.A. Real-time coordination of plug-in electric vehicle charging in smart grids to minimize power losses and improve voltage profile. IEEE Trans. Smart Grid 2011, 2, 456–467. [Google Scholar] [CrossRef]
  9. Mingfei, B.A.N.; Jilai, Y.U. Procedural simulation method for aggregating charging load model of private electric vehicle cluster. J. Mod. Power Syst. Clean Energy 2015, 3, 170–179. [Google Scholar]
  10. Donadee, J.; Ilic, M.; Karabasoglu, O. Optimal autonomous charging of electric vehicles with stochastic driver behavior. In Proceedings of the IEEE Vehicle Power and Propulsion Conference (VPPC), Coimbra, Portugal, 27–30 October 2014; pp. 1–6. [Google Scholar]
  11. Amini, M.H.; McNamara, P.; Weng, P.; Karabasoglu, O.; Xu, Y. Hierarchical Electric Vehicle Charging Aggregator Strategy Using Dantzig-Wolfe Decomposition. IEEE Des. Test 2017. [Google Scholar] [CrossRef]
  12. Kempton, W.; Tomić, J. Vehicle-to-grid power fundamentals: Calculating capacity and net revenue. J. Power Sources 2005, 144, 268–279. [Google Scholar] [CrossRef]
  13. Lund, H.; Kempton, W. Integration of renewable energy into the transport and electricity sectors through V2G. Energy Policy 2008, 36, 3578–3587. [Google Scholar] [CrossRef]
  14. Yazdani-Damavandi, M.; Moghaddam, M.P.; Haghifam, M.R.; Shafie-khah, M.; Catalão, J.P. Modeling operational behavior of plug-in electric vehicles’ parking lot in multi energy systems. IEEE Trans. Smart Grid 2016, 7, 124–135. [Google Scholar] [CrossRef]
  15. Amini, M.H.; Kargarian, A.; Karabasoglu, O. ARIMA-based decoupled time series forecasting of electric vehicle charging demand for stochastic power system operation. Electric Power Syst. Res. 2016, 140, 378–390. [Google Scholar] [CrossRef]
  16. Amini, M.H.; Islam, A. Allocation of Electric Vehicles’ Parking Lots in Distribution Network. In Proceedings of the IEEE PES 5th Innovative Smart Grid Technologies Conference (ISGT 2014), Washington, DC, USA, 19–22 February 2014. [Google Scholar]
  17. Neyestani, N.; Damavandi, M.Y.; Shafie-khah, M.; Catalao, J.P. Modeling the PEV traffic pattern in an urban environment with parking lots and charging stations. In Proceedings of the 2015 IEEE Eindhoven Power Tech, Eindhoven, The Netherlands, 29 June–2 July 2015; pp. 1–6. [Google Scholar]
  18. Mohsenzadeh, A.; Pang, C.; Pazouki, S.; Haghifam, M. Optimal siting and sizing of electric vehicle public charging stations considering smart distribution network reliability. In Proceedings of the IEEE North American Power Symposium (NAPS), Charlotte, NC, USA, 4–6 October 2015. [Google Scholar]
  19. Chen, Q.; Liu, N. Optimal Power Utilizing Strategy for PV-based EV Charging Stations Considering Real-Time Price. In Proceedings of the 2014 IEEE Conference and Expo Transportation Electrification Asia-Pacific (ITEC Asia-Pacific), Beijing, China, 31 August–3 September 2014; pp. 1–6. [Google Scholar]
  20. Eklund, P.W.; Kirkby, S.; Pollitt, S. A dynamic multi-source Dijkstra’s algorithm for vehicle routing. In Proceedings of the IEEE Australian and New Zealand Conference on Intelligent Information Systems, Adelaide, SA, Australia, 18–20 November 1996; pp. 329–333. [Google Scholar]
  21. Ahn, C.W.; Ramakrishna, R.S. A genetic algorithm for shortest path routing problem and the sizing of populations. IEEE Trans. Evolut. Comput. 2002, 6, 566–579. [Google Scholar]
  22. Goldberg, A.V.; Radzik, T. A heuristic improvement of the Bellman-Ford algorithm. Appl. Math. Lett. 1993, 6, 3–6. [Google Scholar] [CrossRef]
  23. Mohemmed, A.W.; Sahoo, N.C.; Geok, T.K. Solving shortest path problem using particle swarm optimization. Appl. Soft Comput. 2008, 8, 1643–1653. [Google Scholar] [CrossRef]
  24. Chabrier, A. Vehicle routing problem with elementary shortest path based column generation. Comput. Oper. Res. 2006, 33, 2972–2990. [Google Scholar] [CrossRef]
  25. Qiao, Z.; Karabasoglu, O. Vehicle Powertrain Connected Route Optimization for Conventional, Hybrid and Plug-in Electric Vehicles. arXiv, 2016; arXiv preprint. arXiv:1612.01243. [Google Scholar]
  26. Karabasoglu, O.; Michalek, J. Influence of driving patterns on life cycle cost and emissions of hybrid and plug-in electric vehicle powertrains. Energy Policy 2013, 60, 445–461. [Google Scholar] [CrossRef]
  27. Zhang, C.; Vahidi, A.; Pisu, P.; Li, X.; Tennant, K. Role of terrain preview in energy management of hybrid electric vehicles. IEEE Trans. Veh. Technol. 2010, 59, 1139–1147. [Google Scholar] [CrossRef]
  28. Xiao, Y.; Zhao, Q.; Kaku, I.; Xu, Y. Development of a fuel consumption optimization model for the capacitated vehicle routing problem. Comput. Oper. Res. 2012, 39, 1419–1431. [Google Scholar] [CrossRef]
  29. Tavares, G.; Zsigraiova, Z.; Semiao, V.; Carvalho, M. Optimisation of MSW collection routes for minimum fuel consumption using 3d GIS modelling. Waste Manag. 2009, 29, 1176–1185. [Google Scholar] [CrossRef] [PubMed]
  30. Artmeier, A.; Haselmayr, J.; Leucker, M.; Sachenbacher, M. The shortest path problem revisited: Optimal routing for electric vehicles. In Annual Conference on Artificial Intelligence; Springer: Berlin/Heidelberg, Germany, 2010. [Google Scholar]
  31. Yang, Z.; Long, K.; You, P.; Chow, M.Y. Joint scheduling of large-scale appliances and batteries via distributed mixed optimization. IEEE Trans. Power Syst. 2015, 30, 2031–2040. [Google Scholar] [CrossRef]
  32. You, P.; Yang, Z.; Zhang, Y.; Low, S.H. Optimal Charging Schedule for a Battery Switching Station Serving Electric Buses. IEEE Trans. Power Syst. 2016, 31, 3473–3483. [Google Scholar] [CrossRef]
  33. Bashash, S.; Moura, S.J.; Forman, J.C.; Fathy, H.K. Plug-in hybrid electric vehicle charge pattern optimization for energy cost and battery longevity. J. Power Sources 2011, 196, 541–549. [Google Scholar] [CrossRef]
  34. Xiong, J.; Zhang, K.; Guo, Y.; Su, W. Investigate the Impacts of PEV Charging Facilities on Integrated Electric Distribution System and Electrified Transportation System. IEEE Trans. Transp. Electr. 2015, 1, 178–187. [Google Scholar] [CrossRef]
  35. Allan, D.F.; Farid, A.M. A Benchmark Analysis of Open Source Transportation-Electrification Simulation Tools. In Proceedings of the 2015 IEEE 18th International Conference on Intelligent Transportation Systems (ITSC), Las Palmas, Spain, 15–18 September 2015; pp. 1202–1208. [Google Scholar]
  36. Viswanath, A.; Farid, A.M. A hybrid dynamic system model for the assessment of transportation electrification. In Proceedings of the IEEE American Control Conference, Portland, OR, USA, 4–6 June 2014. [Google Scholar]
  37. Farid, A.M. A Hybrid Dynamic System Model for Multimodal Transportation Electrification. IEEE Trans. Control Syst. Technol. 2016, 25, 940–951. [Google Scholar] [CrossRef]
  38. Farid, A.M. Symmetrica: Test case for transportation electrification research. Infrastruct. Complex. 2015, 2, 1–10. [Google Scholar] [CrossRef]
  39. Dijkstra, E.W. A note on two problems in connexion with graphs. Numer. Math. 1959, 1, 269–271. [Google Scholar] [CrossRef]
  40. Skiena, S. Dijkstra’s algorithm. In Implementing Discrete Mathematics: Combinatorics and Graph Theory with Mathematica; Addison-Wesley: Reading, MA, USA, 1990; pp. 225–227. [Google Scholar]
  41. Zhou, R.; Hansen, E.A. Breadth-first heuristic search. Artif. Intell. 2006, 170, 385–408. [Google Scholar] [CrossRef]
  42. Zhu, J. Optimization of Power System Operation; John Wiley & Sons: NJ, USA, 2015. [Google Scholar]
  43. Amini, M.H.; Jaddivada, R.; Mishra, S.; Karabasoglu, O. Distributed security constrained economic dispatch. In Proceedings of the IEEE Innovative Smart Grid Technologies-Asia (ISGT ASIA), Bangkok, Thailand, 3–6 November 2015. [Google Scholar]
  44. Mehrtash, M.; Kargarian, A.; Mohammadi, A. A partitioning-based bus renumbering effect on interior point-based OPF solution. In Proceedings of the IEEE Power and Energy Conference (TPEC), College Station, TX, USA, 8–9 February 2018. [Google Scholar]
  45. Mohammadi, J.; Hug, G.; Kar, S. Agent-Based Distributed Security Constrained Optimal Power Flow. IEEE Trans. Smart Grid 2016. [Google Scholar] [CrossRef]
  46. Stott, B. Review of load-flow calculation methods. Proc. IEEE 1974, 62, 916–929. [Google Scholar] [CrossRef]
  47. Ott, A. PJM: A full service ISO market evolution (panel on evolution of electricity market structures). Power Eng. Soc. Summer Meet. IEEE 1999, 2, 746–748. [Google Scholar]
  48. Alvey, T.; Goodwin, D.; Ma, X.; Streiffert, D.; Sun, D. A security-constrained bid-clearing system for the New Zealand wholesale electricity market. IEEE Trans. Power Syst. 1998, 13, 340–346. [Google Scholar] [CrossRef]
  49. Shanghai Electric Vehicle Charging Infrastructure Special Plan (2016-2020). Available online: http://www.evpartner.com/news/12/detail-18938.html (accessed on September 2016).
  50. Tesla Model S Software Release Notes v6.0. Available online: https://www.tesla.com/sites/default/files/Tesla_Model_S_Software_6.0.pdf (accessed on January 2017).
Figure 1. General framework for simultaneous operation of electrified transportation and power networks.
Energies 11 00196 g001
Figure 2. General two-stage optimization problem.
Energies 11 00196 g002
Figure 3. Schematic view of the proposed framework for the optimal operation of transportation and power networks.
Energies 11 00196 g003
Figure 4. Electric vehicle module representation.
Energies 11 00196 g004
Figure 5. Least cost optimal routing strategy for EVs considering charging stations with different price incentives. BMS: battery management system; CAN: control area network; OBD: on board diagnostics.
Energies 11 00196 g005
Figure 6. Charging station module representation. ISO: Independent System Operator.
Energies 11 00196 g006
Figure 7. Routing optimization flowchart.
Energies 11 00196 g007
Figure 8. One line diagram of modified IEEE 9-bus test system.
Energies 11 00196 g008
Figure 9. Topology of analyzed Shanghai transportation network with charging stations.
Energies 11 00196 g009
Figure 10. Distribution of the charging stations in specified geographical regions.
Energies 11 00196 g010
Figure 11. Distribution of the profit margins for the charging stations.
Energies 11 00196 g011
Figure 12. Simulated paths with different routing strategies and electricity price signals: vehicle power train connected routing optimization (VPCRO) and Charging Station Strategy-VPCRO (CSS-VPCRO).
Energies 11 00196 g012
Figure 13. Total charging demand of each region under various scenarios in the presence of PHEVs.
Energies 11 00196 g013
Figure 14. Total charging demand of each region under various scenarios.
Energies 11 00196 g014
Figure 15. Total charging cost and total power system cost for one hour in presence of PHEVs.
Energies 11 00196 g015
Figure 16. Total charging cost and total power system cost for one hour in the absence of PHEVs (we only consider battery-only EVs in this case study).
Energies 11 00196 g016
Table 1. The specifications of the electrified vehicles used for the case study. HWFET: highway fuel economy test; UDDS: urban dynamometer driving schedule; NYC: New York city.
Vehicle TypeSymbolUnitHWFETUDDSNYC
PHEV20 μ C D *mi/kWh5.76.24.2
μ C S mi/gal58.669.445.7
PHEV40 μ C D mi/kWh5.76.04.1
μ C S mi/gal58.268.043.1
PHEV60 μ C D mi/kWh5.65.73.8
μ C S mi/gal57.865.840.3
BEV100 μ C D mi/kWh4.85.23.1
* µ is the efficiency of the vehicle under specific driving conditions.
Table 2. Load demand and maximum capacity of electric vehicle charging stations at each bus.
Bus Number123456789
Load demand (MWh)020000120101604080
Region indexNCS *1NCSNCS23456
Max charging station capacityNCS500NCSNCS5007006005001500
Number of charging stationsNCS7NCSNCS586816
* NCS: No charging station.
Table 3. Comparison between total power systems cost and transportation network cost for different scenarios in the presence of PHEVs.
ScenarioIIIIII
Total power system cost (USD)17,476165,6816,677
Total transportation network cost (USD)216512701287
Additional power system cost (compared to the base case)14.14%8.30%8.36%
Table 4. Comparison between total power systems cost and transportation network cost for different scenarios in the absence of PHEVs.
ScenarioIIIIII
Total power system cost (USD)18,72018,53018,427
Total transportation network cost (USD)340932193116
Additional power system cost (compared to the base case)22.27%21.02%20.35%

