A Critical Analysis and Validation of the Accuracy of Wave Overtopping Prediction Formulae for OWECs


Department of Civil Engineering, Ghent University, Technologiepark 904, 9052 Zwijnaarde, Belgium
*
Author to whom correspondence should be addressed.
Energies 2018, 11(1), 133; https://doi.org/10.3390/en11010133
Submission received: 4 December 2017
/
Revised: 19 December 2017
/
Accepted: 28 December 2017
/
Published: 5 January 2018
(This article belongs to the Section I: Energy Fundamentals and Conversion)
Abstract
:The development of wave energy devices is growing in recent years. One type of device is the overtopping wave energy converter (OWEC), for which the knowledge of the wave overtopping rates is a basic and crucial aspect in their design. In particular, the most interesting range to study is for OWECs with steep slopes to vertical walls, and with very small freeboards and zero freeboards where the overtopping rate is maximized, and which can be generalized as steep low-crested structures. Recently, wave overtopping prediction formulae have been published for this type of structures, although their accuracy has not been fully assessed, as the overtopping data available in this range is scarce. We performed a critical analysis of the overtopping prediction formulae for steep low-crested structures and the validation of the accuracy of these formulae, based on new overtopping data for steep low-crested structures obtained at Ghent University. This paper summarizes the existing knowledge about average wave overtopping, describes the physical model tests performed, analyses the results and compares them to existing prediction formulae. The new dataset extends the wave overtopping data towards vertical walls and zero freeboard structures. In general, the new dataset validated the more recent overtopping formulae focused on steep slopes with small freeboards, although the formulae are underpredicting the average overtopping rates for very small and zero relative crest freeboards.
1. Introduction
Climate change and the associated sea level rise has caused a change in the policies of governments around the globe, impulsing the move from fossil fuels to renewable energies. The European Union has been one of the leaders in this process by presenting in 2010 an ambitious plan within the framework of the Europe 2020 strategy to limit the effects of climate change. By 2020, the greenhouse gas emissions should be a 20% lower than 1990 levels, 20% of energy should come from renewable sources, and there should be an increase in the energy efficiency of 20%. To achieve these targets the blue energy field and the research on wave energy has been developing in recent years, covering different types of wave energy converters (WECs).
One type of WEC is the overtopping wave energy converter (OWEC), based on the working principle of waves running-up a slope and overtopping (i.e., kinetic and potential energy of the waves) into a reservoir (potential energy), which is emptied into the ocean through a set of low-head turbines, generating electricity [1]. Various OWEC prototypes were developed in the past for offshore and onshore application. The Wave Dragon [2] and the WaveCat [3] are offshore OWECs, with a working principle based on a floating structure with reflectors to guide the incoming waves towards a ramp in front of a reservoir where the water is collected. An onshore OWEC integrates a reservoir within a sea defence structure such a breakwater at a lower level than the crest of the sea defence structure in order to capture the overtopped water of the incident waves. Examples of onshore OWECs developed are the Tapchan (Tapered Channel Wave Power Device) [4], the SSG (Seawave Slot-cone Generator) [5] (a multi-level OWEC with three reservoirs on top of each other) and, more recently, the OBREC (Overtopping BReakwater for Energy Conversion) [6].
The geometry is a major consideration when designing an OWEC, as its design will determine the run-up and overtopping at the crest of the device. For OWEC design, the prediction of wave overtopping is crucial to correctly assess the capacity and production of the OWEC, and to design a structurally safe device.
Research progress on sea defence structures can be of use when predicting overtopping as the wave overtopping research of this type of structures is very extensive, as shown in the EurOtop (2007) manual [7] and the updated EurOtop published in 2016 [8]. However, while a sea defence structure protecting the coast requires a minimization of the overtopping rates for extreme wave conditions, an OWEC should be designed to maximize the overtopping rates (usually for operational wave conditions) and therefore the electricity output. This is only possible for ranges of geometries for sea defence structures previously unexplored in the scientific literature.
Kofoed [9] developed further the idea of using the overtopping research initially focusing on sea defence structures for application for OWEC research. Based on physical model tests of fixed OWECs with a limited draft, a uniform slope and a single reservoir, he obtained correction factors for the overtopping prediction formula published in the EurOtop (2007) manual [7]. With these correction factors, the range of the prediction formula is extended towards ranges of slope angles and crest freeboards more suitable for OWECs.
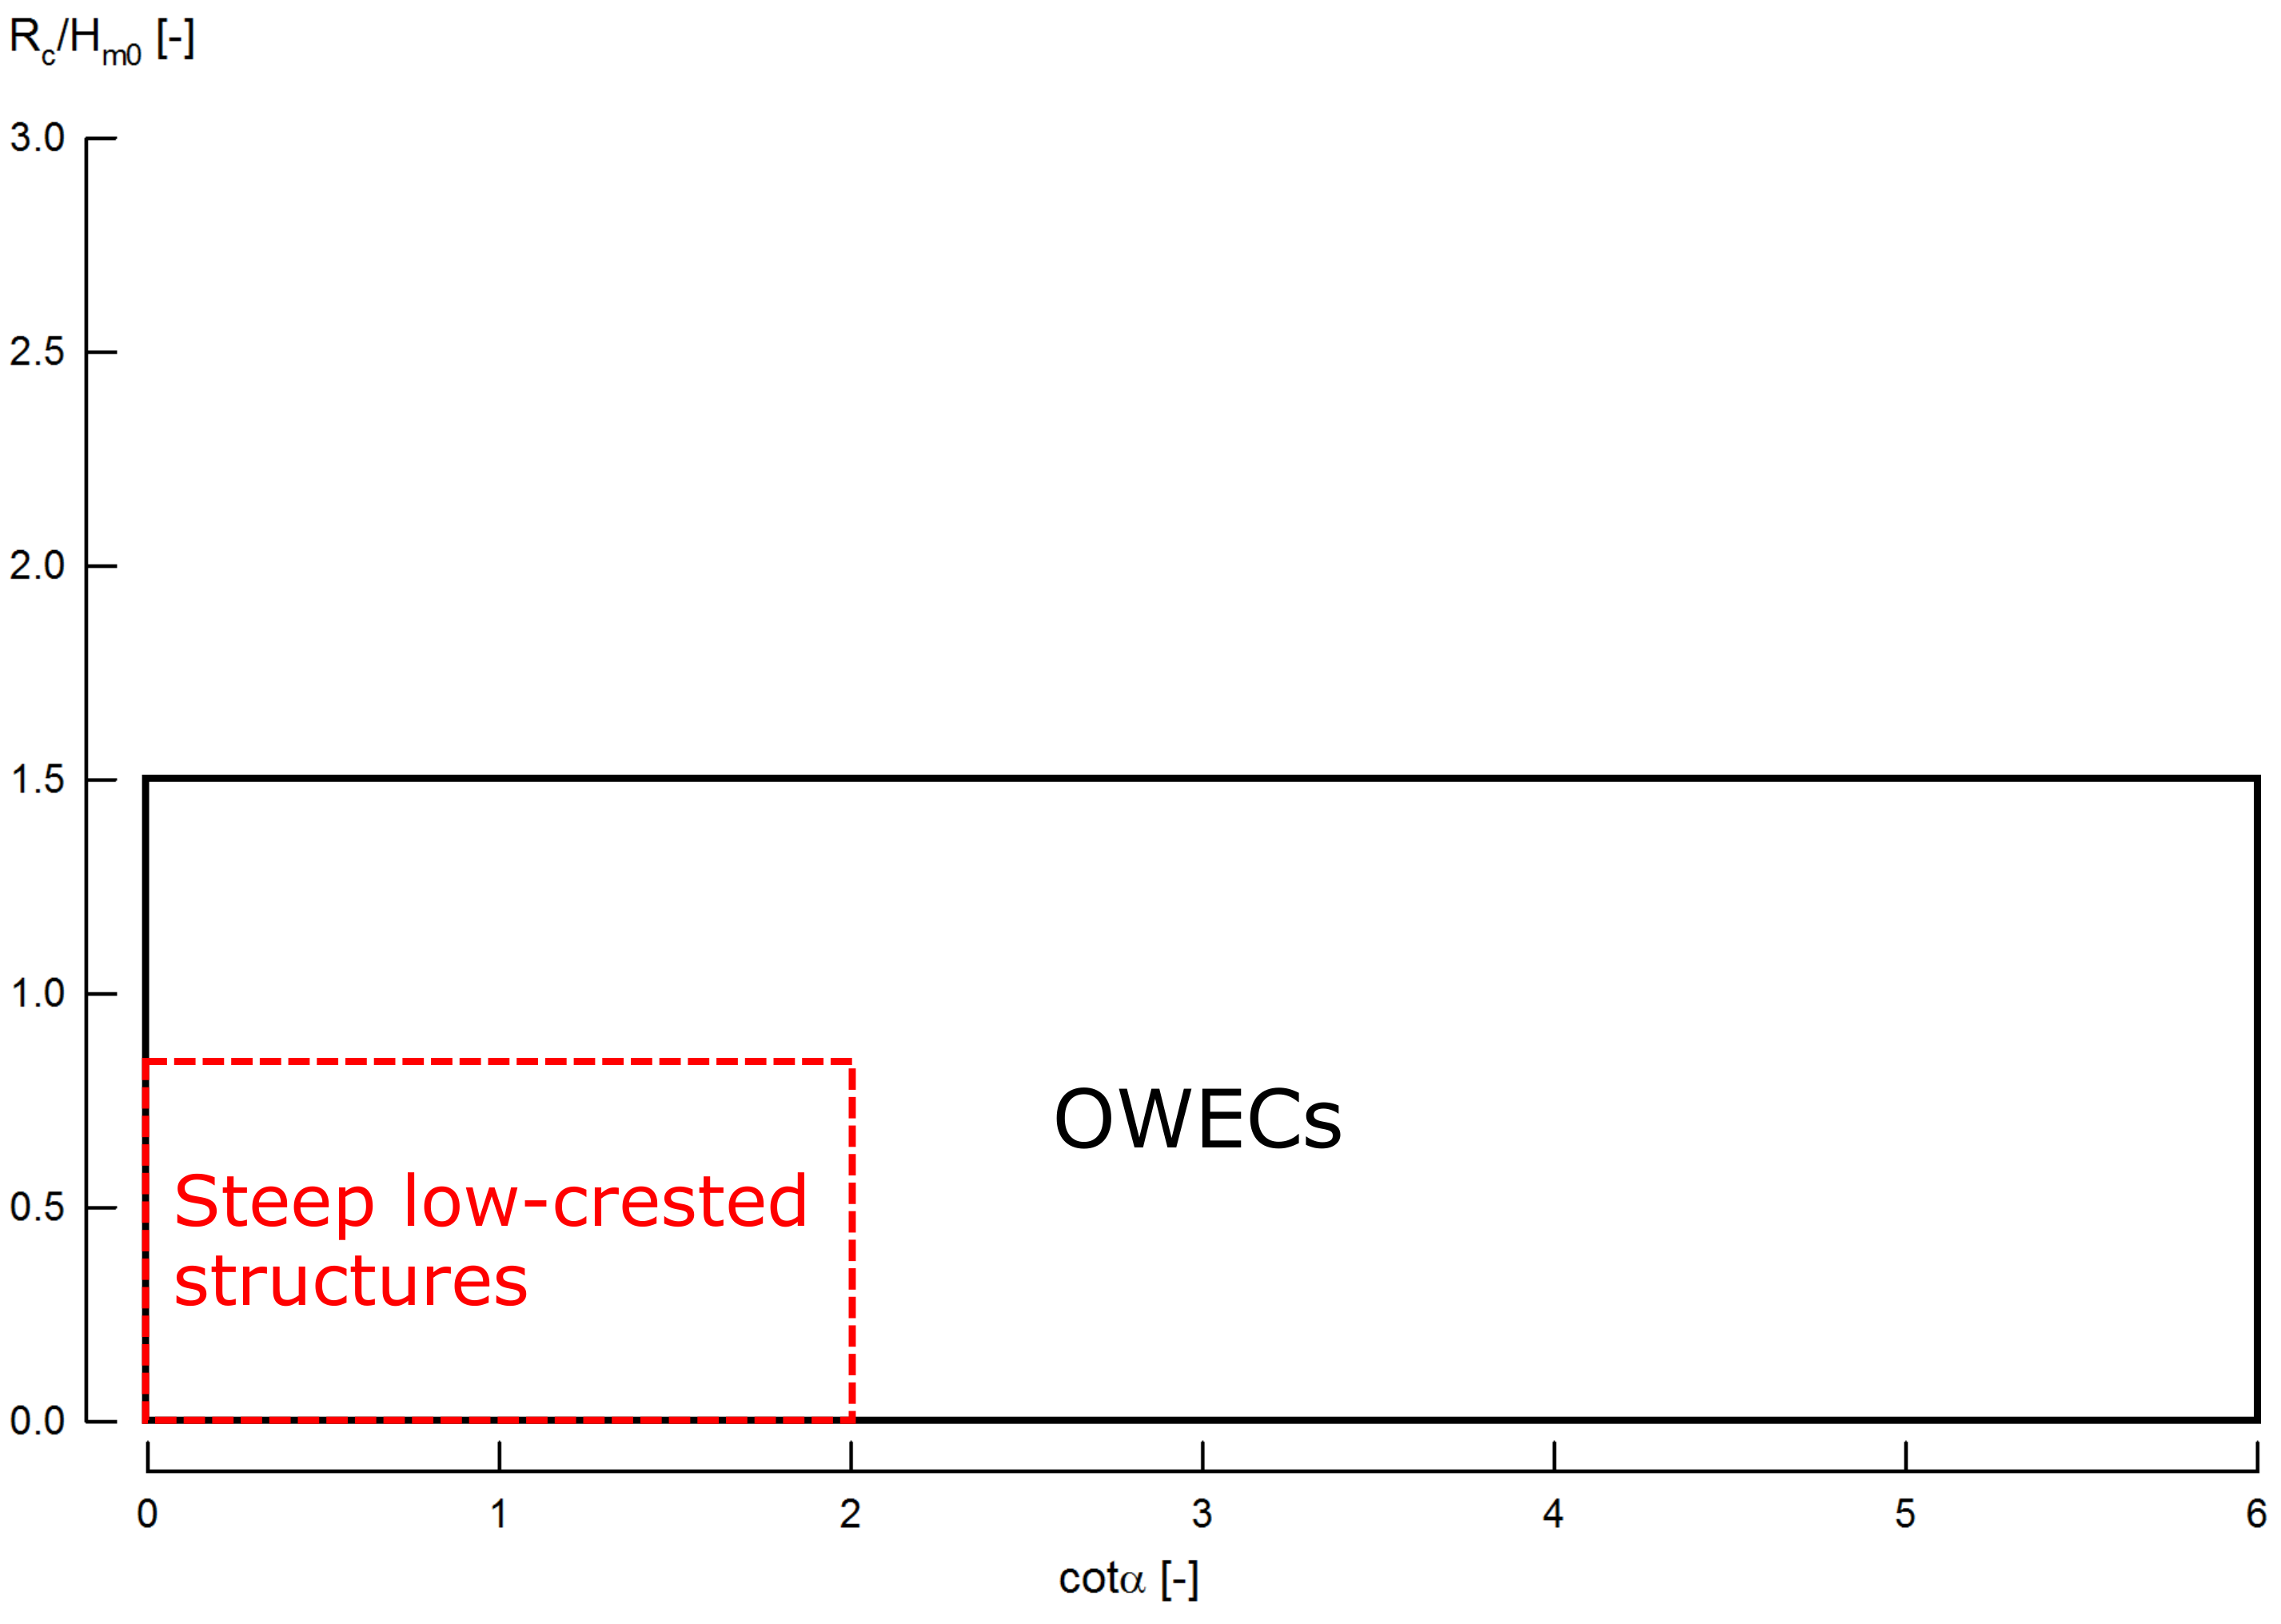
Victor and Troch [10] studied the performance of wave overtopping with respect to the OWEC geometry and characteristics. It was stated that the most convenient range would be for slope angles from mild to vertical walls (), as the wave breaking for this range of slopes is limited, not reducing the energy of the waves and therefore the run-up and overtopping. For relative crest freeboards (where is the crest freeboard and the incident significant wave height at the toe of the structure) the most suitable range would be for small relative crest freeboards up to the zero freeboard case (), as the overtopping rate increases for lower . A range of structures with interest for OWECs is formed by steep low-crested structures (with steep slope angles , and with low relative crest freeboards ) as for this range the overtopping is maximized due to the very small freeboards. Figure 1 shows this range of steep low-crested structures as a subset of the optimal range for OWECs suggested by Victor and Troch [10]. An accurate overtopping prediction for steep low-crested structures is necessary to avoid an underdesign (leading to a reduced operational time) or overdesign (leading to an increase of costs) of the device. Based on physical model tests, Victor and Troch [10] developed new overtopping prediction formulae for steep low-crested structures. Van der Meer and Bruce [11] also developed overtopping prediction formulae for ranges optimal for OWECs.
However, since the development of those prediction formulae, new data acquired at Ghent University (Belgium) allow us to study the achieved accuracy of those predictions and a potential incorrect prediction of overtopping values, which might be sensitive for the performance of OWECs. For that reason, we perform a critical analysis of the overtopping prediction formulae for steep low-crested structures and the validation of the accuracy of these formulae by comparing with the new overtopping data of Ghent University for this type of structures.
Section 2 of this paper presents an overview of the existing knowledge in literature on wave overtopping for steep low-crested structures, focusing on describing the state of the art research and the most recent overtopping prediction formulae for this type of structures. Section 3 explains the physical model tests performed in the wave flume of Ghent University to validate the overtopping prediction formulae for steep low-crested structures, describing both the test set-up and the experimental programme for the UG13 dataset. Section 4 presents and discusses the results of average overtopping, while Section 5 compares these results to the existing overtopping prediction formulae, and discusses the limit cases of vertical wall and zero freeboard. Finally, Section 6 presents the findings and the conclusions on the validation of the wave overtopping prediction formulae for steep low-crested structures.
2. Literature Review for Wave Overtopping Research
2.1. State of the Art
For the various OWEC prototypes mentioned in Section 1, wave overtopping studies have been published. Tedd and Kofoed [12] studied the overtopping rates on a Wave Dragon prototype installed in Denmark, obtaining flow time series and individual overtopping distributions. Vicinanza et al. [13] performed 2D small-scale physical model tests to study the overtopping rates and the hydraulic efficiency of the SSG, while Zanuttigh et al. [14] studied the wave reflection from the same device. Vicinanza et al. [15] studied the overtopping rates and the structural response of the OBREC, both in 2D small-scale physical model tests and in a full-scale prototype built in Naples (Italy). Numerical models have also been developed to predict the overtopping rates for OWECs [16] and for specific prototypes such as the OBREC [17].
All these overtopping studies were performed for specific OWEC prototypes, and they are not valid for a more general prediction of the overtopping rates as the wave conditions and geometries tested are specific for each device. From these studies it is not possible to extrapolate a general prediction of the overtopping rates for different wave and structural conditions.
However, the research of wave overtopping for sea defence structures offers a large number of wave overtopping prediction formulae suitable for a wide range of structural and wave conditions. Recent physical model research was focused on improving wave overtopping prediction by enlarging the range of application of the existing prediction formulae. Extensive research was done in the CLASH project [18], which consisted of physical model tests and field measurements of wave overtopping for rubble mound breakwaters and smooth slopes with various foreshore geometries, for both regular and irregular sea states. The CLASH project resulted in a very detailed database of wave overtopping results for the aforementioned conditions, and the development of a neural network on wave overtopping [19]. The EurOtop (2007) manual [7] proposed different wave overtopping prediction formulae based on the improved knowledge provided by the CLASH database.
Experiments carried out in Ghent University (Belgium) within the PhD research of Victor [20] studied wave overtopping rates for structures with steep slopes in low-crested conditions, which are within the optimal range of OWEC devices. These experiments formed the so-called ‘UG10’ dataset. The two dominant parameters of the UG10 dataset are the slope angle ; and the relative crest freeboard , covering the range of ; and . Victor and Troch [10,21] have thoroughly analysed the results of UG10 dataset. Based on UG10, Victor and Troch [10] developed overtopping prediction formulae for steep low-crested structures, extending the range of application towards steep slopes and very small freeboards of the prediction formula of the EurOtop (2007) manual [7]. Van der Meer and Bruce [11] also proposed a new overtopping prediction formulae for steep low-crested structures based on the analysis of UG10 and the CLASH database [18].
However, not the whole range of slope angles and relative crest freeboards was covered by the UG10 dataset. There is still a knowledge gap in the scientific literature on wave overtopping for very steep slopes and vertical walls, with very small and zero freeboards. This includes a lack of overtopping prediction formulae fitted through this range of slope angles and crest freeboards. It is also possible to assess the accuracy of the various prediction formulae for this range of slope angles and crest freeboards. To analyse and validate the overtopping prediction formulae in the range of very steep slopes to vertical walls, with very small and zero freeboards, we performed 2D physical model tests measuring the wave conditions and the wave overtopping rates in the wave flume of Ghent University. The dataset obtained is called ‘UG13’, and it consists of 307 physical model tests for steep low-crested structures in deep water conditions and non-breaking waves performed with a setup based on the work of Victor and Troch [22]. The UG13 dataset covers a range of slope angles between ; and a range of relative crest freeboards between . A small overlap on specific slope angles with the UG10 dataset is present to allow a comparison of the two datasets on wave overtopping rates. The UG13 dataset is also partially described in Troch et al. [23]. This dataset is an improvement in the wave overtopping data available, covering the range of structures with slope angles from very steep to vertical walls with very small and zero freeboards.
2.2. Literature Study on Wave Overtopping Prediction Formulae
The scientific literature available on overtopping prediction formulae is very extensive. The EurOtop (2007) manual [7] provides formulae for various structure types (mild sloping structures and vertical walls) and wave conditions, both for average and individual wave overtopping rates. Recently two new wave overtopping prediction formulae have been published by van der Meer and Bruce [11], and Victor and Troch [10] extending the traditional range of application towards steep low-crested structures. The EurOtop manual was updated in 2016 [8] to include the latest research on wave overtopping for steep low-crested structures from van der Meer and Bruce [11].
2.2.1. Sloping Structures
The mean value approach of the average overtopping prediction formula for mild slopes in non-breaking conditions (Equation (1)) contained in the EurOtop (2007) manual [7] was originally presented by van der Meer and Janssen [24].
In Equation (1), q is the average overtopping rate, is the incident significant wave height at the toe of the structure, is the crest freeboard, and the slope angle of the structure. The parameters and are different reduction factors for the roughness of the slope and oblique wave attack, respectively. The coefficient of Equation (1) is a normally distributed stochastic parameter with an associated standard deviation of . The range of application of Equation (1) is for slope angles between and for relative crest freeboards between for surf similarity parameter values . This range corresponds to the more conventional geometries (mild slopes with large relative crest freeboards), while for very steep slopes and vertical walls with very small and zero freeboards (i.e., steep low-crested structures) this formula should not be used.
The surf similarity paremeter is a dimensionless parameter that indicates the breaking wave type, and is defined by , which is the ratio between the tangent of the slope angle and the square root of the wave steepness . The different types of breaking waves derived from the surf similarity paremeter are spilling for , plunging for , collapsing for , and surging (non-breaking waves) for .
During the PhD research of Victor [20] on OWECs, a new wave overtopping prediction formula was needed, which included the operational conditions of these devices that behave as low-crested structures. To fill the knowledge gap for overtopping on this type of structures, he obtained a new overtopping dataset for steep low-crested structures, the UG10 dataset (described in Section 2.1). Victor and Troch [10] developed new average overtopping prediction formulae (Equation (2)) based on the dataset UG10, and the subsets 106 (small crest freeboards), 107 (zero crest freeboard) and 402 (large crest freeboards) of the CLASH database [18] for plain vertical walls under non-impulsive conditions with relative crest freeboards .
Equation (2) shows the formula to predict the dimensionless average overtopping rate and Table 3 shows the expressions for the a and b coefficients as a function of the slope angle and relative crest freeboard . The formulae are divided into 4 different zones (Z1, Z2, Z3, Z4) depending on the values of slope angle and relative crest freeboard . This provides a high physical insight of wave overtopping, allowing a clear visualization of the physical meaning of the formulae and leading to a better understanding of the dependence of wave overtopping on the slope angle and relative crest freeboard . The formulae maintain the shape of the EurOtop (2007) formula for non-breaking conditions (Equation (1)), with the relative crest freeboard as governing parameter of the wave overtopping prediction. However, as opposed to Equation (1), the overtopping prediction resulting from Equation (2) is also influenced by the slope angle .
For slopes and (very) small relative crest freeboards (zone Z1), the effect of the slope angle on wave overtopping is significant, while for large relative crest freeboards (zone Z2) this effect is even stronger than in the zone Z1. When considering slopes , for both (very) small relative crest freeboards (; zone Z3) and large relative crest freeboards (; zone Z4) the effect of the slope angle on wave overtopping is negligible and therefore not consider in the coefficients. The zone Z4 of this formula is equal to the EurOtop (2007) overtopping prediction formula for non-breaking wave conditions (Equation (1)).
To obtain the 90% confidence band of the overtopping prediction, the authors apply an overtopping discharge factor based on the root mean square error (RMSE) of the tests through which the formulae were fitted. The overtopping discharge factor for the zone Z1 is 1.25; for the zone Z2 is 1.47; and for the zone Z3 is 1.18. To obtain the upper limit of 90% confidence band, the predicted overtopping value should be multiplied by the overtopping discharge factor; while to obtain the lower limit 90% confidence band, it should be divided by the overtopping discharge factor. The overtopping prediction in the zone Z4 is equal to Equation (1) and therefore standard deviation given with the equation is still valid.
The existing EurOtop (2007) [7] wave overtopping prediction formula for non-breaking conditions (Equation (1)) was reviewed and improved by the overtopping prediction formulae (mean value approach) presented by van der Meer and Bruce [11], shown in Equations (3)–(6).
with the following expressions for the coefficients a, b and c:
This prediction has an extended range of application with respect to Equation (1) towards steep, very steep slopes and vertical walls (), with very small and zero freeboard () for non-breaking conditions. For the range of validity of the EurOtop (2007) [7] formula, Equation (3) gives a similar prediction of average wave overtopping although providing a deeper insight of the overtopping process. The van der Meer and Bruce [11] formulae is included in the EurOtop (2016) manual [8] as the reference overtopping prediction for structures with steep slopes up to vertical walls with relative freeboards from large to zero. Compared to Equation (1), the van der Meer and Bruce [11] prediction formulae (Equation (3)) add a power (with a constant value) inside the exponential function (Equation (6)) and two coefficients and which are a function of the slope angle . The coefficient (Equation (4)) determines the overtopping value when the value of the x-axis (where the y-axis is ) is equal to zero (therefore, in the case of zero relative crest freeboards ). The coefficient (Equation (5)) determines the shape of the equation for the entire range of .
The reliability of Equation (3) is described by a coefficient of variation (being the standard deviation and the average value of normally distributed stochastic parameters) for the coefficients and , with the values and .
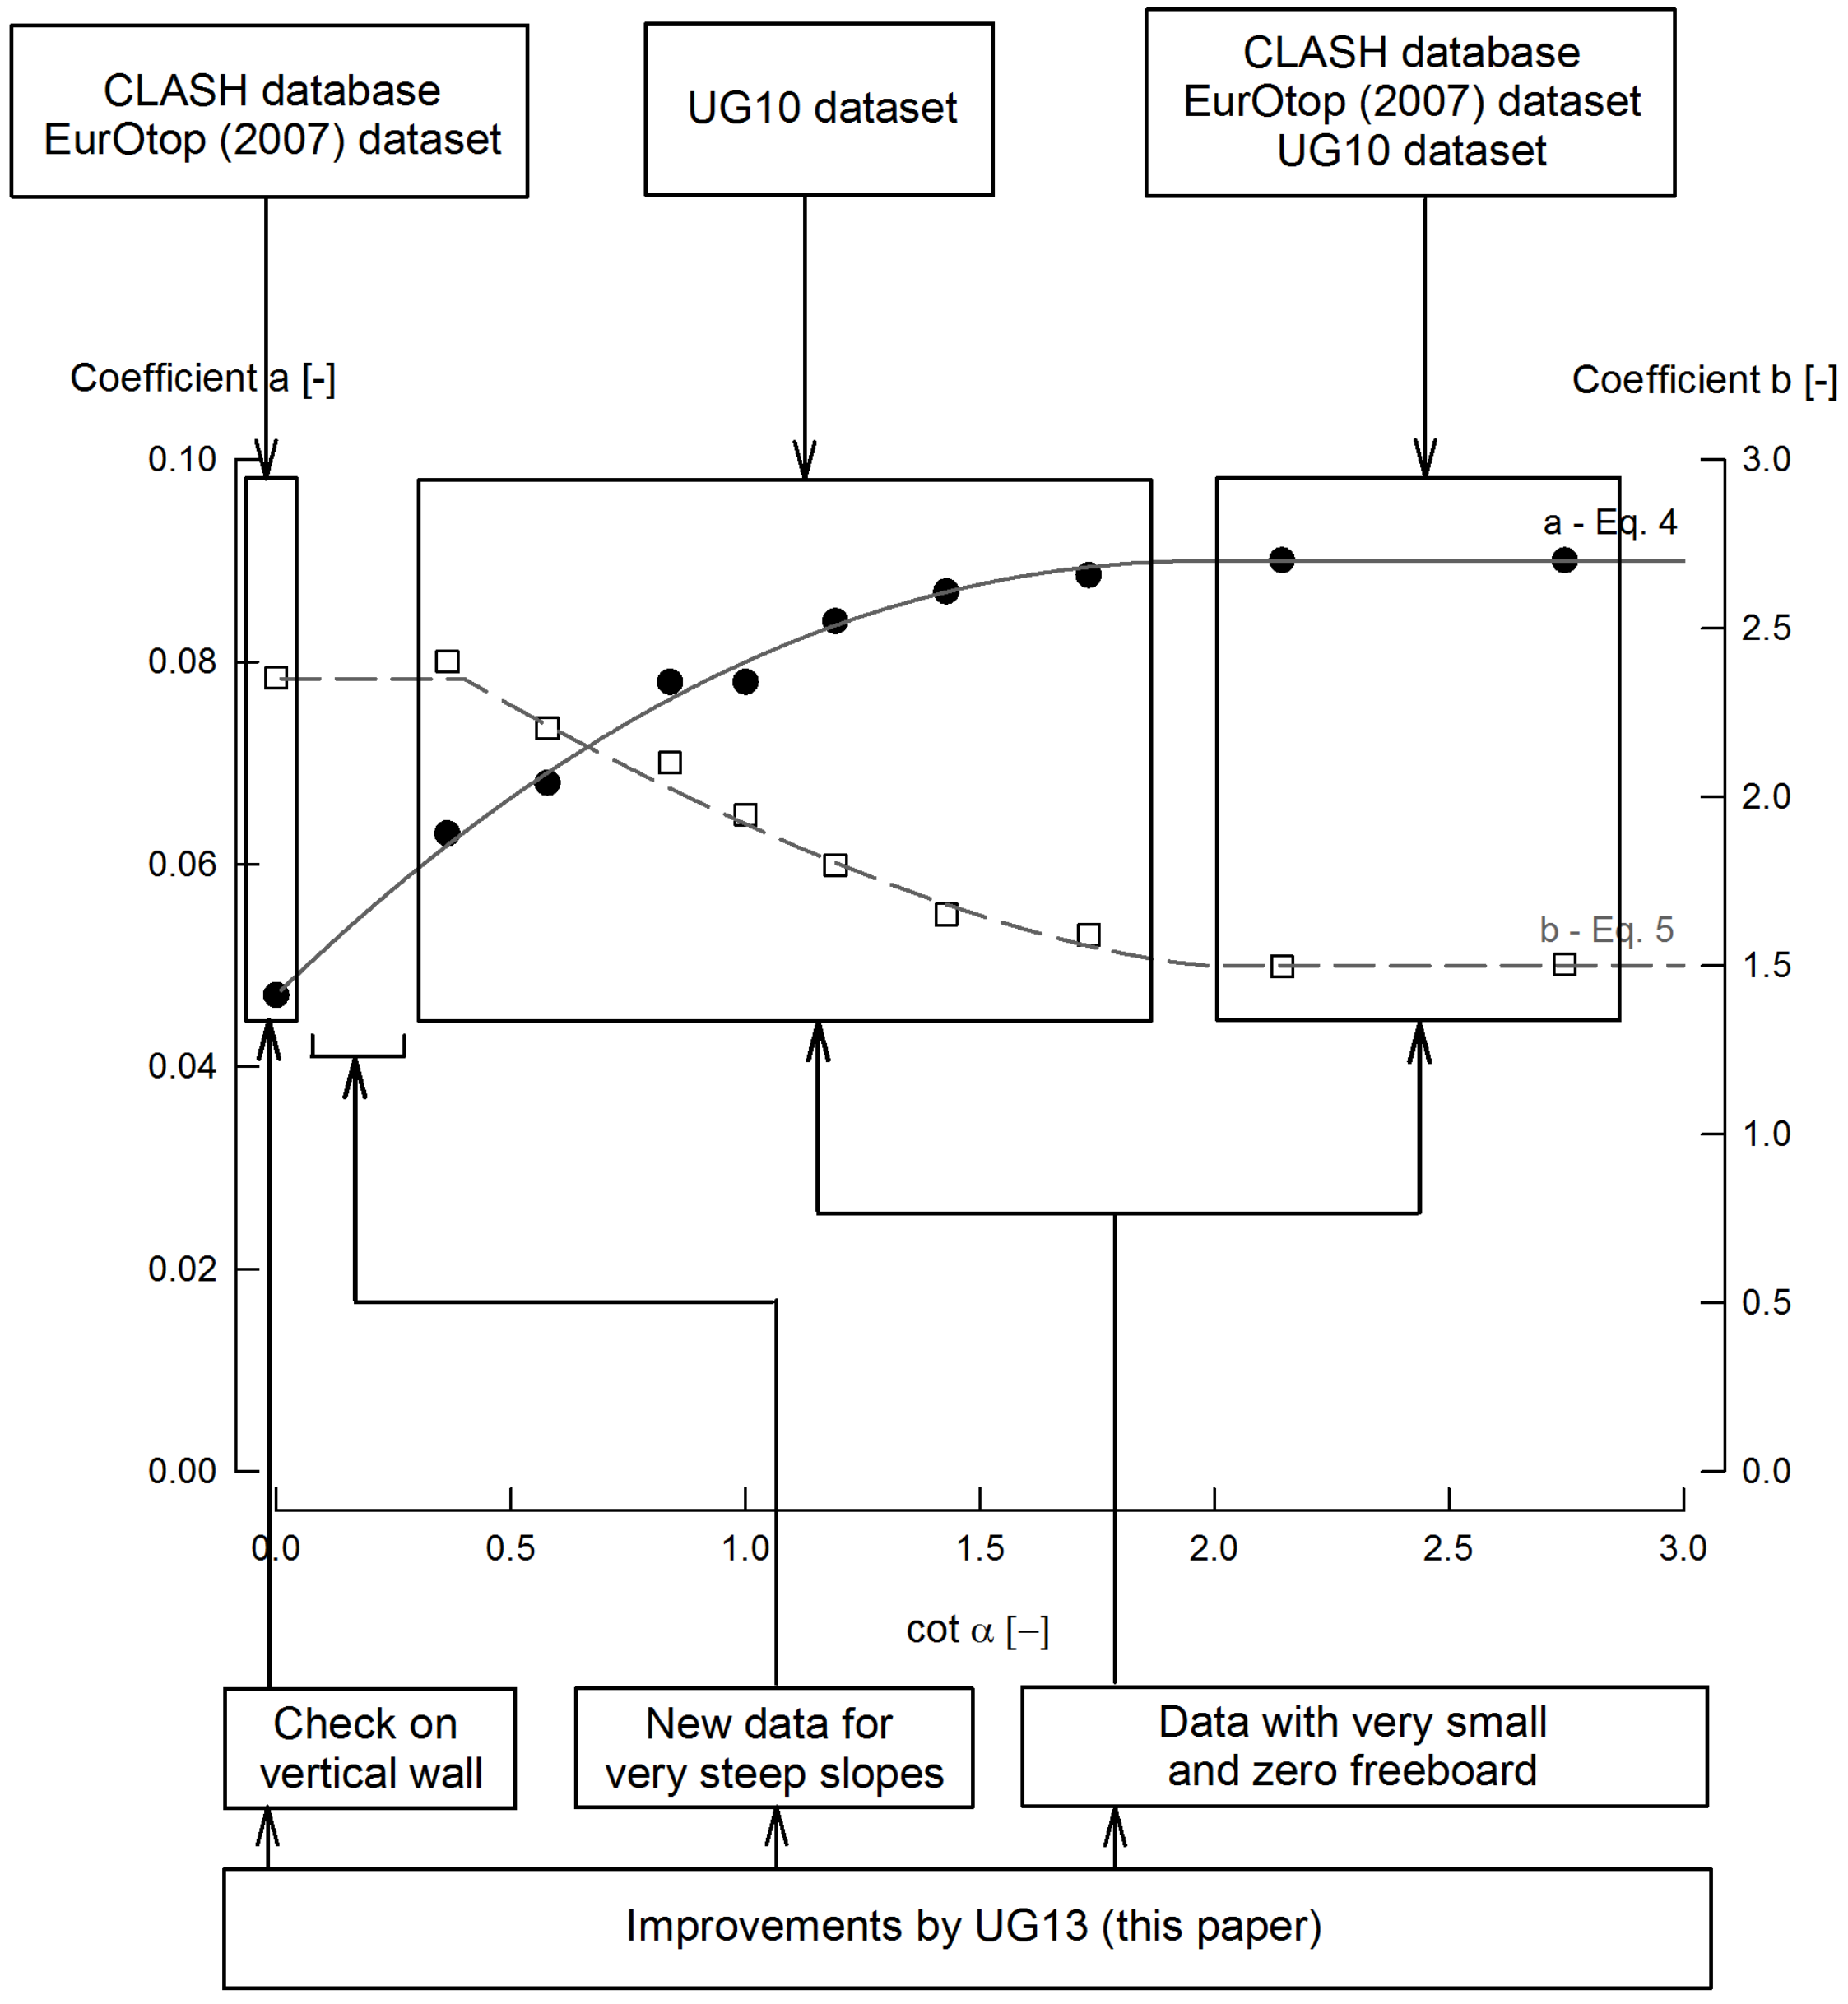
The expression for the (Equation (4)) and (Equation (5)) coefficients of Equation (3) was fitted by van der Meer and Bruce [11] using wave overtopping results for specific slope angles and relative crest freeboards from different sources (Figure 2). For the mild slope range () the fit of the coefficients of the prediction formulae was performed through the UG10 dataset, the EurOtop (2007) [7] dataset and the subsets 102 (with small crest freeboards) and 108 (with zero freeboard) of the CLASH database, taking these coefficients of the mild slope limit case as asymptotic values for steeper slopes with . In the range of steep slopes () only the UG10 dataset results were used to fit the expressions of the coefficients, as the CLASH database lacks of overtopping data for this range of slopes. For very steep slopes () no data were used to fit the formulae, however the overtopping prediction is still considered valid, which raises concerns about the accuracy of the formulae on this range of slope angles. For the case of the vertical wall (), the UG10 dataset also lacked of overtopping data. Therefore, the fit of the coefficients was performed through 9 subsets of the CLASH database for vertical walls (subsets 106 for small freeboards; 107 for zero freeboards; 113, 228, 229, 315, 351, 380 and 914), and the EurOtop (2007) [7] dataset.
Figure 3 compares the Victor and Troch [10] overtopping prediction formula (Equation (2); black lines) with the van der Meer and Bruce [11] formulae (Equation (3); red lines) for the case of mild slopes (solid lines) and vertical walls (dashed lines). As seen both formulae give similar overtopping prediction, although Equation (3) gives a slightly higher prediction for the case of vertical walls. The shape of the formulae are different even though they are both exponential. Equation (2) are straight lines on a logarithmic plot while Equation (3) are curved lines due to the coefficient that indicates the prediction follows a Weibull distribution. For very small and zero relative crest freeboards, Equation (2) gives a higher overtopping prediction than Equation (3). However, neither of the two formulae have been fitted with overtopping data in this range of relative crest freeboards and therefore the questions about the accuracy of the overtopping prediction arise.
2.2.2. Vertical Walls
In Bruce et al. [25], an overview of various overtopping prediction formulae for vertical walls is presented. The EurOtop (2007) manual [7] contains overtopping prediction formulae for the specific case of vertical walls under both impulsive and non-impulsive conditions.
The mean value approach prediction formula for non-impulsive conditions is shown in Equation (7). This prediction is valid in a range of relative crest freeboards , with the coefficient having an associated standard deviation of .
The coefficients of the van der Meer and Bruce [11] formulae (Equation (3)) for the specific case of vertical walls () are and .
For vertical walls () with zero crest freeboard (), Smid [26] proposed a constant average overtopping rate for non-impulsive wave conditions (Equation (8)) which was based on experimental tests. Victor and Troch [10] considered this formula by Smid [26] and fixed the value of their prediction formula (Equation (2)) for the case of vertical walls with zero freeboard according to Equation (8).
Table 4 presents an overview of the most important overtopping prediction formula used throughout this paper.
3. New Wave Overtopping Physical Model Tests
The UG13 dataset consists of 307 tests with overtopping and wave measurements, with a good coverage of the complete range of slope angles (from mild slopes to vertical walls, ) and of relative crest freeboards (from large to zero, ), unlike the UG10 dataset. This section presents the test setup and the wave and structural parameters of the UG13 dataset.
3.1. Experimental Setup in the Wave Flume
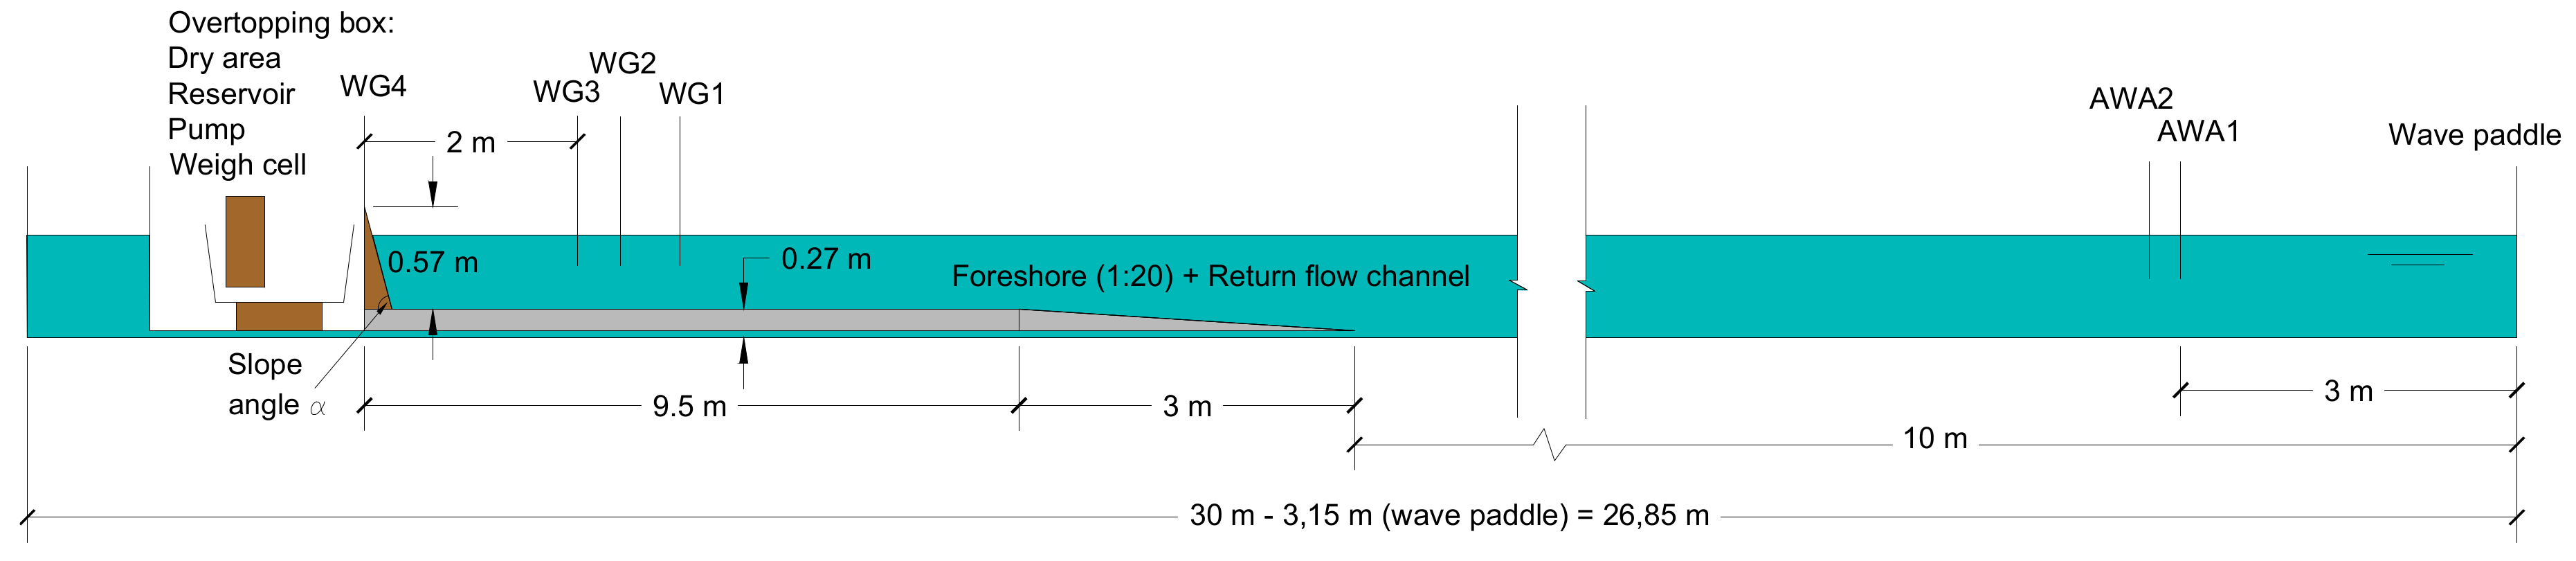
We performed the experiments in the wave flume of the Department of Civil Engineering at Ghent University (Belgium) which has a length of 30 m, a width of 1 m and a height of 1.2 m. The wave flume is equipped with a piston type wave paddle with a maximum stroke length of 1.5 m. The bottom of the wave flume featured a 1:20 concrete foreshore slope that was developed over 3 m, starting at a 10 m distance from the wave paddle and reaching a height of 0.27 m (including a return flow channel) and then continuing as a horizontal foreshore for 9.5 m until the front of the model structure (Figure 4).
The model structure in the experimental setup consisted of a smooth impermeable plywood panel forming a given slope angle with the foreshore (Figure 5a). The top part of the model structure supports the plywood panel acting as a hinge on which the plywood panel rotates to form a slope angle with the foreshore. The height of the model structure over the foreshore is 0.57 m (Figure 4). Behind the test section an overtopping box was placed (Figure 5b), containing the necessary equipment to measure the wave overtopping, with the model structure in front of it. Victor and Troch [22] developed the overtopping box to measure the overtopping using the weigh cell technique, with a specific design to measure individual wave overtopping volumes with high accuracy. The return flow channel was constructed to allow the overtopped water to return to the central section of the flume in order to maintain a constant water level during the tests. This channel is wide enough to assure a low velocity flow that does not affect the incoming waves.
Two sets of resistive type wave gauges (WG) measured the wave heights. The first set was used by the active wave absorption (AWA) system to filter the wave signal in order to absorb the reflected waves at the wave paddle and was composed by two wave gauges (AWA 1 and 2 in Figure 4). The first wave gauge of the AWA system was located 3 m away from the wave paddle, while the second AWA wave gauge was located in each test at the distance that maximized the active wave absorption. The second set of wave gauges was composed by three wave gauges with a separation distance between the individual wave gauges of each set according to Mansard and Funke [27]. This set of wave gauges (WG 1, 2, 3 in Figure 4) was placed in front of the model structure (being WG 3 at a constant distance of 2 m from the crest of the model structure) and the measurements were used to calculate the incident wave height and the reflection coefficient using the 3-point method described in Mansard and Funke [27]. An extra wave gauge (WG 4 in Figure 4) was placed at the entrance of the overtopping box to detect when a wave overtopped in order to analyse the individual wave overtopping volumes at a later research stage.
3.2. Experimental Programme
We performed experiments using the setup described in Section 3.1 for various structural parameters (slope angle , crest freeboard ) and wave parameters at the toe of the structure (local water depth at the toe of the structure h, incident spectral wave height , incident peak wave period and incident wave period defined by the ratio between the first negative moment and the zeroth moment of the spectrum ). A definition sketch of these parameters is shown in Figure 5a. The average overtopping rate q and the individual wave overtopping volumes are measured for each test of the UG13 dataset. After processing the data with a MATLAB™ script, both the average overtopping rates and the individual overtopping volumes are obtained. In this paper, only the average overtopping rates of the UG13 dataset are analysed.
The UG13 dataset is a continuation of the UG10 dataset [21], extending the tested slope angles towards the limit vertical wall case; and the crest freeboards towards the limit zero freeboard case. 12% of the UG13 tests are on the same slope angles and range as the UG10 dataset. Table 5 shows an overview of the ranges of the parameters tested in the UG10 and UG13 datasets, and Figure 6 shows a plot of the various slope angles () and relative crest freeboards tested on the UG10 and UG13 datasets. During the experiments, 1000 irregular waves per test were generated using a JONSWAP spectrum with a shape parameter of . The UG10 and UG13 datasets are considered entirely in the non-breaking waves region as the surf similarity parameter is for every test.
As seen on Section 2.2, the coefficients of the van der Meer and Bruce [11] formulae (Equation (3)) were not fitted through very steep slopes, while for very small and zero relative freeboards they were fitted only through the very limited overtopping data available. However, these two ranges of slope angle and relative crest freeboard are included within the range of application of the formulae, urging a validation of the accuracy of the overtopping prediction for these conditions. The UG13 dataset adds new data that can help assessing the accuracy and validating the van der Meer and Bruce [11] prediction in three different ranges of slope angles and crest freeboards:
- vertical walls () overtopping data;
- very steep slopes () overtopping data, which was not previously considered in the fitting of the coefficients; and
- very small and zero crest freeboard () overtopping data, a range which was not considered in the fitting of the coefficients.
4. Average Overtopping Results
For the entire UG13 dataset the dimensionless average wave overtopping is presented as a function of the relative crest freeboard (Figure 7). For a specific slope angle , increases when decreases. In Figure 7 the green squares indicate the subset of mild slopes (); the red triangles indicate steep slopes (); the blue diamonds indicate very steep slopes (); and the white circles indicate the vertical wall (). The average overtopping rate decreases for decreasing values of (increasing slope angle ). The effect of the slope angle on the average wave overtopping will be discussed throughout the paper.
Figure 8 shows the dimensionless average overtopping rate as a function of for very small and zero relative freeboards of the UG13 dataset, showing 4 groups of the relative crest freeboard ( in white diamonds; in yellow circles; in orange triangles; and in red squares). All these overtopping data form the new zones Z1* (for ) and Z3* () that were not tested in the UG10 dataset.
An influence of the slope angle on the relative overtopping rates is present in the UG13 data for very small and zero relative crest freeboards. For mild () and steep slopes (), the relative overtopping decreases for steeper slopes. However, in the range of very steep slopes () this influence seems to be negligible as the overtopping rates are constant. The influence of the slope angle is again present when moving towards the vertical wall limit () as the overtopping rates decrease. The behaviour described is the same within each of the 4 groups of shown in Figure 8. Therefore, a vertical wall () performs better than a very steep slope when reducing average wave overtopping on very low-crested conditions.
5. Comparison with Overtopping Prediction Formulae for Steep Low-Crested Structures
Recently, two new overtopping prediction formulae have been developed as discussed in Section 2.2. The UG13 dataset is used to check the accuracy of both predictions on the range of steep low-crested structures.
To assess the accuracy of the prediction formulae, the root mean square error (RMSE) will be used, following Equation (9), while the bias of the prediction is shown in Equation (10).
In Equation (9), is the total number of data used to calculate the RMSE, the absolute average overtopping predicted for the test n, and the absolute average overtopping measured for the test n. A smaller RMSE value for a specific set of data means a more accurate prediction than a larger RMSE value. The comparison between RMSE values from different predictions is only possible for the same set of data. The bias of the prediction (Equation (10)) is calculated to assess if there is underprediction or overprediction of the measured overtopping values. A positive value of bias indicates that the overtopping is overpredicted for the considered data, while a negative value of bias indicates underprediction.
Table 6 shows the RMSE and bias values of the Victor and Troch [10] prediction (Equation (2)) and the van der Meer and Bruce [11] prediction (Equation (3)) for the complete UG13 dataset, for specific ranges of relative crest freeboard (following Table 2 and the relative freeboard ranges defined in Figure 8) and for the ranges of slope angle defined in Table 1. For the entire UG13 and for all the and slope ranges considered, Equation (2) has consistently smaller RMSE values than Equation (3). Specifically, for the entire UG13 dataset the RMSE is a 21% smaller and for the zero freeboard case () is a 26% smaller. The highest difference is obtained for very steep slopes, where the RMSE value is a 49% smaller. This indicates that the Victor and Troch [10] prediction is more accurate when predicting the UG13 tests than the van der Meer and Bruce [11] prediction. Analysing the bias values of Table 6, Equation (3) are consistently underpredicting the results (negative values of bias) for most of the ranges considered, while Equation (2) does not show a clear trend in underpredicting or overpredicting the UG13 dataset.
The van der Meer and Bruce [11] overtopping prediction formulae (Equation (3)) are the most relevant ones as these formulae are included in the EurOtop (2016) manual [8] as the reference overtopping prediction for steep slopes up to vertical walls, with very small and zero freeboards. A further graphical comparison between the UG13 dataset and Equation (3) is presented, together with the UG10 dataset when possible.
Mild slopes () were covered in the UG10 dataset and again in the UG13 dataset with an extension to the zero freeboard limit forming the new zone Z3* (, ). Figure 9 shows the dimensionless average wave overtopping as a function of the relative crest freeboard for the mild slopes of both datasets ( in purple triangles for UG10 and green squares for UG13, and in orange circles for UG10), compared with the van der Meer and Bruce (2014) [11] overtopping prediction formula (Equation (3)) for mild slopes (solid line) with its 90% confidence band (grey area). The wave overtopping data of the UG13 dataset with very small relative crest freeboards define a new zone Z3* with a range of not tested in the UG10 dataset. In general, the formula has a good agreement with the UG10 and UG13 dataset. However, in the extension zone Z3* Equation (3) is slightly underpredicting the dimensionless average overtopping rate (with a RMSE = 0.0137) probably due to the fact that the formula has not been fitted through overtopping data on that range. As expected, there is a good agreement between UG13 and the formulae in the Z3 and Z4 zones.
For steeper slopes (), Victor and Troch [10] described two zones: Z1 for and Z2 for . Figure 10 shows the UG10 and UG13 data of dimensionless average wave overtopping as a function of the relative crest freeboard for three different steep slopes: 35° (, UG10 orange circles, UG13 red circles), 45° (, UG10 purple diamonds, UG13 blue diamonds) and 60° (, UG10 yellow squares, UG13 green squares), compared to Equation (3) shown in a red solid line, blue dashed line and green dot-dashed line respectively. The zone Z1* is composed by new overtopping data on steep slopes and very small relative freeboards which are not considered in the existing overtopping prediction formulae. In the zones Z1 and Z2 there is a good agreement of the prediction formulae with the UG13 dataset. In the zone Z1*, Equation (3) underpredict the dimensionless overtopping rates (with a RMSE = 0.0143), following the general trend of underprediction for very small and zero freeboards. The UG13 data for show 6 outliers that are overpredicted by Equation (3). The analysis of these 6 tests showed no evidence of an error during the performance of the experiments or the analysis of the acquired data and therefore, the authors decided to keep these 6 tests in the validation of the accuracy of the prediction formulae.
For very steep slopes (), UG13 fills a knowledge gap in the scientific literature. The new zones Z1* (, ) and Z2* (, ) are defined where the UG10 dataset range is extended by UG13. Figure 11 shows the UG13 data for the very steep slopes of 75° (, orange circles), 80° (, green diamonds) and 85° (, purple squares). The new data now defined in the zones Z1* and Z2* are compared to the prediction of Equation (3) for (as the rest of slope angles have very similar—although different—predictions) with its 90% confidence band. The accuracy of the prediction is good for the zone Z2* and most of the zone Z1*. However, for relative crest freeboards the trend of the UG13 data diverges from the prediction, resulting in an underprediction of the overtopping values. This is in agreement with the underprediction for very small and zero relative crest freeboards already proved for mild and steep slopes, and shown in the overview of RMSE values (Table 6).
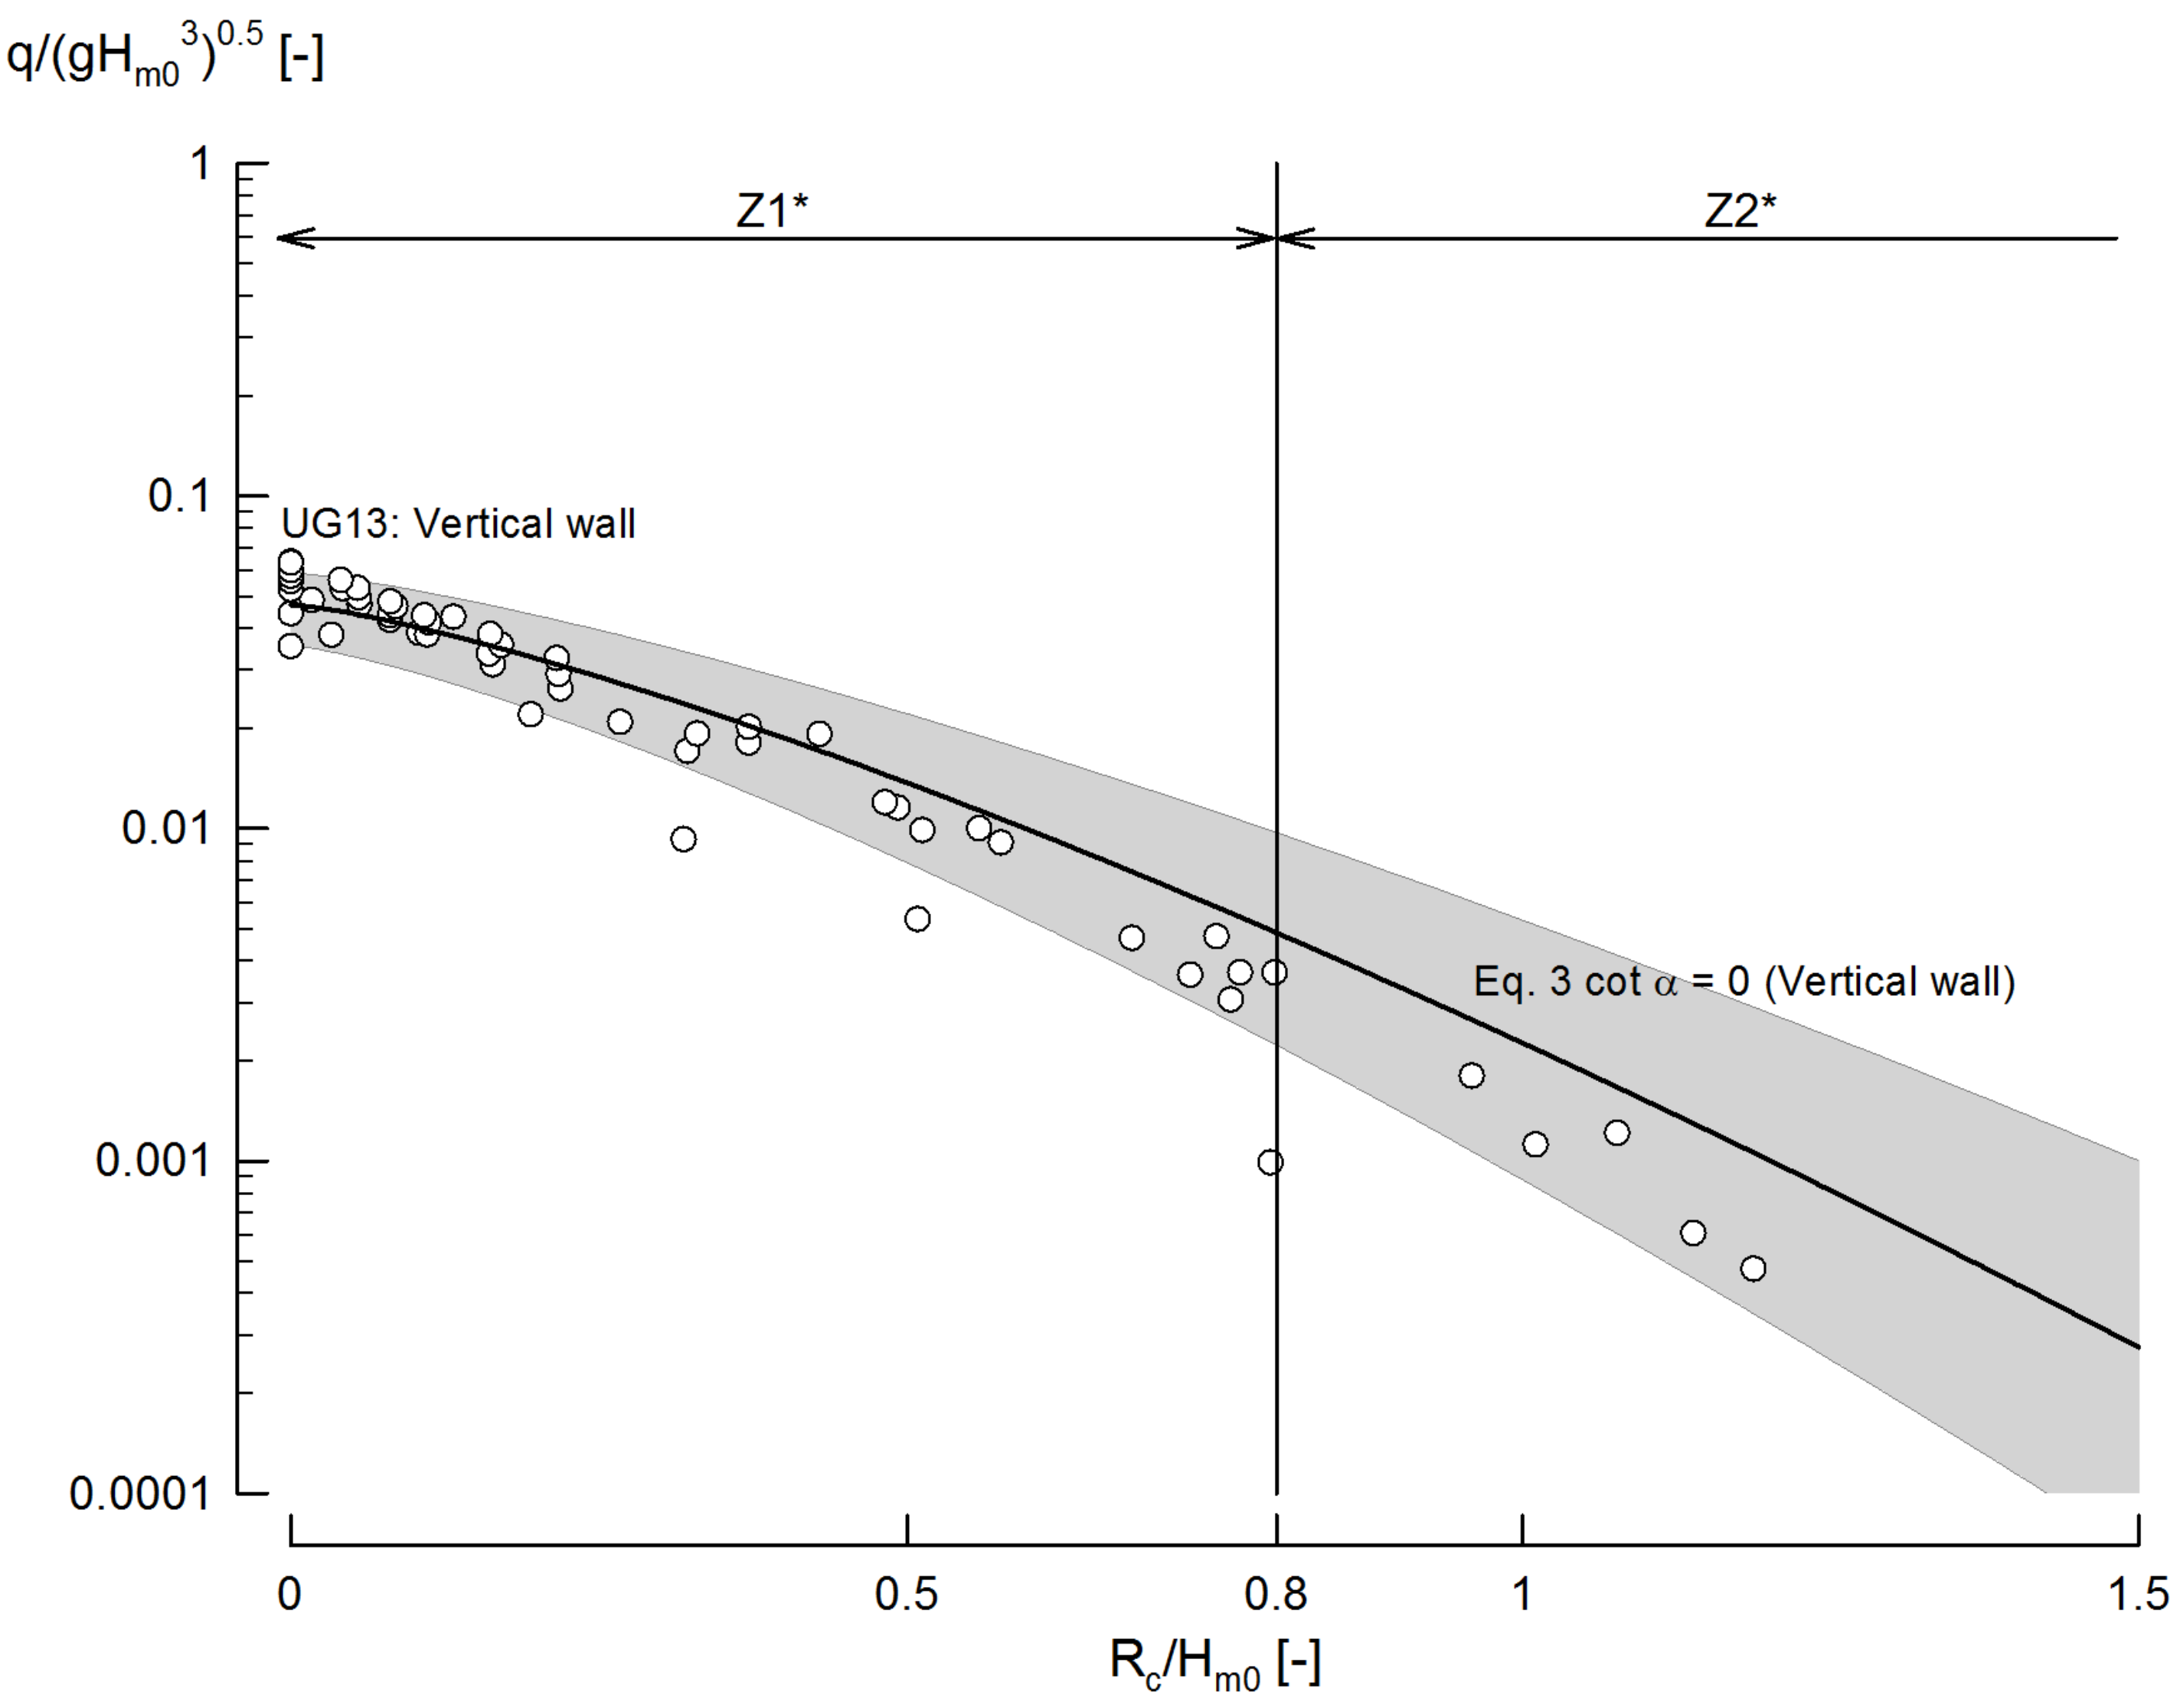
For vertical walls, UG13 also adds new data to the zones Z1* (, ) and Z2* (, ) where the UG10 dataset had a gap. Figure 12 shows the UG13 data for vertical walls (white circles) compared to the prediction of Equation (3) for vertical walls. Even though the data shows a relatively good agreement with the prediction (within the 90% confidence band), there is a small overprediction of the values when , while for there is a similar underprediction for very small and zero relative crest freeboards.
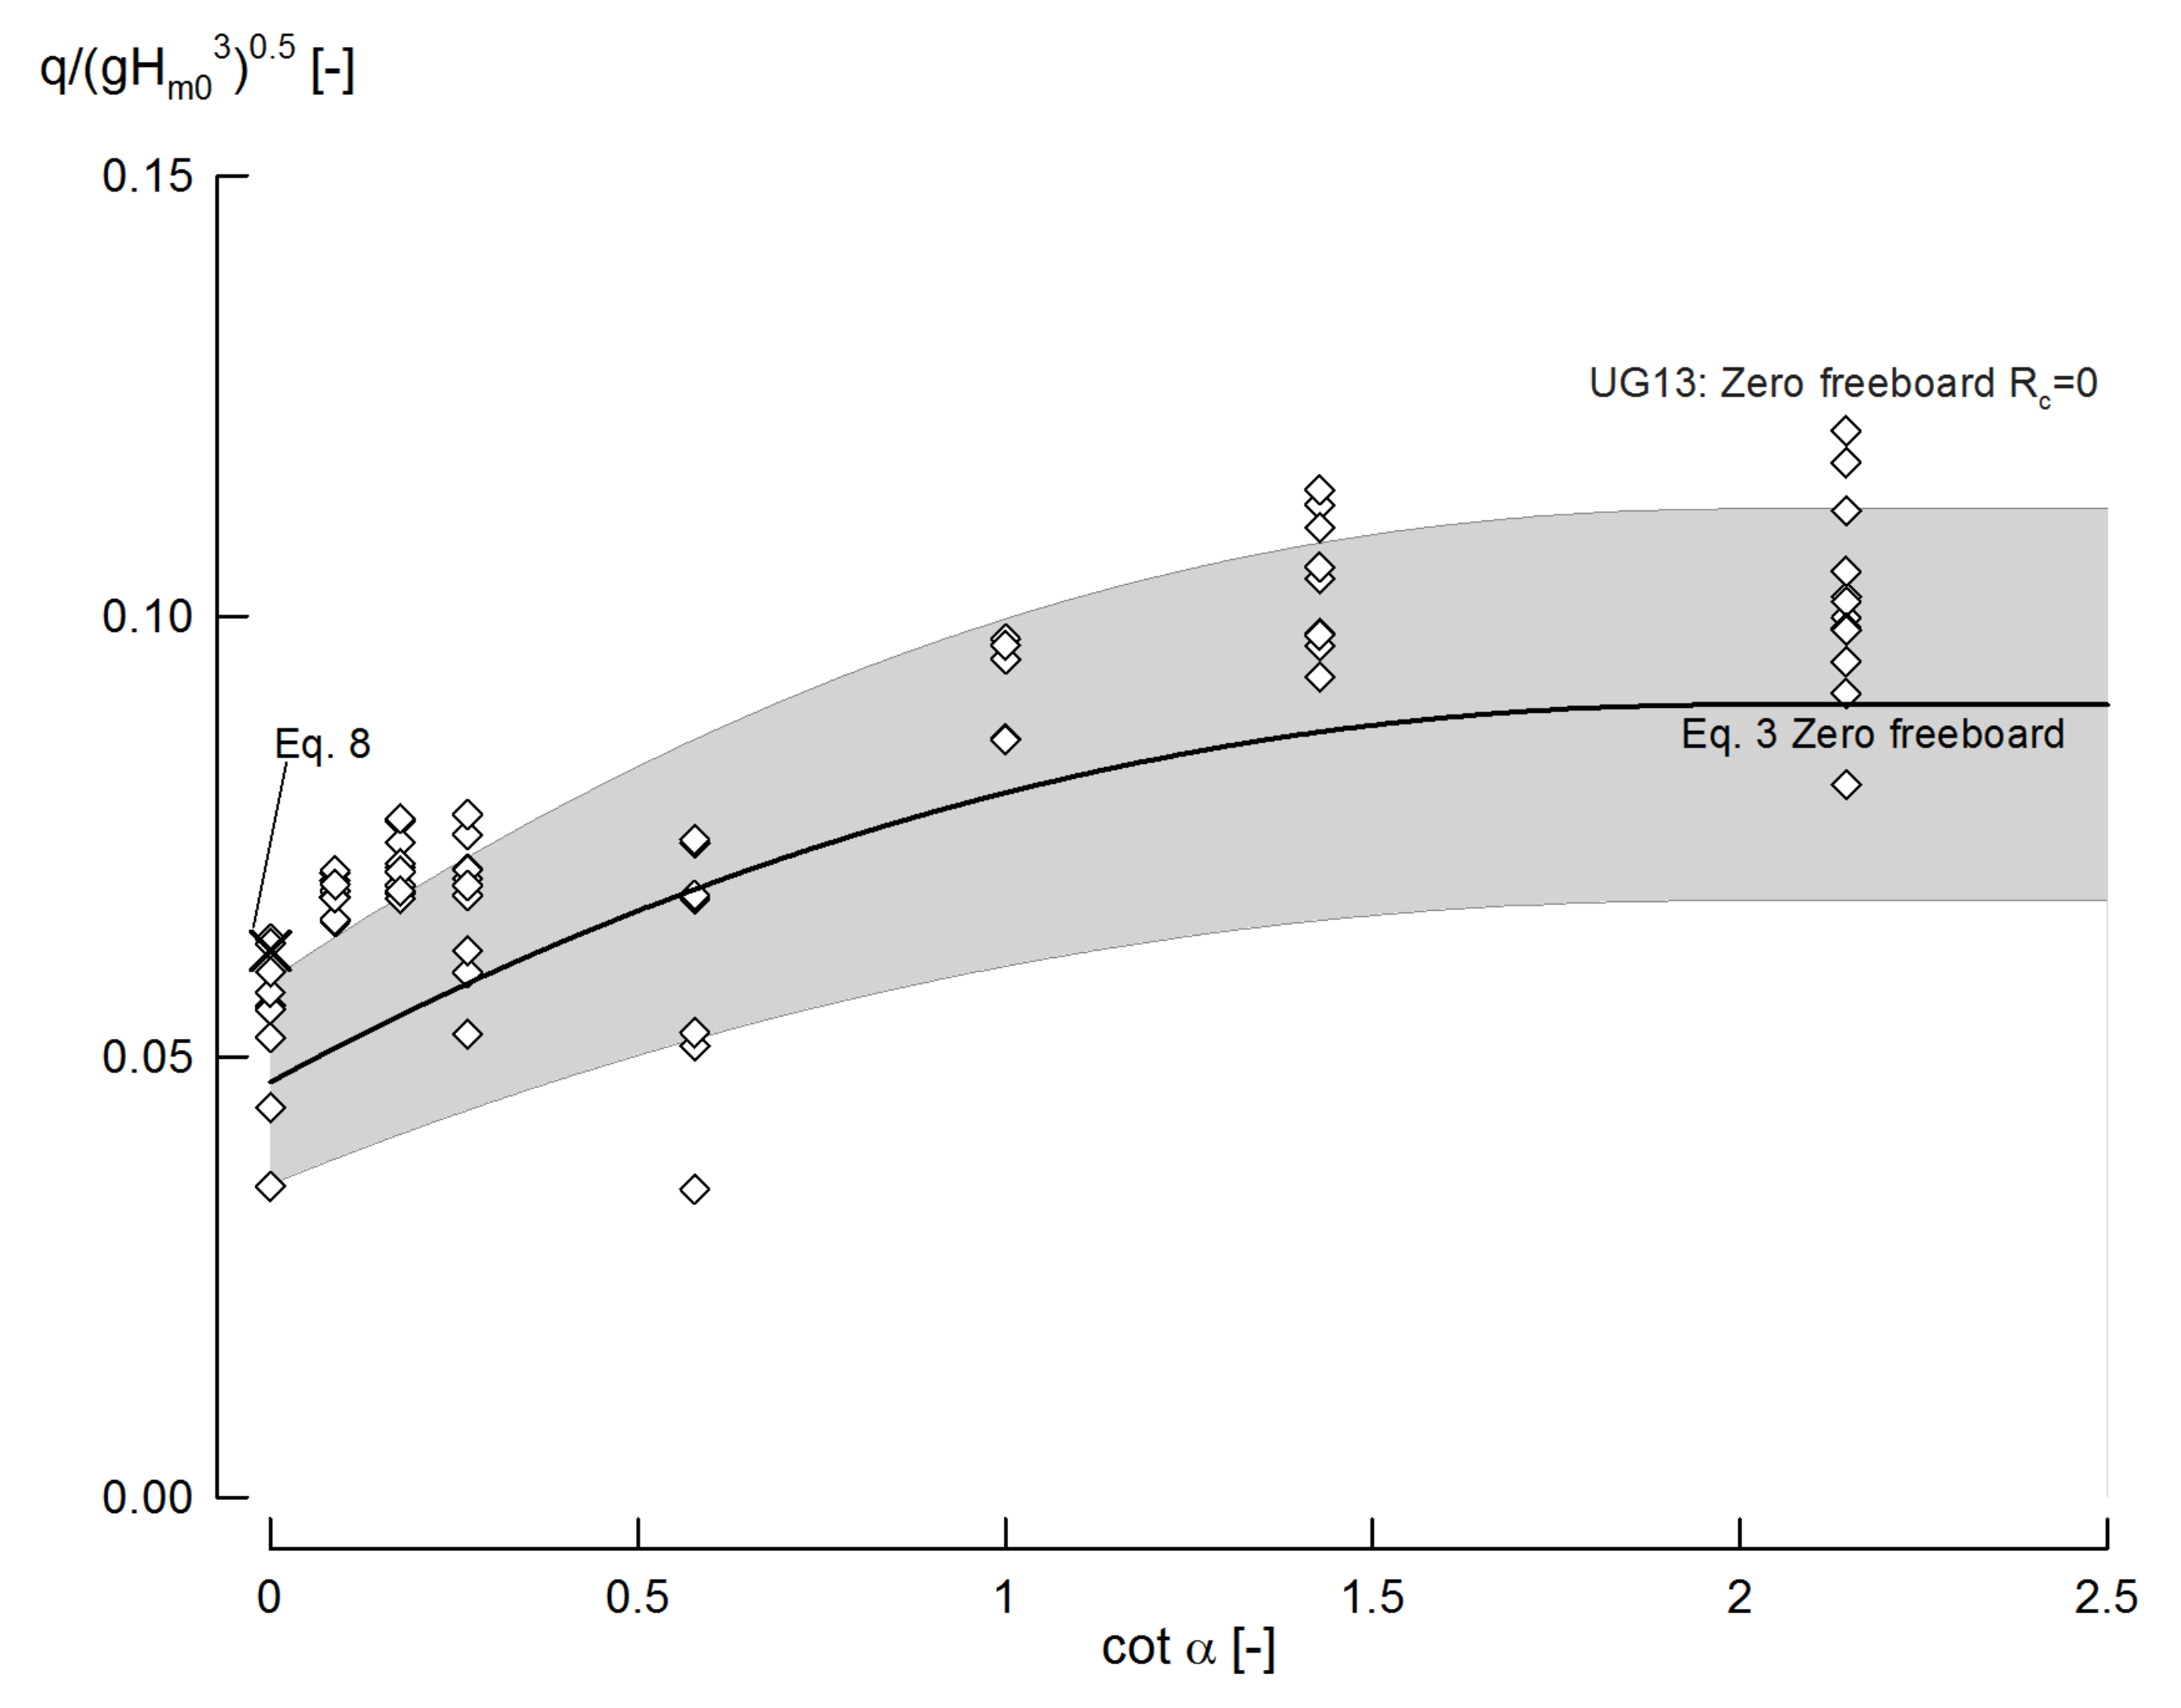
Across the whole UG13 dataset (mild, steep, very steep slopes and vertical walls) a consistent underprediction of the overtopping values for very small and zero relative crest freeboards is seen. This is also confirmed by Figure 13 which shows the UG13 zero freeboard () data (white diamonds) compared to the prediction of Equation (3) for the zero freeboard case and Equation (8) for vertical walls with zero freeboards. Almost all the overtopping values are underpredicted by Equation (3). Moreover, as seen in Table 7, 45.2% of the tests (from a total of 73 tests) with zero freeboard are predicted outside the 90% confidence band, while by definition only 10% of the tests should be predicted outside the 90% confidence band (considering a sufficiently large dataset). Also for (inside the range of very small freeboards defined in Table 2) 16.7% of the tests are predicted outside the 90% confidence band. For small () and large () relative crest freeboards, the percentage is close to 10%.
6. Discussion and Conclusions
The knowledge of the wave overtopping rates is a basic aspect of the performance of an OWEC as its design needs to be adapted to maximize the overtopping and therefore the electricity output. The range of steep low-crested structures (steep slopes to vertical walls, with very small and zero freeboards) is optimal for this purpose. Recently, overtopping prediction formulae for this type of structures have been published by Victor and Troch [10], and van der Meer and Bruce [11]. However, the accuracy of these prediction formulae for steep low-crested structures has not been studied. With the new UG13 dataset obtained at Ghent University it is possible to critically analyse and validate the accuracy of the prediction formulae. This new dataset adds overtopping data in the range of steep slopes to vertical walls, with small and zero freeboards.
Between the Victor and Troch [10] formulae (Equation (2) and Table 3) and the van der Meer and Bruce [11] formulae (Equations (3)–(6)), there is a special interest in the latter, as they are suggested in the EurOtop (2016) manual [8] as the reference prediction for very steep slopes to vertical walls with very small and zero freeboard. However, the prediction formulae by Victor and Troch [10] are in general more accurate (i.e., smaller RMSE values for the same data) in predicting the overtopping values of the UG13 dataset than the van der Meer and Bruce [11] formulae.
None of the formulae where validated explicitly by data for very steep slopes to vertical walls, and very small to zero freeboards, i.e., steep low-crested structures. UG13 can be used to check the accuracy of the prediction in this range, previously a knowledge gap in the literature. For these conditions, the new zones Z1* (, ), Z2* (, ) and Z3* (, ) are defined with the UG13 extension data. Van der Meer and Bruce [11] formulae have a good accuracy for mild slopes and steep slopes (Figure 9 and Figure 10), while for very steep slopes (Figure 11) and vertical walls (Figure 12) the trend of the data is slightly different than the prediction, causing a small overprediction for relative crest freeboards and a small underprediction for .
For very small and zero relative crest freeboards () there is a consistent underprediction across all the slope ranges by van der Meer and Bruce [11] formulae. This is confirmed graphically by Figure 13, by the RMSE values for various ranges of relative crest freeboards (Table 6) and by the large percentage of UG13 data for zero freeboard outside the 90% confidence band of the prediction (Table 7).
The accuracy of the prediction by van der Meer and Bruce [11] can improve by refitting the a, b and c coefficients in Equations (4)–(6) by adding the UG13 dataset to the previous UG10 dataset and CLASH data. This is possible through the complete range of slope angles () and relative crest freeboards (). With this updated fit, the accuracy will increase for very steep slopes towards vertical walls, and for very small relative freeboards towards the zero freeboard case, while maintaining the achieved accuracy for the more conventional ranges. This increased accuracy of the prediction can certainly have an impact in OWECs, as the devices will be better designed for the maximum overtopping rates, maximizing the electricity output while staying under operational conditions and avoiding damage to the device.
Acknowledgments
Authors would like to acknowledge Justine Mollaert and Sofie Peelman for performing the UG13 overtopping model tests, and the support of the technical staff at the Department of Civil Engineering of Ghent University during the experiments.
Author Contributions
David Gallach-Sánchez analysed the overtopping data, made the literature review, compared the acquired data to the existing prediction formulae and wrote the paper; with support, discussion and revision from Peter Troch and Andreas Kortenhaus.
Conflicts of Interest
The authors declare no conflict of interest.
Abbreviations
The following abbreviations are used in this manuscript:
| OBREC | Overtopping BReakwater for Energy Conversion |
| OWEC | Overtopping wave energy converter |
| RMSE | Root mean square error |
| SSG | Seawave Slot-cone Generator |
| Tapchan | Tapered Cahnnle Wave Power Device |
| WEC | Wave energy converter |
References
- Falcão, A.F.O. Wave energy utilization: A review of the technologies. Renew. Sus. Energy Rev. 2010, 14, 899–918. [Google Scholar] [CrossRef]
- Kofoed, J.P.; Frigaard, P.; Friis-Madsen, E.; Sørensen, H.C. Prototype testing of the wave energy converter wave dragon. Renew. Energy 2006, 31, 181–189. [Google Scholar] [CrossRef]
- Fernandez, H.; Iglesias, G.; Carballo, R.; Castro, A.; Fraguela, J.A.; Taveira-Pinto, F.; Sanchez, M. The new wave energy converter WaveCat: Concept and laboratory tests. Mar. Struct. 2012, 29, 58–70. [Google Scholar] [CrossRef]
- Mehlum, E. Tapchan. In Hydrodynamics of Ocean Wave Eenrgy Utilization; Evans, D.V., Falcão, A.F.O., Eds.; Springer: Berlin, Germany, 1986; pp. 51–55. [Google Scholar]
- Margheritini, L.; Vicinanza, D.; Frigaard, P. SSG wave energy converter: Design, reliability and hydraulic performance of an innovative overtopping device. Renew. Energy 2009, 34, 1371–1380. [Google Scholar] [CrossRef]
- Vicinanza, D.; Contestabile, P.; Quvang Harck Nørgaard, J.; Lykke Andersen, T. Innovative rubble mound breakwaters for overtopping wave energy conversion. Coast. Eng. 2014, 88, 154–170. [Google Scholar] [CrossRef]
- Pullen, T.; Allsop, W.; Bruce, T.; Kortenhaus, A.; Schüttrumpf, H.; van der Meer, J.W. EurOtop. Wave Overtopping of Sea Defences and Related Structures: Assessment Manual; Kuratorium für Forschung im Küsteningenieurwesen: Hamburg, Germany, 2007; p. 178. [Google Scholar]
- Van der Meer, J.W.; Allsop, W.; Bruce, T.; De Rouck, J.; Kortenhaus, A.; Pullen, T.; Schüttrumpf, H.; Troch, P.; Zanuttigh, B. EurOtop. Manual on Wave Overtopping of Sea Defences and Related Structures. 2016. Available online: http://www.overtopping-manual.com/docs/EurOtop%20II%202016%20Pre-release%20October%202016.pdf (accessed on 4 January 2018).
- Kofoed, J.P. Wave Overtopping of Marine Structures: Utilization of Wave Energy. Ph.D. Thesis, Aalborg University, Aalborg, Denmark, 2002. [Google Scholar]
- Victor, L.; Troch, P. Wave overtopping at smooth impermeable steep slopes with low crest freeboards. J. Waterw. Port Coast. Ocean Eng. 2012, 138, 372–385. [Google Scholar] [CrossRef]
- Van der Meer, J.; Bruce, T. New physical insights and design formulas on wave overtopping at sloping and vertical structures. J. Waterw. Port Coast. Ocean Eng. 2014, 140. [Google Scholar] [CrossRef]
- Tedd, J.; Peter Kofoed, J. Measurements of overtopping flow time series on the Wave Dragon, wave energy converter. Renew. Energy 2009, 34, 711–717. [Google Scholar] [CrossRef]
- Vicinanza, D.; Margheritini, L.; Kofoed, J.P.; Buccino, M. The SSG wave energy converter: Performance, status and recent developments. Energies 2012, 5, 193–226. [Google Scholar] [CrossRef]
- Zanuttigh, B.; Margheritini, L.; Gambles, L.; Martinelli, L. Analysis of wave reflection from wave energy converters installed as breakwaters in harbour. In Proceedings of the 8th European Wave and Tidal Energy Conference, Uppsala, Sweden, 7–10 September 2009; pp. 384–392. [Google Scholar]
- Vicinanza, D.; Contestabile, P.; Di Lauro, E. Overtopping Breakwater for Wave Energy Conversion: Status and Perspective. In Proceedings of the 12th European Wave and Tidal Energy Conference, Cork, Ireland, 27 August–1 September 2017; pp. 1194-1–1194-9. [Google Scholar]
- Liu, Z.; Hyun, B.S. Numerical Prediction for Overtopping. In Proceedings of the Oceans 2008—MTS/IEEE Kobe Techno-Ocean, Kobe International Exhibition Hall, Kobe, Japan, 8–11 April 2008. [Google Scholar]
- Di Lauro, E.; Maza, M.; Lara, J.L.; Contestabile, P.; Losada, I.J.; Vicinanza, D. Numerical Analysis of a Non-Conventional Breakwater for Wave. In Proceedings of the International Short Course and Conference on Applied Coastal Research (SCACR 2017), Santander, Spain, 3–6 October 2017. [Google Scholar]
- De Rouck, J.; Verhaeghe, H.; Geeraerts, J. Crest level assessment of coastal structures-General overview. Coast. Eng. 2009, 56, 99–107. [Google Scholar] [CrossRef]
- Verhaeghe, H.; De Rouck, J.; van der Meer, J.W. Combined classifier-quantifier model: A 2-phases neural model for prediction of wave overtopping at coastal structures. Coast. Eng. 2008, 55, 357–374. [Google Scholar] [CrossRef]
- Victor, L. Optimization of the Hydrodynamic Performance of Overtopping Wave Energy Converters: Experimental Study of Optimal Geometry and Probability Distribution of Overtopping Volumes. Ph.D. Thesis, Ghent University, Ghent, Belgium, 2012. [Google Scholar]
- Victor, L.; Troch, P. Experimental study on the overtopping behaviour of steep slopes—Transition between mild slopes and vertical walls. In Proceedings of the 33rd International Conference on Coastal Engineering, Santander, Spain, 1–6 July 2012; pp. 1–23. [Google Scholar]
- Victor, L.; Troch, P. Development of a test set-up to measure large wave-by-wave overtopping masses. In Proceedings of the 3rd International Conference on the Applications of Physical Modelling to Port and Coastal Protection (Coastlab10), Barcelona, Spain, 28 September–1 October 2010; Number 1; pp. 1–9. [Google Scholar]
- Troch, P.; Mollaert, J.; Peelman, S.; Victor, L.; van der Meer, J.W.; Gallach-Sánchez, D.; Kortenhaus, A. Experimental study of overtopping performance for the cases of very steep slopes and vertical walls with very small freeboards. In Proceedings of the 34th International Conference on Coastal Engineering (ICCE 2014), Seoul, Korea, 2015; Volume 138, p. 270. [Google Scholar]
- Van der Meer, J.W.; Janssen, J. Wave Run-Up and Wave Overtopping at Dikes and Revetments; Technical Report; Delft Hydraulics: Delft, The Netherlands, 1994. [Google Scholar]
- Bruce, T.; van der Meer, J.W.; Allsop, W.; Franco, L.; Kortenhaus, A.; Pullen, T.; Schüttrumpf, H. EurOtop revisited. Part 2: Vertical Structures. In Proceedings of the ICE, Coasts, Marine Structures and Breakwaters, Edinburgh, UK, 18–20 September 2013. [Google Scholar]
- Smid, R. Untersuchungen Zur Ermittlung Der Mittleren WellenüBerlaufrate an Einer Senkrechten Wand Und Einer 1: 1, 5 Geneigten BöSchung für Versuche Mit Und Ohne Freibord; Technical Report; Leichtweiss-Institute: Braunschweig, Germany, 2001. [Google Scholar]
- Mansard, E.P.D.; Funke, E.R. The Measurement of Incident and Reflected Spectra Using a least Squares Method. In Proceedings of the 17th International Conference on Coastal Engineering (ICCE 1980), Sydney, Australia, 23–28 March 1980; pp. 154–172. [Google Scholar]
Figure 1.
Range of slope angles and relative crest freeboards for OWECs according to Victor and Troch [10] and steep low-crested structures.
Figure 1.
Range of slope angles and relative crest freeboards for OWECs according to Victor and Troch [10] and steep low-crested structures.

Figure 2.
Best fit per slope angle of the a and b coefficients for the UG10 dataset and selected tests of the CLASH database, with the van der Meer and Bruce [11] formulae expressions for (Equation (4)) and (Equation (5)).

Figure 3.
Comparison of overtopping prediction between Victor and Troch [10] (Equation (2)) and van der Meer and Bruce [11] (Equation (3)) for mild slopes () and vertical walls ().
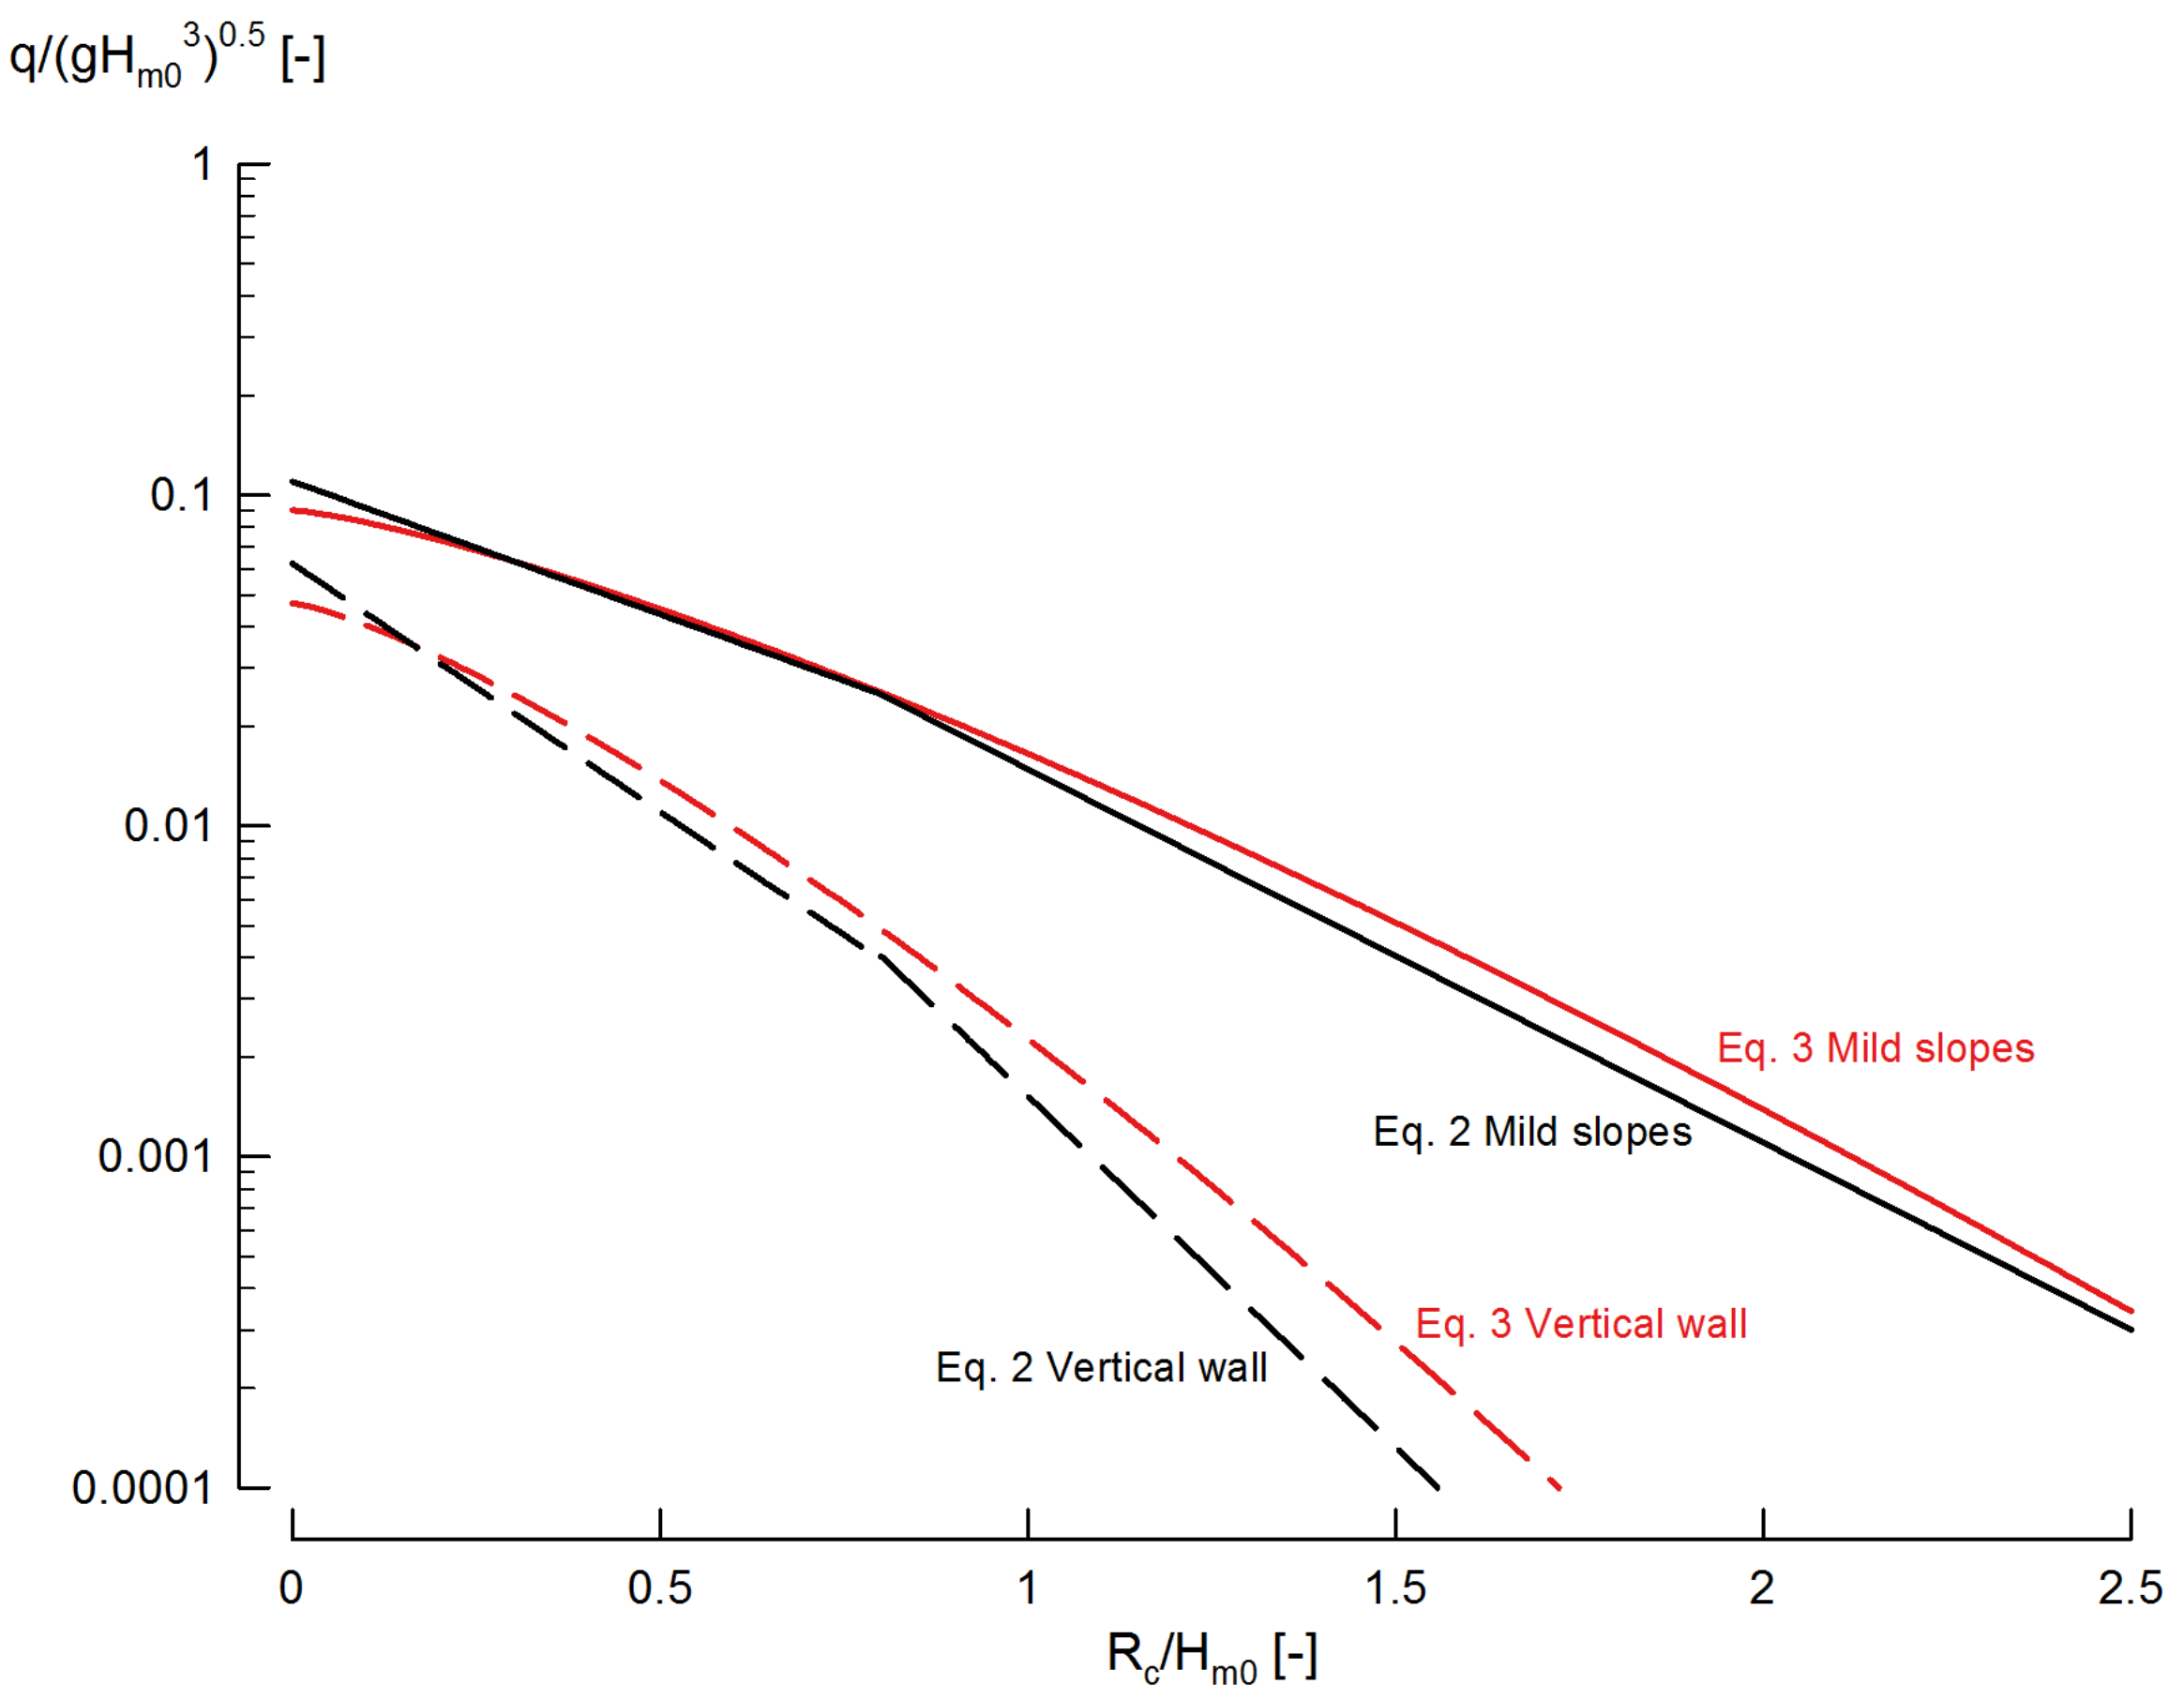
Figure 4.
Test setup of the UG experiments (drawing not to scale).

Figure 5.
(a) Cross section of the test structure; (b) Overtopping box used to measure the overtopping rates designed according to Victor and Troch [22].
Figure 5.
(a) Cross section of the test structure; (b) Overtopping box used to measure the overtopping rates designed according to Victor and Troch [22].
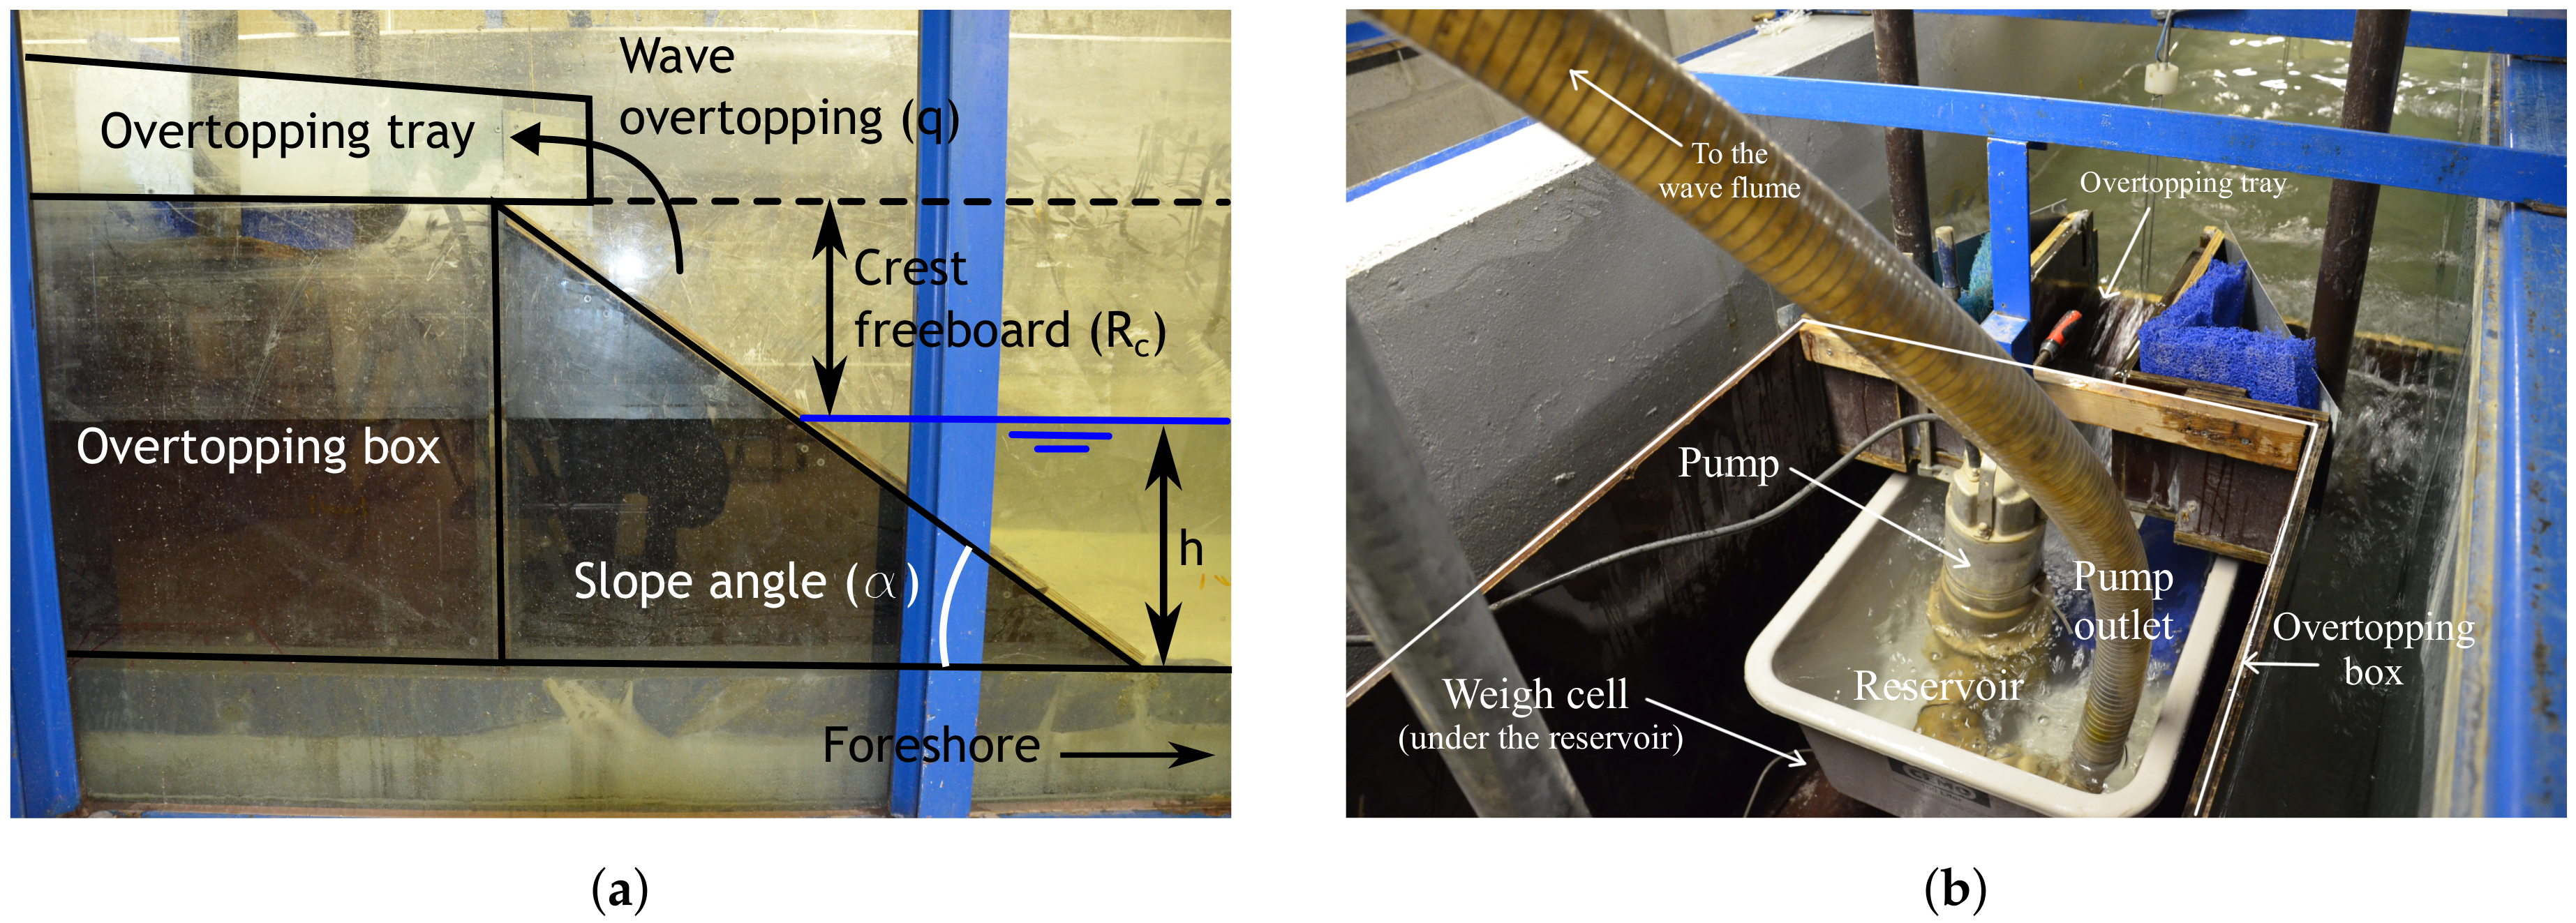
Figure 6.
Slope angle and relative crest freeboard values tested on the UG10 (purple triangles) and UG13 (green circles) datasets.
Figure 6.
Slope angle and relative crest freeboard values tested on the UG10 (purple triangles) and UG13 (green circles) datasets.
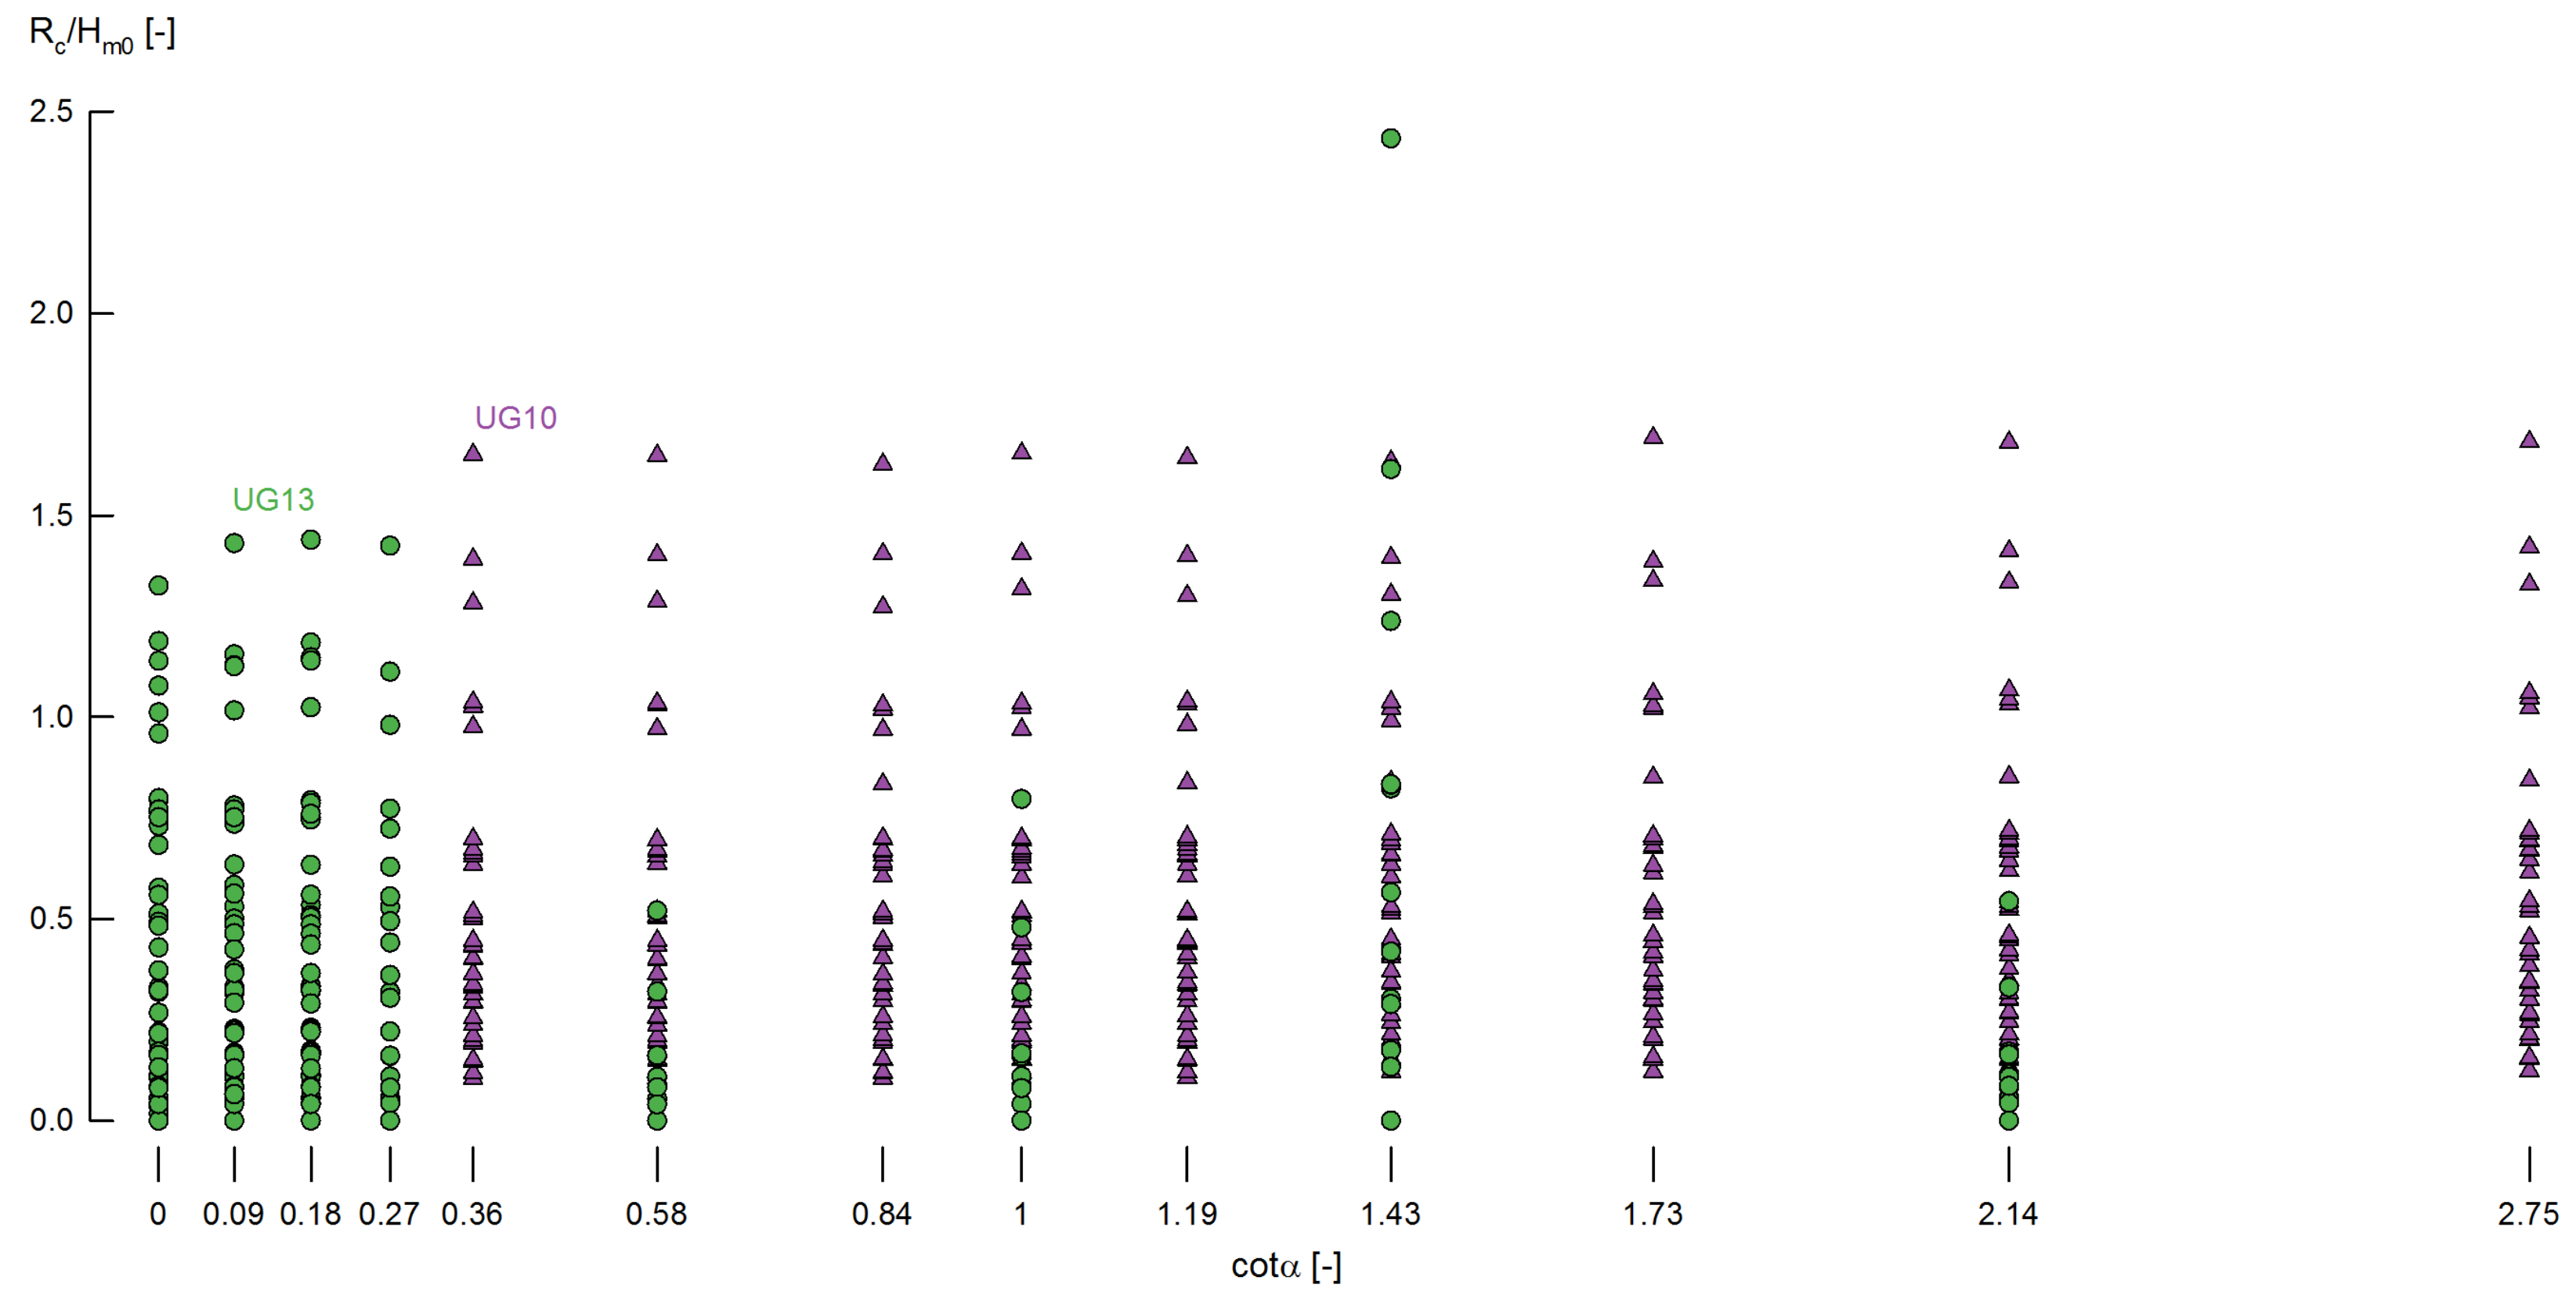
Figure 7.
Dimensionless average wave overtopping as a function of the relative crest freeboard for the UG13 dataset, classified per slope according to Table 1.
Figure 7.
Dimensionless average wave overtopping as a function of the relative crest freeboard for the UG13 dataset, classified per slope according to Table 1.
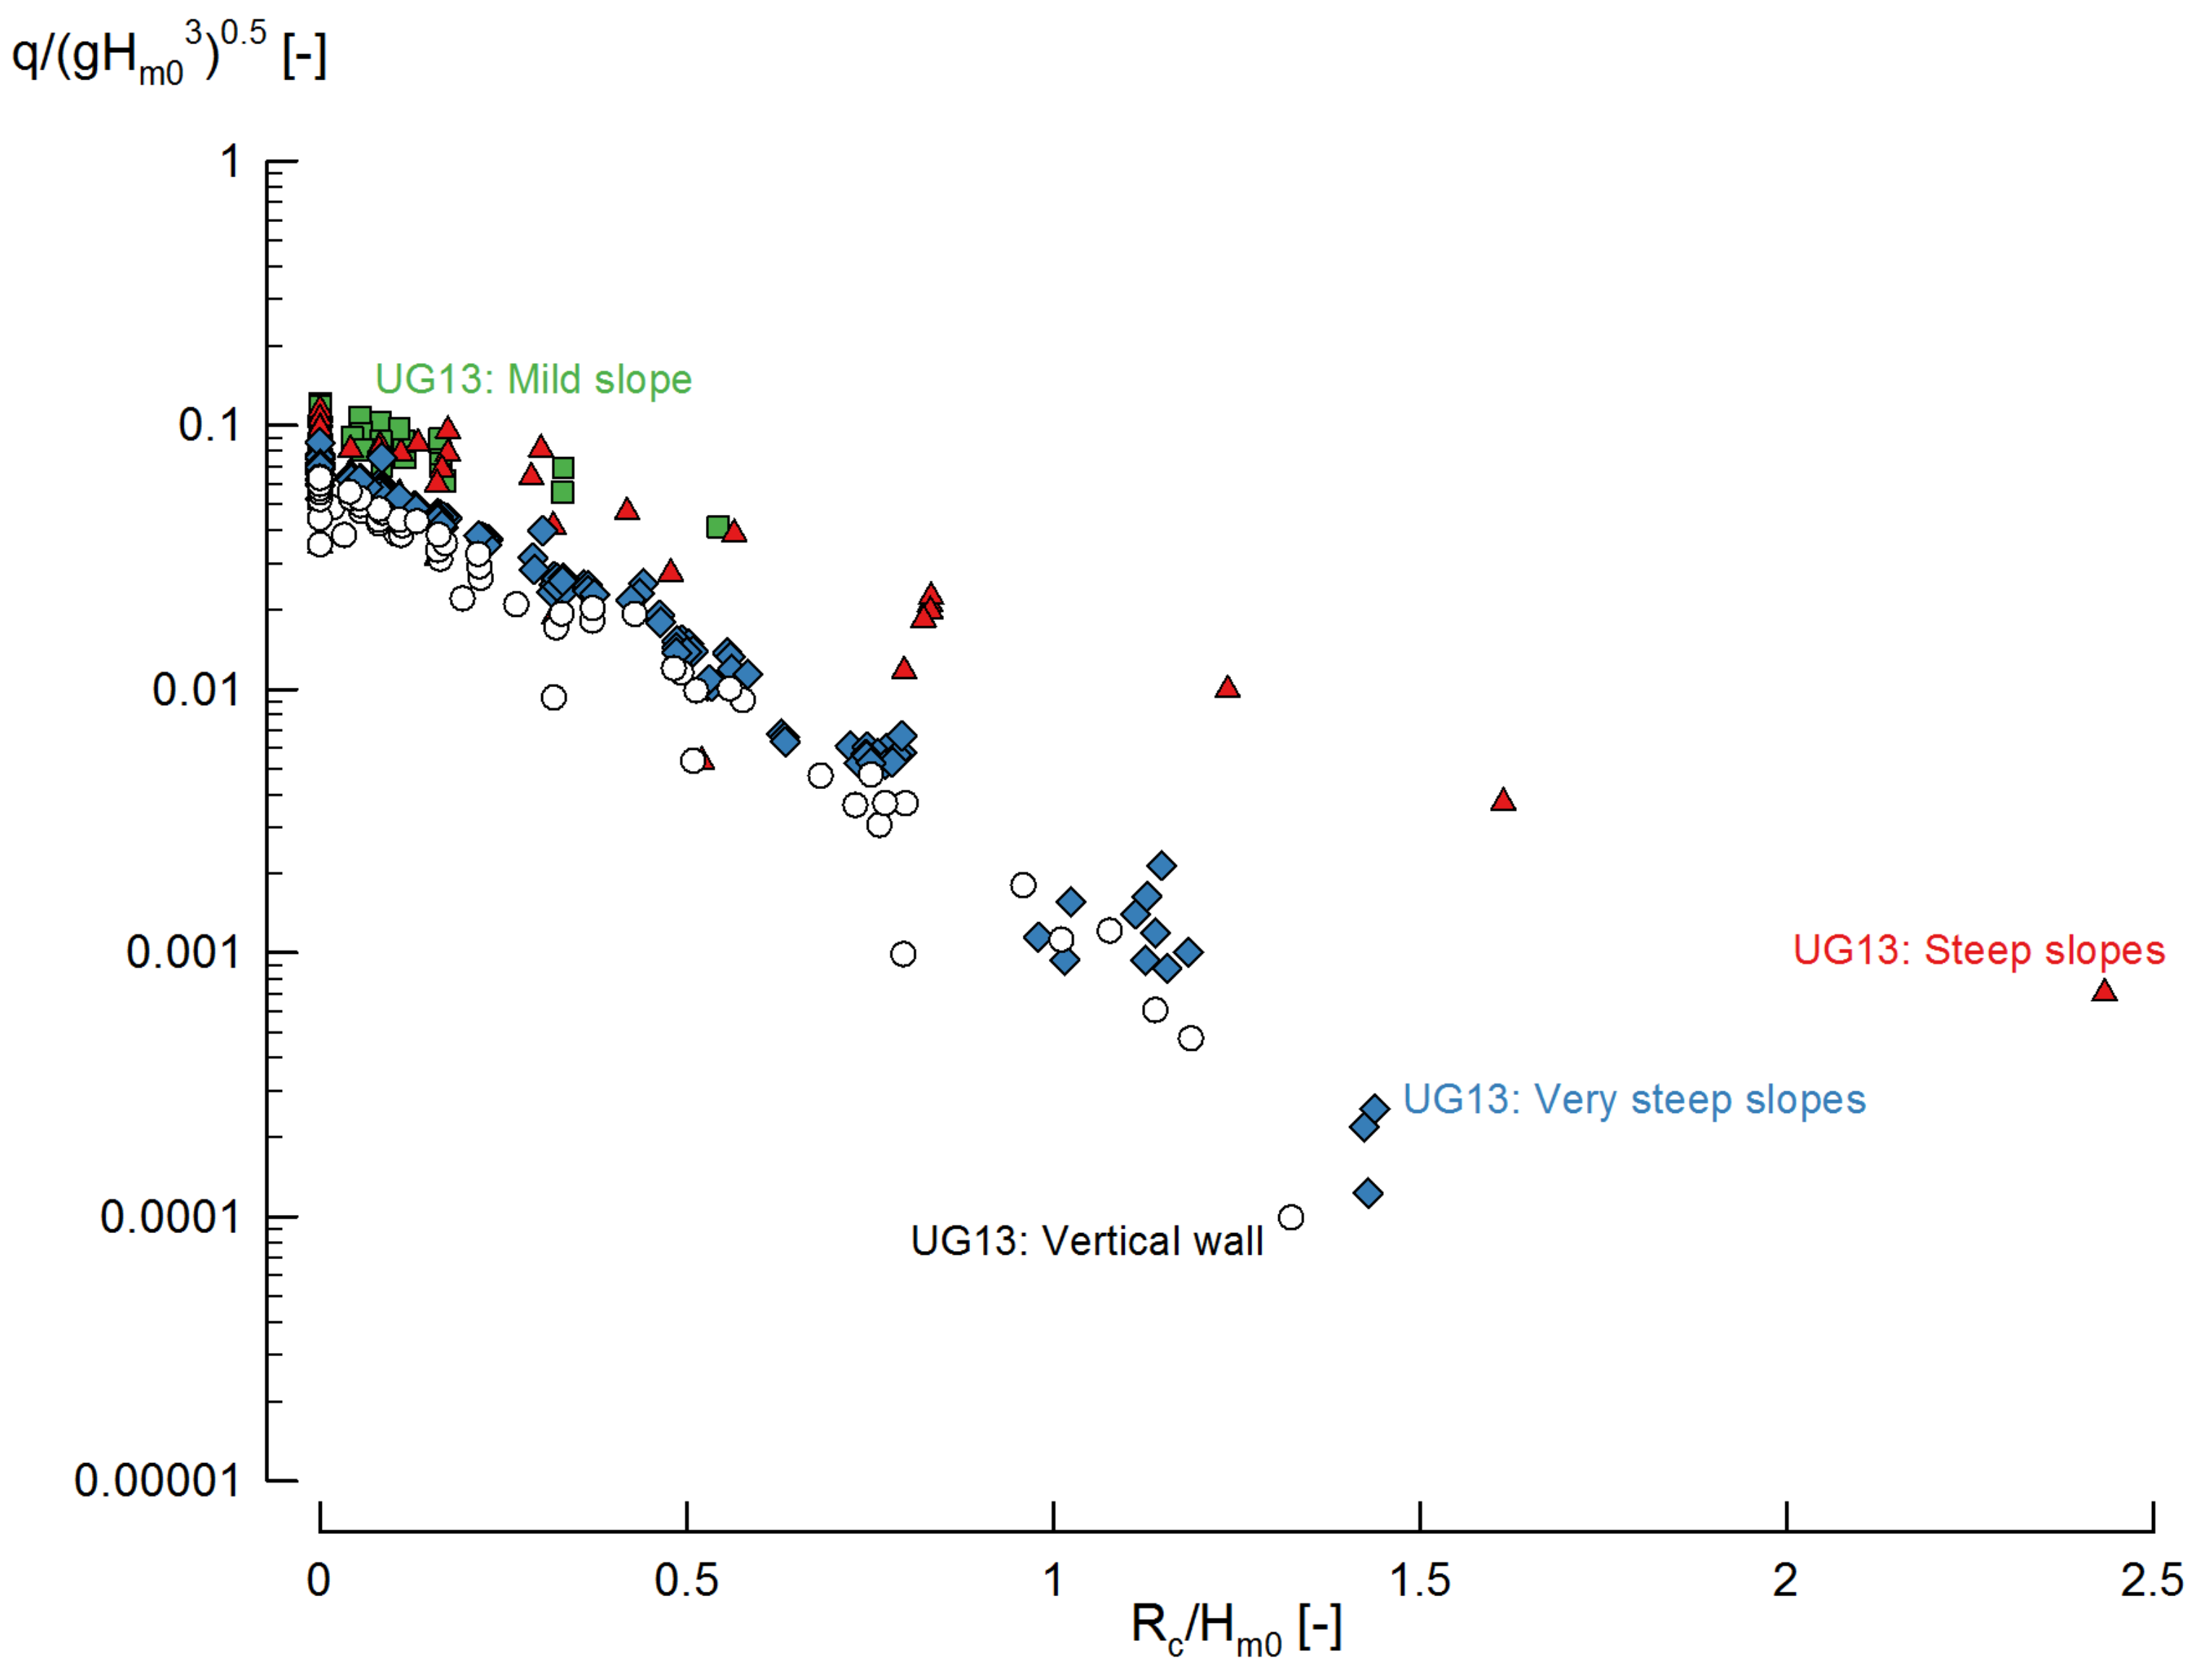
Figure 8.
Dimensionless average wave overtopping as a function of the slope angle () for very small and zero relative crest freeboards ().
Figure 8.
Dimensionless average wave overtopping as a function of the slope angle () for very small and zero relative crest freeboards ().
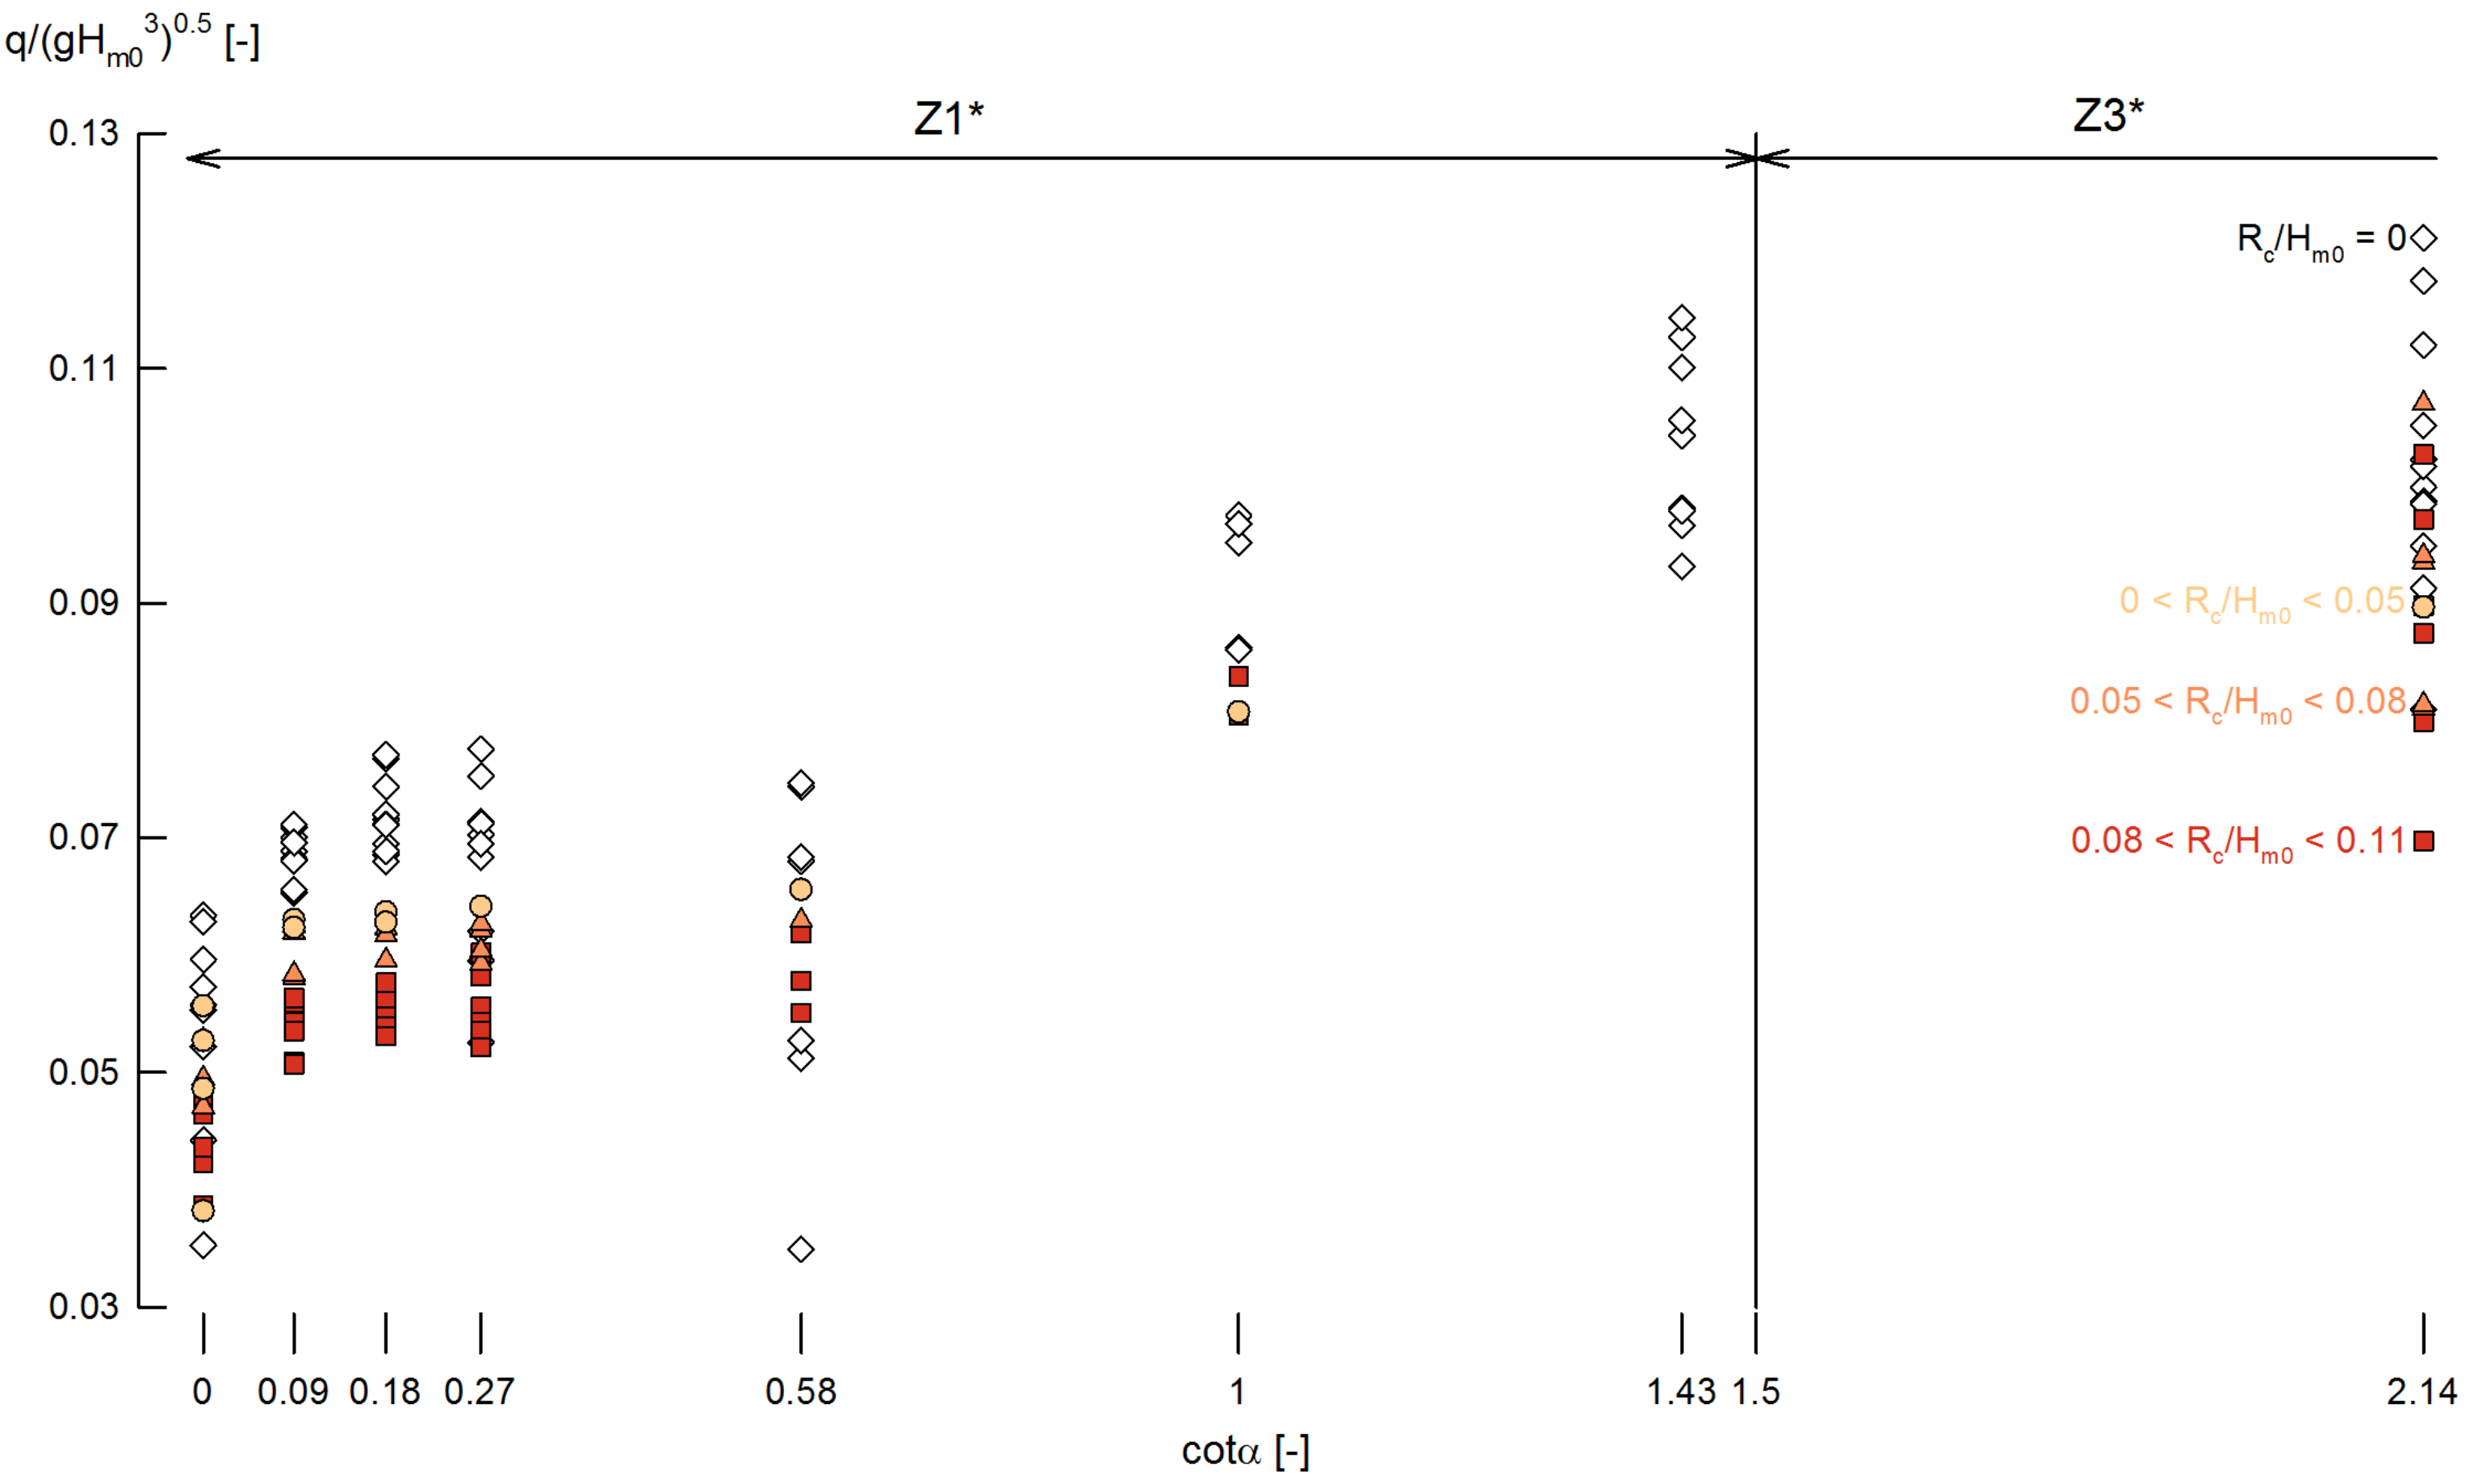
Figure 9.
Dimensionless average wave overtopping as a function of the relative crest freeboard for mild slopes ( and ) of the UG10 and UG13 datasets compared to Equation (3) with the 90% confidence band.
Figure 9.
Dimensionless average wave overtopping as a function of the relative crest freeboard for mild slopes ( and ) of the UG10 and UG13 datasets compared to Equation (3) with the 90% confidence band.
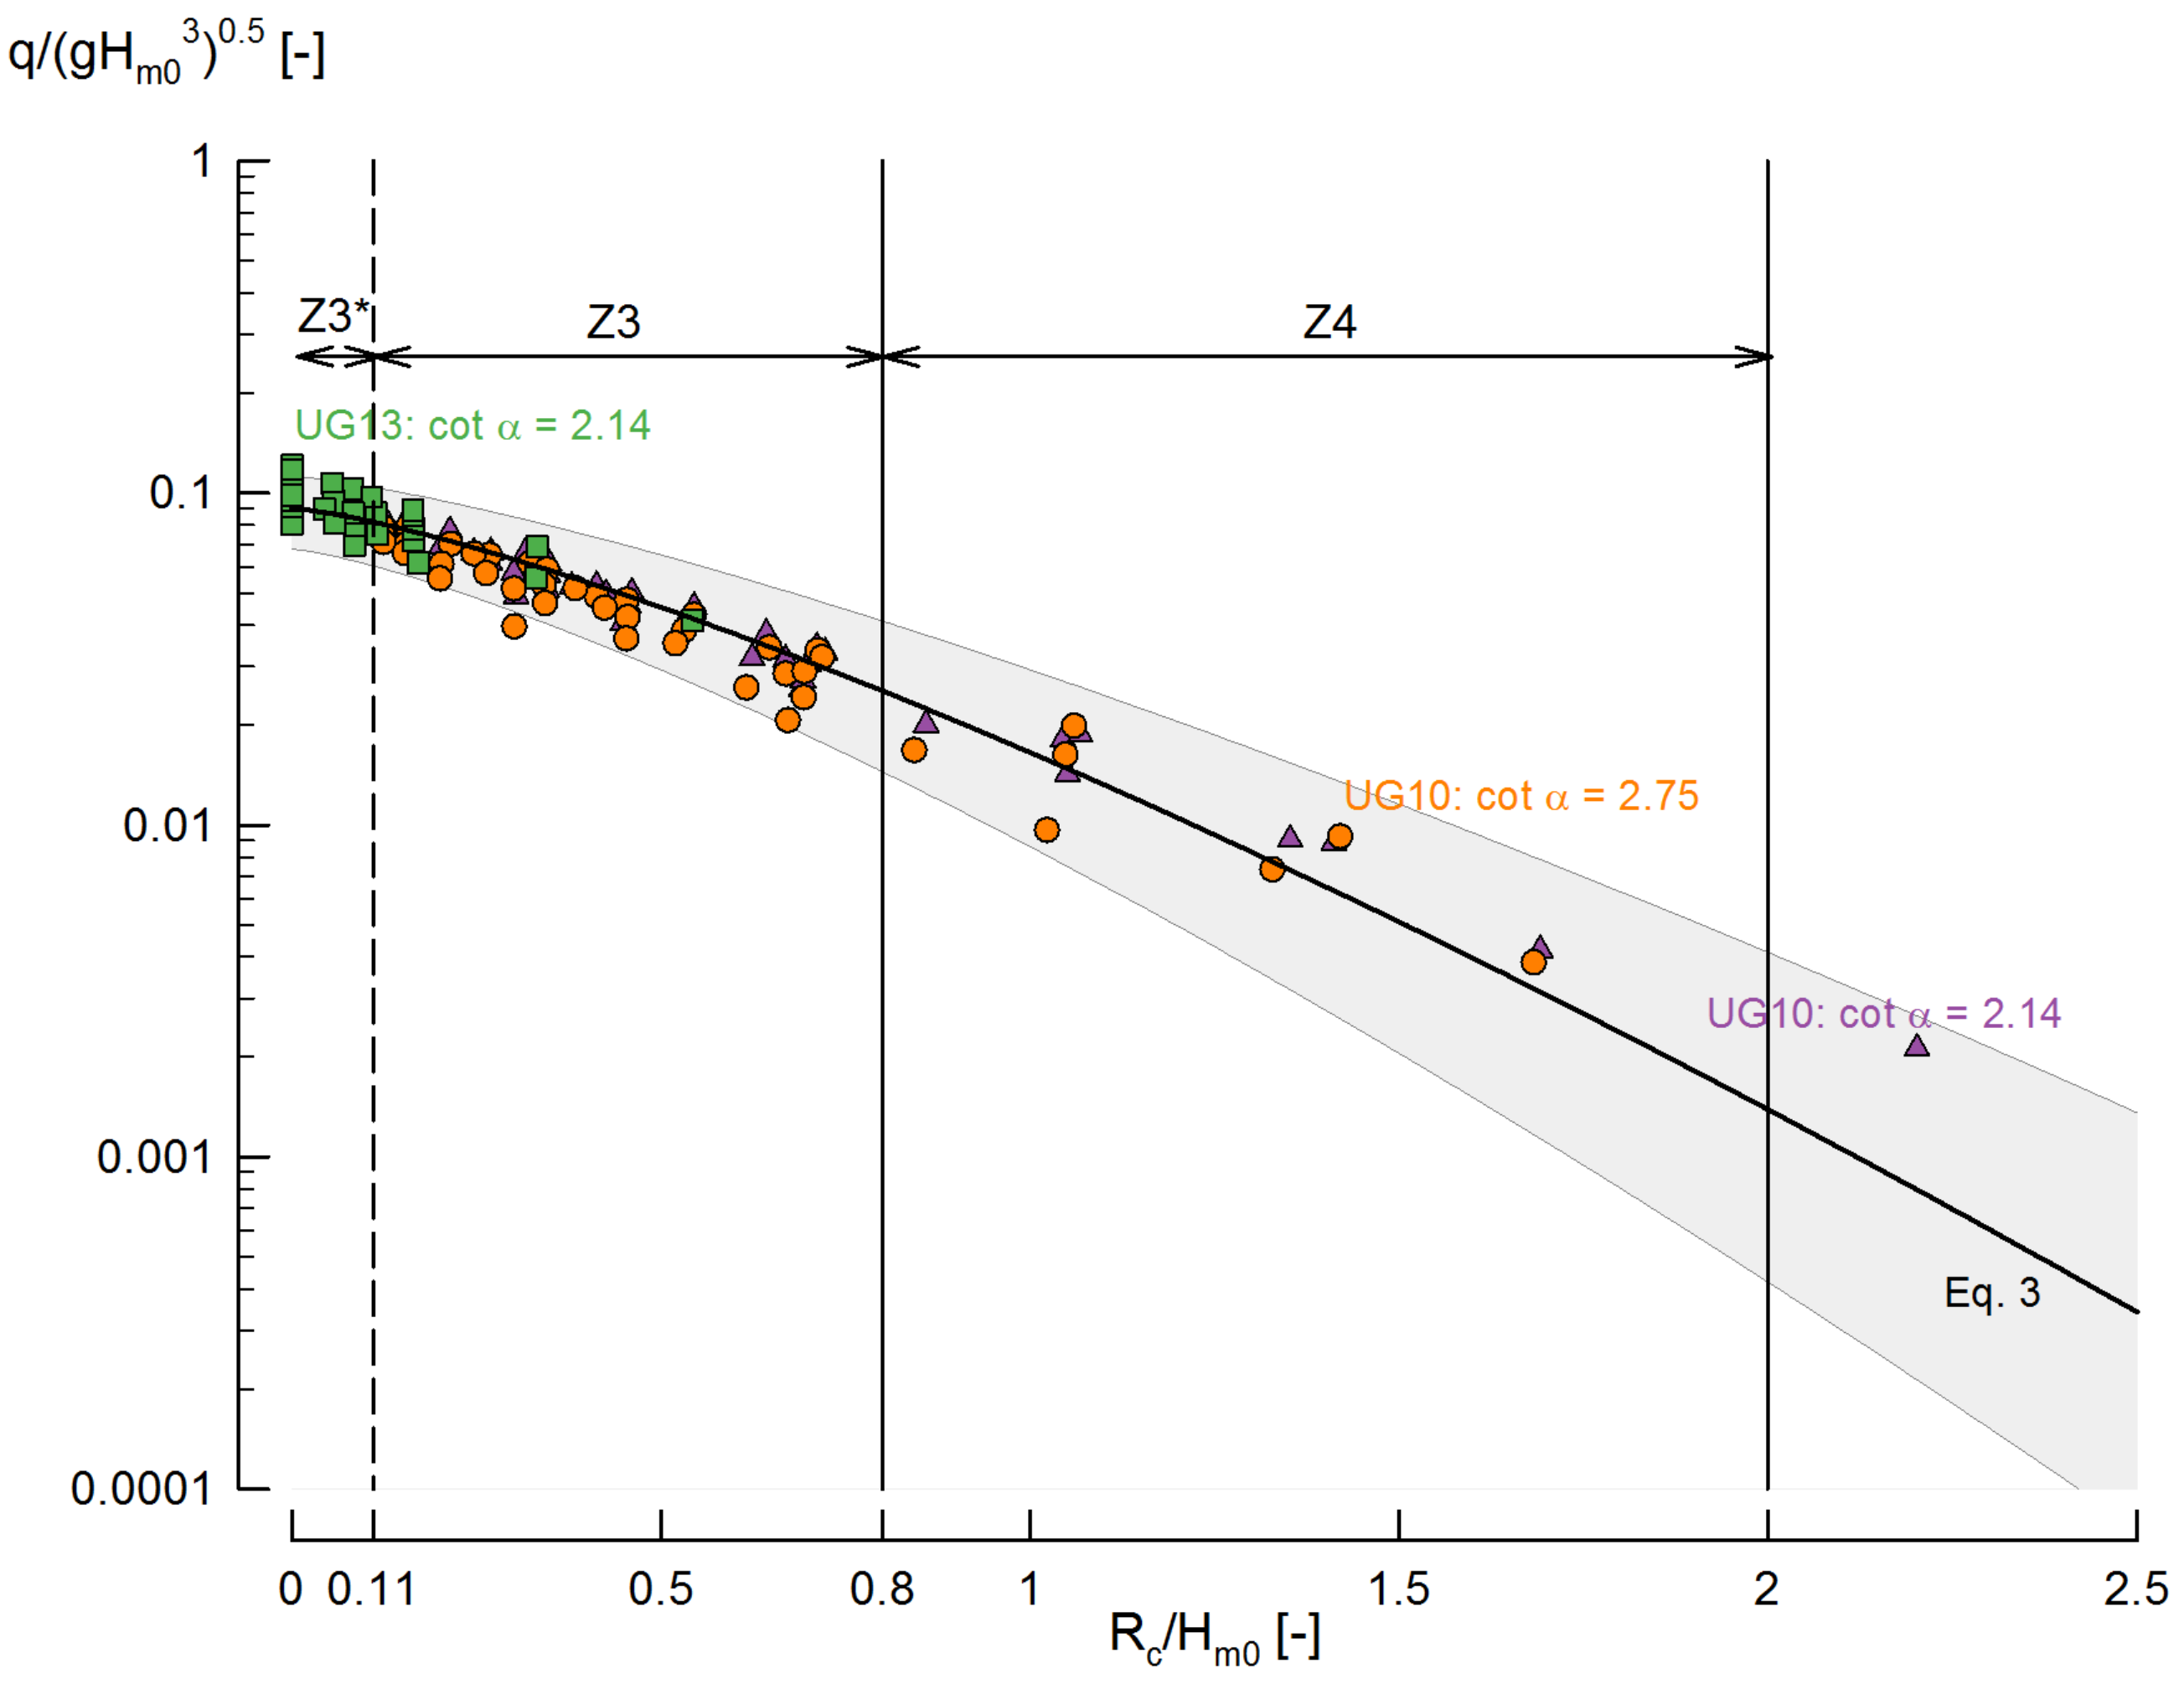
Figure 10.
Dimensionless average wave overtopping as a function of the relative crest freeboard for steep slopes () of the UG10 and UG13 compared to Equation (3) with the 90% confidence band.
Figure 10.
Dimensionless average wave overtopping as a function of the relative crest freeboard for steep slopes () of the UG10 and UG13 compared to Equation (3) with the 90% confidence band.
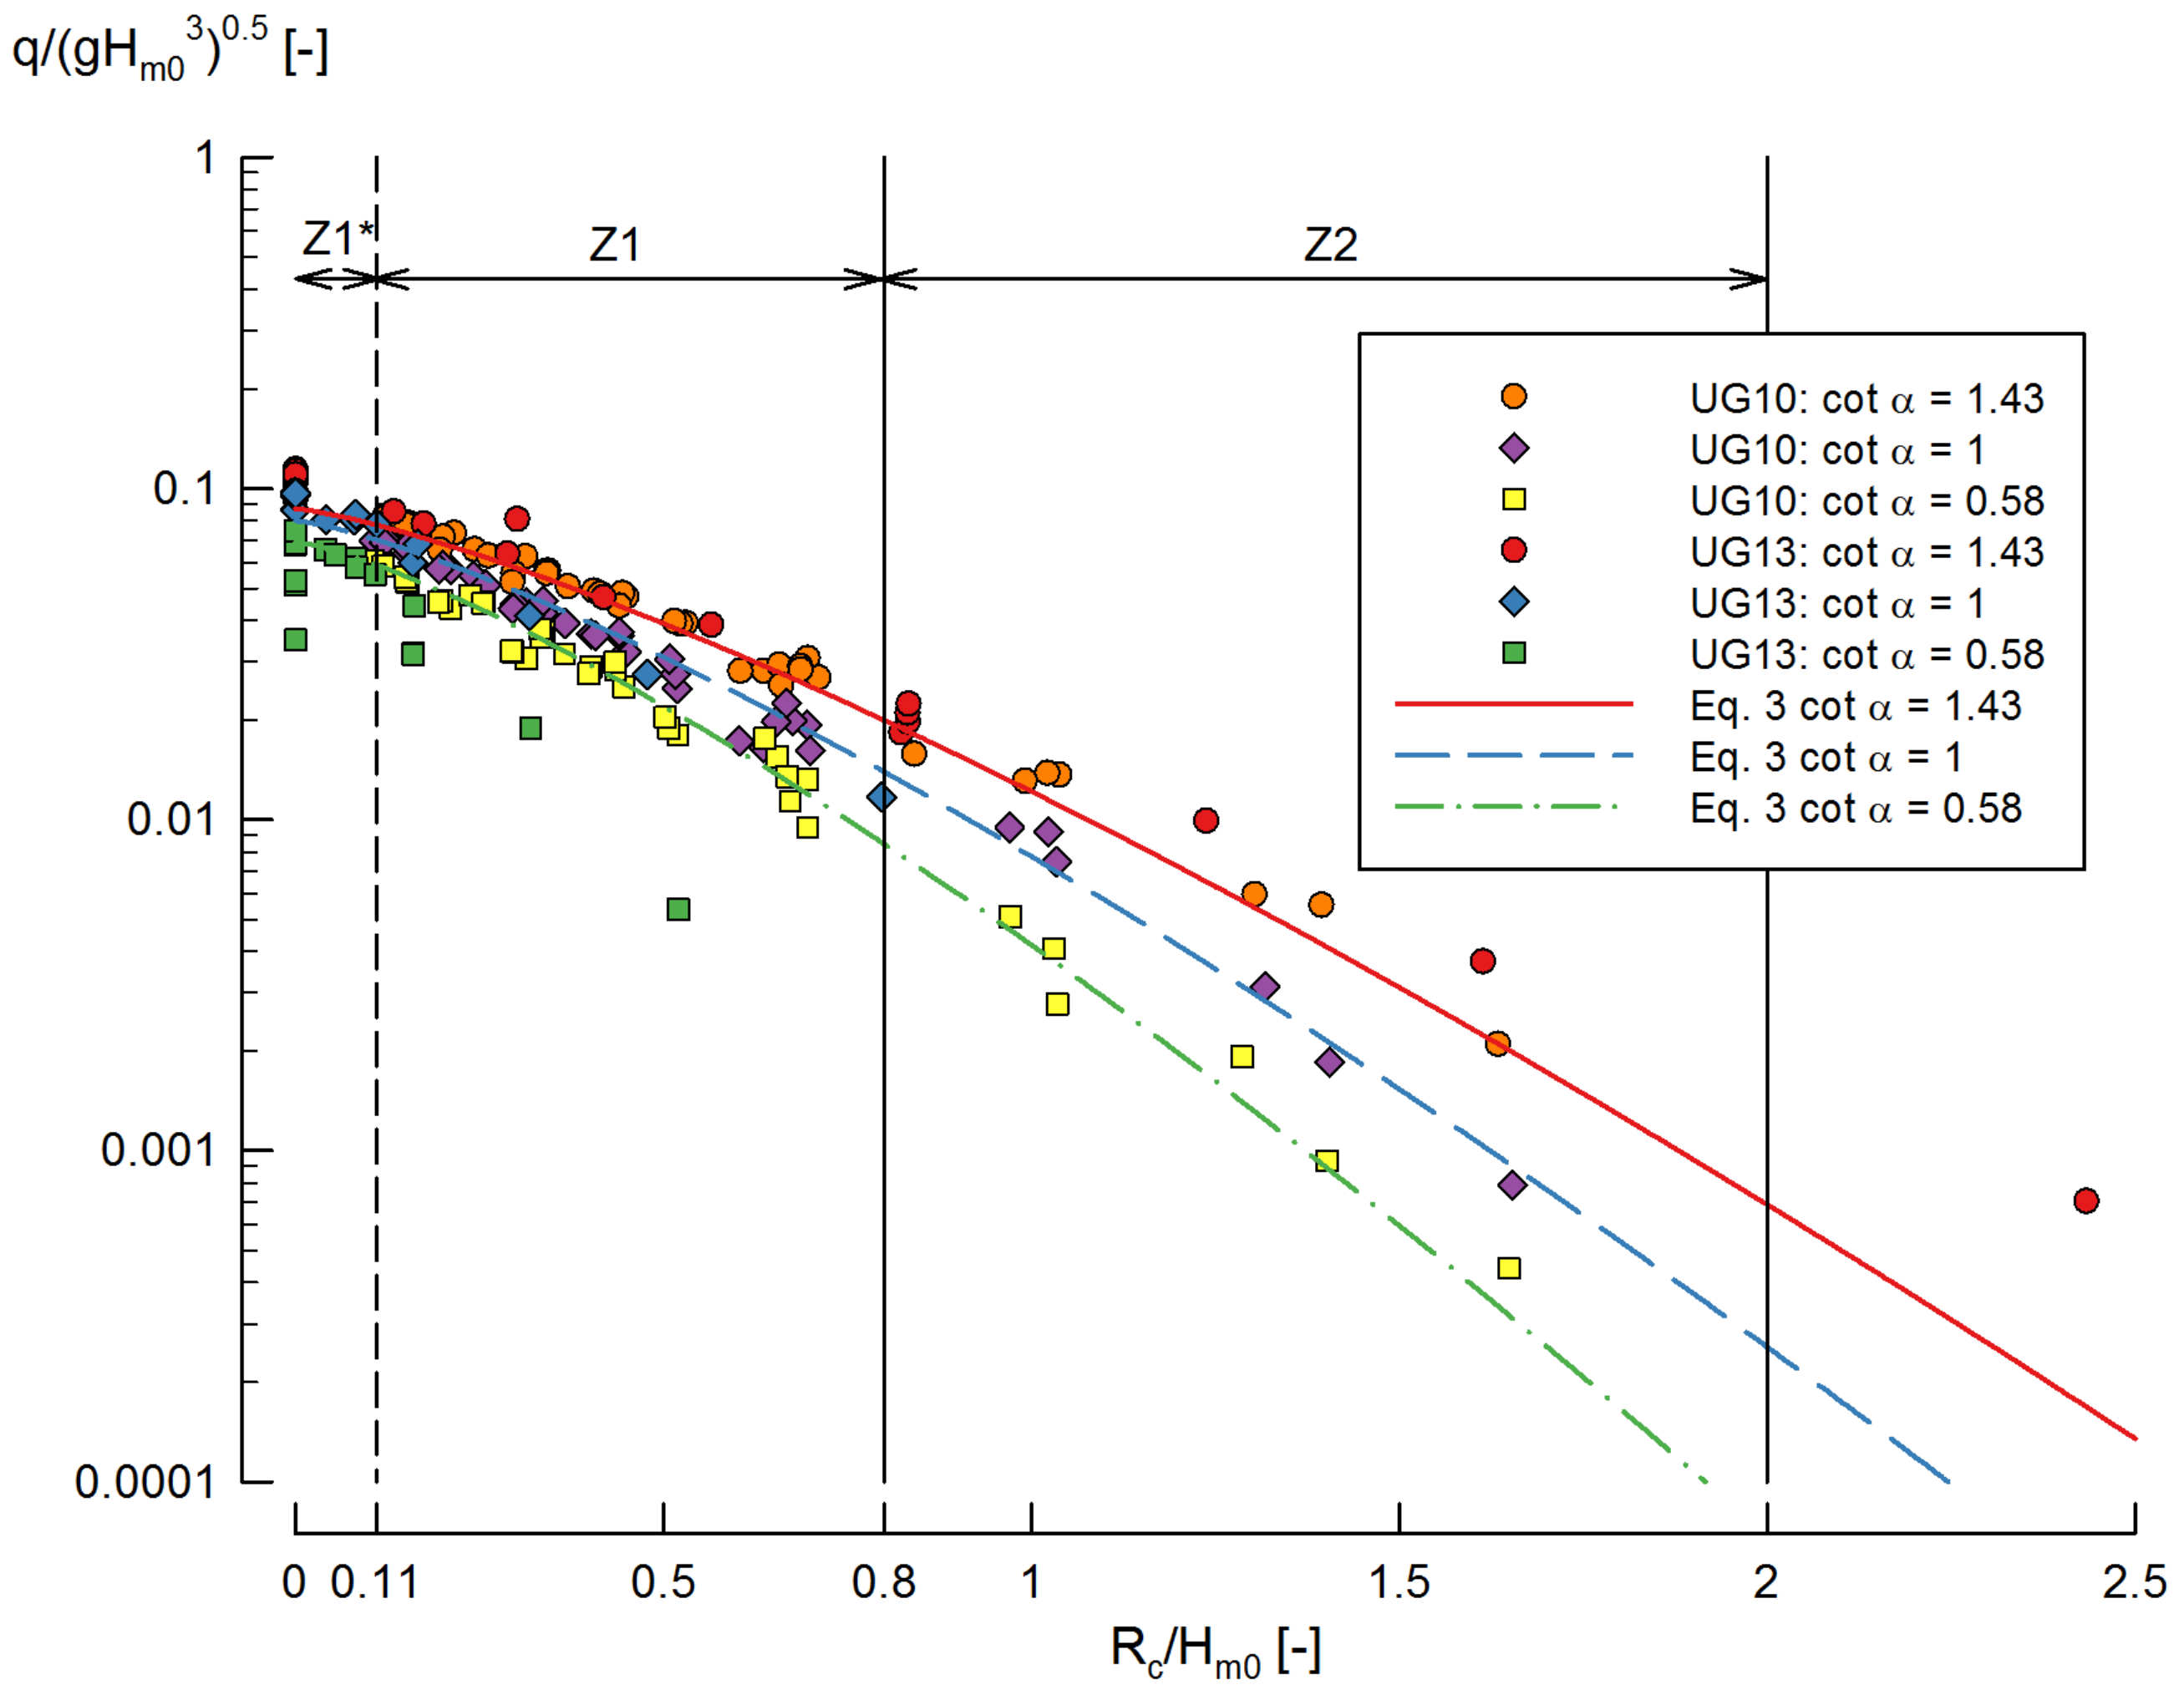
Figure 11.
Dimensionless average wave overtopping as a function of the relative crest freeboard for very steep slopes overtopping data of the UG13 dataset () compared to Equation (3) for with its 90% confidence band.
Figure 11.
Dimensionless average wave overtopping as a function of the relative crest freeboard for very steep slopes overtopping data of the UG13 dataset () compared to Equation (3) for with its 90% confidence band.
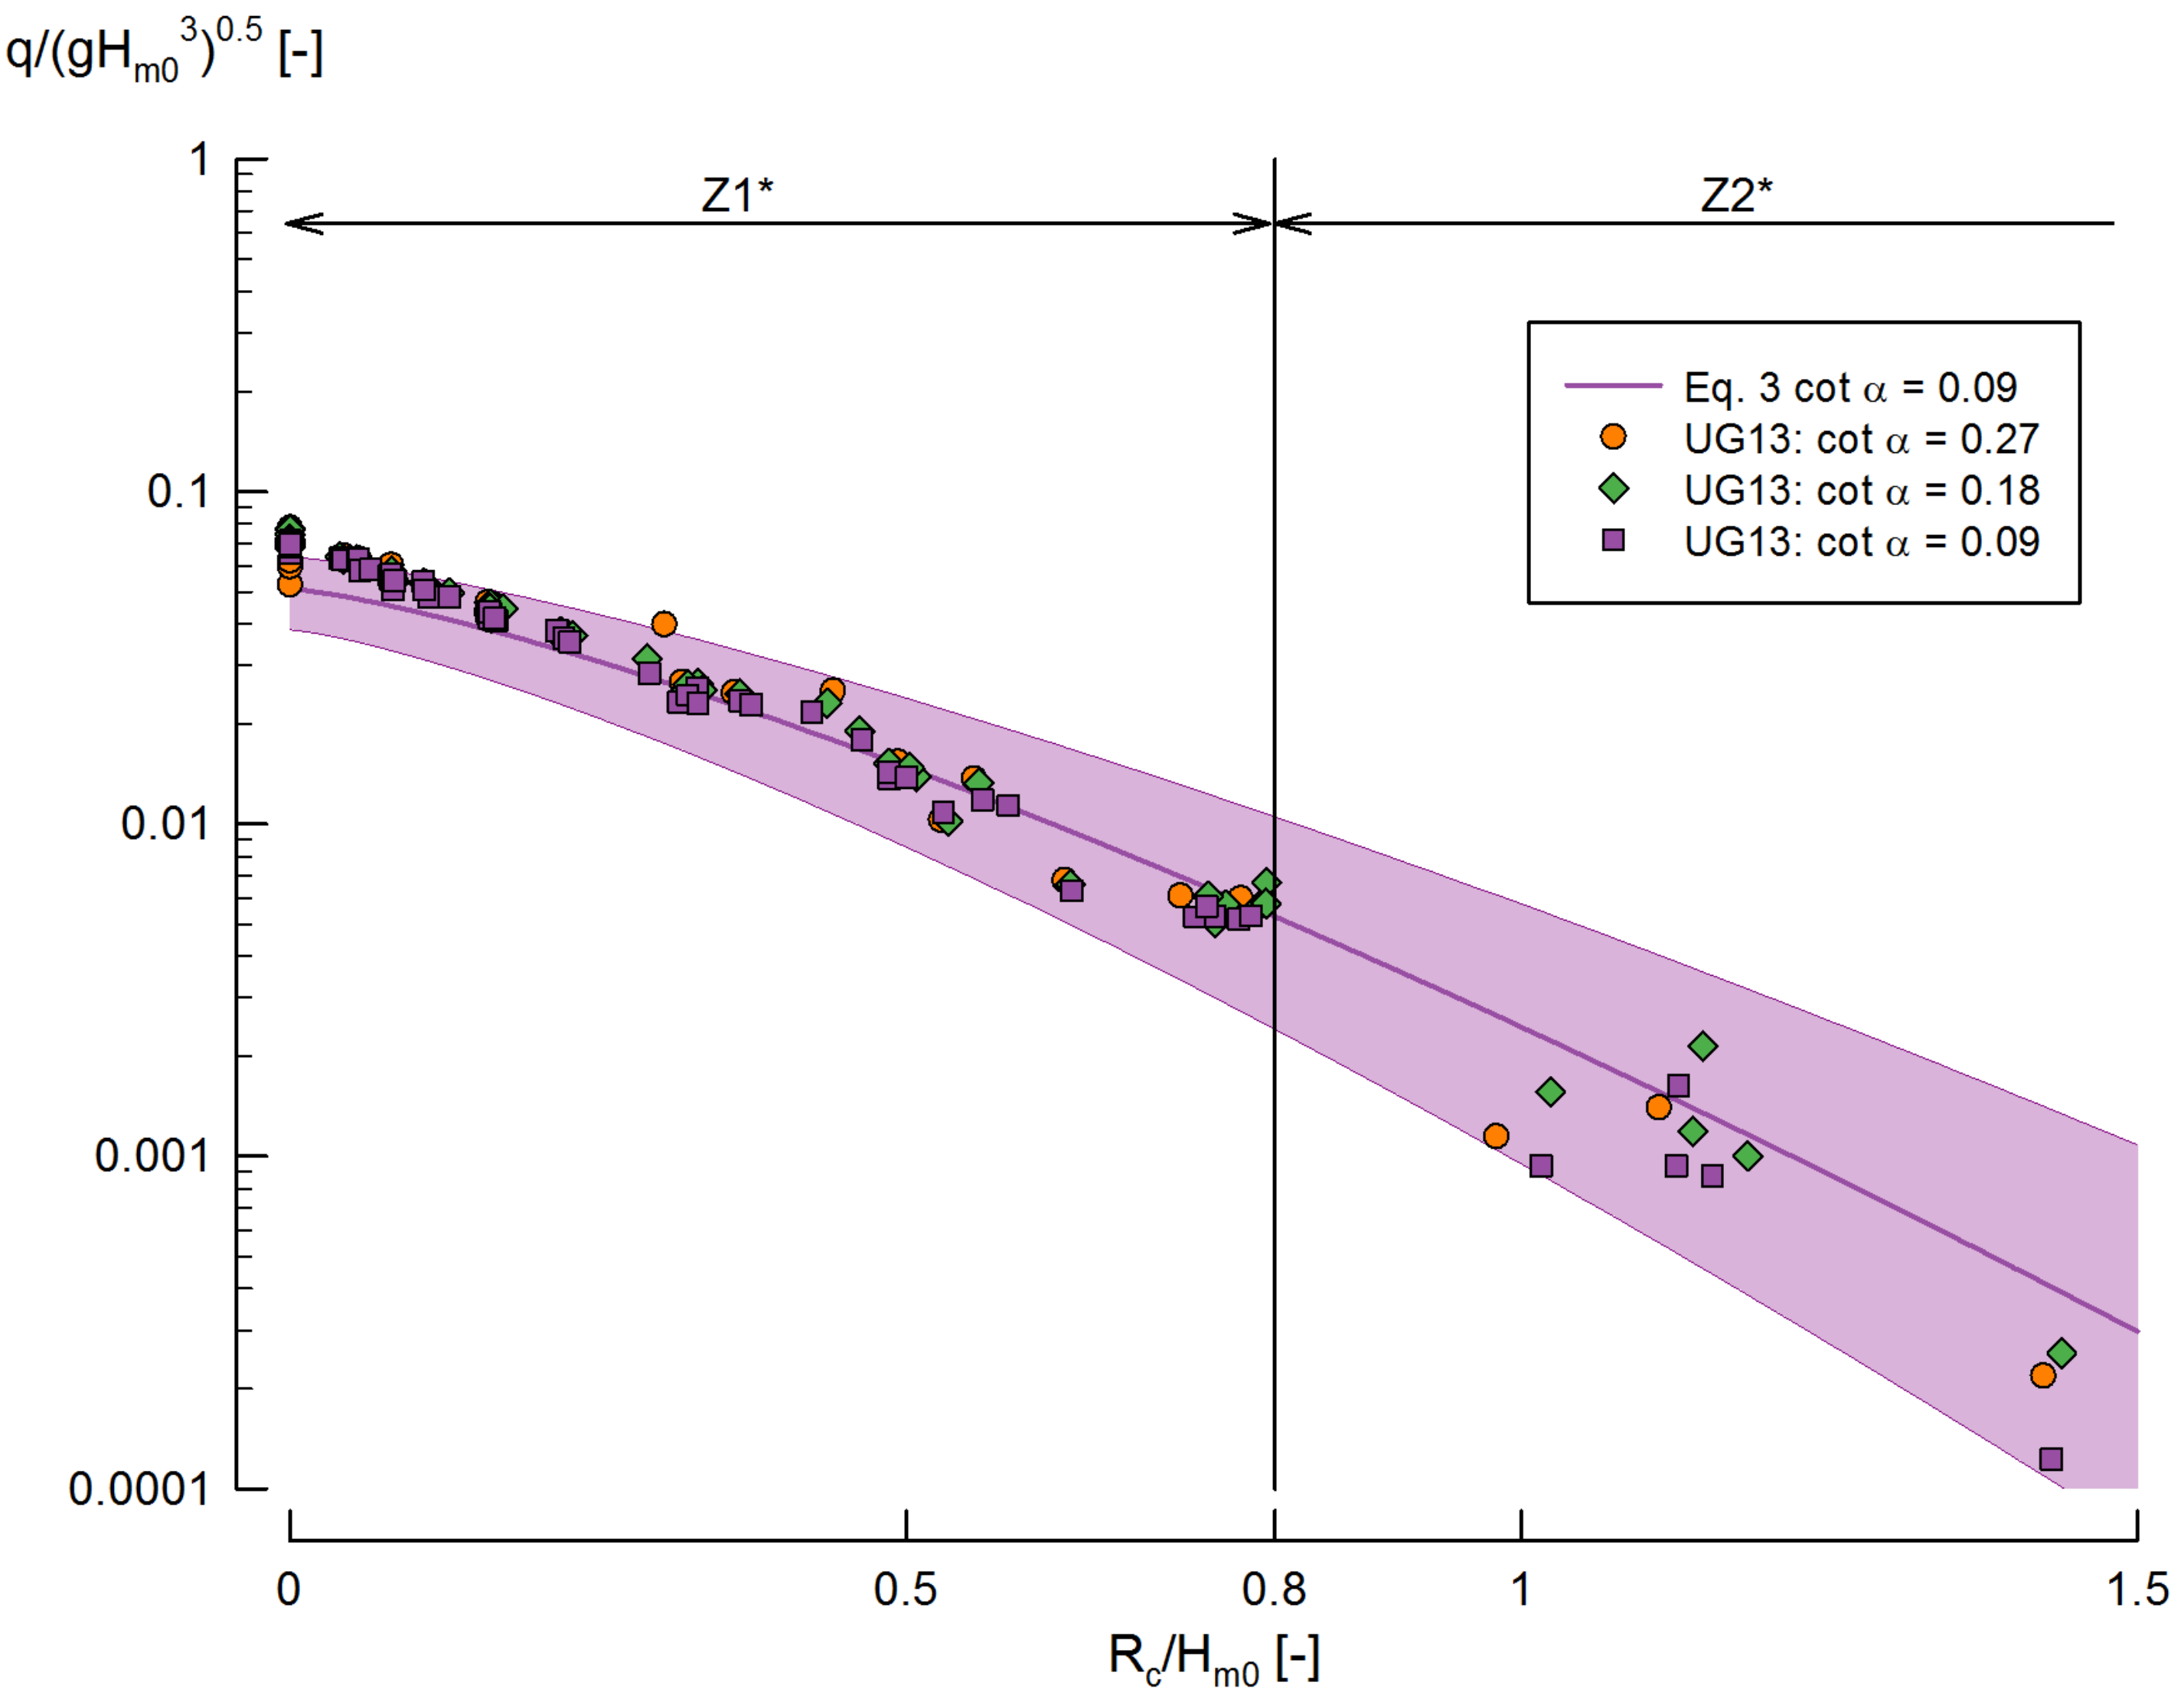
Figure 12.
Dimensionless average wave overtopping as a function of the relative crest freeboard for vertical wall data () of the UG13 dataset compared to Equation (3) with its 90% confidence band.
Figure 12.
Dimensionless average wave overtopping as a function of the relative crest freeboard for vertical wall data () of the UG13 dataset compared to Equation (3) with its 90% confidence band.

Figure 13.
Dimensionless average wave overtopping as a function of the slope angle for zero freeboard data () of the UG13 dataset compared to Equation (3) with its 90% confidence band and Equation (8).


Table 1.
Range definition of slope angle .
| Slope Angle | |
|---|---|
| Mild slopes | |
| Steep slopes | |
| Very steep slopes | |
| Vertical walls |
Table 2.
Range definition of relative crest freeboards .
| Relative Crest Freeboard | |
|---|---|
| Large relative freeboards | |
| Small relative freeboards | |
| Very small relative freeboards | |
| Zero freeboard |
Table 3.
Coefficients of Victor and Troch [10] formulae (Equation (2)) as a function of the slope angle and relative crest freeboard .
| Relative Crest Freeboard | |||||
|---|---|---|---|---|---|
| Z1 | Z2 | ||||
| Z3 | Z4 | ||||
Table 4.
Summary of the overtopping prediction formulae overviewed in this paper and their range of application.
Table 4.
Summary of the overtopping prediction formulae overviewed in this paper and their range of application.
| Equation | Reference | ||
|---|---|---|---|
| (1) | EurOtop (2007) [7] mild slopes non-breaking | ||
| (2) | Victor and Troch [10] | ||
| (3) | Van der Meer and Bruce [11] | ||
| (7) | EurOtop (2007) [7] vertical walls | ||
| (8) | Smid [26] |
Table 5.
Overview of UG10 and UG13 dataset.
| Item | UG10 | UG13 |
|---|---|---|
| Slope angle (°) | 20, 25, 30, 35, 40, 45, 50, 60, 70 | 25, 35, 45, 60, 75, 80, 85, 90 |
| (-) | 2.75, 2.14, 1.73, 1.43, 1.19, 1, 0.84, 0.58, 0.36 | 2.14, 1.43, 1, 0.58, 0.27, 0.18, 0.09, 0 |
| Crest freeboard (m) | 0.02, 0.045, 0.070 | 0, 0.005, 0.01, 0.02, 0.045, 0.07 |
| Incident significant wave height at the toe of the structure (m) | 0.023–0.19 | 0.018–0.16 |
| Relative crest freeboard (-) | 0.11–1.69 | 0–2.43 |
| Relative wave height (-) | 0.03–0.33 | 0.04–0.38 |
| Target peak wave period (s) | 1.00–2.000 | 1.022–2.045 |
| Wave steepness (-) | 0.016–0.056 | 0.014–0.047 |
| Surf similarity parameter | 2–21.5 | 2.28–95 |
Table 6.
RMSE values (Equation (9)) and bias (Equation (10)) of the UG13 dataset in different ranges of relative crest freeboards and slope angle .
| Equation | Equation (2) | Equation (3) | ||
|---|---|---|---|---|
| Item | RMSE (-) | Bias (-) | RMSE (-) | Bias (-) |
| UG13 (All tests) | 0.0075 | 0.0094 | ||
| Zero freeboard () | 0.0114 | 0.0156 | ||
| 0.0078 | 0.0090 | |||
| 0.0072 | 0.0096 | |||
| 0.0066 | 0.0077 | |||
| 0.0054 | 0.0057 | |||
| 0.0012 | 0.0014 | |||
| Mild slopes | 0.0119 | 0.0123 | ||
| Steep slopes | 0.0116 | 0.0126 | ||
| Very steep slopes | 0.0049 | 0.0072 | ||
| Vertical wall | 0.0044 | 0.0085 | ||
© 2018 by the authors. Licensee MDPI, Basel, Switzerland. This article is an open access article distributed under the terms and conditions of the Creative Commons Attribution (CC BY) license (http://creativecommons.org/licenses/by/4.0/).
Share and Cite
MDPI and ACS Style
Gallach-Sánchez, D.; Troch, P.; Kortenhaus, A. A Critical Analysis and Validation of the Accuracy of Wave Overtopping Prediction Formulae for OWECs. Energies 2018, 11, 133. https://doi.org/10.3390/en11010133
AMA Style
Gallach-Sánchez D, Troch P, Kortenhaus A. A Critical Analysis and Validation of the Accuracy of Wave Overtopping Prediction Formulae for OWECs. Energies. 2018; 11(1):133. https://doi.org/10.3390/en11010133
Chicago/Turabian StyleGallach-Sánchez, David, Peter Troch, and Andreas Kortenhaus. 2018. "A Critical Analysis and Validation of the Accuracy of Wave Overtopping Prediction Formulae for OWECs" Energies 11, no. 1: 133. https://doi.org/10.3390/en11010133
Note that from the first issue of 2016, this journal uses article numbers instead of page numbers. See further details here.