Energy Analysis of Cascade Heating with High Back-Pressure Large-Scale Steam Turbine


1
Key Laboratory of Condition Monitoring and Control for Power Plant Equipment (North China Electric Power University), Ministry of Education, Beijing 102206, China
2
School of Energy and Power Engineering, Lanzhou University of Technology, Lanzhou 730050, China
*
Author to whom correspondence should be addressed.
Energies 2018, 11(1), 119; https://doi.org/10.3390/en11010119
Submission received: 17 November 2017
/
Revised: 27 December 2017
/
Accepted: 31 December 2017
/
Published: 3 January 2018
(This article belongs to the Section F: Electrical Engineering)
Abstract
:To reduce the exergy loss that is caused by the high-grade extraction steam of traditional heating mode of combined heat and power (CHP) generating unit, a high back-pressure cascade heating technology for two jointly constructed large-scale steam turbine power generating units is proposed. The Unit 1 makes full use of the exhaust steam heat from high back-pressure turbine, and the Unit 2 uses the original heating mode of extracting steam condensation, which significantly reduces the flow rate of high-grade extraction steam. The typical 2 × 350 MW supercritical CHP units in northern China were selected as object. The boundary conditions for heating were determined based on the actual climatic conditions and heating demands. A model to analyze the performance of the high back-pressure cascade heating supply units for off-design operating conditions was developed. The load distributions between high back-pressure exhaust steam direct supply and extraction steam heating supply were described under various conditions, based on which, the heating efficiency of the CHP units with the high back-pressure cascade heating system was analyzed. The design heating load and maximum heating supply load were determined as well. The results indicate that the average coal consumption rate during the heating season is 205.46 g/kWh for the design heating load after the retrofit, which is about 51.99 g/kWh lower than that of the traditional heating mode. The coal consumption rate of 199.07 g/kWh can be achieved for the maximum heating load. Significant energy saving and CO2 emission reduction are obtained.
1. Introduction
The total efficiency of energy utilization of combined heat and power (CHP) generation is between 60% and 80%, which is much higher than the 40% average efficiency of typical coal-fired power plants [1,2]. The United States, Britain, and the Scandinavian countries actively promote the application of CHP technology [3,4,5,6,7]. In Denmark, for example, 72.8% of the regional heating supply in 2013 (134 PJ) came from CHP, which reduced CO2 emissions by approximately 30% when compared to the independent heat and power generation systems [8,9]. As of the end of 2016, the installed CHP capacity in China had reached 300 million kilowatts and accounted for approximately 30% of the installed thermal power capacity, which gave China the highest thermal power capacity in the world. It is estimated that in 2020, 350 million kilowatts of coal-burning units in China will have been retrofitted into CHP units.
At present, the main heat source for CHP units is steam extraction from the intermediate pressure cylinder of the steam turbine. The steam has a pressure of 0.3–0.5 MPa and a temperature of approximately 235–276 °C. The pressure of the extracting steam from the turbine larger than 300 MW can even reach 0.98 MPa. However, the first-class heating networks are generally designed for a water supply temperature of approximately 120–130 °C. Because of climate change and energy saving of buildings, the actual operating temperature is usually approximately 90–100 °C [10,11]. The temperature of extracting steam is too high, which results in large amounts of exergy loss. On the other hand, the exhaust steam from the low pressure cylinder of turbine condenses into water by releasing large amount latent heat, which results in great cold source loss [12]. Therefore, making full use of the steam turbine’s exhaust heat and reducing the throttling loss from the extracting steam is the key to further improving the efficiency of the CHP unit.
Several improvements have been made to the traditional steam extraction heating method, including that of the steam turbine using dual-axis rotors and can be operated under all condensation, extraction, and back pressure conditions [13,14]. When the heat load during the heating period is high, the low pressure cylinder is removed, and the steam turbine operates on the high back pressure, which can increase the heating capacity by using all of the exhaust heat. However, a synchro-self-shifting (SSS) clutch must be installed to implement the changeover between different conditions, which is of much expensive. Besides, the power plant, coupled absorption heat pump heating method [15,16], and the high back-pressure heating method [17,18], were also developed. The power plant coupled absorption heat pump refers to the installation of an absorbing heat pump unit on the side of the power plant to recover the circulating thermal energy of the heating supply network, which will heat the network water to a certain temperature. The water then enters the heating supply network heater and uses extraction steam from the intermediate pressure cylinder of turbine to reach the required temperature for the supplement of the downstream heat station. Because the backwater temperature of the city’s primary net is generally high, the heating temperature of the heat pump is relatively high, which significantly affects its energy efficiency, so the residual heat of the circulating water cannot be fully recovered. In addition, several problems are associated with the heat recovery of a power plant using an absorption heat pump, including the large area that is occupied by the heat pump, the high investment, and the long investment recovery period.
The high back-pressure operation of a turbine uses the exhausted steam to heat the water of the heating network. For the same fuel consumption, this method can greatly increase the heating capacity and improve the circulating thermal efficiency [19,20]. It is especially suitable for air-cooled steam turbines, which is a commonly used power generation method in northern China. When the air-cooled steam turbine runs at a back pressure of 30–40 kPa, the exhaust steam can provide heating network water with a temperature of approximately 75 °C, which can satisfy the heating demand for local and remote users through most cold periods.
However, researches on the actual performance of operating high back-pressure heating units have shown that the back pressure adjustment range of the turbine is limited. In the heat-regulating power operation mode, as the ambient temperature changes, it is difficult to make the unit respond reasonably under the conditions of high back-pressure heating. Based on these issues, this paper presents a high back-pressure cascade heating scheme that focuses on two jointly constructed 350 MW supercritical CHP units. Unit 1 is retrofitted with the high back-pressure heating technique to making full use of the low pressure exhaust heat energy of the steam turbine, and Unit 2 uses the original extraction condensing heating method to supply heat to the network water, which significantly reduces the high-grade extraction steam loss. Based on the actual changes of the climatic conditions during the heating period in typical regions of northern China, this paper focused on ensuring highly efficient and energy-saving operation of the heating unit for the entire heating period with optimal heat load distributions between the high back-pressure direct heat supply and extraction steam from turbine.
2. Research Object and Analytical Model
The 2 × 350 MW supercritical steam turbine power generating units that are located in the cold zone of northern China are selected as object. To simultaneously reduce the exergy loss that is caused by traditional extraction steam heating and to improve the adaptability of the unit to changes in the environmental conditions during the heating period, the high back-pressure cascade heating of these two units is proposed.
As shown in Figure 1, at the beginning and end of the heating season, the steam turbine of Unit 1 runs at a high back pressure, and the required temperature of the circulating water is below 70 °C. the heating network water only enters the No. 1 condenser. Having heated by the residual heat from the exhaust steam of Unit 1 turbine, the circulating water is directly supplied to customers through a bypass pipe. The extracting steam from the intermediate pressure cylinder of Unit 2 turbine is responsible for peak heating during severely cold periods following the heating by the condenser of Unit 1.
The low pressure cylinder rotor of Unit 1 uses that for a 350 MW indirect air-cooled steam turbine. During the heating season, the back pressure can be increased to 34 kPa, and during the non-heating season, the back pressure is maintained at 10 kPa. Unit 2 operates at a design back pressure of 4.9 kPa by means of the traditional wet cooling method, and the extracting steam from intermediate pressure cylinder is used to heat the network water during severely cold periods.
2.1. Model for Analyzing off-Design Operating Conditions
The thermal system model of the steam turbine power generating unit shown, as in Figure 2, was developed based on a mass balance and thermal energy balance. The model consists of a boiler, steam turbine, generator, and other local thermal systems, which was used to determine the characteristics of the steam turbine during off-design operating conditions [21,22]. During the analysis of off-design operations, the isentropic efficiency of stage group of the turbine, , can be determined based on the practical heat balance diagram that is provided by the manufacturer of steam turbine.
The subscripts A and B represent the different operating conditions of the steam turbine. As the working conditions of the unit change, they meet the requirements of the Stodola-Frügel formula [23],
where G represents the mass flow of the stage group of turbine, p1 and p2 represent the pressures before and after the stage group, respectively, and T1 represents the steam temperature at the stage group inlet.
The stage group pressure ratio is defined as . The steam flow of the stage group of turbine does not behaves as an ideal gas, therefore it may cause deviations using Equation (1). By replace the temperature, T1A and T1B, with practical specific volume of steam, v1 and pressure, p1, a more precise Stodola-Frügel formula can be expressed as,
where v1 represents the specific volume of steam at the stage group inlet.
The stage group’s internal power generation, Pi, can be expressed as,
in which, h1 is the inlet steam enthalpy of stage group, h2,is is the specific enthalpy of the isentropic expansion at the outlet, and is the isentropic efficiency of the turbine.
The Stodola-Frügel Formula (1) or (2) establishes the thermodynamic relationship between different operating conditions of the turbine. Based on the energy conservation and mass conservation, the relationship between the steam mass flow rate and the pressure of stage group of turbine for various operating conditions can be obtained by the formula. Further, the enthalpy drop, power generation and other thermodynamic parameters can be obtained by the analysis model. During the operation of steam turbine, the regenerative extraction steam is non-adjusted extraction steam, which means its variation is proportionate to the variations of main steam and the condensing water. Therefore, in practical operation, all of the regenerative heaters and the condenser can reach new heat balance automatically under the off-design conditions.
Simulated calculations of the total power generation for the demonstration unit under operating conditions of turbine heat acceptance (THA), as well as 75%, 50%, and 40% THA, were performed. The results were compared with that obtained from the practical heat balance diagram of this turbine in Table 1. The results show that the maximum relative error of the calculated results is less than 0.8%.
As the back pressure of the steam turbine increases, the enthalpy difference decreases, and the generated power also decreases. When high back-pressure is used for heating, the back pressure and the volume of the extraction steam change with the heat supply, which will affect the power generation of the unit. The relationships between the generated power of the CHP unit and the operational back-pressure for different amounts of extraction steam are shown in Figure 3. The results show that at the same back pressure, the generated power decreases as the heat load of the extraction steam increases. As the back pressure increases, the generated power decreases.
2.2. Heat Load Distribution of the High Back-Pressure Cascade Heating System
The total heat supply heating load, Q, of the high back-pressure cascade heating unit includes two parts,
where Q1 in MW is the heating load by exhaust steam of high back pressure turbine, Q2 is the heating load by extraction steam, in t/h is the flow rate of circulating water of heating network, Cpw in kJ/(kg·°C) is the constant pressure specific heat, ts in °C is the water supply temperature in the primary heating network, and tr is the return water temperature in the primary heating network.
The thermal power absorbed by the heating network water in the heating condenser, Q1, is,
where in t/h is the exhaust steam flow of turbine, hc in kJ/kg is the enthalpy of exhaust steam, and is the enthalpy of the condensation water.
The heat absorbed by the heating network water in the heater, Q2, is,
here is the flow of extraction steam that enters the heating network heater, he is the extracted enthalpy, and is the enthalpy of the water released after condensation of the extraction steam.
The analysis shows that the recovery of the high back-pressure residual heat is significantly affected by the return water temperature. When the temperature of the return water is low, the residual heat of the exhaust steam is more efficiently utilized with the same heat supply, which yields a higher unit generating power. When the temperature of the return water increases, the exhaust steam utilization ratio of the unit decreases, and the electric generation power also decreases. If the return water temperature is too high, then the exhaust heat cannot be consumed by the condenser efficiently and a large amount of exhaust steam has to be dissipated to the air-cooling island with lots of residual heat dissipated to the environment. This causes heat loss and requires more high-grade extraction steam to meet the heating demand. The analysis indicates that due to the large differences in regional heating networks and the variable operating parameters, the high back-pressure heating unit is more suitable for heating regions with lower return water temperatures.
2.3. Heating Efficiency and Coal Consumption of the High Back-Pressure Cascade Heating Unit
The heating efficiency of the high back-pressure heating unit is calculated by the heat distribution method, as follows.
The steam turbine’s heat consumption, Qtp in GJ/h, is,
The heating heat consumption, Qtp(h) in GJ/h, is,
The power generation heat consumption, Qtp(e) in GJ/h, is,
The power generation thermal efficiency, , is,
The power generation standard coal consumption rate, , in g/(kW·h), is,
in these equations, is the main steam volume, t/h, h0 is the steam turbine’s main steam enthalpy, kJ/kg, hfw is the enthalpy of the water supply, kJ/kg, is the reheat steam flow, t/h, hrh,0 is the enthalpy of the reheat steam, kJ/kg, hrh,I is the enthalpy of the reheat cold section steam, kJ/kg; is the boiler efficiency, which was chosen to be 0.93, is the pipe thermal efficiency, which is chosen to be 0.99, and is the unit’s power generation, MW.
3. Determination of the Boundary Conditions for High Back-Pressure Cascade Heating
Before the retrofit, the 2 × 350 MW supercritical unit analyzed in this paper used the extracting steam condensation heating method. The rated extracting steam flow rate was 500 t/h, and the supportable heating area was approximately 9 million m2. The regional heating area was increased for the high back-pressure cascade heating retrofit, which was required to meet a central heating demand of 11.9 million m2 and also has the potential to expand further in the future.
3.1. Heating Load Delay Map during Heating Period
To determine the regional heating load of the demonstration unit, the heating load with the number of days through the heating period, and also the outdoor temperature for the region where the demonstration unit is located are needed. The heating load delay map is usually drawn using the dimensionless form, as proposed in [24,25].
The heat load is expressed as:
where is the relative heat load, which is the ratio of the actual heat load to the design heat load, is the number of delayed days, is the number of days in the heating season, is a coefficient, , in which represents the indoor temperature for calculating the heating, and is generally chosen to be 18 °C, is the outdoor temperature for calculating the heating, °C; is a dimensionless number that represents the number of non-consecutive days, , and the subscript a is an index, , in which .
In the present study, the outdoor temperature, , for heating for the region where the demonstration unit is located is −11 °C. The regulated specified heating period extends from November 5 to April 5 of the following year, which includes 152 heating days. The calculation yields and , which are used to obtain,
Based on the planned supported heat area of 11.9 million m2, the heat load coefficient of the region is 41 W/m2, and the design heat load, Q, is 1756.44 GJ/h. The heating load delay curve of the power plant, according to Equation (12b), is shown in Figure 4. The heating loads that correspond to different outdoor temperatures are obtained from these results.
The results of the high back-pressure cascade heating technique retrofit can then be calculated from the supported heating load.
3.2. Determination of the Heating Network’s Return Water Temperature
The utilization of exhaust heat from steam turbine and the heating efficiency of the unit are affected by the return water temperature. Hence, it is necessary to determine the return water temperature distribution for the entire heating season. The qualitative adjustment method is applied to the heating season. When the heating area is determined, the volume of water that is circulating through the heating network remains unchanged, and the return water temperature is adjusted when the heating demands changes.
The demand of heating by users changes with the outdoor temperature. The design outdoor temperature is . This parameter is denoted with the superscript “′” to distinguish it from the actual outdoor temperature, , generally, . The heating load ratio under the operating conditions and the design heating load is called the relative heating load ratio, . To keep the indoor temperature, , constant during the heating season, the return water temperature supplied by the secondary network must be adjusted by,
where ; , in which b is the radiator performance coefficient, and .
After the temperature of the return water that is supplied by the secondary network has been determined, the primary network’s return water temperature must be adjusted based on the connection between the heating network and the users. Let τg and τh represent the temperatures of the primary network’s supply and return water, respectively. For the demonstration unit’s regional heating network connection,
where , in which is the logarithmic mean temperature difference during the heat exchange in the water-to-water heat exchanger under the design operating conditions, .
Based on the actual conditions at the location of the demonstration unit, the supply and return water temperatures of the primary network are set to 110 °C and 50 °C, respectively, and those of the secondary network are set to 70 °C and 45 °C, respectively. The local radiator is a conventional cast iron radiator, and the radiator constant b is 0.298. Taking the average daily temperature of the region from 2006 to 2016 as the outdoor temperature, , the supply and return water temperatures of the primary network for the entire heating season, as well as the corresponding monthly average primary network supply and the return water temperatures can be obtained, as shown in Figure 5. The results are taken as the boundary conditions for high back-pressure cascade heating.
4. Results and Analysis
The heating area demand of the objective CHP units in 2016 was 11.90 million m2, and the design heating load Q was 1756.44 GJ/h.
4.1. The Heating Load Distributions of the Two CHP Units after the Retrofit
The circulating water of the heating network was heated by the residual heat of the exhaust steam from the high back-pressure turbine of Unit 1, and the heating network water was heated by the intermediate extraction steam of Unit 2. The heating load distributions of Units 1 and 2 can be obtained from the analysis presented in Section 2.2, and are shown in Table 2.
During the low heating demand months of November, March, and April, the power plant can satisfy the heating demand by using only Unit 1’s high back-pressure steam heating. All of the supplied heat came from the exhaust steam’s residual heat, and the exhaust steam heating ratio reached 100%. During the cold period of the heating season, Unit 2’s extraction steam was used for peak heating; the heat came from the exhaust steam and the extraction steam. Exhaust steam heating during the cold period represented 54.17% of the total heat supply.
4.2. Comparison of the Heating Efficiencies before and after the Retrofit
Using the heating unit model presented in Section 2.1, the heating efficiencies of the entire plant under different operating conditions after the high back-pressure retrofit were determined. The plant’s heating efficiency using the extraction steam heating method before the retrofit with the same fuel input was calculated either. Based on the efficiencies that were obtained, the coal consumption of the entire plant for extraction steam heating and high back-pressure cascade heating at the designed heating load can be acquired, according to Equations (4)–(11). The results are shown in Figure 6, in which the power generated before and after the retrofit also is illustrated.
For the CHP unit, the operating mode is usually generating power based on the required heating load. It can be deduced from Figure 6a that the heating efficiency of Unit 1 was mostly influenced by the heating demand. The heating demand was higher during the cold months, and the heating capacity of the unit was well capitalized, leading to lower coal consumption.
In addition, the coal consumption of the entire plant decreased significantly by the high back-pressure retrofit. The coal consumption in January was only 196.43 g/kWh, which was 47 g/kWh lower than that before the retrofit, whereas the coal consumption in December was 50.0 g/kWh lower than that before the retrofit. The heating demand was low at the beginning and at the end of the heating season, and the heating capacity of the unit could not be fully capitalized. The coal consumption was relatively high; the coal consumption in November was 211.99 g/kWh, which was 56.8 g/kWh lower than that before the retrofit, and the coal consumption in March was 55.3 g/kWh lower than that before the retrofit.
For the entire heating season, the coal consumption of the power plant was 257.45 g/kWh prior to the retrofit and decreased to 205.46 g/kWh after the retrofit, which represents an average decrease of 51.99 g/kWh. Based on the heating time and heating load, approximately 37,500 tons less coal consumption can be acquired during the overall heating season, which reduces CO2 emission by approximately 98,200 tons, SO2 emissions by approximately 2800 tons, NOx emissions by approximately 1400 tons, and dust particles by approximately 2500 tons. Significant energy saving and emission reductions can be acquired. Moreover, as shown in Figure 6b, at the same heating load, the power generation increased after the retrofit, implying that the economic efficiency of the power plant was improved.
4.3. Heating Efficiency at the Maximum Heating Capacity
Because the local heating load that is demanded will increase in the future, the maximum heating load capacity and heating efficiency after the high back-pressure heating retrofit are analyzed.
The high back-pressure retrofit was performed on Unit 1 and Unit 2 used the original heating mode of extracting steam condensation. Based on Unit 2’s maximum heating steam extraction condition in the thermal balance diagram, the main steam flow rate was 1067 t/h, the extracting steam flow rate was 520 t/h with the pressure of 0.4 MPa and the temperature of 253.75 °C, which corresponds to a heating load of 342 MW.
For the maximum heating capacity of the retrofitted Unit 1, both high back pressure exhaust steam and extracting steam from the intermediate pressure cylinder of turbine should be taken into consideration as heat sources. When the back-pressure, Pb, is increased, the high back pressure of Unit 1 can lead to the reduction of specific volume of exhaust steam, and hence the reduction of volume flow rate, which causes a safety problem of last stage blade of turbine. Therefore, the minimum flow rate of steam into the low-pressure cylinder of turbine must be taken into account when selecting the maximum flow rate of extracting steam to ensure safe operation of the turbine. As for Unit 2, which operates at the original back pressure of 5 kPa, the normal specific volume of exhaust steam can satisfy the security requirement of last stage blades.
The minimum flow rate of steam into the low-pressure cylinder of turbine of Unit 1 can be obtained, as follows.
The pneumatic characteristics of the final stage’s turbine blade are reflected by the change in the Mach number, Mca,
where Dv,t in m3/s is the flow volume of the exhaust, Dt in kg/s is the mass flow of the exhaust, vc in m³/kg is the specific volume of the exhaust, and Ft in m2 is the final stage’s blade area.
The low pressure flow module of the demonstration unit was replaced in the retrofit. The final stage’s blade length was 710 mm and Ft = 5.4 m2. A in m/s is the final stage’s outlet speed of sound,
where k is the adiabatic index. For superheat steam, k = 1.3, and for wet steam, = 1.035 + 0.1x. x is the wet steam quality,
where AX is a correction factor and has a value of 1.03 for the intermediate reheating power generating unit.
To avoid low Mach operation, corresponding to the operating condition for ultra-low flow volume, which affects the safety of the final stage’s blade at a high back pressure, the extracting steam should be limited. According to the design of the final stage blades in large scale steam turbine, the final stage should reach a minimum flow volume at an exhaust axial Mach number, Mca = 0.23, under which the efficiency of the final stage is approximately zero. If the flow volume is lower than this limitation, great steam flow shocks will occur, which seriously threaten the safety of the unit. Therefore, Mca ≥ 0.23 is used as the minimum flow volume constraint for the final stage of turbine. The maximum extracting steam from the turbine, Dt,min, can be hence obtained by [26],
Combined Equations (17)–(20), it can be acquired that the Dt,min is 410.2 t/h, and the corresponding maximum extracting steam flow rate is 253 t/h at Pb = 34kPa. When considering the sum of the heating loads of the exhaust steam and the extracting steam, the maximum heating load of Unit 1 is 479 MW. Under these operating conditions, the plant’s maximum heating load, including that provided by both CHP units, is 821 MW. At the regional design heating index of 41 W/m2, the corresponding maximum heating area is 2.002 × 10⁷ m2.
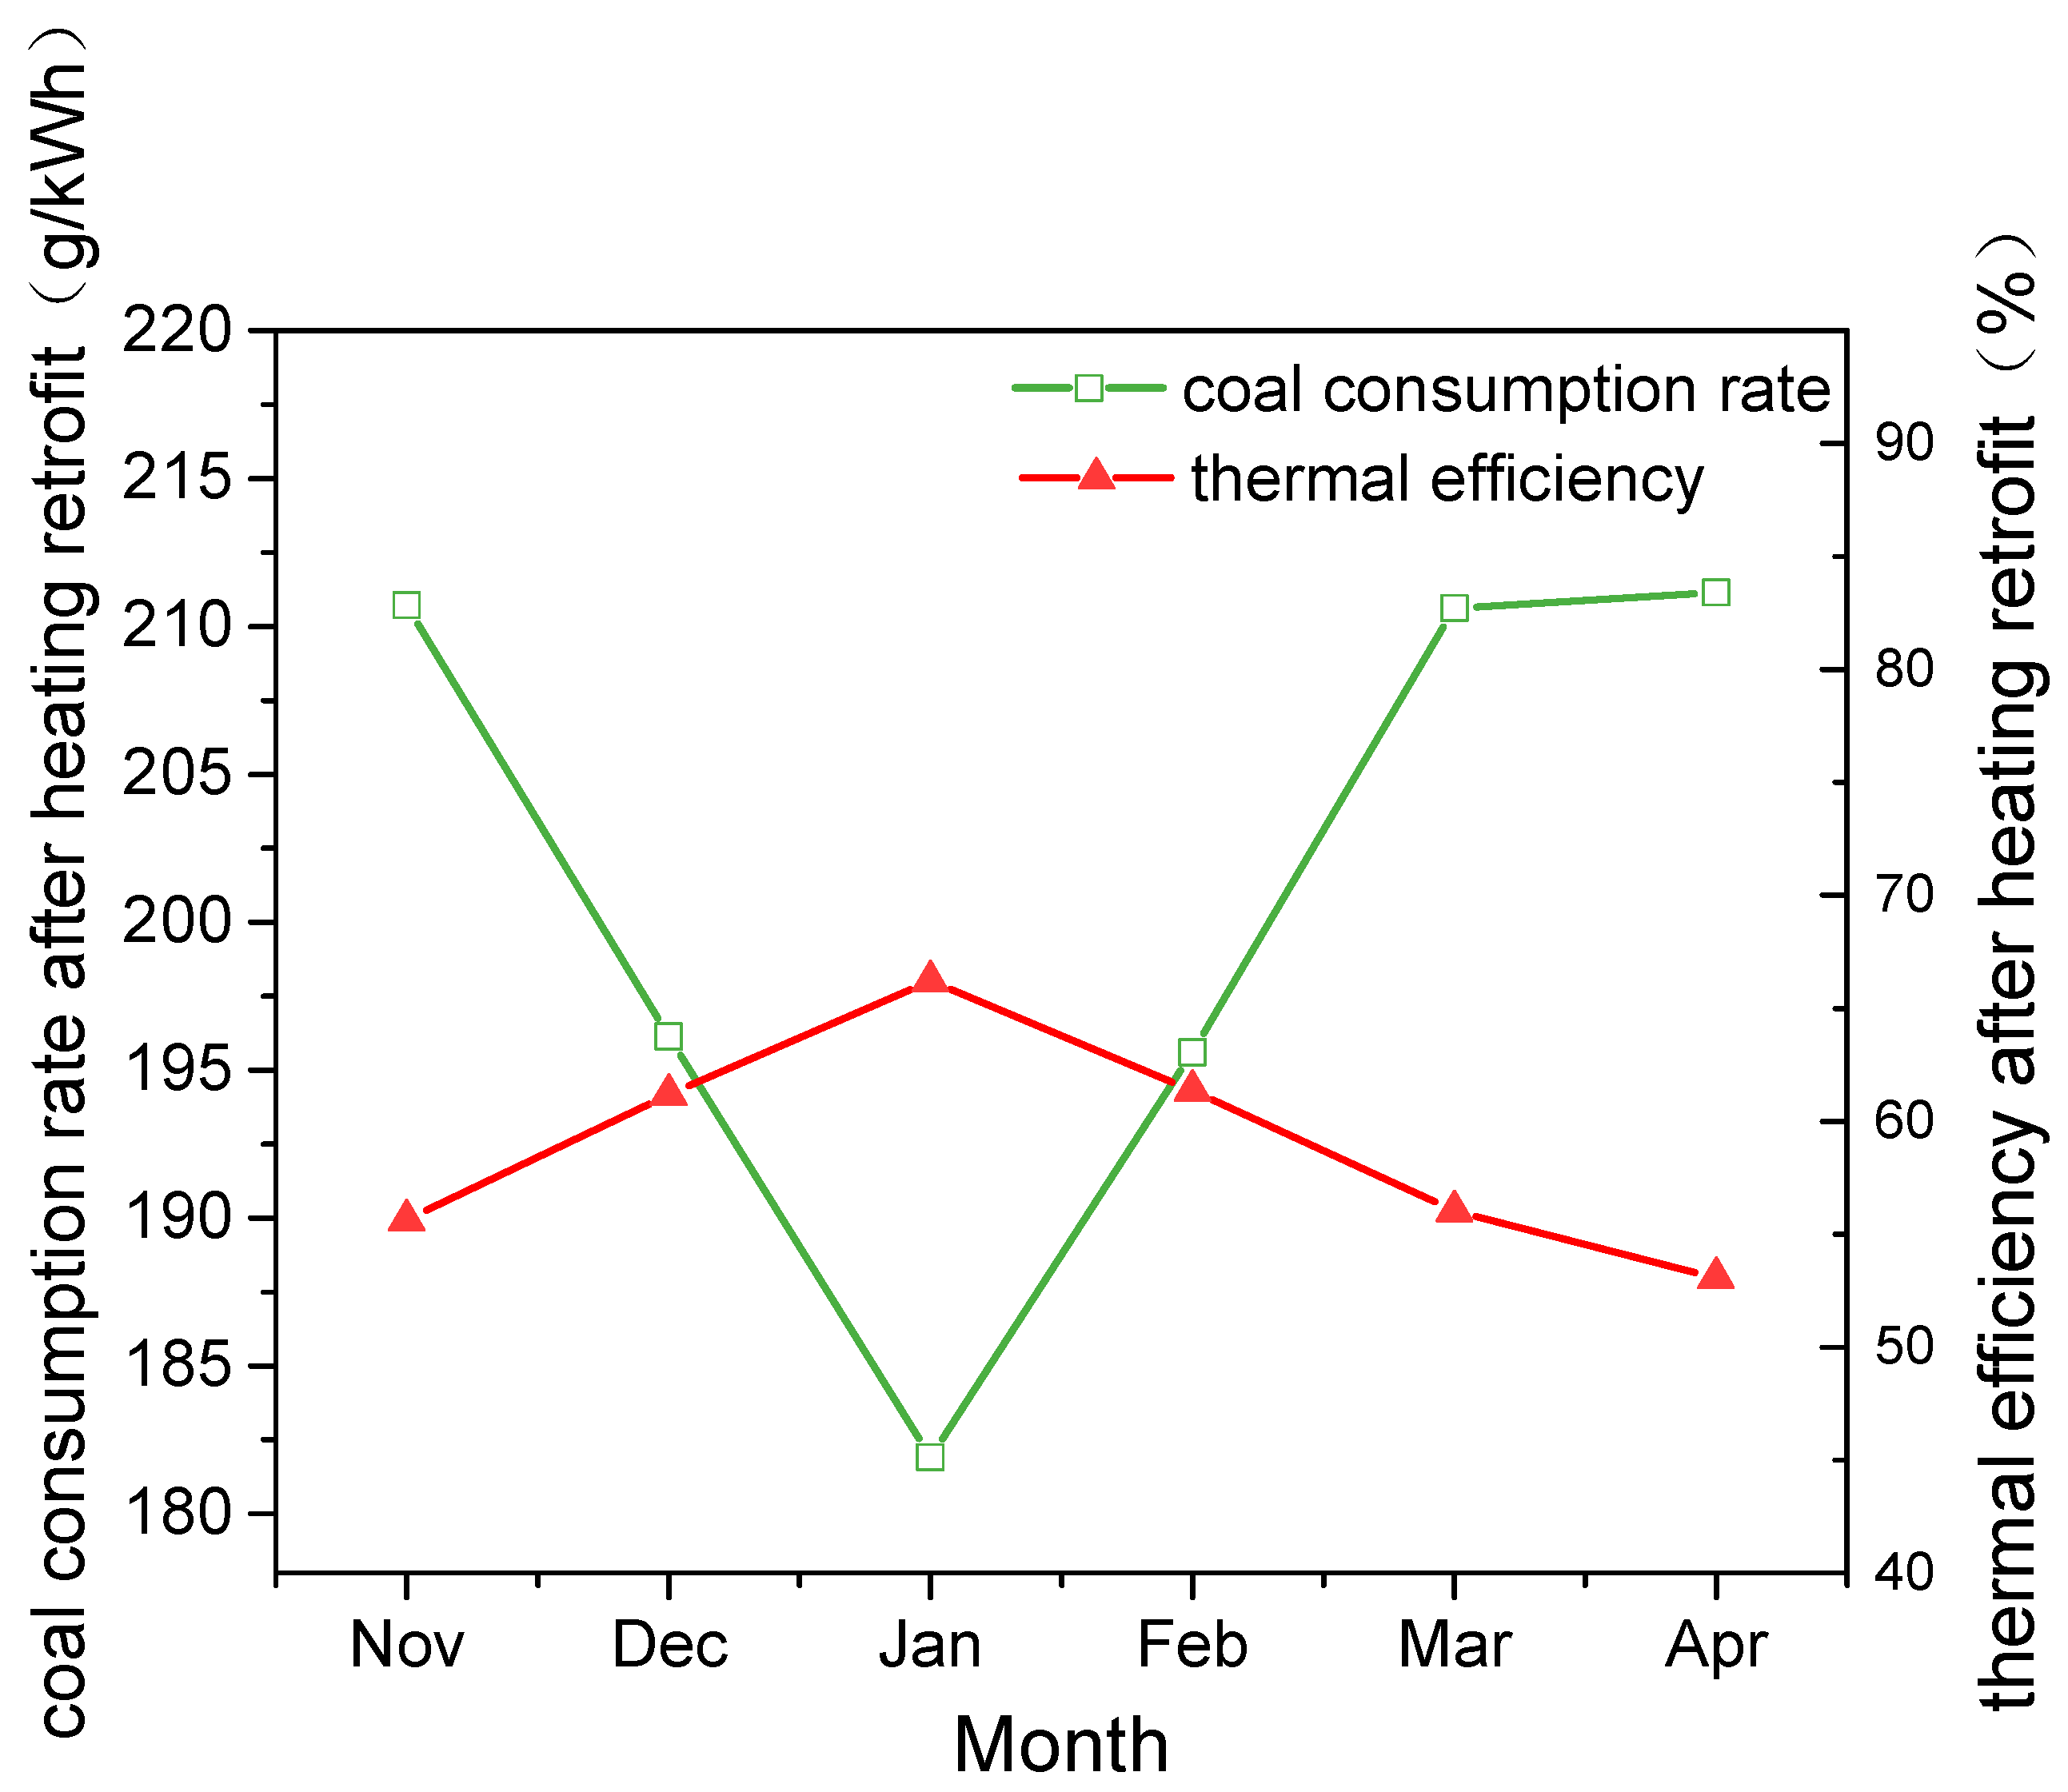
Using the model for CHP unit presented in Section 2.1, the monthly operating conditions and heat efficiency at the maximum heating capacity after the high back-pressure heating retrofit were acquired for typical operating conditions. The plant’s standard coal consumption rates under these operation conditions are shown in Figure 7.
It can be obtained that the average coal consumption rate of the objective CHP units for the whole heating season was 199.07 g/kWh, and the average thermal efficiency was 61.79%. A comparison of Figure 7 with Figure 6 shows that at the load of the design operating conditions for a heating area of 1.190 × 10⁷ m2, the average coal consumption rate was 205.46 g/kWh, and the thermal efficiency was 59.87%. For the maximum heating capacity condition, the coal consumption decreased by 6.39 g/kWh and the thermal efficiency increased by 1.92%. This can be attributed that the higher the heating load is, the smaller the unit’s cold source loss induced by exhaust heating is, and the greater the advantages of high back-pressure heating are. Therefore, when applying high back-pressure heating technology in practice, a relatively high and stable heating load can benefit achieving a high heating efficiency.
5. Conclusions
A high back-pressure cascade heating system was designed for 2 × 350 MW CHP units. The boundary conditions were determined, a model of the heating system for off-design operating conditions was developed, and the heating efficiency was analyzed. The conclusions are as follows:
- (1)
- The present high back-pressure cascade heating system recovered the waste heat of low grade steam, the heating efficiency improved significantly. Under the design heating load, the average standard coal consumption rate for the heating season was 205.46 g/kWh. About 37.5 kt coal can be saved for a single heating season, which reduces CO2 emission by approximately 98.2 kt.
- (2)
- The maximum heating capacity of the retrofitted CHP unit was determined. Under the maximum heating conditions, the standard coal consumption rate for the heating season was 199.07 g/kWh, and the thermal power generation efficiency was 61.79%.
- (3)
- The performance of the high back-pressure cascade heating system is greatly influenced by the heating load. Higher heating load leads to more significant energy saving and emission reduction. In practical applications of high back-pressure cascade heating technology, high heating load is proposed to achieve the expected benefits.
Acknowledgments
The financial supports for this research project from the National Scientific and Technical Supporting Program of China (No. 2014BAA06B01) and the State Grid Science and Technology Program (No. GTLN201706-KJXM001) are gratefully acknowledged.
Author Contributions
Zhihua Ge and Xiaoze Du provided the main idea of the study; Zhihua Ge wrote the paper. Fuxiang Zhang established the analytical model. Shimeng Sun and Jie He took the case study and results analysis.
Conflicts of Interest
The authors declare no conflicts of interest.
Nomenclature
| A | speed of sound (m/s) |
| C | specific heat (kJ/(kg·°C)) |
| F | area (m2) |
| G | mass flow (kg/s) |
| h | specific enthalpy (kJ/kg) |
| k | adiabatic index |
| p | pressure (MPa) |
| Q | heat (MW) |
| t | time (s) |
| T | temperature (K, °C) |
| V | volume (m3) |
| v | specific volume (m3/kg) |
| W | power output (kW) |
| x | ammonia concentration (kg/kg) |
| Greek Symbols: | |
| π | pressure ratio |
| η | efficiency |
| Subscripts: | |
| 0 | initial |
| a | axial |
| b | boiler |
| c | condense |
| e | extraction/electricity |
| fw | feedwater |
| is | isentropy process |
| p | piping or pipe |
| r | return water |
| rh | reheat |
| s | supply water |
| t | thermal |
| tp | thermal power |
| w | water |
References
- Ghorbani, N. Combined heat and power economic dispatch using exchange market algorith. Int. J. Electr. Power Energy Syst. 2016, 82, 58–66. [Google Scholar] [CrossRef]
- Athawale, R.; Felder, F.A.; Goldman, L.A. Do Combined Heat and Power plants perform Case study of publicly funded projects in New York. Energy Policy 2016, 97, 618–627. [Google Scholar] [CrossRef]
- Wells, P.; Nithyanandam, K.; Wirz, R. Cost Optimal Strategies of High Temperature Thermal Energy Storage Systems in Combined Heat and Power Applications. In Proceedings of the ASME 2016 10th International Conference on Energy Sustainability collocated with the ASME 2016 Power Conference and the ASME 2016 14th International Conference on Fuel Cell Science, Engineering and Technology, Charlotte, NC, USA, 26–30 June 2016; p. V001T03A006. [Google Scholar]
- Long, W.C.; Luck, R.; Mago, P.J. Uncertainty based operating strategy selection in combined heat and power systems. Appl. Therm. Eng. 2016, 98, 1013–1024. [Google Scholar] [CrossRef]
- Smith, A.D.; Mago, P.J. Effects of load-following operational methods on combined heat and power system efficiency. Appl. Energy 2014, 115, 337–351. [Google Scholar] [CrossRef]
- Van der Veen, R.A.C.; Kasmire, J. Combined heat and power in Dutch greenhouses: A case study of technology diffusion. Energy Policy 2015, 87, 8–16. [Google Scholar] [CrossRef]
- Li, H.; Svendsen, S. Energy and exergy analysis of low temperature district heating network. Energy 2012, 45, 237–246. [Google Scholar] [CrossRef]
- Lund, H.; Moller, B.; Mathiesen, B.V. The role of district heating in future renewable energy systems. Energy 2010, 35, 1381–1390. [Google Scholar] [CrossRef]
- Yang, X.; Li, H.; Svendsen, S. Energy, economy and exergy evaluations of the solutions for supplying domestic hot water from low-temperature district heating in Denmark. Energy Convers. Manag. 2016, 122, 142–152. [Google Scholar] [CrossRef]
- Byuna, S.; Parka, H.; Yia, S.; Songa, C.; Choib, Y.; Leeb, S.; Shinc, J. Study on the optimal heat supply control algorithm for district heating distribution network in response to outdoor air temperature. Energy 2015, 86, 247–256. [Google Scholar] [CrossRef]
- Ji, Y.; Xu, P.; Duan, P.; Lu, X. Estimating hourly cooling load in commercial buildings using a thermal network model and electricity submetering data. Appl. Energy 2016, 169, 309–323. [Google Scholar] [CrossRef]
- Fu, L.; Li, Y.; Zhang, S.; Jiang, Y. A district heating system based on absorption heat exchange with CHP systems. Front. Energy Power Eng. China 2010, 4, 77–83. [Google Scholar] [CrossRef]
- Guo, J.; Yang, H. A fault detection method for heat loss in a tyre vulcanization workshop using a dynamic energy consumption model and predictive baselines. Appl. Therm. Eng. 2015, 90, 711–721. [Google Scholar] [CrossRef]
- Galindo, J.; Climent, H.; Dolz, V.; Royo-Pascual, L. Multi-objective optimization of a bottoming Organic Rankine Cycle (ORC) of gasoline engine using swash-plate expander. Energy Convers. Manag. 2016, 126, 1054–1065. [Google Scholar] [CrossRef]
- Sun, F.; Fu, L.; Zhang, S. New waste heat district heating system with combined heat and power based on absorption heat exchange cycle in China. Appl. Therm. Eng. 2012, 37, 136–144. [Google Scholar] [CrossRef]
- Zhang, H.; Zhao, H.; Li, Z. Thermodynamic performance study on solar-assisted absorption heat pump cogeneration system in the coal-fired power plant. Energy 2016, 116, 942–955. [Google Scholar] [CrossRef]
- Federico, S.; Luca, A. Exploitation of humid air latent heat by means of solar assisted heat pumps operating below the dew point. Appl. Therm. Eng. 2016, 100, 820–828. [Google Scholar]
- Sobamowo, M.G. Thermal analysis of longitudinal fin with temperature-dependent properties and internal heat generation using Galerkin’s method of weighted residual. Appl. Therm. Eng. 2016, 99, 1316–1330. [Google Scholar] [CrossRef]
- Sun, W.; Yu, X.; Wang, Y. Exergy efficiency analysis of ORC (Organic Rankine Cycle) and ORC-based combined cycles driven by low-temperature waste heat. Energy Convers. Manag. 2017, 135, 63–73. [Google Scholar] [CrossRef]
- Wang, H.; Yin, W.; Abdollahi, E.; Lahdelma, R.; Jiao, W. Modelling and optimization of CHP based district heating system with renewable energy production and energy storage. Appl. Energy 2015, 159, 401–421. [Google Scholar] [CrossRef]
- Li, P.; Nord, N.; Ertesvåg, I.S.; Ge, Z.; Yang, Z.; Yang, Y. Integrated multiscale simulation of combined heat and power based district heating system. Energy Convers. Manag. 2015, 106, 337–354. [Google Scholar] [CrossRef]
- Wang, L.; Yang, Y.; Dong, C.; Morosuk, T.; Tsatsaronis, G. Multi-objective optimization of coal-fired power plants using differential evolution. Appl. Energy 2014, 115, 254–264. [Google Scholar] [CrossRef]
- Xu, D.; Deng, D.; Wang, S.; Chen, W. Application of characteristic flow area of steam turbines and improvement on flugel formula. J. Chin. Soc. Power Eng. 2010, 30, 473–477. (In Chinese) [Google Scholar]
- Al-Shammari, E.T.; Keivani, A.; Shamshirband, S.; Mostafaeipourd, A.; Yee, P.L.; Petkoviće, D.; Chf, S. Prediction of heat load in district heating systems by Support Vector Machine with Firefly searching algorithm. Energy 2016, 95, 266–273. [Google Scholar] [CrossRef]
- Cao, J.; Liu, J.; Man, X. A united WRF/TRNSYS method for estimating the heating/cooling load for the thousand-meter scale megatall buildings. Appl. Therm. Eng. 2017, 114, 196–210. [Google Scholar] [CrossRef]
- Pirouti, M.; Bagdanavicius, A.; Ekanayake, J. Energy consumption and economic analyses of a district heating network. Energy 2013, 57, 149–159. [Google Scholar] [CrossRef]
Figure 1.
Schematic diagram of the 2 × 350 MW supercritical unit with high back-pressure cascade heating.
Figure 1.
Schematic diagram of the 2 × 350 MW supercritical unit with high back-pressure cascade heating.
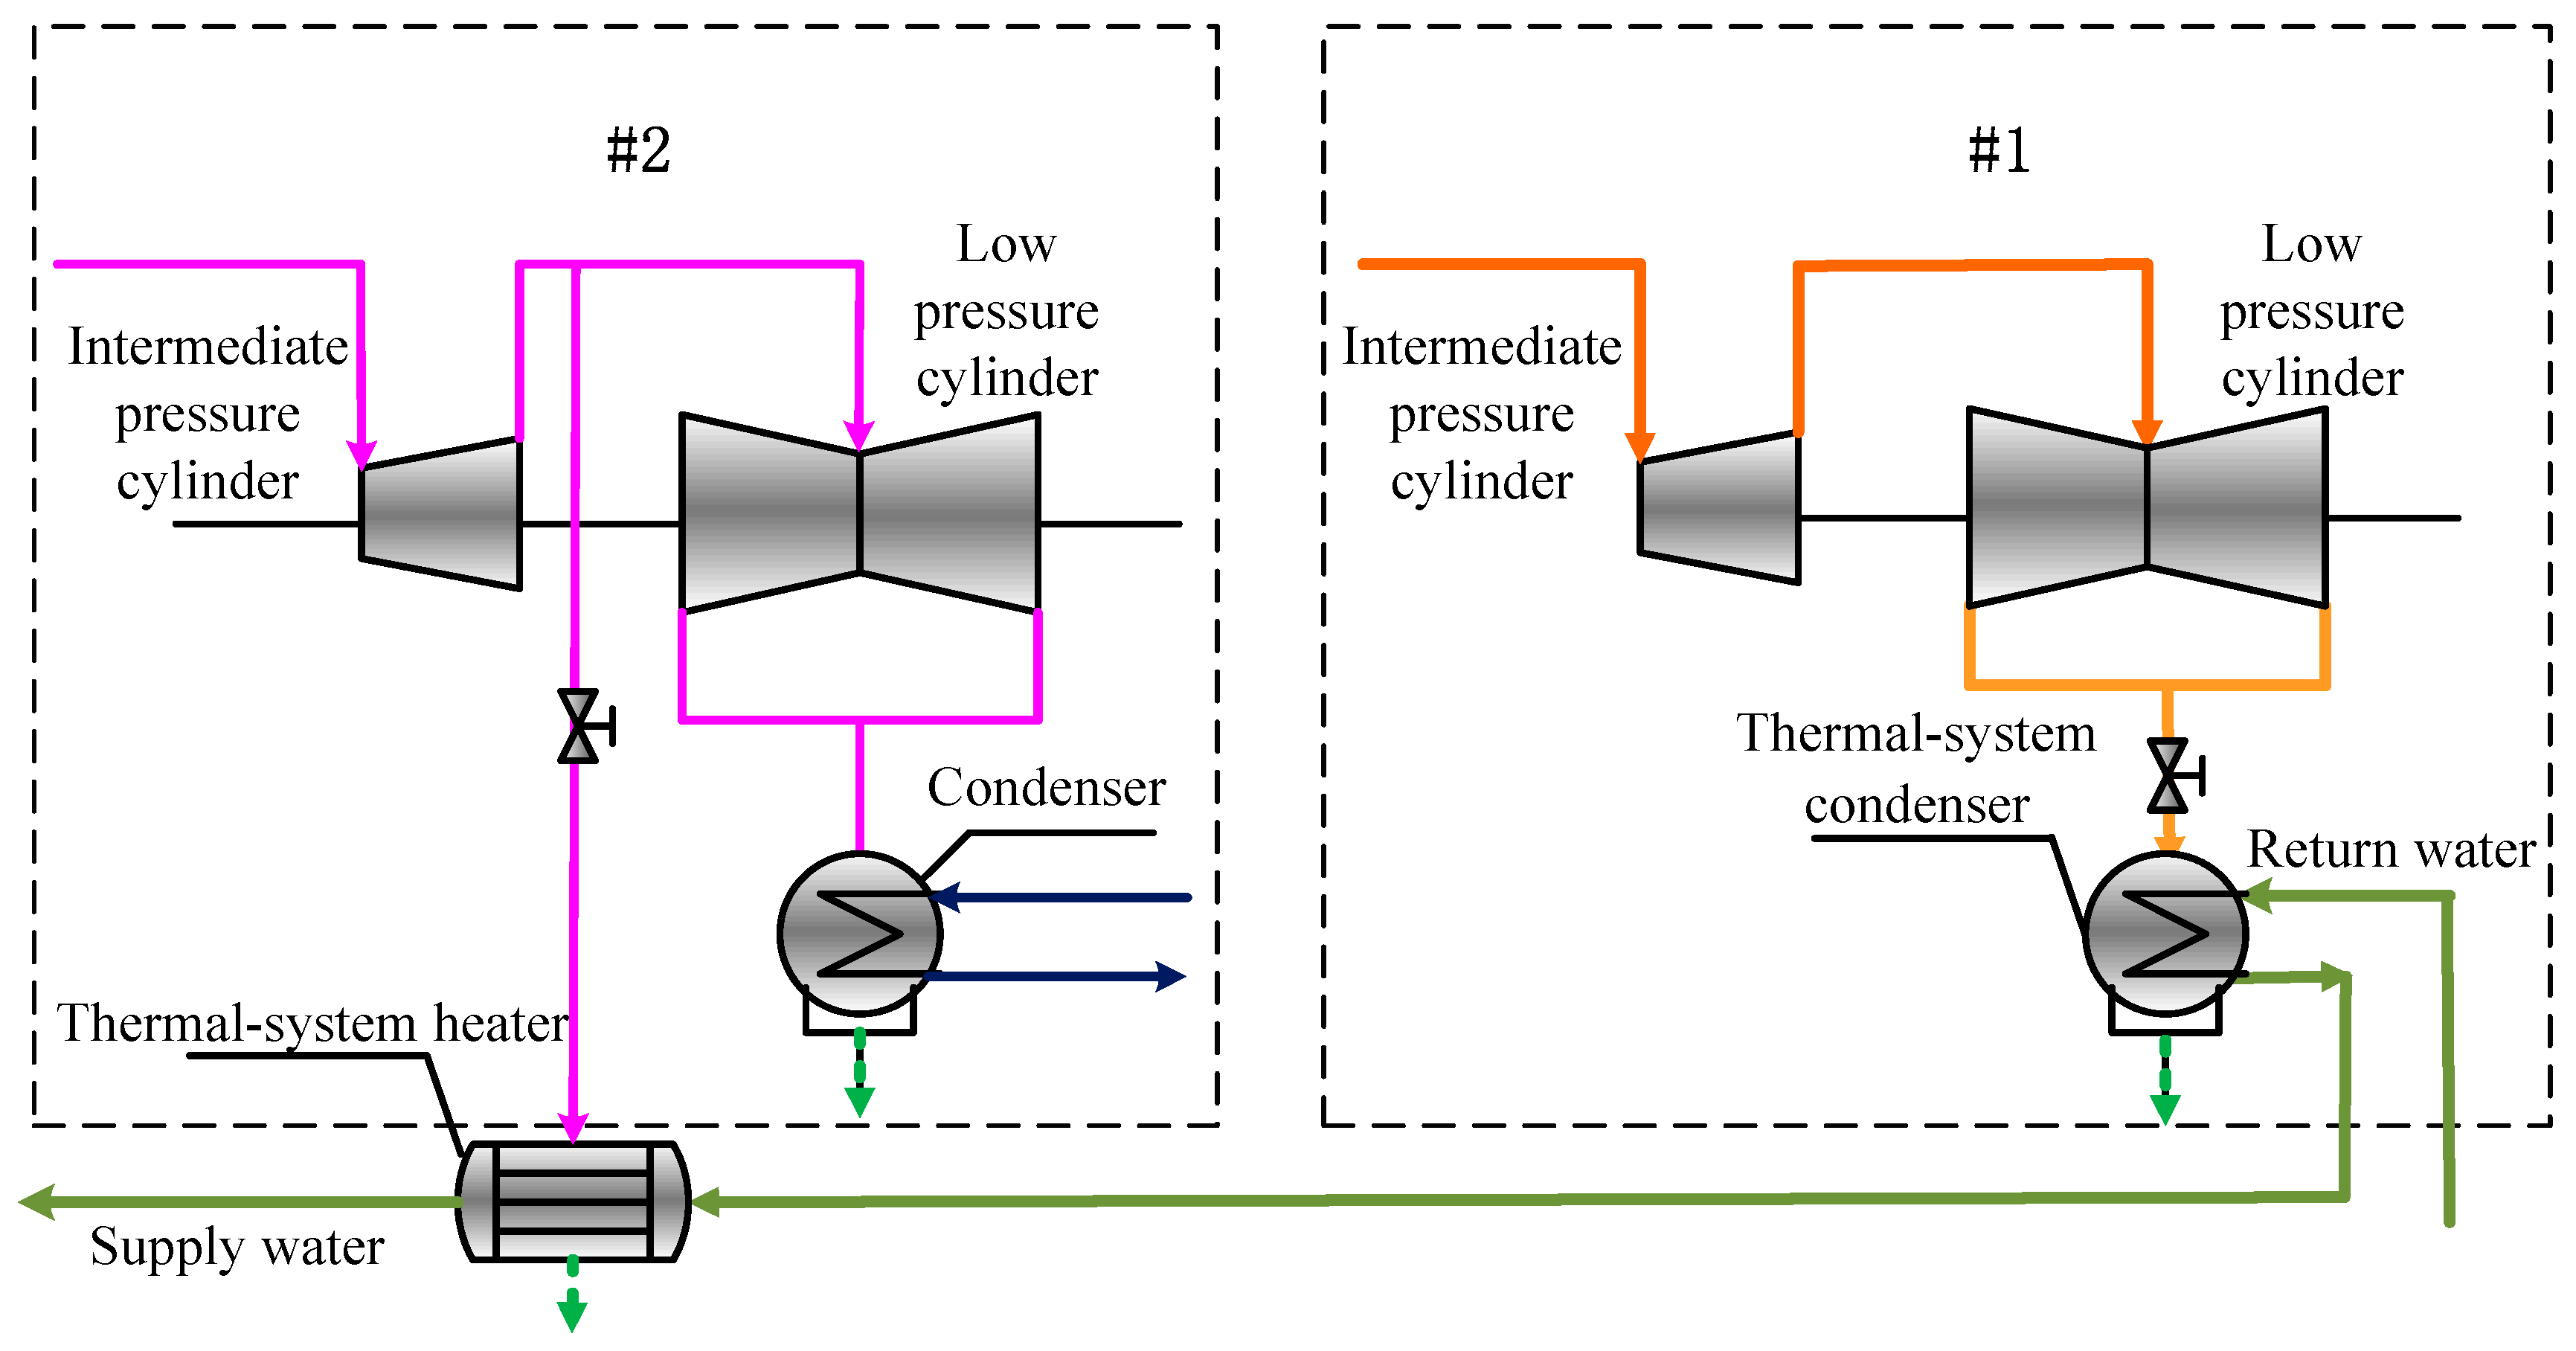
Figure 2.
Model of the steam turbine power generating unit.
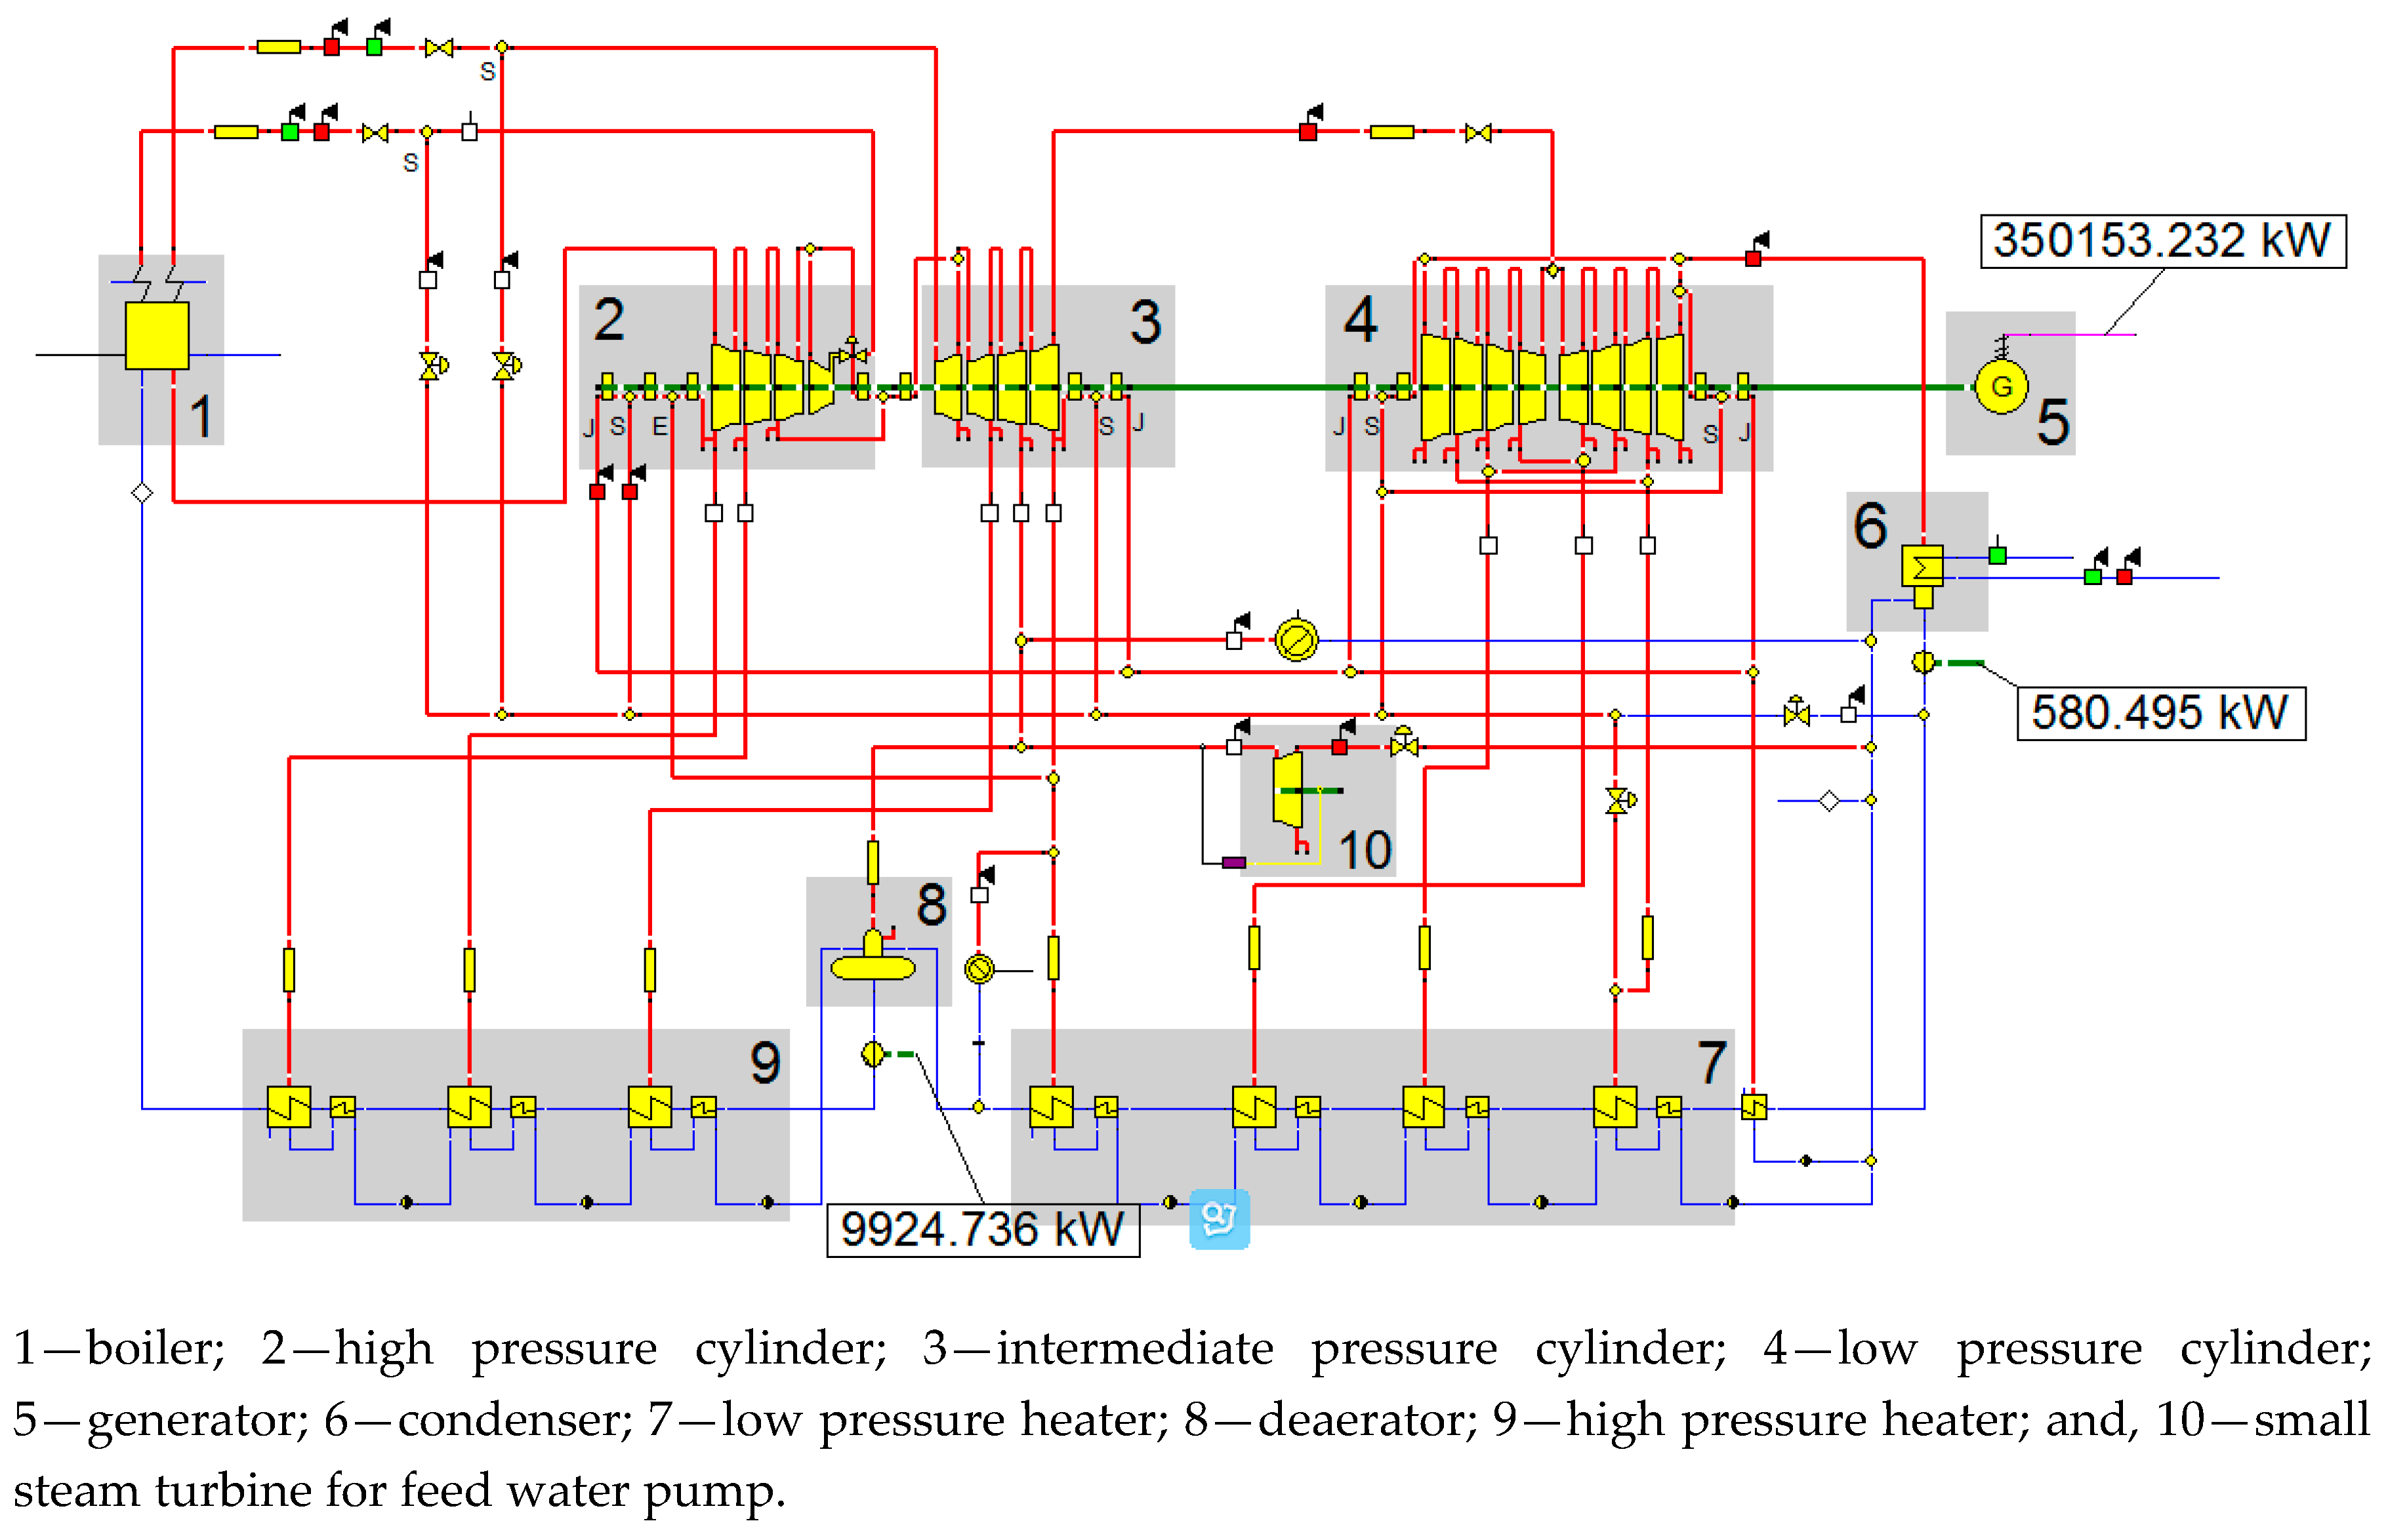
Figure 3.
Variations in power of the combined heat and power (CHP) unit with increasing back pressure.
Figure 3.
Variations in power of the combined heat and power (CHP) unit with increasing back pressure.
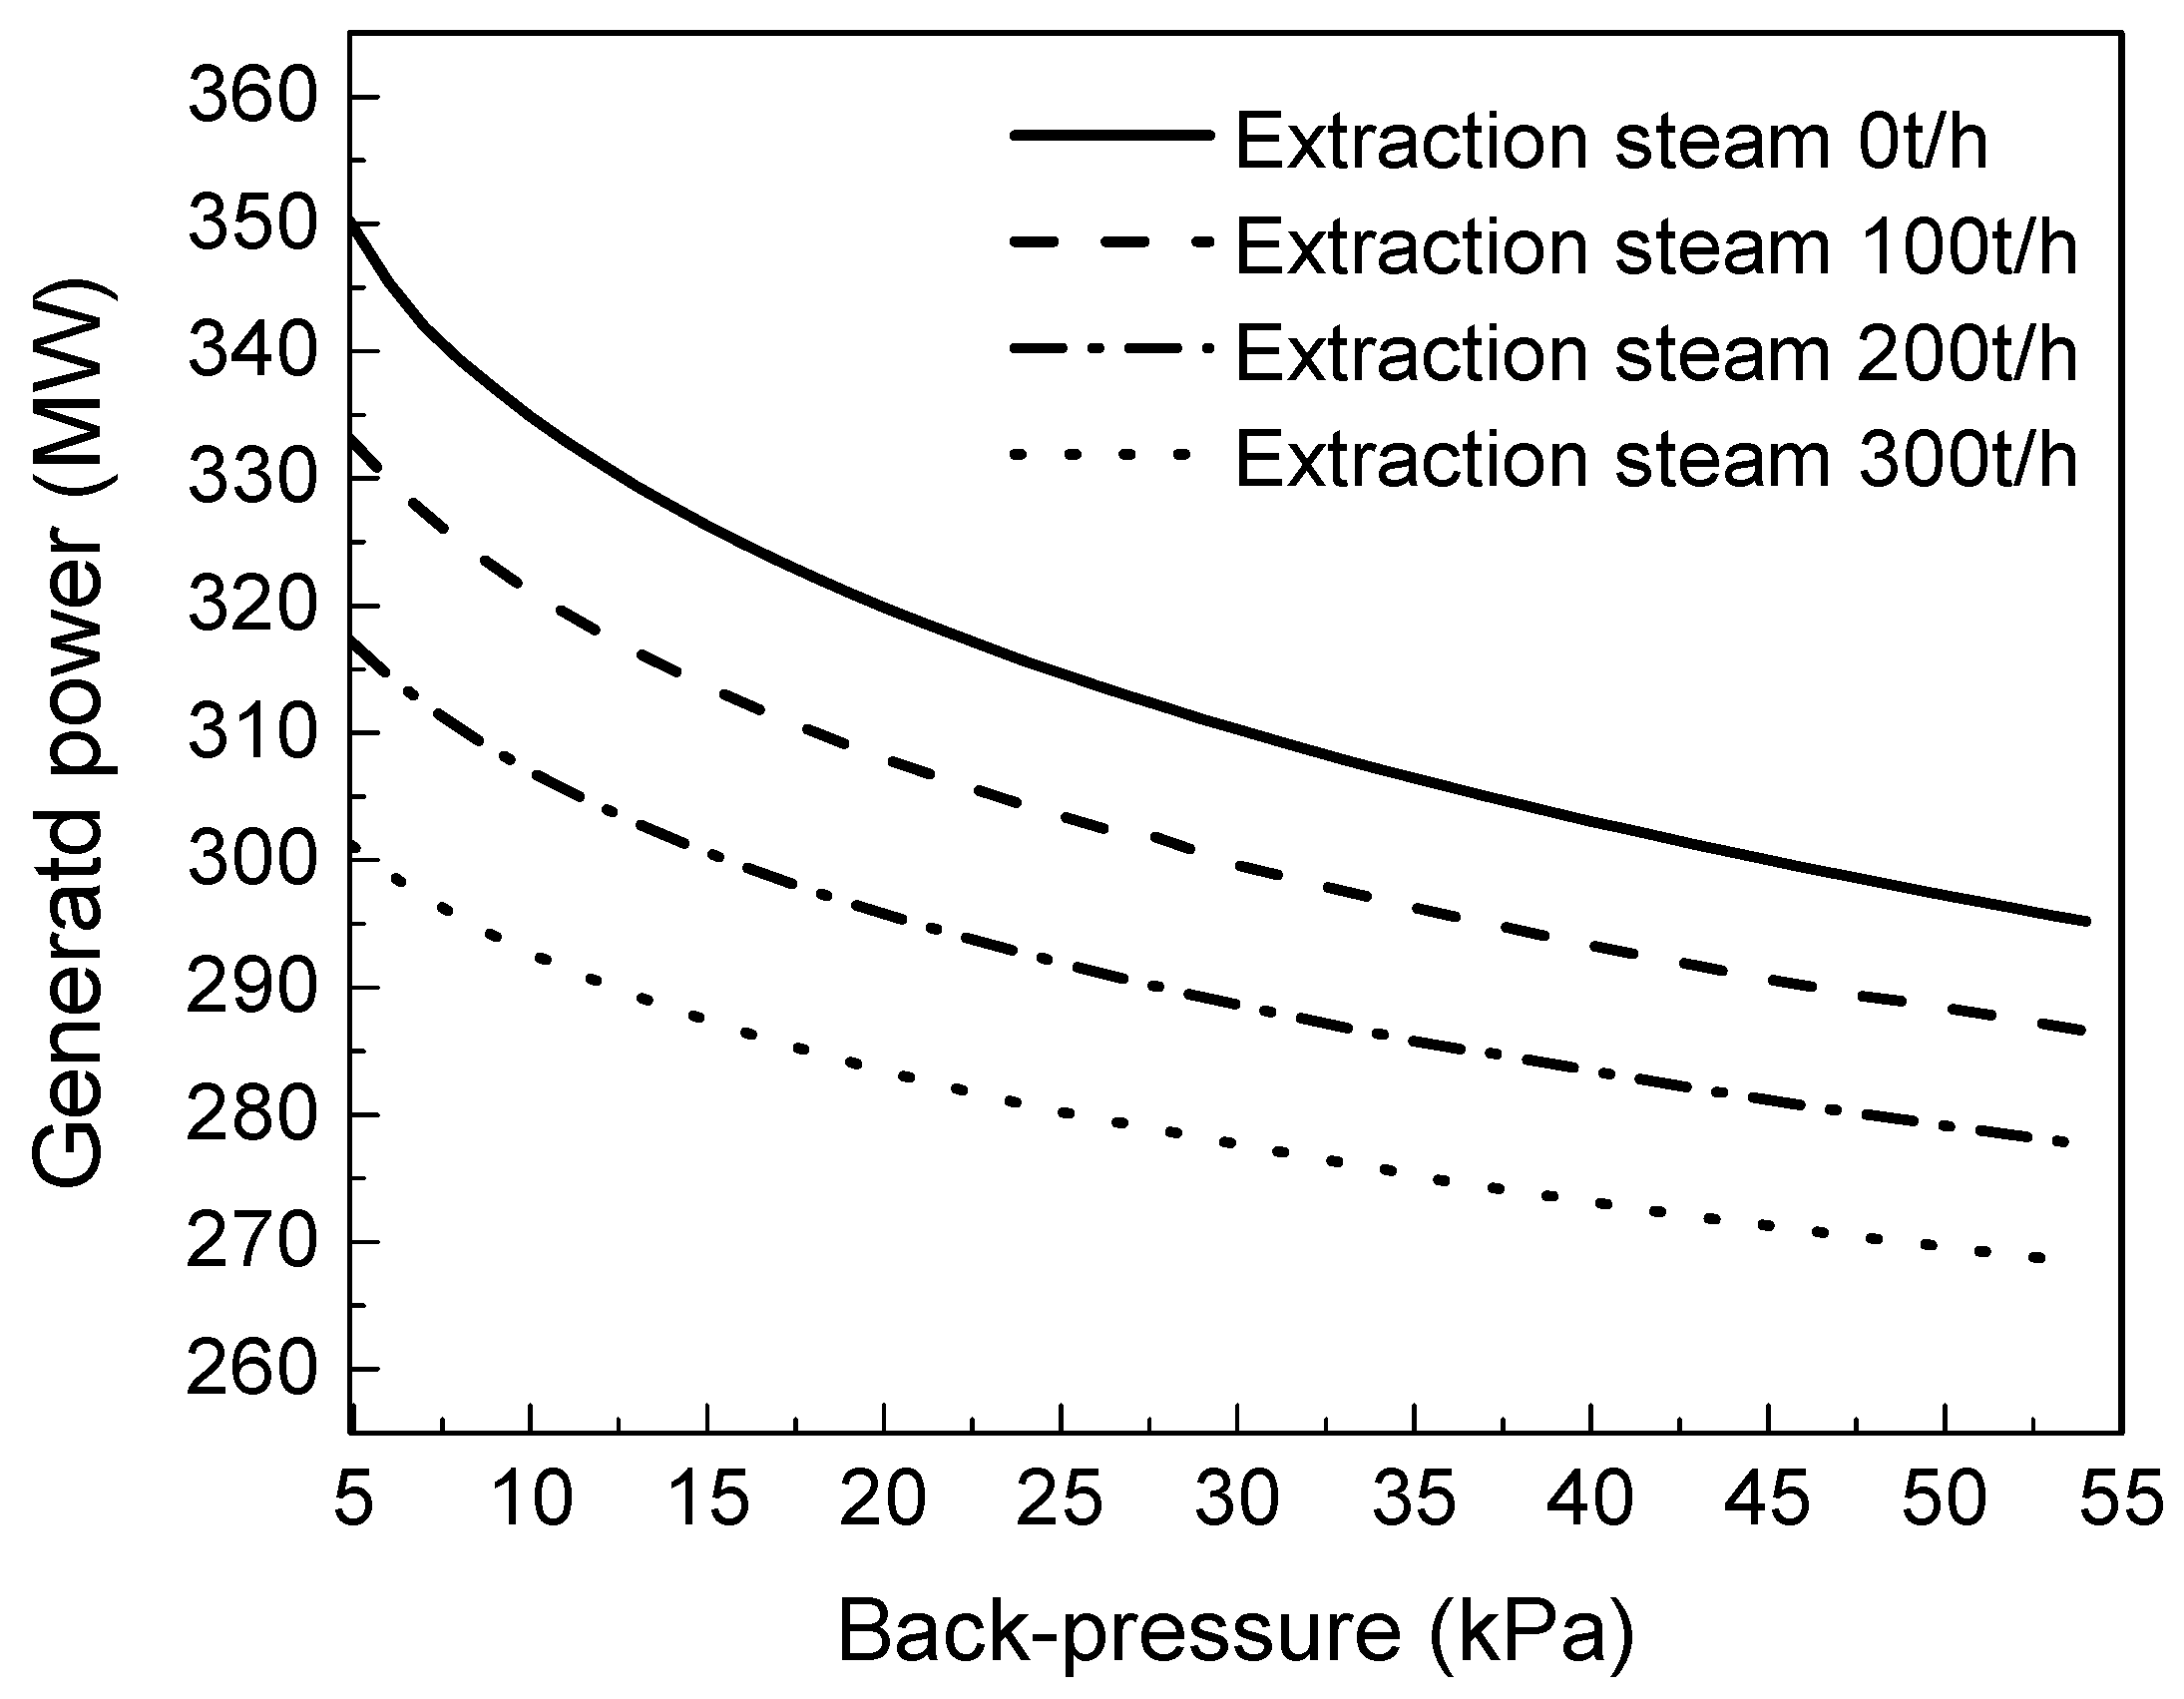
Figure 4.
Heat load delay curve of the demonstration power plant during the 2016–2017 heating season.
Figure 4.
Heat load delay curve of the demonstration power plant during the 2016–2017 heating season.
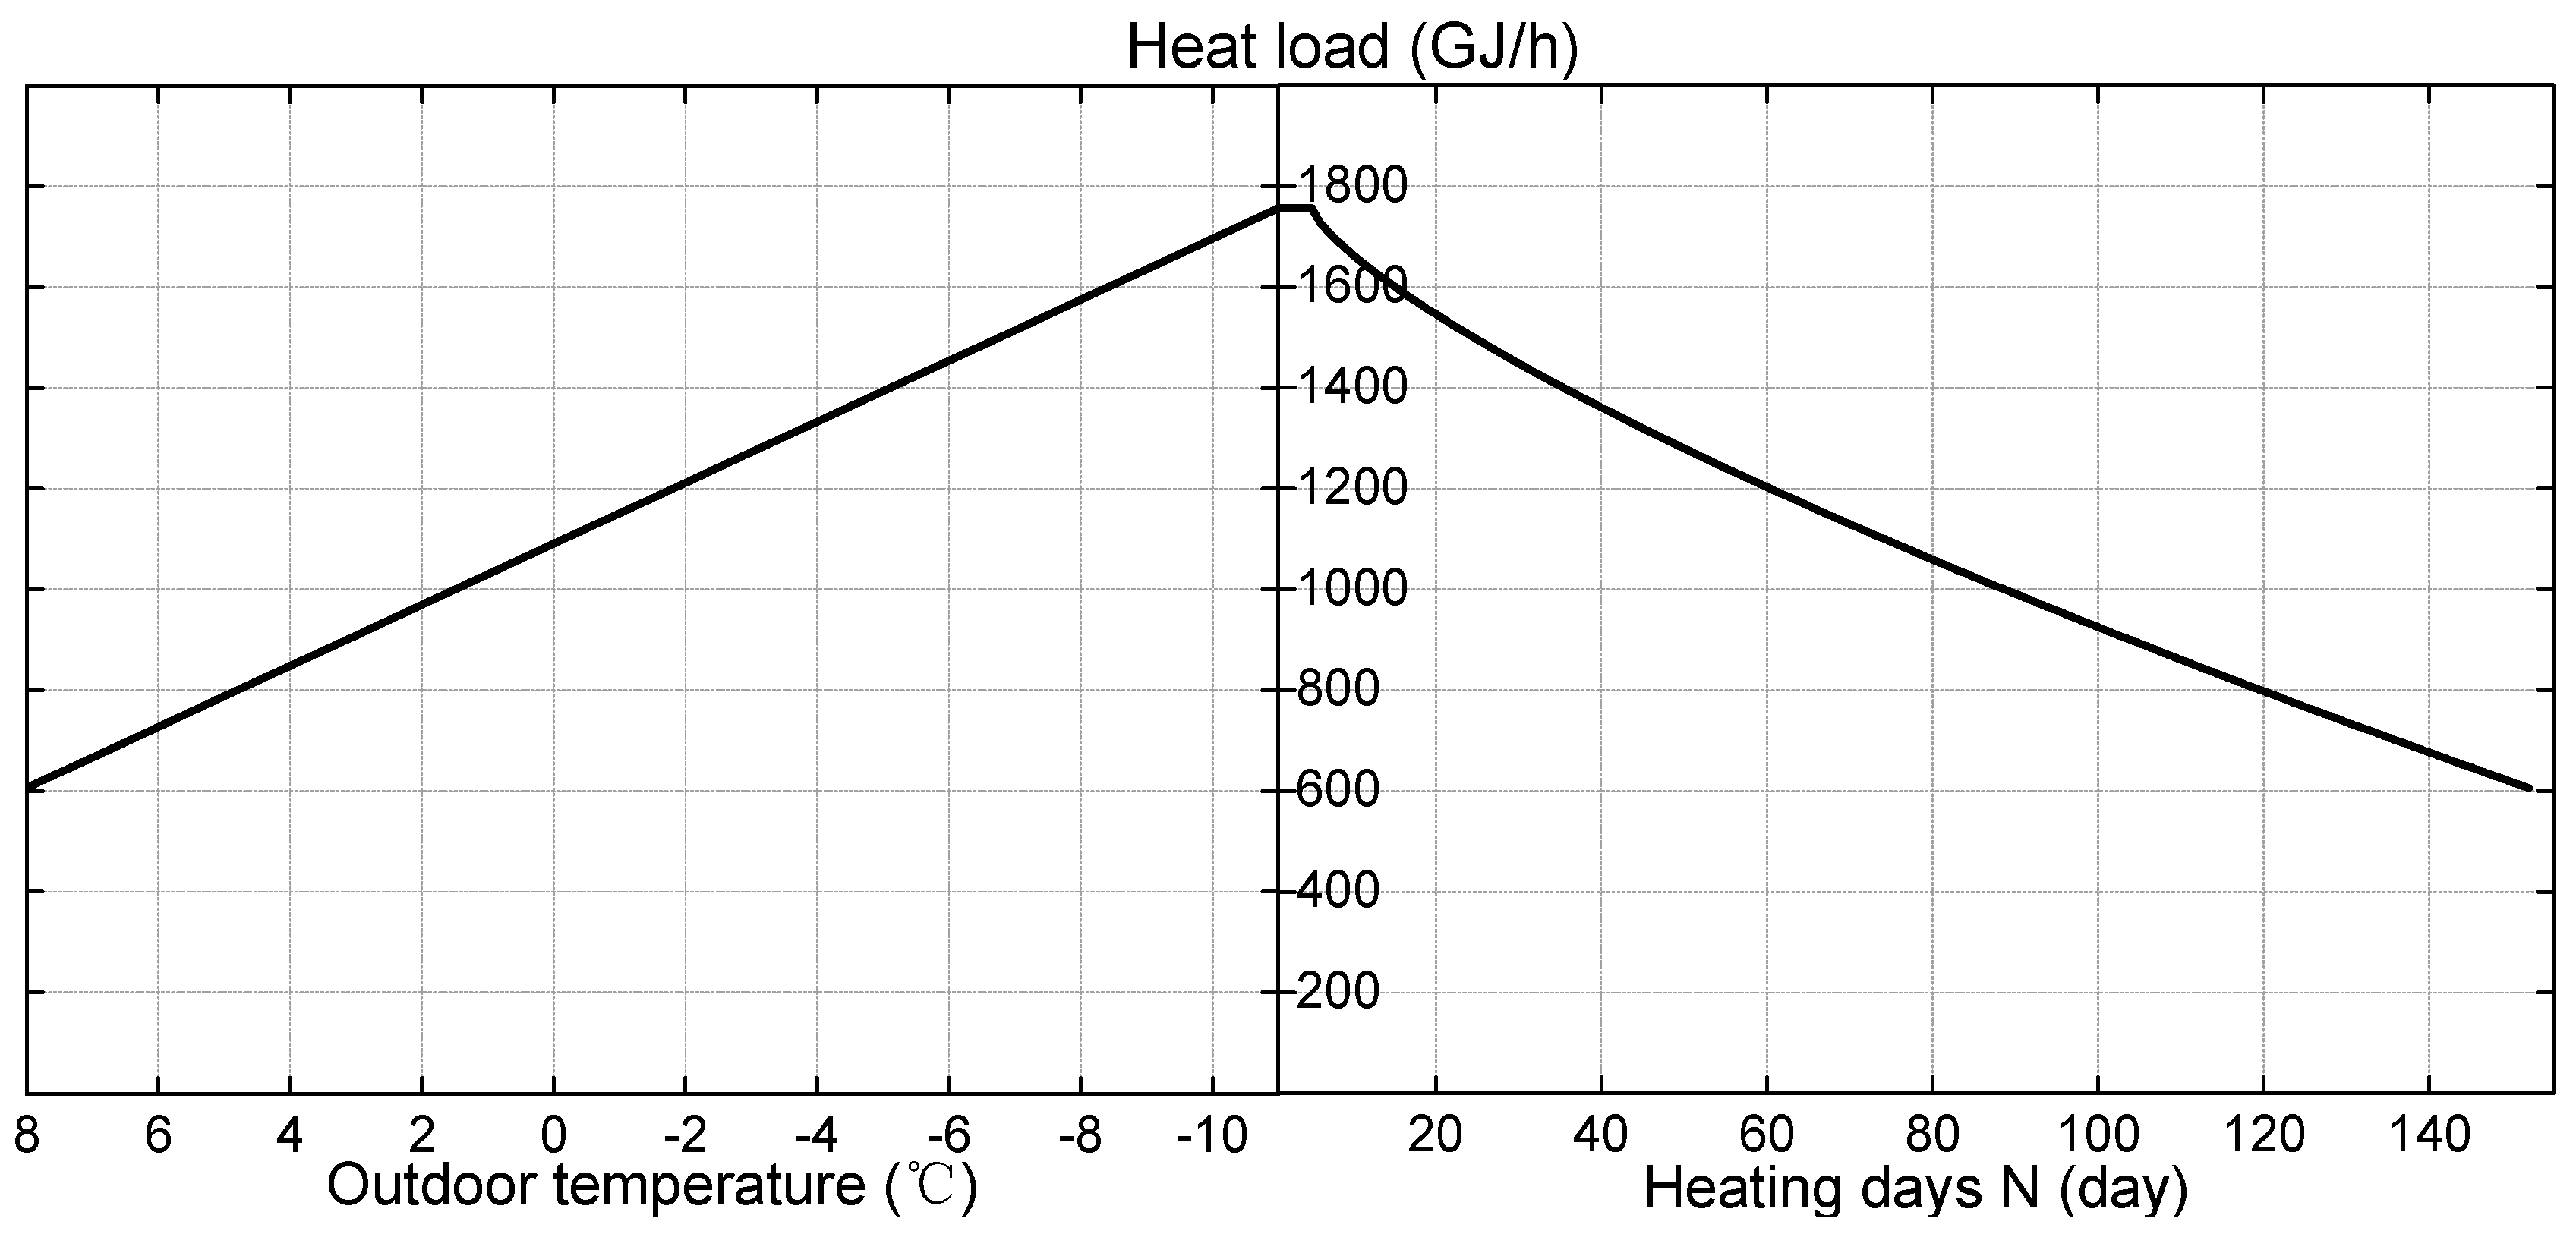
Figure 5.
Temperature curve of the primary network supply and return water in the demonstration power plant. (a) Daily temperature; (b) Month average temperature.
Figure 5.
Temperature curve of the primary network supply and return water in the demonstration power plant. (a) Daily temperature; (b) Month average temperature.
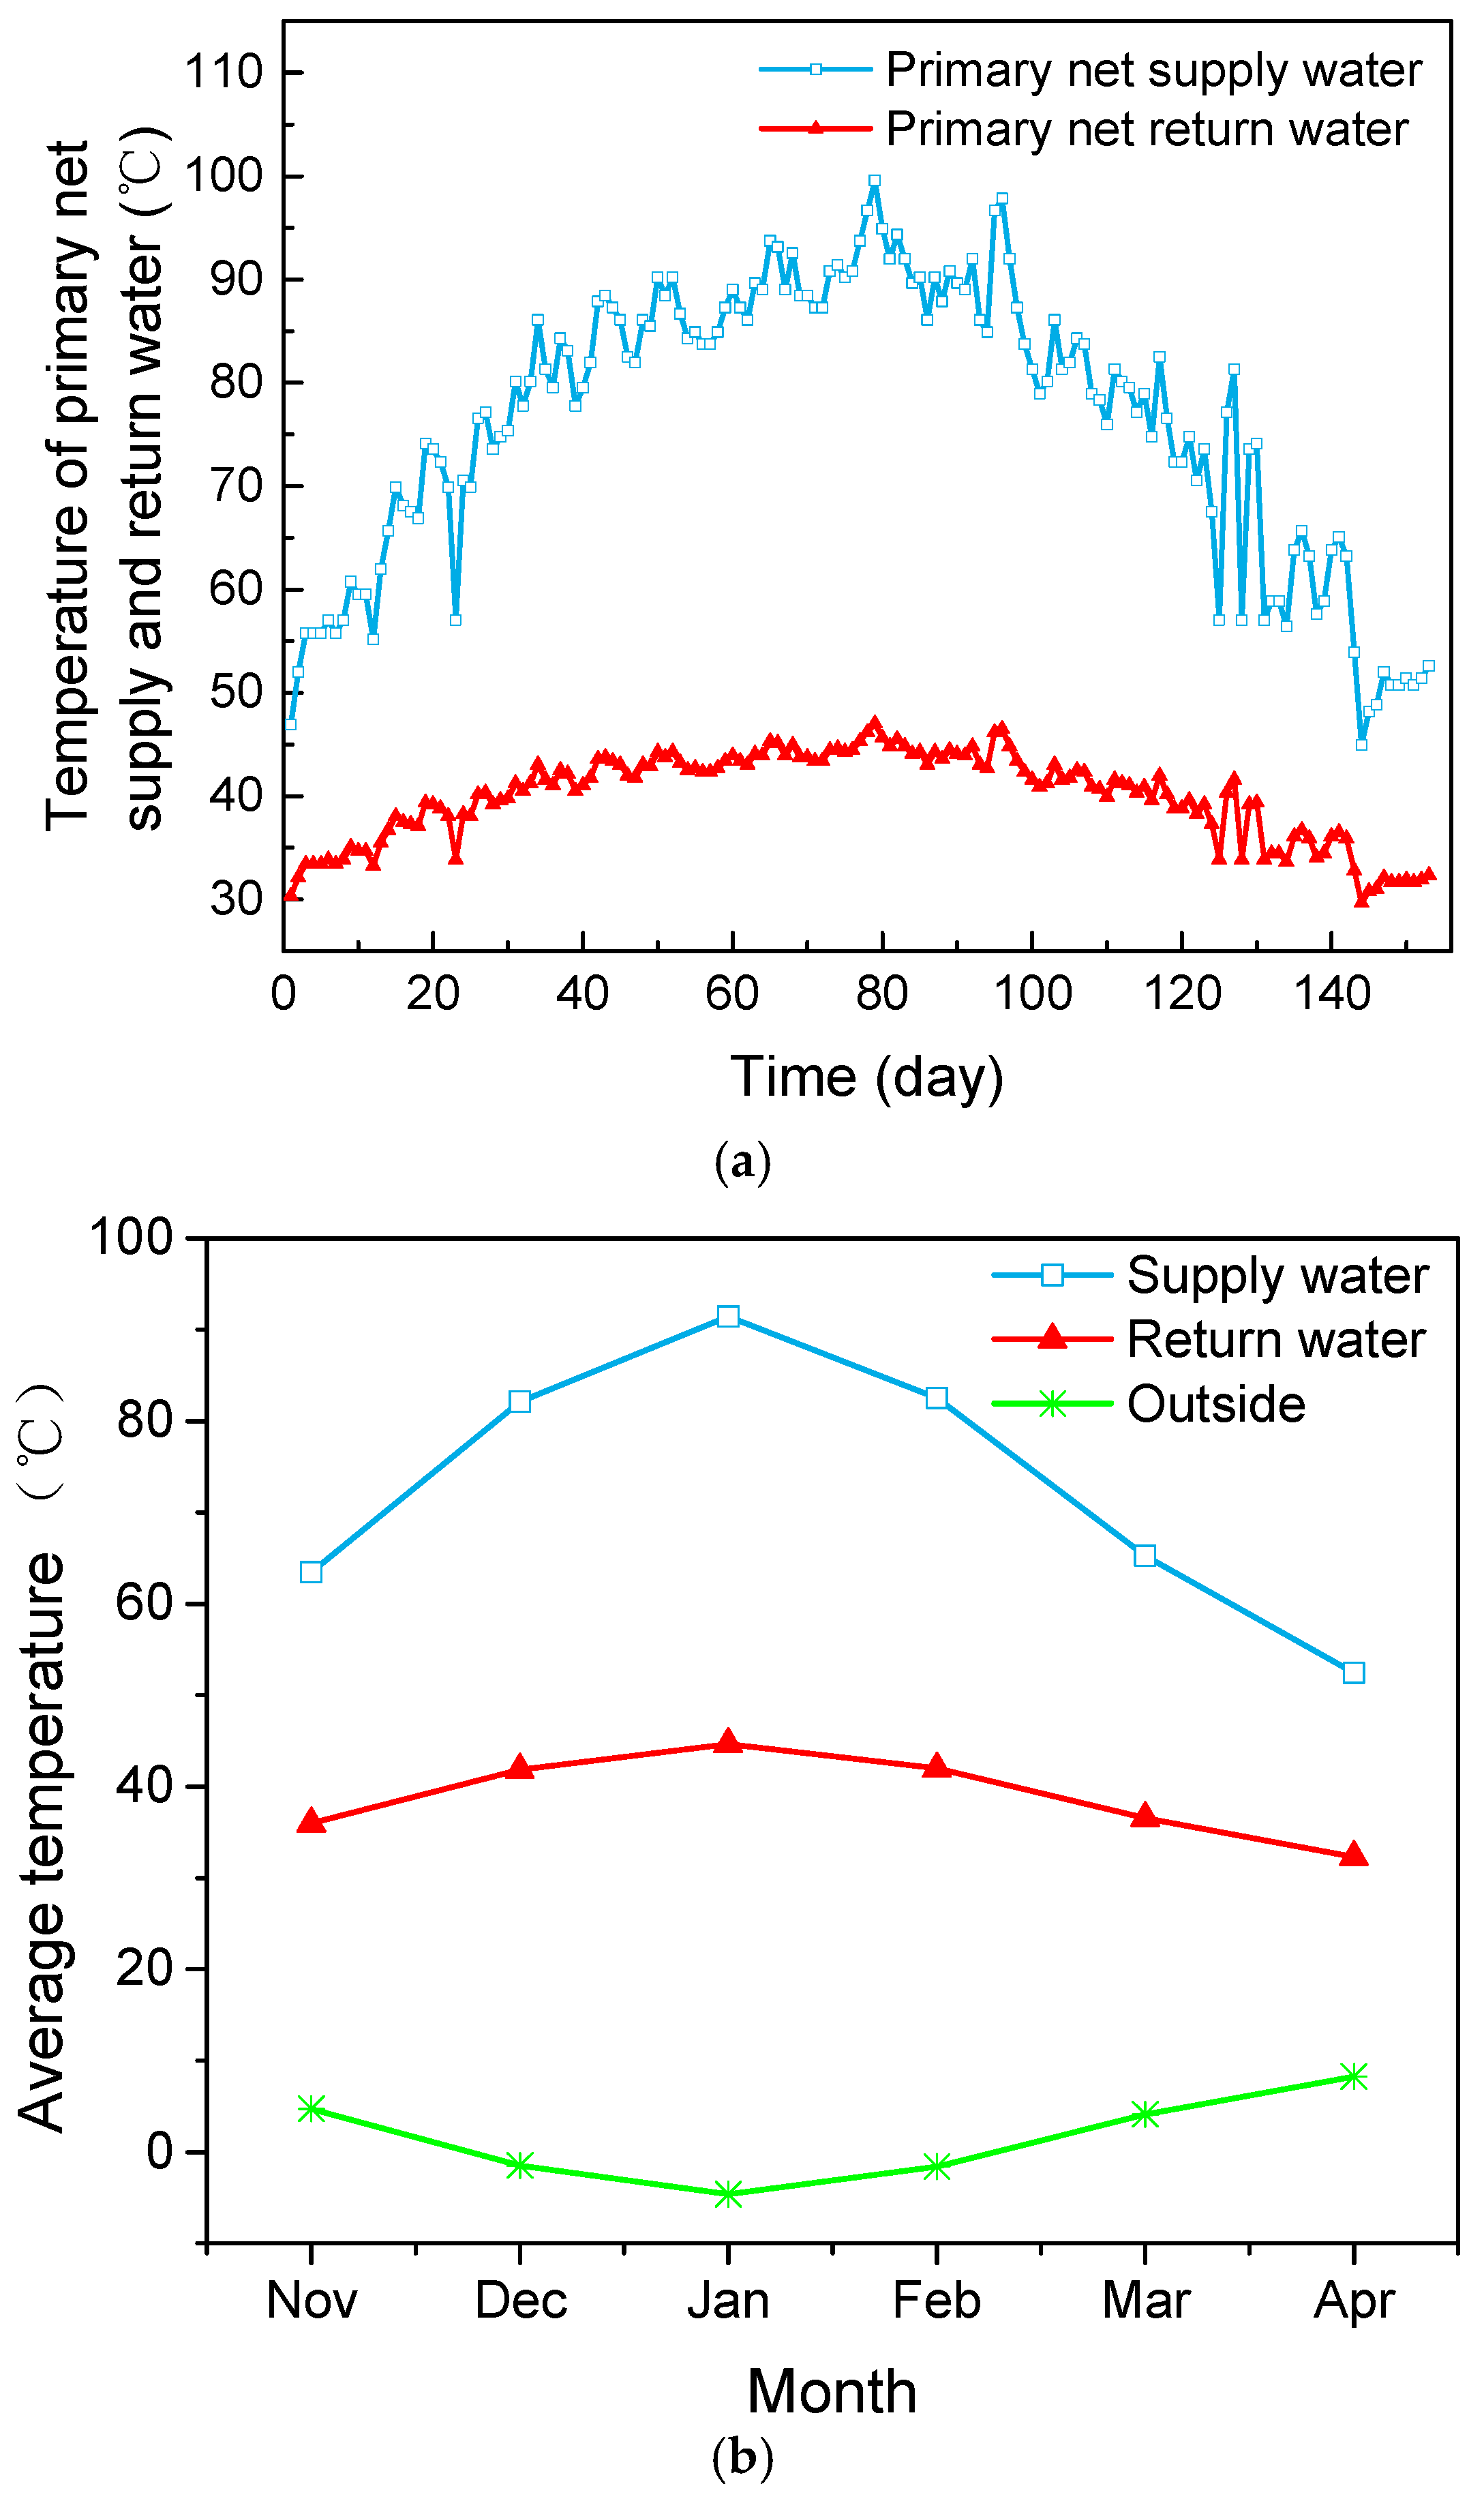
Figure 6.
Comparisons of the performance of the power plant during the heating season before and after the retrofit. (a) Coal consumption rate; and, (b) Power output.
Figure 6.
Comparisons of the performance of the power plant during the heating season before and after the retrofit. (a) Coal consumption rate; and, (b) Power output.
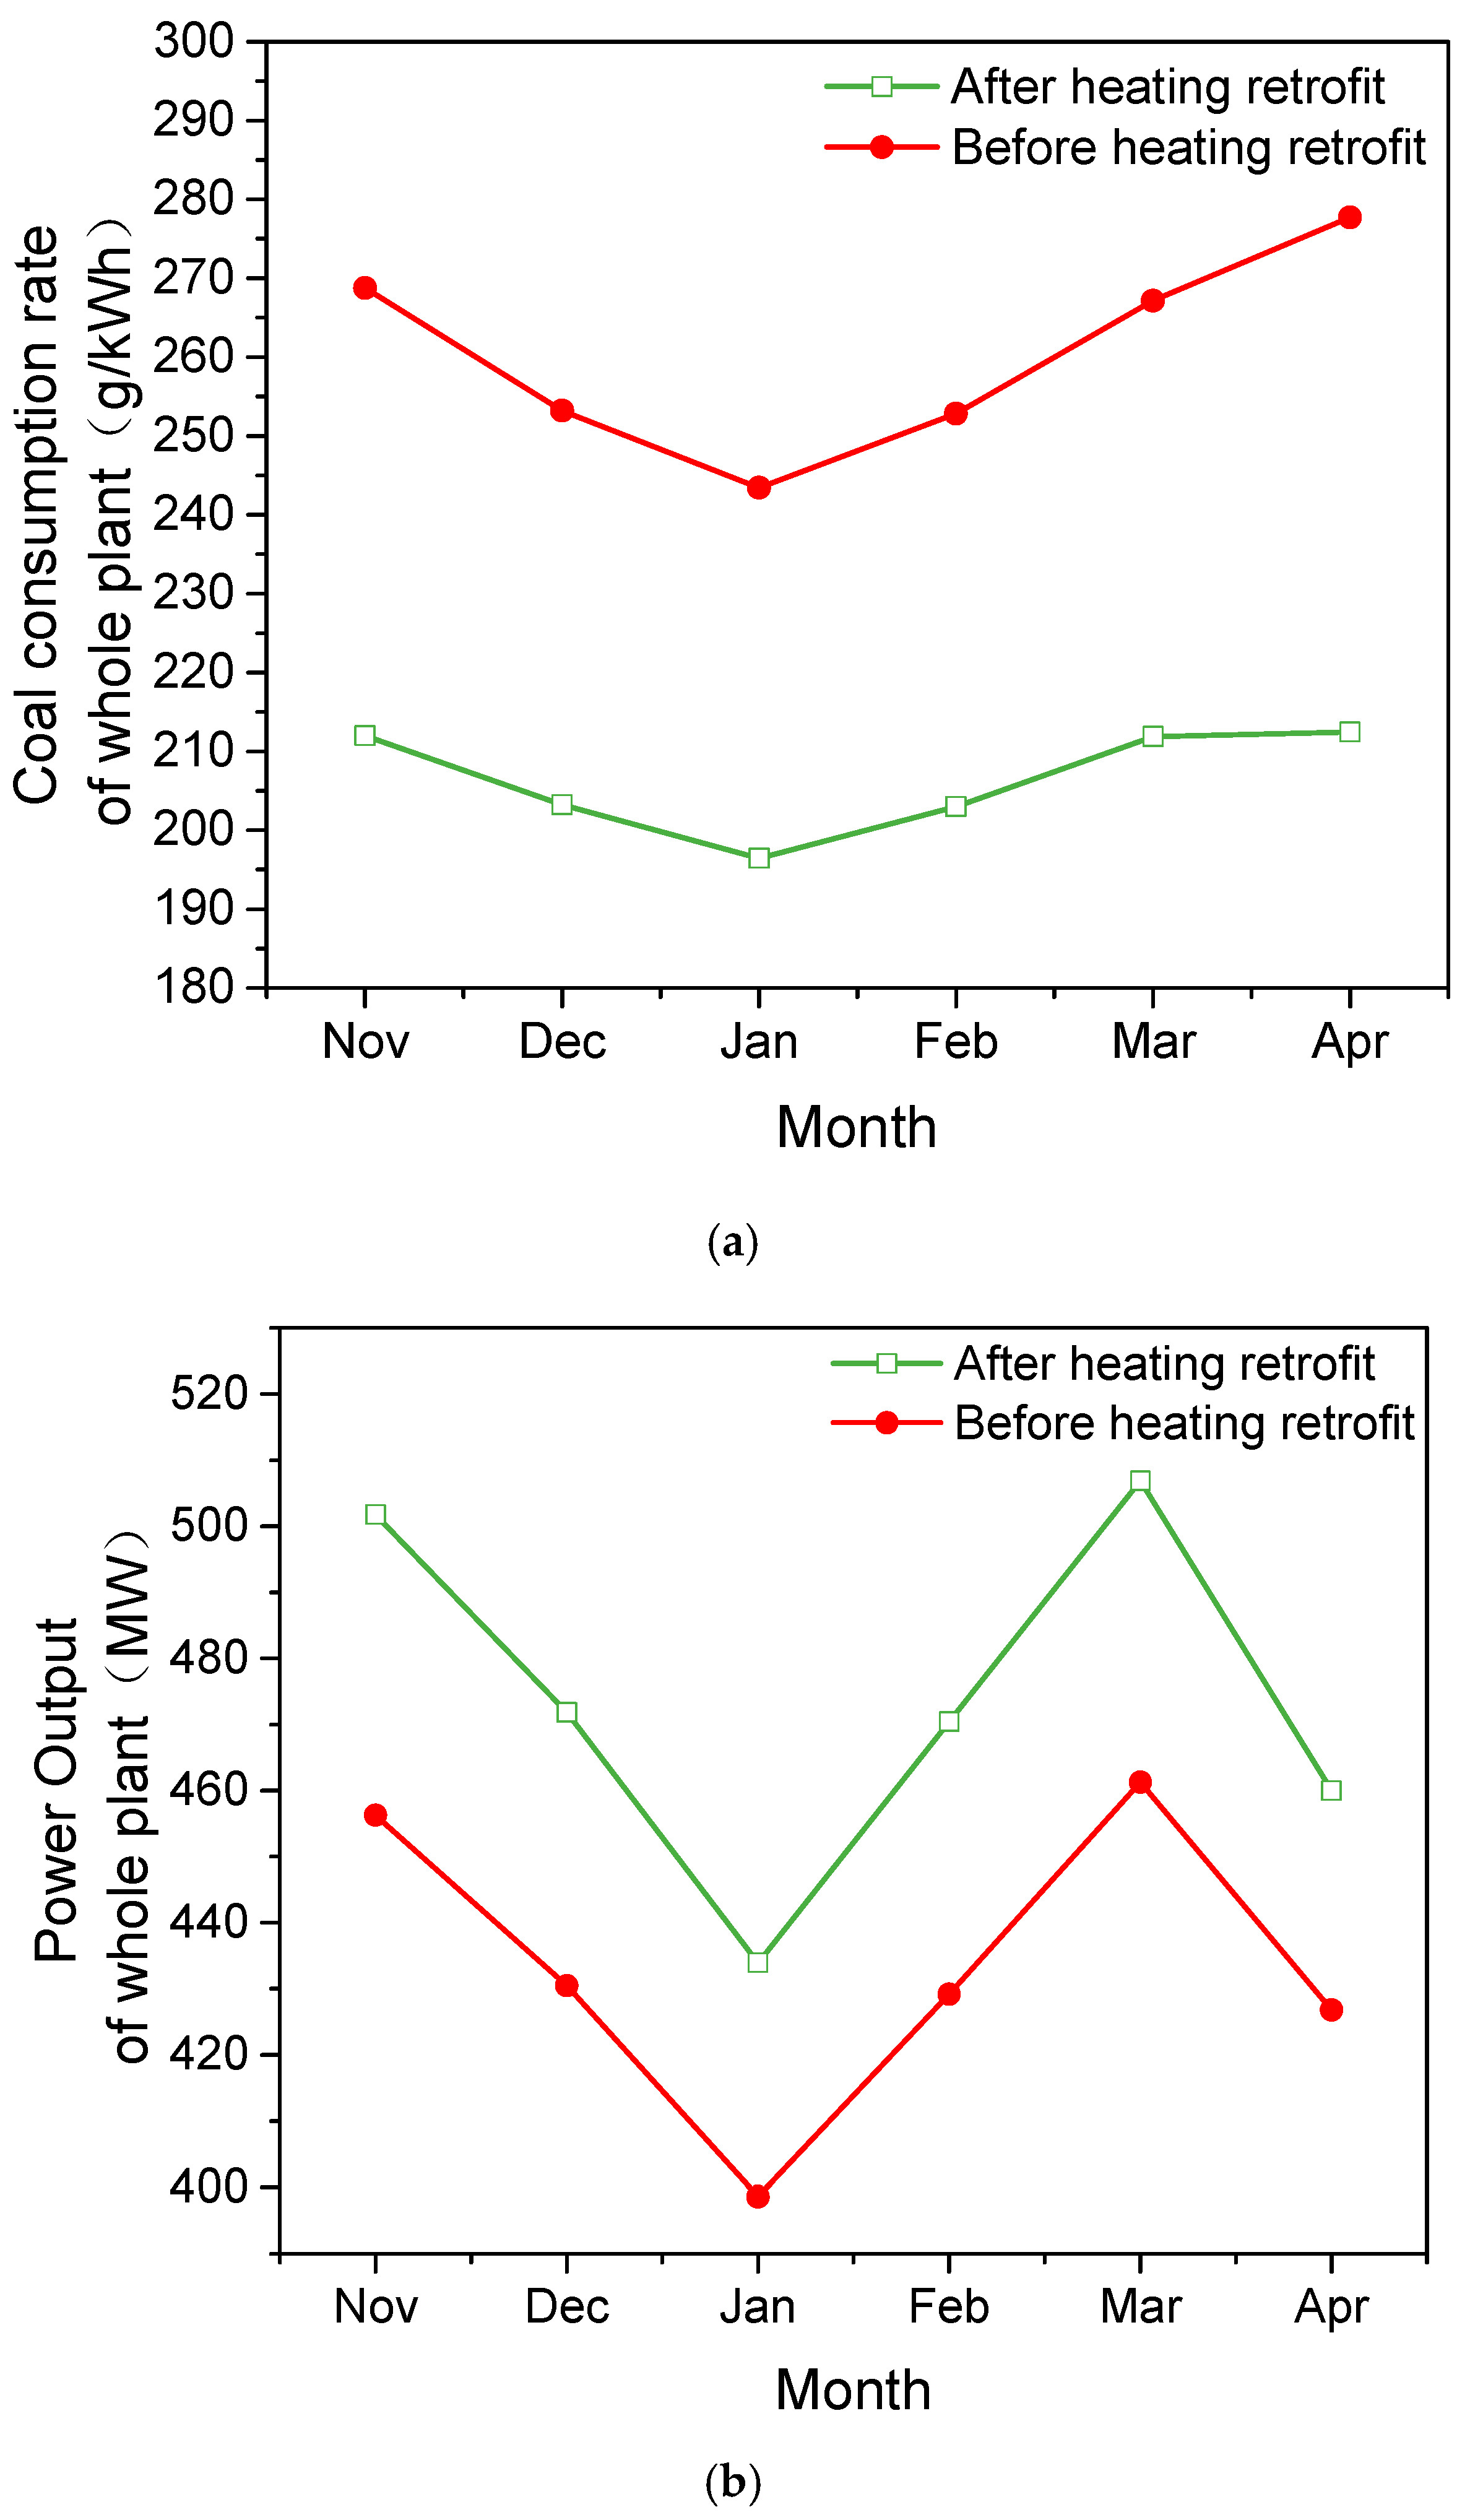
Figure 7.
Coal consumption rates and thermal efficiencies at the maximum heating capacity.


Table 1.
Calculation error of power generation under different conditions.
| Condition | Heat Balance Diagram Value/MW | Calculated Value/MW | Calculation Error/% |
|---|---|---|---|
| THA | 350.153 | 350.153 | 0 |
| 75% THA | 262.552 | 260.630 | 0.73 |
| 50% THA | 175.223 | 174.626 | 0.34 |
| 40% THA | 140.020 | 141.083 | 0.76 |
Table 2.
Heat load distribution between the two CHP units.
| Time | Outdoor Temperature/°C | Relative Calorie Ratio | Heating Load/MW | Exhaust Steam Heating/MW | Extraction Steam Heating/MW | Water Temperature after Exhaust Heating/°C | Percentage of Exhaust Steam Heating/% |
|---|---|---|---|---|---|---|---|
| Nov. | 4.72 | 0.46 | 223.37 | 223.37 | 0 | 63.45 | 100.0 |
| Dec. | −1.46 | 0.67 | 327.47 | 228.88 | 98.60 | 69.99 | 69.89 |
| Jan. | −4.62 | 0.78 | 380.55 | 206.15 | 174.40 | 70.00 | 54.17 |
| Feb. | −1.60 | 0.68 | 329.82 | 227.85 | 101.97 | 70.26 | 69.08 |
| Mar. | 4.13 | 0.48 | 233.31 | 233.31 | 0 | 65.26 | 100.0 |
| Apr. | 8.26 | 0.34 | 163.87 | 163.87 | 0 | 52.45 | 100.0 |
© 2018 by the authors. Licensee MDPI, Basel, Switzerland. This article is an open access article distributed under the terms and conditions of the Creative Commons Attribution (CC BY) license (http://creativecommons.org/licenses/by/4.0/).
Share and Cite
MDPI and ACS Style
Ge, Z.; Zhang, F.; Sun, S.; He, J.; Du, X. Energy Analysis of Cascade Heating with High Back-Pressure Large-Scale Steam Turbine. Energies 2018, 11, 119. https://doi.org/10.3390/en11010119
AMA Style
Ge Z, Zhang F, Sun S, He J, Du X. Energy Analysis of Cascade Heating with High Back-Pressure Large-Scale Steam Turbine. Energies. 2018; 11(1):119. https://doi.org/10.3390/en11010119
Chicago/Turabian StyleGe, Zhihua, Fuxiang Zhang, Shimeng Sun, Jie He, and Xiaoze Du. 2018. "Energy Analysis of Cascade Heating with High Back-Pressure Large-Scale Steam Turbine" Energies 11, no. 1: 119. https://doi.org/10.3390/en11010119
Note that from the first issue of 2016, this journal uses article numbers instead of page numbers. See further details here.