Article

A Combined Experimental and Computational Fluid Dynamics Investigation of Particulate Matter Emissions from a Wall-Guided Gasoline Direct Injection Engine

Department of Mechanical Engineering and Mathematical Sciences, Oxford Brookes University, Wheatley Campus, Oxford OX33 1HX, UK
*
Author to whom correspondence should be addressed.
Energies 2017, 10(9), 1408; https://doi.org/10.3390/en10091408
Submission received: 30 June 2017 / Revised: 3 September 2017 / Accepted: 7 September 2017 / Published: 14 September 2017

Abstract

:
The latest generation of high-efficiency gasoline direct injection (GDI) engines continues to be a significant source of dangerous ultra-fine particulate matter (PM) emissions. The forthcoming advent in the 2017–2020 timeframe of the real driving emission (RDE) standards affords little time for the identification of viable solutions. The present research work aims to contribute towards a much-needed improved understanding of the process of PM formation in theoretically-homogeneous stoichiometric spark-ignition combustion. Experimental measurements of engine-out PM have been taken from a wall-guided GDI engine operated at part-load; through parallel computational fluid dynamics (CFD) simulations of the test-engine, the process of mixture preparation was investigated. About 80% of the total particle number is emitted on average in the 5–50 nm range, with the vast majority being below the regulated lower limit of 23 nm. The results suggest that both improved charge homogeneity and lower peak combustion temperature contribute to lower particle number density (PNDen) and larger particle size, as engine speed and load increase. The effect of engine load is stronger and results from greater injection pressure through better fuel droplet atomisation. Increases in pre-combustion homogeneity of 6% are associated with one order of magnitude reductions of PNDen. A simplified two-equation functional model was developed, which returns satisfactory qualitative predictions of PNDen as a function of basic engine control variables.

1. Introduction

Increased market demand for low fuel consumption vehicles and new emissions regulations have led developers in recent years to focus on technology which increases the efficiency of GDI engines. Down-sizing, in combination with turbo-charging and variable valve timing (VVT), offered real potential for improving fuel economy in comparison to traditional gasoline engines [1,2,3]. However, GDI engines emit large numbers of ultra-fine particles and hence pose a serious concern for human health and the environment [4,5]. The World Health Organization estimates that around 800,000 people die each year worldwide due to diseases correlated with particulate matter (PM) [6]. The new EU6c/d emission regulations introduce particle number limits of 6.0 × 10¹¹ particles/km in connection with the Worldwide Harmonized Light Duty Vehicles Test Cycle (WLTC), but these limits are staged through a series of RDE conformity factors (CF), from September 2017 (CF < 1) till 2020 when presumably the limits will take full effect (CF = 1) [7,8]. The regulations will also oblige manufacturers to publish vehicles’ certificates of conformity, giving consumers full transparency on real emission performance. In spite of the staged approach, the new emission standards afford little time for identification and implementation of viable solutions. Current limitations in portable emission measuring systems (PEMS) also mean that tests and regulations exclude sub-23 nm particles, effectively ignoring a large proportion of the ultra-fine PM yield. While this may result in easier vehicle compliance, achievable through the implementation of gasoline particulate filters (GPF) [7,8], the current approach may have implications in terms of direction of research and development investment as well as of public perception and market demand. Investigating new ways of deploying existing technology and improved control strategies to minimise PM emissions from GDI engines is today very much essential. The first necessary step to generate effective PM-oriented control strategies is to develop improved fundamental knowledge of the process of PM formation, along with better predictive models.

1.1. Particulate Matter Formation Process

The process of PM formation may be described as a succession of chemical and physical events, including:
  • Oxidation and/or pyrolysis of fuel under fuel-rich conditions and temperature between 1000 and 2800 K;
  • Production of precursor molecules from hydrocarbons species, leading to the formation of polycyclic aromatic hydrocarbons (PAH) gas species molecules;
  • Polymerization of hydrocarbon rings;
  • Particle inception or nucleation, as a result of the interaction between polymerized structures;
  • Particles growth due to interactions between PAH species and particle surface;
  • Coagulation of particles due to collision;
  • Oxidation of particles in the presence of oxygen species (O2, OH, CO2, H2O) in high temperature environment (during and post combustion).
PM emissions are a complex mixture of volatile components, mostly unburned hydrocarbons (uHC) originating from either fuel or lubricant oil, and solid components—primarily ash, sulphur and metal. The agglomerated carbonaceous primary particles (normally addressed as soot) may adsorb both organic and inorganic compounds on their surface. In a GDI engine working under stoichiometric conditions, a large amount of the soot formed would actually be oxidised during combustion [9,10,11]. Less than 1% of PM mass is thought to be oxidised inside the exhaust pipe [11]. After combustion, while the system is cooling down during the expansion stroke, a high concentration of non-volatile species (e.g., metals) may deposit on carbon particles or self-nucleate [12].
Generally, solid and volatile particles are divided into three classes or modes: nucleation mode, consisting principally of volatile droplets; accumulation mode, consisting mainly of agglomerated solid carbon particles featuring condensed volatile materials on their surface; and coarse mode. Conventionally [13,14], the nucleation mode comprises of nanoparticles with diameter smaller than 50 nm; the accumulation mode comprises of ultra-fine particles with size between 50 and 100 nm; and the course mode is made up of bigger particles. A complete account of these modes in relation to the functional form of the experimental particle number density distributions is due to Kittelson et al. [15]. The analysis of soot emission by number count shows that most particles belong to the nucleation mode; the analysis by mass shows a clear bias towards the accumulation mode. Giechaskiel et al. [12] suggest that, for both GDI and diesel engines, the mean value of the primary particles size is around 25 nm. La Rocca et al. [16] suggest a slightly larger size. The particles size distribution in GDI engines may be wider when compared to diesel engines because of higher concentration of volatiles. Larger percentage of sub-23 nm particles can also exist due to the presence of fuel or lubricant additives. Experimental measurements obtained by Giechaskiel et al. [12] show that for emission levels around 1.0 × 10¹³ particles/km, the percentage of solid sub-23 nm particles was about 40%. Measured composition of PM from analysis of exhaust gas samples heavily depends on where and how samples are obtained. Condensation and adsorption may convert volatile components to solid and liquid particles as soon as the exhaust gas is diluted and cooled within the sampling line [11]. Several complex phenomena affect formation of volatile components (dilution rate, temperature, resident time, humidity) and of particles (thermophoresis, diffusion, impact, electrophoresis) [11,17]. Consequently, the results across different studies are often discordant. Andersson et al. [18] investigated particle emissions from wall-guided GDI engines and concluded that the clear majority (72% by number count) was elemental soot, which is comparable to diesel engines [19]. Price et al. [14] concluded instead that the volatile components were dominant, while the solid carbon fraction accounted only for up to 30%. To reduce measurement uncertainty and repeatability issues, the particle measurement programme (PMP) has recently been introduced, which identifies standardized techniques for measuring particle number and mass from engines operating with different fuels [12].
In a GDI engine, poor mixture preparation is one of the major causes of PM formation [11,14,20,21,22,23,24,25]. Mixture preparation refers normally to the process of fuel injection, vaporisation and mixing with in-cylinder air charge. Generally, poor mixture preparation occurs in at least one of three forms, namely air-fuel ratio (AFR) mal-distribution at the beginning and during combustion; formation of liquid fuel film on the combustion chamber walls and piston crown; residual fuel droplets remaining during combustion. AFR mal-distribution occurs due to the relatively short time available between end of injection and spark timing. Incomplete mixing between air and fuel and the permanence of sub-stoichiometric mixture-pockets during combustion, lead to abnormal combustion and generation of PM [9,10,14,21,22,24,25,26,27,28]. Fuel film formation is governed by injection characteristics such as injection pressure, spray angle/direction, injection timing, but is also heavily dependent on gas and especially metal wall temperature [14,25]. Higher injection pressure speeds up the process of mixing through better droplets atomisation but, at the same time, results in deeper spray tip penetration and potential spray-wall impingement. If exposed to high temperature during combustion, liquid film may give rise to the mechanism of pool-fire leading to heavy PM yield [9,21,25]; on the other hand, the process of evaporation of the film may contribute to the mal-distribution of AFR along the chamber periphery [14,25]. The third mechanism, residual liquid droplets, is generally related to cold start running conditions or specific strategies such as stratified charge combustion [22,24]. If a reduction of fuel atomisation occurs, this leads to larger than normal droplets that take longer to vaporize. The phenomenon of direct carbonization of these droplets is also possible [29].

1.2. Influence of Engine Control Parameters

Several studies have been conducted to investigate how engine calibration control parameters correlate to emission of PM [11,13,14,21,22,23,24]. The work of Maricq et al. [22], and the more recent one by Farron et al. [24], remained major milestones in GDI engine PM emission research. Maricq et al. [22] investigated the effects of injection timing, speed, load and spark timing on PM emission from a GDI engine. The transition from homogeneous to stratified charge combustion, gained by varying the end of injection (EOI) between 300 and 50 crank angle degrees (CA deg) before top dead centre (BTDC) at fixed operating conditions, led to an increase of both particle number and mass of at the least a factor of 20. A clear increase in PM emissions was also observed when both engine speed and load were augmented at fixed fuel injection pressure. In this case, enhanced chamber turbulence and better mixing were not sufficient to mitigate the effects of reduced mixing time or greater amount of fuel. A weak correlation was found instead between retarded spark timing and reduced PM number concentration for homogeneous charge operation. On one hand, retarded ignition leads to lower in-cylinder peak temperature and hence lower nucleation rate; on the other hand, it causes higher exhaust gas temperature and hence stronger post-flame oxidation. The measured particle number density (PNDen) distributions were predominantly mono-modal (single peak) with particles concentrating mostly in the accumulation mode. Consistent results have been shown by Farron et al. [24]. Delaying the EOI from 330 to 100 CA deg BTDC, increases PM number density by one order of magnitude, between 3.0 × 10⁶ and 3.0 × 10⁷ particles/cm3. Similar changes result from doubling the indicated mean effective pressure (IMEP) at fixed engine speed and injection pressure. On account of improved fuel droplets atomisation, a four-fold reduction of PM number density was associated with doubling the fuel pressure from 40 to 80 bar. Retarding the spark timing between 25 and 10 CA deg BTDC, produced a small reduction of PM number concentration. Varying the air-fuel charge from lean (AFR = 18) to rich (AFR = 13), generated an increase of PM number density of two orders of magnitude (1.0 × 10⁵ to 1.0 × 10⁷ particles/cm3). Reducing coolant and oil temperature led to increased sensitivity of PM number density. Cold start engine tests at 30 °C caused an increase of PNDen of up to two orders of magnitude, when compared to fully warm conditions. Interestingly, the measured number density distributions were mostly bi-modal for injection timing tests and mono-modal for all other tests. The predominant mode was consistently the accumulation mode.
Price et al. [14] focused on the influence of AFR, start of injection (SOI), spark timing (ST) and fuel composition. Transitioning from stoichiometric to rich charge (AFR = 12) led to an order of magnitude increase in PM mass. A much smaller increase was recorded varying the charge AFR between stoichiometric and lean conditions (AFR = 18). Variation of SOI led to inconsistent results from competing mixture preparation phenomena. Again, a generally weak dependence was seen between ST and particle emissions. The measured PNDen distributions were bi-modal, with a predominant accumulation mode as a result of diffusion controlled combustion process and hence lack of charge homogeneity. Compared to isooctane, the use of aromatic hydrocarbon toluene led to one order of magnitude increase in PNDen. Chen et al. [30] investigated nine different blends of N-octane, isooctane, xylene and ethanol. The results point out to a trend of PNDen increasing proportionately with the aromatics contents, whilst the correlation between other components and particles emission was unclear. Wang et al. [31] studied the effect on PM emission of blending ethanol in gasoline with research octane number (RON) of 96.8. The ethanol mixtures yielded more than one order of magnitude reduction of total PM mass due to higher oxygen content and higher volatility. On the contrary, the total number density was higher compared to gasoline fuel because the uHC formed from ethanol would enhance the rate of particles nucleation. Other studies indicated that pure ethanol reduces dramatically PM mass emission compared to traditional unleaded fuel [32,33,34].

1.3. Influence of Combustion Parameters

Studies that concentrate on investigating the direct effect of combustion characteristics on PM are less common. Nonetheless, a survey of relevant literature provides convincing evidence regarding the role of gas temperature (during and post combustion) in the intrinsic trade-off between particle formation and oxidation [13,23,24,28,35,36]. A comprehensive investigation on the influence of combustion characteristics on particle emissions in a GDI engine is due to Pei et al. [23]. Their work shows that higher in-cylinder temperature and heat release rate, associated to rich mixtures, promote particle formation in accumulation mode and formation of HC; the latter, in turn, promotes the nucleation mode. Once particles are formed, the residence time at high temperature strongly affects the oxidation process. Decreasing the mixture AFR from 18 to 11 led to earlier combustion and greater rate of heat release; the resulting peak temperature grows between 2000 and 2250 K causing a factor of 10 increase in PNDen (5.0 × 10⁷ to 5.0 × 10⁸ particles/cm3). Over the same AFR interval, the geometrical mean diameter (GMD) increases between 9 and 32 nm, and this is explained through lower post-combustion temperature suppressing particle oxidation. The measured number density distributions were mostly bi-modal, but revealing a second nucleation mode peak for rich mixtures, presumably due to the presence of volatile low boiling-point HC. Hemdal et al. [37] investigated the relation between combustion characteristics and soot emissions using an optical GDI engine operated in stratified charge combustion mode. They showed that the soot luminescence trace follows the heat release rate profile with some delay due to the particle formation reaction time (milliseconds). After peaking, the soot luminescence trace quickly declines because of increased oxidation and reduced gas temperature. During combustion, the mechanism of oxidation is strongly driven by the presence of OH radicals. The impact of combustion temperature has also been recognised by Bermúdez et al. [35] in a study which focuses on the effects of cooled exhaust gas recirculation (EGR) in a modern turbo-charged EURO5 GDI engine, at part-load operating conditions. In this case, through the reduction of combustion temperature, the addition of 15% EGR at fixed break mean effective pressure (BMEP) produced 40% to 45% reduction in both PM mass and number concentrations.

1.4. Computational Fluid Dynamics Analysis of Mixture Preparation

In recent years there have been significant developments in accurate 3D CFD modelling of GDI engines as this offers a useful insight into the physico-chemical mechanisms leading to particle formation. Several studies [25,38,39] demonstrated that a strong indirect correlation exists between mixture preparation and engine-out PNDen. Engine speed, injection timing and mixing time are shown to influence the preparation process, but injection pressure appears to be the most significant driver for mixture homogeneity. Control strategies which include high injection pressure and appropriate timing to minimise unwanted jet-to-wall impact are seen to be potentially beneficial across the wider engine running envelope. Through modelling of a high-performance wall-guided GDI engine, Giovannoni et al. [25] showed how retarded SOI increases the quantity of fuel film forming on the piston crown, resulting in an unwanted stratification of the equivalence ratio distribution across the entire combustion chamber. Importantly, the study demonstrates that exhaust soot concentration is intimately correlated with the summation of combustion chamber computational cells’ mass, where the modelled fuel equivalence ratio at ignition timing is in excess of a set rich threshold. Kim and Kim [38] used a detailed soot model to understand the influence of air-fuel mixture preparation on particles emissions. The model was calibrated with experimental data obtained from a single cylinder research engine featuring side-mounted injector. The results indicated that PAH production depends strongly on the distribution of air-fuel equivalence ratio. The study shows that even at the highest injection pressure of 200 bar, localized rich regions persisted late in the compression stroke due to the following factors: suppression of fuel evaporation in the vicinity of cooler in-cylinder walls; piston upward motion forcing the fuel towards the chamber periphery; fuel film evaporation leading to enrichment of near-wall charge. The highest injection pressure was associated to the lowest Sauter mean diameter (SMD) of fuel droplets, while the lowest injection pressure of 100 bar showed the highest fuel film thickness and area. As a result, the lowest injection pressure case showed more than double the amount of rich mixture leading to an important source of particle inception. Jiao and Reitz, R. [11] modelled a single-cylinder engine operating in stratified-charge mode to explore the influence of liquid film deposits on soot emissions. Late injection strategies led to conspicuous deposits (about 6% of the fuel injected) remaining upon piston and cylinder head just before ignition. The resulting sub-stoichiometric near-wall gas regions, featuring equivalence ratios in excess of 2, are shown to be a significant source of soot formation. In previous CFD modelling work, Jiao and Reitz, R. [40] investigated the influence of equivalence ratio in theoretically-homogeneous/premixed part-load engine operating conditions. In all cases, irrespective of the global AFR, greater soot concentration and bigger particles were observed in the near-wall region as a result of 1. The presence of post-flame chemical species (e.g., acetylene and pyrene) promoting particle inception; 2. The lower temperature and reduced quantity of oxidising species (O2 and OH). Lucchini et al. [41] developed CFD models of a wall-guided GDI engine to investigate the effects of air-fuel mixture preparation on PM emissions, using two injectors of different spray pattern. A mixture uniformity index (UI) was defined as U I = 1   σ   /   σ ti , where σ is the standard deviation of fuel mass fraction and σ ti is the standard deviation for a totally inhomogeneous mixture (fuel not at all mixed with air): σ ti = AFR / ( 1 + AFR ) . Interestingly, for given engine running conditions, the two injectors give very similar levels of end-of-compression uniformity, but the injector featuring wider spray pattern, less jet-to-jet interaction, and reduced wall and valve-impingement, produced up to two orders of magnitude lower total particle number density.
The following conclusions may be drawn from the literature review: PM emissions from a GDI engine consist of solid (ash, sulphur, soot, metal) and volatile (uHC) components. The measured size-resolved particle number density distributions assume generally a bi-modal form; the larger nucleation mode would consist mostly of volatile particles, the smaller accumulation mode mostly of solid particles. GDI engines emit large proportions of sub-23 nm particles; the average particle size is reported to be 25 nm or slightly higher. The particle sampling process suffers from errors and repeatability issues due to the complex nature of PM. During combustion, the soot production process follows, with a certain delay, the heat release rate; higher in-cylinder temperature and rate of heat release would promote particle formation; however, the resident time at high temperature influences the oxidation process and hence the resulting average size. For a wall-guided GDI engine, lack of mixture homogeneity and liquid fuel film remaining at the walls, are major promoters of PM emissions. With respect to their effects on PM emissions, engine running variables can be listed in the following descending rank of importance: fuel type; fuel injection pressure; coolant and oil temperature; AFR; injection timing; spark timing. Accurate CFD modelling may significantly support the development of GDI engines and the understanding of the limits of the technology. Published CFD studies consistently point out that PM production depends strongly on the process of air-fuel mixture preparation.
The research work summarised in this paper attempts a detailed characterization of PM emission from a wall-guided GDI engine operated at part-load, along with an analysis of relevant correlations existing between engine-out PM levels, combustion characteristics and basic engine control parameters. Specifically, the work outlines the role of air-fuel mixture preparation and combustion temperature in the process of PM formation, and use cut-down CFD simulations to quantify mixture preparation and propose an initial simplified model where particle number density is given as a function of basic engine variables. The main aim of the work has been to contribute towards an improved fundamental understanding of PM mechanisms in partially-premixed globally-stoichiometric spark ignition combustion.

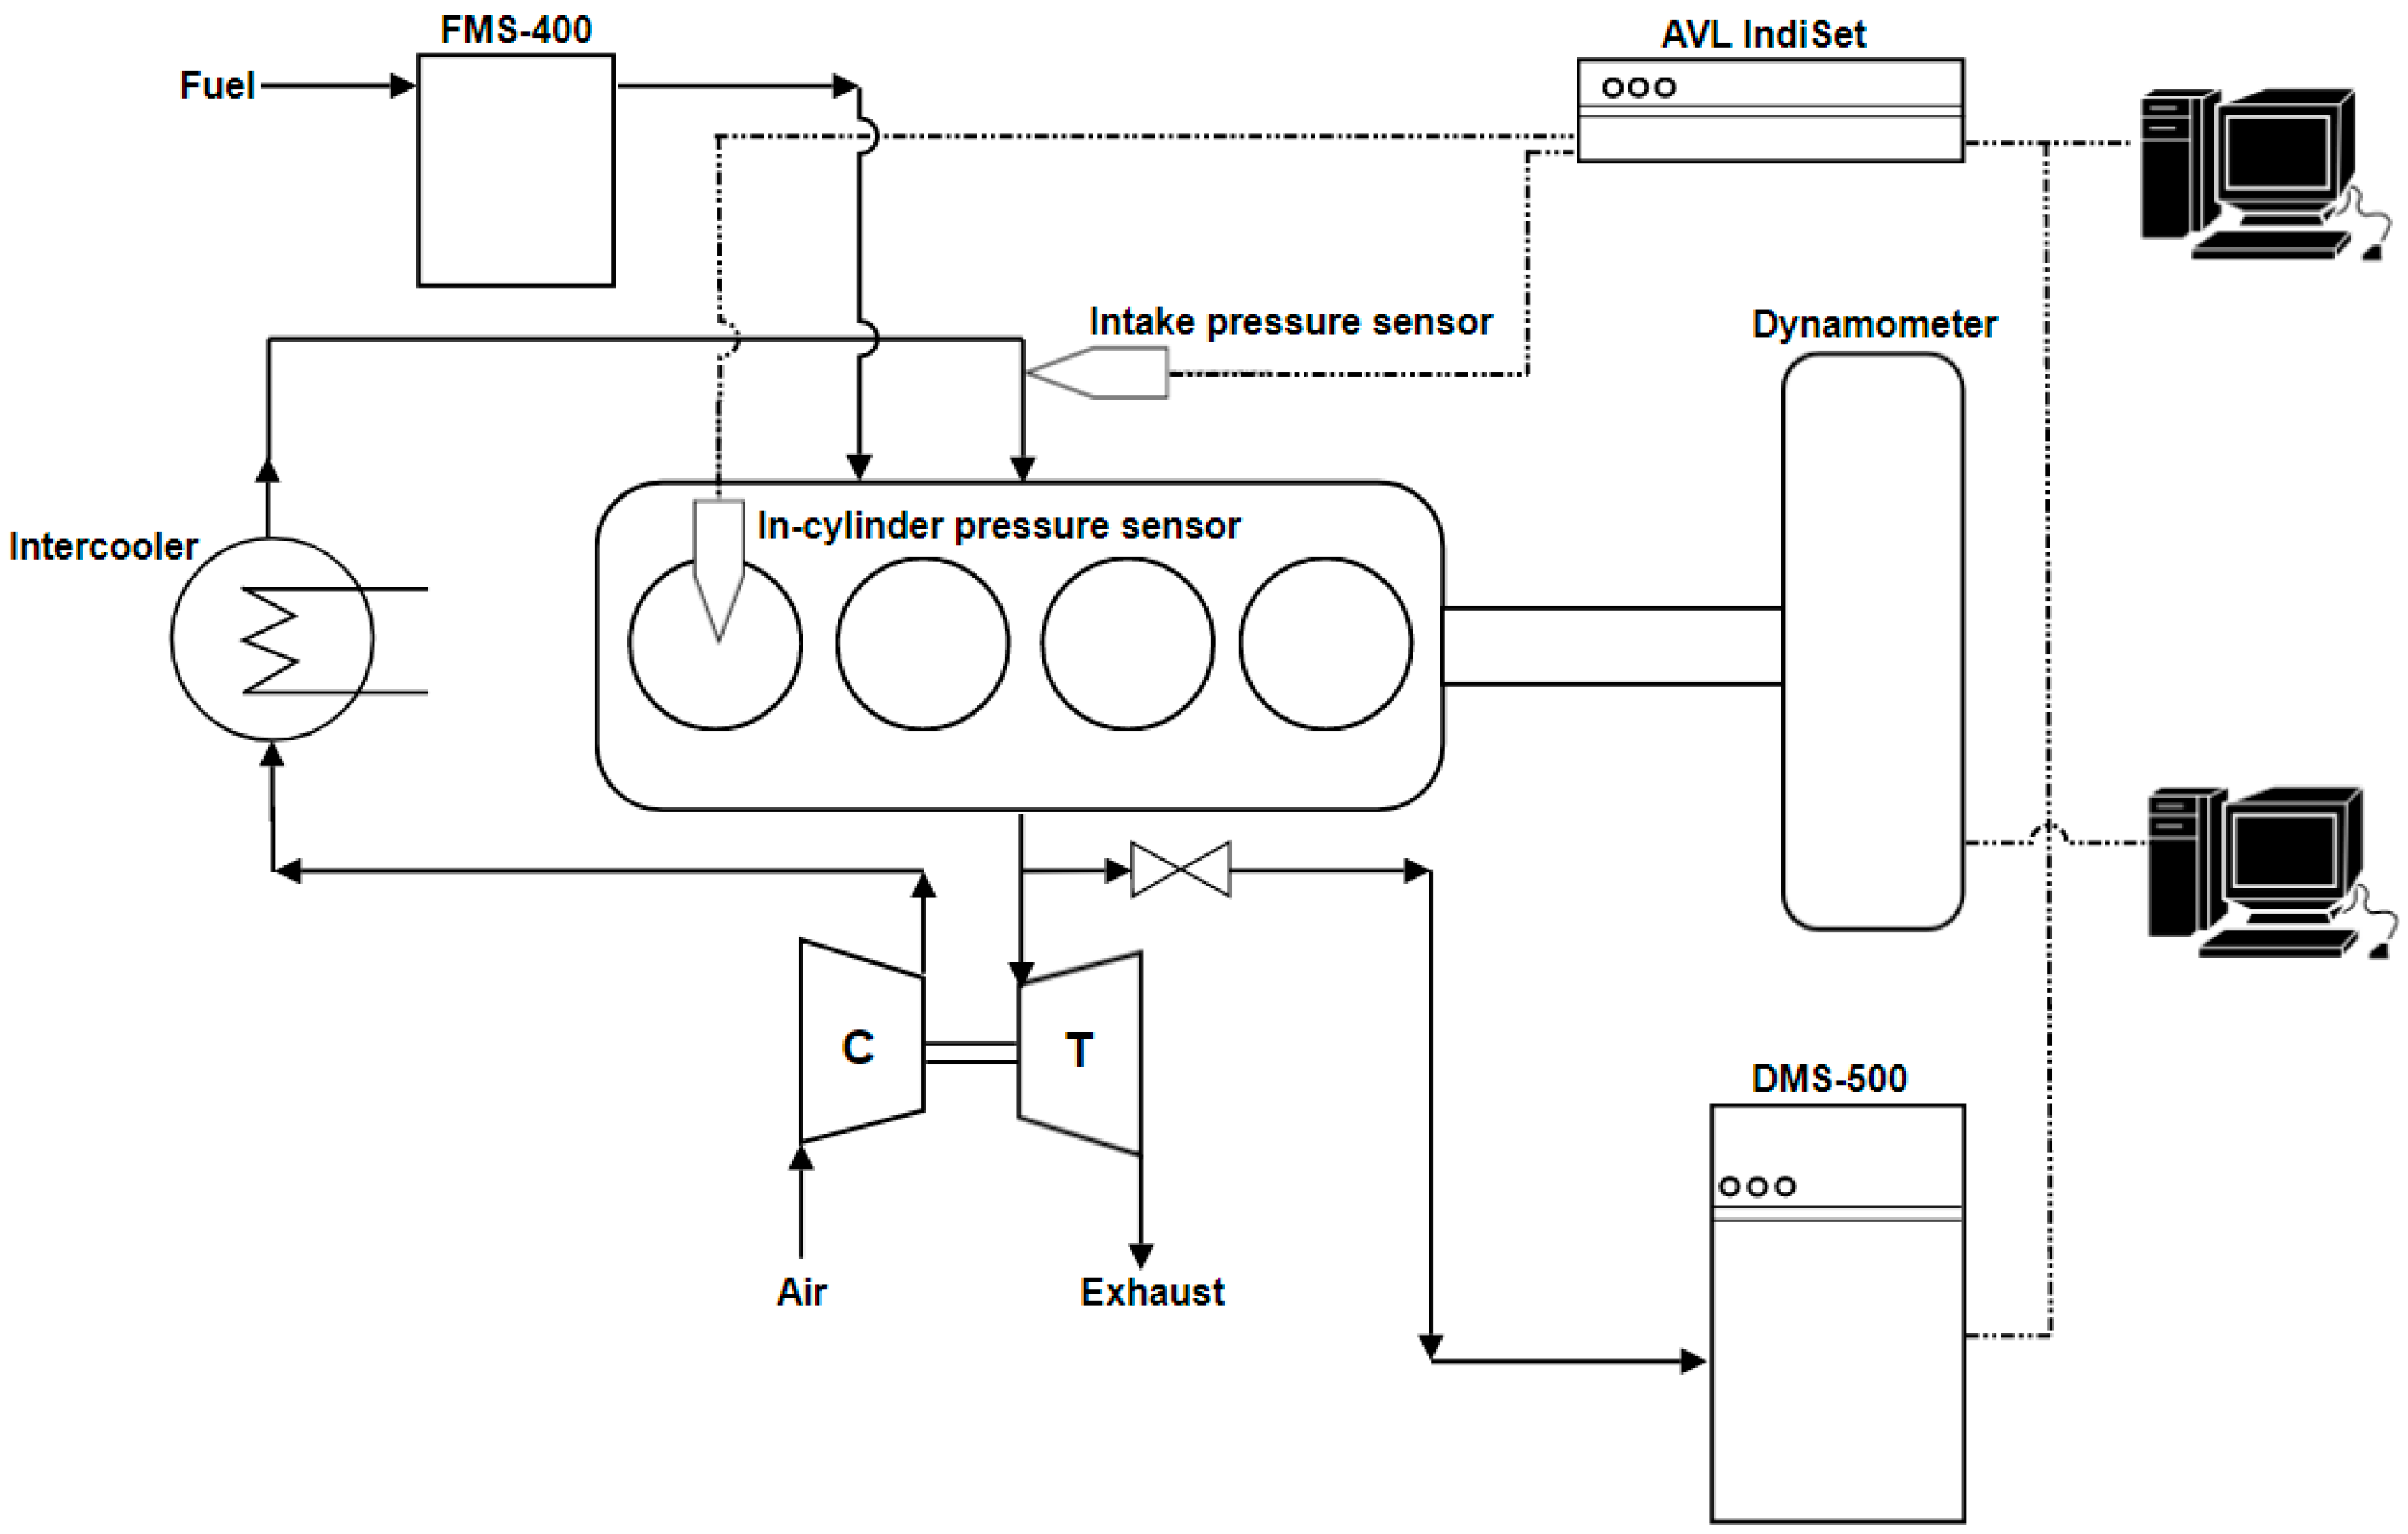
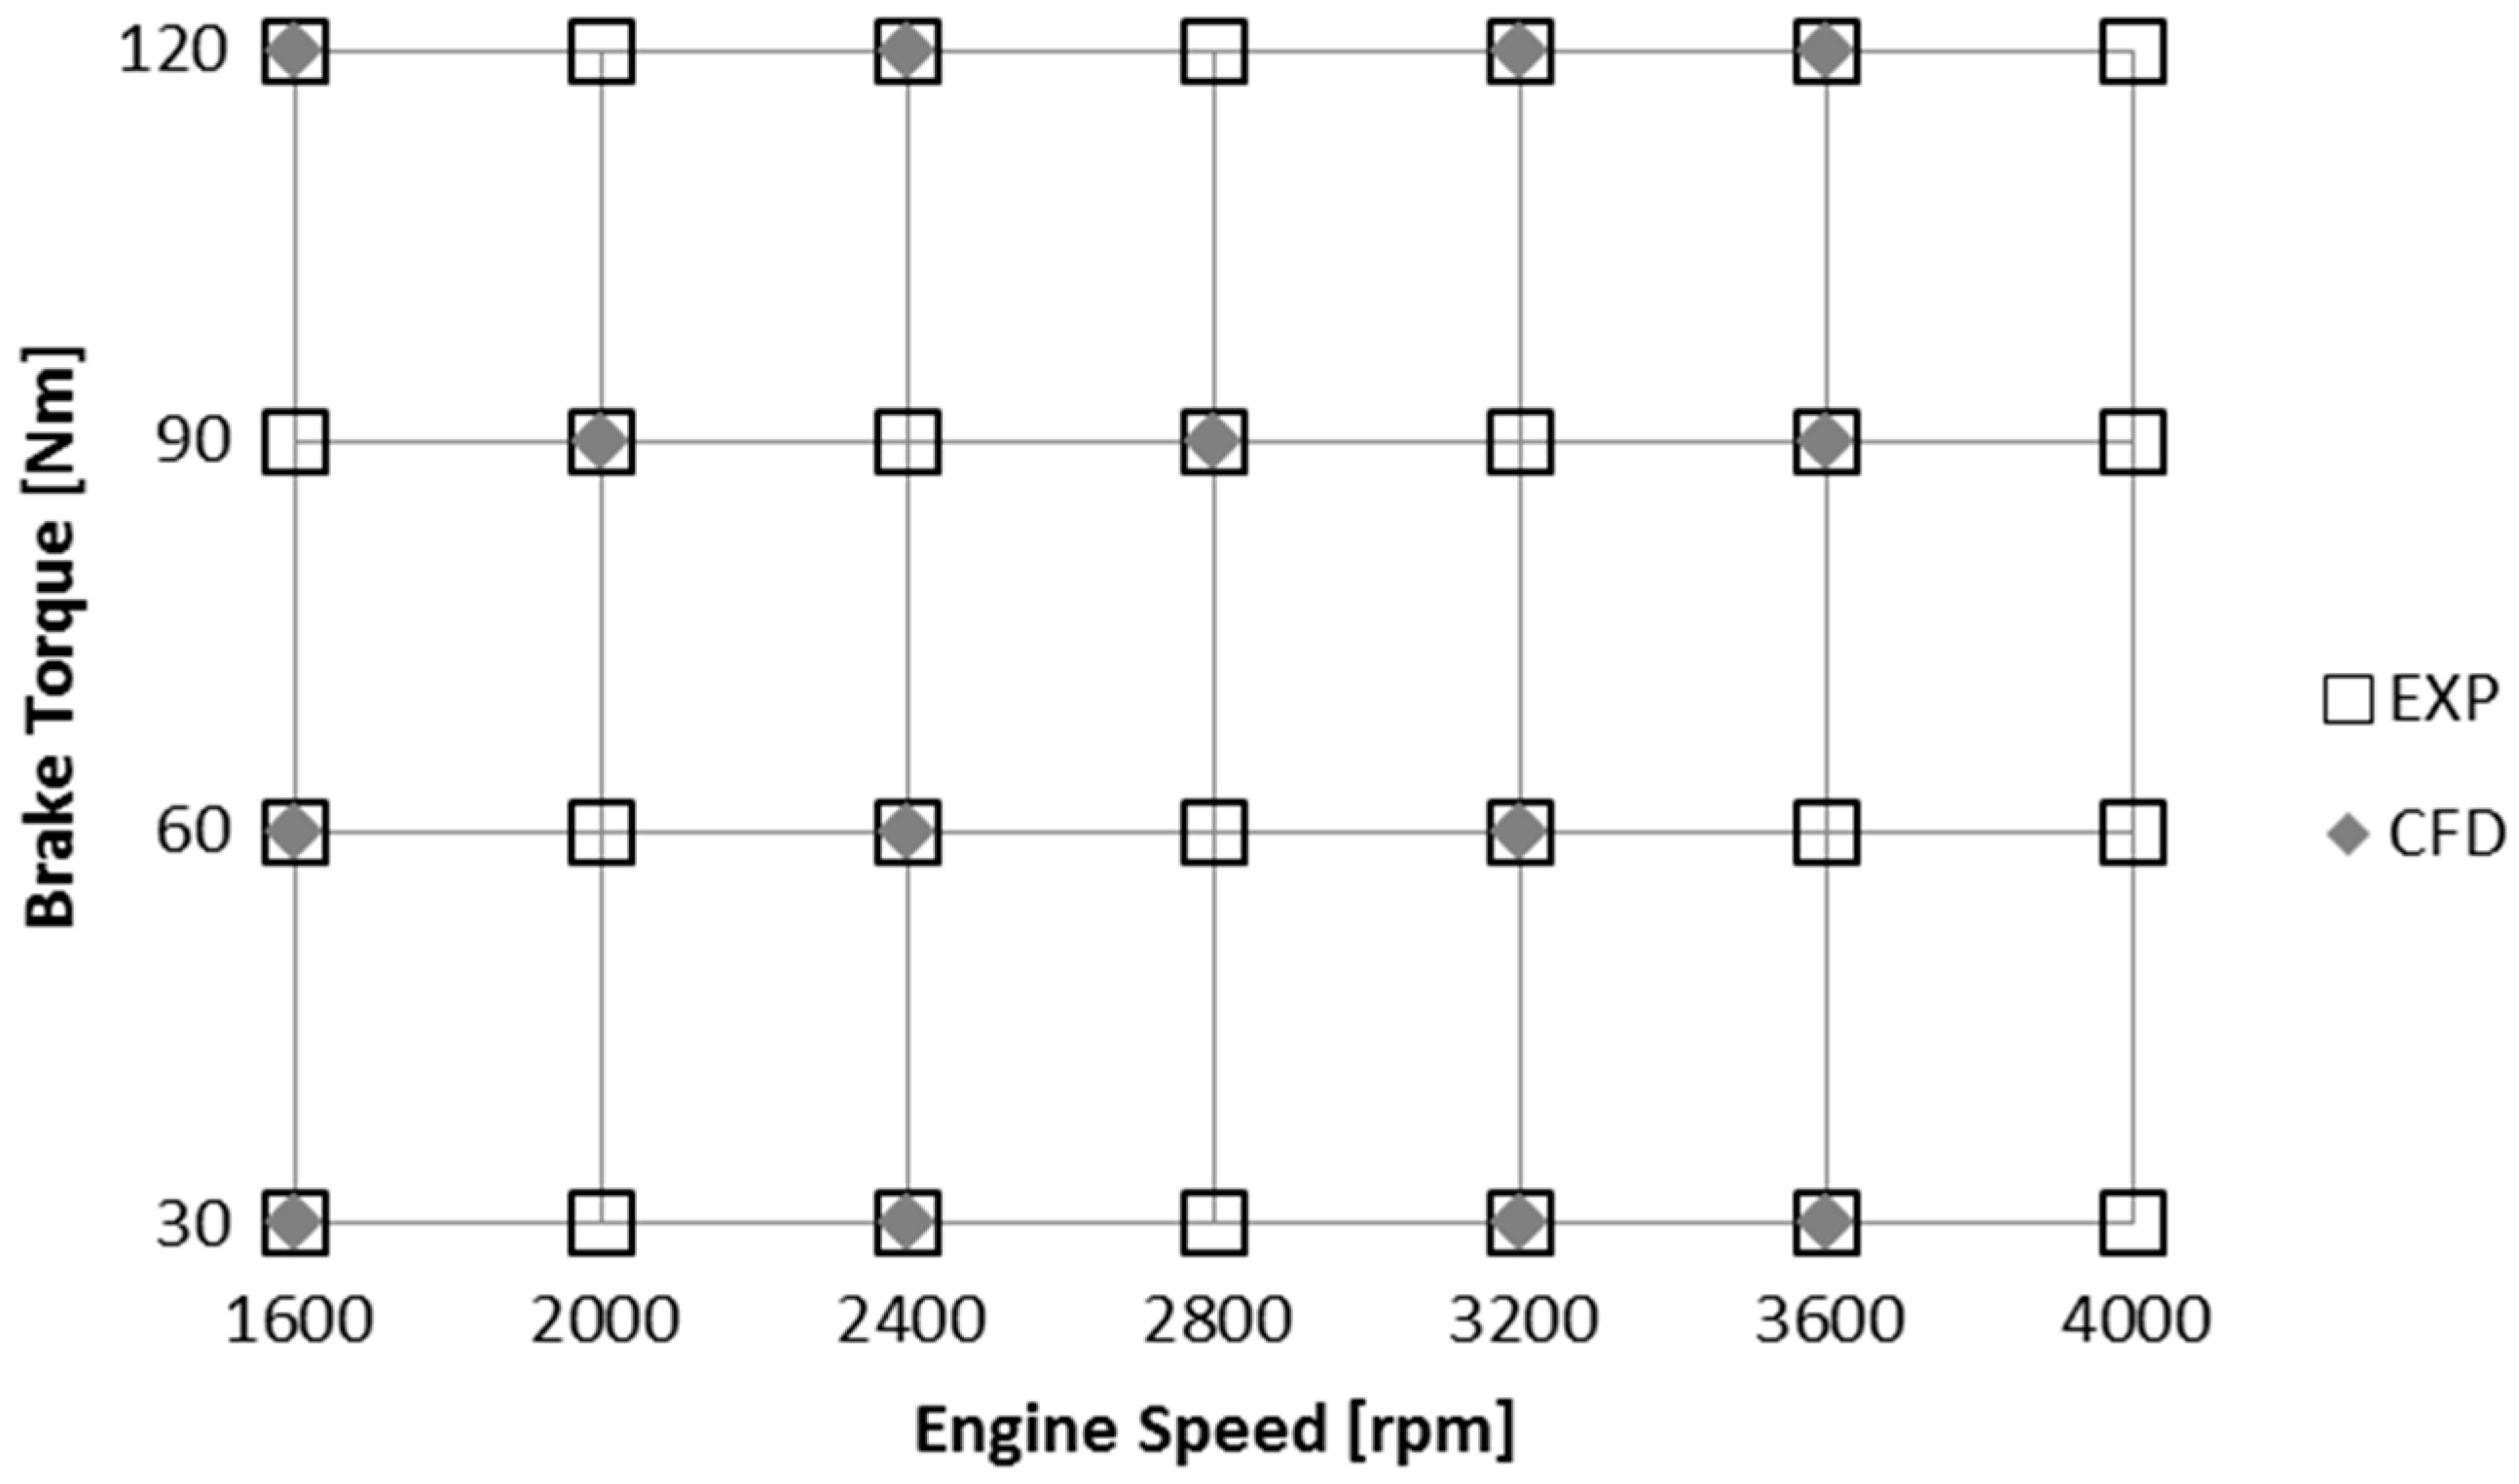
2. Experimental Setup and Methodology

Engine testing was conducted using a 4-cylinder, 1.6 L, turbo-charged, inter-cooled, wall-guided GDI engine of Euro 4 standards, connected to a W150 eddy-current dynamometer (Schenck, Darmstadt, Germany) and controlled via a CADET computerised control and data acquisition system (Sierra-CP Engineering, Malvern, UK). Technical specifications of the test engine are summarised in Table 1. In Figure 1, a schematic of the test rig is presented. Fuel consumption was recorded via a Sierra-CP Engineering FMS-400 gravimetric system. The fuel used for the entire testing campaign was 95 RON reference unleaded gasoline with stoichiometric AFR of 14.4. The fuel properties are reported in Table 2. Relatively low percentages of aromatic (<40%) and olefins are reported to reduce particle emissions [30]. Engine testing was carried out under steady-state, fully-warm operating conditions. A total of 28 conditions were investigated, crossing a large portion of the part-load running envelope, according to a classic grid of equally spaced speed-load points. Engine speed was varied in the range 1600–4000 rpm, in steps of 400 rpm; torque was varied in the range 30–120 Nm, in steps of 30 Nm. The engine control unit (ECU) controlled spark timing in an open-loop process, and fuel injection strategy to ensure theoretically-homogeneous charge and stoichiometric global AFR. The engine coolant and oil temperatures were maintained at 95 °C and 100 °C, respectively, to minimise the effects on PM formation [21,23]. In-cylinder pressure was acquired from cylinder N.1 via a piezo-electric, spark plug-mounted, Type 6115BFD36 sensor (Kistler, Winterhur, Switzerland). Intake pressure was acquired in the intake port area of the same cylinder, using a piezo-resistive Kistler Type 4005BA5F sensor. These sensors were connected to an Indiset Advance Type 631 data acquisition system (AVL, Graz, Austria) which worked in conjunction with PC-based AVL Indicom 1.6 software for data visualization and post-processing. Batches of 100 consecutive pressure cycles were recorded at each steady-state condition for averaging. Pressure data were used for combustion analysis and to support the CFD modelling, as boundary conditions and for model validation.
A simple ideal-gas equation model was used to evaluate the in-cylinder gas temperature at the location of peak pressure, based on instantaneous pressure measurements, available geometrical volume and trapped air mass calculated from injected fuel and AFR measurements. This work aims to identify the relationship existing between modelled combustion temperature and experimental PM records. Previous work [13] had suggested that the vast majority of PM would be formed during the rapid combustion phase up to the point of peak pressure, which is when the main flame front reaches the furthest chamber walls and, in a well-calibrated engine, most of the air-fuel charge has been burned. The ideal-gas temperature at peak pressure is taken as an indication of the burned gas temperature behind the flame front, where most particles are formed. In spite of its simplicity, the ideal-gas model returns temperature levels which, as reported in Section 3, show some interesting correlations with both particle number and its average size. Although the mechanism of particle inception may continue in the remaining sub-stoichiometric air-fuel pocket in the periphery of the chamber, this choice of combustion temperature would also ensure increased ease of implementation within modern engine controllers.
Engine-out PM measurements were carried out using a fast-response Differential Mobility Spectrometer DMS-500 system by Cambustion (Cambridge, UK), which enables real-time classification of PM in the 5–1000 nm size range on the basis of particles’ aerodynamic drag-to-charge ratio. The sampling point for the exhaust gas was fitted into the exhaust manifold, close to the port of the cylinder where pressure measurements were taken. The exhaust gas sample was passed through an electrical heater kept at constant temperature of 190 °C, and through the standard Cambustion heated sampling line, to prevent condensation. Both remote cyclone and sampling line temperatures were set to 120 °C. The 1st dilution stage was set to a ratio of 5:1 (5 parts of air, 1 part of exhaust flow); the 2nd dilution stage was set to a ratio of 12:1. These settings were used for all the operating conditions tested and led to a consistent signal to noise ratio. At each engine running condition, the gas was sampled for five consecutive minutes and averages taken. Data was acquired with a sample rate of 10 Hz. Due to the typical erratic behaviour of PM measurements, and measurement variability in the nucleation mode range, where high number-low diameter samples are acquired, every operating condition was repeated three times, in different days and under nominally identical conditions to reduce random errors and increase repeatability [12,14,42]. The data was collected and processed via the manufacturer software to obtain average values of number density, mass concentration and particle diameter.

Computational Fluid Dynamics Modelling

Cut-down CFD simulations of the test-engine were carried out to investigate the process of mixture preparation and the resulting air-fuel mixture homogeneity up to the time of spark ignition. The CFD work was performed using the commercial CFD software Star-CD version 4.22 (CD-Adapco Siemens PLM: Detroit, MI, USA), and was based on earlier work by the authors [39]. The time constraint of the initial feasibility phase of the research project meant only 14 operating conditions were simulated using CFD. These points were chosen to be consistent to the experimental investigation—the remaining test-conditions were used, as shown in Section 3, for model validation. In Figure 2, experimental and CFD test conditions are compared with one another in a speed vs. torque plot. The computational domain featured about 210,000 cell with piston at Top Dead Centre, and 360,000 with piston at Bottom Dead Centre; the typical cell size was 1 mm [43]. The simulations incorporated gas exchange process, fuel spray including spray-wall interaction and the processes of air-fuel mixing along intake and compression strokes. The “Gasoline1” fuel model, originally developed by BTU Cottbus/LOGE [44], was used for all simulations [45]. Treated within the Star-CD solver as a single-component fuel, the model is based on a toluene reference fuel (TRF) blend, and optimised to reflect Lower Heating Value, aromatic content and RON of commercial EURO 4 gasoline fuel. The thermo-physical properties of liquid and gas phases are assumed to be temperature dependent, and NIST tables are used to estimate these properties. The KH-RT model, applied with a coupled Lagrangian method, was used to model fuel spray [46,47]. This approach has been shown by Malaguti et al. [46] to provide good agreement with experimental observations, both in terms of spray penetration length and morphology of the plumes. A Rosin-Rammler type fuel droplet size distribution, featuring average diameter of 50 µm, was used as initial input [48,49]. Simplified time-resolved profiles of realistic form were used for injection mass flow rate, based on published data [50]. The Bai-Onera advanced wall-impingement model [45] was incorporated to predict liquid film formation; this was coupled with a 1D multi-layer conjugate heat transfer model, used to capture the effects of heat transfer due to the interaction between spray and cylinder metal surfaces. Turbulence was modelled via the RNG k-ε model. The simulations were initiated five CA deg before intake valve opening (IVO), to capture the effects of valve overlap on in-cylinder charge, and terminated just after the experimental ignition timing. Given that the combustion process is not simulated, CFD model calibration and validation was carried out in terms of spray and in-cylinder pressure development up to spark timing. Spray calibration was carried out in a simulated spray vessel environment and targeted spray-tip penetration, droplets average size (SMD) and shape/morphology using data from published work at an injection pressure of 120 bar [41,51,52]. Spray tuning was performed through changes of the KH-RT model constants, which controlled primary and secondary droplets break-up mechanisms. As detailed in earlier work by the authors [39], comparisons between CFD results and high-speed camera images showed good spray shape and penetration agreement for the initial portion of the injection process where same-injector data was available [52]. A steady droplets SMD level of 16 μm towards the end of injection was also in agreement with values reported in literatures [41,51].
Although the vast majority of research studies consistently address lack of mixture homogeneity as one of the main causes of PM formation in GDI engines, quantifying mixture preparation is challenging. In this work, the in-cylinder charge homogeneity has been quantified through a newly defined parameter, the volume-based uniformity index of equivalence ratio:
UI φ = 1 [ 1 V tot   | φ     φ aver | 2 φ aver   d V ]
In this equation, the integral is calculated discretely over all the computational cells of the combustion chamber domain, knowing their volume and equivalence ratio φ. According to its definition, the uniformity index varies between 0 and 1, where 1 indicates a perfectly homogeneous air-fuel mixture. As it stands, the Star-CD software does not include automatic evaluation of this passive scalar, hence the calculation was performed off line as a post-processing exercise using Excel. The results of UIφ calculated at spark timing have then been correlated to experimental levels of total particles number density.

3. Results and Discussion

The detailed engine-out PM characterisation presented in the following sections is deemed as typical of modern GDI engines where load control is realised via changes of mass of fuel injected as well as injection pressure. Contour plots of engine control and combustion parameters which are thought to be relevant for the analysis of the engine-out PM emission are shown in Figure 3a–f. The SOI (Figure 3a) varies between 35 and 75 CA deg after top dead centre (ATDC), mostly as a function of engine speed. As engine speed increases, the SOI takes place earlier in the intake stroke to ensure sufficient time for mixing. The injector mass flow rate (Figure 3b) is proportional to, and here used as an indication of, fuel injection pressure. It varies mostly as a function of engine load/BMEP and shows a three-fold increase across the part-load envelope, between 6 and 18 g/s. Correspondingly, the total mass of fuel injected varied between 9 and 26 mg/cycle-cylinder. The mixing time (Figure 3c), defined as the time interval between EOI and ST, varies predominantly as a function of engine speed, between 12 and 28 ms. The spark ignition timing (Figure 3d) varies between 5 and 45 CA deg BTDC and is a complex function of both engine speed and load. At each point, ST is optimised for best thermal efficiency according to a knock-limited maximum break torque (MBT) strategy. As engine speed increases at fixed engine load, effectively reducing the time available for combustion, ST is advanced to regain optimal combustion phasing. At fixed engine speed and increasing engine load, ST tends to be retarded to mitigate the potential effects of auto-ignition and knock. The ideal-gas in-cylinder temperature, calculated at the location of peak pressure (Figure 3e), is also a complex function of engine speed and load. Two main regions of interest can be identified: the mid-to-high speed/high load region, featuring the lowest combustion temperatures (2100–2200 K); the high speed/mid load region, featuring the highest temperatures (>2500 K). Finally, the measured exhaust gas temperature (Figure 3f) is seen to increase nearly equally with both increasing engine speed and load. Earlier spark timing results in lower exhaust temperature as combustion is phased earlier, causing greater effective expansion of the burned gas. An increase in engine speed at fixed load causes the combustion process to stretch over larger crank angle intervals and this in turn reduces the effective expansion stroke leading to greater exhaust temperatures.

3.1. Particulate Matter Characterisation

Figure 4 shows the experimental size-resolved particle number density distributions (or spectra) for all the experimental test conditions investigated in this work. For ease of visualisation, each row in Figure 4 presents fixed load data at increasing engine speed. The spectra show generally bi-modal form with much greater number density levels in nucleation mode. In some conditions, the spectra assume exceptional form, either showing a double peak in nucleation mode, or a single overall peak biased towards the accumulation mode. The analysis of the results points out that increases in engine speed and load lead to lower PNDen and lower peaks in both nucleation and accumulation mode. The reduction associated to greater engine load is more pronounced, suggesting that higher injection pressure exerts the greatest effect on charge homogeneity and, in turn, on the process of particle inception.
At the lowest engine speed investigated, 1600 rpm, an increase in load between 30 and 120 Nm, causes the highest drop in nucleation mode peak intensity, from 1.2 × 10⁸ to 2.3 × 10⁶ particles/cm3. It has been pointed out that, at low engine speed, a considerable amount of interaction takes place between one fuel spray jets and an open intake valve [53]. According to Lucchini et al. [41], stripping and re-entrainment of the resulting liquid film due to the incoming air-flow may cause charge inhomogeneity. The impact mechanism would reduce as engine load is increased due to higher injection pressure which leads to better fuel atomization. At the same engine speed of 1600 rpm, the location of the nucleation mode peak in terms of particle diameter (x-axis) is invariably below 20 nm. At 2000 and 2400 rpm, as engine load increases between 30 and 120 Nm, the nucleation mode peak intensity reduces of about one order of magnitude, while the peak location remains below 20 nm. At higher engine speed (2800–4000 rpm), the intensity of the nucleation mode peak reduces of about two orders of magnitude between approximately 4.0 × 10⁷ and 4.0 × 10⁵. Most likely, this is the result of the combined effect of better fuel atomisation and stronger in-cylinder motion. At these higher engine speeds, the corresponding diameter of the nucleation mode peaks is again located invariably below 20 nm up to an engine load of 90 Nm, increasing to 40 nm for the 120 Nm case. The lower combustion temperature calculated in this speed-load region may have led not only to reduced nucleation, but also to lower superficial oxidation and hence greater particle size.
At fixed engine load of 30 Nm, when engine speed is increased between 1600 and 4000 rpm, PNDen, generally shows a substantial reduction, mostly as a result of stronger in-cylinder motion and hence better mixing. The largest reduction in nucleation mode peak intensity, from 1.2 × 10⁸ to 4.0 × 10⁷ particles/cm3, takes place between 1600 and 2400 rpm; a mild shift in peak location is also seen, from 7.5 to 13 nm. Presumably, the increased motion enables greater particle coagulation leading to larger size and lower numbers. However, these trends are reversed in some cases, suggesting parallel competing effects from higher gas temperature and lower residence time [28]. At the same minimum engine load of 30 Nm, the size-resolved PNDen distributions reveal an unusual tri-modal form at 1600 and also at 2000 rpm. The third peak is situated between the highest, nucleation mode peak, and the accumulation mode peak, with a corresponding size of 13 nm at both engine speeds. Another tri-modal spectrum is revealed at 60 Nm and 1600 rpm, although the two peaks show different bias. The existence of double nucleation mode peak is difficult to explain; however, there is indication that particles of different sort (e.g., polyaromatic and polyhedral species) are capable of co-existing in the initial phase of particle inception [54]. High sooting conditions are reported to promote multiple peaks in the nucleation range due to particle inception of different species and/or particle decomposition [22,54,55].
With some minor exceptions, at both 90 and 120 Nm the number density spectra reduce consistently as engine speed increases. Interestingly, at the highest load and speeds investigated, the spectra assume a mono-modal form as pointed out in relevant literature for low sooting operating conditions [22,54,55]. The nucleation peak shifts towards bigger size, from 27 to 42 nm, while the accumulation mode flattens following the downward trend of the nucleation mode. The accumulation mode region is small at all conditions, with the exception of the highest load cases. Considering all operating conditions investigated in this work, the average value for the accumulation peak intensity is 1.0 × 10⁶ particles/cm3, with an average size of 65 nm. The results from the PNDen spectra are summarised in Figure 5, which shows total PNDen and GMD as functions of engine load, at each of the engine speeds investigated. As expected, the total PNDen in Figure 5a decreases as both engine load and speed increase; the effect of engine speed is less marked and reduces as the engine load increases. A jet-to-valve impact mechanism, as reported above, may have caused the “out-of-range” levels of total PNDen measured at 1600 rpm–30 Nm and hence the altered trend for the whole 1600 rpm distribution. For clarity of visualisation, the 1600 rpm–30 Nm point is excluded from Figure 5a. As load increases between 30 and 120 Nm, the variation of PNDen is consistent at all engine speeds with levels comprised between 1.75 × 10⁷ and 1.0 × 10⁶ particles/cm3.
The correlation between particles GMD and engine running conditions is presented in Figure 5b. Conversely to PNDen, GMD shows lower dependence on engine speed at low engine load and much greater dependence at higher load. As suggested above, the increased chamber motion associated to greater engine speed may lead to more frequent particle collision, greater rates of coagulation, and hence greater size and lower numbers. At the same time, for a given engine speed, the lower combustion temperatures seen at increasing engine load would lead to lower superficial oxidation, further increasing the average particle size. With one exception (3200 rpm–60 Nm), the engine-out GMD is measured between 10 and 22 nm, for engine load up to 90 Nm. As load increases to 120 Nm, the GMD ranges between 20 and 60 nm, with the greatest values associated to highest speed investigated.
Figure 6 shows the frequency distribution of number density and mass concentration upon five relevant particle diameter bins. In line with relevant literature, the number density frequency distribution shows that on average 72% of engine-out particulate matter is emitted in the 5–23 nm diameter range, while in excess of 80% falls into the nucleation mode range (<50 nm). The frequency was only 10% in accumulation mode (51–100 nm size bin), decreasing to less than 6% in the 101–300 nm size bin and becoming negligible (0.3%) in the 301–1000 nm size bin. The mass concentration distribution shows that, as expected, the engine-out PM mass concentrates mostly in larger size bins, with a frequency of about 80% in the course mode range (>101 nm). The average frequency was 15% in the accumulation mode bin and only 5% in the nucleation mode range. Although the results may be engine and fuel specific, parallel analysis of the two distributions clearly highlights that PM control strategies in GDI engines should focus mostly on minimisation of particle number count in the nucleation mode range. While the inherent difficulties and accuracy issues of measuring PM emissions are well known and acknowledged, the 23 nm threshold was purposely selected to expose potential limitations of the incoming EU6c/d regulations which do not consider any particles below this size. Giechaskiel et al. [12] suggest that while measurements in the sub-10 nm range may be strongly affected by artefacts (re-nucleation or pyrolysis) and should not be recommended for type-approval tests, it is essential that future regulations actually incorporate the 10–23 nm range.
The results presented in Figure 4, Figure 5 and Figure 6 are informative as they outline the characterisation of engine-out particulate matter in the context of a typical efficiency-oriented part-load control strategy. Nevertheless, these results are not fully explanatory. The development of improved emission control strategies require a substantial phenomenological analysis, which considers on one hand the effects of mixture homogeneity and, on the other, the connection between PM and combustion characteristics. In the next section, focus has been given in particular to combustion temperature and how this may affect the mechanisms leading to formation of particulate matter.

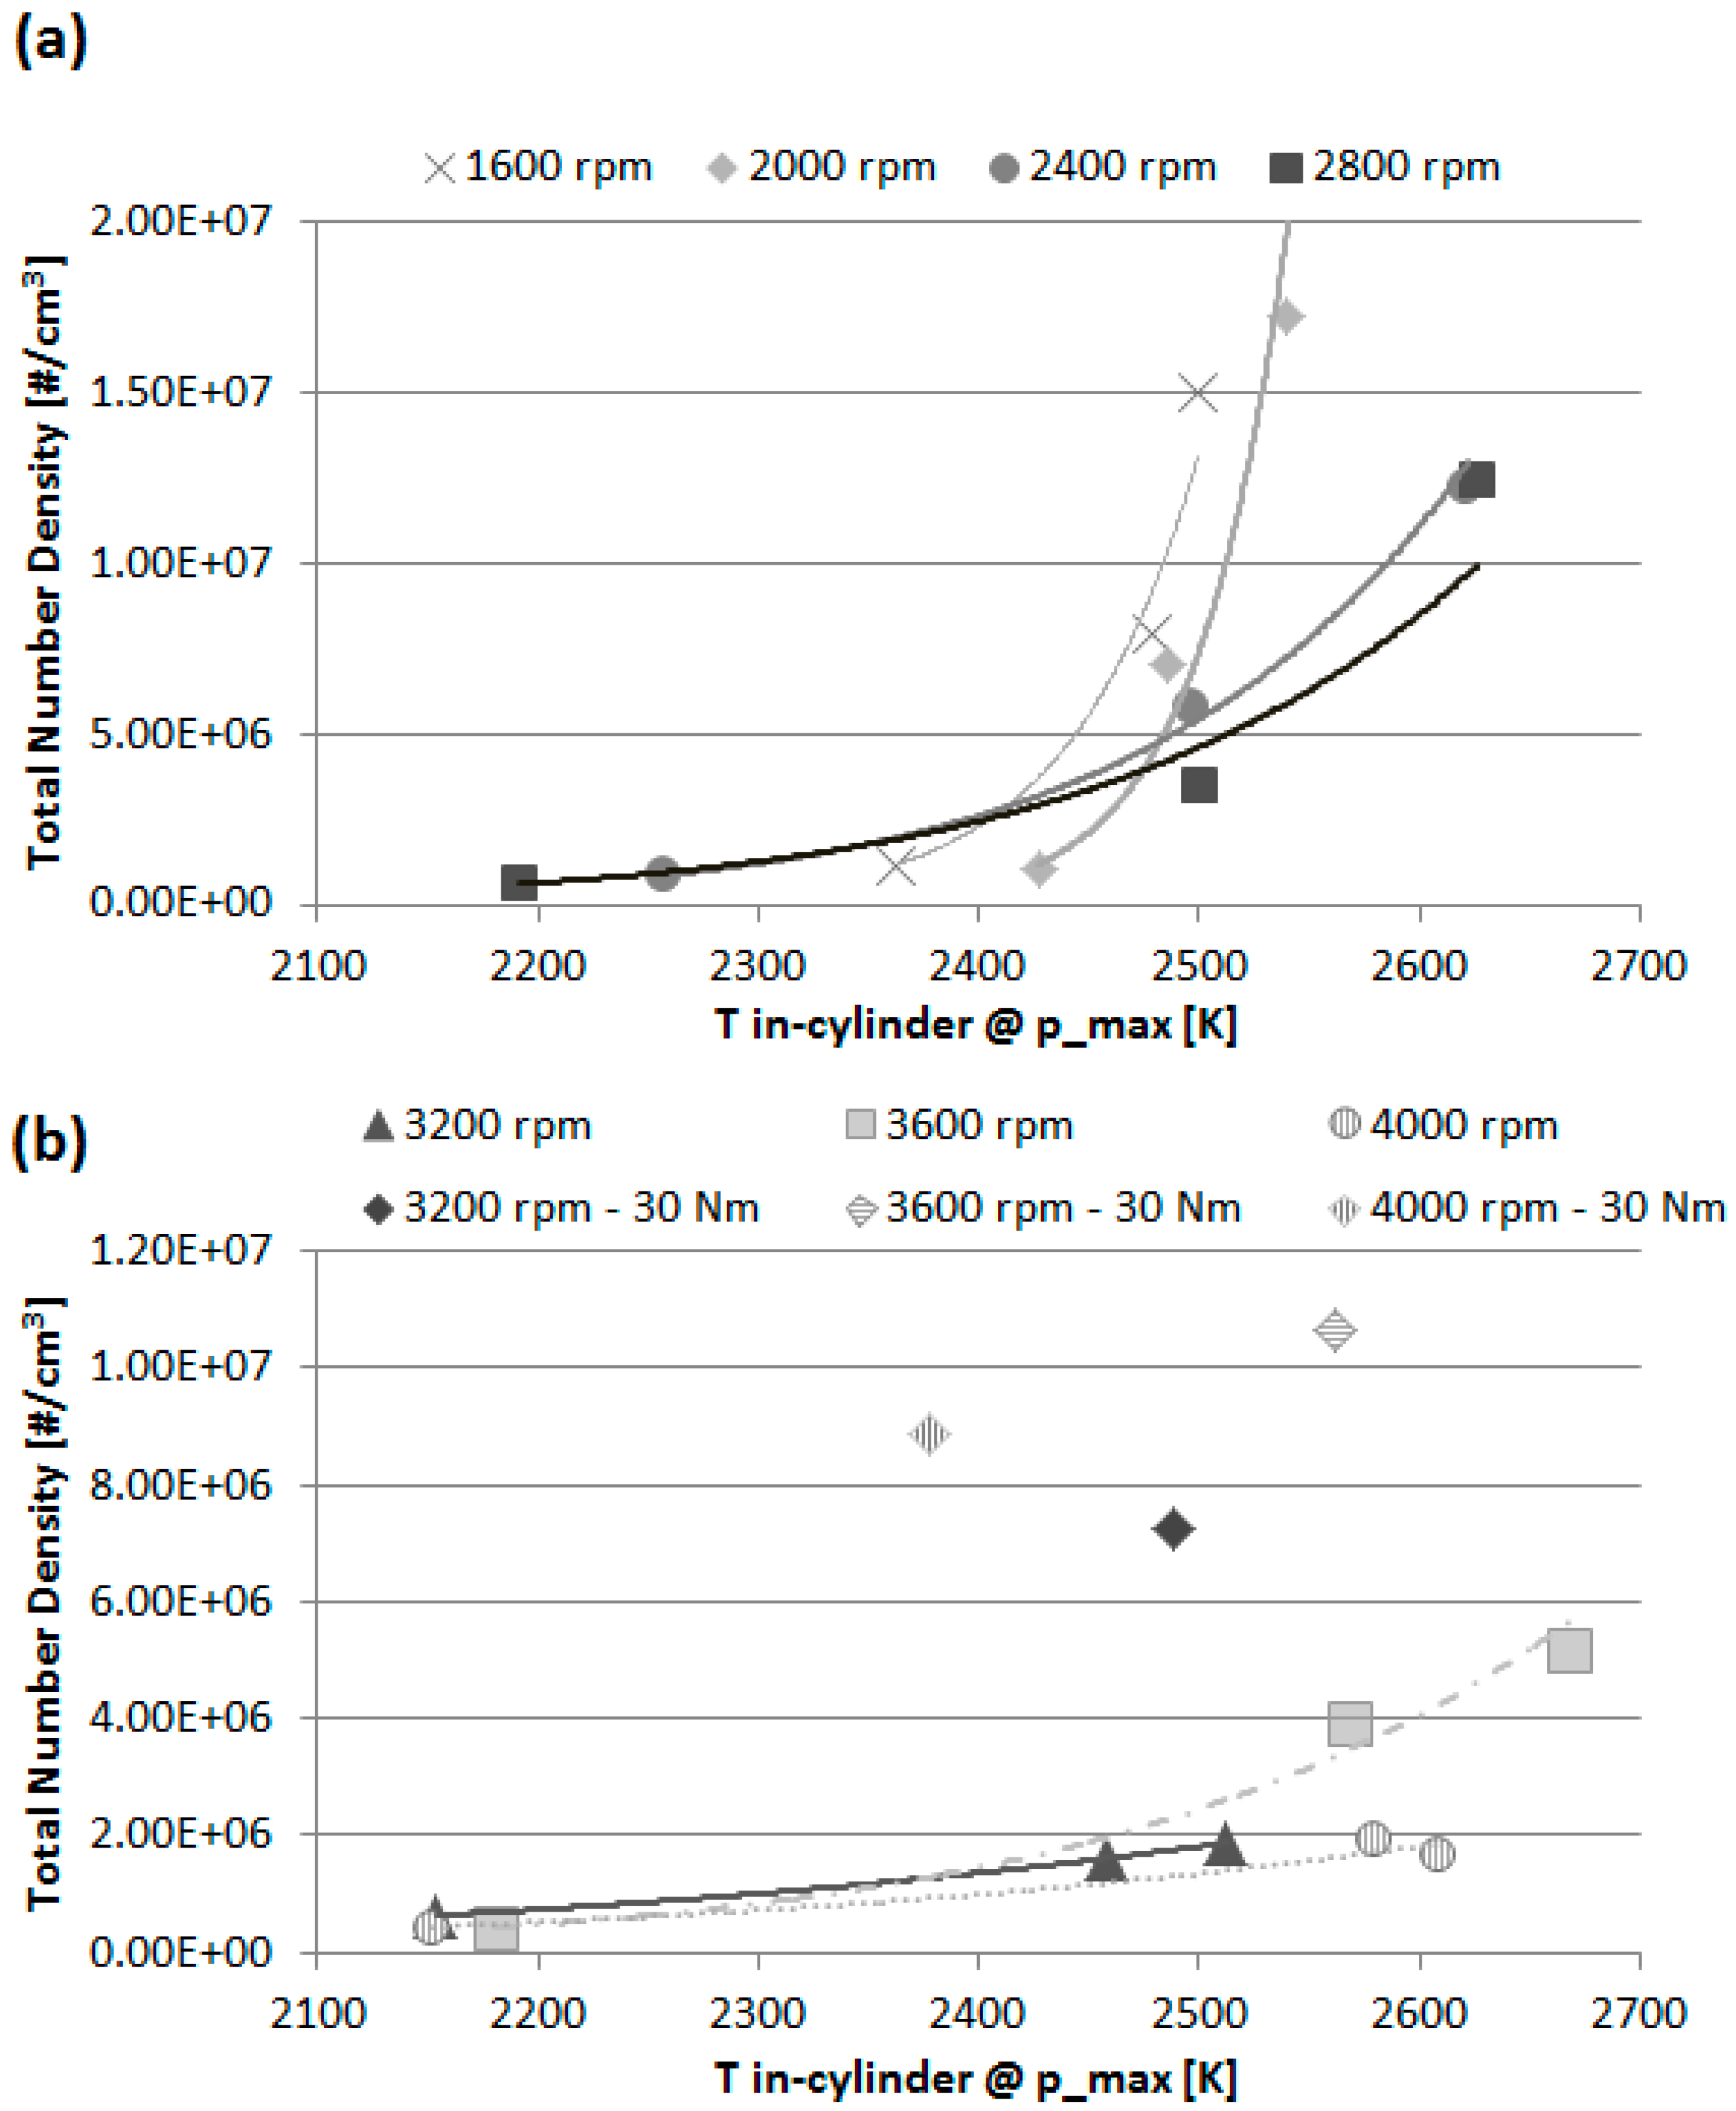
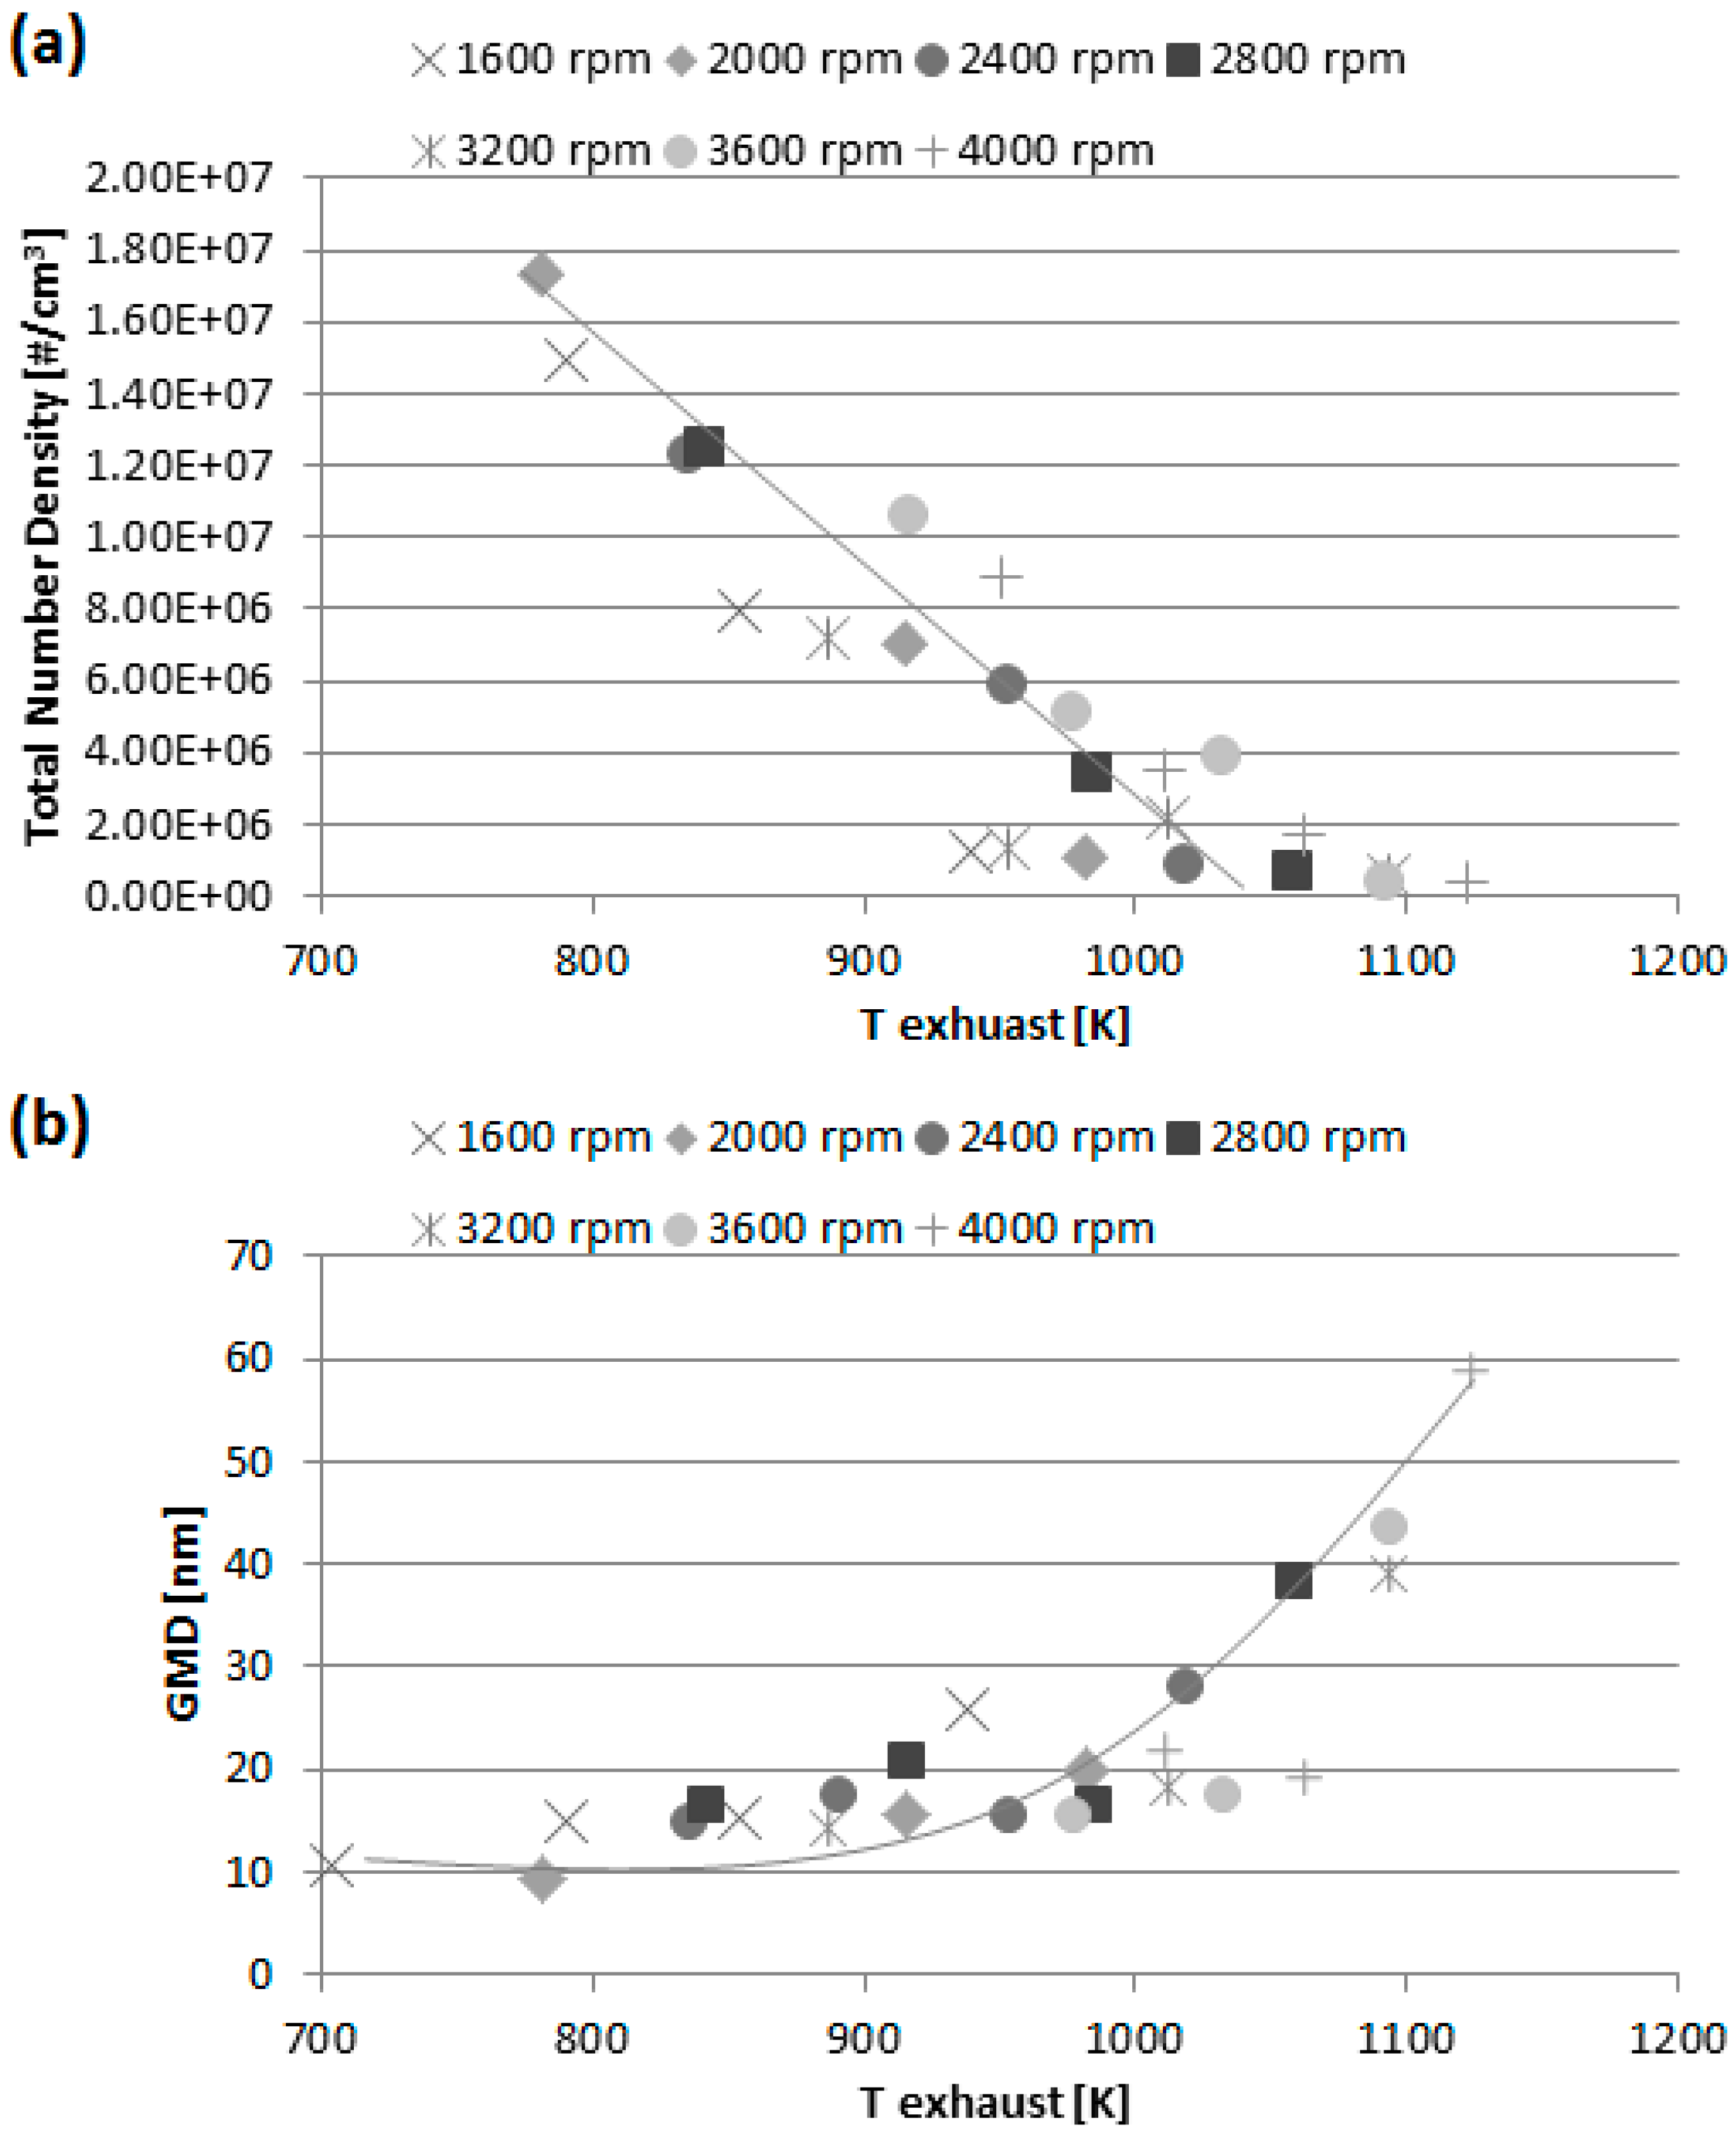
3.2. Apparent Correlation with Gas Temperature

Figure 7a,b shows total PNDen plotted as a function of modelled in-cylinder gas temperature at the location of maximum pressure. The data are conveniently grouped by fixed engine speed and power-law trend lines are used to highlight the relevant dependencies. For ease of visualisation, the data have been split into two different plots. Points such as those affected by jet-to-valve impact acted as confounding outliers. Here and in the following sections outliers have been filtered out.
In Figure 7a,b, the effects of gas temperature cannot effectively be separated from those exerted by variable injection pressure and mixing time on charge homogeneity. Nevertheless, the trend lines indicate the existence of a strong apparent relationship between combustion temperature and PNDen, supporting the suggestion that higher gas temperature enhances the rate of PAH formation and, in turn, the rate of particle nucleation [11,35]. At the lower engine speeds, the effect of gas temperature is more visible, with a sharp increase in PNDen, associated to gas temperature in excess of 2400 K. The average gradient of the trend lines decreases as engine speed increases, revealing how greater engine speed carries a beneficial impact on mixture preparation. Greater combustion temperature also supports the mechanism of PM oxidation in two separate ways: oxidation via available molecular O2 which, in a gasoline engine running in stoichiometric conditions, is almost fully consumed by combustion and otherwise confined to lower-temperature near-wall regions [39]; oxidation via OH radicals which tends to take place behind the flame front at very high temperature [25]. The results would indicate that, at the lower engine speeds, the effect of combustion temperature on nucleation is likely to be dominant when compared to oxidation, at least as far as full particle destruction/burn-out is concerned. For engine speed in excess of 3000 rpm (Figure 7b), the relation between modelled gas temperature and total PNDen is not as obvious as before. Increasing engine speed also causes reduced high-temperature exposure or residence time, which mitigates the rate of particle nucleation through a second mechanism [26]. Importantly, temperature-dependent power-law curves can still be identified as soon as the data at 30 Nm are removed from the analysis. In spite of the strong in-cylinder bulk motion, the low injection pressure used at low engine load does not ensure an effective mixing process; the results suggest that lack of mixture homogeneity in these cases leads to large rates of particle nucleation, even if the gas temperature is not as high as otherwise required.
Figure 8 shows the apparent correlation between GMD and modelled gas temperature. The data are again grouped by fixed engine speed but, as speed shows only a minor influence, a single representative trend line has been used for clarity. GMD varies between 10 and 60 nm and shows an inverse relationship with gas temperature. Increasing temperature leads to greater nucleation rate and, at the same time, greater superficial oxidation; both mechanisms would contribute to yielding small particles on average. GMDs in excess of 25 nm are consistently associated to lower combustion temperature, but also to engine speed above 2400 rpm; higher engine speed may also support coagulation through increased chamber motion and limit oxidation due to reduced residence time. Interestingly, Figure 8 identifies 2400 K as a threshold temperature above which particles form in much greater number and with average size of approximately 15 nm. For combustion temperatures in excess of 2550 K, some GMD points tend to cluster in isolation producing a plateau, or slight increase, in the trend line. These points are mostly associated to lower load conditions, suggesting greater particle number density may also hold a positive influence on particles coagulation. The correlation between GMD and combustion temperature reinforces the importance of developing improved means of controlling the combustion process and its peak temperature. This study shows that reducing the gas temperature at peak pressure between 2650 K and 2150 K would lead, dependent of engine running conditions, to a 3 to 5-fold increase in average size as well as to a reduction in total number density of up to one order of magnitude. The emission of larger particles is highly beneficial not only in terms of the inherent reduction of nano-size number count, but also of improved number-based exhaust gas filtration efficiency.
For the part-load operating envelope investigated in this work, the ECU strategy produces, with some exceptions, an inverse correlation between in-cylinder temperature at maximum pressure and exhaust gas temperature. Spark timing advances lead to earlier and hotter combustion; in turn, this causes longer effective expansion and lower exhaust temperature. This inverse relationship is reflected in the trends of total PNDen and GMD versus exhaust gas temperature, shown respectively in Figure 9a,b. The first plot depicts an overall linear dependence; the standard interpretation of this result, typically advanced in diesel engine studies, would point towards late or post-combustion oxidation (or full burn-out) in the presence of leftover oxygen, supported by greater exhaust temperature and leading to lower particle number [15,56]. Parallel analysis of Figure 9b shows that, for the GDI engine investigated in the present work, such interpretation would be erroneous, as GMD in fact increases along with the exhaust temperature following a clear monotonic distribution. Although some degree of late or post-combustion coagulation is possible, effectively leading to reduced numbers and greater size, the results suggest that the relationship between PM characteristics and exhaust gas temperature is essentially a reflection of the influence of combustion temperature.
Particle formation is a complicated multi-step mechanism, severely affected by in-cylinder physico-chemical conditions at different stages of the engine cycle. The results of this investigation suggest the combustion process and its peak temperature are important drivers for the process of particles inception and also for their course of life, whenever poor mixture preparation establishes appropriate conditions for PM to form.

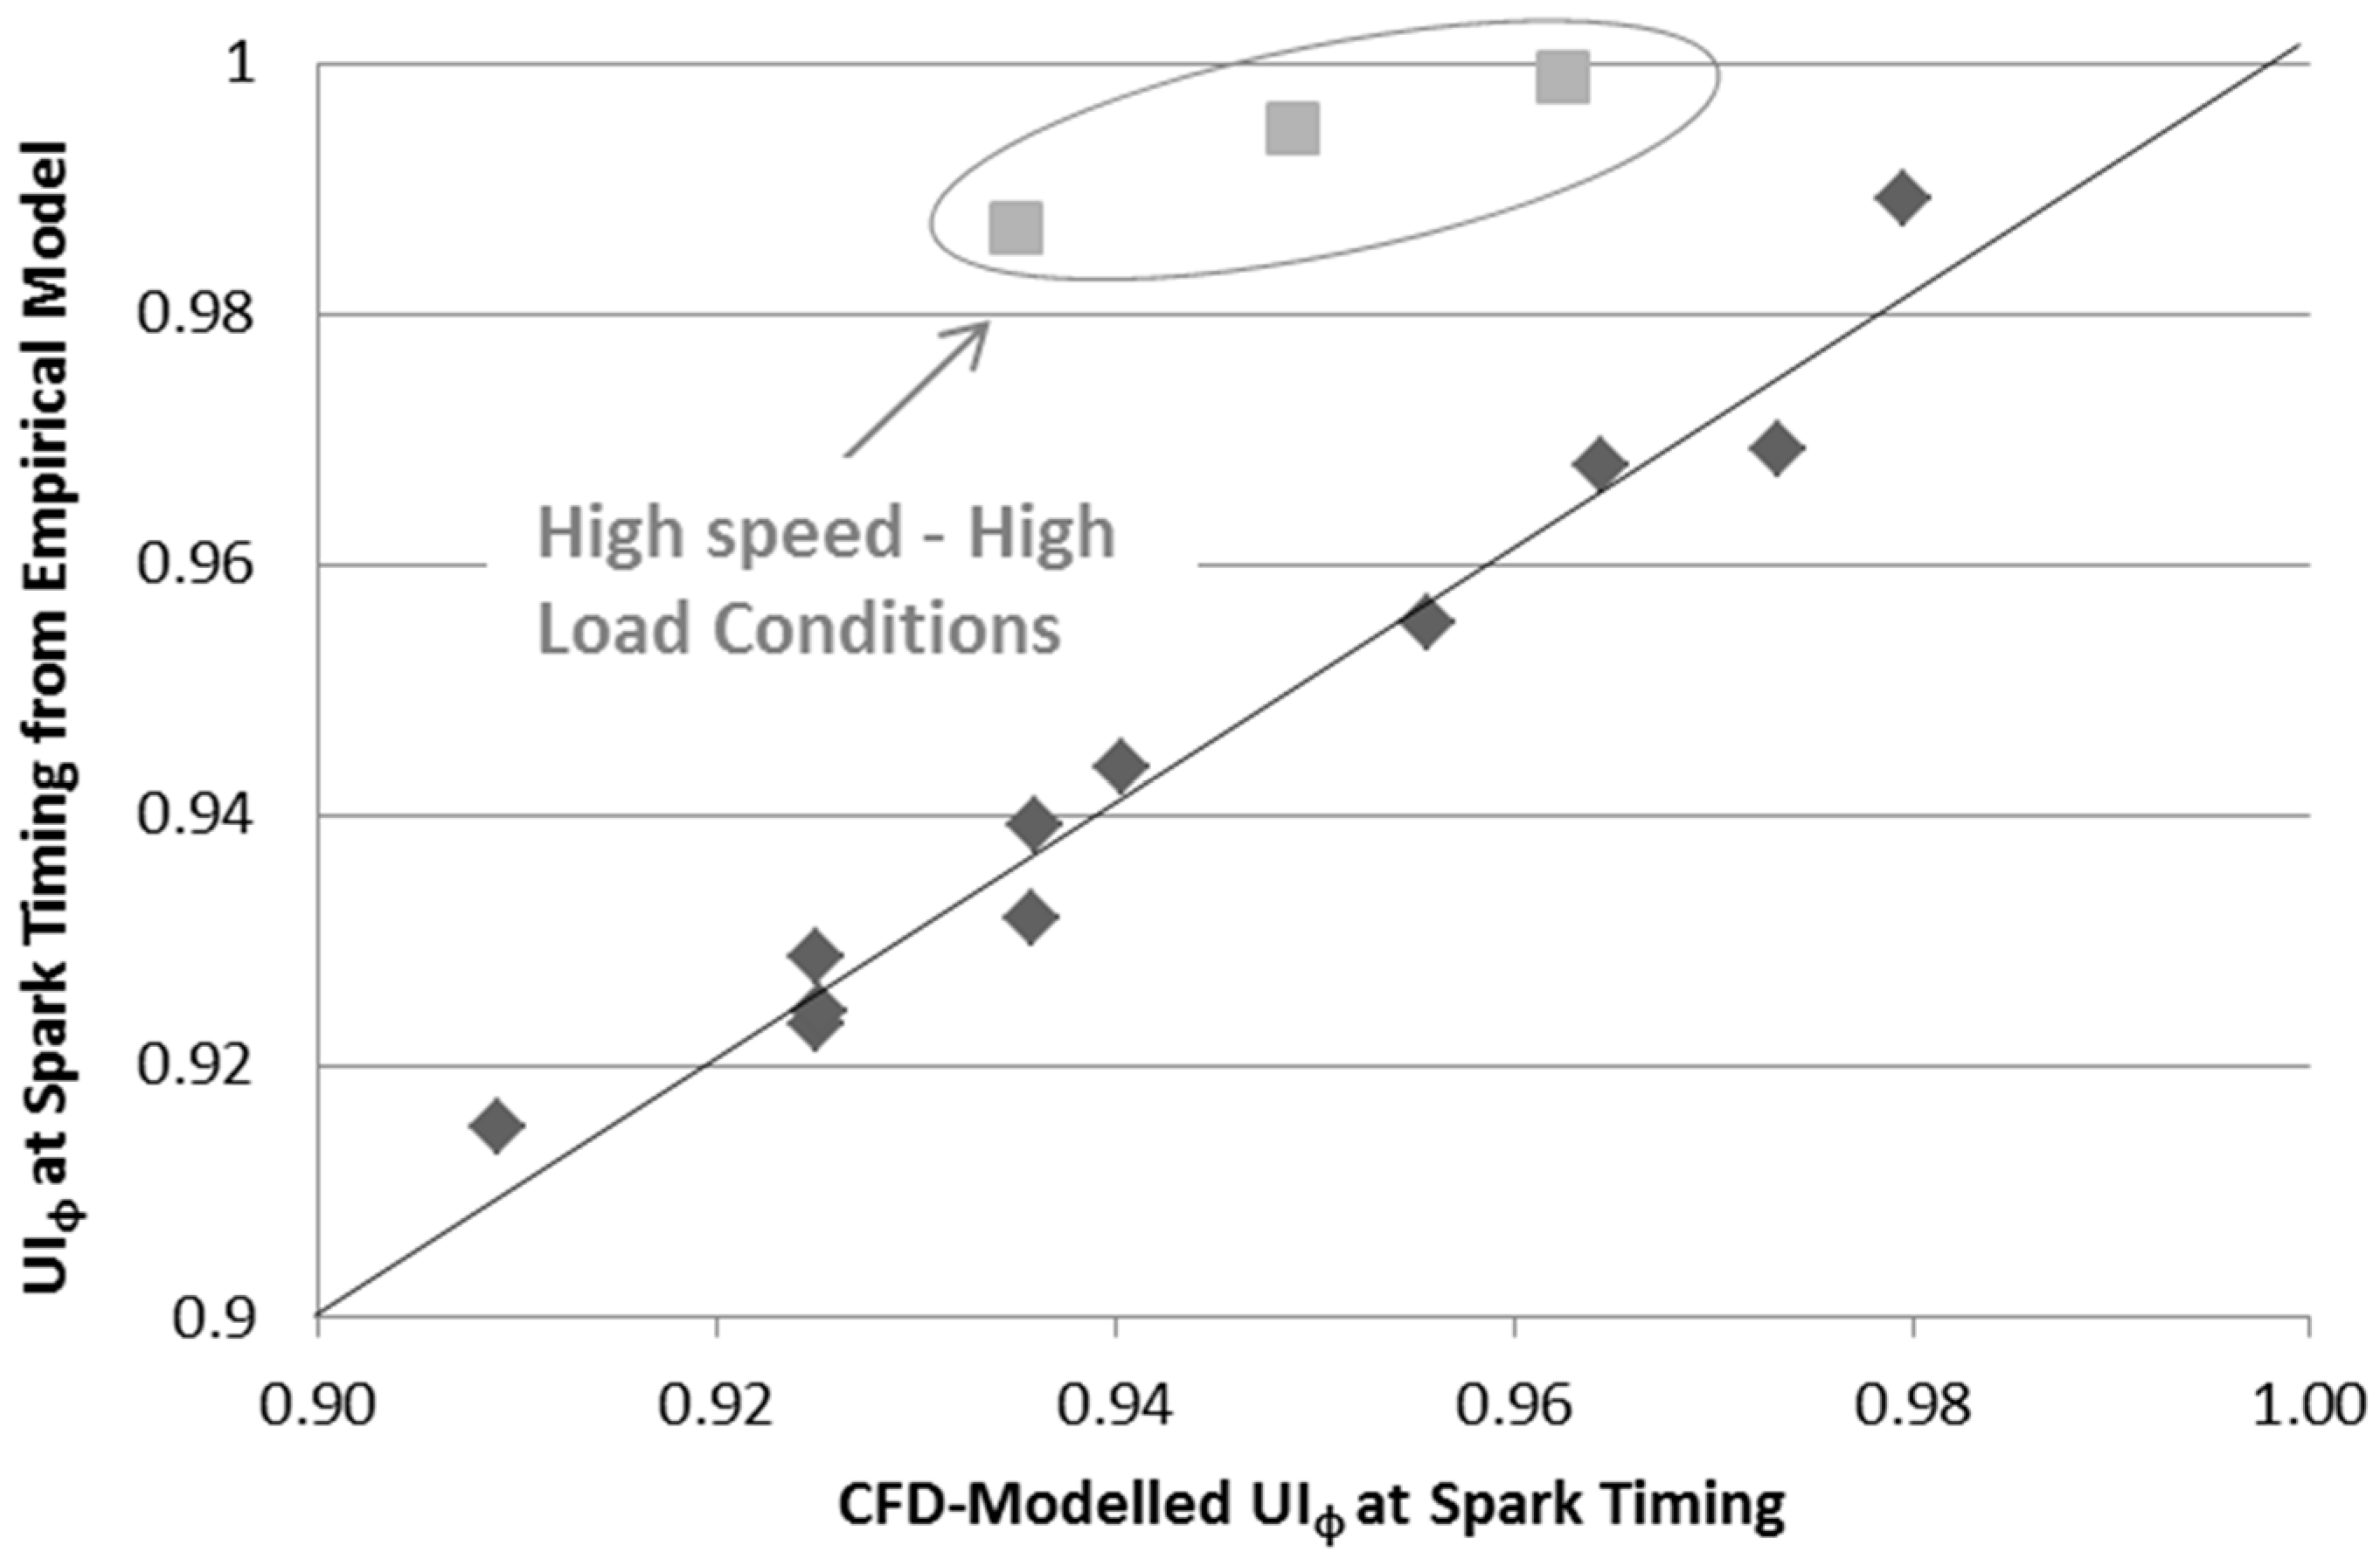
3.3. Correlation between Charge Homogeneity and Particle Number Density

Based on the conclusions drawn so far, the present section focuses on mixture preparation and the direct correlation existing between charge homogeneity and engine-out particle number density. As reported in the Methodology section, charge homogeneity is quantified via a newly defined parameter, the volume-based uniformity index of equivalence ratio UIφ, obtained through a limited number of cut-down CFD simulations of the gas exchange, injection and mixing processes. Notwithstanding the limitations of the numerical approach, the CFD simulations have shown that, at part-load fully-warm engine conditions, any fuel liquid film forming at the walls during injection, fully vaporises by the ignition timing. However, by definition UIφ does consider local gas mixture mal-uniformities arising from liquid film changing phase in the near-wall region without mixing properly. The limitations that the “GASOLINE1” fuel model may have in regards to the complex vaporization behavior of different components will be the object of future research work.
All running conditions investigated in the present work are cases of theoretically-homogeneous combustion, featuring fuel injection mid-way through the intake stroke—see Figure 3. UIφ is calculated at regular intervals, from EOI to spark timing. As expected, the mixture homogeneity improves steadily along the engine cycle, with UIφ increasing monotonically from an initial value of approximately 0.5, and approaching unity towards the end of compression [38]. For the range of operating points investigated using CFD, the UIφ calculated at spark timing varies between 0.91 and 0.98.
In Figure 10, CFD images of the mixture preparation process at various CA locations are reported for three representative operating conditions. The first column of Figure 10 refers to 1600 rpm–30 Nm, which features the worst spark timing homogeneity, with uniformity index calculated at 0.91. The mid column refers to the same low engine speed, but in connection with the highest load investigated (120 Nm). This point features good uniformity of 0.97. The third column refers to high speed/high load conditions (3200 rpm–120 Nm), which feature a uniformity index of 0.95. The first row of Figure 10 reports liquid fuel droplets distributions at 40 CA deg after EOI for the three operating conditions. No labelling or legend is used in this case as the images are intended as qualitative rendering of the fuel dynamics within the chamber after the injection has ended. The second row shows isomeric views of gas-phase equivalence ratio distribution at 20 CA deg after intake stroke BDC. The third row shows isomeric views of equivalence ratio at spark timing. Rows two and three feature different equivalence ratio ranges for clarity of visualization.
In all cases, a vertical tumbling macro-scale motion establishes within the available chamber volume, with counter-clockwise rotation. The fuel, which is injected by the high-pressure injector located at the top-right corner of the chamber, impacts against the far liner-wall and piston crown, then mostly splashes and/or rebounds. The tumbling flow structure transports the fuel along the periphery of the chamber while vaporisation and mixing takes place. For the low speed-low load case, low injection pressure causes poor atomisation and hence larger and heavier liquid droplets which remain grouped on top of the piston crown with limited initial movement. At the beginning of the compression stroke (20 CA deg ATDC), due to the main tumbling flow, a large proportion of evaporated fuel concentrates along the right side of the liner. By spark timing, when the tumble rotation has lost intensity due to the squishing action of the upward moving piston, two high-concentration fuel clouds can be identified which, after rotating another 90 deg approximately, reside diametrically opposed either side of the spark plug. The resulting poor charge homogeneity, combined with the jet-to-valve impact mentioned above, are likely sources of high PM formation. The low speed-high load case (1600 rpm–120 Nm) benefit from much greater injection pressure, which results in smaller/lighter liquid droplets, more easily transported and quicker to evaporate. The droplet distribution is heavily influenced by the strong jet-to-wall impact and consequent multi-directional rebound; soon after, the main counter-clockwise tumbling flow prevails, transporting the fuel peripherally as seen before. Compared to the lower load case, due to faster evaporation and mixing, both start-of-compression and spark timing equivalence ratio distributions show less mixture stratification and better overall homogeneity in spite of the three-fold increase in injected fuel mass. In the last case reported in Figure 10 (3200 rpm–120 Nm), a wider droplet distribution is seen at 40 CA deg after EOI. Nevertheless, the greater engine speed and associated centrifugal action, compromise to some extent the subsequent fuel dynamics, with a resulting high equivalence ratio gas layer concentrated along the right side of the liner at the beginning of the compression stroke. By the end of compression, a large sub-stoichiometric region forms on the left side of the squish volume, accompanied by evident stratification from the rich periphery to the lean core. The permanence of rich mixture pockets in the near-wall lower-temperature periphery, seen in all three cases, has been associated to PM emissions due mostly to lower late and post-combustion oxidation [39]. In the remainder of this section, the levels of charge uniformity from the CFD work are directly correlated to those of total number density measured experimentally.
Figure 11a shows the strong correlation existing between total PNDen and CFD modelled UIφ at park timing. To the Authors’ best knowledge, no other study has identified a quantitative correlation of this nature and strength. In Figure 11a, interestingly, two separate power-law distributions can be distinguished: the top one, which includes most part-load data, spans across a wide range of UIφ variation, showing that changes of mixture uniformity of the order of 6% return large changes of PNDen between 1.5 × 10⁷ and 1.0 × 10⁶ particles/cm3. The second lower distribution returns much lower levels of PNDen for given UIφ, and is associated to engine speed and load equal or greater than 3200 rpm and 90 Nm, respectively. While mixture uniformity settles to mid-range levels, these points feature relatively low combustion temperature (between 2150 and 2320 K) which, as seen in the previous section, would be a sufficient requisite for low soot yielding. Although the limited number of engine conditions investigated using CFD does not concede drawing firm conclusions, the existence of two lines and, by extension, the existence of a bunch of lines across the engine running space, reinforces the suggestion that mixture preparation and combustion temperature are both significant factors in the process of PM formation. In order to assess the effects of these two factors in isolation, the assumption is taken that total PNDen can be expressed as product of two independent factors– PN Den ~   f ( U I φ ) · f ( T ) . In Figure 11b, the total PNDen normalised by the UIφ power-law expression derived from Figure 11a, is plotted against gas temperature at peak pressure. Figure 11b unveils a remarkable linear correlation between particle number density and combustion temperature. The data appear to confirm that a drop in temperature of 500 degrees between 2650 and 2150 K would induce a reduction of PNDen of approximately one order of magnitude.
The knowledge gained from the CFD runs is further exploited to generate an initial empirical model of uniformity index as a function of basic engine control parameters. This is then used within an additional simplified functional model to generate predictions of engine-out PNDen. The uniformity index of equivalence ratio at the time of ignition is modelled as a function of five available parameters: (1) injector mass flow rate ( m ˙ inj ), (2) engine speed (N), (3) mixing time (Δtmix), (4) intake runner temperature (Tint) and (5) start of injection (SOI). The functional UIϕ correlation is determined through simple linear regression of the levels generated using CFD, with best fitting corresponding to a polynomial-type model which considers only linear terms and one interaction, as follows:
U I φ = A + B   m ˙ inj + C   T int D   SOI + E   Δ t mix   N
In this equation, where the actual parameter intervals are transformed into normalised [−1, 1] intervals, the regression coefficients assume the following values A = 0.9553, B = 0.0361, C = 0.00694, D = 0.01134 and E = 0.000582. The regression features RMSE of 0.00855 and R2 of 0.92. The model, which must be constrained to a maximum value of 1 (perfectly-homogeneous mixture at start of combustion), is valid within the parameter intervals depicted in Figure 3, plus a naturally-occurring interval of engine intake air temperature between 295 and 310 K. A direct comparison between CFD modelled and empirical levels of UIφ is given in Figure 12. The three exceptional high speed-high load points, originally seen in Figure 11a, exhibit an evident uniformity over-prediction, suggesting that the regression model is unable to capture the details of the air-fuel mixing process shown by the CFD analysis. A more sophisticated model would require a more comprehensive account of in-cylinder motion, in combination with injection characteristics (including injected fuel mass), and a more realistic indication of gas temperature at SOI. With the limited amount of data currently available, the inclusion of injected mass degrades the regression quality, compromising the model applicability.
The correlation between measured total PNDen and empirical UIφ model is shown in Figure 13. In spite of the deviation from the CFD results, the empirical UIφ model consistently associates high levels of charge homogeneity to instances where the measured level of PNDen is low; as a result, the three exceptional high speed-high load points are shifted right towards greater UIφ and become part of the same distribution. Importantly, the inclusion of these points carries negligible impact on the resulting trend line power-law equation.
The total PNDen can be predicted using the empirical model for UIφ in combination with a power-law equation of the form:
PN Den = A   ( 1 U I φ ) α
Here, the constant A is given the value 603,305; the exponent α the value 41. A comparison of measured and modelled levels of total PNDen, for the running conditions used in this section, and for the remaining points investigated in this work, is presented in Figure 14. In spite of the limitations of the statistical analysis, which is due to a reduced CFD-generated sample, the results indicate the two-equation functional model gives a meaningful account of the prevailing phenomena and can be used as a benchmark for further development. If the typical lack of repeatability and the inherent erratic behaviour of PM emissions in GDI engines [12,42] are taken into account, one might conclude that the model returns acceptable qualitative predictions of particle number density. Due to the expected propagation of model errors, considering a further combustion temperature factor within an expression of the form PN Den ~   f ( U I φ ) · f ( T ) , does not improve at this stage the predictive power of the model.

4. Conclusions

Engine-out particulate matter emissions have been investigated in a wall-guided, turbo-charged, GDI engine operated at part-load under fully-warm, steady-state, theoretically-homogeneous and stoichiometric charge conditions. Engine speed was varied in the range 1600 to 4000 rpm; engine load between 30 and 120 Nm. A reference 95 RON gasoline fuel with average aromatics contents of 32% by volume, was used consistently for the whole investigation. A differential mobility spectrometer DMS-500 by Cambustion was used to analyse exhaust gas samples drawn from the exhaust port area of one cylinder. A detailed characterisation of PM emissions has been carried out through analysis of number density spectra and overall quantities including total particle number density (PNDen) and GMD. PNDen, which is volumetric concentration of particles in the exhaust gas stream, has been used throughout the investigation to aid unveiling the effects of air-fuel mixture preparation and combustion on the particle formation process. Indeed, significant correlations were identified between PNDen, and combustion and preparation indicators. However, it is important to note that PNDen is not representative of the total number of particles generated/released by the engine. Total numbers would depend not only on particle number density, but also on exhaust gas flow rate which is a strong function of engine speed and load. The following conclusions may be drawn from the investigation:
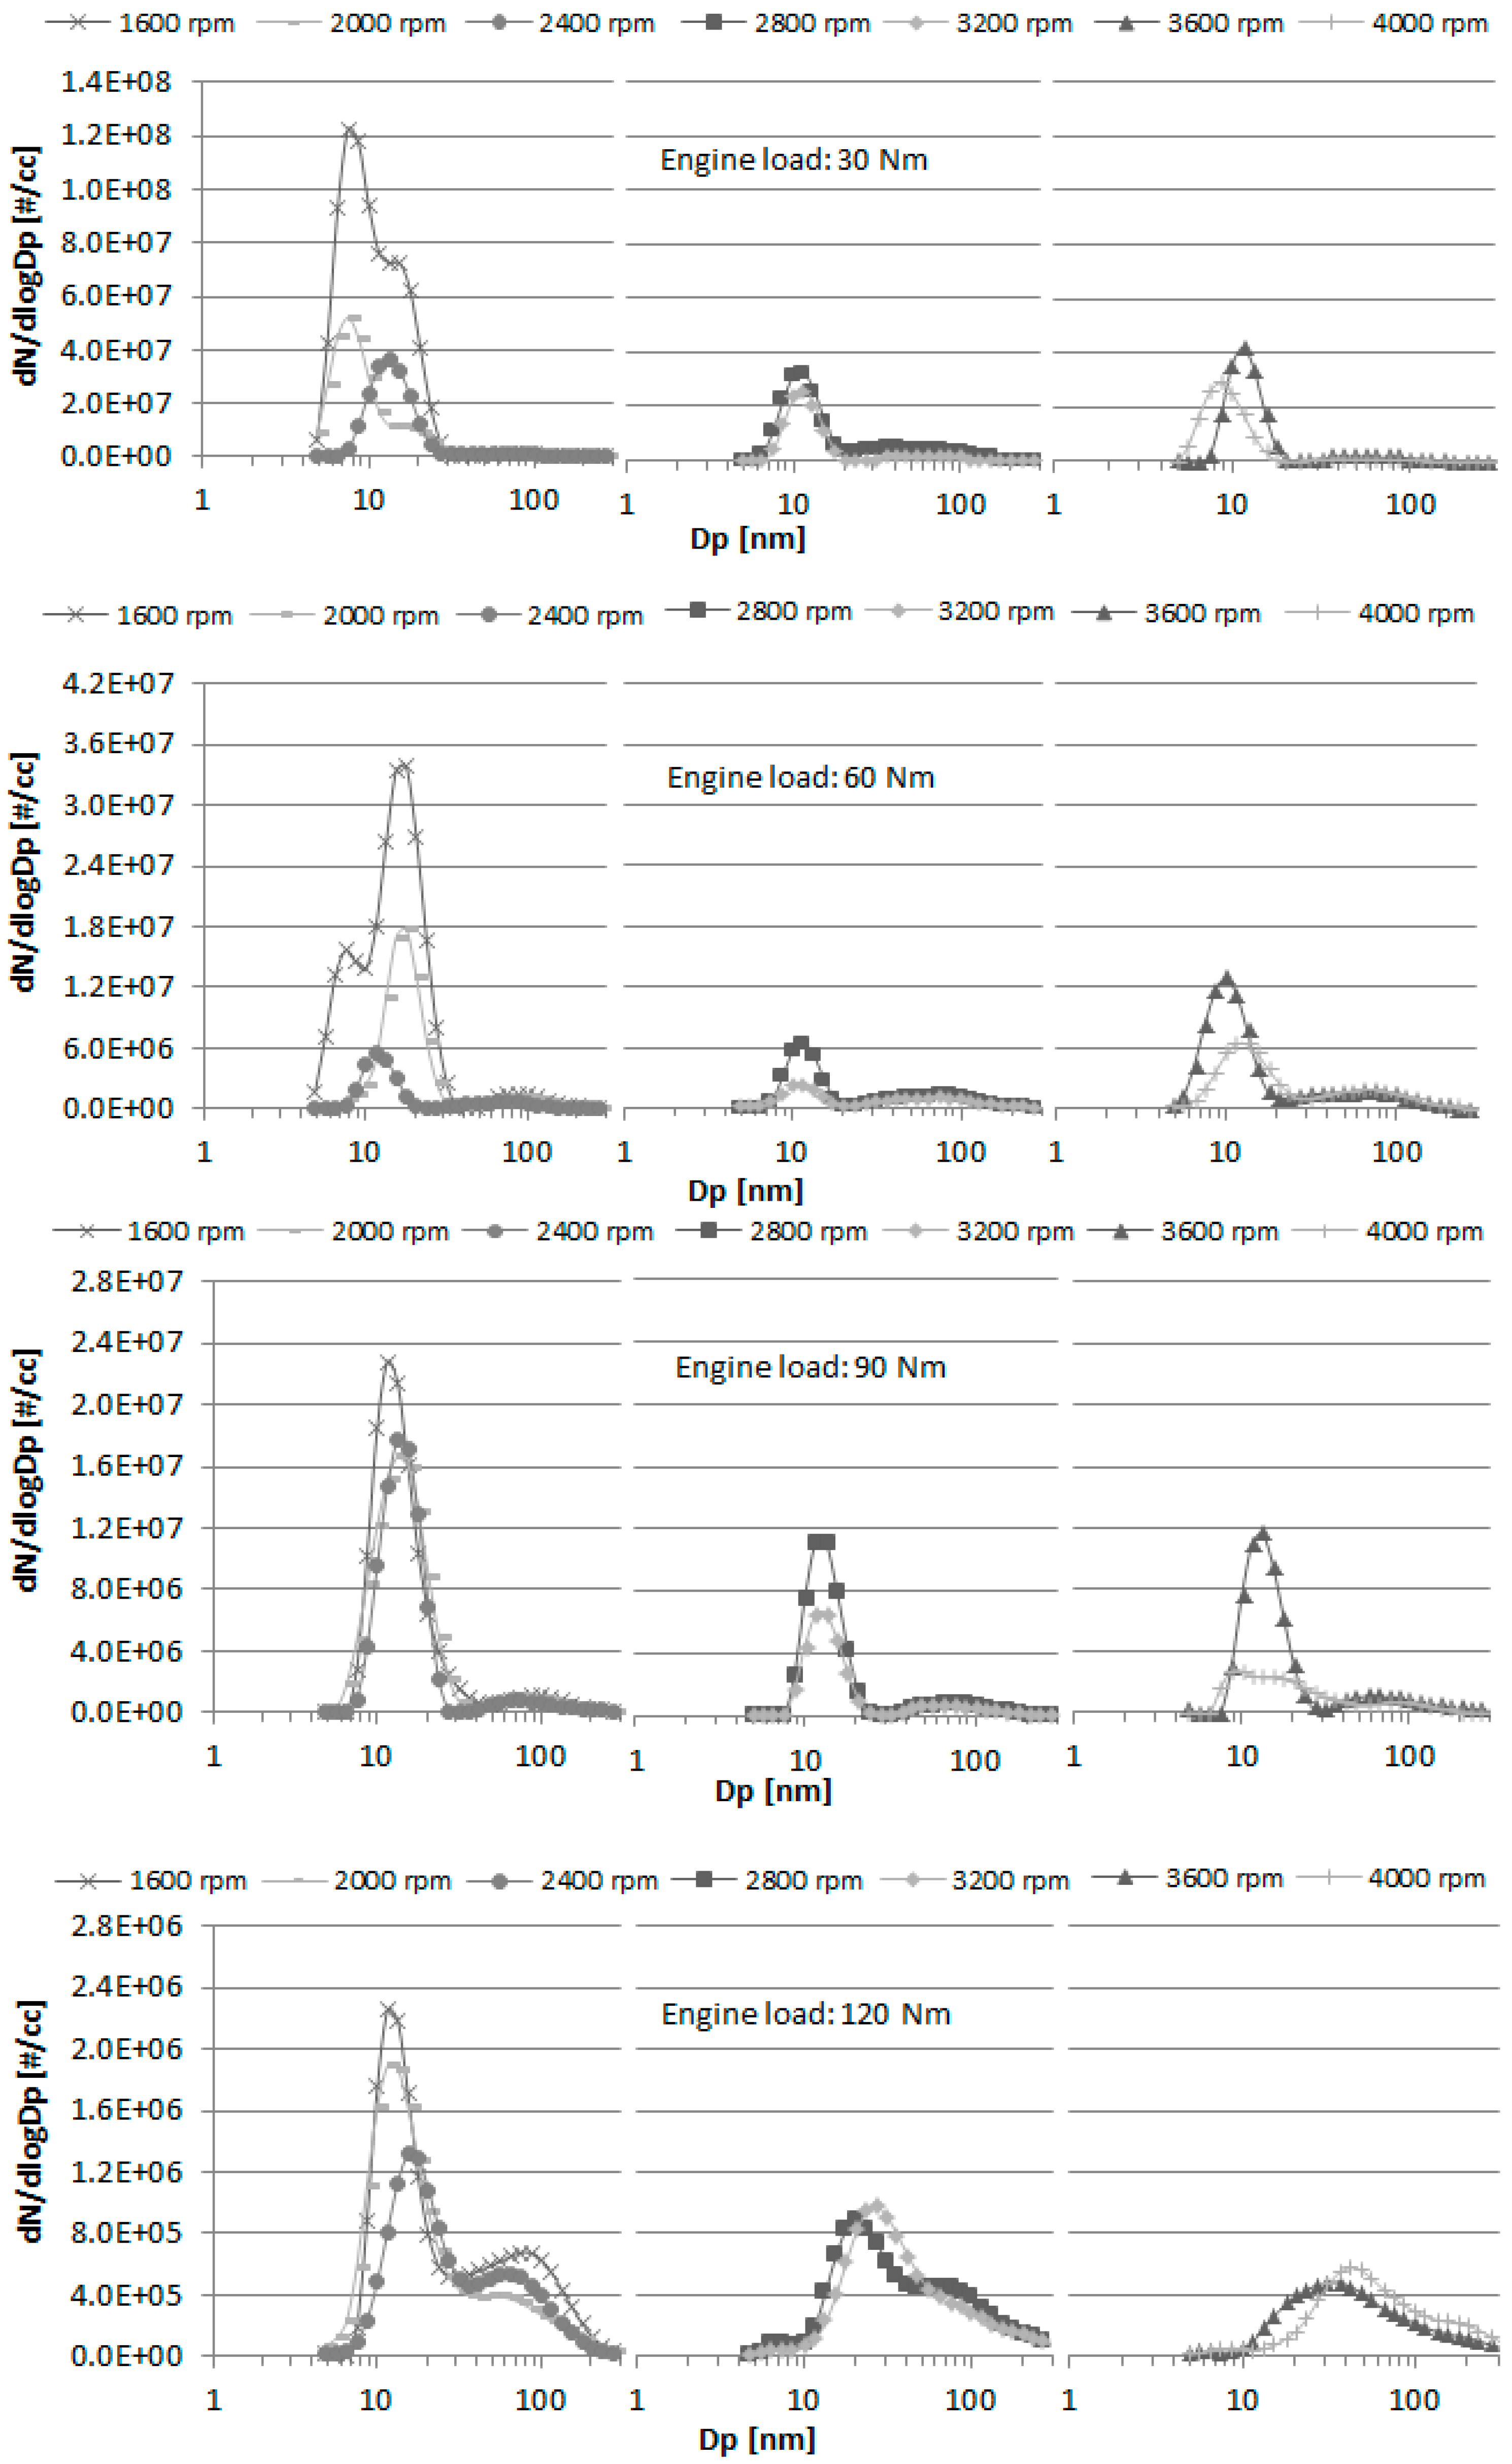
  • The analysis of size-resolved particle number density distributions reveals a mostly bi-modal functional form, featuring much greater levels in nucleation mode (<50 nm). In the lowest sooting conditions (engine load of 120 Nm and speed of 3600 rpm and above), the distributions present mono-modal form with peak located at the high end of nucleation mode interval.
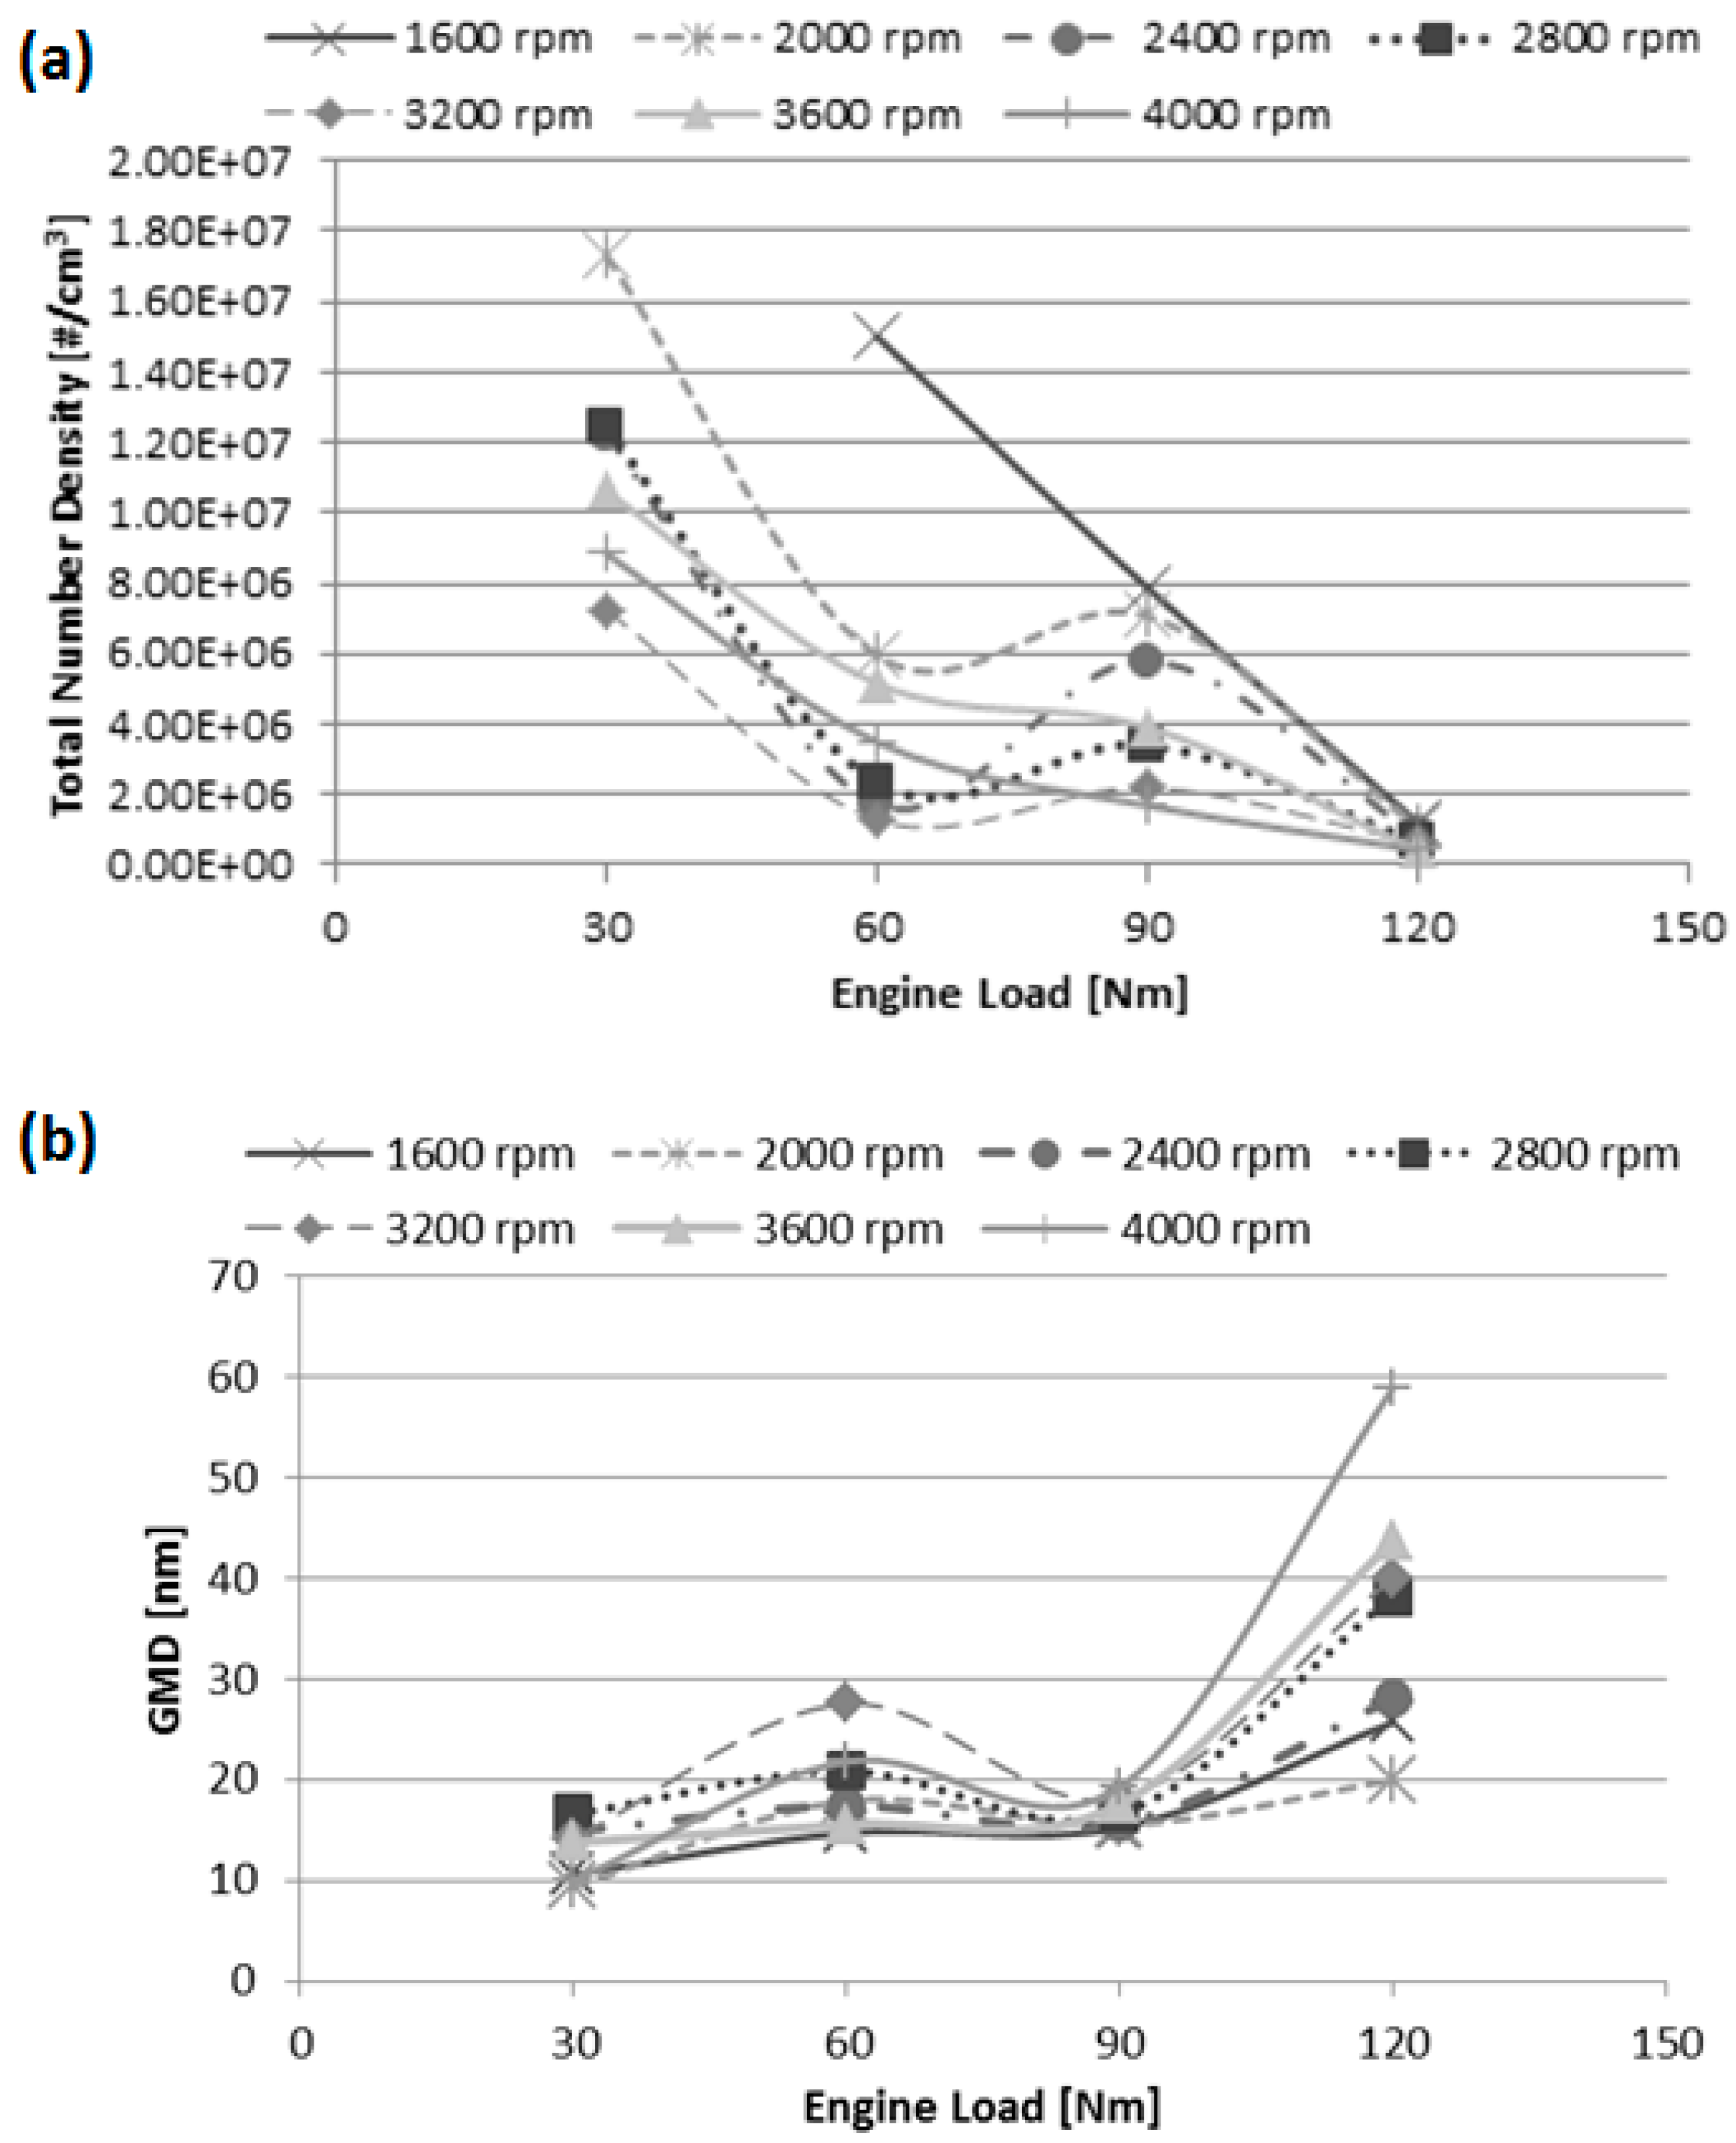
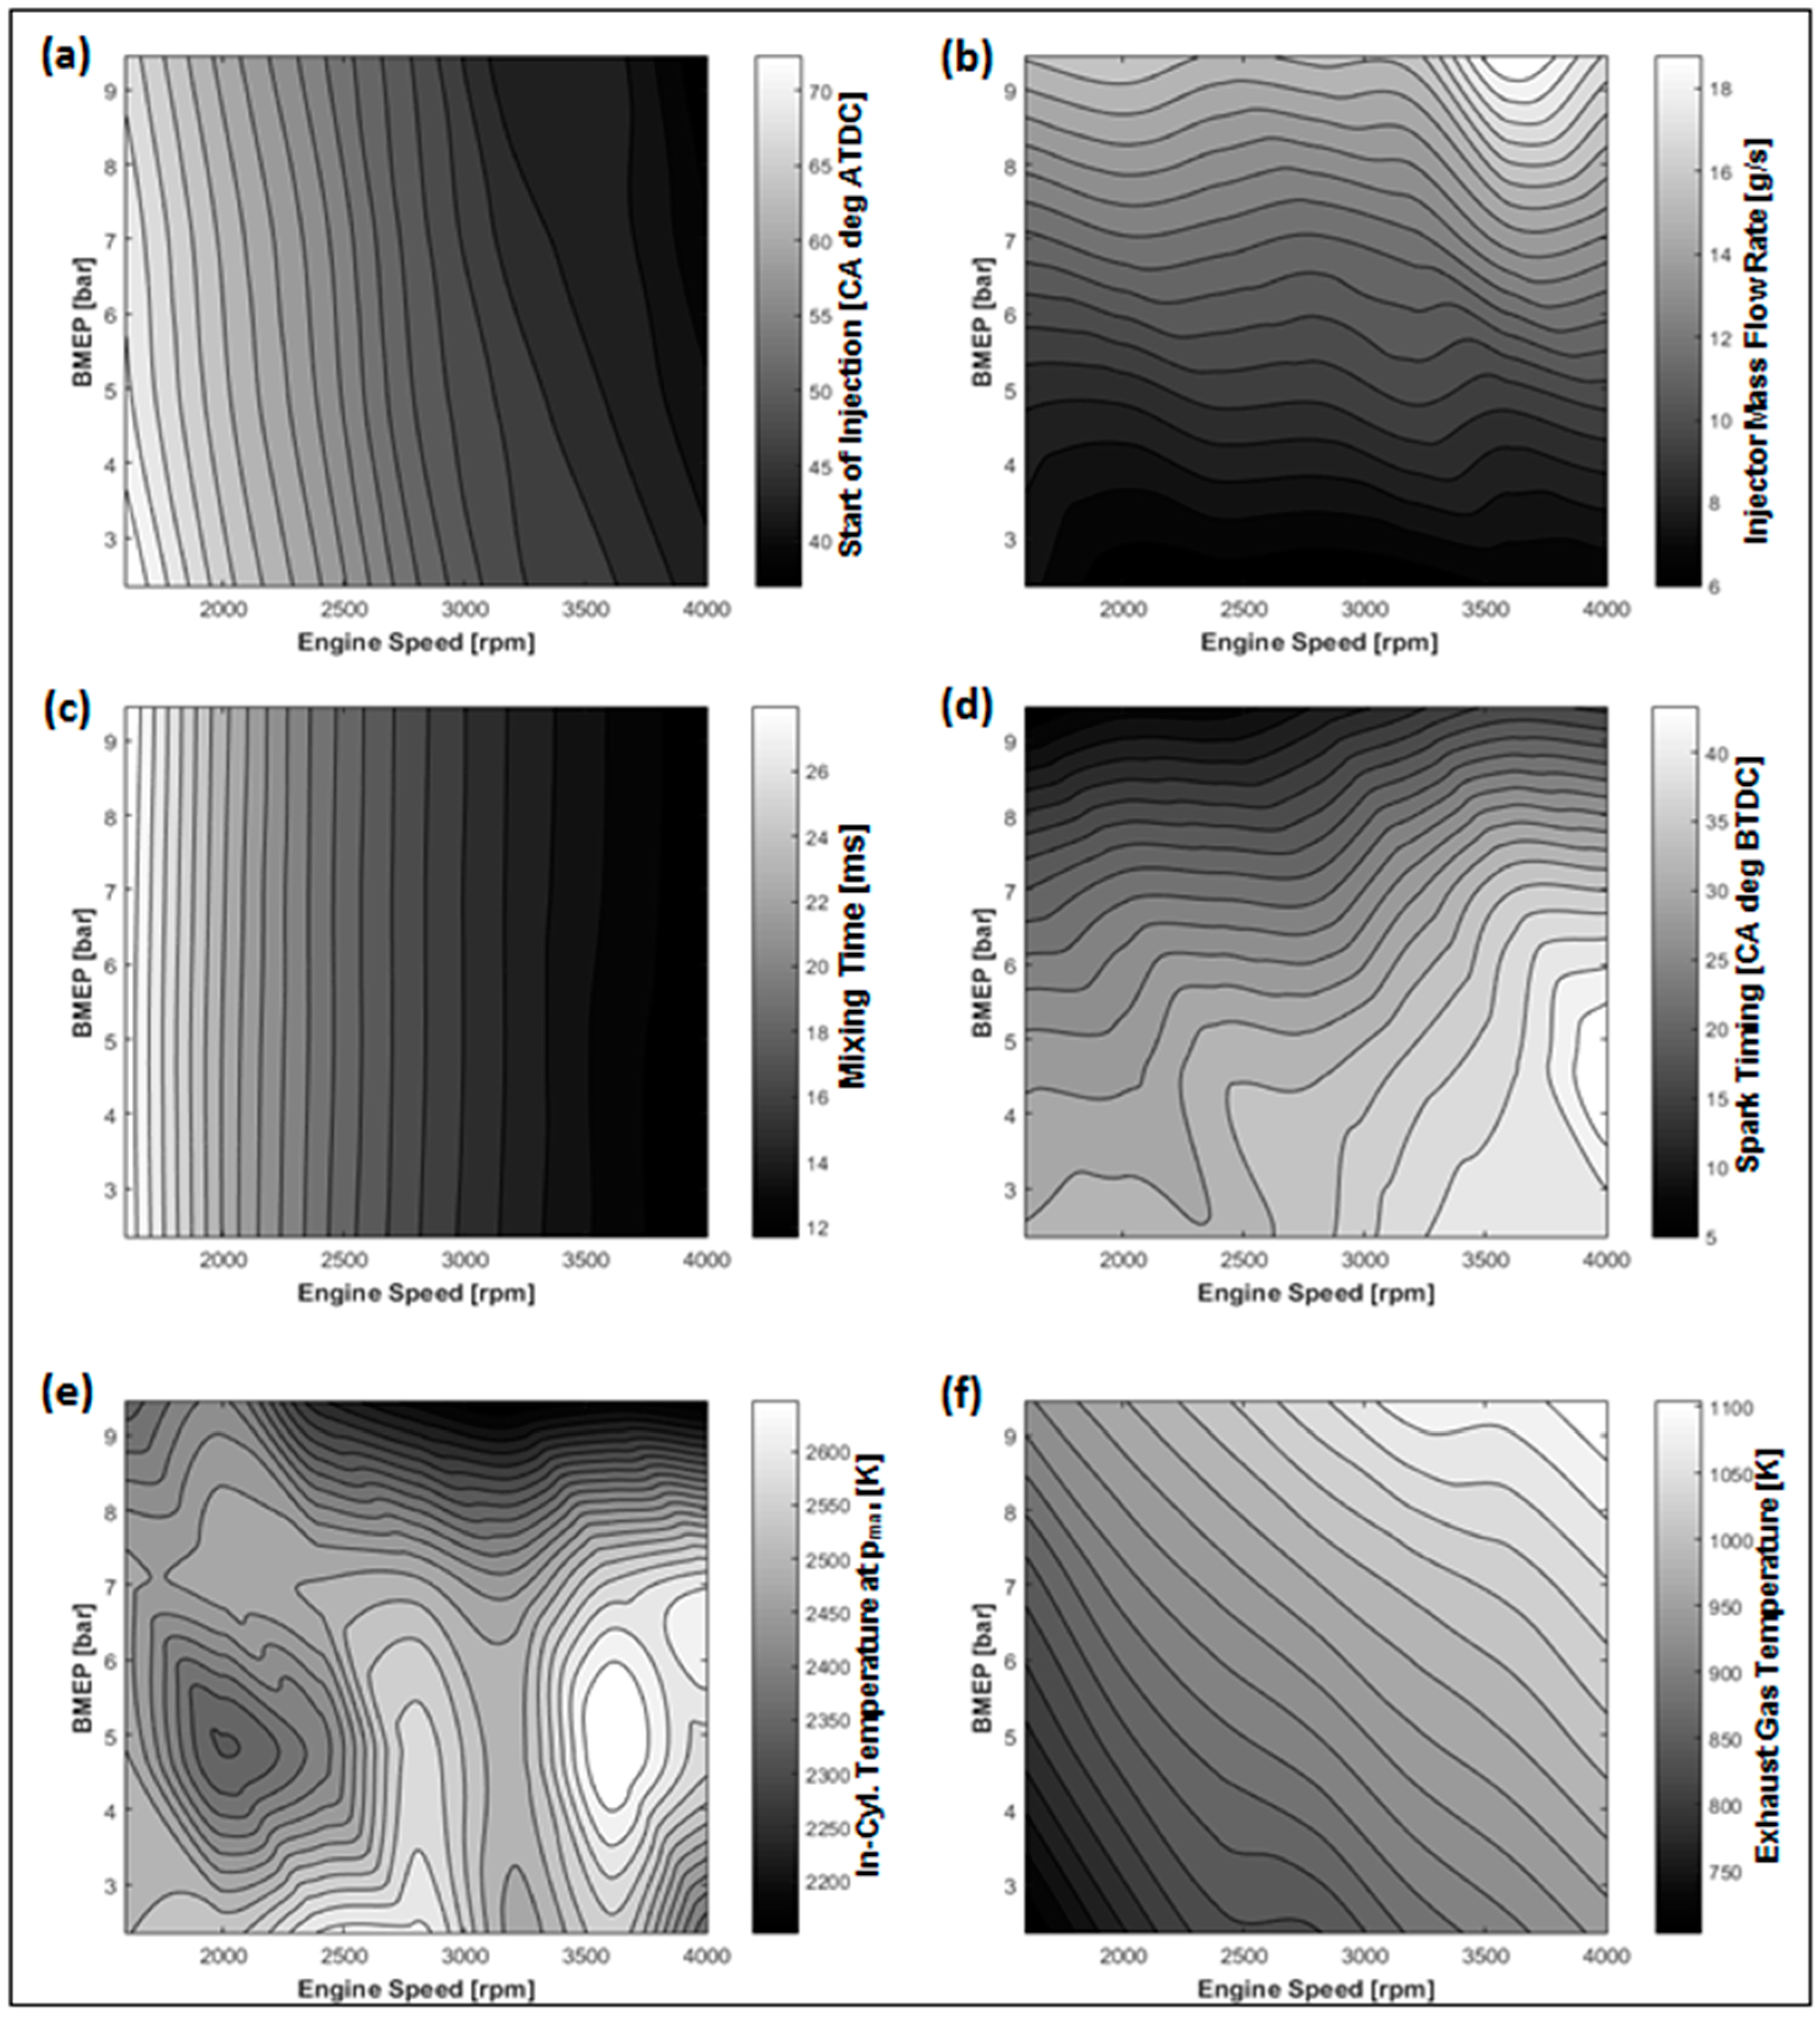
  • Increases in engine speed and load lead to lower particle number densities and larger size. The effect of engine load is more pronounced and results from greater injection pressure which improves charge homogeneity through better fuel atomisation.
  • The total PNDen varies between 1.7 × 10⁷ and 4.0 × 10⁵ particles/cm3, showing larger dependence on engine speed at low load and lower dependence at higher load. The results suggest that both improved mixture preparation and lower peak combustion temperature contribute to the reduction in particle number concentration as engine speed and load increase.
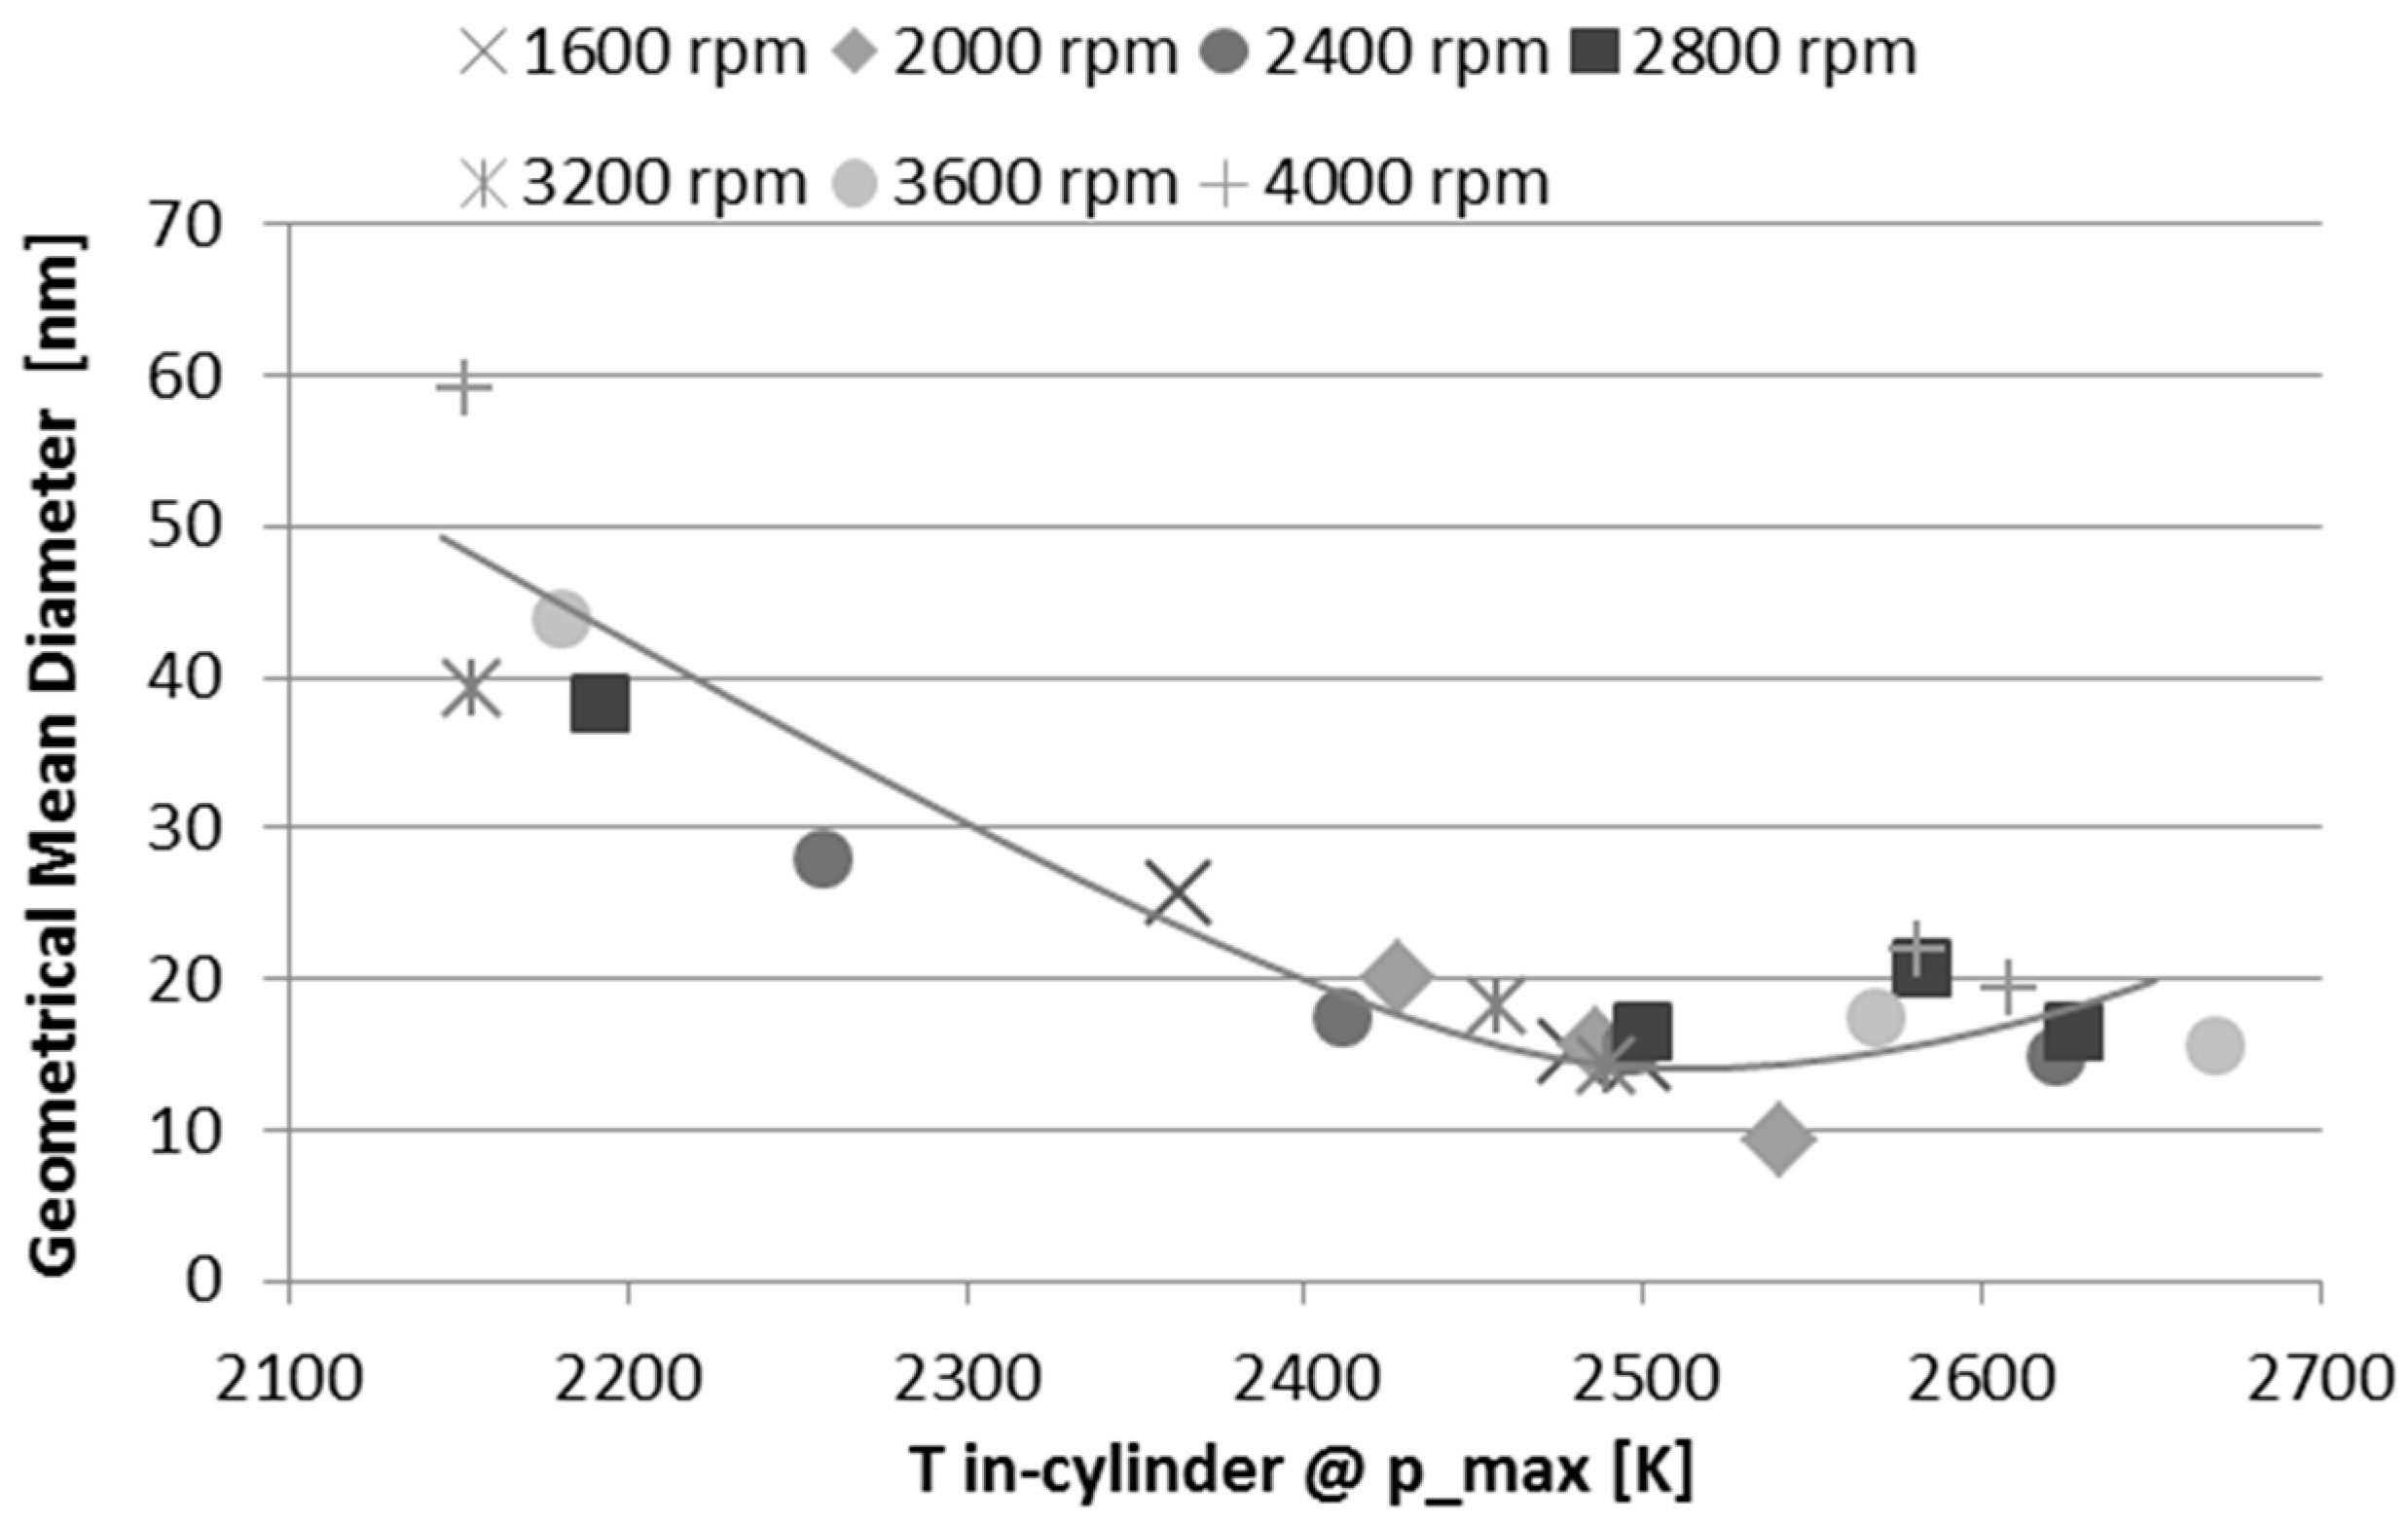
  • The GMD varies between 10 and 60 nm. Conversely to PNDen, GMD shows low dependence on engine speed at low load and greater dependence at higher load. Stronger particle coagulation and lower oxidation may contribute to greater particle size as engine speed and load increase.
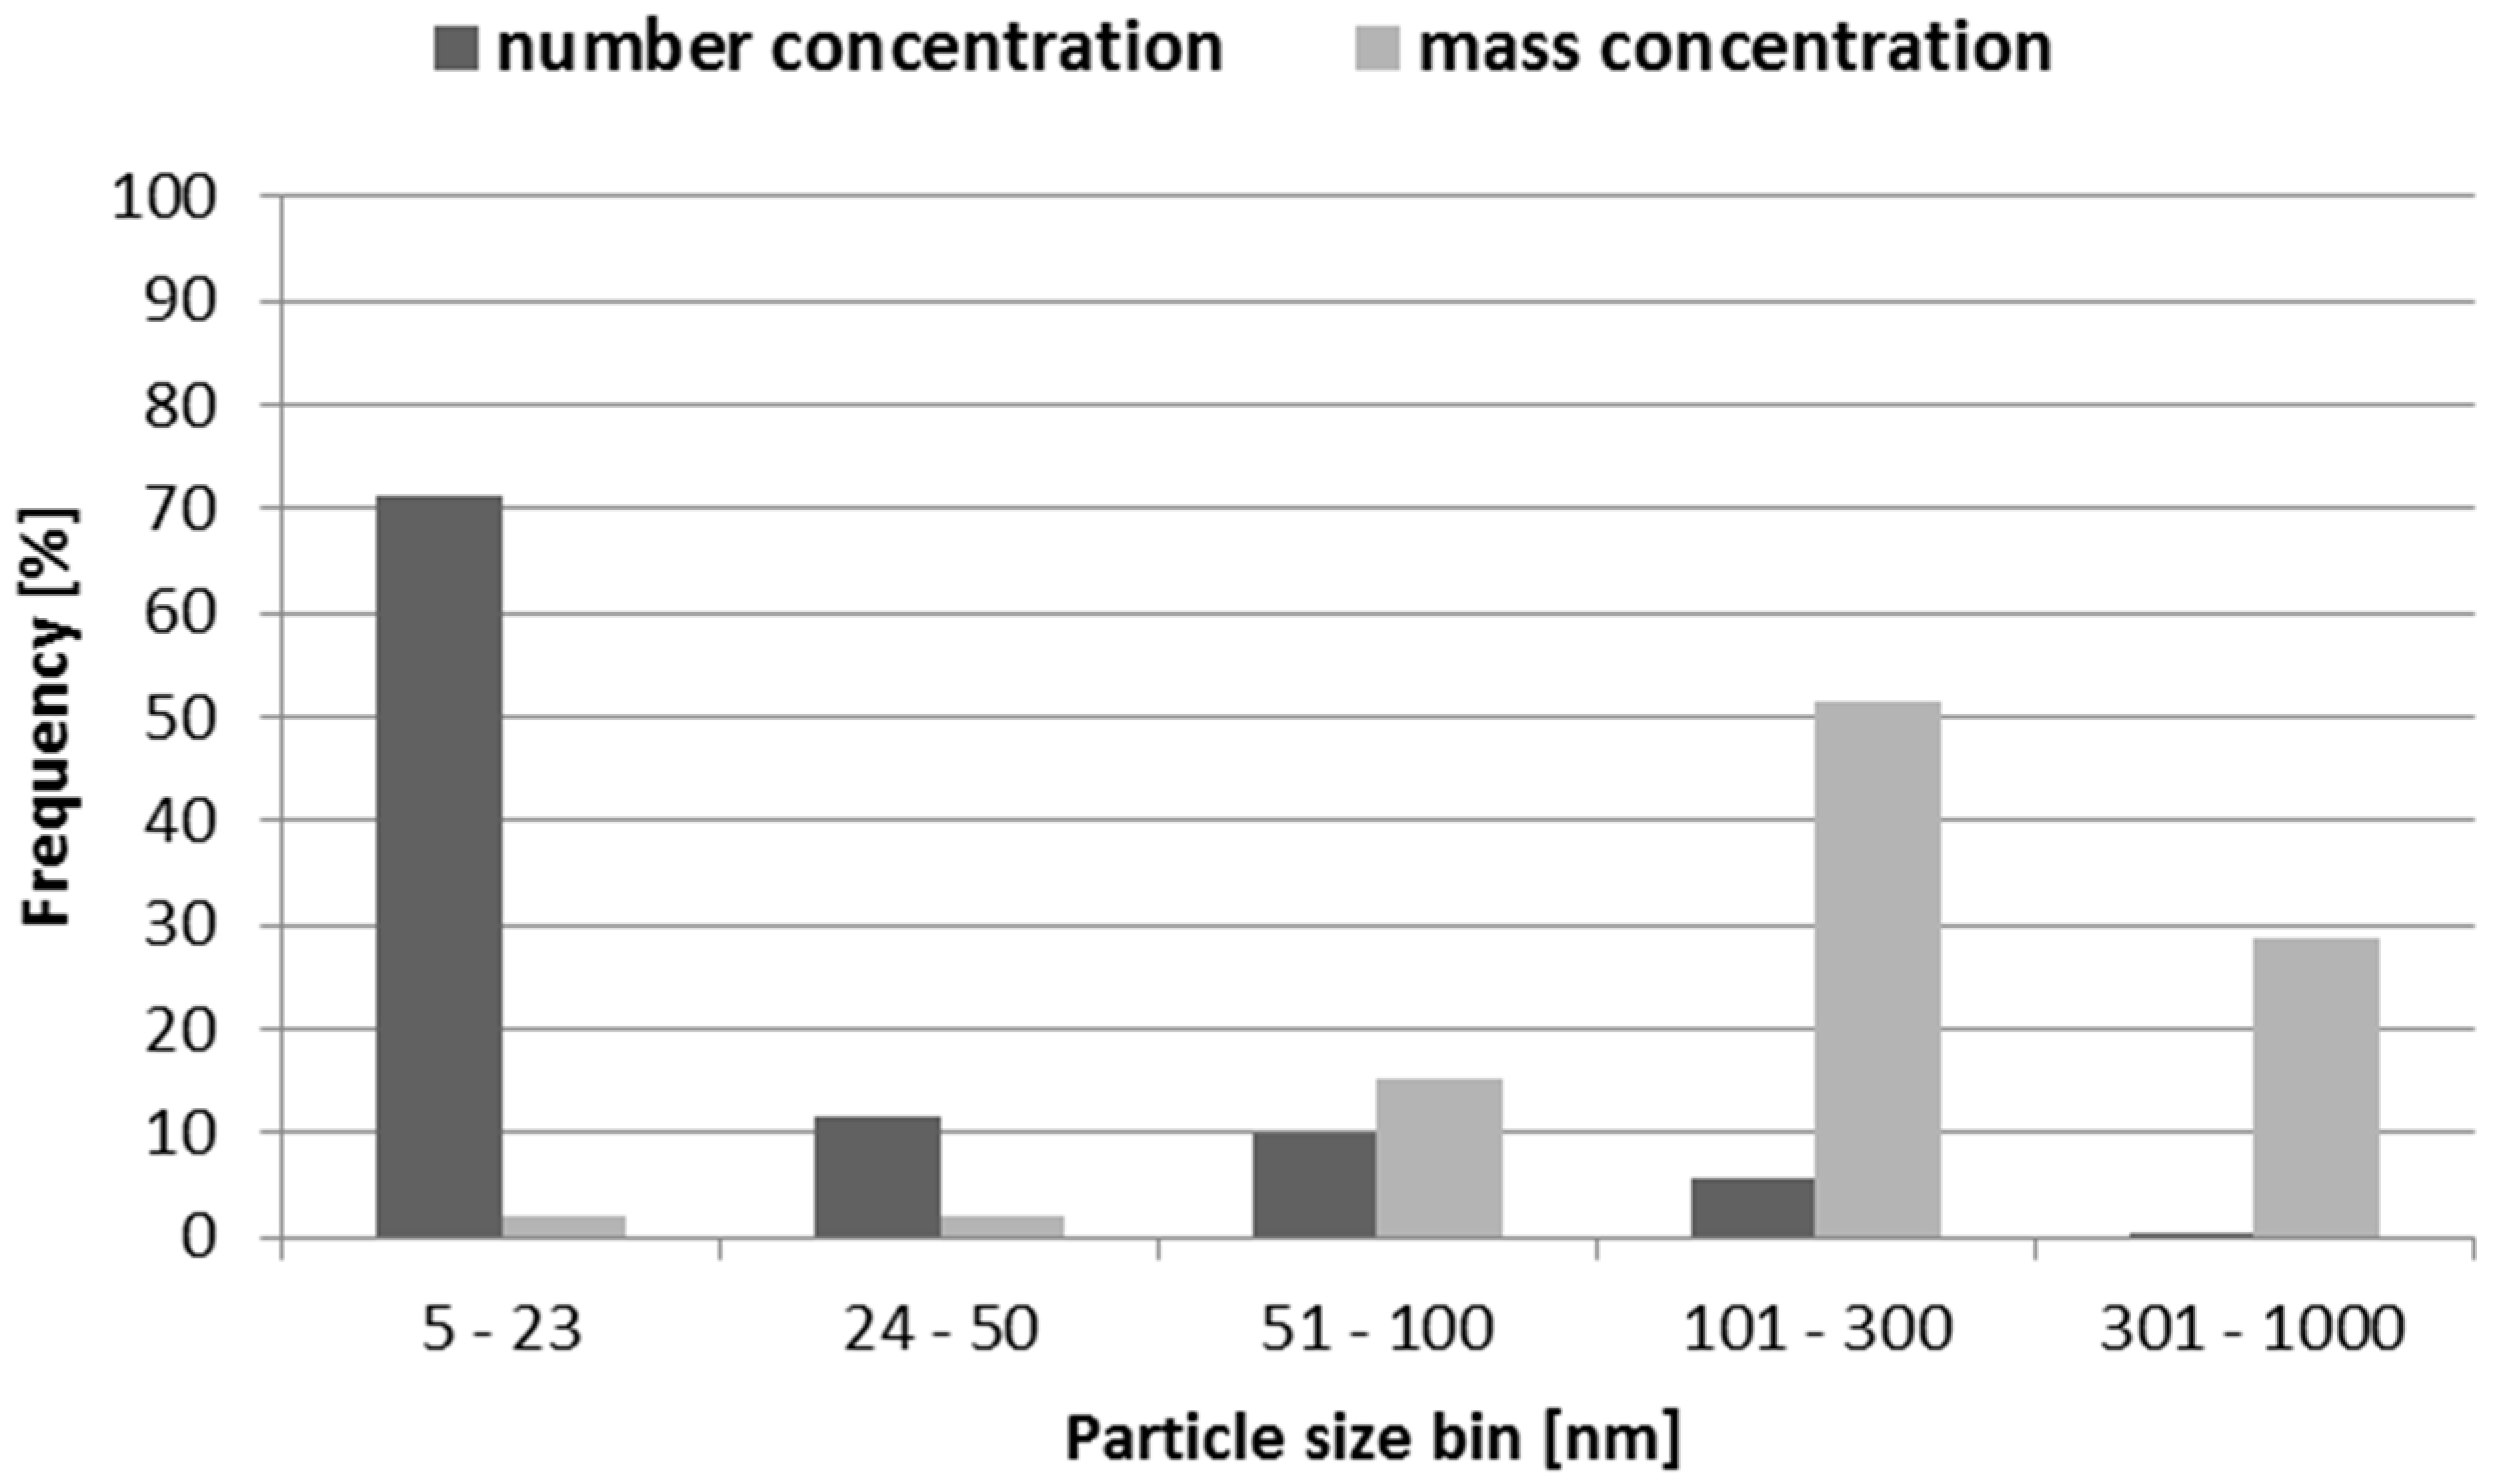
  • 72% of particles are emitted on average in the 5–23 nm size range, while over 80% falls in the nucleation mode range. Only 10% of particles are emitted in accumulation mode (51–100 nm). The very high frequencies in the sub-23 nm range expose potential limitations of the incoming EU6c/d emission regulations, which do not consider particles below this threshold.
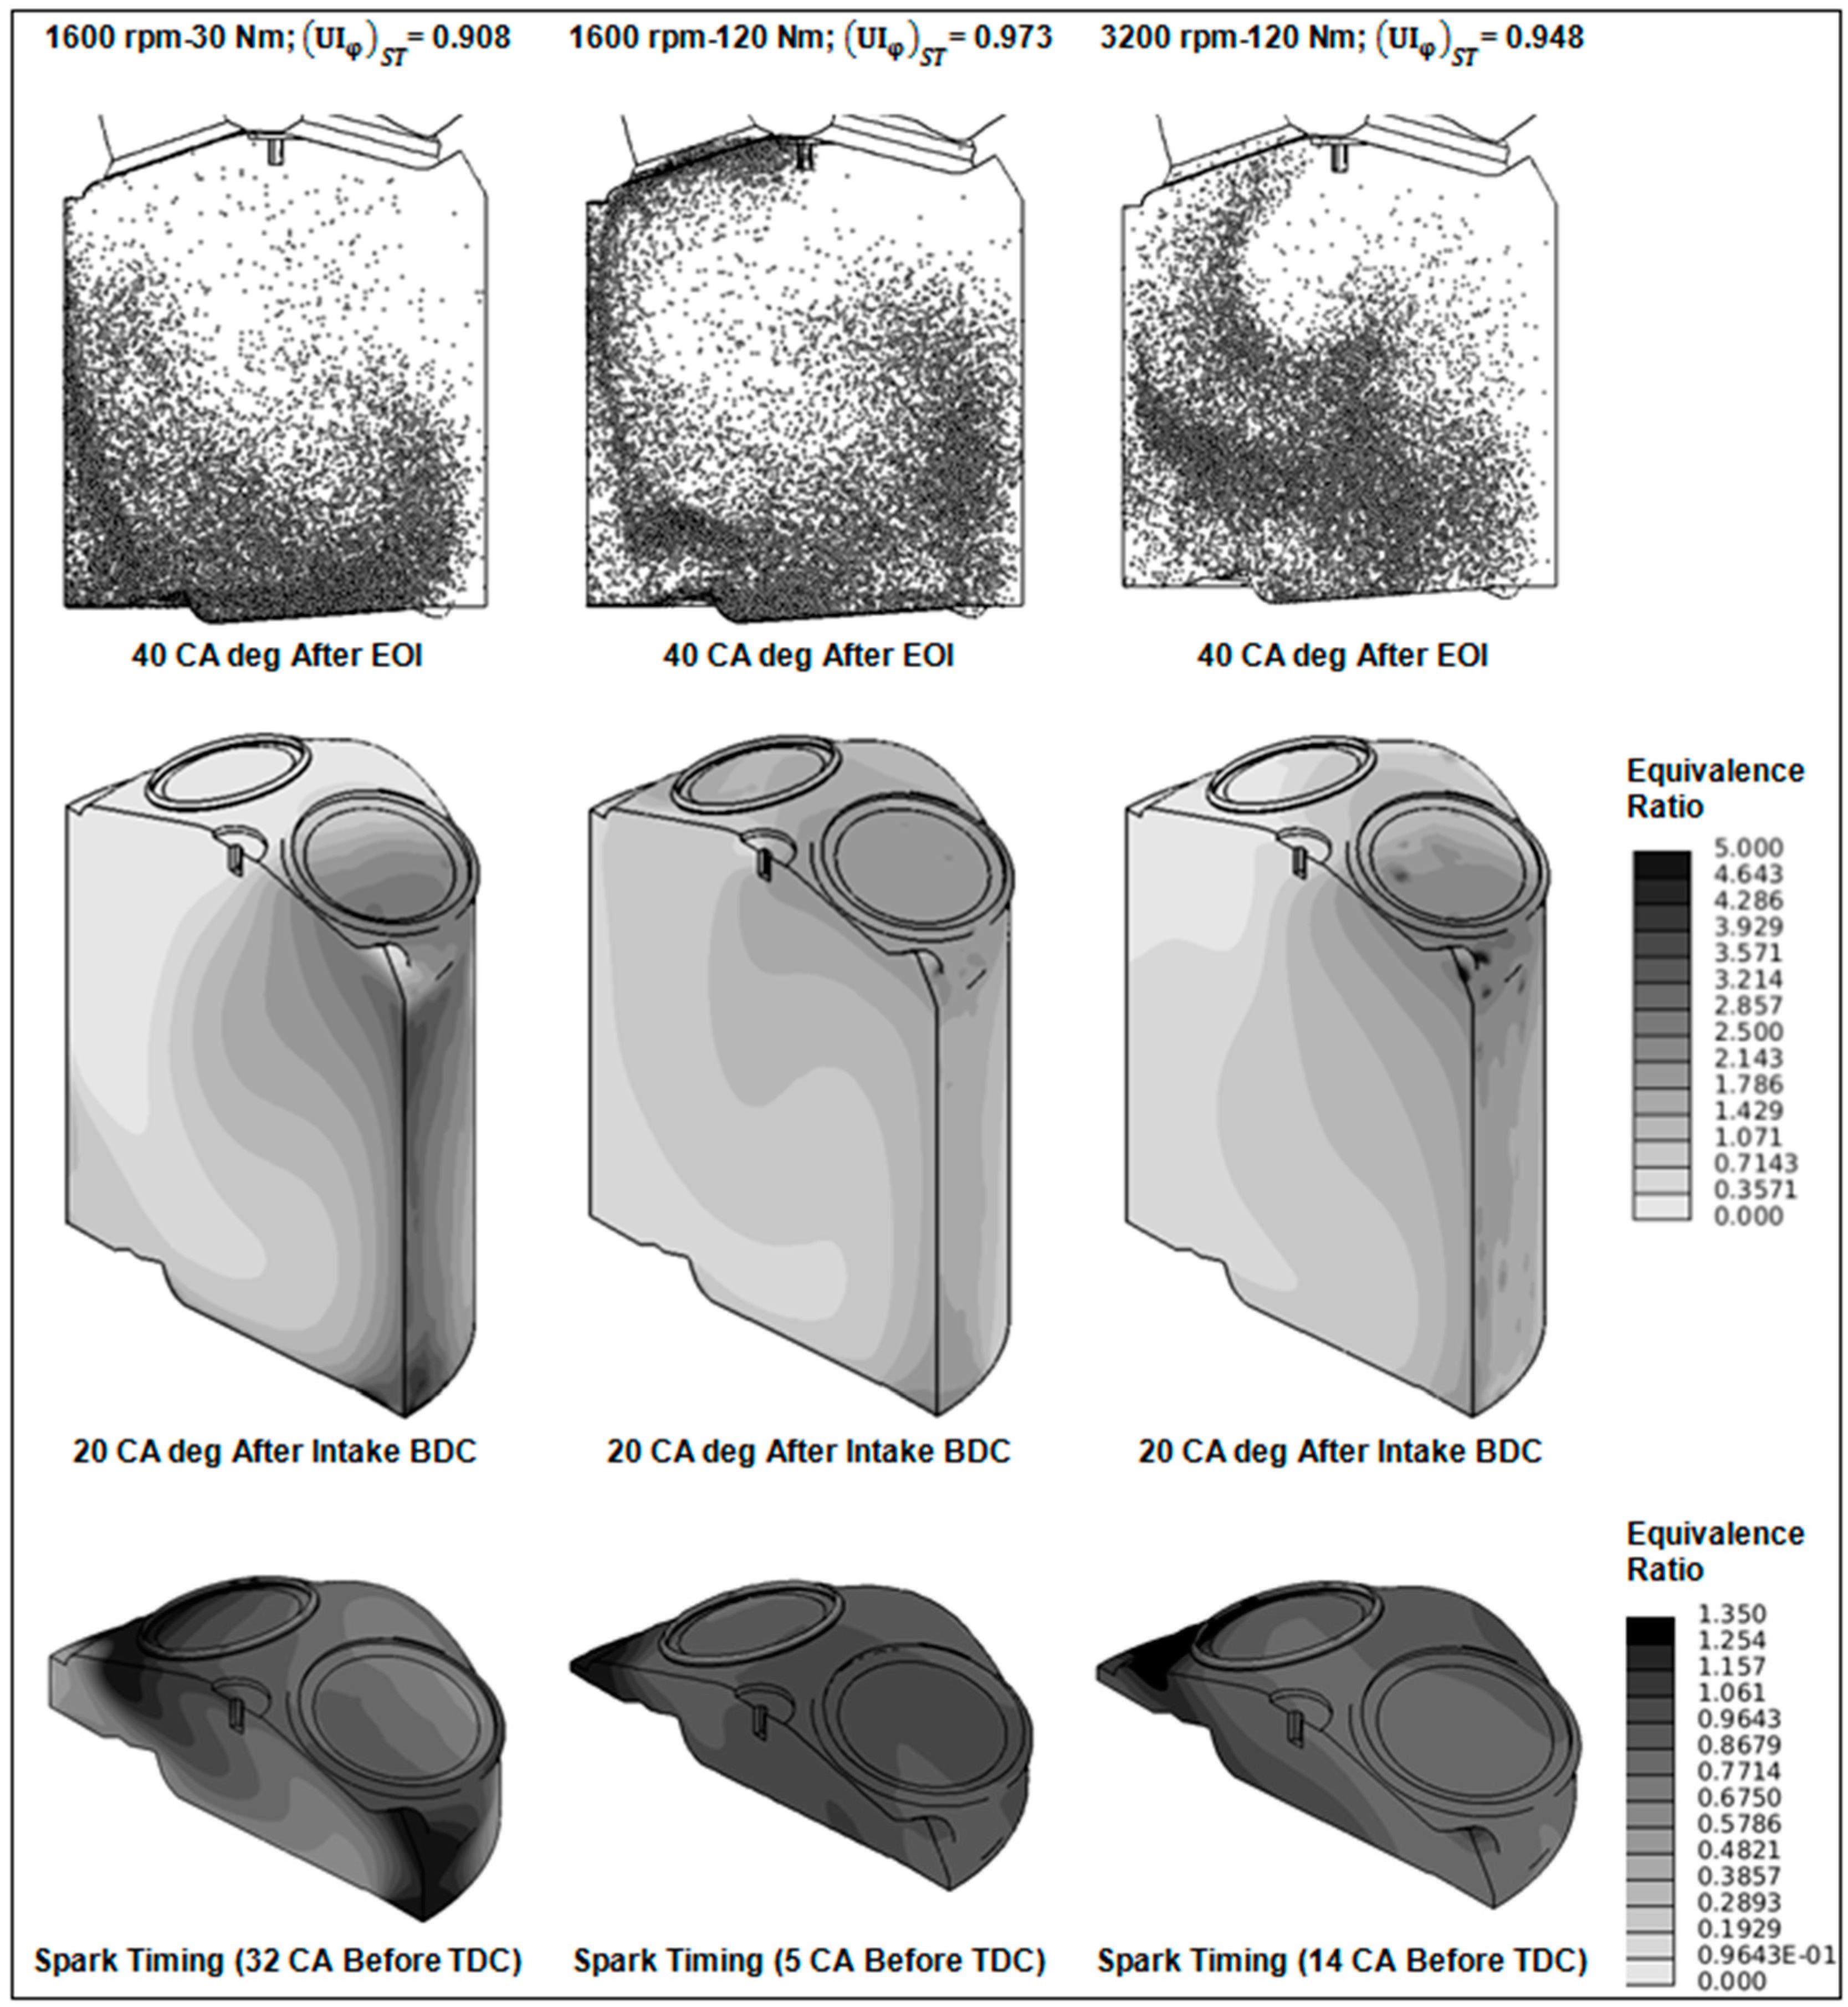
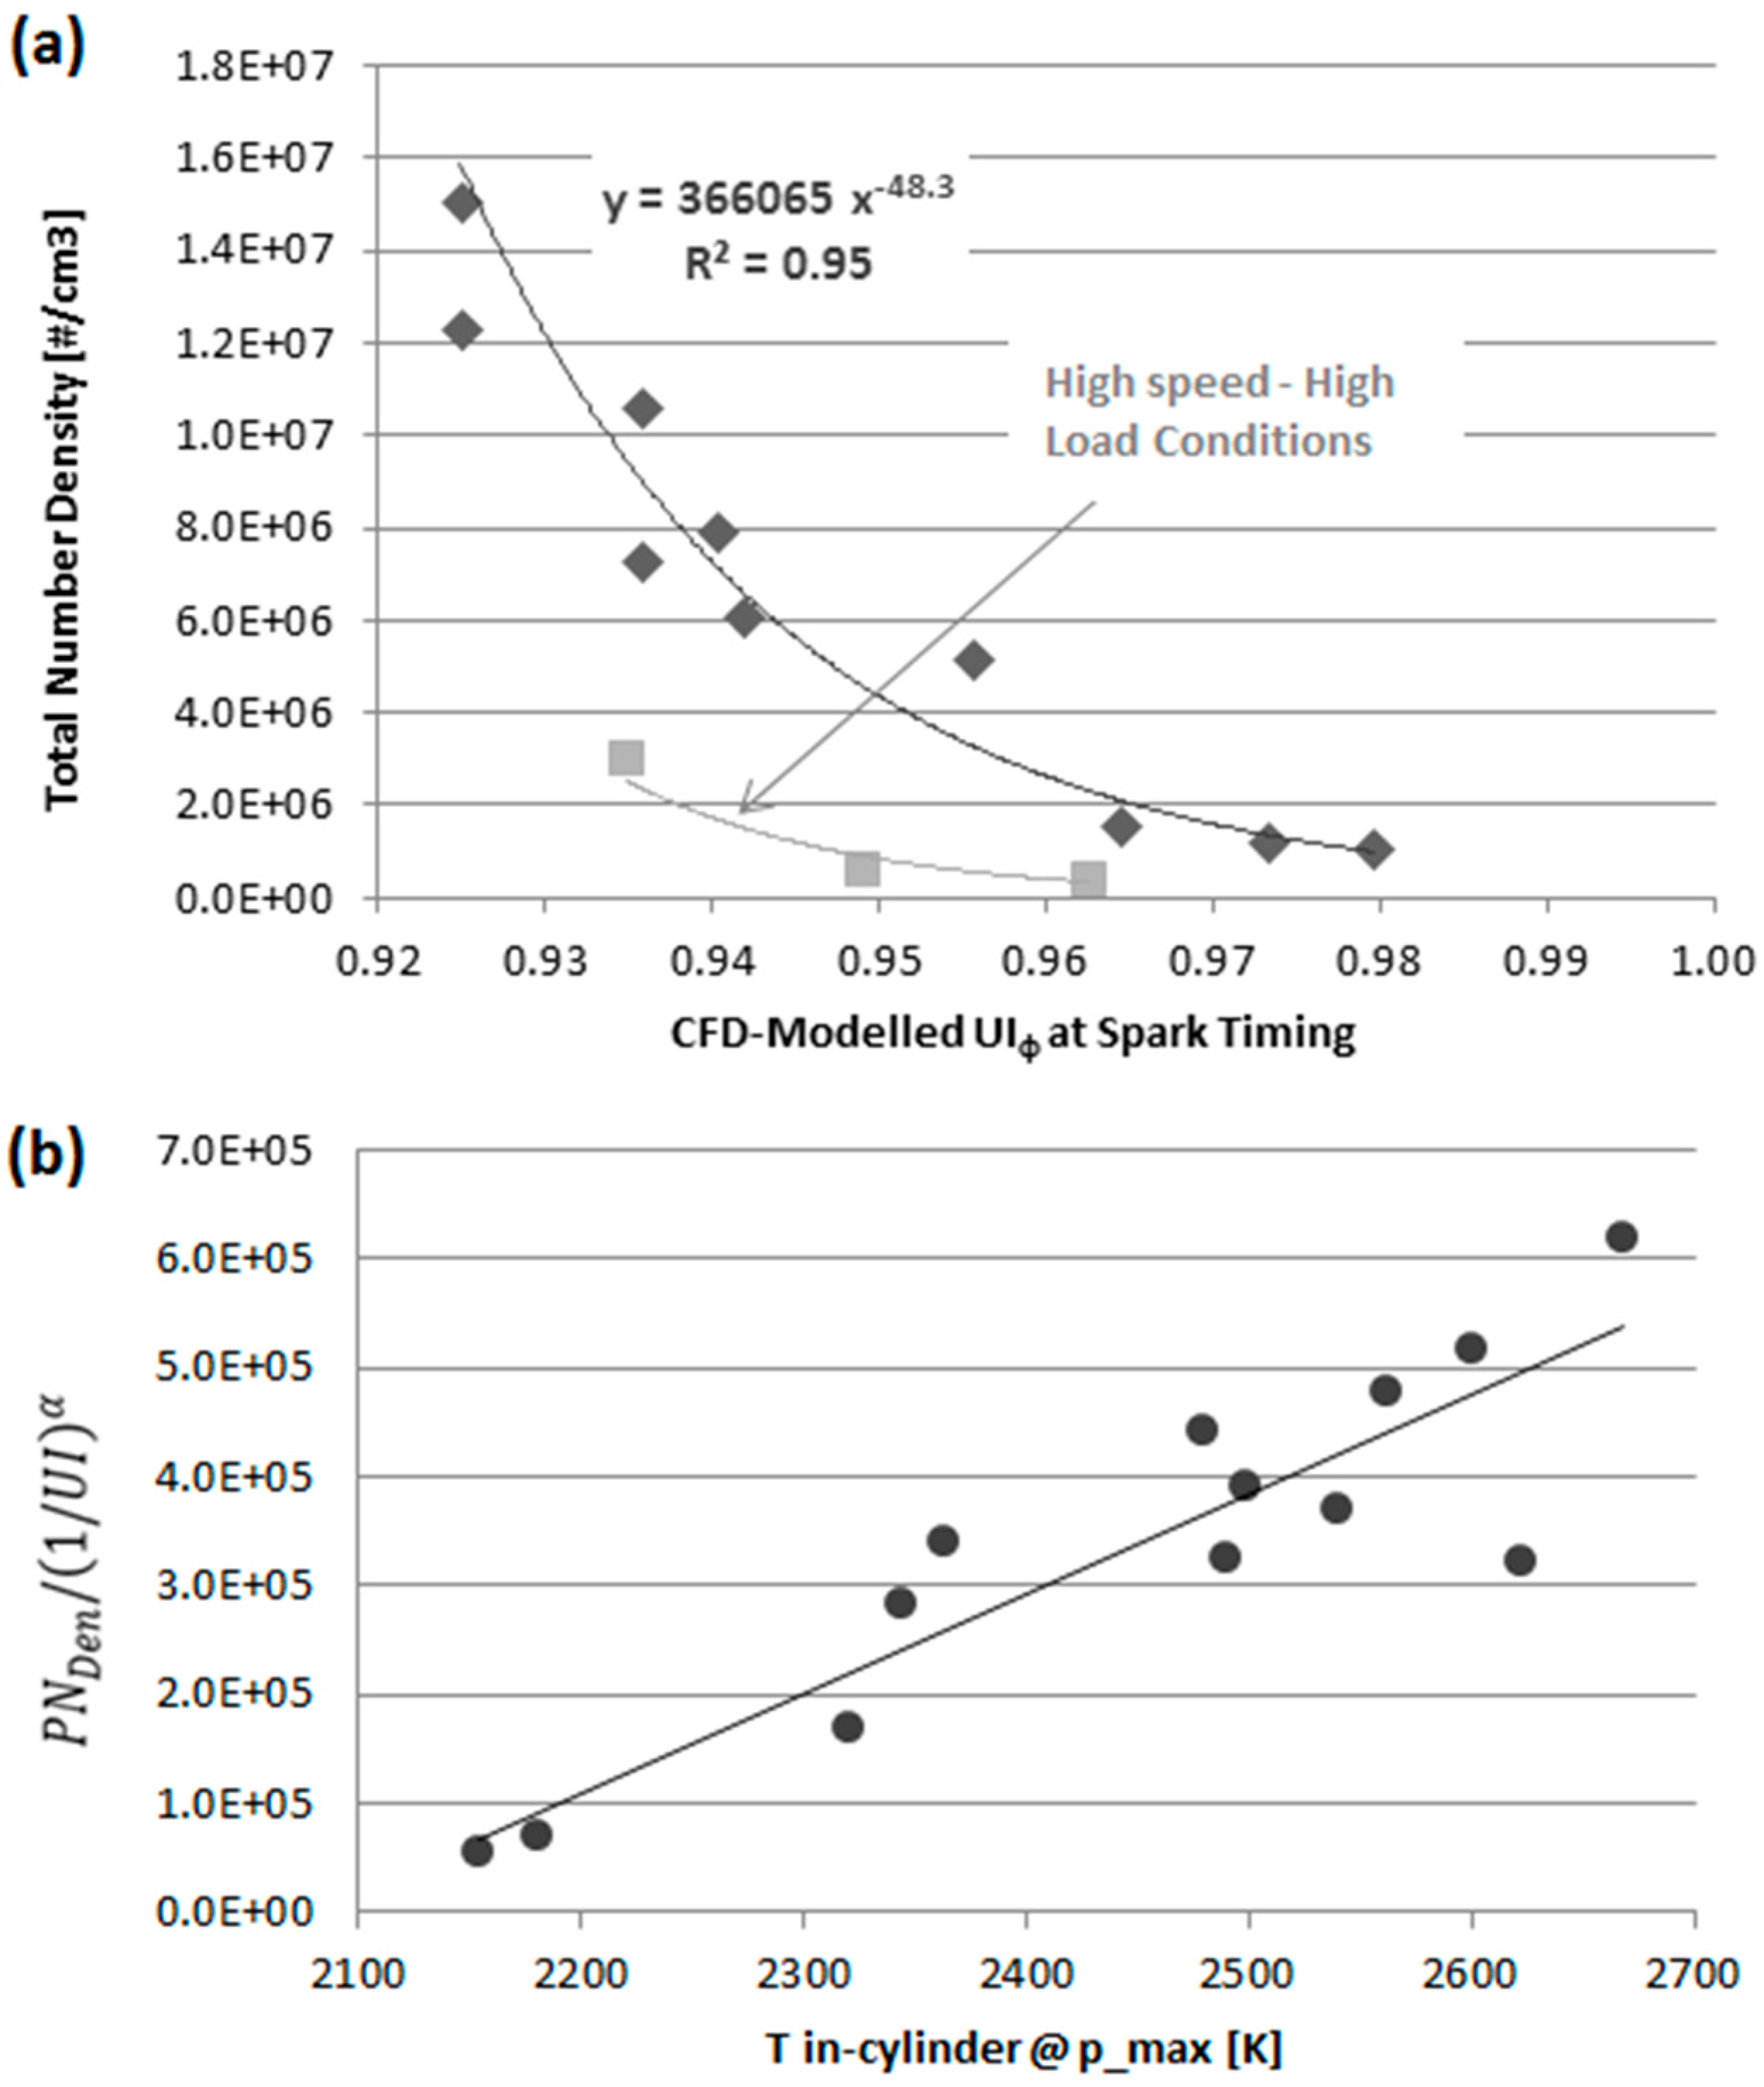
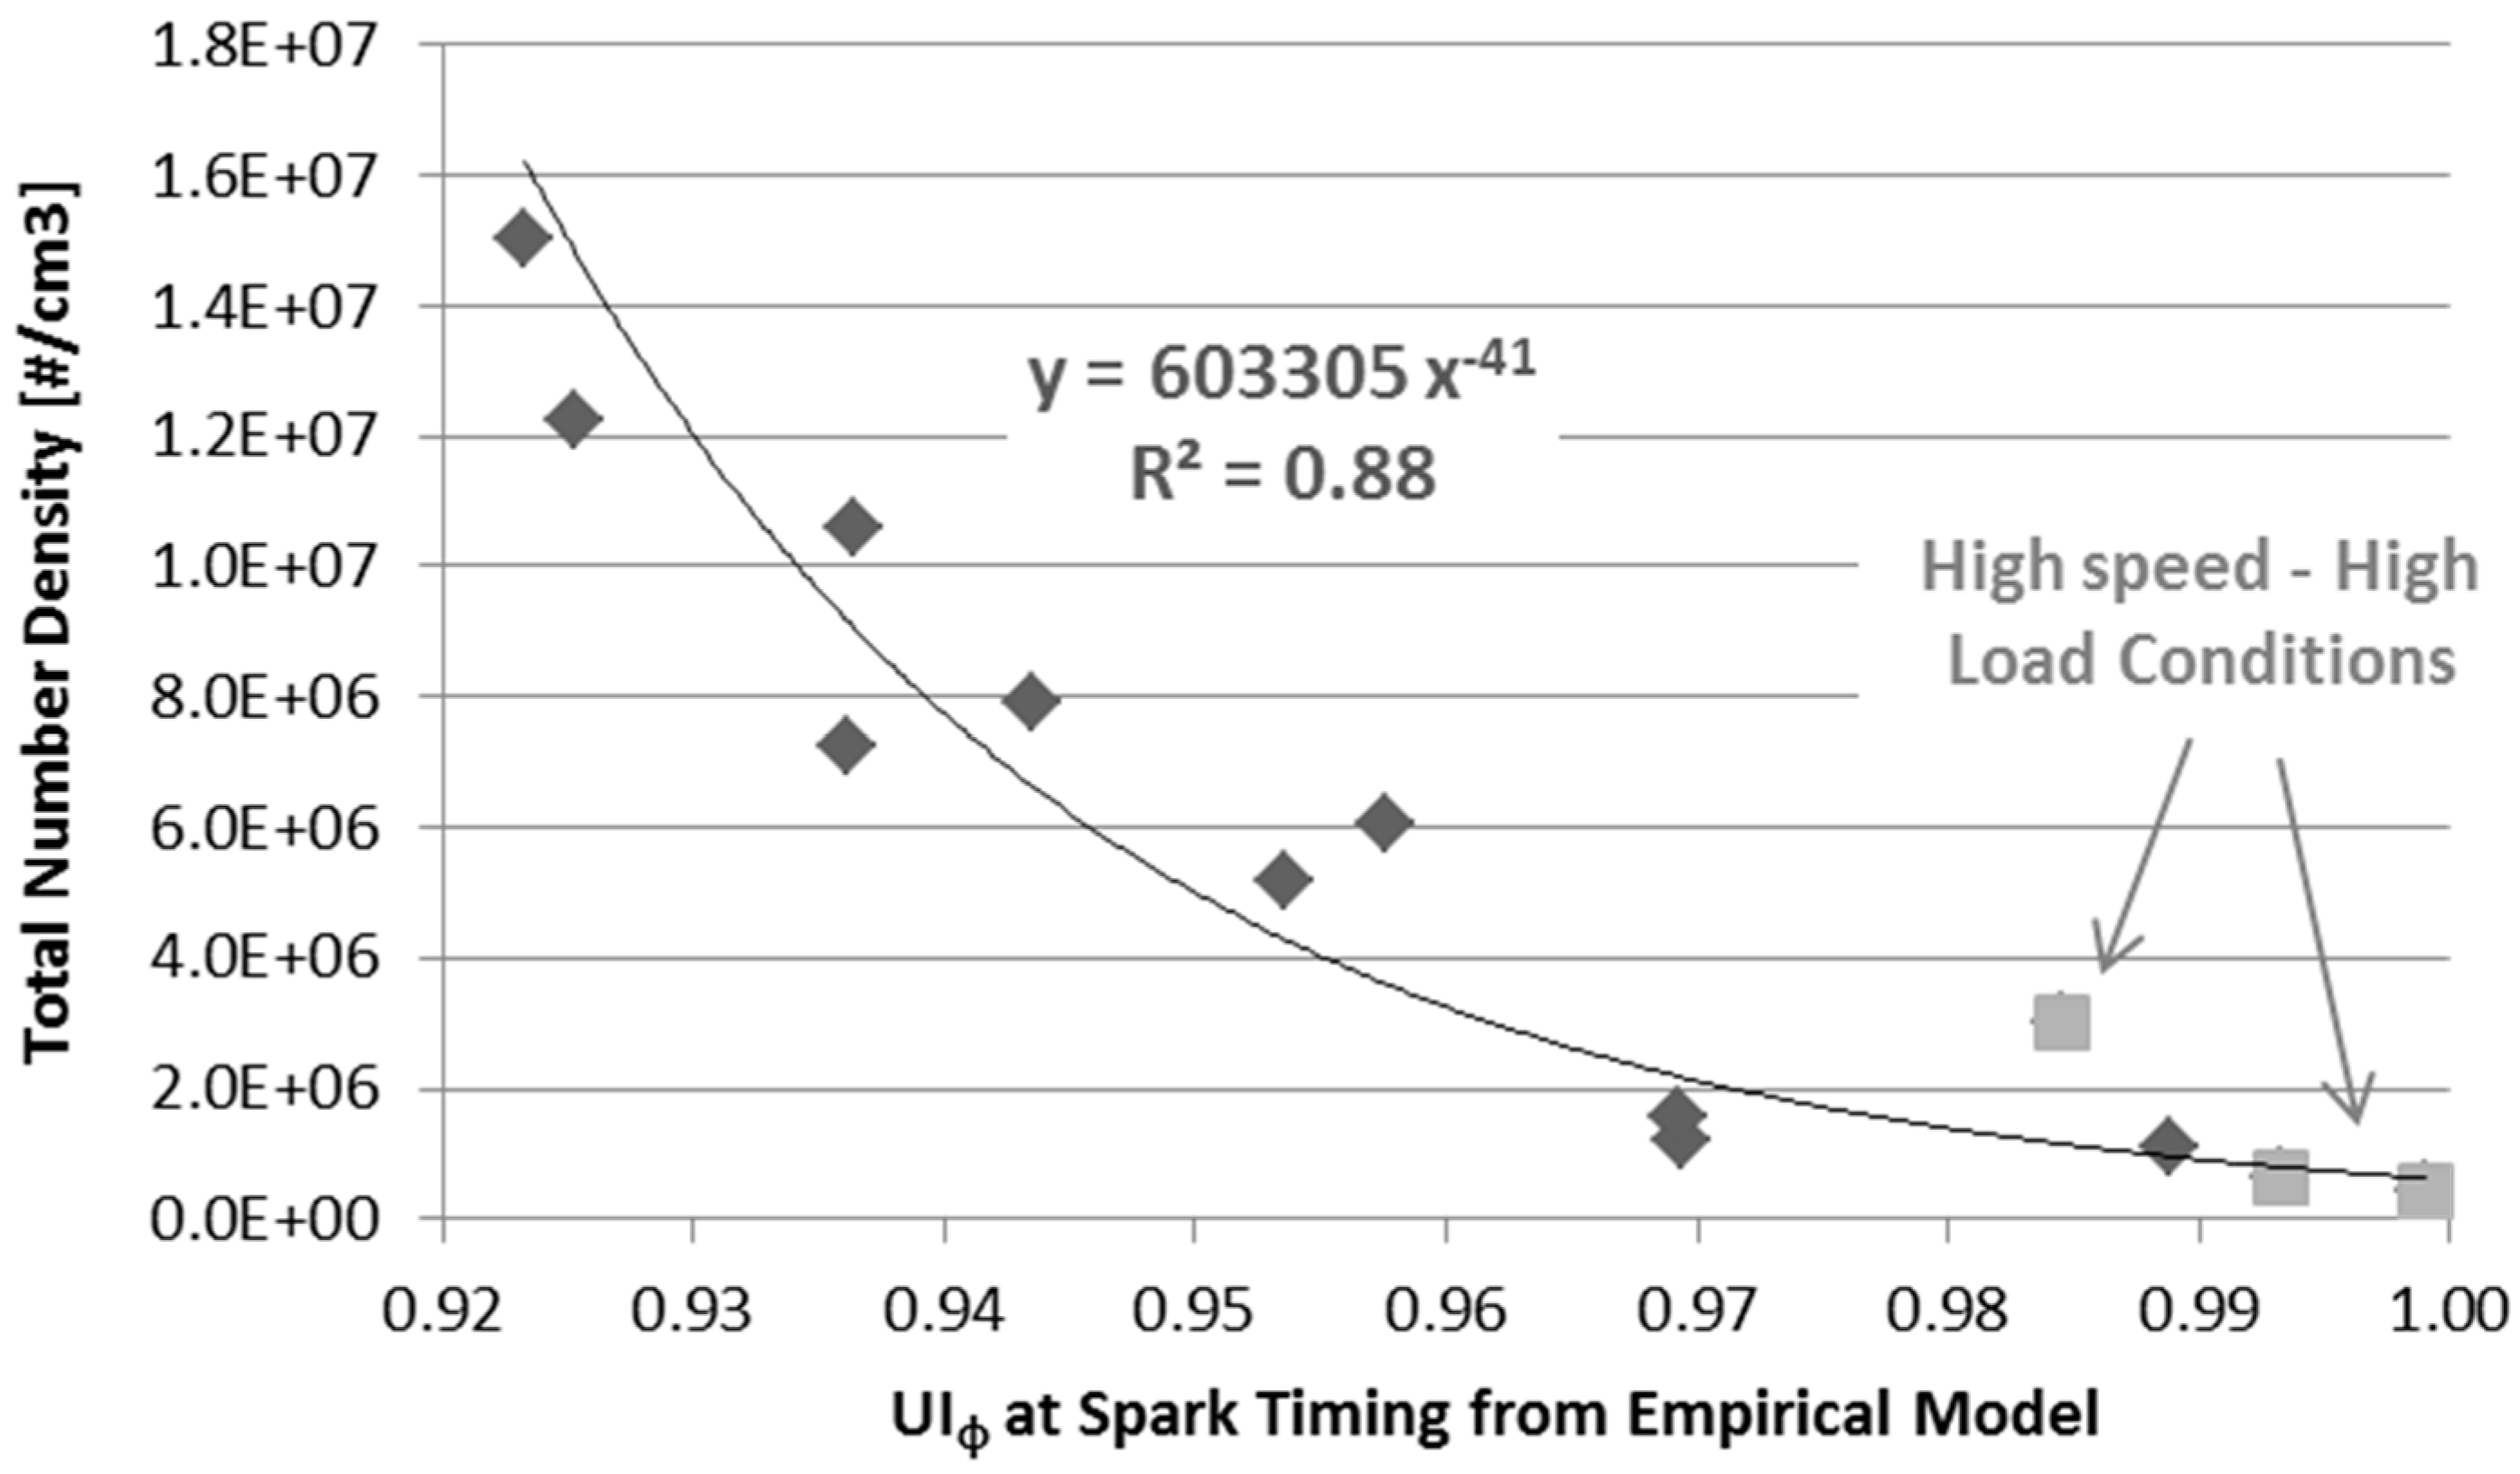
  • The volume-based uniformity index of equivalence ratio (UIφ) was calculated through a limited number of CFD simulations of the test-engine, and used as an indication of the effectiveness of the mixture preparation process. A strong power-law type correlation exists between PNDen and UIφ calculated at spark timing. Relatively small increases in charge homogeneity of the order of 6% are associated to large reductions of total particle number density of approximately one order of magnitude.
  • A strong correlation can also be identified between PNDen and modelled ideal-gas temperature at the location of peak combustion pressure. Reducing temperature between 2650 K and 2150 K would lead, dependent on engine running conditions, to a three to five-fold increase in average size, as well as to 90% reduction in total number density.
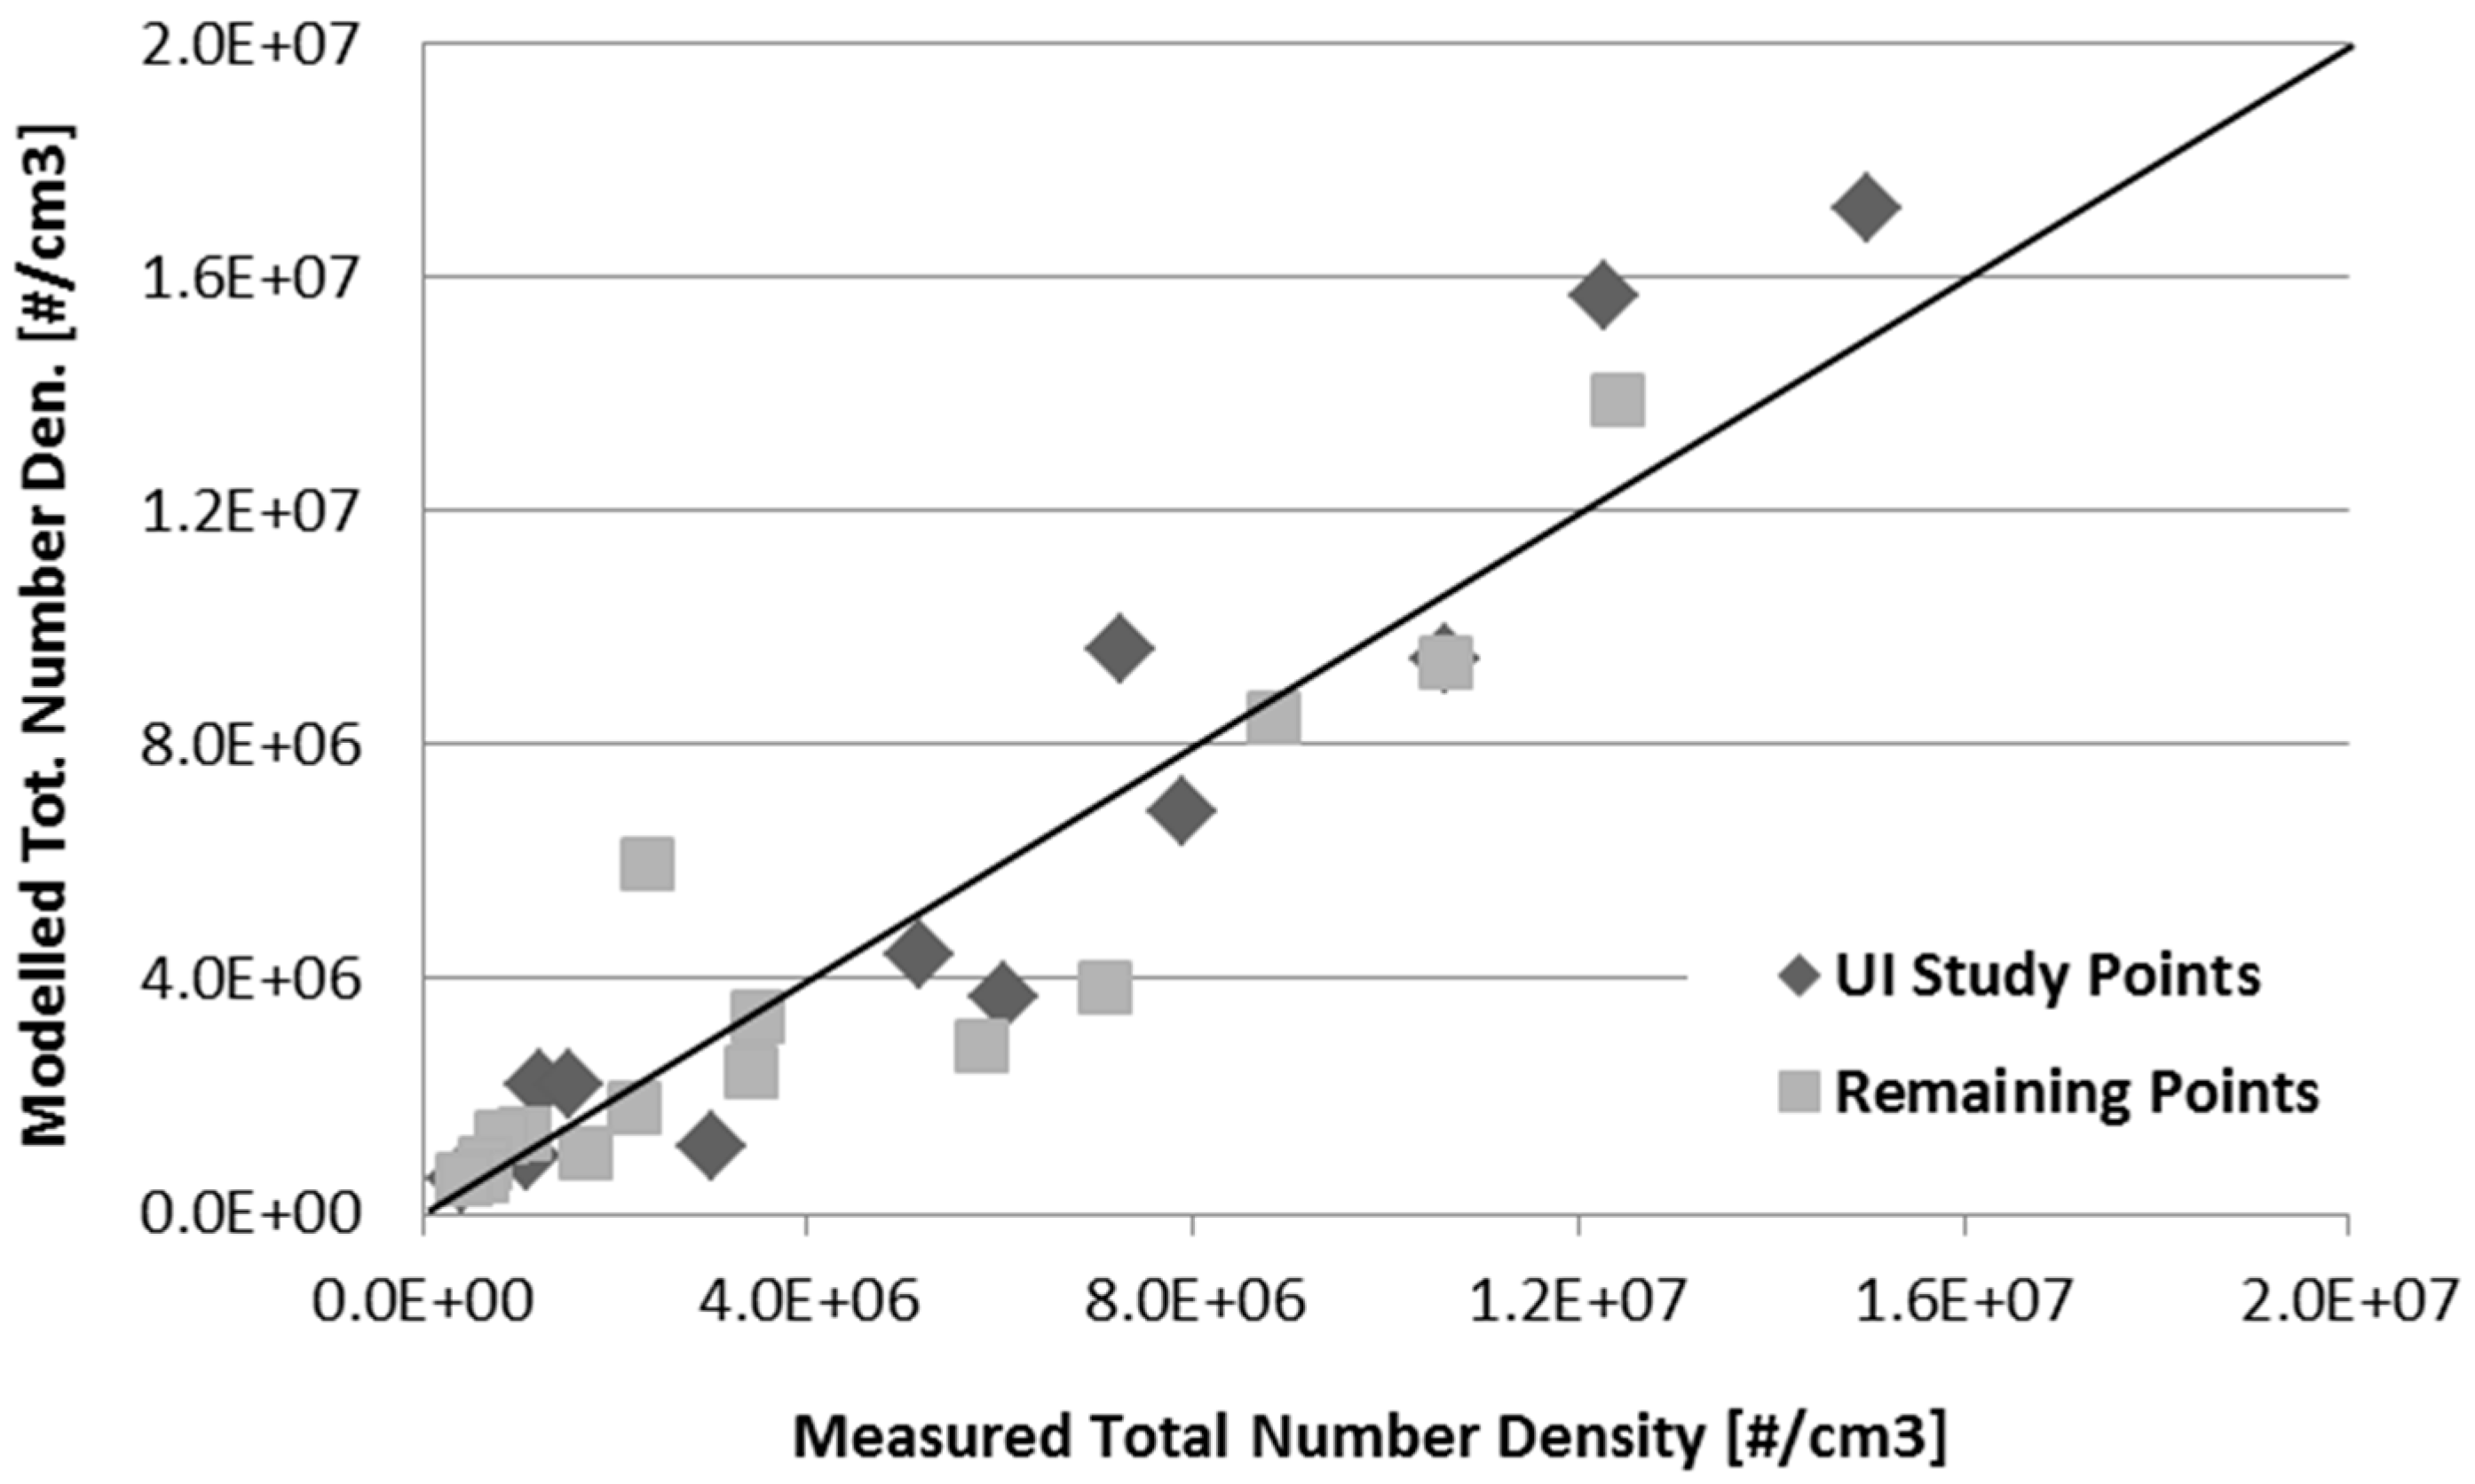
  • A simple two-equation functional model was developed which returns satisfactory qualitative predictions of total PNDen as a function of basic engine control variables. The initial model is unsophisticated and requires engine-specific calibration and further improvement; nevertheless, the approach identifies a potential effective route to perform real-time control of soot number output in modern GDI engines. Future work by the Authors will focus on improving this model and explore further potential correlations existing between engine varibales and average particle size.

Author Contributions

All five Authors contributed to conceiving and designing the investigation; Davide D. Sciortino carried out the experimental work and data analysis, and contributed to writing the paper; Fabrizio Bonatesta carried out data analysis and wrote the paper; Edward Hopkins carried out CFD work and data analysis; Changho Yang contributed to data analysis; Denise Morrey coordinated the activities.

Conflicts of Interest

The Authors declare no conflict of interest.

Nomenclature

AFRAir Fuel Ratio
ATDCAfter Top Dead Centre
BDCBottom Dead Centre
BMEPBrake Mean Effective Pressure
BTDCBefore Top Death Centre
CACrank Angle
CFConformity Factors
CFDComputational Fluid Dynamics
DMSDifferential Mobility Spectrometer
ECUEngine Control Unit
EGRExhaust Gas Recirculation
EOIEnd of Injection
EUEuropean Union
FMSFuel Measurement System
GDIGasoline Direct Injection
GMDGeometrical Mean Diameter
GPFGasoline Particulate Filters
IMEPIndicated Mean Effective Pressure
IVOIntake Valve Opening
PAHPolycyclic Aromatic Hydrocarbons
PEMSPortable Emission Measuring System
PMParticulate Matter
PMPParticle Measurement Programme
PNDenParticle Number Density
RDEReal Driving Emission
RMSERoot Mean Square Error
RONResearch Octane Number
SMDSauter Mean Diameter
SOIStart of Injection
STSpark Timing
TDCTop Dead Centre
uHCUnburned Hydrocarbons
UIϕUniformity Index of Equivalence Ratio
VVTVariable Valve Timing
WLTCWorldwide Harmonized Light Duty Vehicles Test Cycle

References

  1. Han, D.; Han, S.-K.; Han, B.-H.; Kim, W.-T. Development of 2.0 L Turbocharged DISI Engine for Downsizing Application; SAE Technical Paper 2007-01-0259; SAE International: Warrendale, PA, USA, 2007. [Google Scholar]
  2. Bonatesta, F.; Altamore, G.; Kalsi, J.; Cary, M. Fuel economy analysis of part-load variable camshaft timing strategies in two modern small-capacity spark ignition engines. Appl. Energy 2016, 164, 475–491. [Google Scholar] [CrossRef]
  3. Kleeberg, H.; Tomazic, D.; Lang, O.; Habermann, K. Future Potential and Development Methods for High Output Turbocharged Direct Injected Gasoline Engines; SAE Technical Paper 2006-01-0046; SAE International: Warrendale, PA, USA, 2006. [Google Scholar]
  4. Anderson, J.O.; Thundiyil, J.G.; Stolbach, A. Clearing the air: A review of the effects of particulate matter air pollution on human health. J. Med. Toxicol. 2012, 8, 166–175. [Google Scholar] [CrossRef] [PubMed]
  5. Raaschou-Nielsen, O.; Andersen, Z.J.; Beelen, R.; Samoli, E.; Stafoggia, M.; Weinmayr, G.; Hoffmann, B.; Fischer, P.; Nieuwenhuijsen, M.J.; Brunekreef, B. Air pollution and lung cancer incidence in 17 European cohorts: Prospective analyses from the European Study of Cohorts for Air Pollution Effects (ESCAPE). Lancet Oncol. 2013, 14, 813–822. [Google Scholar] [CrossRef]
  6. World Health Organization. The World Health Report 2002: Reducing Risks, Promoting Healthy Life; World Health Organization: Geneva, Switzerland, 2002. [Google Scholar]
  7. Demuynck, J.; Favre, C.; Bosteels, D.; Hamje, H.; Andersson, J. Real-World Emissions Measurements of a Gasoline Direct Injection Vehicle without and with a Gasoline Particulate Filter; SAE Technical Paper 2017-01-0985; SAE International: Warrendale, PA, USA, 2017. [Google Scholar]
  8. Wolff, H.; Perry, L. Policy Monitor: Trends in Clean Air Legislation in Europe: Particulate Matter and Low Emission Zones. Rev. Environ. Econ. Policy 2010, 4, 293–308. [Google Scholar] [CrossRef]
  9. Piock, W.; Hoffmann, G.; Berndorfer, A.; Salemi, P.; Fusshoeller, B. Strategies towards meeting future particulate matter emission requirements in homogeneous gasoline direct injection engines. SAE Int. J. Engines 2011, 4, 1455–1468. [Google Scholar] [CrossRef]
  10. Velji, A.; Yeom, K.; Wagner, U.; Spicher, U.; Roßbach, M.; Suntz, R.; Bockhorn, H. Investigations of the Formation and Oxidation of Soot inside a Direct Injection Spark Ignition Engine Using Advanced Laser-Techniques; SAE Technical Paper 2010-01-0352; SAE International: Warrendale, PA, USA, 2010. [Google Scholar]
  11. Jiao, Q.; Reitz, R.D. The effect of operating parameters on soot emissions in GDI engines. SAE Int. J. Engines 2015, 8, 1322–1333. [Google Scholar] [CrossRef]
  12. Giechaskiel, B.; Manfredi, U.; Martini, G. Engine exhaust solid sub-23 nm particles: I. Literature survey. SAE Int. J. Fuels Lubr. 2014, 7, 950–964. [Google Scholar] [CrossRef]
  13. Bonatesta, F.; Chiappetta, E.; La Rocca, A. Part-load particulate matter from a GDI engine and the connection with combustion characteristics. Appl. Energy 2014, 124, 366–376. [Google Scholar] [CrossRef]
  14. Price, P.; Stone, R.; Collier, T.; Davies, M. Particulate Matter and Hydrocarbon Emissions Measurements: Comparing First and Second Generation DISI with PFI in Single Cylinder Optical Engines; SAE Technical Paper 2006-01-1263; SAE International: Warrendale, PA, USA, 2006. [Google Scholar]
  15. Kittelson, D.B.; Arnold, M.; Watts, W. Review of Diesel Particulate Matter Sampling Methods: Final Report; University of Minnesota: Minneapolis, MN, USA, 1999. [Google Scholar]
  16. La Rocca, A.; Bonatesta, F.; Fay, M.; Campanella, F. Characterisation of soot in oil from a gasoline direct injection engine using Transmission Electron Microscopy. Tribol. Int. 2015, 86, 77–84. [Google Scholar] [CrossRef]
  17. Johansson, A.N.; Hemdal, S.; Dahlander, P. Experimental Investigation of Soot in a Spray-Guided Single Cylinder GDI Engine Operating in a Stratified Mode; SAE Technical Paper 2013-24-0052; SAE International: Warrendale, PA, USA, 2013. [Google Scholar]
  18. Andersson, J.; Collier, A.; Wedekind, B. Particle and Sulphur Species as Key Issue in Gasoline Direct Injection Diesel Exhaust; JSAE Technical Paper; Society of Automotive Engineers: Tokyo, Japan, 1999. [Google Scholar]
  19. Wang, X.; Huang, Z.; Zhang, W.; Kuti, O.A.; Nishida, K. Effects of ultra-high injection pressure and micro-hole nozzle on flame structure and soot formation of impinging diesel spray. Appl. Energy 2011, 88, 1620–1628. [Google Scholar] [CrossRef]
  20. Peckham, M.S.; Finch, A.; Campbell, B.; Price, P.; Davies, M.T. Study of Particle Number Emissions from a Turbocharged Gasoline Direct Injection (GDI) Engine Including Data from a Fast-Response Particle Size Spectrometer; SAE Technical Paper 2011-01-1224; SAE International: Warrendale, PA, USA, 2011. [Google Scholar]
  21. Sabathil, D.; Koenigstein, A.; Schaffner, P.; Fritzsche, J.; Doehler, A. The Influence of DISI Engine Operating Parameters on Particle Number Emissions; SAE Technical Paper 2011-01-0143; SAE International: Warrendale, PA, USA, 2011. [Google Scholar]
  22. Maricq, M.M.; Podsiadlik, D.H.; Brehob, D.D.; Haghgooie, M. Particulate Emissions from a Direct-Injection Spark-Ignition (DISI) Engine; SAE Technical Paper 1999-01-1530; SAE International: Warrendale, PA, USA, 1999. [Google Scholar]
  23. Pei, Y.-Q.; Qin, J.; Pan, S.-Z. Experimental study on the particulate matter emission characteristics for a direct-injection gasoline engine. Proc. Inst. Mech. Eng. Part D J. Autom. Eng. 2014, 228, 604–616. [Google Scholar] [CrossRef]
  24. Farron, C.; Matthias, N.; Foster, D.E.; Andrie, M.; Krieger, R.; Najt, P.; Narayanaswamy, K.; Solomon, A.; Zelenyuk, A. Particulate Characteristics for Varying Engine Operation in a Gasoline Spark Ignited, Direct Injection Engine; SAE Technical Paper 2011-01-1220; SAE International: Warrendale, PA, USA, 2011. [Google Scholar]
  25. Giovannoni, N.; Breda, S.; Paltrinieri, S.; D’Adamo, A.; Fontanesi, S.; Pulvirenti, F. CFD Analysis of the Effects of Fuel Composition and Injection Strategy on Mixture Preparation and Fuel Deposit Formation in a GDI Engine; SAE Technical Paper 2015-24-2408; SAE International: Warrendale, PA, USA, 2015. [Google Scholar]
  26. Choi, K.; Kim, J.; Myung, C.-L.; Lee, M.; Kwon, S.; Lee, Y.; Park, S. Effect of the mixture preparation on the nanoparticle characteristics of gasoline direct-injection vehicles. Proc. Inst. Mech. Eng. Part D J. Autom. Eng. 2012, 226, 1514–1524. [Google Scholar] [CrossRef]
  27. Barone, T.L.; Storey, J.M.; Youngquist, A.D.; Szybist, J.P. An analysis of direct-injection spark-ignition (DISI) soot morphology. Atmos. Environ. 2012, 49, 268–274. [Google Scholar] [CrossRef]
  28. Kayes, D.; Hochgreb, S. Mechanisms of particulate matter formation in spark-ignition engines. 1. Effect of engine operating conditions. Environ. Sci. Technol. 1999, 33, 3957–3967. [Google Scholar] [CrossRef]
  29. Huang, Y.; Hong, G.; Huang, R. Numerical investigation to the dual-fuel spray combustion process in an ethanol direct injection plus gasoline port injection (EDI + GPI) engine. Energy Convers. Manag. 2015, 92, 275–286. [Google Scholar] [CrossRef]
  30. Chen, L.; Zhang, Z.; Gong, W.; Liang, Z. Quantifying the effects of fuel compositions on GDI-derived particle emissions using the optimal mixture design of experiments. Fuel 2015, 154, 252–260. [Google Scholar] [CrossRef]
  31. Wang, C.; Xu, H.; Herreros, J.M.; Wang, J.; Cracknell, R. Impact of fuel and injection system on particle emissions from a GDI engine. Appl. Energy 2014, 132, 178–191. [Google Scholar] [CrossRef]
  32. Di Iorio, S.; Lazzaro, M.; Sementa, P.; Vaglieco, B.M.; Catapano, F. Particle Size Distributions from a DI High Performance SI Engine Fuelled with Gasoline-Ethanol Blended Fuels; SAE Technical Paper 2011-24-0211; SAE International: Warrendale, PA, USA, 2011. [Google Scholar]
  33. Daniel, R.; Tian, G.; Xu, H.; Wyszynski, M.L.; Wu, X.; Huang, Z. Effect of spark timing and load on a DISI engine fuelled with 2,5-dimethylfuran. Fuel 2011, 90, 449–458. [Google Scholar] [CrossRef]
  34. Catapano, F.; Di Iorio, S.; Lazzaro, M.; Sementa, P.; Vaglieco, B.M. Characterization of Ethanol Blends Combustion Processes and Soot Formation in a GDI Optical Engine; SAE Technical Paper 2013-01-1316; SAE International: Warrendale, PA, USA, 2013. [Google Scholar]
  35. Bermúdez, V.; Luján, J.M.; Climent, H.; Campos, D. Assessment of pollutants emission and aftertreatment efficiency in a GTDi engine including cooled LP-EGR system under different steady-state operating conditions. Appl. Energy 2015, 158, 459–473. [Google Scholar] [CrossRef]
  36. Kim, Y.; Kim, Y.; Jun, S.; Lee, K.H.; Rew, S.; Lee, D.; Park, S. Strategies for Particle Emissions Reduction from GDI Engines; SAE Technical Paper 2013-01-1556; SAE International: Warrendale, PA, USA, 2013. [Google Scholar]
  37. Hemdal, S.; Andersson, M.; Dahlander, P.; Ochoterena, R.; Denbratt, I. In-cylinder soot imaging and emissions of stratified combustion in a spark-ignited spray-guided direct-injection gasoline engine. Int. J. Engine Res. 2011, 12, 549–563. [Google Scholar] [CrossRef]
  38. Kim, J.; Kim, N.; Min, K. Numerical Investigation of Soot Emission in Direct-Injection Spark-Ignition Engines Using a Detailed Soot Model Framework; SAE Technical Paper 2016-01-0580; SAE International: Warrendale, PA, USA, 2016. [Google Scholar]
  39. Bonatesta, F.; Hopkins, E.; Francavilla, C.; Bell, D.; La Rocca, A. Combustion and Particulate Matter Formation in Modern GDI Engines: A Modelling Study Using CFD. In Proceedings of the FISITA 2016 World Automotive Congress, Busan, Korea, 26–30 September 2016; pp. 1–13. [Google Scholar]
  40. Jiao, Q.; Reitz, R.D. Modeling of Equivalence Ratio Effects on Particulate Formation in a Spark-Ignition Engine under Premixed Conditions; SAE Technical Paper 2014-01-1607; SAE International: Warrendale, PA, USA, 2014. [Google Scholar]
  41. Lucchini, T.; D’Errico, G.; Onorati, A.; Bonandrini, G.; Venturoli, L.; Di Gioia, R. Development and application of a computational fluid dynamics methodology to predict fuel-air mixing and sources of soot formation in gasoline direct injection engines. Int. J. Engine Res. 2014, 15, 581–596. [Google Scholar] [CrossRef]
  42. Mason, B.; Bradley, W.; Pezouvanis, A.; Ebrahimi, K. Repeatable steady-state measurement of particulate number emissions in engine experiments. Int. J. Engine Res. 2016, 17, 1108–1117. [Google Scholar] [CrossRef]
  43. Malaguti, S.; Fontanesi, S.; Cantore, G. Numerical characterization of a new high-pressure multi-hole GDI injector. In Proceedings of the ILASS-Europe 2010, 23rd Annual Conference on Liquid Atomization and Spray Systems, Brno, Czech Republic, 6–9 September 2010. [Google Scholar]
  44. Wang, Y. Validation of an Existing Mechanism for N-Heptane, Iso-Octane and Toluene Reference Fuels; Brandenburgische Technische Universitat: Cottbus, Germany, 2015. [Google Scholar]
  45. Star-CD. Star-CD Methodology Manual, version 4.22; CD-Adapco Siemens PLM: Detroit, MI, USA, 2014. [Google Scholar]
  46. Malaguti, S.; Bagli, G.; Montanaro, A.; Piccinini, S.; Allocca, L. Experimental and Numerical Characterization of Gasoline-Ethanol Blends from a GDI Multi-Hole injector by Means of Multi-Component Approach; SAE Technical Paper 2013-24-0002; SAE International: Warrendale, PA, USA, 2013. [Google Scholar]
  47. Rosa, N.G.; Villedieu, P.; Dewitte, J.; Lavergne, G. A new droplet-wall interaction model. In Proceedings of the 10th International Conference on Liquid Atomization and Spray Systems, Tokyo, Japan, 27 August–1 September 2006; pp. 29–32. [Google Scholar]
  48. Semiao, V.; Andrade, P.; da GraCa Carvalho, M. Spray characterization: Numerical prediction of Sauter mean diameter and droplet size distribution. Fuel 1996, 75, 1707–1714. [Google Scholar] [CrossRef]
  49. Huang, C.; Lipatnikov, A. Modelling of Gasoline and Ethanol Hollow-Cone sprays Using OpenFOAM; SAE Technical Paper 2011-01-1896; SAE International: Warrendale, PA, USA, 2011. [Google Scholar]
  50. Montanaro, A.; Allocca, L.; Ettorre, D.; Lucchini, T.; Brusiani, F.; Cazzoli, G. Experimental characterization of high-pressure impinging sprays for CFD modeling of GDI engines. SAE Int. J. Engines 2011, 4, 747–763. [Google Scholar] [CrossRef]
  51. Yi, Y.; DeMinco, C.M. Numerical Investigation of Mixture Preparation in a GDI Engine; SAE Technical Paper 2006-01-3375; SAE International: Warrendale, PA, USA, 2006. [Google Scholar]
  52. Whelan, I.C. A Study of Particulate Matter Emissions from Gasoline Direct Injection Engines; University College Dublin: Dublin, Ireland, 2013. [Google Scholar]
  53. Bonatesta, F.; La Rocca, S.; Hopkins, E.; Bell, D. Application of Computational Fluid Dynamics to Explore the Sources of Soot Formation in a Gasoline Direct Injection Engine; SAE Technical Paper 2014-01-2569; SAE International: Warrendale, PA, USA, 2014. [Google Scholar]
  54. Mätzing, H.; Baumann, W.; Bockhorn, H.; Paur, H.-R.; Seifert, H. Detection of electrically charged soot particles in laminar premixed flames. Combust. Flame 2012, 159, 1082–1089. [Google Scholar] [CrossRef]
  55. Wong, D.; Whitesides, R.; Schuetz, C.; Frenklach, M.; Bockhorn, H.; D’Anna, A.; Sarofim, A.; Wang, H. Combustion Generated Fine Carbonaceous Particles; KIT Scientific Publishing: Karlsruhe, Germany, 2007; pp. 275–285. [Google Scholar]
  56. Xu, Z.; Li, X.; Guan, C.; Huang, Z. Effects of injection timing on exhaust particle size and nanostructure on a diesel engine at different loads. J. Aerosol Sci. 2014, 76, 28–38. [Google Scholar] [CrossRef]
Figure 1. Schematic of the engine test-rig.
Energies 10 01408 g001
Figure 2. Experimental and CFD test conditions.
Energies 10 01408 g002
Figure 3. Engine control and combustion parameters as a function of engine speed (rpm) and BMEP (bar). (a) Start of injection; (b) injector fuel mass flow rate; (c) mixing time (time interval between EOI and ST); (d) spark ignition timing; (e) in-cylinder gas temperature at maximum pressure; and (f) exhaust gas temperature.
Energies 10 01408 g003
Figure 4. Measured size-resolved particle number density distributions for all the experimental conditions investigated in this work. Engine speed is varied between 1600 and 4000 rpm, at each of four engine torque levels (30, 60, 90, 120 Nm).
Energies 10 01408 g004
Figure 5. Total particle number density (a) and geometrical mean diameter (GMD) (b) as functions of engine load, at each of the engine speeds investigated.
Energies 10 01408 g005
Figure 6. Frequency distribution of number density and mass concentration upon five particle diameter bins.
Energies 10 01408 g006
Figure 7. Total particle number density plotted as a function of modelled in-cylinder gas temperature at the location of maximum pressure. For ease of visualisation, the data are grouped by fixed engine speed and split into two plots. (a) Refers to engine speeds between 1600 and 2800 rpm; (b) refers to engine speeds between 3200 and 4000 rpm. Some outliers have been removed.
Energies 10 01408 g007
Figure 8. GMD as a function of modelled gas temperature at the location of peak pressure.
Energies 10 01408 g008
Figure 9. Total particle number density (a) and GMD (b) as functions exhaust gas temperature.
Energies 10 01408 g009
Figure 10. CFD images of the mixture preparation process (liquid droplet distribution and equivalence ratio distribution) at various CA locations for three representative engine running conditions.
Energies 10 01408 g010
Figure 11. (a) Total particle number density as a function of CFD-modelled uniformity index of equivalence ratio calculated at spark timing; and (b) normalised total number density as a function of gas temperature calculated at the location of peak pressure.
Energies 10 01408 g011
Figure 12. Comparison between CFD-modelled and empirical levels of charge homogeneity (uniformity index of equivalent ratio) at spark timing.
Energies 10 01408 g012
Figure 13. Correlation between measured total particle number density and spark timing uniformity index calculated through the empirical model.
Energies 10 01408 g013
Figure 14. Comparison of measured and modelled levels of total particle number density for the running conditions investigated in this work.
Energies 10 01408 g014
Table 1. GDI test-engine specifications.
CharacteristicUnitsValue/Description
Boremm77
Strokemm85.8
Compression ratio-10.5:1
Connecting Rod Lengthmm138.4
Combustion chamber-4-Valve, central spark plug, pent-roof design
Engine type-In-line 4-cylinder
Cycle-4-Stroke spark ignition
Fuel injector system-Direct injection common rail
Fuel injectors-Side-mounted, wall-guided spray
Maximum injection pressurebar120
Table 2. Reference fuel properties.
Characteristic/ComponentUnitsMinMax
RON-95-
MON-85-
Aromaticsvol %2935
Olefinsvol %313
Saturatesvol %--

