Article

Numerical Analysis of the Combustion and Emission Characteristics of Diesel Engines with Multiple Injection Strategies Using a Modified 2-D Flamelet Model

Department of Mechanical and Aerospace Engineering, Seoul National University, 1 Gwanak-ro, Gwanak-gu, Seoul 08826, Korea
*
Author to whom correspondence should be addressed.
Energies 2017, 10(9), 1292; https://doi.org/10.3390/en10091292
Submission received: 2 August 2017 / Revised: 18 August 2017 / Accepted: 27 August 2017 / Published: 29 August 2017

Abstract

:
The multiple injection strategy has been widely used in diesel engines to reduce engine noise, NOx and soot formation. Fuel injection developments such as the common-rail and piezo-actuator system provide more precise control of the injection quantity and time under higher injection pressures. As various injection strategies become accessible, it is important to understand the interaction of each fuel stream and following combustion process under the multiple injection strategy. To investigate these complex processes quantitatively, numerical analysis using CFD is a good alternative to overcome the limitation of experiments. A modified 2-D flamelet model is further developed from previous work to model multi-fuel streams with higher accuracy. The model was validated under various engine operating conditions and captures the combustion and emissions characteristics as well as several parametric variations. The model is expected to be used to suggest advanced injection strategies in engine development processes.

1. Introduction

The diesel engine has been widely used because of its great torque and high thermal efficiency with direct injection under a higher compression ratio [1]. However, a high temperature region causes an increase in NOx emissions, and the inhomogeneous mixture field caused by the direct injected fuel produces soot emissions. In addition, the higher pressure rise rate during the combustion process increases the noise and vibrations, which can damage the engine. There have been many attempts to overcome these limitations for decades, such as the advanced combustion concept [2,3,4] and development of after-treatment system [5,6]. The multiple injection strategy was additionally suggested as an alternative where a small amount of pilot injections can heat the combustion chamber and alter the turbulent mixing fields that affect the combustion of the main fuel stream and make mixture fields more homogenous [7,8,9,10]. In this situation, development of injection technologies could facilitate more precise control of the injection rate and higher injection pressure [11,12]. Development of the injection system is an ongoing process; hence, it provides more precise control of the fuel quantity with duration and has the potential to simultaneously reduce the emissions under the same torque.
To further improve the engine efficiency and emissions level using multiple injection strategies, it is important to understand the interaction of each fuel stream, which may include an effect of turbulent fields, and the combustion process that follows. Abundant fundamental research on the combustion and emissions behavior under multiple injection strategies exists [13,14,15,16,17]; however, most of these studies were based on an experimental approach which has limitations in the quantitative analysis of in-cylinder phenomena.
CFD simulation is a good option for the analysis of these complex systems due to the increased computing power, and can provide quantitative information and intuitive insights into the combustion process. Several numerical approaches have been proposed to simulate multi-fuel systems by direct calculation using simple reactions [18,19,20]. The laminar flamelet concept [21] is an approach in which the instantaneous solution of flamelet equations is related to the corresponding turbulent flow fields. Since the single flamelet concepts do not represent the overall flame structures when multiple injection events are present during a single cycle, the 2-D flamelet model was introduced to describe both fuel streams [22] using different mixture fractions. The dimensional extension for the three-feed system could be applied using three-scale asymptotic analysis, i.e., one for each of the two fuel streams and another for the air stream. In their research, the simulation results capture the pressure and heat release rate of the experiment where split injection was applied. Although it is significant that it was the first suggestion of resolving multiple fuel streams using Representative Interactive Flamelet (RIF) concepts [23], an increase in computational complexity requires a large amount of CPU time to solve the original 2-D flamelet model. The modified 2-D flamelet model [24] could drastically reduce CPU time without any loss of accuracy by simplifying the region where it is difficult for the reaction to occur. Although the model agrees with the experimental results for ignition delay time in a constant-volume vessel, a more specific evaluation of the robustness and availability of the model is required to apply to the engine conditions. Although Kim et al. [25] suggested a different method to solve these regions that showed good agreement with the pressure and heat release rate of the engine experimental results, the lack of validated conditions and a quantitative comparison with the previous method remains a challenge.
The original 2-D flamelet model was extended to mimic a combustion process using more than three fuel streams from different times [26], so it is applicable to the development process of commercial engines. The concept of the work in [26] is to introduce a method called the ‘collapse method’ where the 2-D flamelet solution can be reduced to a single dimension just before the third injection. This is because it can be considered to have already reached a steady-state if there is sufficient time between the second and third injection.
Additionally, the effect of introducing the joint scalar dissipation rate ( χ 12 ) in the original 2-D flamelet model has been investigated using DNS approaches, which, for simplicity, are not used in the present work [27,28].
Based on previous research, the objective of this study is to investigate the physical mechanism of the combustion process of multiple injection using the modified 2-D flamelet model with the introduction of the collapse method. Improvements over the previous work on modified 2-D flamelet models will be shown by comparing the procedures of flame propagation as well as computational time. This paper describes a fundamental investigation of the feasibility and potential of the model being applicable in engine conditions, which presents a direction to obtain optimal injection strategies. Beginning with introducing the development process of the modified 2-D flamelet model, quantitative analysis under various engine operating conditions using the model will be provided. In addition, the applicability of the model to multi-fuel systems will be investigated by describing the computational results under changing engine parameters and suggesting advanced injection strategies that can reduce both NOx and PM emissions.

2. Model Framework

2.1. Modified 2-D Flamelet Model

Much of the numerical research using the laminar flamelet concept shows successful results in diesel engine simulations [29,30,31,32]. Starting with the laminar flamelet model of a single mixture fraction, the 2-D flamelet model [22], which is described by transforming the physical coordinate of each mixture fraction Z i to the coordinate that is normal to the flame surface, was introduced. With a unity Lewis number, the original 2-D flamelet equations for the species mass fraction and temperature are shown in Equations (1) and (2). The scalar dissipation rates for each mixture fraction are defined by Equation (3), where D is a scalar diffusive coefficient for each mixture fraction:
ρ Y i t ρ 2 ( χ 1 2 Y i Z 1 2 + χ 2 2 Y i Z 2 2 ) m ˙ i = 0
ρ T t ρ 2 ( χ 1 2 T Z 1 2 + χ 2 2 T Z 2 2 ) ρ 2 c p T Z 1 { χ 1 c p Z 1 + i c p , i ( χ 1 Y i Z 1 ) } ρ 2 c p T Z 2 { χ 2 c p Z 2 + i c p , i ( χ 2 Y i Z 2 ) } = 1 c p ( p t q ˙ r i h i m ˙ i )
χ 1 = 2 D ( Z 1 x α ) 2 , χ 2 = 2 D ( Z 2 x α ) 2
To avoid numerical problems due to a non-square solution domain, new governing equations for species and temperature were derived where the solution coordinates of Equations (1) and (2) are transformed by introducing new parameters Z and y [22], which are defined by Equations (4) and (5):
ρ Y i t ρ χ 1 2 L e i ( 2 Y i Z 2 2 y Z 2 Y i Z y + 2 y Z 2 Y i y + 2 y 2 Z 2 2 Y i y 2 ) ρ χ 2 2 L e i ( 2 Y i Z 2 + 2 ( 1 y ) Z 2 Y i Z y 2 ( 1 y ) Z 2 Y i y + 2 ( 1 y ) 2 Z 2 2 Y i y 2 ) m ˙ i = 0
ρ T t ρ χ 1 2 L e i ( 2 T Z 2 2 y Z 2 T Z y + 2 y Z 2 T y + y 2 Z 2 2 T y 2 ) ρ χ 2 2 L e i ( 2 T Z 2 + 2 ( 1 y ) Z 2 T Z y 2 ( 1 y ) Z 2 T y + ( 1 y ) 2 Z 2 2 T y 2 ) ρ c p ( T Z y Z T y ) ( k c p , k L e k χ 1 2 ( Y k Z y Z Y k y ) + χ 1 2 ( c p Z y Z c p y ) ) ρ c p ( T Z + ( 1 y ) Z T y ) ( k c p , k L e k χ 2 2 ( Y k Z + ( 1 y ) Z Y k y ) + χ 2 2 ( c p Z + ( 1 y ) Z c p y ) ) = 1 c p ( p t q ˙ r k h k m ˙ k )
Lim et al., introduced a modified description of the 2-D flamelet model to reduce the CPU time for solving the governing equation by simplifying the calculation process in quite rich and lean regions, i.e., Z > 0.08 for rich region and Z < 0.03 for lean region [24]. Their solution was replaced with the steady-state solution of 1-D flamelet equations where y = 0 if the specific condition is satisfied. To avoid a singularity problem at each borderline where Z = 0.033 and 0.08, the governing equation regarding the y-direction is solved as shown in Equations (6) and (7):
ρ Y i t ρ χ 1 2 L e i ( 2 y Z 2 Y i y + y 2 Z 2 2 Y i y 2 ) ρ χ 2 2 L e i ( 2 ( 1 y ) Z 2 Y i y + ( 1 y ) 2 Z 2 2 Y i y 2 ) m ˙ i = 0
ρ T t ρ χ 1 2 L e i ( 2 y Z 2 T y + y 2 Z 2 2 T y 2 ) ρ χ 2 2 L e i ( 2 ( 1 y ) Z 2 T y + ( 1 y ) 2 Z 2 2 T y 2 ) ρ c p ( y Z T y ) ( k c p , k L e k χ 1 2 ( y Z Y k y ) + χ 1 2 ( y Z c p y ) ) ρ c p ( ( 1 y ) Z T y ) ( k c p , k L e k χ 2 2 ( ( 1 y ) Z Y k y ) + χ 2 2 ( ( 1 y ) Z c p y ) ) = 1 c p ( p t q ˙ r k h k m ˙ k )
Each scalar dissipation rate conditioned at the stoichiometric mixture fraction was modeled by applying the presumed joint beta PDF of variable Z and y to the instantaneous scalar dissipation rates [22,33,34]:
χ s t , 1 = χ ˜ 1 0 1 0 1 f 1 ( Z , y ) f 1 ( Z s t , y = 0 ) P ˜ ( Z , y ) d Z d y , χ s t , 2 = χ ˜ 2 0 1 0 1 f 2 ( Z , y ) f 2 ( Z s t , y = 1 ) P ˜ ( Z , y ) d Z d y
To apply the flamelet approach in a RANS simulation, the conditioned scalar dissipation rate was averaged on the surface of the stoichiometric mixture, and input to the governing equations at each time step:
χ ^ s t , j = V χ ^ s t , j 3 / 2 P ˜ ( Z s t , y ) d V V χ ^ s t , j 1 / 2 P ˜ ( Z s t , y ) d V
The scalar dissipation rates denoted in Equations (4)–(7) are defined by Equation (10), which was introduced by Girimaji et al. [35], where a 1 and a 2 are determined by the scalar dissipation rate at the stoichiometric mixture fraction as described in Equation (8):
χ 1 ( Z 1 , Z 2 ) = a 1 π ( 1 Z 2 ) 2 exp { 2 [ e r f c 1 ( 2 Z 1 / ( 1 Z 2 ) ) ] 2 } χ 2 ( Z 1 , Z 2 ) = a 2 π ( 1 Z 1 ) 2 exp { 2 [ e r f c 1 ( 2 Z 2 / ( 1 Z 1 ) ) ] 2 }

2.2. Further Modification of 2-D Flamelet Model

To be applied to the various strategies in engine conditions, the assumptions in the modified 2-D flamelet model are estimated, and another method is suggested in this section. Two conditions using dual injection strategies were selected for evaluation, i.e., one condition has a notably short dwell time, and the other condition is in the situation where a small amount of fuel mass is injected at both injection events.
Simulation results of temperature and NO emissions for each dwell time (100 μs, 400 μs) are provided in Figure 1, where the pilot injection followed by the main injection are implemented with different dwell times in a simple 3-D domain. As the dwell time decreases, the flamelet solutions of the first fuel spray do not have time to reach steady-state before the start of the second injection, which may cause more discrepancies in the solutions than that of the original 2-D flamelet model. Figure 1a,c show that the temperature and NO emissions results of the modified 2-D model are less than those of other models because the solutions in regions where Z < 0.033 and Z > 0.08 cannot be replaced with the steady-state solutions.
Problems are more significant when a small amount of fuel is injected twice at both injection events such as two-pilot injection under diesel engine conditions. If the ambient temperature is decreased with the EGR stream supplied, the steady-state solution of the first stream cannot replace the solution of rich and lean regions because the temperature cannot exceed 2000 K under some conditions, as depicted in Figure 2b. Additionally, the dwell time has significant effects on the combustion characteristics because the first fuel stream requires more time due to dummy species and lowered ambient temperature. As a result, the flame structures of the modified 2-D model are different from the original model, as shown in Figure 2a.
To overcome these limitations, the flamelet solutions in the rich and lean regions are interpolated by each fuel stream at y = 0 and y = 1, respectively. Because mass and heat are transferred from the first fuel stream, where y = 0, to the second fuel stream where y = 1, it is more realistic to reflect the solutions of both fuel sides rather than to replace the steady-state 1-D flamelet solutions. Figure 1 and Figure 2 show that the interpolation method is a good approximation which is more similar to the results of the original 2-D flamelet model than previous simplifications.

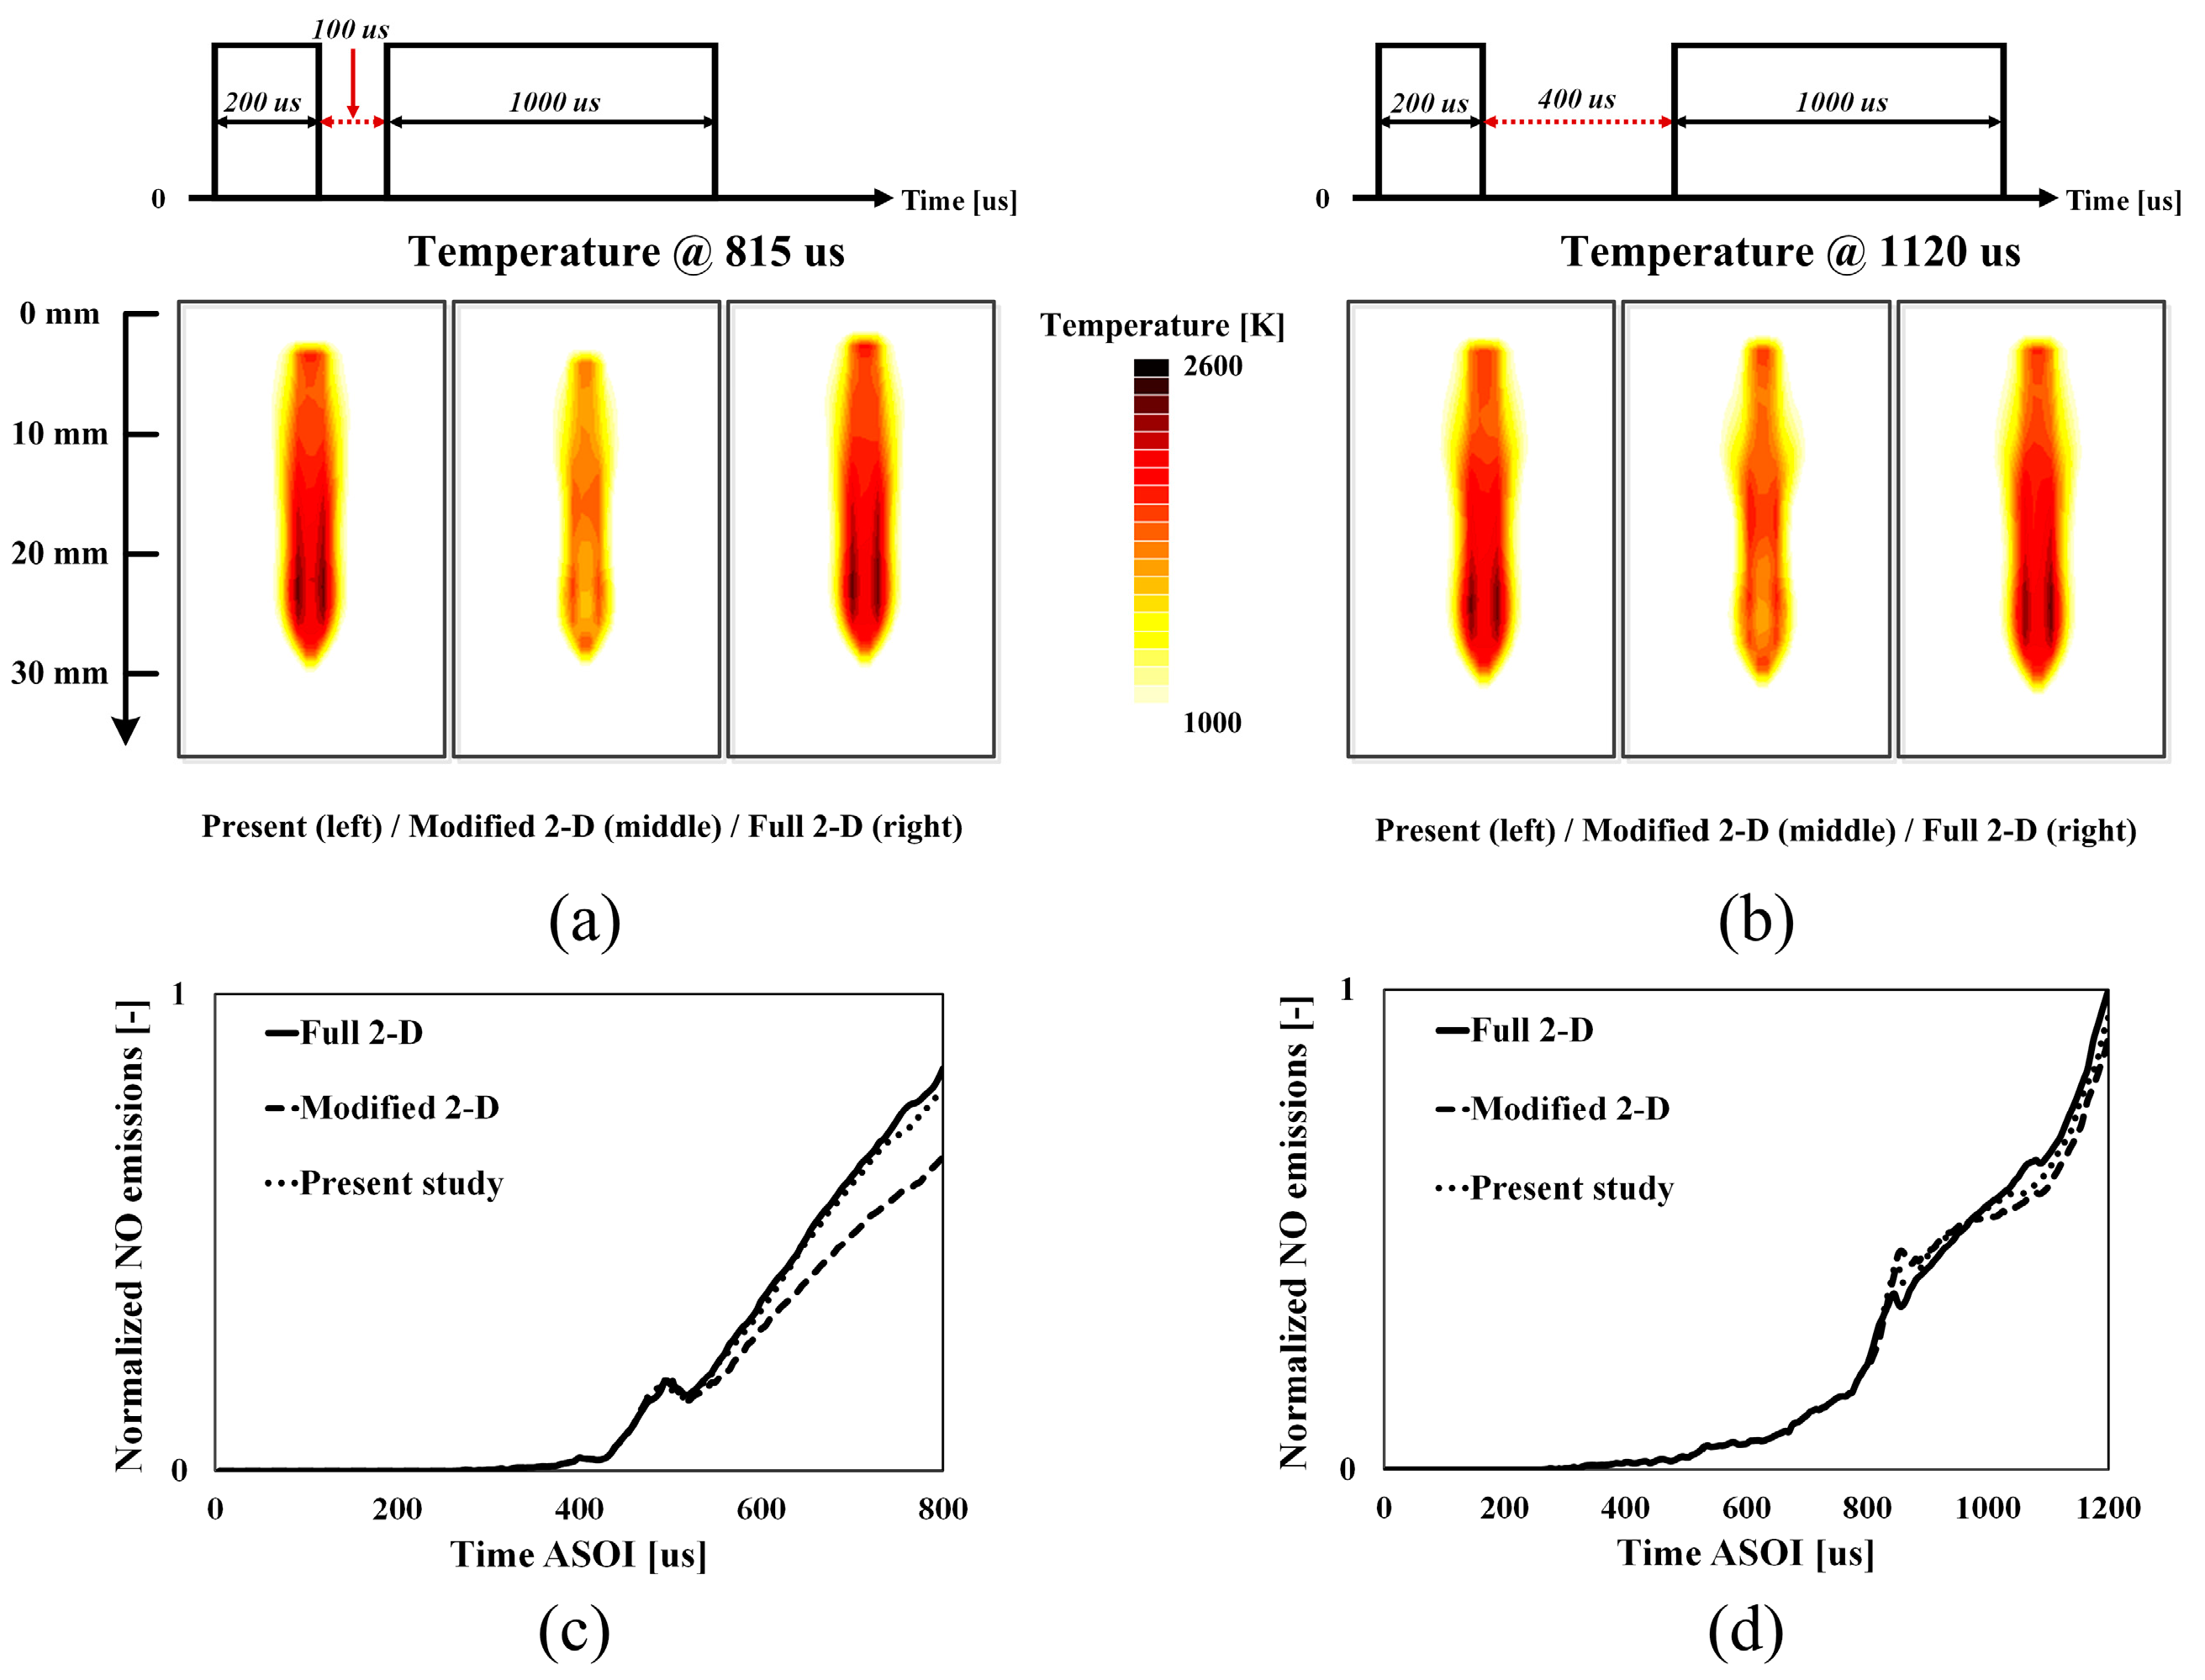
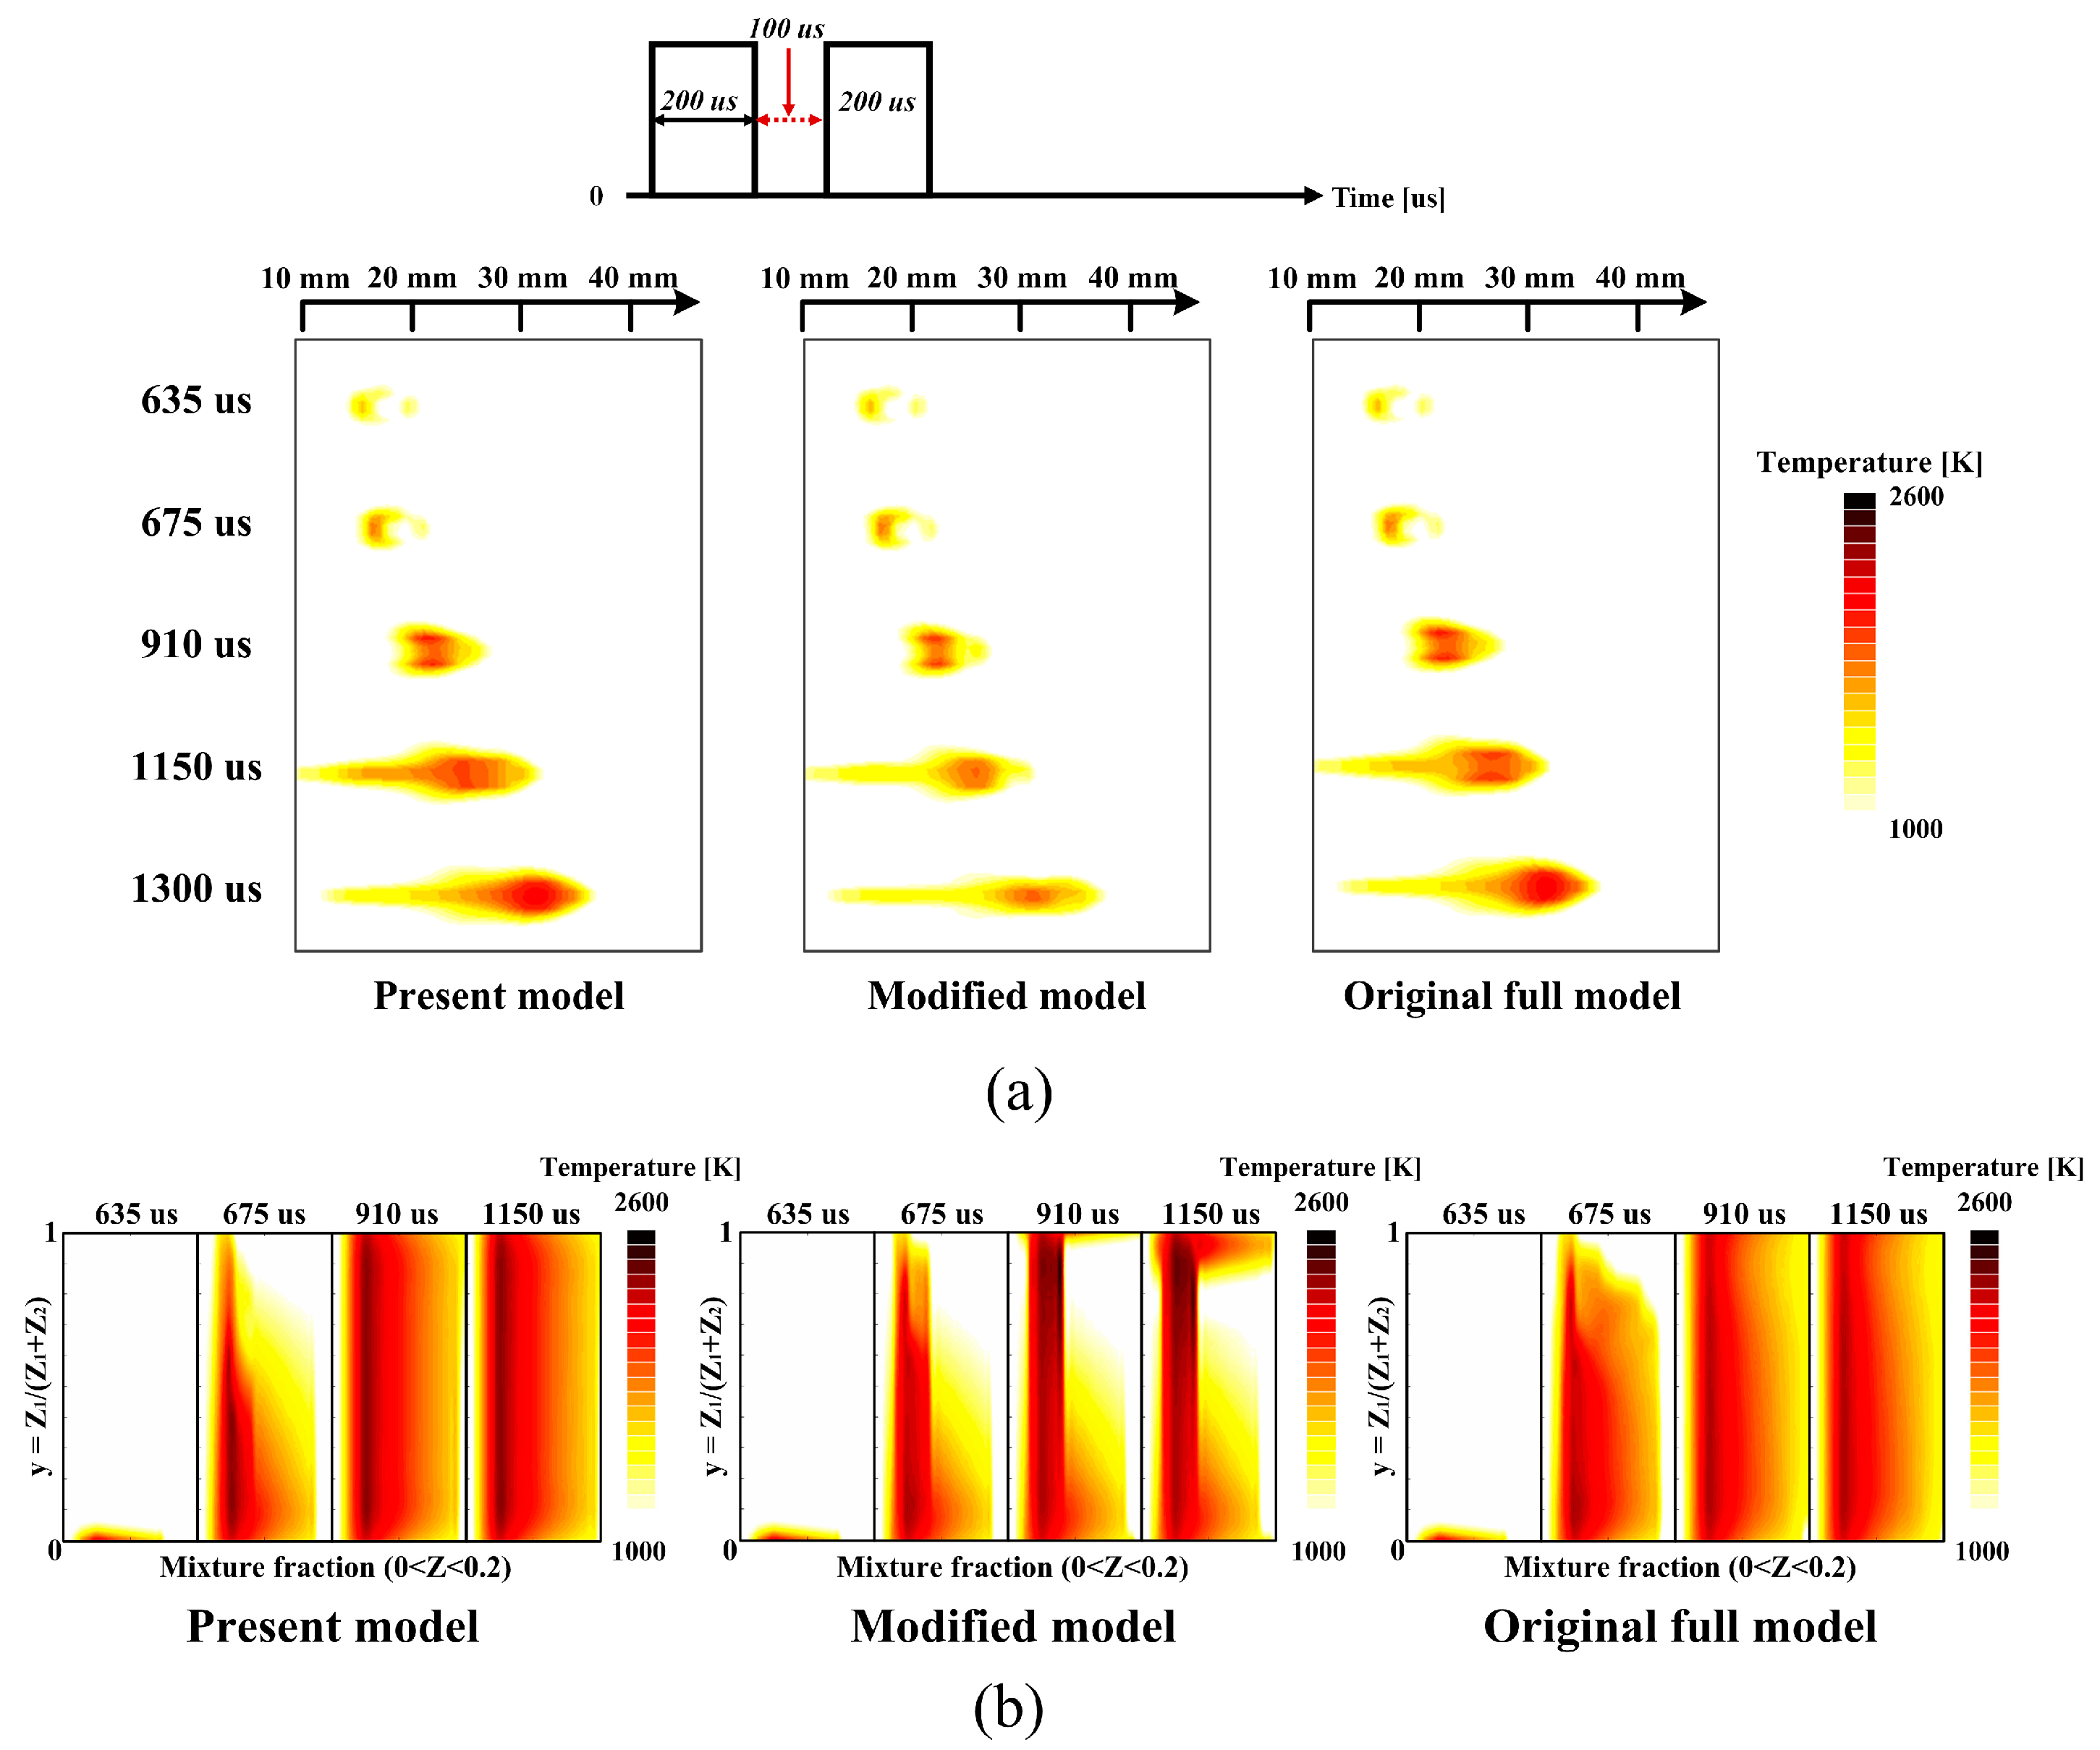
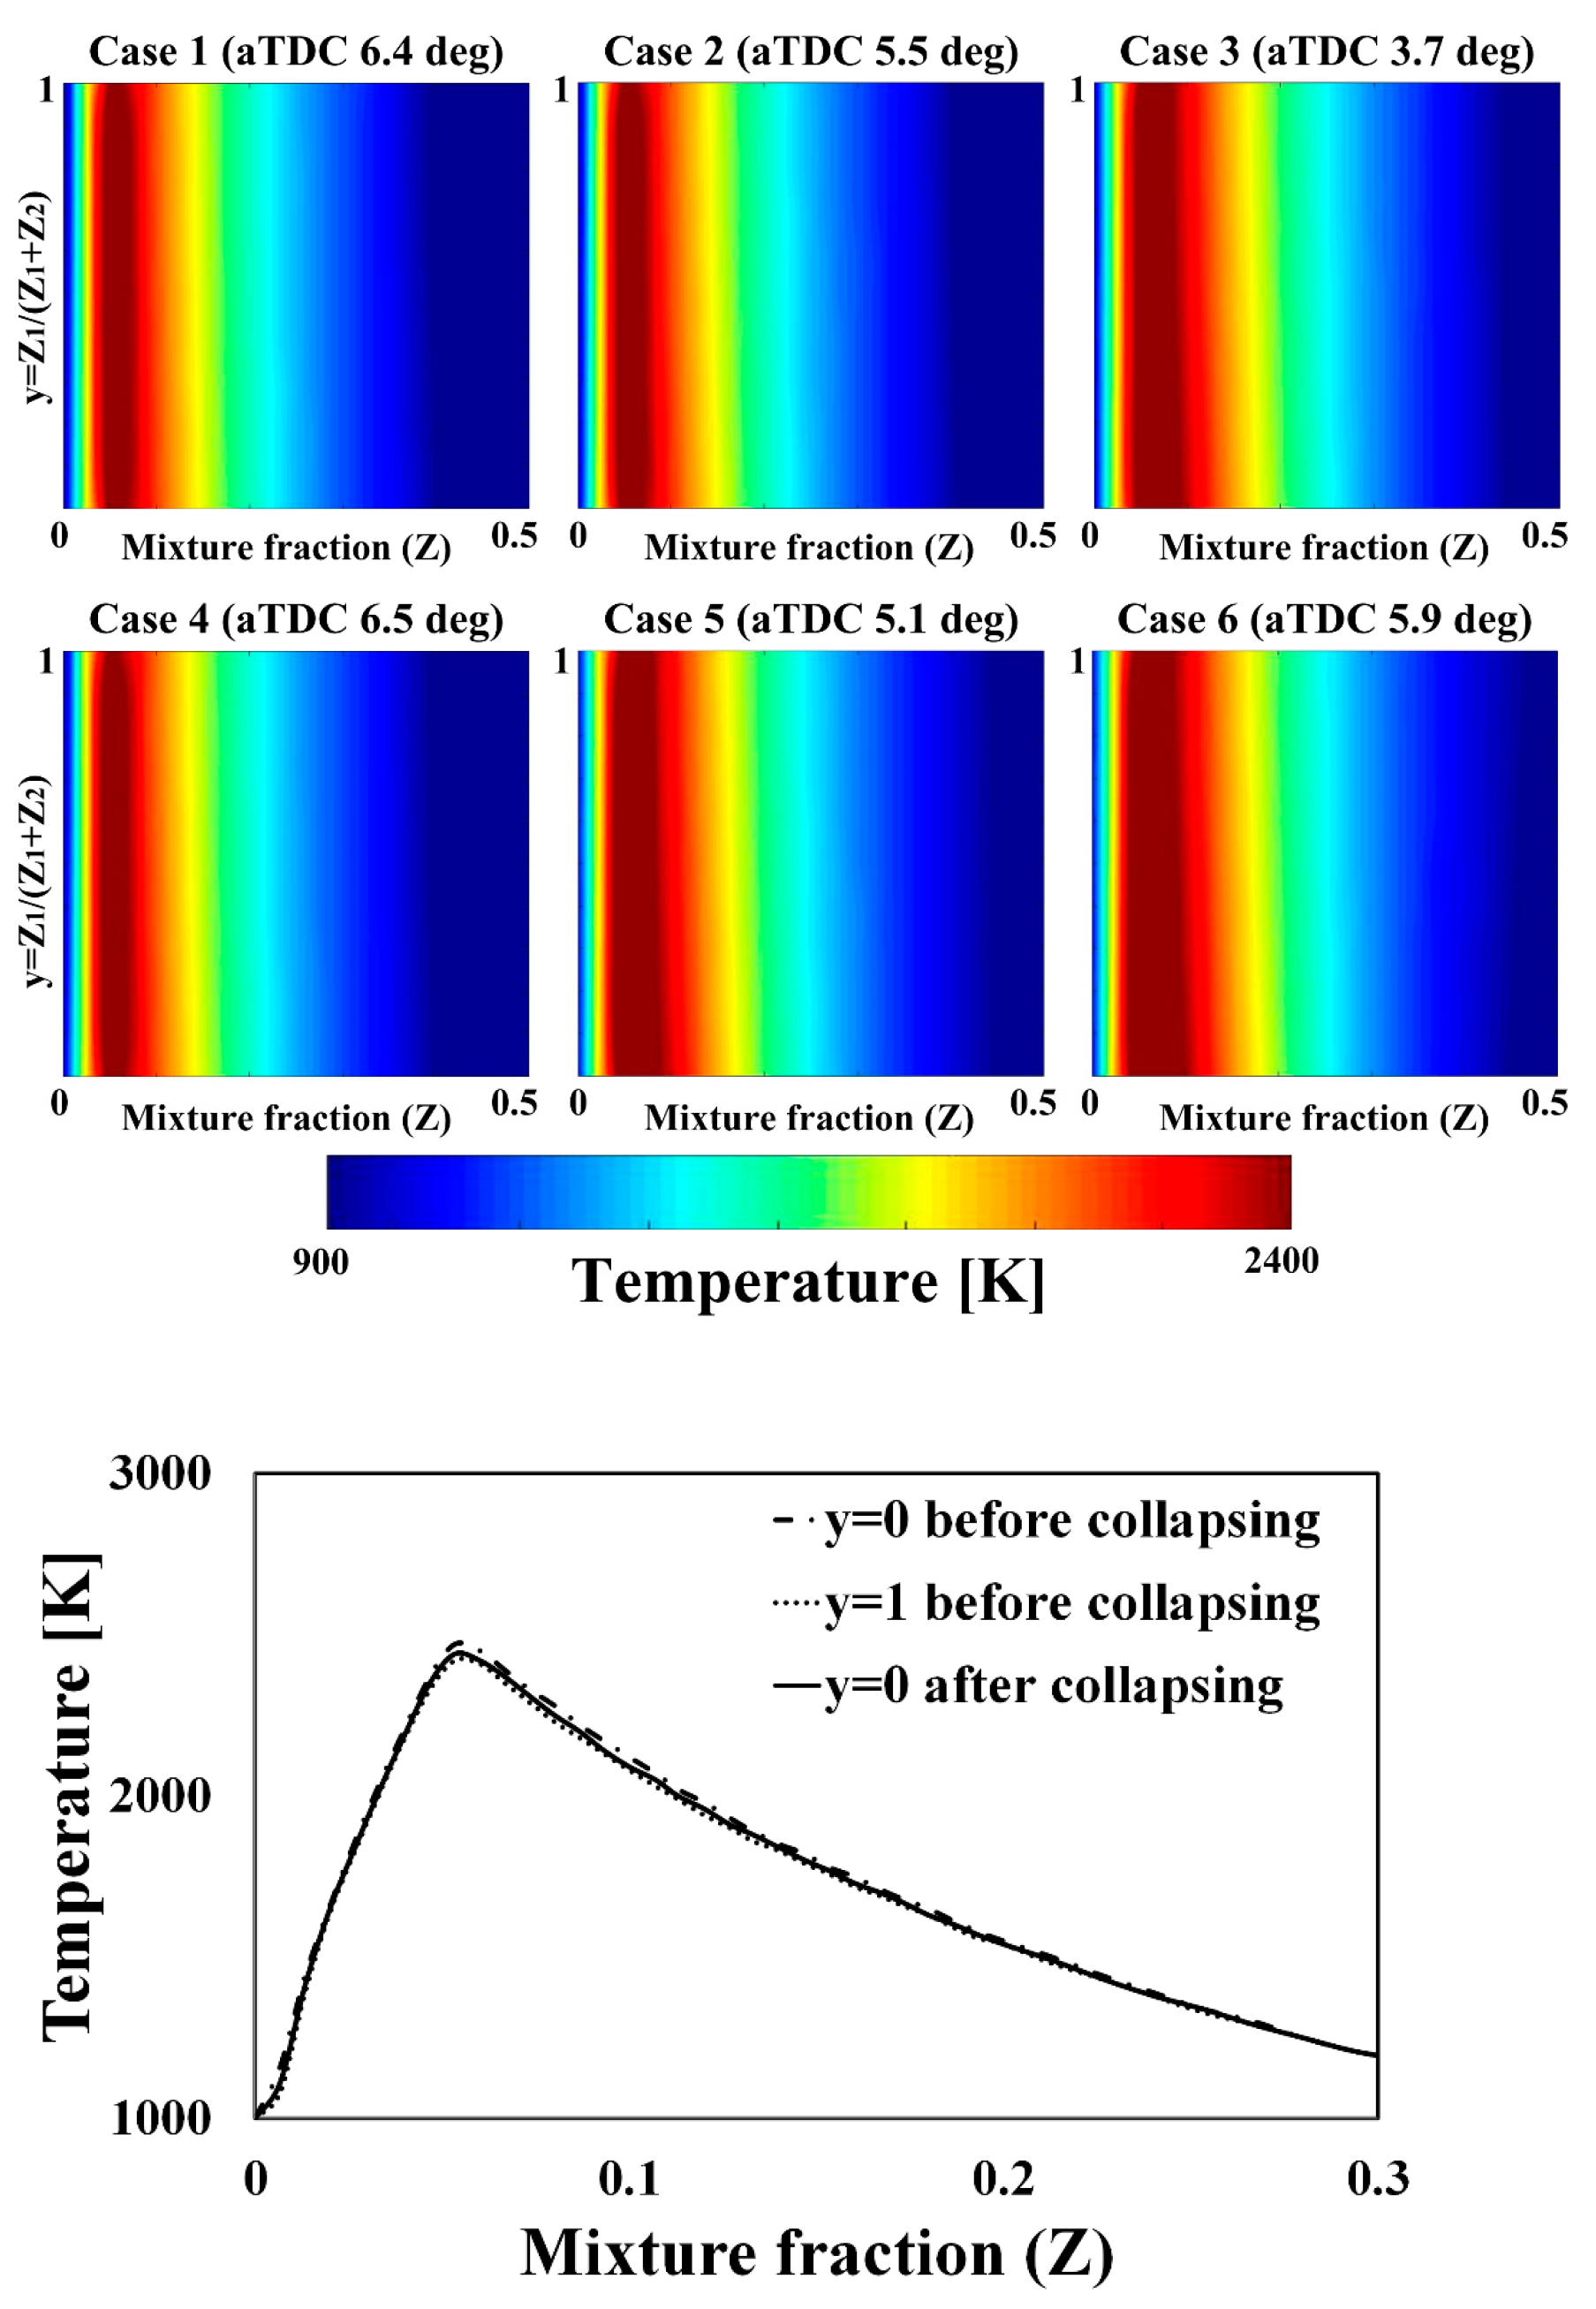
2.3. Collapse of 2-D Flamelet Solution

Felsch et al. [26] introduced a method of collapsing the 2-D flamelet solutions to mimic another fuel stream when there are more than three injection events. Because the 2-D flamelet approach theoretically resolves two fuel streams, 2-D flamelet solutions are collapsed into a solution with a single dimension just before the start of the third injection. The following solution is obtained from interpolating the 2-D flamelet solution at each fuel stream weighted by the mass fraction of each fuel mass, as shown in Equation (11). This assumption is only valid when two fuels reach a nearly steady-state before the third injection so that the collapsed solution is similar to the previous state. Most of the operating conditions in the present study use multiple injection strategies satisfying those situations, as discussed later:
Y i ( Z ) = V ρ Z ˜ 1 d V V ρ ( j = 1 N Z ˜ j ) d V Y i ( Z = Z 1 ) + V ρ Z ˜ 2 d V V ρ ( j = 1 N Z ˜ j ) d V Y i ( Z = Z 2 )

2.4. Linking with CFD Solver

The modified 2-D flamelet model developed in this research was linked with the solution of instantaneous flow field. First, the CFD solver provides pressure and mixture fraction information to calculate the scalar dissipation rate. Then, the flamelet model is used to solve the governing equations of species and temperature where the chemical database was obtained from the CHEMKIN library [36]. Resultant solutions were weighted by presumed joint-PDF distribution and returned to the CFD solver. The detailed calculation procedures are the same as those used in previous research [22,26].

2.5. Modeling Strategies for Diesel Engine Simulation

An overall calculation procedure of the model is presented in this section by combining the previous concepts. The modelling strategy for the case of quadruple injection is shown as an example and the application of the model is changed by four different periods as shown below:
  • From the start of the first injection until the start of the second injection
  • From the start of the second injection until two mixture fields are merged
  • From the start of the merging of mixture fields until the start of the third injection
  • Moment just before the third injection
A multiple injection event begins with the start of the first injection. In this case, there is a single fuel stream which can be described using the conventional 1-D flamelet model (phase (1)). The 2-D flamelet approach is applied once the second fuel injection begins. Despite the fact that there are two fuel streams in the computational domain, the governing equations are not solved because a second fuel spray is physically separated from the existing fuel stream. Alternatively, two 1-D flamelet solutions relevant to each fuel stream are linearly interpolated in phase (2). A newly developed modified 2-D flamelet model is applied when two mixture fields are considered merged, which can be determined by interaction parameter ‘I’ [22] as described in Equation (12). When the third fuel injection starts, the instantaneous solution of the modified 2-D flamelet model is collapsed into a one-dimensional solution so another fuel spra is not faced. Phases (2)–(4) are repeated for the following injection:
I = V ρ y = Δ y 1 Δ y Z = Z s t Δ Ζ Z s t + Δ Ζ P ˜ ( Z , y ; x α , t ) d Z d y d V V ρ y = 0 1 Z = Z s t Δ Ζ Z s t + Δ Ζ P ˜ ( Z , y ; x α , t ) d Z d y d V

3. Experimental and Simulation Setup

3.1. Experimental Setup

The experimental results were obtained using a light-duty diesel engine with 1.6 L of displacement volume equipped with a turbocharger and four cylinders. The compression ratio is 17.3 and further specifications of the test engine are listed in Table 1. The engine test bed was attached to a 340 KW AC dynamometer (AVL, Graz, Austria) controlled under steady-state operation with a PUMA controller (AVL, Graz, Austria). NO emissions were measured by an exhaust gas analyzer (Mexa-7100DEGR, HORIBA Instruments, Kyoto, Japan). The fuel quantity was measured at the inlet and return fuel line with a fuel flowmeter (OVAL Corporation, Tokyo, Japan). Six operating conditions were chosen as the base conditions including various RPMs, loads, EGR rates and injection characteristics, as shown in Table 2. Additionally, parametric studies on the injection timing, EGR rate, boost pressure and injection pressure were performed, as listed in Table 3.

3.2. Numerical Implementation

A k-ε RNG model [37] with a commercial CFD code (Version 4.22, Star-CD, CD-Adapco, Melville, NY, USA) was used to calculate the unsteady RANS equation using a 1/7 sector mesh with 20,000 cells at TDC and 70,000 cells at BDC, where the average cell spacing was chosen as 1 mm which was calculated by performing the grid-sensitivity analysis from 0.5 mm to 2 mm. A cyclic boundary condition was applied in the azimuthal direction, while a constant temperature boundary condition was applied in the other directions. A total of 61 grids were used to discretize the mixture fraction (Z) domain of the modified 2-D flamelet model with local refinement near the stoichiometric region, and a time step of 0.1 CA before injection and 0.05 CA after the injection.
n-Heptane was chosen to represent commercial diesel oil fuel, and the chemistry consisted of 29 species and 52 reactions [38] coupled with a NOx mechanism [39]. Each chemical species was solved by the governing equations and returned to the CFD solver to calculate the total change in enthalpy and RANS equation of following flow field.
Fuel injection was modeled using a Lagrangian approach where the fuel droplet is considered a group of liquid particles. This property was used for n-dodecane fuel, and the Reitz-diwakar model [40] was used for the spray breakup to the vapor phase of n-heptane. Unfortunately, the experimental data of spray visualization in the target engine could not be tested. Instead, the model was validated by comparing the vapor penetration length with the experimental results by Sandia National Laboratory (‘Spray A standard’, [41]), as shown in Figure 3.

4. Results and Discussion

The results are divided into three main parts. In the first section, validation of the modified 2-D flamelet model under various operating conditions used in commercial diesel engines is presented. The second section discusses the simulation results under a parametric change of base conditions to show the robustness of the model. Based on the validation results of the modified 2-D flamelet model, effects of the advance injection strategies on both NOx and PM emissions are quantitatively investigated in the last section. The experimental pressure was averaged over one hundred cycles while the computed results are shown with solid lines to distinguish them.

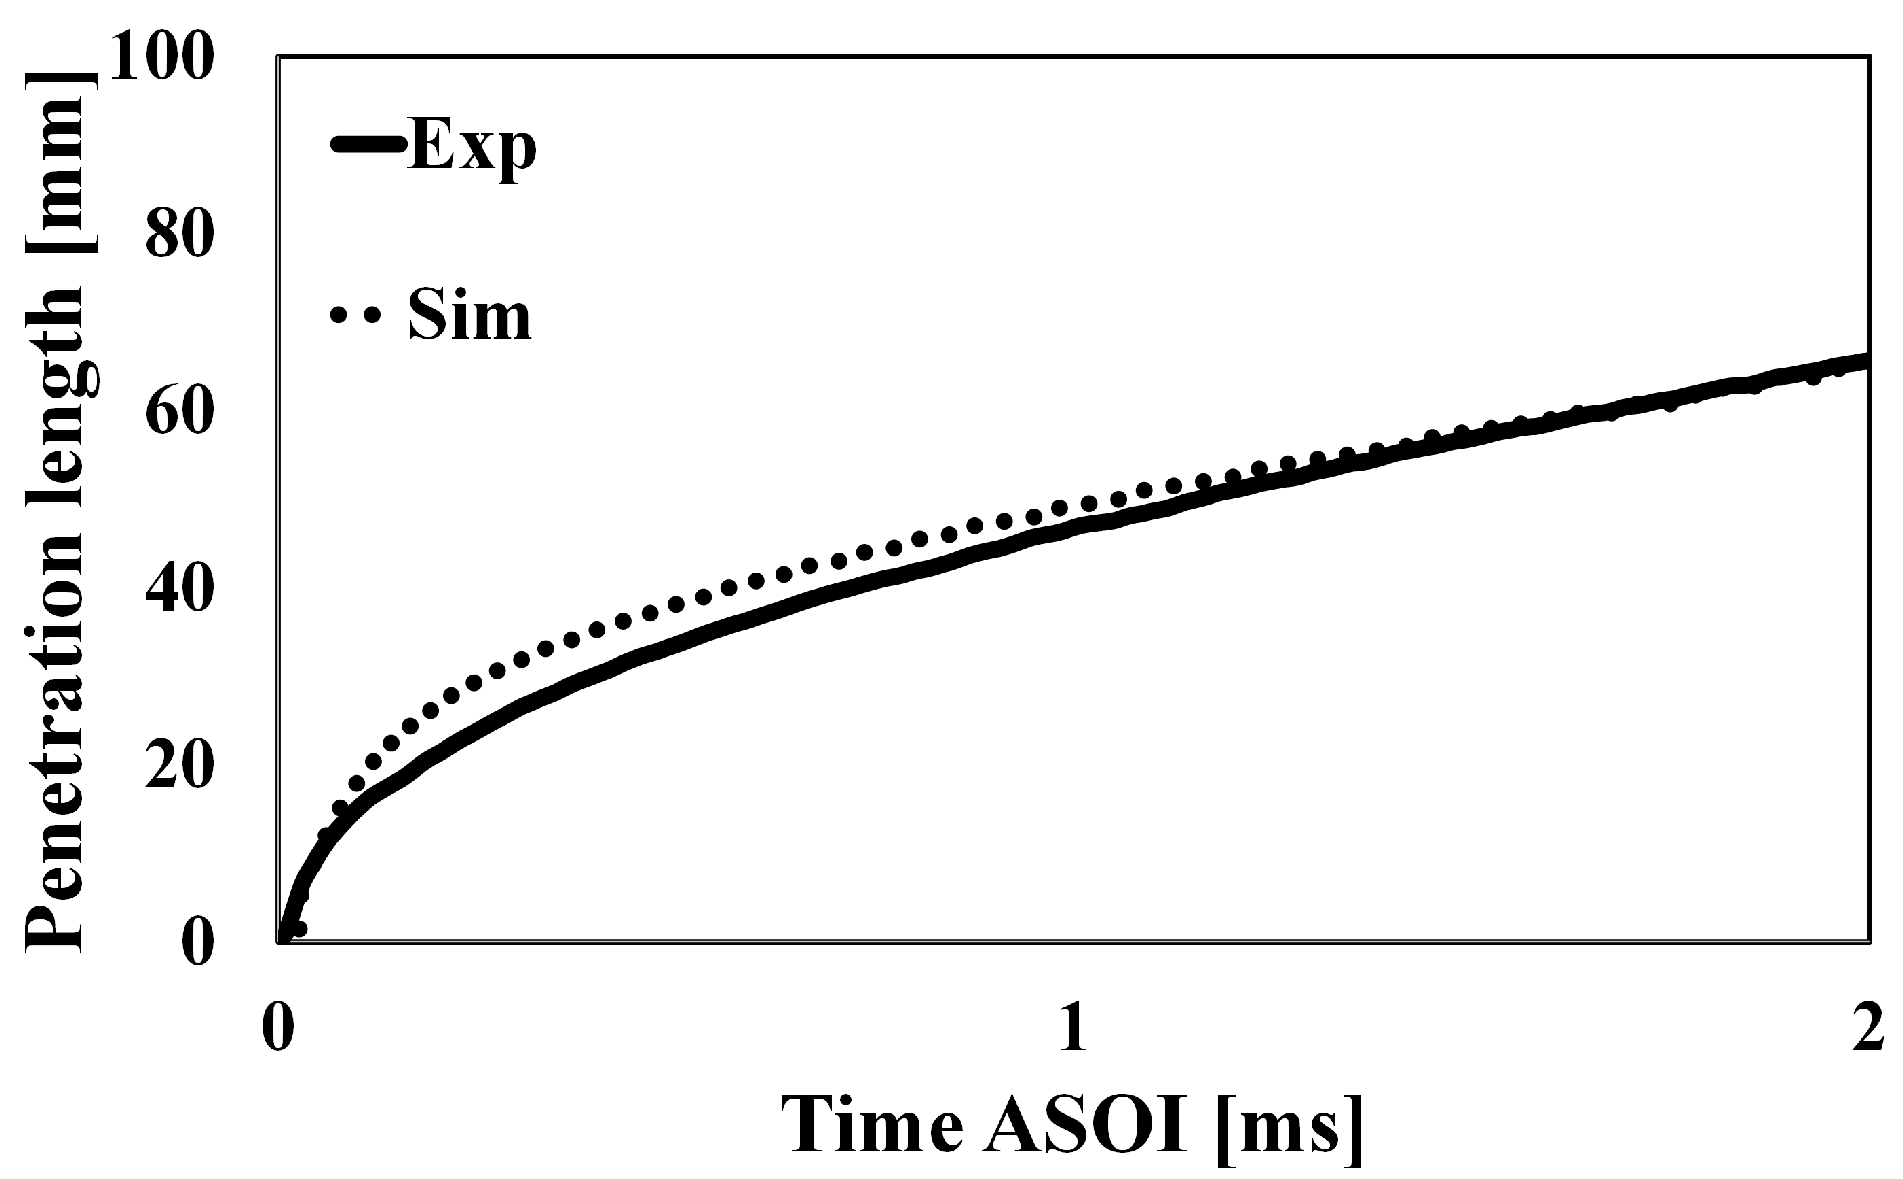
4.1. Validation of Modified 2-D Flamelet Model under Base Conditions

To evaluate the feasibility of the model, various operating conditions, including different RPM, loads, mixture conditions and injection strategies, were selected as base cases and validated with experiments. Figure 4 shows experimental and simulation results for the base conditions. The model captures the start of auto-ignition and the overall combustion phase for each injection. The NO emissions trends were well matched with experiments, although the quantitative values were less than those in the experiments.
Meanwhile, the base condition results show that the assumption of the collapse method is valid under engine conditions as shown in Figure 5.
Because all the cases use two pilot injections before the start of the third stream, collapse of the instantaneous flamelet solutions may be possible when the second fuel stream reaches a steady-state solution at the time when the solutions are collapsed. The 2-D contour simulation results show that the solution of each fuel side (i.e., y = 0 and y = 1) has similar temperature profiles, and the solution following the collapse is similar to that of both solutions before the collapse.

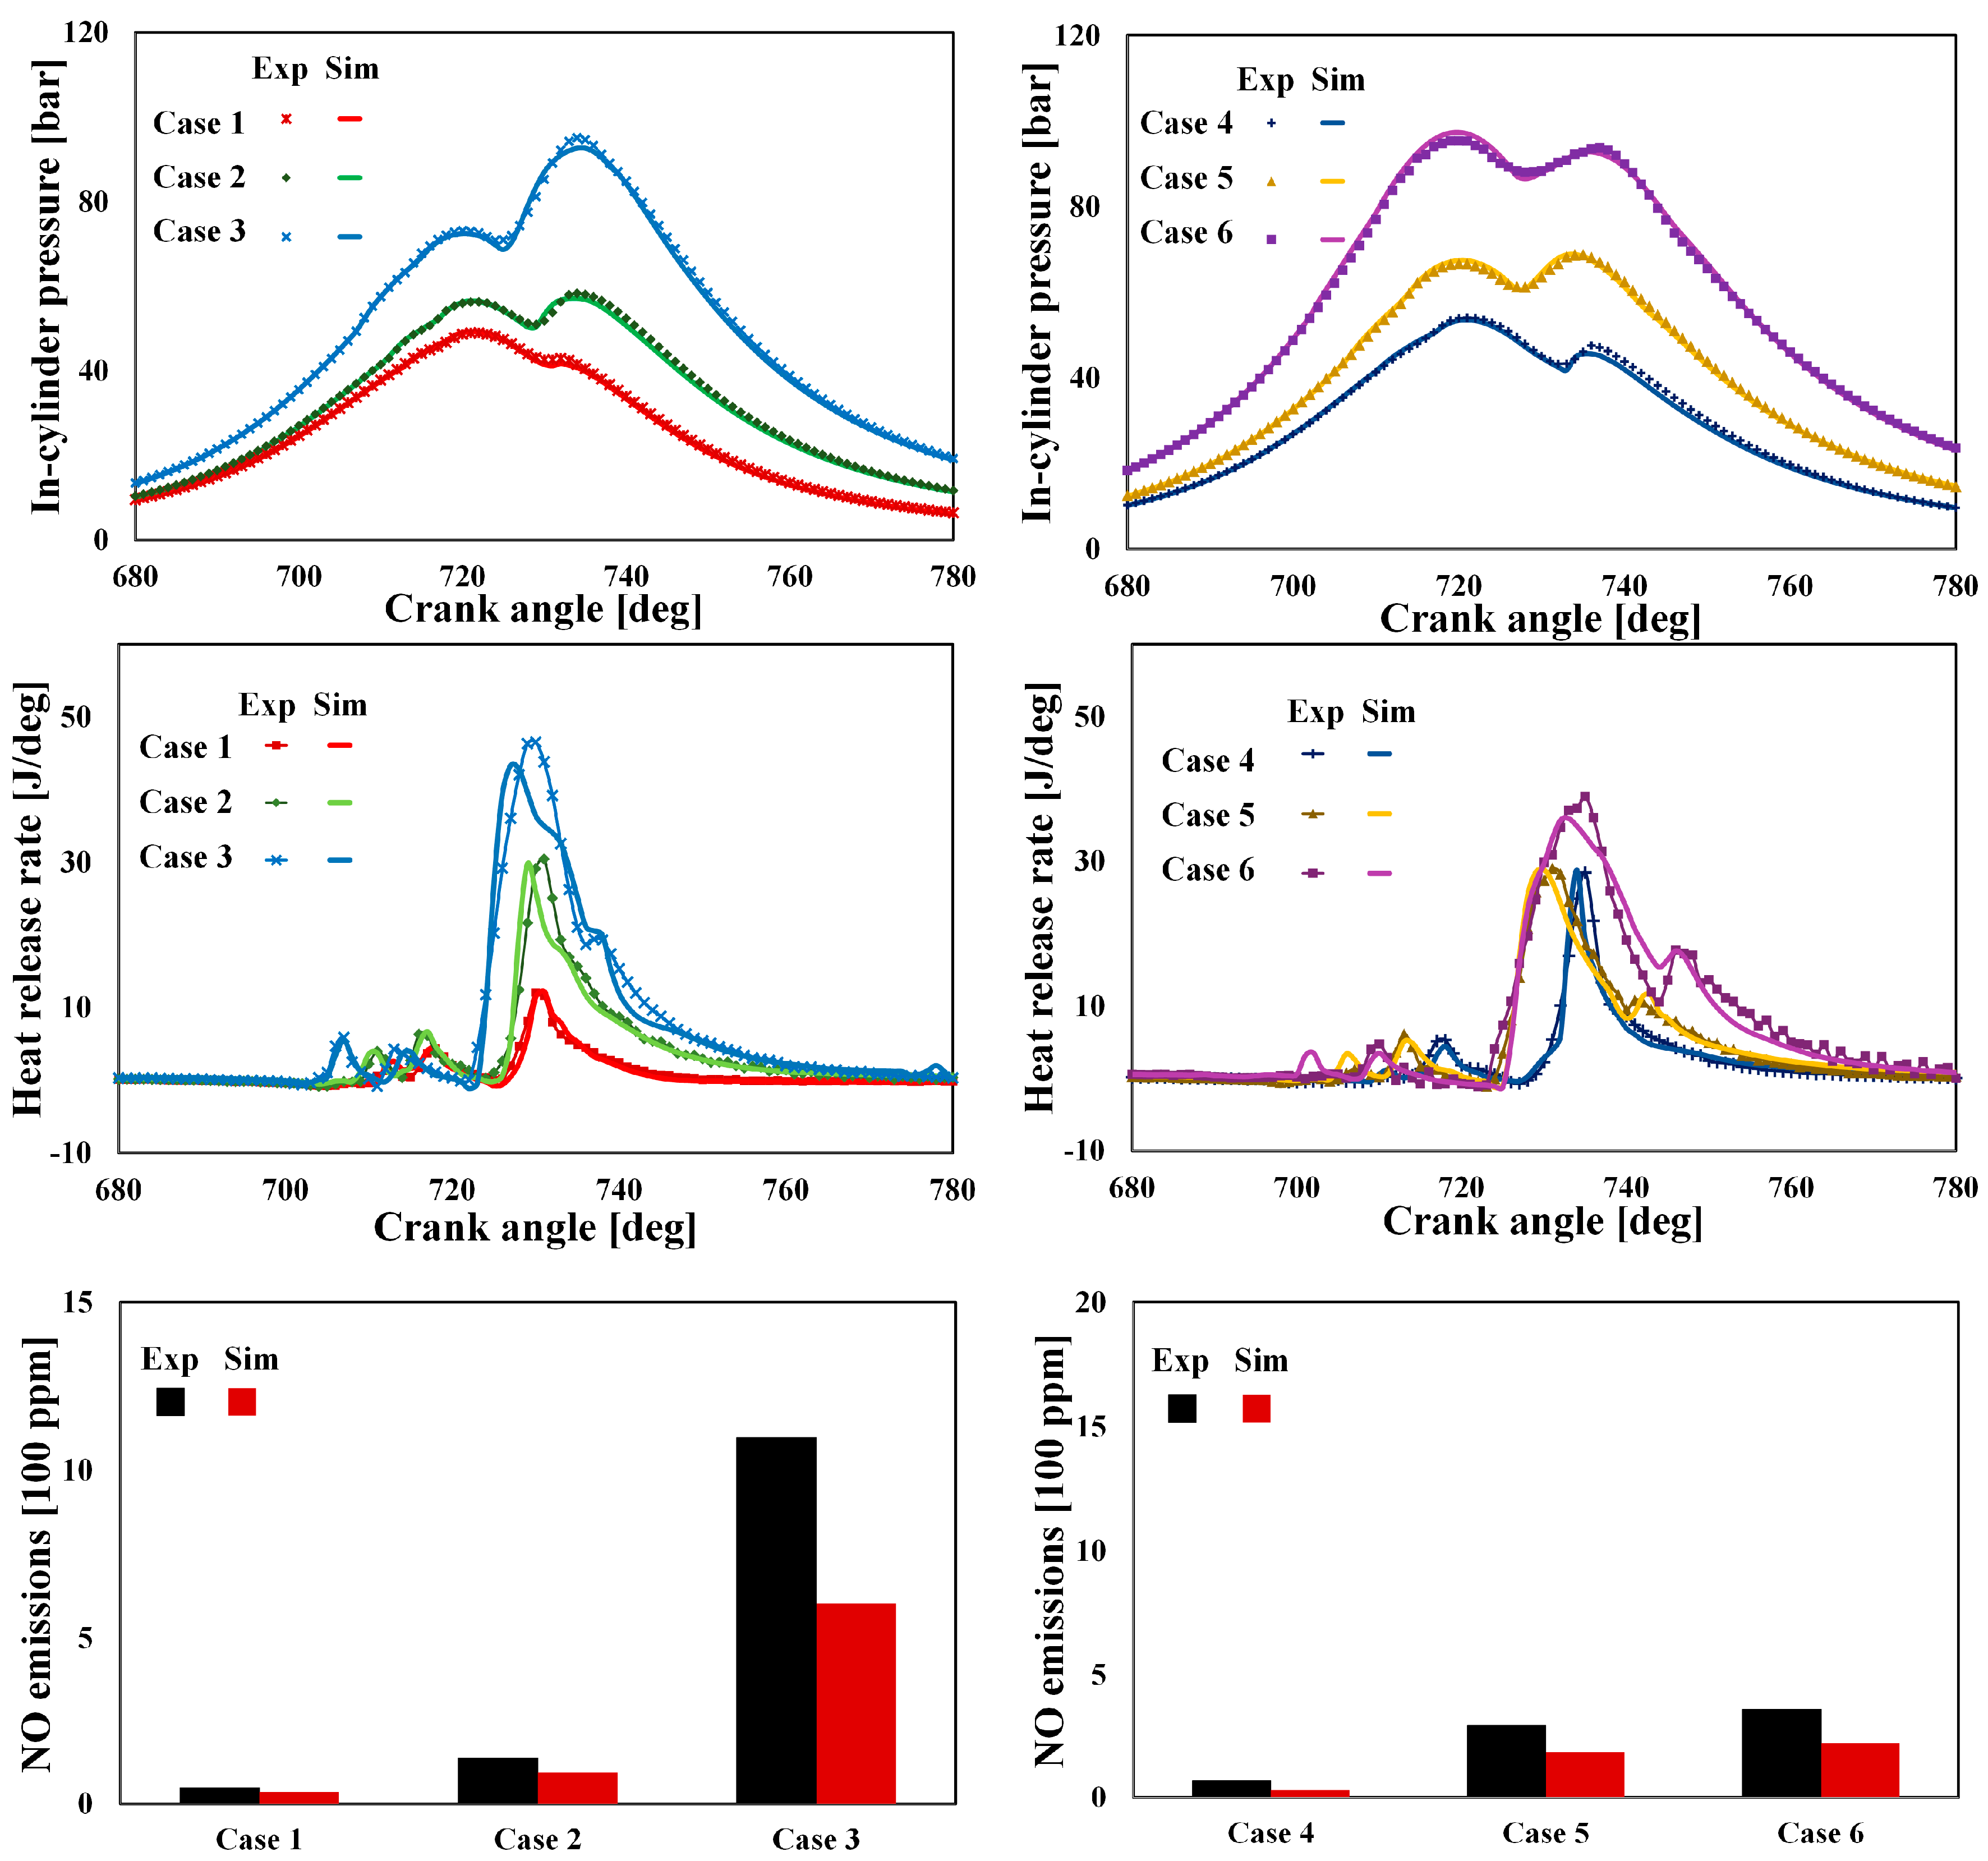
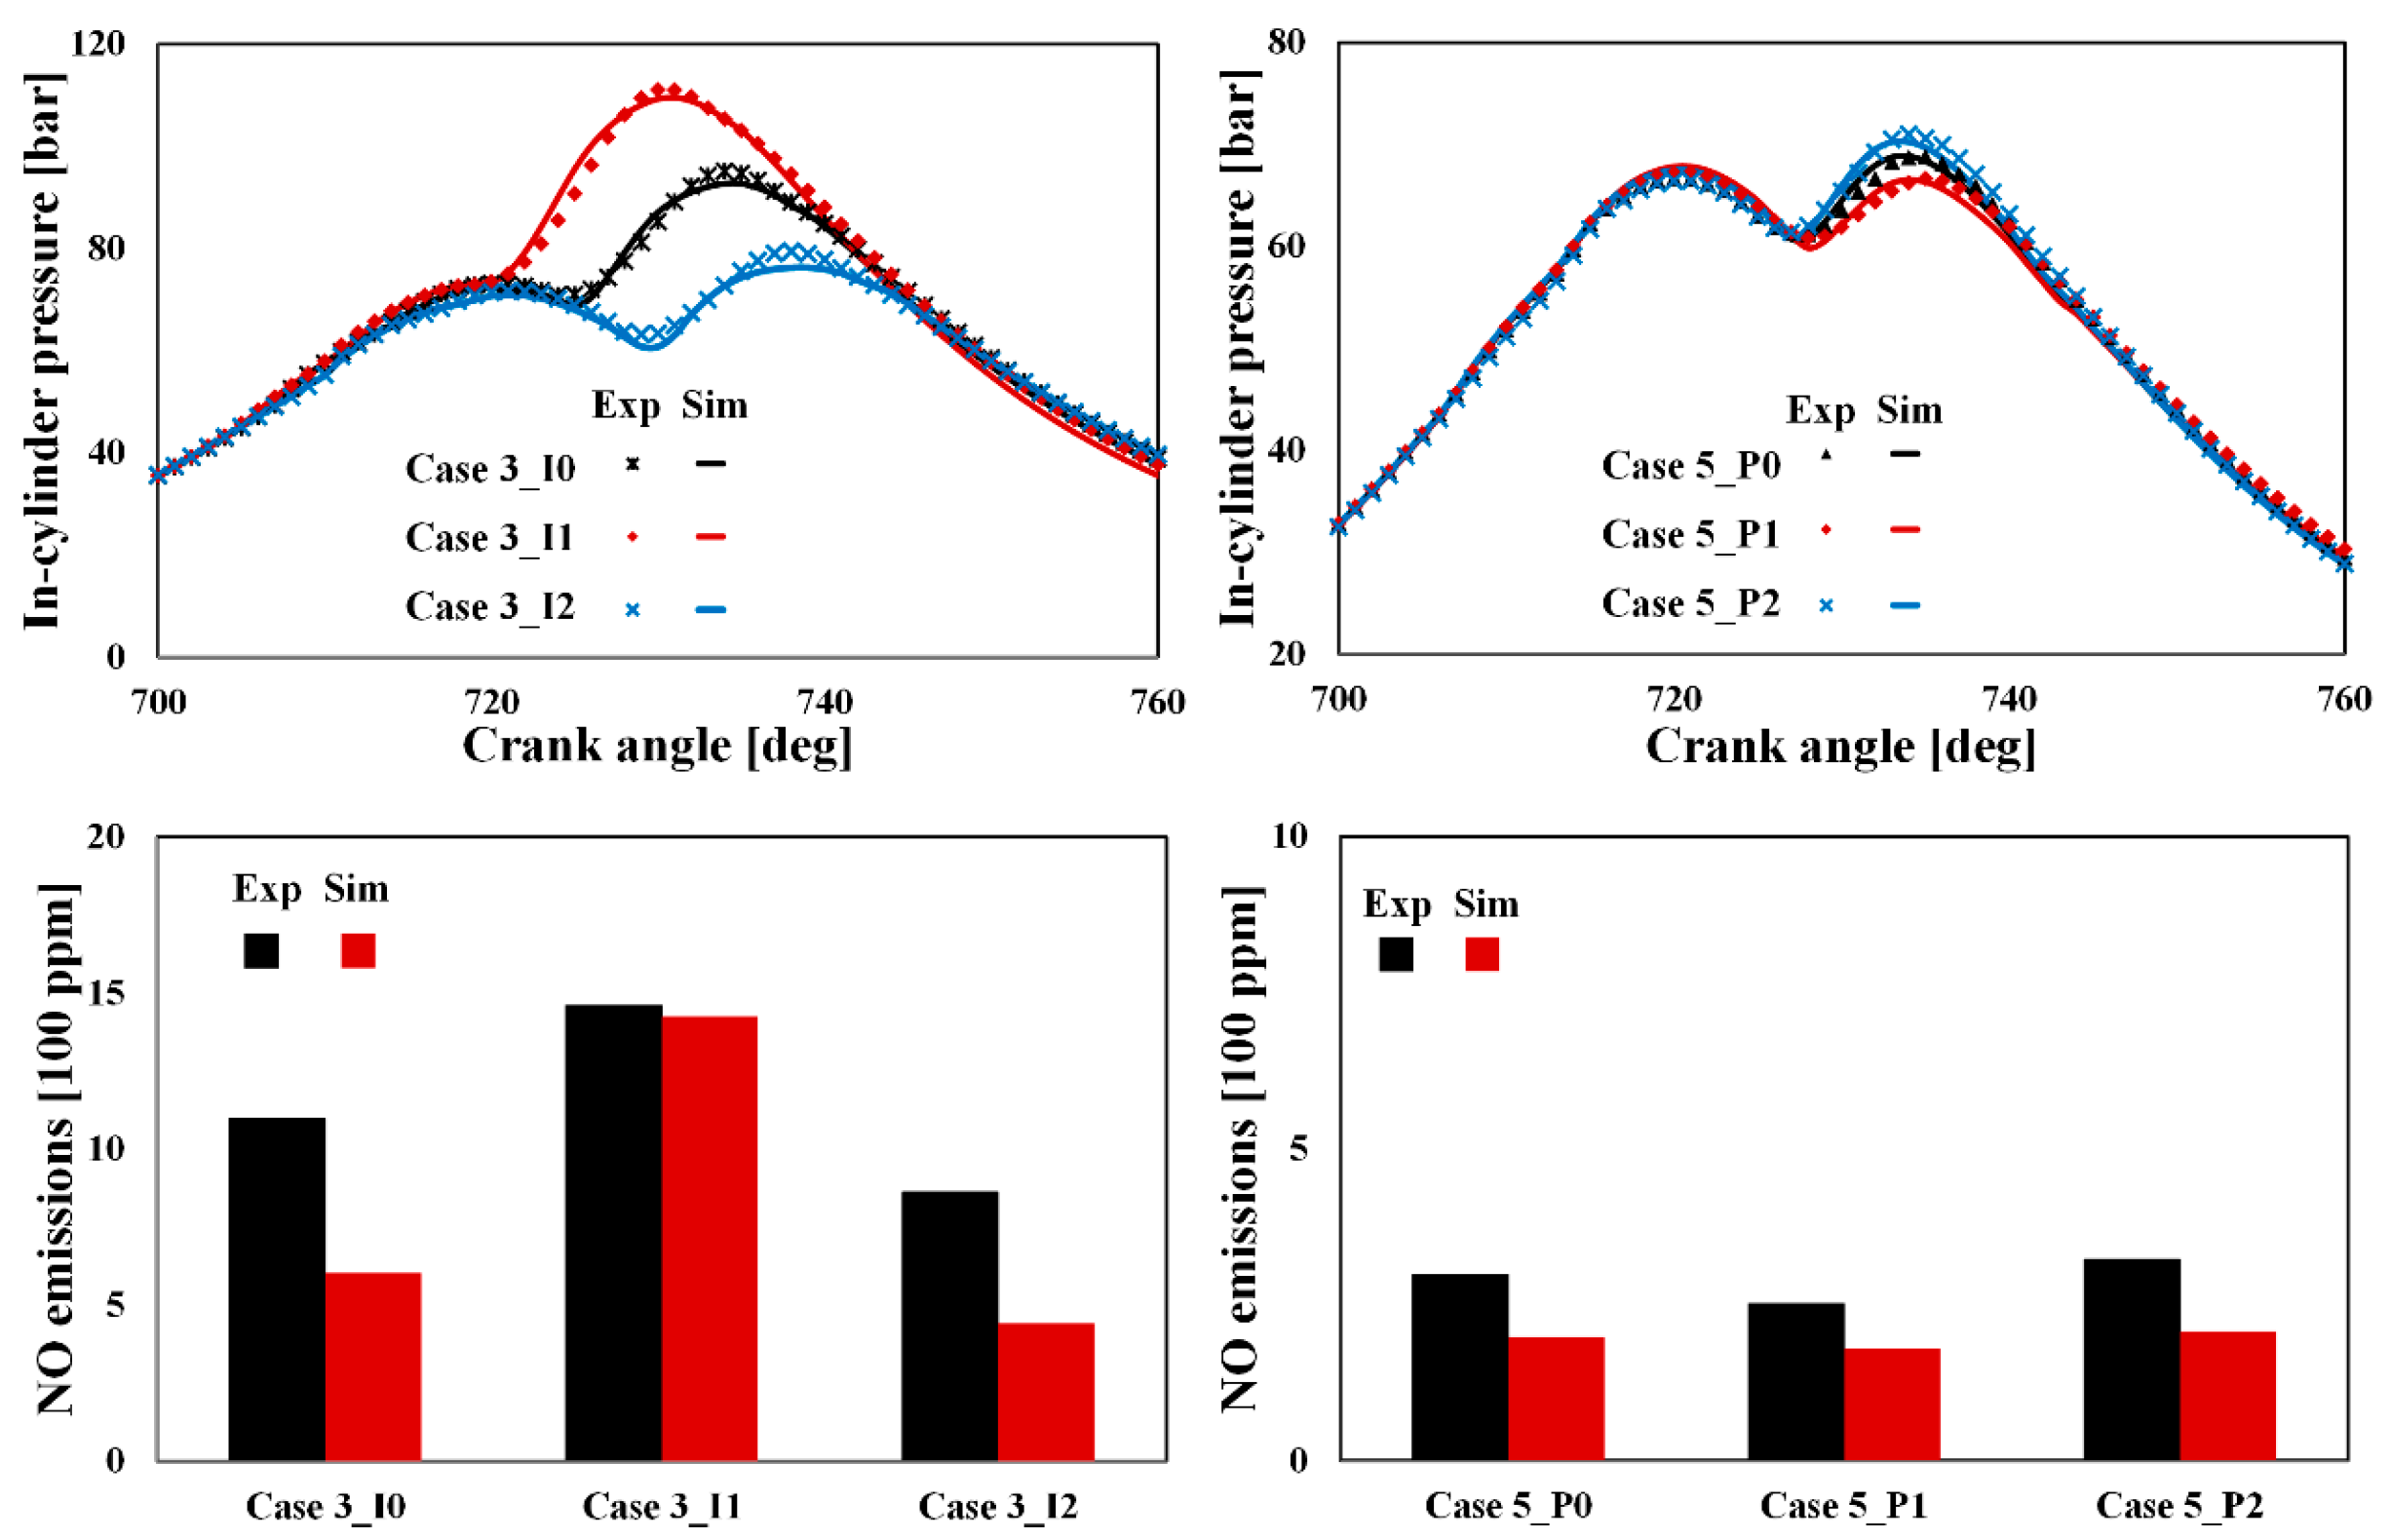
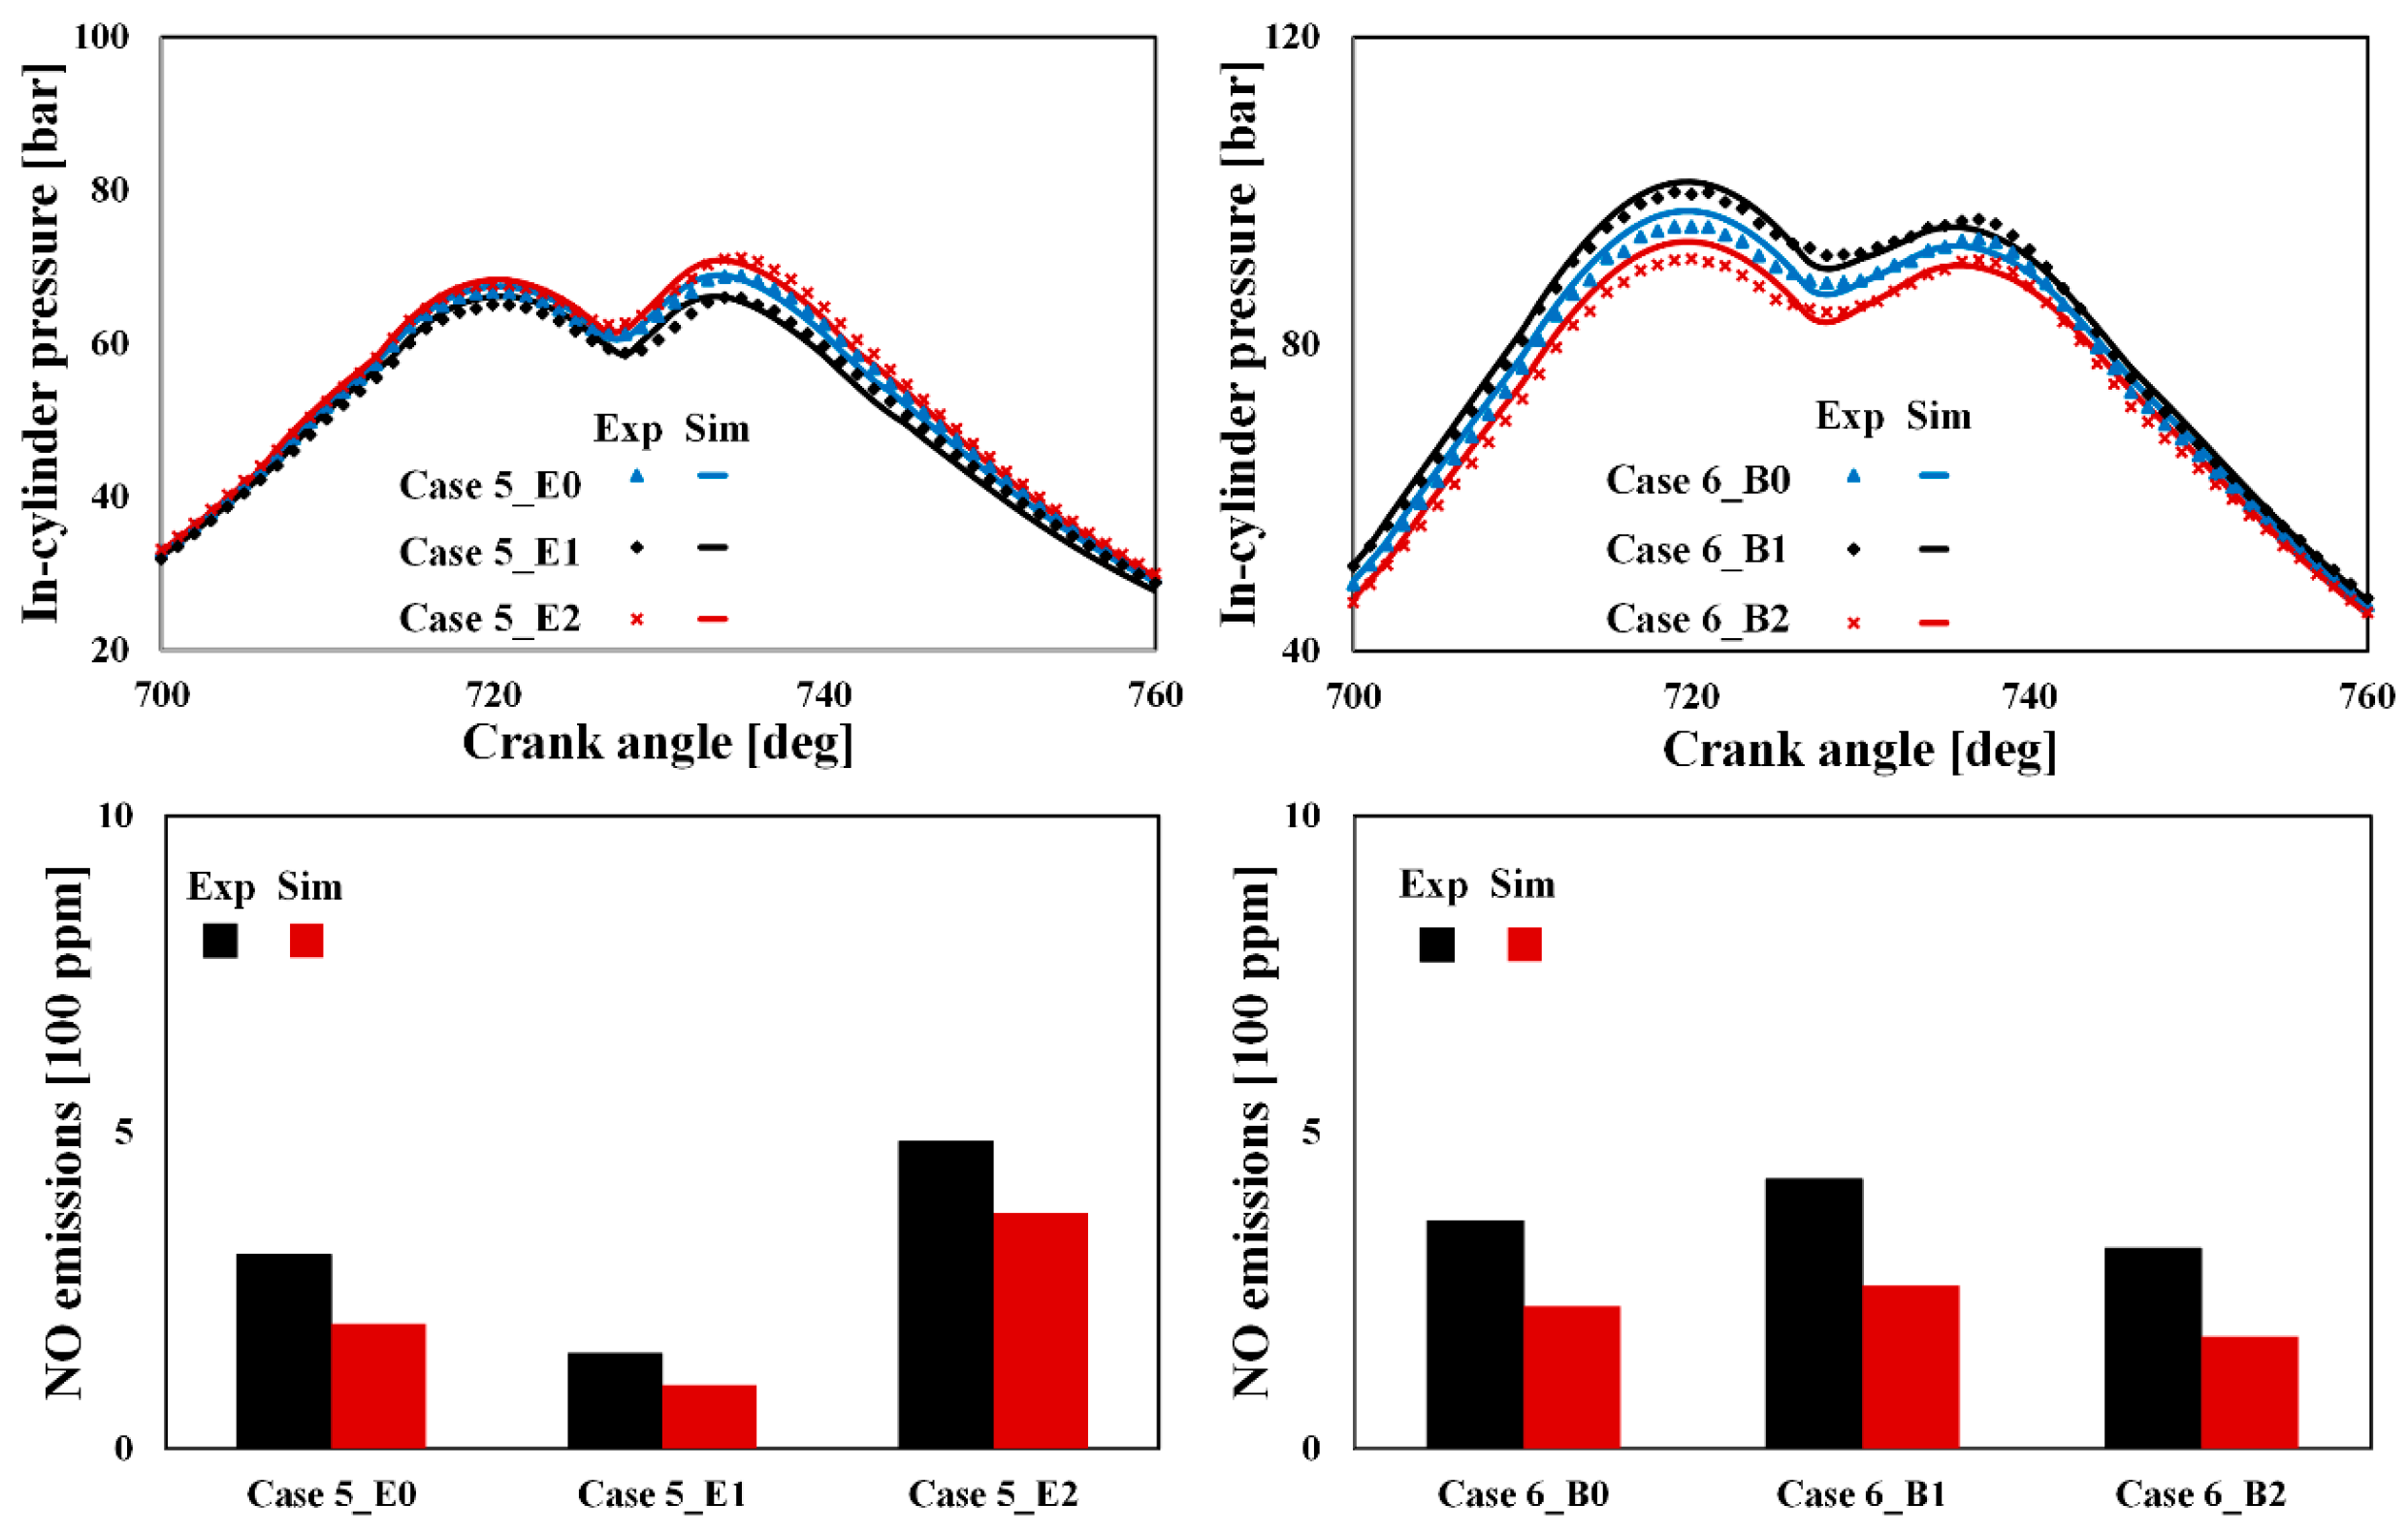
4.2. Validation of Injection Parameter Variations

The robustness of the model should be investigated because it can be used for any type of development and optimization process for the engine system. A parametric study of the injection variable should be performed because the most noticeable feature of the modified 2-D flamelet model is to describe more than three fuel streams. Many injection parameters, such as injection timing, pressure, and duration, must be controlled during the engine experiments.
Injection timing and pressure were changed from case 3 and case 5 among the base conditions, as listed in Table 2. The injection timing of all injection events, including pilot and post injections, was changed while the other parameters remained constant. Fuel mass and EGR rate had to change slightly because of the difficulty of controlling the other parameters as a constant simultaneously changing the injection pressure.
Figure 6 shows the effect of changing the injection timing and pressure on the simulation results. Advancing the injection timing results in an earlier combustion phase and increased maximum pressure, which results in increased NO emissions. Meanwhile, increasing the injection pressure with similar fuel quantity results in the needle opening faster, which causes an earlier pressure rise, especially for the main fuel streams. The model captures these trends well regarding injection parameters, and the overall pressure histories are in good agreement with experimental results.

4.3. Validation of in-Cylinder Mixture Variations

To validate the modified 2-D flamelet model under various ambient conditions, experiments were performed by varying the EGR rate. The two ways of changing the EGR rate in an engine are decreasing the mass of fresh air and increasing the boost pressure. Because the total mass entering the cylinder during the intake process is nearly constant in the same boost condition, the relative mass ratio of fresh air should be reduced to increase the EGR rate. This implies that the composition of trapped mass in the cylinder has changed while the ambient pressure and temperature remain constant. The other option is supplying more mass from the EGR stream by increasing the boost pressure while maintaining the mass of fresh air.
Figure 7 shows the simulation results under changing in-cylinder mixture conditions. Incrementally increasing the EGR rate while maintaining boost pressure results in lower oxygen concentration and increases the temperature inside the cylinder, decreasing the cylinder pressure at the end of the compression stroke due to further heat transfer to the wall. Hence, it is difficult to auto-ignite the air-fuel mixture which delays the overall combustion phases. In contrast, these trends are not found in the case of constant air mass because the oxygen concentration does not vary, and the higher boost pressure compensates for these effects. The simulation results show decent agreement of these tendencies with the experimental data.

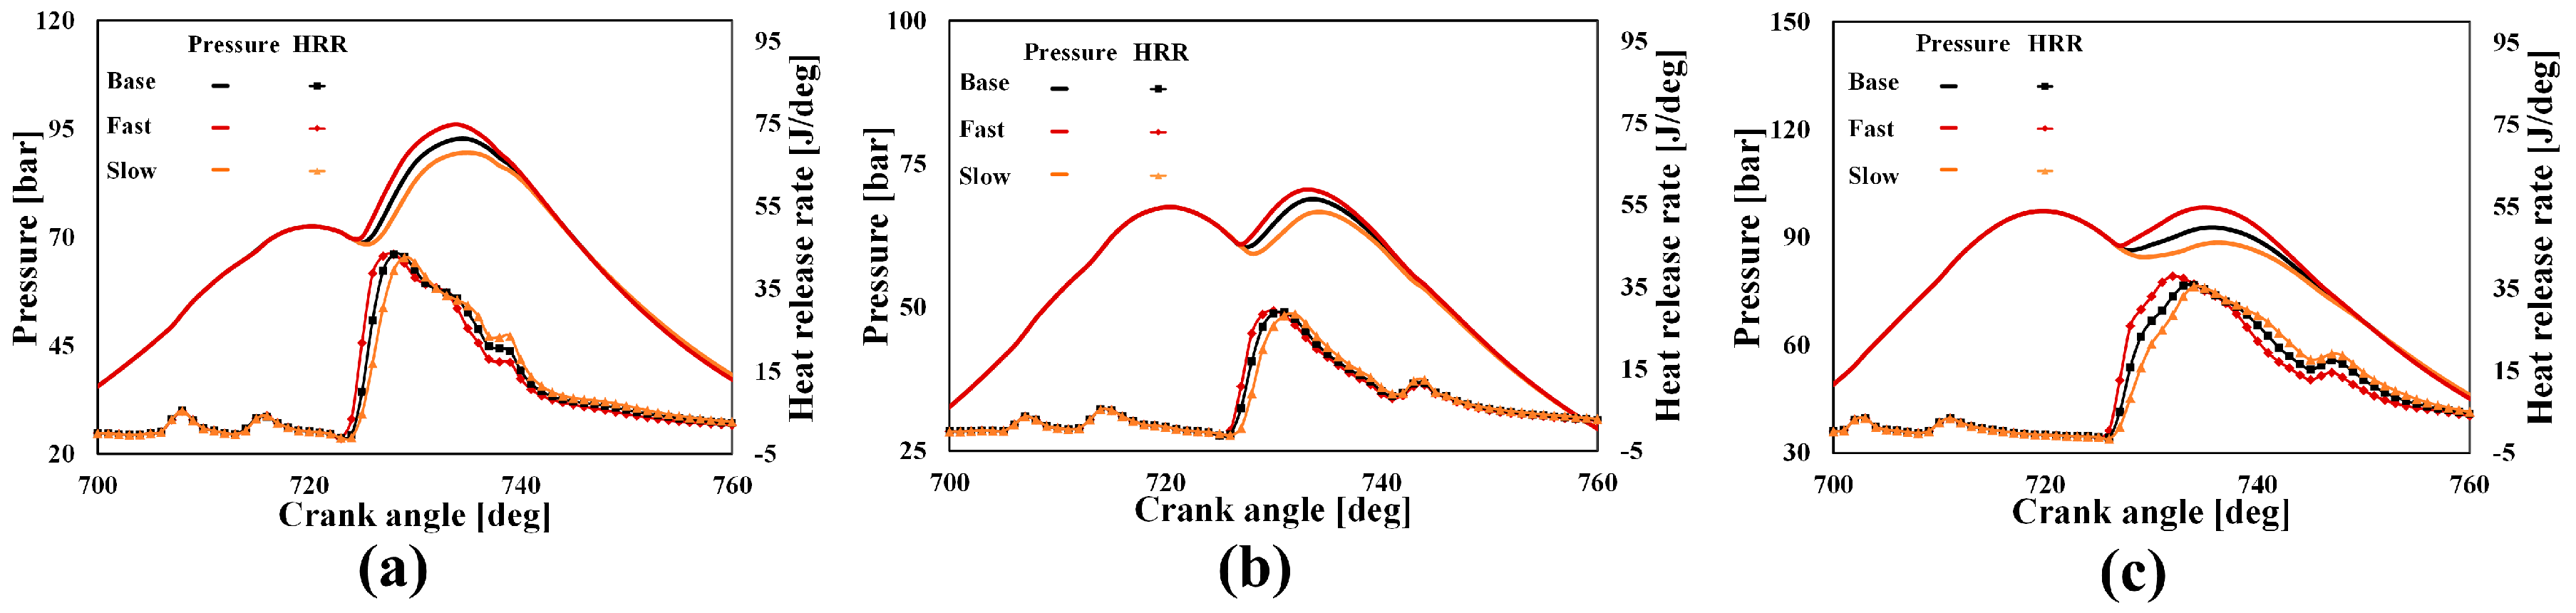
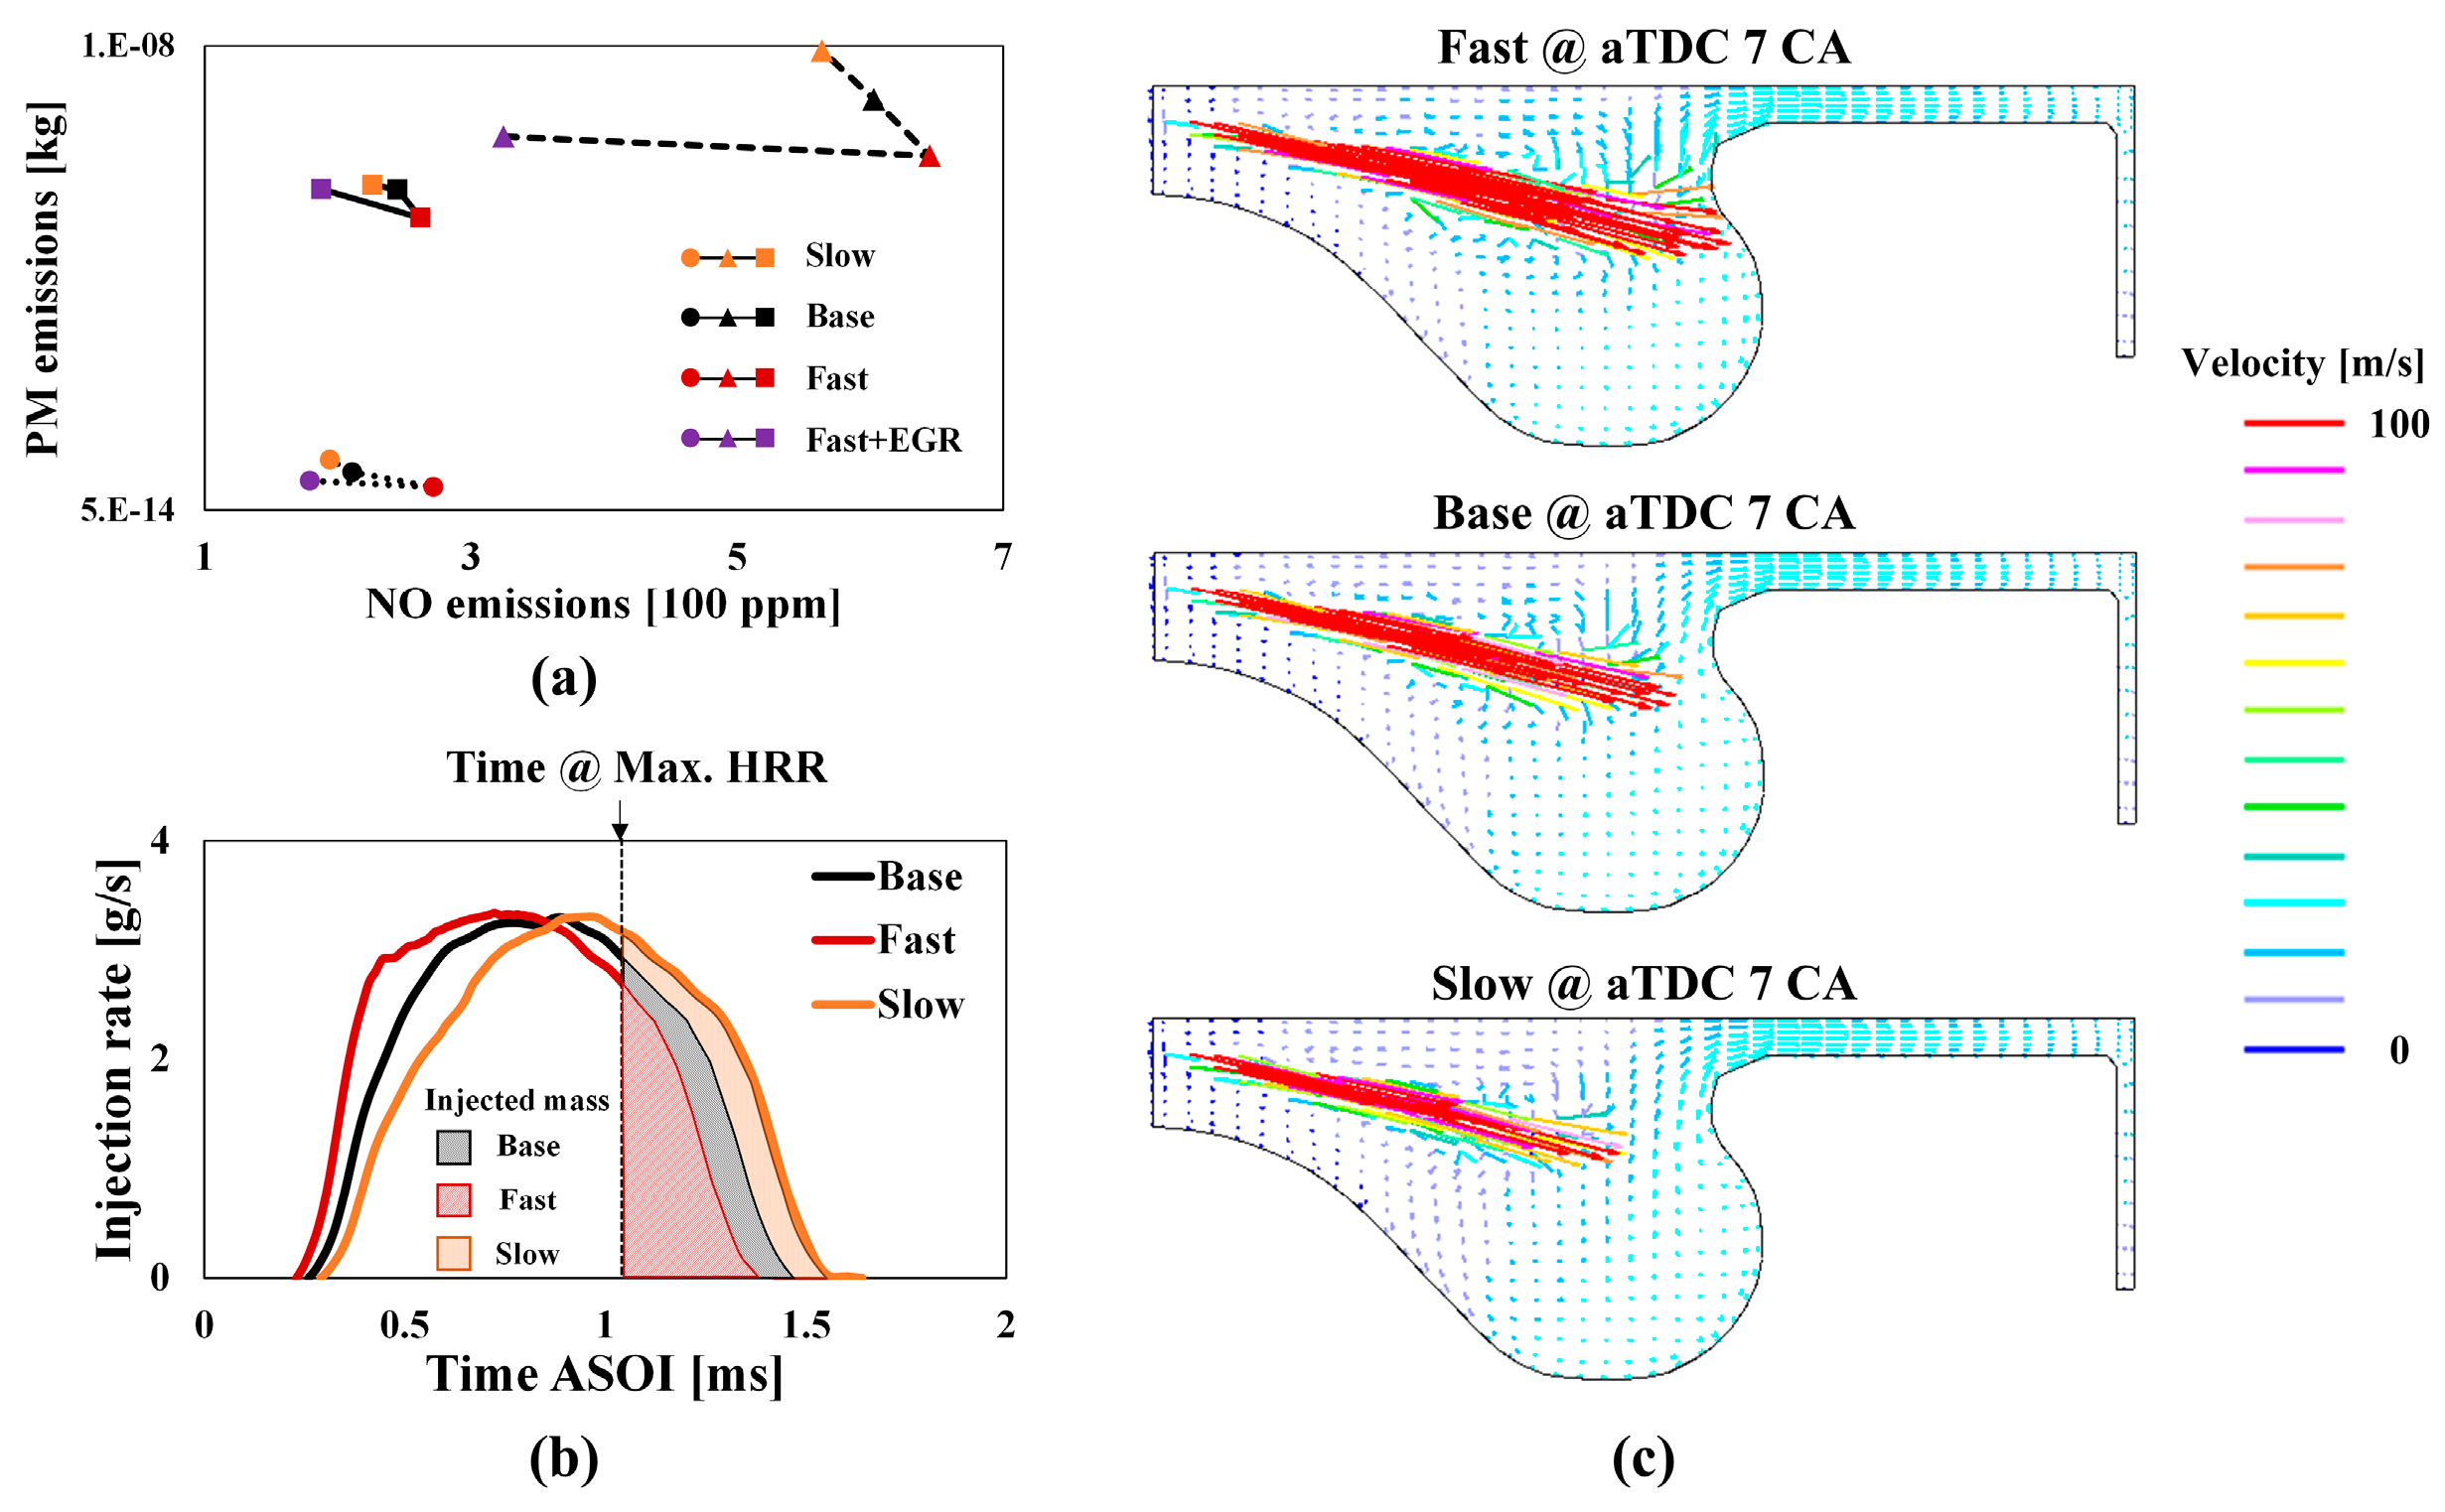
4.4. Numerical Analysis on the Effect of Injection Rate Shaping on Engine-Out Emissions

Using the modified 2-D flamelet model validated in Section 4.2, Section 4.3 and Section 4.4, advanced injection strategies are suggested to achieve both NOx and PM emissions reduction. First, the effects of injection rate shaping on the combustion and emissions characteristics are investigated. Injection rate shaping provides appropriate mixing conditions of fuel and air for increased efficiency and emissions reduction while injection pressure and duration are maintained [42,43,44].
Figure 8 shows the simulation result of combustion and emissions characteristics when implementing injection rate shaping and the varying the opening rate of the injector needle to change the injection rate. Both the pressure rise rate and the peak pressure increase and the combustion phase is advanced when the fast needle opening rate increases because more fuel is injected at the early stage of injection and a larger premixed area develops due to the increased penetration length.
There is a trade-off between NO and PM emissions despite the injection rate shaping, however, it provides the potential of additional emissions reduction by combining other operating strategies. Figure 9 shows a possible NO emissions reduction method by supplying an additional EGR mixture. In general, EGR gas can effectively reduce NO emissions, but there is a limit to the increase in PM emissions because the mixture condition becomes richer. It is possible to reduce NO emissions without increasing PM emissions due to the sufficiently lean mixtures under the fast needle opening condition because the fast needle opening has a high injection momentum which increases the jet penetration length and the following air-entrainment effect. The decreased injected mass at later stages during injection makes the mixture leaner, as shown in Figure 9.

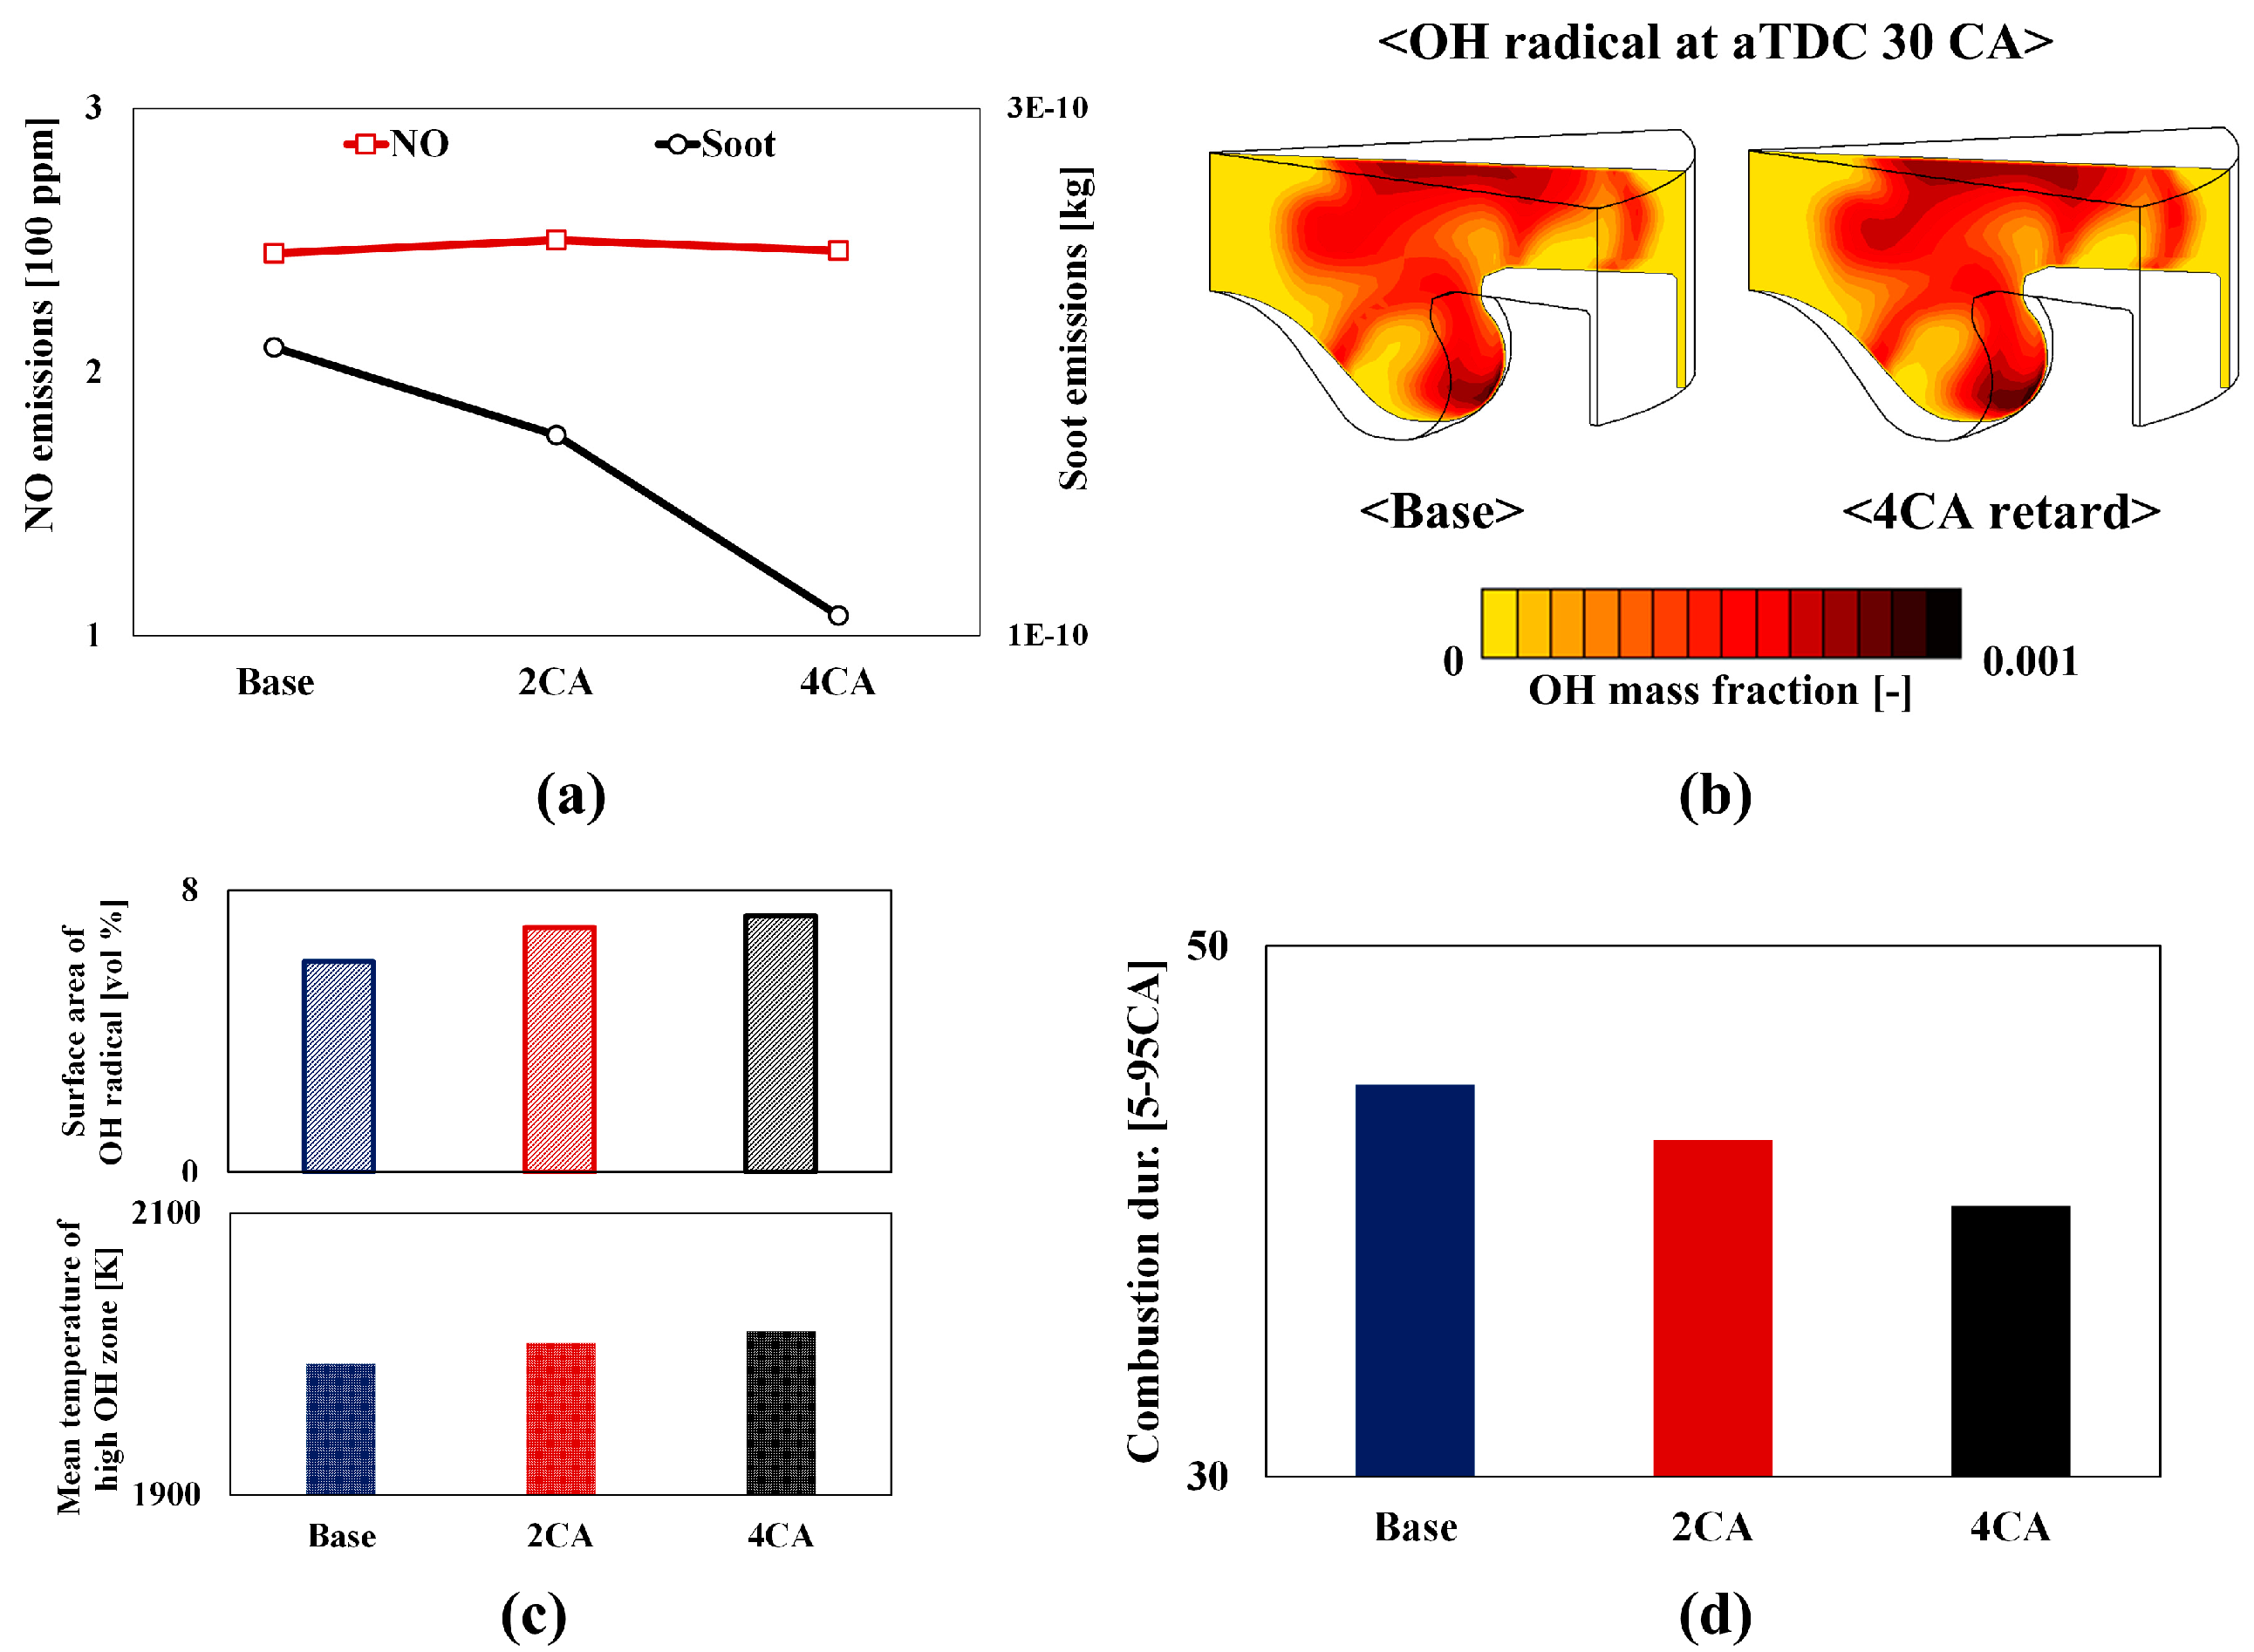
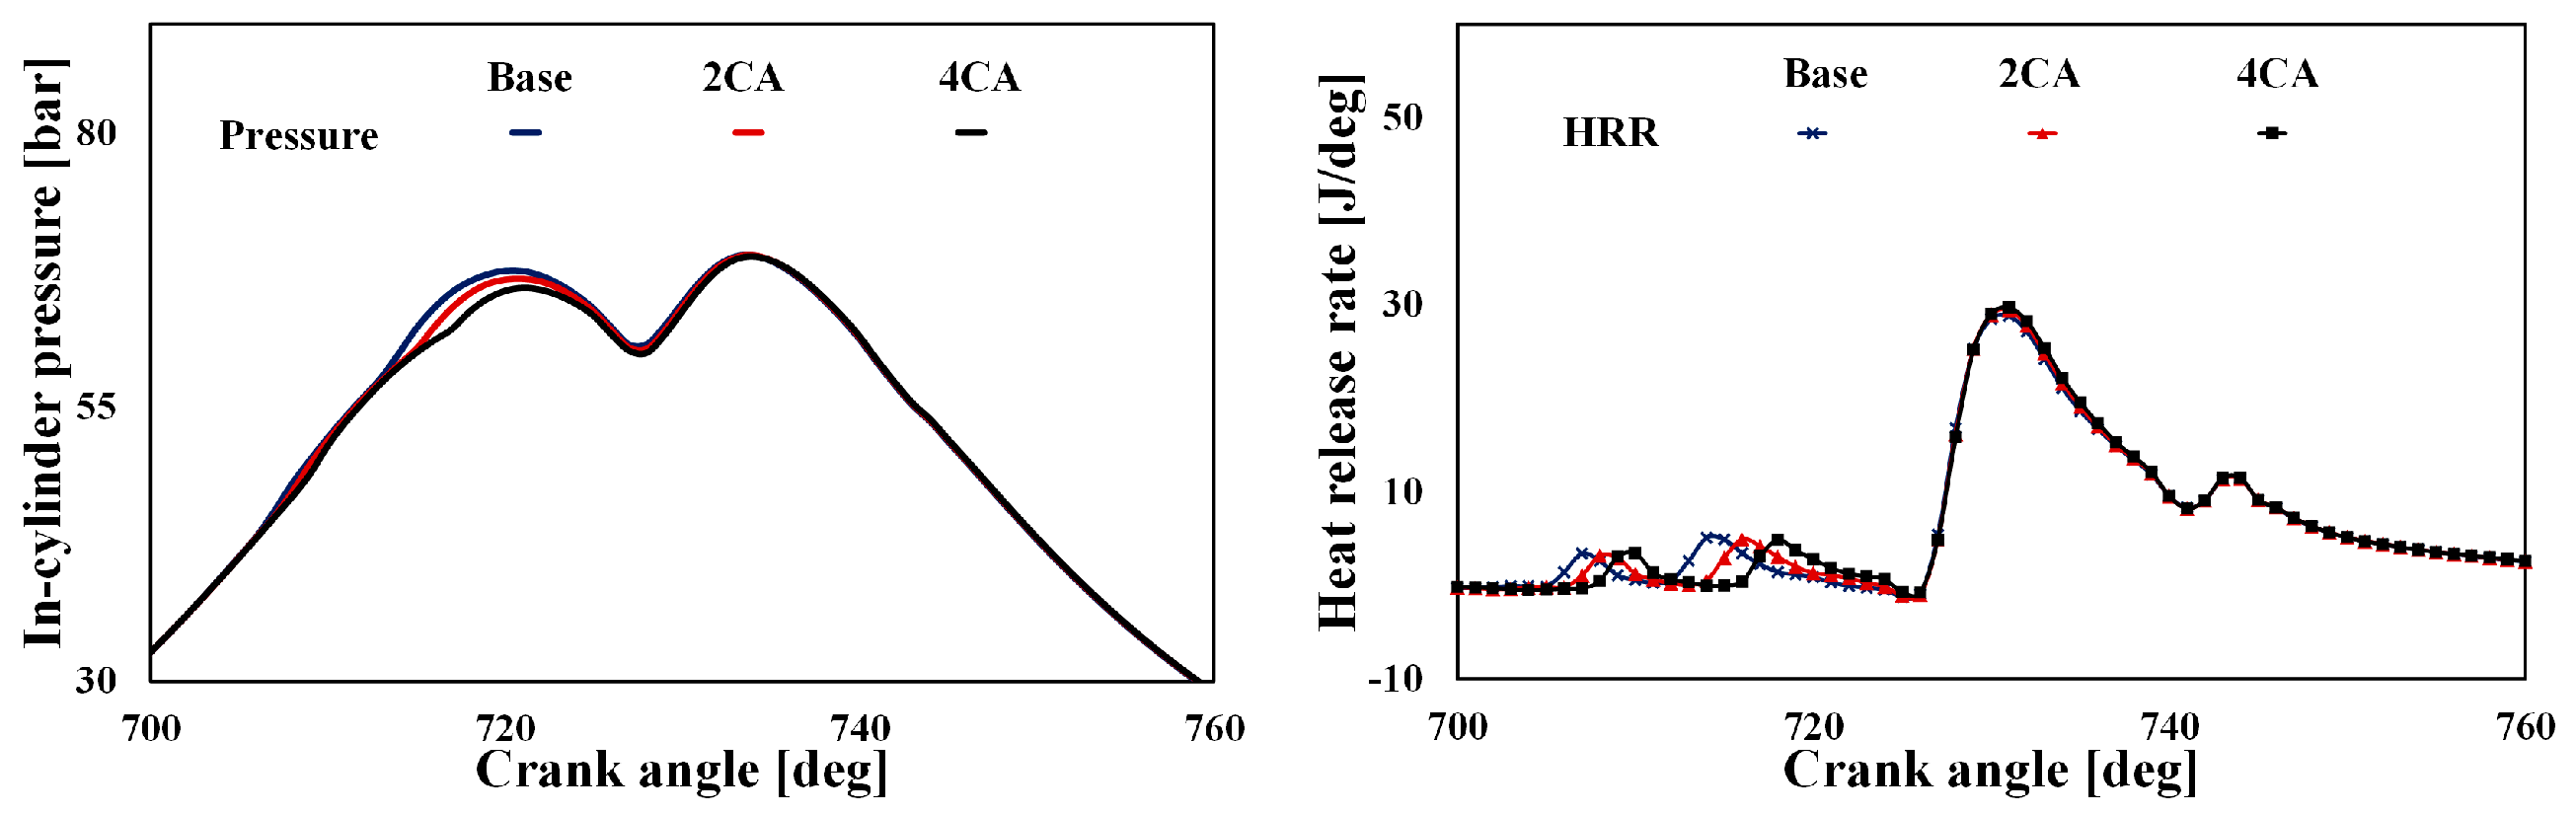
4.5. Numerical Analyses on the Effect of Dwell Time on NOx and Soot Emissions

Dwell time is defined as the duration between the end of first injection and the start of the second injection. The effects of dwell time between the pilot and main injection are numerically investigated because it was known to affect the emissions characteristics [45,46,47,48].
Figure 10 shows the time history of in-cylinder pressure and heat release rate according to the decrease in the dwell time between the pilot and main injection from case 5 (see Table 2) as a base condition. There are two pilot injections in the base condition, and only the injection timings of both pilot injections are delayed while the time between each pilot injection remains constant. The NO emissions are not significantly affected by the change of dwell time because the start of combustion by the main injection and the following combustion process are not significantly affected since the pilot-injected fuel was almost burned before the start of the main combustion. This is because the injection timing of pilot fuels is not advanced but retarded as shown in the simulation results in Figure 10, where the combustibility of pilot fuels does not decrease.
Figure 11a shows that the NOx emissions are similar to changing the dwell time while soot emissions are reduced by changing dwell time. Generally, soot emissions is mainly oxidized via OH radicals and oxidation increases because of decreasing dwell time increases the spatial distribution of OH radicals and the corresponding mean temperature, as shown in Figure 11b,c. In addition, the combustion duration decreases due to a short dwell time, which results in better soot oxidation (Figure 11d).

5. Conclusions

The modified 2-D flamelet model was further improved for the simulation of combustion characteristics under various multi-fuel streams injected more than three different times. The governing equations, except near the stoichiometric region, were interpolated for each fuel stream where y = 0 and y = 1, which presented more accurate results with similar CPU time compared to previous simplifications of the modified 2-D flamelet model.
As discussed in the results section, the model predicts the combustion and emissions characteristics under implementation of multiple injection strategies including more than three injection events. In addition, the model showed successful results regardless of parametric variations to the base condition. Furthermore, a validated model was used to analyze the effect of changes in injection rate shaping and dwell time on both NOx and PM emissions, which demonstrated an example of the possibility of suggesting advanced injection strategies. The model is applicable for simulating commercial diesel engines using multiple injection strategies, and it can be used to develop advanced injection plans to provide engines with higher efficiency and lower emissions.

Acknowledgments

The authors would like to thank the advanced diesel engine development team at the Hyundai Motor Group for their technical support. This research was supported by the Hyundai Motor Group and the Seoul National University institute of advanced machines and design (SNU-IAMD).

Author Contributions

Gyujin Kim and Kyoungdoug Min conceived and constructed the combustion model; Gyujin Kim and Sunyoung Moon performed the simulations; Gyujin Kim, Sunyoung Moon and Seungha Lee analyzed the data; Seungha Lee provided the experimental data; Gyujin Kim and Kyoungdoug Min wrote the paper.

Conflicts of Interest

The authors declare no conflict of interest.

Abbreviations

1-DOne dimensional
2-DTwo dimensional
3-DThree dimensional
a 1 a constant in Equation (10)
a 2 a constant in Equation (10)
aBDCafter Bottom Dead Center
aTDCafter Top Dead Center
bBDCbefore Bottom Dead Center
BDCBottom Dead Center
bTDCbefore Top Dead Center
CACrank Angle (degree)
CFDComputational Fluid Dynamics
c p mean specific heat at constant pressure (J/kg·K)
CPUCentral Processing Unit
Dscalar diffusion coefficient (m2/s)
DNSDirect Numerical Simulation
EGRExhaust Gas Recirculation
erfccomplimentary error function in Equation (10)
EVCexhaust valve close
EVOexhaust valve open
expexponential function
henthalpy (J)
IInteraction parameter
IVCintake valve close
IVOintake valve open
LeLewis number (-)
OHhydroxide
RIFRepresentative Interactive Flamelet
RNGRe-Normalization Group
m ˙ chemical production rate
MIMain injection
MFBMass fraction burned
NNumber of fuel streams
NOnitric monoxide
NOxnitric oxides
pPressure (bar)
P ˜ probability density function
PDFProbability Density Function
PIPilot Injection
PMParticulate Matter
PoPost injection
q r ˙ Radiative heat flux
RANSReynolds-Averaged Navier-Stokes
RPMRevolution per minute
ttime (s)
TDCTop Dead Center
Vvolume (m3)
x a spatial coordinate
Yspecies mass fraction
ymixing parameter (-)
Zoverall mixture fraction (-)
Z ˜ mean mixture fraction
Greek Symbols
ρ density (kg/m3)
χ instantaneous scalar dissipation rate (1/s)
χ 12 joint scalar dissipation rate (1/s)
χ s t ^ domain averaged scalar dissipation rate conditioned on stoichiometric mixture (1/s)
Subscripts
1fuel stream 1
2fuel stream 2
iith species
jjth fuel stream
kkth species
ststoichiometric mixture

References

  1. Heywood, J.B. Combustion in compression-ignition engines. In Internal Combustion Engine Fundamentals; McGraw-Hill Education: New York, NY, USA, 1988; pp. 491–566. ISBN 0-07-100499-8. [Google Scholar]
  2. Stanglmaier, R.; Roberts, C. Homogeneous Charge Compression Ignition (HCCI): Benefits, Compromises, and Future Engine Applications; SAE Technical Paper; SAE International: Warrendale, PA, USA, 1999. [Google Scholar]
  3. Lee, S.; Reitz, R.D. Spray Targeting to Minimize Soot and CO Formation in Premixed Charge Compression Ignition (PCCI) Combustion with a HSDI Diesel Engine; SAE Technical Paper; SAE International: Warrendale, PA, USA, 2006. [Google Scholar]
  4. Kokjohn, S.L.; Hanson, R.M.; Splitter, D.A.; Reitz, R.D. Fuel reactivity controlled compression ignition (RCCI): A pathway to controlled high-efficiency clean combustion. Int. J. Eng. Res. 2011, 12, 209–226. [Google Scholar] [CrossRef]
  5. Di Sarli, V.; Di Benedetto, A. Modeling and simulation of soot combustion dynamics in a catalytic diesel particulate filter. Chem. Eng. Sci. 2015, 137, 69–78. [Google Scholar] [CrossRef]
  6. Di Sarli, V.; Landi, G.; Lisi, L.; Saliva, A.; Di Benedetto, A. Catalytic diesel particulate filters with highly dispersed ceria: Effect of the soot-catalyst contact on the regeneration performance. Appl. Catal. B Environ. 2016, 197, 116–124. [Google Scholar] [CrossRef]
  7. Tow, T.C.; Pierpont, D.A.; Reitz, R.D. Reducing Particulate and NOx Emissions by Using Multiple Injections in a Heavy Duty DI Diesel Engine; SAE Technical Paper; SAE International: Warrendale, PA, USA, 1994. [Google Scholar]
  8. Shundoh, S.; Komori, M.; Tsujimura, K.; Kobayashi, S. NOx Reduction from Diesel Combustion Using Pilot Injection with High Pressure Fuel Injection; SAE Technical Paper; SAE International: Warrendale, PA, USA, 1992. [Google Scholar]
  9. Nehmer, D.A.; Reitz, R.D. Measurement of the Effect of Injection Rate and Split Injections on Diesel Engine Soot and NOx Emissions; SAE Technical Paper; SAE International: Warrendale, PA, USA, 1994. [Google Scholar]
  10. Chen, S. Simultaneous Reduction of NOx and Particulate Emissions by Using Multiple Injections in a Small Diesel Engine; SAE Technical Paper; SAE International: Warrendale, PA, USA, 2000. [Google Scholar]
  11. Miyaki, M.; Fujisawa, H.; Masuda, A.; Yamamoto, Y. Development of New Electronically Controlled Fuel Injection System ECD-U2 for Diesel Engine; SAE Technical Paper; SAE International: Warrendale, PA, USA, 1991. [Google Scholar]
  12. Guerrassi, N.; Dupraz, P. A Common Rail Injection System for High Speed Direct Injection Diesel Engines; SAE Technical Paper; SAE International: Warrendale, PA, USA, 1998. [Google Scholar]
  13. Benajes, J.; Molina, S.; Garcia, J. Influence of Pre- and Post-Injection on the Performance and Pollutant Emissions in a HD Diesel Engine; SAE Technical Paper; SAE International: Warrendale, PA, USA, 2001. [Google Scholar]
  14. Payri, R.; Benajes, J.; Molina, S.; Soare, V. Investigation of the influence of injection rate shaping on the spray characteristics in a diesel common rail system equipped with a piston amplifier. J. Fluids Eng. 2005, 127, 1102–1110. [Google Scholar]
  15. Bianchi, G.M.; Pelloni, P.; Corcione, F.E.; Luppino, F. Numerical Analysis of Passenger Car HSDI Diesel Engines with the 2nd Generation of Common Rail Injection Systems: The Effect of Multiple Injections on Emissions; SAE Technical Paper; SAE International: Warrendale, PA, USA, 2001. [Google Scholar]
  16. Corcione, F.E.; Vaglieco, B.M.; Corcione, G.E.; Lavorgna, M. Potential of Multiple Injection Strategy for Low Emission Diesel Engines; SAE Technical Paper; SAE International: Warrendale, PA, USA, 2002. [Google Scholar]
  17. Schmid, M.; Leipertz, A.; Fettes, C. Influence of Nozzle Hole Geometry, Rail Pressure and Pre-Injection on Injection, Vaporisation and Combustion in a Single-Cylinder Transparent Passenger Car Common Rail Engine; SAE Technical Paper; SAE International: Warrendale, PA, USA, 2002. [Google Scholar]
  18. Patterson, M.A.; Kong, S.C.; Hampson, G.J.; Reitz, R.D. Modeling the Effects of Fuel Injection Characteristics on Diesel Engine Soot and NOx Emissions; SAE Technical Paper; SAE International: Warrendale, PA, USA, 1994. [Google Scholar]
  19. Han, Z.; Uludogan, A.; Hampson, G.J.; Reitz, R.D. Mechanism of Soot and NOx Emission Reduction Using Multiple-Injection in a Diesel Engine; SAE Technical Paper; SAE International: Warrendale, PA, USA, 1996. [Google Scholar]
  20. Wang, D.; Zhang, C.; Wang, Y. A numerical study of multiple fuel injection strategies for NOx reduction from DI Diesel engines. Int. J. Green Energy 2007, 4, 453–470. [Google Scholar] [CrossRef]
  21. Peters, N. Laminar diffusion flamelet models in a non-premixed turbulent combustion. Prog. Energy Combust. Sci. 1984, 10, 319–339. [Google Scholar] [CrossRef]
  22. Hasse, C.; Peters, N. A two mixture fraction flamelet model applied to split injections in a DI Diesel engine. Proc. Combust. Inst. 2005, 30, 2755–2762. [Google Scholar] [CrossRef]
  23. Pitsch, H.; Wan, Y.P.; Peters, N. Numerical Investigation of Soot Formation and Oxidation under Diesel Engine Conditions; SAE Technical Paper; SAE International: Warrendale, PA, USA, 1995. [Google Scholar]
  24. Lim, J.; Lee, S.; Min, K. Combustion modelling of split injection in HSDI Diesel engines. Combust. Sci. Technol. 2010, 183, 180–201. [Google Scholar] [CrossRef]
  25. Kim, G.; Min, K. Numerical Study on the Multiple Injection Strategy in Diesel Engines Using a Modified 2-D Flamelet Model; SAE Technical Paper; SAE International: Warrendale, PA, USA, 2015. [Google Scholar]
  26. Felsch, C.; Gauding, M.; Hasse, C.; Vogel, S.; Peters, N. An extended flamelet model for multiple injections in DI Diesel engines. Proc. Combust. Inst. 2009, 32, 2775–2783. [Google Scholar] [CrossRef]
  27. Mittal, V.; Cook, D.J.; Pitsch, H. An extended multi-regime flamelet model for IC engines. Combust. Flame 2012, 159, 2767–2776. [Google Scholar] [CrossRef]
  28. Doran, E.M.; Pitsch, H.; Cook, D.J. A priori testing of two-dimensional unsteady flamelet model for three-feed combustion systems. Proc. Combust. Inst. 2013, 34, 1317–1324. [Google Scholar] [CrossRef]
  29. Pitsch, H.; Barths, H.; Peters, N. Three-Dimensional Modelling of NOx and Soot Formation in DI-Diesel Engines Using Detailed Chemistry Based on the Interactive Flamelet Approach; SAE Technical Paper; SAE International: Warrendale, PA, USA, 1996. [Google Scholar]
  30. Hergart, C.; Barths, H.; Peters, N. Modeling the Combustion in a Small-Bore Diesel Engine Using a Method Based on Representative Interactive Flamelets; SAE Technical Paper; SAE International: Warrendale, PA, USA, 1999. [Google Scholar]
  31. Pitsch, H.; Riesmeier, E.; Peters, N. Unsteady flamelet modelling of soot formation in turbulent diffusion flames. Combust. Sci. Technol. 2000, 158, 389–406. [Google Scholar] [CrossRef]
  32. Yu, Y.; Kim, S.; Kim, Y. Numerical modelling for auto-ignition and combustion process of fuel sprays in high-pressure environment. Combust. Sci. Technol. 2001, 168, 85–112. [Google Scholar] [CrossRef]
  33. Jones, W.P.; Whitelaw, J.H. Calculation methods for reacting turbulent flows: A review. Combust. Flame 1982, 48, 1–26. [Google Scholar] [CrossRef]
  34. Pitsch, H.; Chen, M.; Peters, N. Unsteady flamelet modelling of turbulent hydrogen-air diffusion flames. Symposium (Int.) Combust. 1998, 27, 1057–1064. [Google Scholar] [CrossRef]
  35. Girimaji, S.S. Assumed β-pdf model for turbulent mixing: Validation and extension to multiple scalar mixing. Combust. Sci. Technol. 1991, 78, 177–196. [Google Scholar] [CrossRef]
  36. Kee, R.J.; Rupley, F.M.; Miller, J.A. The Chemkin Thermodynamic Data Base. No. SAND-87-8215B, Technical Report; USA, 1990. Available online: https://www.osti.gov/scitech/biblio/7073290-chemkin-thermodynamic-data-base/ (accessed on 28 August 2017).
  37. Yakhot, V.; Orszag, S.A. Renormalization group analysis of turbulence. I. Basic theory. J. Sci. Comput. 1986, 1, 3–51. [Google Scholar] [CrossRef]
  38. Patel, A.; Kong, S.C.; Reitz, R.D. Development and Validation of a Reduced Reaction Mechanism for HCCI Engine Simulations; SAE Technical Paper; SAE International: Warrendale, PA, USA, 2004. [Google Scholar]
  39. GRI-Mech 3.0. Available online: http://www.me.berkeley.edu/gri_mech/ (accessed on 17 July 2017).
  40. Reitz, R.D.; Diwakar, R. Effect of Drop Breakup on Fuel Sprays; SAE Technical Paper; SAE International: Warrendale, PA, USA, 1986. [Google Scholar]
  41. Bardi, M.; Payri, R.; Malbec, L.M.; Bruneaux, G.; Pickett, L.M.; Manin, J.; Bazyn, T.; Genzale, C.L. Engine combustion network: Comparison of spray development vaporization, and combustion in different combustion vessels. At. Sprays 2012, 22, 807–842. [Google Scholar] [CrossRef]
  42. Herzog, P.L.; Bürgler, L.; Winklhofer, E.; Zelenka, P.; Cartellieri, W. NOx Reduction Strategies for DI Diesel Engines; SAE Technical Paper; SAE International: Warrendale, PA, USA, 1992. [Google Scholar]
  43. Desantes, J.M.; Benajes, J.; Molina, S.; Gonzelez, C.A. The modification of the fuel injection rate in heavy-duty diesel engines. Part 1: Effect on engine performance and emissions. Appl. Therm. Eng. 2004, 24, 2701–2714. [Google Scholar] [CrossRef]
  44. Ikemoto, M.; Omae, K.; Shimode, K.; Toda, N. Diesel spray and combustion development using nozzle flow visualization, spray and combustion analyses. In Proceedings of the International Conference: SIA Powertrain—Rouen 2016, Rouen, France, 1–2 June 2016; Available online: http://www.sia.fr/evenements/12-sia-powertrain-rouen-2016?calendrier=1#planning/ (accessed on 28 July 2017).
  45. Hardy, W.L.; Reitz, R.D. An Experimental Investigation of Partially Premixed Combustion Strategies Using Multiple Injections in a Heavy-Duty Diesel Engine; SAE Technical Paper; SAE International: Warrendale, PA, USA, 2006. [Google Scholar]
  46. Poorghasemi, K.; Ommi, F.; Yaghmaei, H.; Namaki, A. An investigation of high pressure post injection on soot and NO emissions in a DI diesel engine. J. Mech. Sci. Technol. 2012, 26, 269–281. [Google Scholar] [CrossRef]
  47. Diwakar, R.; Domenech-Llopis, V. Physics of Combustion Noise Reduction with Multiple Injections in a DI Diesel Engine—A Computational Study; SAE Technical Paper; SAE International: Warrendale, PA, USA, 2017. [Google Scholar]
  48. Kim, M.; Yoon, S.; Lee, C. Impact of split injection strategy on the exhaust emissions and soot particulates from a compression ignition engine fueled with neat biodiesel. Energy Fuels 2008, 22, 1260–1265. [Google Scholar] [CrossRef]
Figure 1. Simulation result of flame structure (a,b) and corresponding NO emissions (c,d) using each flamelet model in box mesh (108 × 108 × 54 mm 3 ) with no EGR rate ( O 2 = 21%) and a total fuel mass of 11 mg, including 1 mg of first injection and 10 mg of second injection under 100 μs (left) and 400 μs (right) of dwell time. The NO emissions are normalized by the value of NO emissions when the time ASOI is 1200 μs in 400 μs of dwell time.
Energies 10 01292 g001
Figure 2. Simulation results where a small amount of fuel mass is implemented for both injection events (a) flame structure and (b) 2-D contour of temperature solution using each model. The ambient temperature and pressure are 800 K and 40 bar, respectively, with an EGR rate = 20%, and the other conditions are the same as the simulations in Figure 1.
Energies 10 01292 g002
Figure 3. Vapor penetration length from experiments and simulation at 900 K and 60 bar. The Reitz-Diwakar model [40] was used for the spray breakup process. Mixture condition is non-reacting gas where oxygen concentration is zero, and the injection pressure is 1500 bar.
Energies 10 01292 g003
Figure 4. Pressure history (top), heat release rate history (middle) and NO emissions (bottom) from the simulation results of 6 base conditions.
Energies 10 01292 g004
Figure 5. Temperature contours (upper) of instantaneous flamelet solutions of the base condition. The crank angle in the parenthesis is when the collapse method is about to be applied. Comparison of temperature solutions (lower) before and after the collapse of the solution in case 1.
Energies 10 01292 g005
Figure 6. Pressure histories and NO emissions in the change of the injection timing by 4 CA (left) and of the injection pressure by 100 bar (right). Firing TDC is 720 CA.
Energies 10 01292 g006
Figure 7. Pressure history and NO emissions for an 8% change of the EGR rate under the same boost pressure (left) and a 4% change (right). Firing TDC is 720 CA.
Energies 10 01292 g007
Figure 8. Time history of in-cylinder pressure and heat release rate ((a): case 3; (b): case 5; (c): case 6 of base condition (Table 2), solid line: pressure, solid with marker: heat release rate) according to each needle opening rate (black: base, red: fast opening rate, orange: slow opening rate).
Energies 10 01292 g008
Figure 9. (a) NO and PM emissions of each case (long dashed line: case 3, solid line: case 5, short dashed line: case 6/black: base, red: fast opening rate, orange: slow opening rate, purple: fast opening rate with additional EGR supply); (b) Injection profile of each opening rate and the injected mass after the time of maximum heat release rate; (c) Instantaneous vector flow field of each opening rate at after TDC 7 CA degree.
Energies 10 01292 g009
Figure 10. Time history (CA) of in-cylinder pressure (left) and heat release rate (right). Base condition: case 5 (Table 2). The term CA in each graph means the crank angle of the injection timing of both pilot injections retarded from the base condition.
Energies 10 01292 g010
Figure 11. (a) NOx and PM emissions results of each dwell time; (b) Spatial distribution of OH radical at aTDC 30 CA degree; (c) Volumetric area of OH radical and mean temperature in the area; (d) Combustion duration (MFB 5-95CA) of each dwell time.
Energies 10 01292 g011
Table 1. Target engine specifications.
ParametersValues
Bore77.2 mm
Stroke84.5 mm
Connecting rod length140.0 mm
Displacement1592 cc (396 cc/cylinder)
Compression ratio17.3:1
Piston bowl shapeω-type
IVO/IVCaTDC 17 CA/aBDC 14 CA
EVO/EVCbBDC 23 CA/bTDC 20 CA
Injection systemCommon-rail with solenoid injector
Spray angle156°
Injector hole diameter0.124 mm
Injector number of holes7
Table 2. Operating conditions for the numerical simulation.
CaseRPMFuel Mass (mg)EGR Rate (%)Injection StrategiesEquivalent Ratio
11500435.4Triple Injection
(PI/PI/MI)
0.29
2150013.522.60.67
3150026.60Quadruple Injection
(PI/PI/MI/Po)
0.73
420008.8533Triple Injection
(PI/PI/MI)
0.52
5200017.116.1Quadruple Injection
(PI/PI/MI/Po)
0.62
6250028.210.40.65
Table 3. Operating conditions for the parametric variations.
CaseDetails of Parametric Variations
3-I1Injection timing Δ = −4 CA from case 3
3-I2Injection timing Δ = +4 CA from case 3
5-P1Injection pressure Δ = −100 bar from case 5
5-P2Injection pressure Δ = +100 bar from case 5
5-E1EGR rate Δ = −8% (abs.) from case 5
5-E2EGR rate Δ = +8% (abs.) from case 5
6-B1Boost pressure Δ = −4% (rel.) from case 6
6-B2Boost pressure Δ = +4% (rel.) from case 6

