Towards a Residential Air-Conditioner Usage Model for Australia


Commonwealth Scientific and Industrial Research Organisation (CSIRO), Newcastle 2304, Australia
Energies 2017, 10(9), 1256; https://doi.org/10.3390/en10091256
Submission received: 22 June 2017
/
Revised: 18 August 2017
/
Accepted: 18 August 2017
/
Published: 24 August 2017
(This article belongs to the Section D: Energy Storage and Application)
Abstract
:Realistic models of occupant behaviour in relation to air-conditioner (a/c) use are fundamentally important for developing accurate building energy simulation tools. In Australia and elsewhere, such simulation tools are inextricably bound both in legislation and in the design of new technology, electricity infrastructure and regulatory schemes. An increasing number of studies in the literature confirm just how important occupants are in determining overall energy consumption, but obtaining the data on which to build behaviour models is a non-trivial task. Here data is presented on air-conditioner usage derived from three different types of case study analyses. These are: (i) use of aggregate energy consumption data coupled with weather, demographic and building statistics across Australia to estimate key predictors of energy use at the aggregate level; (ii) use of survey data to determine characteristic a/c switch on/off behaviours and usage frequencies; and (iii) use of detailed household level sub-circuit monitoring from 140 households to determine a/c switch on/off probabilities and their dependence on different building and occupant parameters. These case studies are used to assess the difficulties associated with translation of different forms of individual, aggregate and survey based information into a/c behaviour simulation models. Finally a method of linking the data gathering methodologies with the model development is suggested. This method would combine whole-of-house “smart”-meter data measurements with linked targeted occupant surveying.
1. Introduction
The ability to understand and predict when occupants will use air-conditioning, and the energy consumed when doing so, is important for design of electricity infrastructure, for developing regulations aimed at reducing household energy consumption, and for designing systems that provide occupants with better comfort outcomes at lower economic and environmental cost. Understanding building air-conditioning energy consumption is particularly important in the first two respects because it contributes 40% of household energy usage in Australia [1], and because air-conditioning is the primary driver of peak electricity consumption in most states of Australia [2].
In Australia, all new residential buildings constructed must meet a minimum building energy efficiency level that is assessed through annual thermal simulation of the proposed building, combined with representative weather data and assumptions around occupancy and air-conditioning (a/c) usage behaviour. The modelling requirements are documented by the Nationwide House Energy Rating Scheme (NatHERS) regulator [3] and dedicated tools [4] have been developed to perform the analysis. Thus, assumptions around how occupants will behave in relation to a/c use, and the simulation models themselves are effectively enshrined in Australian law, with far reaching implications for the building construction industry and for the design of the approximately 20,000 new dwellings built every month [5].
Given this, our goal is to develop improved models of residential air-conditioning use in Australia, not only to improve energy use predictions, but also to facilitate better building and technology design. However, as will be explored in this work, such models must be built on a comprehensive and representative set of data and there is limited existing data available in this area particularly in the Australian context. Before proceeding however, it is important first to review the evidence for the importance of occupant behaviour on building energy consumption, noting in the process the methods of gathering the data used to make these assessments. This is not an exhaustive review, but by necessity international works have been considered.
In the study by Lutzenhiser et al. [6] modelling combined with survey derived information on equipment usage patterns was used to simulate three representative detached houses—stated to represent approximately 70% of the Californian building stock—in four climate zones with a range of different occupancy schedules, a/c control strategies, appliance efficiencies and energy consumption levels. A total of 9500 different model combinations were considered. The authors found that variations due to the climate and building together contributed less than 20% of the total household demand, and that variations across occupant a/c usage behaviour lead to 30 to 50% of the demand variation (with remaining variation due to occupant behaviour in relation to other appliances). Being a model-based approach, the authors were readily able to compare the influence of different building and equipment changes on consumption. However, variations in a/c usage behaviour were largely confined to set-point temperature levels and the occupancy pattern—both of which were based on occupant reported behaviour—which the authors note is sometimes less reliable.
In a widely reported study by Li and Jiang [7], direct measurements of a/c energy consumption for 25 apartments within the same residential building in Beijing were made over a summer. Energy consumption for cooling varied between 0 and 14.3 kWh/m² with an average of 2.3 kWh/m²—the variation entirely due to different occupant behaviours given that the apartment base construction and climate were identical. However, the extent to which the data from this one building can be extrapolated to similar apartment buildings in the same city—let alone to other types of buildings and occupants in other locations—is unclear.
In another study, Daniel et al. [8] surveyed the a/c usage behaviour off approximately 175 occupants living in buildings specifically designed to have low energy consumption. The survey responses were then used in a simulation model to compare the predicted energy consumption of 3 selected air-conditioned houses firstly with the standard occupant behaviour assumptions used for NatHERS rating and then using the actual occupant behaviours. Model predictions were also compared with several months’ of measurements from the 3 houses. Results showed that when the actual occupant behaviour was used the annual energy consumption was an order of magnitude less for a temperate climate and 2.6 times less for a cool temperature climate. These results give useful insights into the importance of occupant behaviour—though for a specific type of low energy consumption building only—and a small sample of occupants.
Meanwhile, Ren et al. [9] expanded the capability of the rating software by adding 6 different representative overall house occupancy patterns based on an Australian Bureau of Statistics (ABS) survey of how Australians use their time. They assumed that when the house was occupied, a/c was used in the zone if the indoor temperature was above a certain set-point. A sensitivity analysis of a highly efficient zero-emission house under the assumed occupancy scenarios showed a 20% variation in annual consumption in Melbourne. However, in this study only the occupancy was varied and not specifically how the a/c was used—i.e., under what conditions a/c was switched on and off.
As discussed by Rupp et al. [10], accurately predicting the extent to which an individual will feel comfortable in a given situation is an extremely difficult task in general. However, a further layer of behaviour complexity exists between the state of being uncomfortable and the action taken to modify this situation. For example, Soebarto and Bennetts [11] monitored 60 households in Adelaide, Brisbane, and Sydney in an attempt to understand whether low-to-middle income occupants were satisfied with their thermal environment and the actions taken if they were unsatisfied. Ten of these households in a modern “green village” development were also instrumented with temperature and a/c monitoring equipment, and occupants were given regular comfort surveys. All houses had a/c only in the living room. The majority of occupants used a/c only occasionally, instead turning on ceiling fans, followed by opening/closing windows and doors, closing curtains, changing clothes, going outside, and having a shower all before finally switching on a/c if they were still uncomfortable. All households stated the cost of running a/c as a concern. Interestingly, 60% of thermal comfort survey responses indicated “slightly warm” to “hot” but only 43% of these indicated that they actually wanted to be cooler. That is, being “not neutral” does not necessarily mean “wanting to be cooler.” This study is an example of using a combination of survey and monitoring data to give revealing interesting insights into a specific group of behaviours, behaviours that are considerably different from those often assumed. Though of course, once again it would not be appropriate to generalize these results across the wider population, building stock, and range of climates.
Finally, several studies—including [11]—also report that the ability of occupants to control their own environment is critical for improving the range of conditions considered comfortable. For example, Frontczak and Wargocki [12] report that users are more tolerant of conditions in naturally ventilated buildings, while Stevenson and Rijal [13] also note that it is critical that occupants understand how to operate their home to maximise both comfort and energy efficiency. The importance of the “human factor” has also been discussed in the compressive review of general occupant behaviour modelling by Yan et al. [14], who cite several authors whose results have shown this (please see the review paper for references).
Overall these studies paint a clear picture: occupant behaviour in relation to building air-conditioning energy use is not just the biggest remaining unknown, but the single most important of all parameters. Moreover, representative data covering a wide range of behaviours is central to the development of new models. Use of survey-based information is a common feature in these studies but is typically supported by validation with direct measurements, usually with the aid of simulation models. In Section 1.2 a brief review of a/c usage models implemented in simulation programs is presented. However, before this, a key distinction in these usage models is discussed—the difference between understanding how a/c is used currently versus why it is used in that way.
1.1. Air-Conditioner Usage: The How and the Why
Understanding and developing models for how occupants behave is clearly essential for predicting energy use. However, a broader understanding of why occupants act in the way that they do leads to a vastly increased ability to predict behaviour over time or once changes to the existing status quo—such as tariff changes or technology improvements—are made. When gathering methodologies, designing data and the simulation models built upon them, it is important to keep this distinction in mind, and hence to understand the limitations of the existing models that deal almost exclusively with the how.
Figure 1 shows a conceptual diagram of the problem. As discussed in a recent review of residential energy consumption behaviours [15], an individual household’s energy and a/c consumption profile is likely the result of many confounding factors. Some of these, for example demographics, climate or building characteristics, are readily measurable and quantifiable and statistical information at the collective level is often available. Others—such as individual priorities, lifestyles, or motivations—are difficult to formalize and measure, profoundly inter-related, and are likely to be evolving over time and/or changing in response to particular events. The contribution of individual behaviours to overall household a/c usage further confounds the problem. The constantly changing, evolving nature of human behaviour in response to a multitude of factors defies simplistic explanation, and certainly no air-conditioner behavioural model could be found in the literature that seeks to understand the why of occupant behaviour as opposed to the how at a stationary moment in time.
Two fundamental approaches may be taken to the problem of obtaining data for use in developing models of a/c behaviour. In the “top-down” approach, data gathering begins at the aggregate level (for example sub-station, suburb or town). Techniques such as clustering may be used to identify typical representative usage that can then be correlated with known characteristics such as demographics using statistical regression techniques (paths A, B and C). This analysis may be made either using time integrated data (for example annual averages or totals), or time dependent (for example 30 min electricity meter) data. The approach yields a predictive capability in that the derived models should be applicable for predicting energy use in response to different weather patterns, or in different regions with known values of the regression predictors (such as demographics). However, because they don’t account for many individual human behaviour characteristics, these models are unlikely to be useful for predicting how usage may change in response to, for example tariff changes, technology or building fabric improvements.
In the second method, the “bottom-up” approach, data gathering begins at the occupant or household level, for example using surveys or electricity metering. This information may be aggregated to build typical representative patterns of a/c energy usage (paths D and E). As for the top-down approach, the analysis may be made either using time integrated or time dependent data. However, depending on the extent of information gathered—for example, on areas such as motivations, circumstances and priorities at the occupant or household level—the models developed may have some ability to predict changing usage patterns. That is, such an approach could be used to help understand the “why” of occupant behaviour. However, this requires careful design of the data gathering methods, with close attention to psycho-social considerations; issues that are not typically the primary concern of users and developers of building energy use models such as engineers, architects and industry professionals.
1.2. Air-Conditioner Usage Models
According to Yan et al. [14], occupant behaviour models may be broadly classified as either deterministic or stochastic. An example of the former are a/c on/off set-points at specific values of temperature or times of the day. In stochastic models, the behaviour is defined in terms of a probability of the action occurring. Stochastic models require multiple independent simulation runs and yield a distribution of output results. However, these models are arguably more realistic because they can take account of the variability of real behaviour. Although there are a number of publications in the literature covering different air-conditioner operation models, here the focus is on two key recent publications that use a stochastic approach.
In the first paper, Ren et al. [16], describe a discrete-time Markov chain based approach for modelling a/c behaviour. They performed an initial investigation of 34 families in 6 cities across China with measurements of indoor temperature, CO2 and a/c energy use, as well as interviews to uncover a/c usage patterns. From these, 3 families were selected as being “typical” and were studied over a 2 month period. For these families, the a/c usage was closely linked to the indoor temperature with the probability of turning on a/c fit to three-parameter probability distribution functions for each family and each conditioned room. The magnitude of these probabilities were very different for each of the 3 families. In addition, event driven probability functions and combined event and temperature probability functions were also proposed.
Recently Feng et al. [17] extended the work of Ren et al. performing surveys of residents in Chengdu, China resulting in approximately 500 responses to a/c on/off behaviour questions targeting information on when the respondents switched on and off their a/c. This resulted in 52 combinations of on/off behaviour that were then used in a simulation model of a residential apartment. The cooling energy consumption over 3 days was estimated using one set of probability functions determined previously by Ren et al. combined with a model of occupancy prediction. The resultant a/c consumption ranged from 0 to 29.1 kWh/m². Cluster analysis was then used to determine the 5 clusters of energy consumption and the corresponding a/c on/off behaviour combinations that covered the majority of behaviours.
Together, these studies show a way forward to gather the data from which to build more realistic a/c use models in simulation tools. However, to be truly reflective of actual behaviour it is necessary to use as broader base of measured data from which to build the underling probability functions and models.
Especially in the Australian context, the required underlying data from which to build a comprehensive a/c usage model is not currently available, though references to some data sources in addition to those noted above are given throughout this paper. Hence, before proceeding to develop and implement such models in building simulation tools, it is necessary firstly to formulate a data gathering and analysis methodology. Thus, here 3 case studies are used to explore different data gathering approaches. The results presented are in themselves useful for the development of building air-conditioner simulation tools, though the approaches taken are also assessed in terms of their comparative strengths and weakness for developing air-conditioner usage models for building simulation tools.
2. Results
2.1. Case Study 1: Aggregate Level Energy Data Analysis
In the first case study, aggregate level dwelling energy use data was linked with aggregate data on the dwelling characteristics, demographics and climate, and a statistical analysis was performed. This is equivalent to path “A” in Figure 1. Although this analysis used total household energy consumption and not a/c energy consumption, and hence is likely to underestimate the effect of climate and building thermal performance, a/c energy use is a substantial portion of total energy use for most households, even in relatively mild climates.
The energy data analysed are quintiles of the distributions of annual residential dwelling energy consumption for approximately 2000 Statistical Area Level 2 (SA2) regions (each SA2 consisting of on average 10,000 people) across Australia for the year 2011 published by the ABS [18]. Least squares regression was used to fit these quintiles to a cumulative Weibull distribution for the energy consumption distribution for each SA2 region. The root mean square (RMS) error of this fit in terms of the quintile locations was 1.29% across all regions.
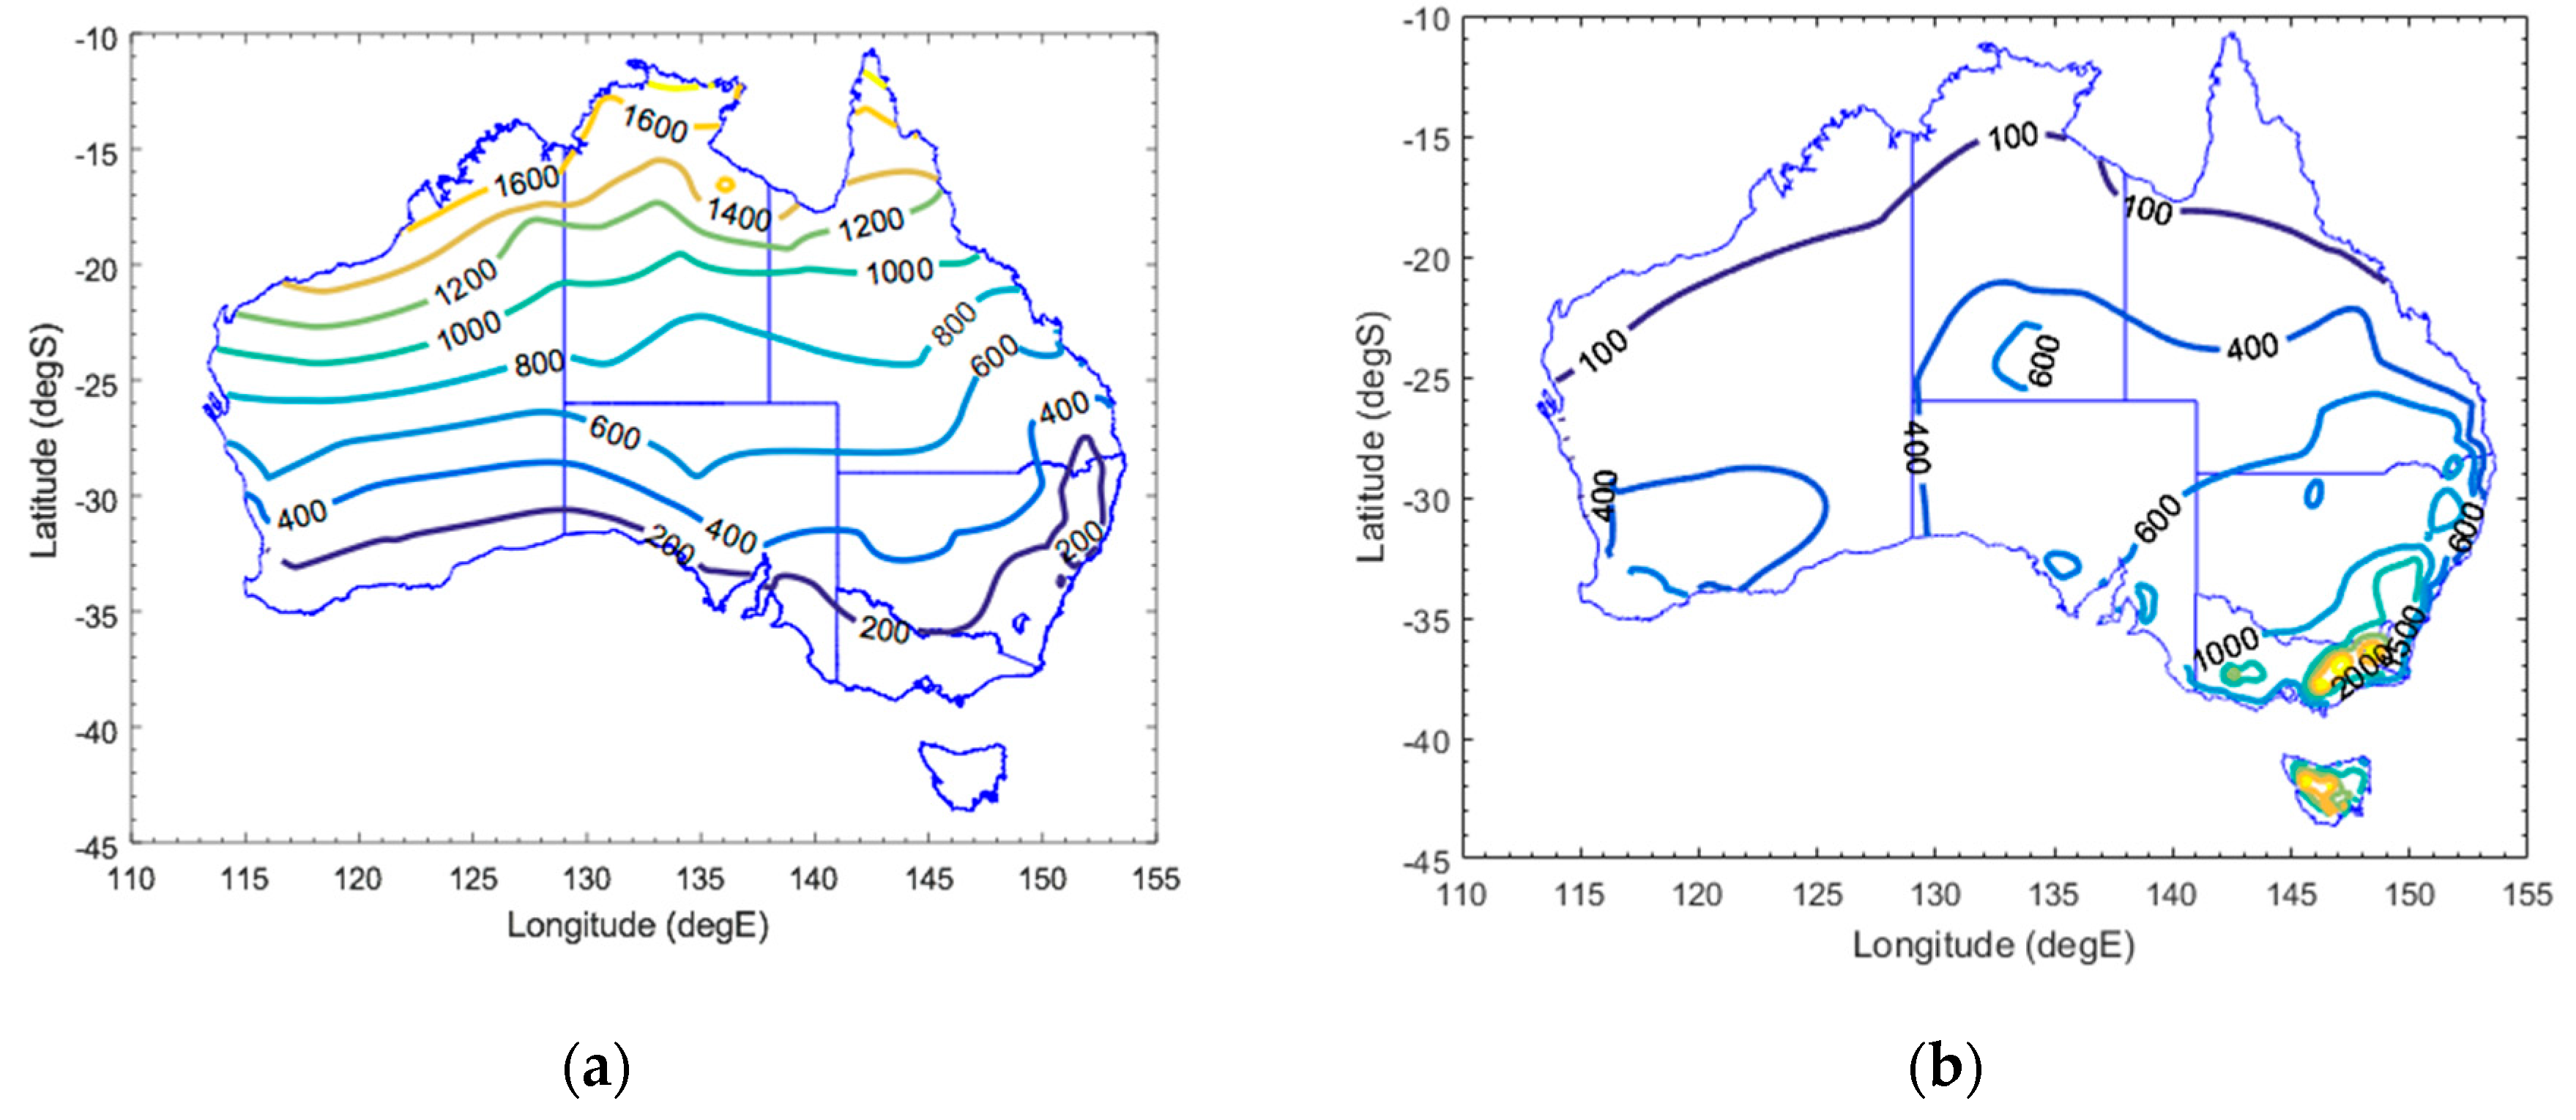
This energy use data was linked with climate data for the same year (2011) provided by the Bureau of Meteorology [19] using the geographically nearest weather station to the centroid of each SA2 region. Climate data was represented in terms of two parameters, the annual Cooling Degree Days (CDD) and annual Heating Degree Days (HDD) both calculated using the apparent temperature [20]. Contours of CDD and HDD are shown across Australia in Figure 2.
The energy use and climate data were combined with demographic and dwelling data from two sources. The proportion of households with equivalized total weekly household income in 10 different levels was obtained for each SA2 region for 2011 from the Australian Census [21]. Additional demographic and building information was obtained from the National Exposure Information System (NEXIS) provided by Geoscience Australia [22]. This data is provided at a higher resolution (approximately 50,000 SA1 regions) and so was aggregated to produce values for the SA2 regions used here. Further details are given in the Appendix A.
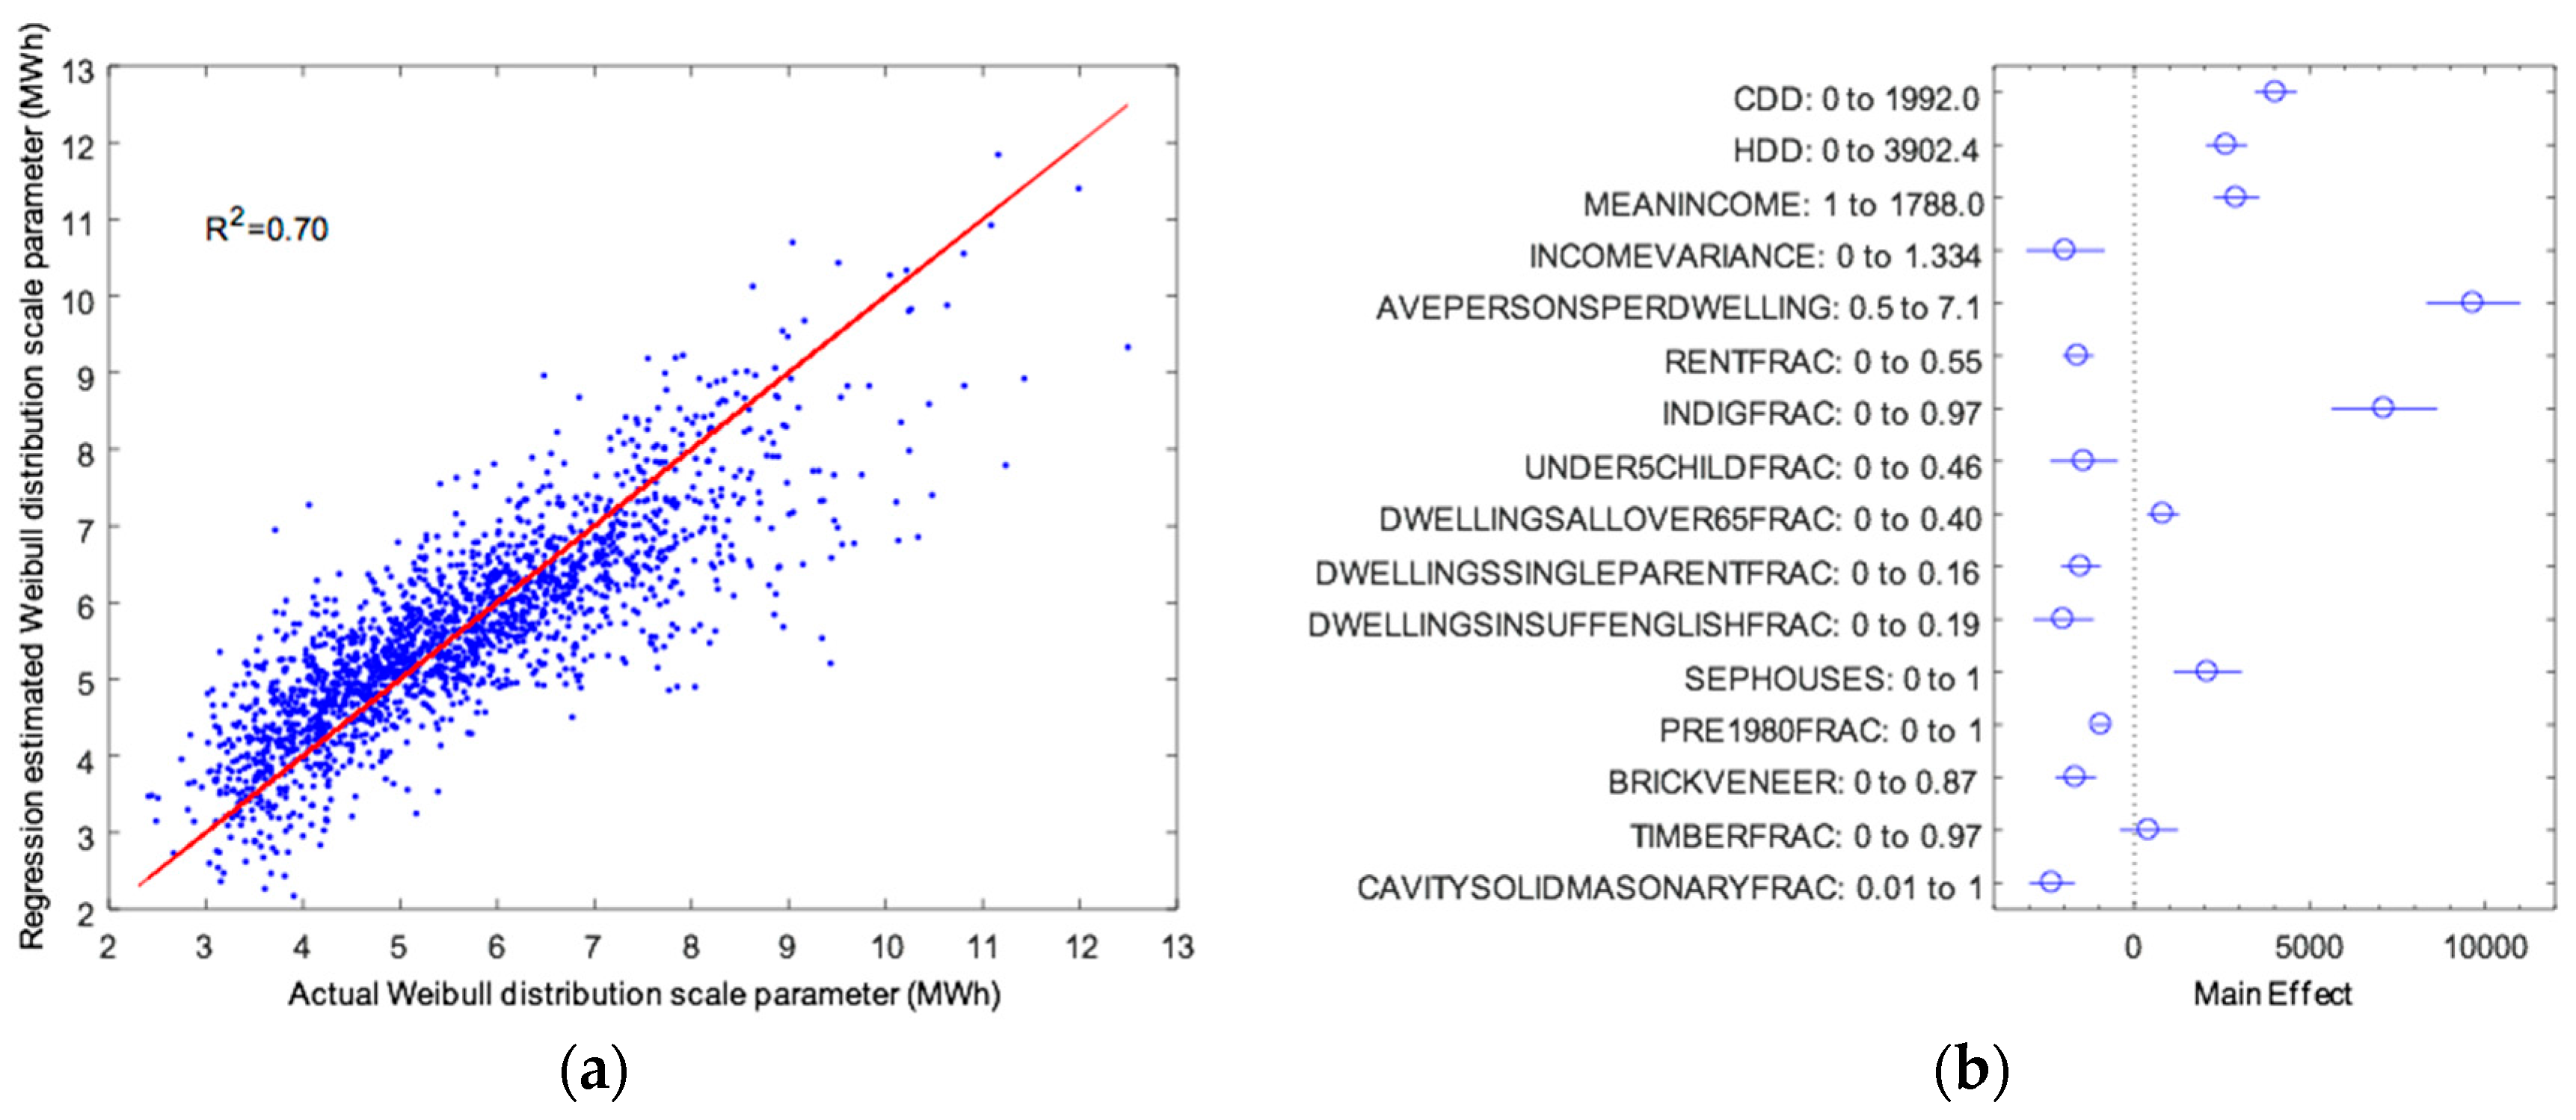
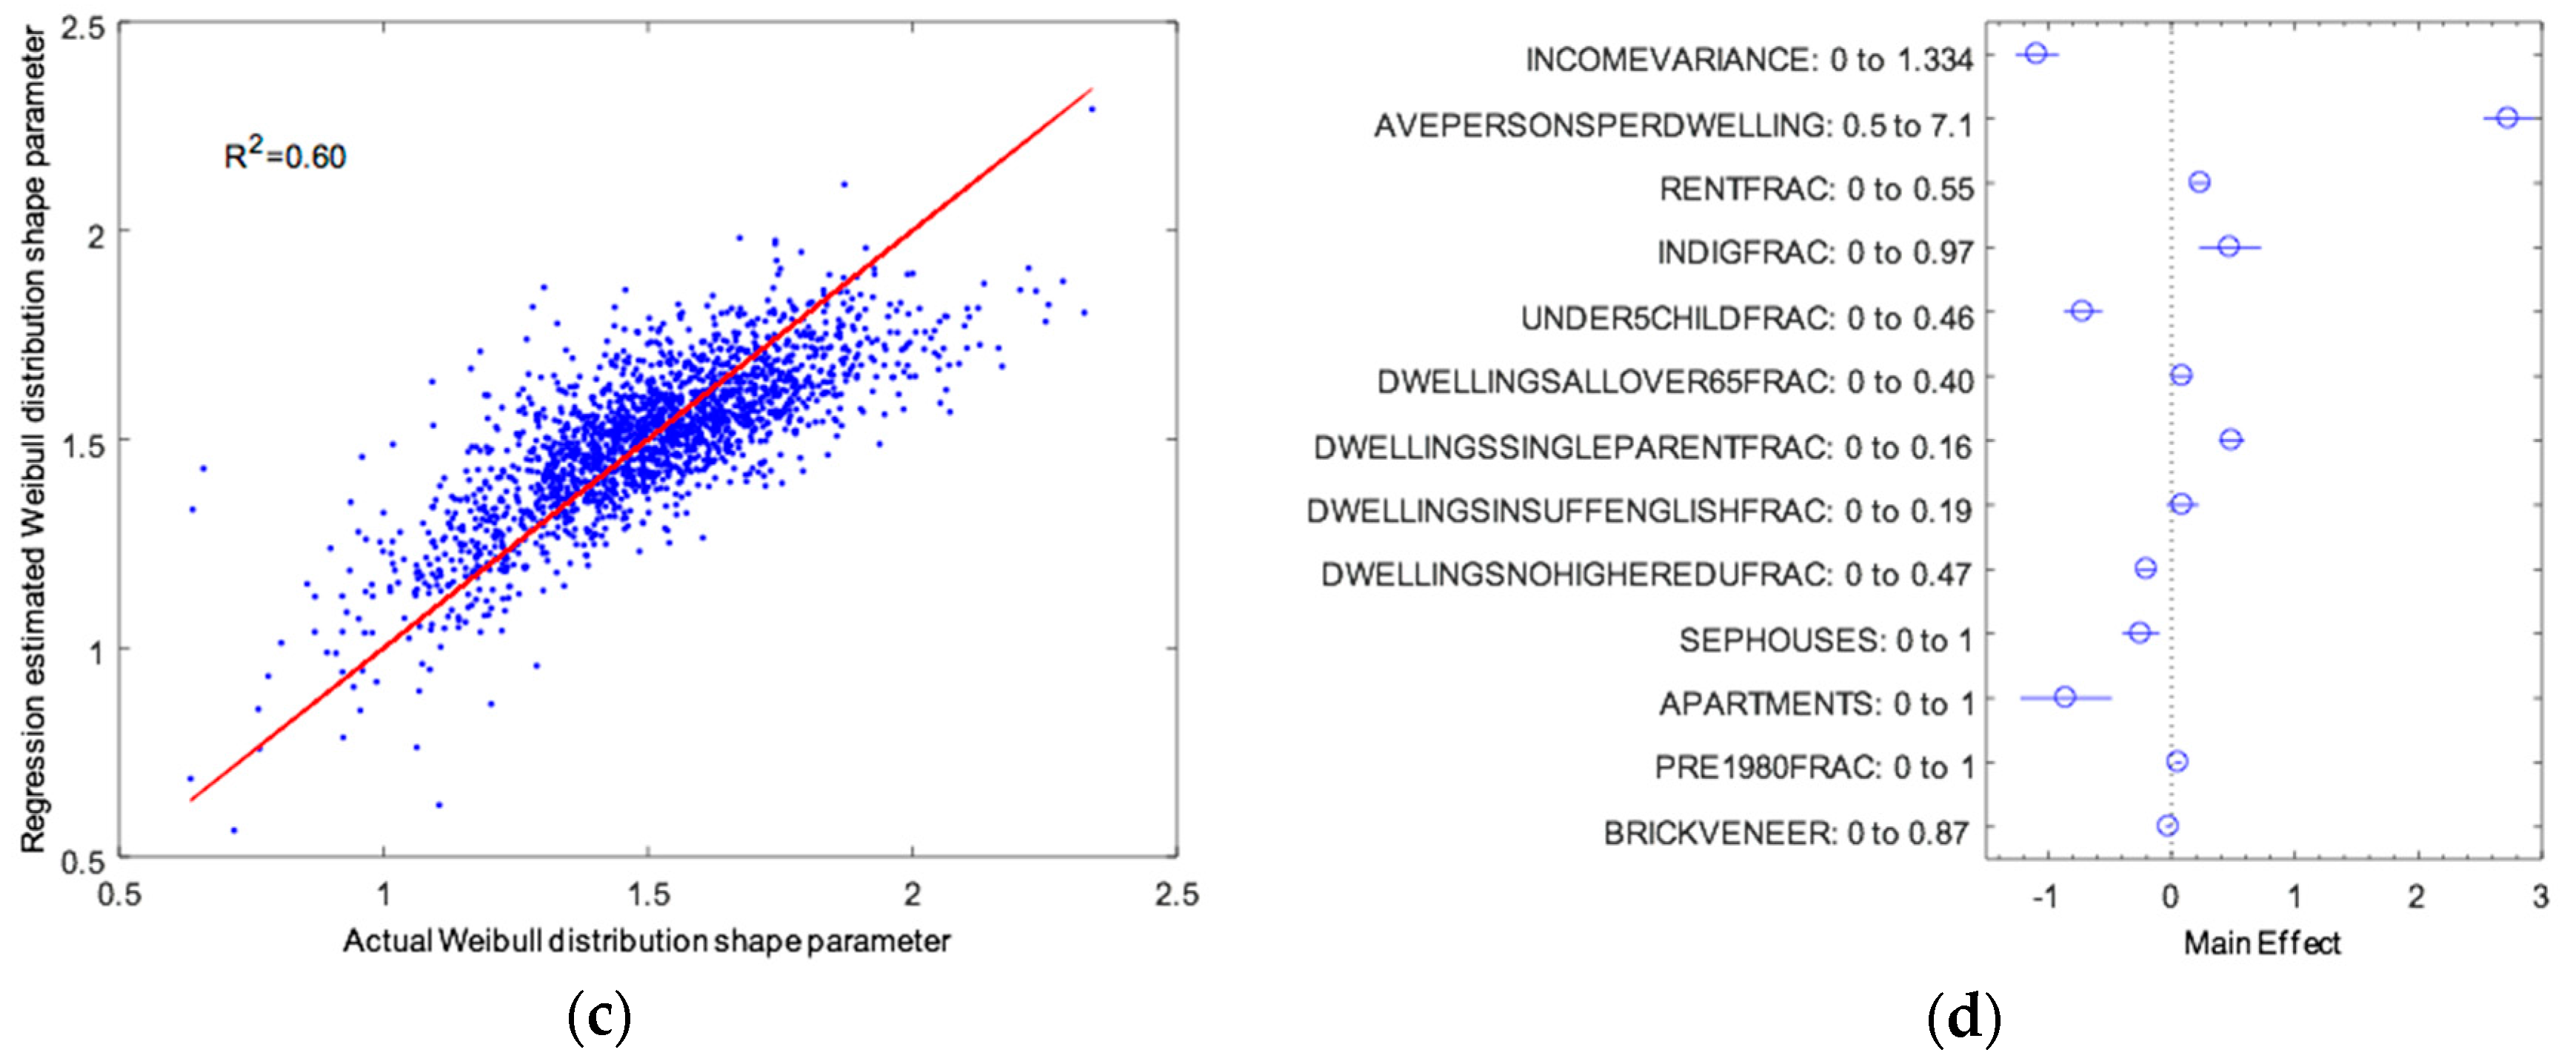
Regression analysis was performed to estimate the two Weibull energy distribution parameters, the scale parameter (similar to the mean) and the shape parameter (an indicator of spread), for each SA2 region using the climate, building and demographic variables as predictors. A step-wise least squares regression was performed, allowing for first-order interactions between the predictors. Plots of the regression estimated Weibull distribution scale and shape parameters versus the fitted values are shown in Figure 3. Also shown are plots of the relative main effects (the influence of a given predictor while accounting for all other variables) for those parameters identified as significant for the two regressions.
Both the climate parameters (CDD and HDD) are significant predictors of mean energy usage with more extreme climates leading to higher energy consumption with a greater effect on cooling requirement than heating (electric only). However, the effect of mean income is greater with higher income regions corresponding with higher mean energy use. The most significant predictors are both demographic indicators; the average number of persons per dwelling and the proportion of households with indigenous occupants having the largest effect. Of the building and dwelling related parameters, the proportion of separate houses had the largest effect while the proportion of apartments and the average floor area were not significant in this model. The proportion of buildings built prior to 1980 (an indicator of the proportion of buildings likely to have poor thermal performance having been constructed prior to the adoption of NatHERS regulations) had very little effect with a higher proportion of older buildings corresponding to a lower average household energy consumption.
In general, despite the large number of regression parameters and interaction terms, the resultant regression models still have a substantial degree of unexplained variance (30% for the scale and 40% for the shape parameters) despite averaging over several thousand households. This is most likely because households generally do not consume energy in categorical ways consistent with assignment to coarse demographic groupings, though it is also possible that some critical variables were not recorded here. However, herein lies a central difficultly of this high level approach. The number of possible contributing variables is so large that the process of aggregation may in fact prevent a statistically meaningful result. At the very least, much more detailed household information around such things as lifestyles, motivations and priorities is needed to test this. Whether this information is obtained directly, inferred from observed behaviour, or by other means is a topic of investigation. An additional consideration is that many of these variables may change over time. Thus, although this information may help in the prediction of aggregate trends, and potentially in the validation of general a/c usage models, distinguishing different classes of specific a/c on/off behaviour from such data alone is likely to remain challenging.
2.2. Case Study 2: Individual Reported a/c Usage Survey Data Analysis
In contrast to the aggregate approach, analysis can also begin with individual household behaviour in an attempt to build representative models of a/c use. This is equivalent to path “B” in Figure 1. There are essentially two primary methods of gathering data on individual households; surveys and direct measurements. The various strengths and weaknesses of these approaches are discussed in [23]. A review of the published scientific literature found no specific Australian surveys of a/c usage across the general population; though in the broader literature several Australian studies reporting survey results including /c usage related questions have been documented [15,24,25,26].
Designing surveys that achieve a representative sample, reasonable response rate and acceptable cost, and that are easy for respondents to complete accurately free from response biases, is an active area of research. Here an initial online survey was conducted primarily to gain some understanding of the link between basic demographics and reported a/c usage. In the process, this also gave first-hand experience of some of the above issues in relation to a/c usage surveys specifically. It is worth noting that this platform was extremely cost and time effective.
The survey was run online using the Google survey platform between 29 April and 24 May 2016, and appeared as a “pop-up” on various Google controlled websites on desktop and mobile platforms. A total of 78,079 users viewed the survey with 700 full responses gathered. Further details are described in the Appendix A.
Here focus is on survey Q5, Q6 and Q7 since these are directly related to a/c usage. Approximately half of respondents (47.7%) reported using a/c every day during summer (groups 1 and 2), with 32.2% using the a/c relatively routinely (groups 3 and 4), and 18.3% essentially only on what are likely to be very hot days (groups 5 and 6).
Next an Analysis of variance (ANOVA) was conducted to investigate the sensitivity of the main effects of several parameters on the reported frequency of a/c use. Variation across states and territories was found to be the largest, with Tasmania (TAS) and the Australian Capital Territory (ACT) having much lower use frequency and South Australia (SA), Western Australia (WA) and the Northern Territory (NT) having higher use. Variation across income brackets was also large, with higher incomes corresponding to more frequent use. Respondents living in newer buildings reported higher frequency of use, as did those in younger age brackets. Variation across a/c type was small, with only households with split systems showing any significant difference (comparatively more frequent usage). Variation across building type was also small, and there was no statistically significant variation with solar photovoltaic (PV) or green power parameters. However, there was some indication that PV owners reported less frequent use.
Q6 and Q7 asked respondents to indicate when they switch on and off the a/c during the summer months. Multiple responses were allowed, but participants were instructed to only select a response if it was true most or all of the time.
In total, 80% of respondents selected only one response option for Q6. Most respondents (72.8%) reported switching on the a/c when they felt uncomfortable inside the building while a considerable proportion (55.9%) also gave this as their only response. Similarly, while 21.2% reported switching on the a/c when it was hot outside, 8.7% gave this as their only response. A total of 16% of respondents gave reasons that excluded response options 1 and 2. For the open text field, the most common response was related to never using a/c (0.9%), while a very small number of respondents (0.3%) reported that the a/c was continuously running.
In total, 66% of respondents selected only one response option for Q7. For these single response cases, the most common response was “when it feels comfortable inside” for 36% of respondents. The next most common single response was “when it’s not hot outside” (9.3%) followed by “when going to sleep” (6.3%), “when leaving the house/room” (5.3%), “after it’s been running for several hours” (4.3%) and “it turns off automatically” (3.7%). For the open text field, the most common response was related to the a/c being rarely used (0.6%), while others were related to when the room was cool or cold, that the a/c was continuously running, or that the a/c was switched off “at night”.
To examine potential relationships between when respondents reported switching on and off the a/c and the other survey responses and demographics, an ANOVA was conducted to investigate the main effects. Key findings were as follows:
- Older respondents were less likely to report switching on a/c when it is hot outside or when arriving home while younger respondents and those living in newer houses were more likely to report switching off the a/c when it is not hot outside. Higher-frequency a/c users were less likely to report switching off a/c when it feels comfortable inside.
- Higher-income and more frequent a/c users were more likely to report switching on a/c when going to sleep, as were owners of portable a/c and those living in newer houses.
- Higher-income respondents and those who were continuous users of a/c were more likely to report switching on a/c when arriving home. Owners of wall and portable a/c systems were more likely to report switching off the a/c when leaving the house or room, while split-system owners were less likely to report this.
- Younger and higher-income respondents, and less frequent users of a/c, were more likely to report switching off the a/c after several hours of operation. This was also true of households with wall, split or ducted a/c.
- Higher-income respondents and those with wall, split or ducted a/c were more likely to report that they have the a/c system switch on automatically while there was some indication that respondents in newer buildings were more likely to report that their a/c switches off automatically.
- No significant trends in a/c switch on or off behaviour were found across gender, state or territory, or dwelling with the exception of dwelling type which was a factor for the ‘other’ dwelling category for Q6 response option 1.
The above survey results show a number of qualitative indications and trends and give some data on the proportions of households likely to have certain characteristic a/c usage behaviour patterns linked to other parameters. However, without linking this information to actual measurements of usage or energy consumption it is difficult to build a quantitative a/c usage model from this data alone.
For example, for the majority of users who use temperature as the primary driver of “switch on” behaviour, it would be possible to link frequency of usage with the ambient temperature corresponding to the same frequency of occurrence given the respondents location, with the aim of creating a distribution for the proportion of respondents using a/c as a function of temperature. For the specific survey question used here, this would require encoding of the quantitative response options such as “a few times a week” into actual hours of operation. A more definitive set of quantitative response options would be required for this approach to have validity. However, it is likely that this would lead to other challenges, in particular ensuring reliable responses from a wide selection of respondents. This suggests that actual measured energy use data is an essential component for developing a general a/c usage model.
2.3. Case Study 3: Household-Level Combined a/c Energy Consumption and Survey Data Analysis
As demonstrated above, the survey methodology can be used to obtain information from a broad population base, however without linking this to specific quantifiable energy consumption data, they have limited utility. In 2012/2013 CSIRO conducted a detailed Residential Building Energy Efficiency (RBEE) study across 209 Australian households [26]. This consisted of 30 min measurements of up to 8 separate circuits within each household over a 12 month period combined with indoor temperature measurement, occupant survey and building assessment information. The houses were located in Melbourne, Brisbane, and Adelaide and were all less than 10 years old. Here this data was used to perform a detailed assessment specifically focused on a/c usage combining both energy consumption and survey information. This analysis corresponds to path D in Figure 1.
2.3.1. Combined Analysis of all 140 Households
The 140 households who had at least one air-conditioner were considered. As in the previous case study, of particular interest are the actions of switching a/c on and off, as understanding an occupant decision requires consideration of the event or action that it precedes. Here, the “switch on” action is defined to have occurred if the a/c energy usage was below a nominal level for the preceding 30 min interval, and above a nominal level for the interval in question. The “switch off” action may be defined similarly. The a priori probability that a/c is switched on or off in any given 30 min interval for any one randomly selected household then follows as the mean ratio of the frequency of the action to the total frequency of all possible actions for that state.
Because compressor on/off cycles usually occur with periods less than 30 min it is expected that the majority of the events captured using this procedure are user “actions” (whether pre-programmed using a controller or made at the time). In addition, even during compressor cycling, the air supply fans of many air-conditioners continue to use significant power, hence in this instance the method would determine that the air-conditioner was still on.
For households with more than one air-conditioner, air-conditioning was assumed to be on for that household if any one device was on and off only if all devices were off.
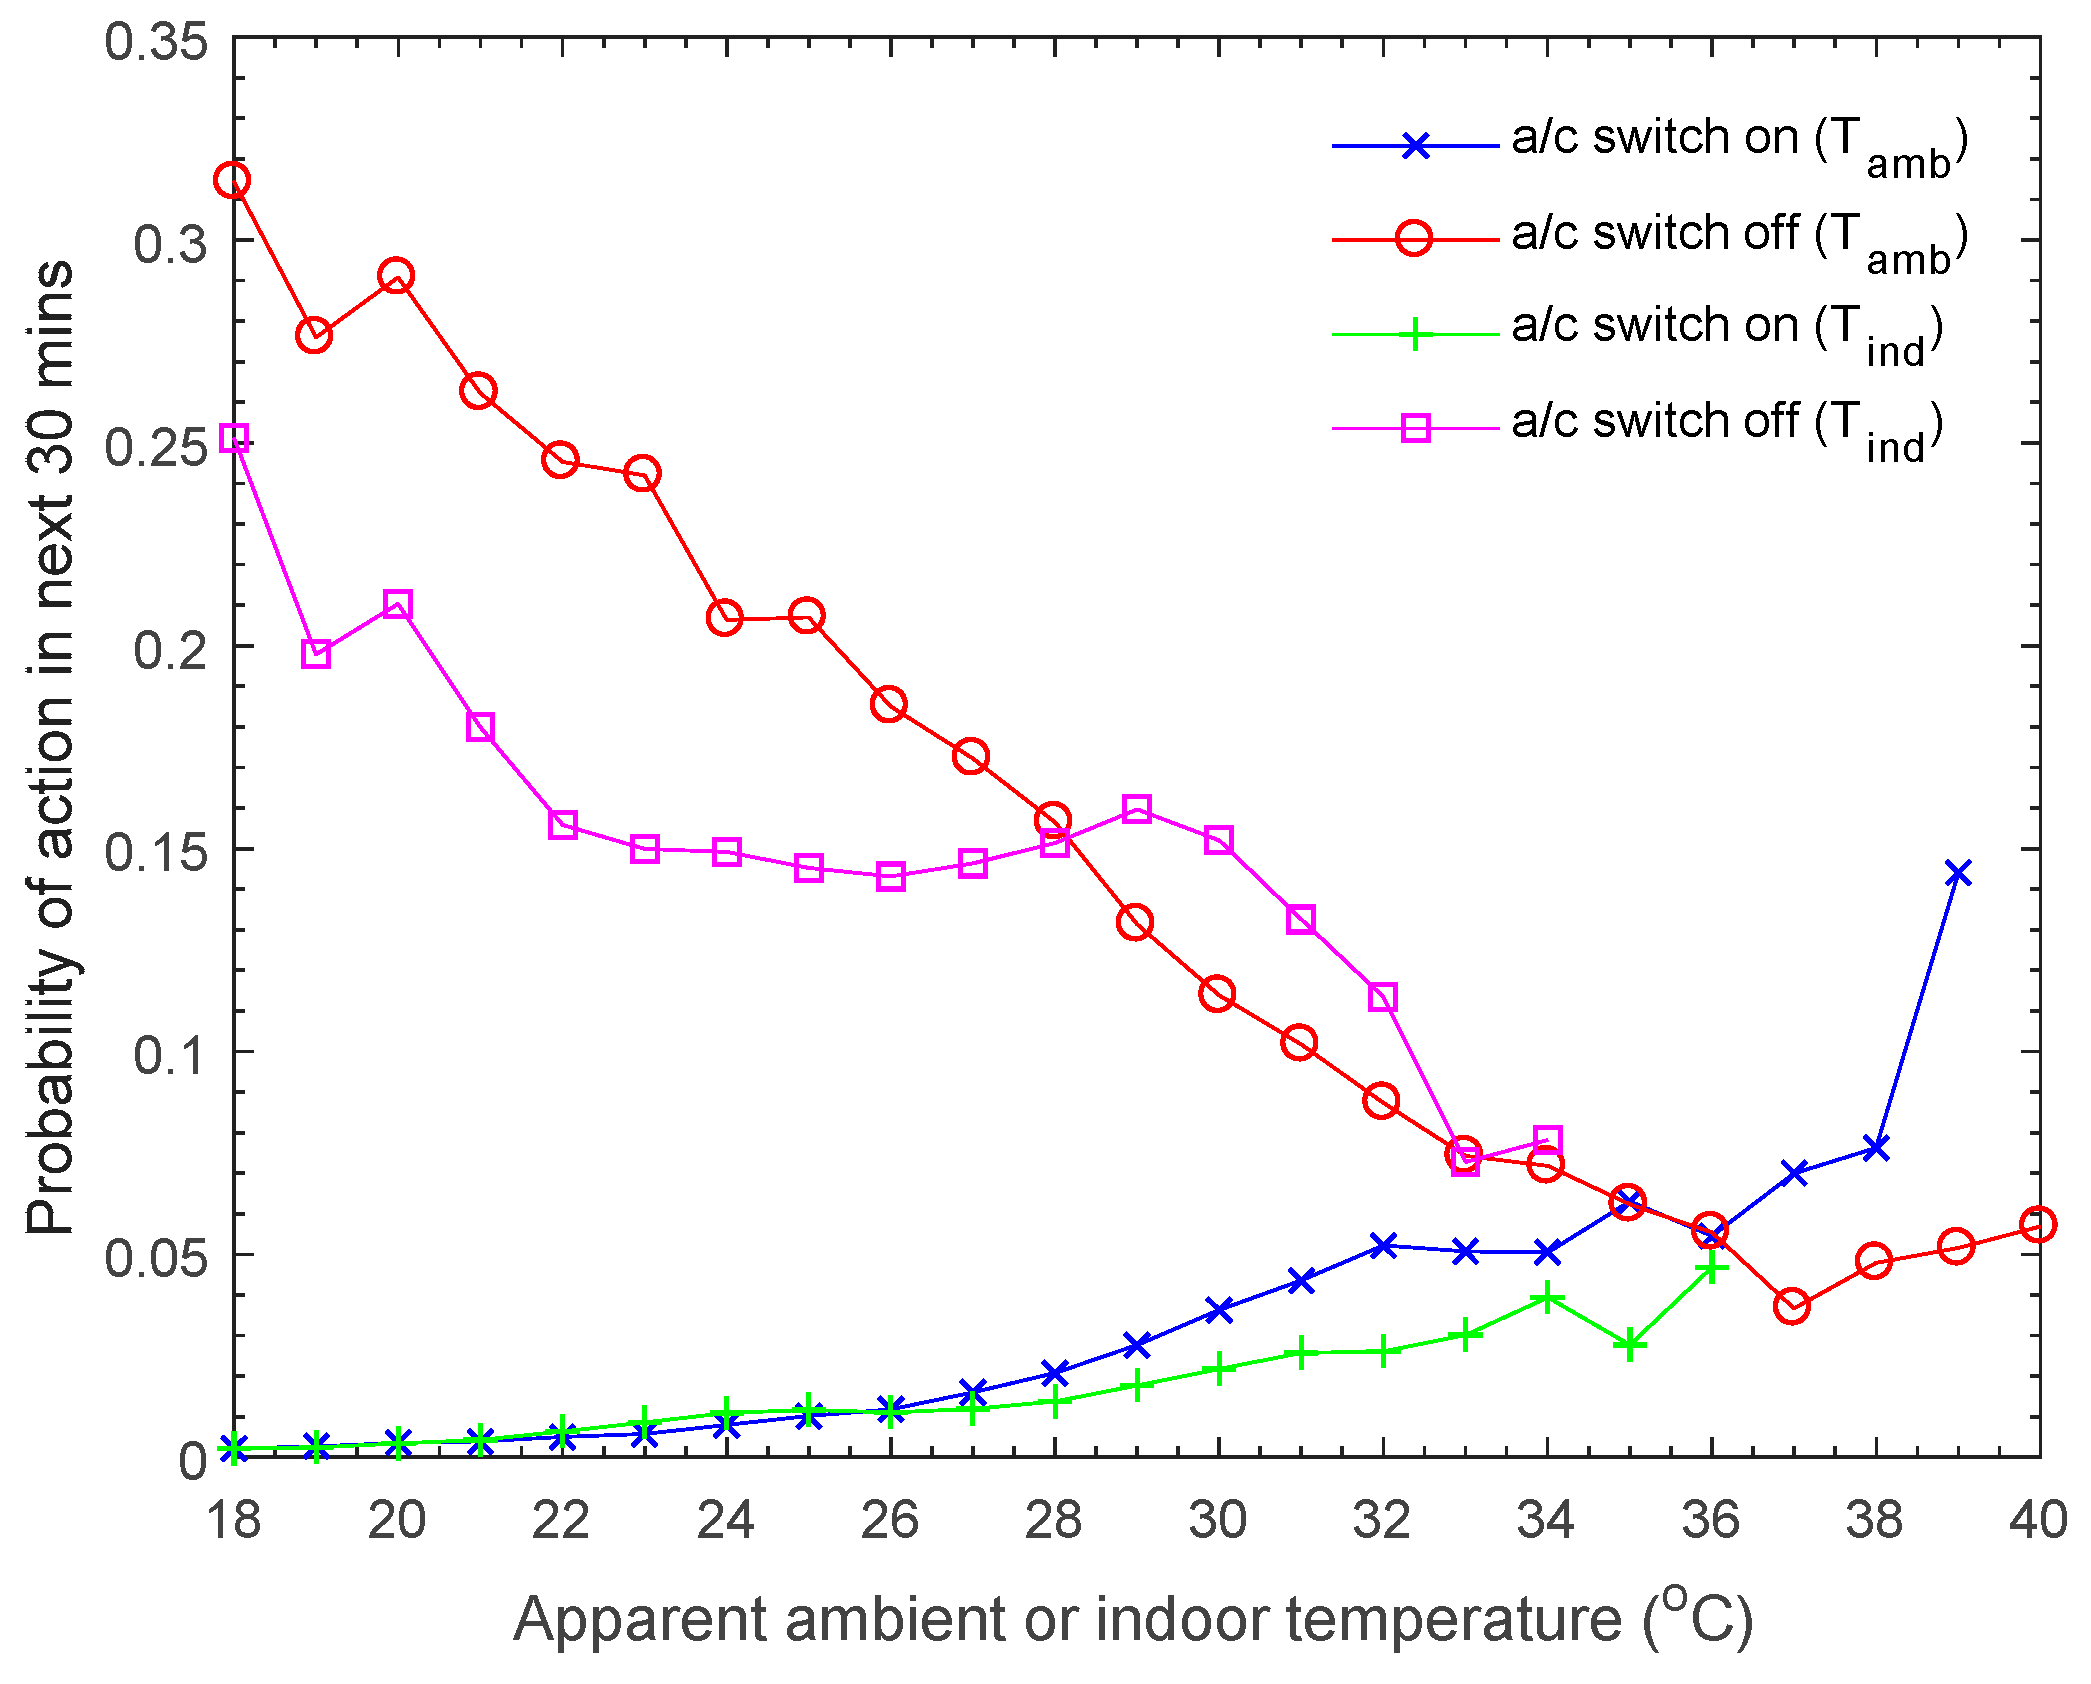
The resulting overall computed “switch on” and “switch off” probabilities are shown in Figure 4 as a function of apparent ambient and apparent indoor temperatures for days where the maximum ambient temperature was >24 °C. Only points based on more than 100 unique data values were included in this figure. There is a clear trend of increasing probability of switching on a/c with increasing ambient and indoor temperatures and decreasing probability of switching off a/c with increasing ambient and indoor temperatures. However, whereas the trend for switch off probability varies almost linearly with ambient temperature, the trend for indoor temperature shows a dip in probabilities for indoor temperatures corresponding to typical room set-points. One possible explanation is that occupants are slightly less likely to switch a/c off if the indoor conditions are comfortable.
In general, since a/c relates to the indoor space and occupant comfort within that space, it might be supposed that the indoor apparent temperature (a close indicator of comfort) would be a clearer driver of a/c-use behaviour, particularly for switching a/c on. However, this does not appear to be the case here. There are several potential contributing factors.
First, the indoor temperature measurement itself is subject to considerable uncertainty in both the accuracy of the measurement, and the extent to which the temperature at the measurement location gives a good indication of the indoor temperature as felt by the occupants. Second, the indoor temperature often changes more rapidly than the ambient temperature, and is affected by prior a/c use. For example, it is possible to envisage a/c being switched on, for the first time in a given day, at a relatively high indoor temperature and being switched off later. A subsequent “switch on” action may be made at a much lower indoor temperature, even though the ambient temperature for both cases was similar.
It may also be noted that here information on the occupancy of the household was unavailable. This means that the “switch on” probabilities include periods when occupants were not at home and so the a/c was off and remained off—as well as periods when the a/c remained on and occupants were not at home. Hence, it was not possible to identify whether, for example, a/c was switched off because occupants left the household or conditioned zone, or for some other reason. That is, “why” the action was made (or not made). Thus, while this model is useful for predicting current a/c behaviour, it cannot reliably predict usage changes due to, for example, changes to the occupancy pattern.
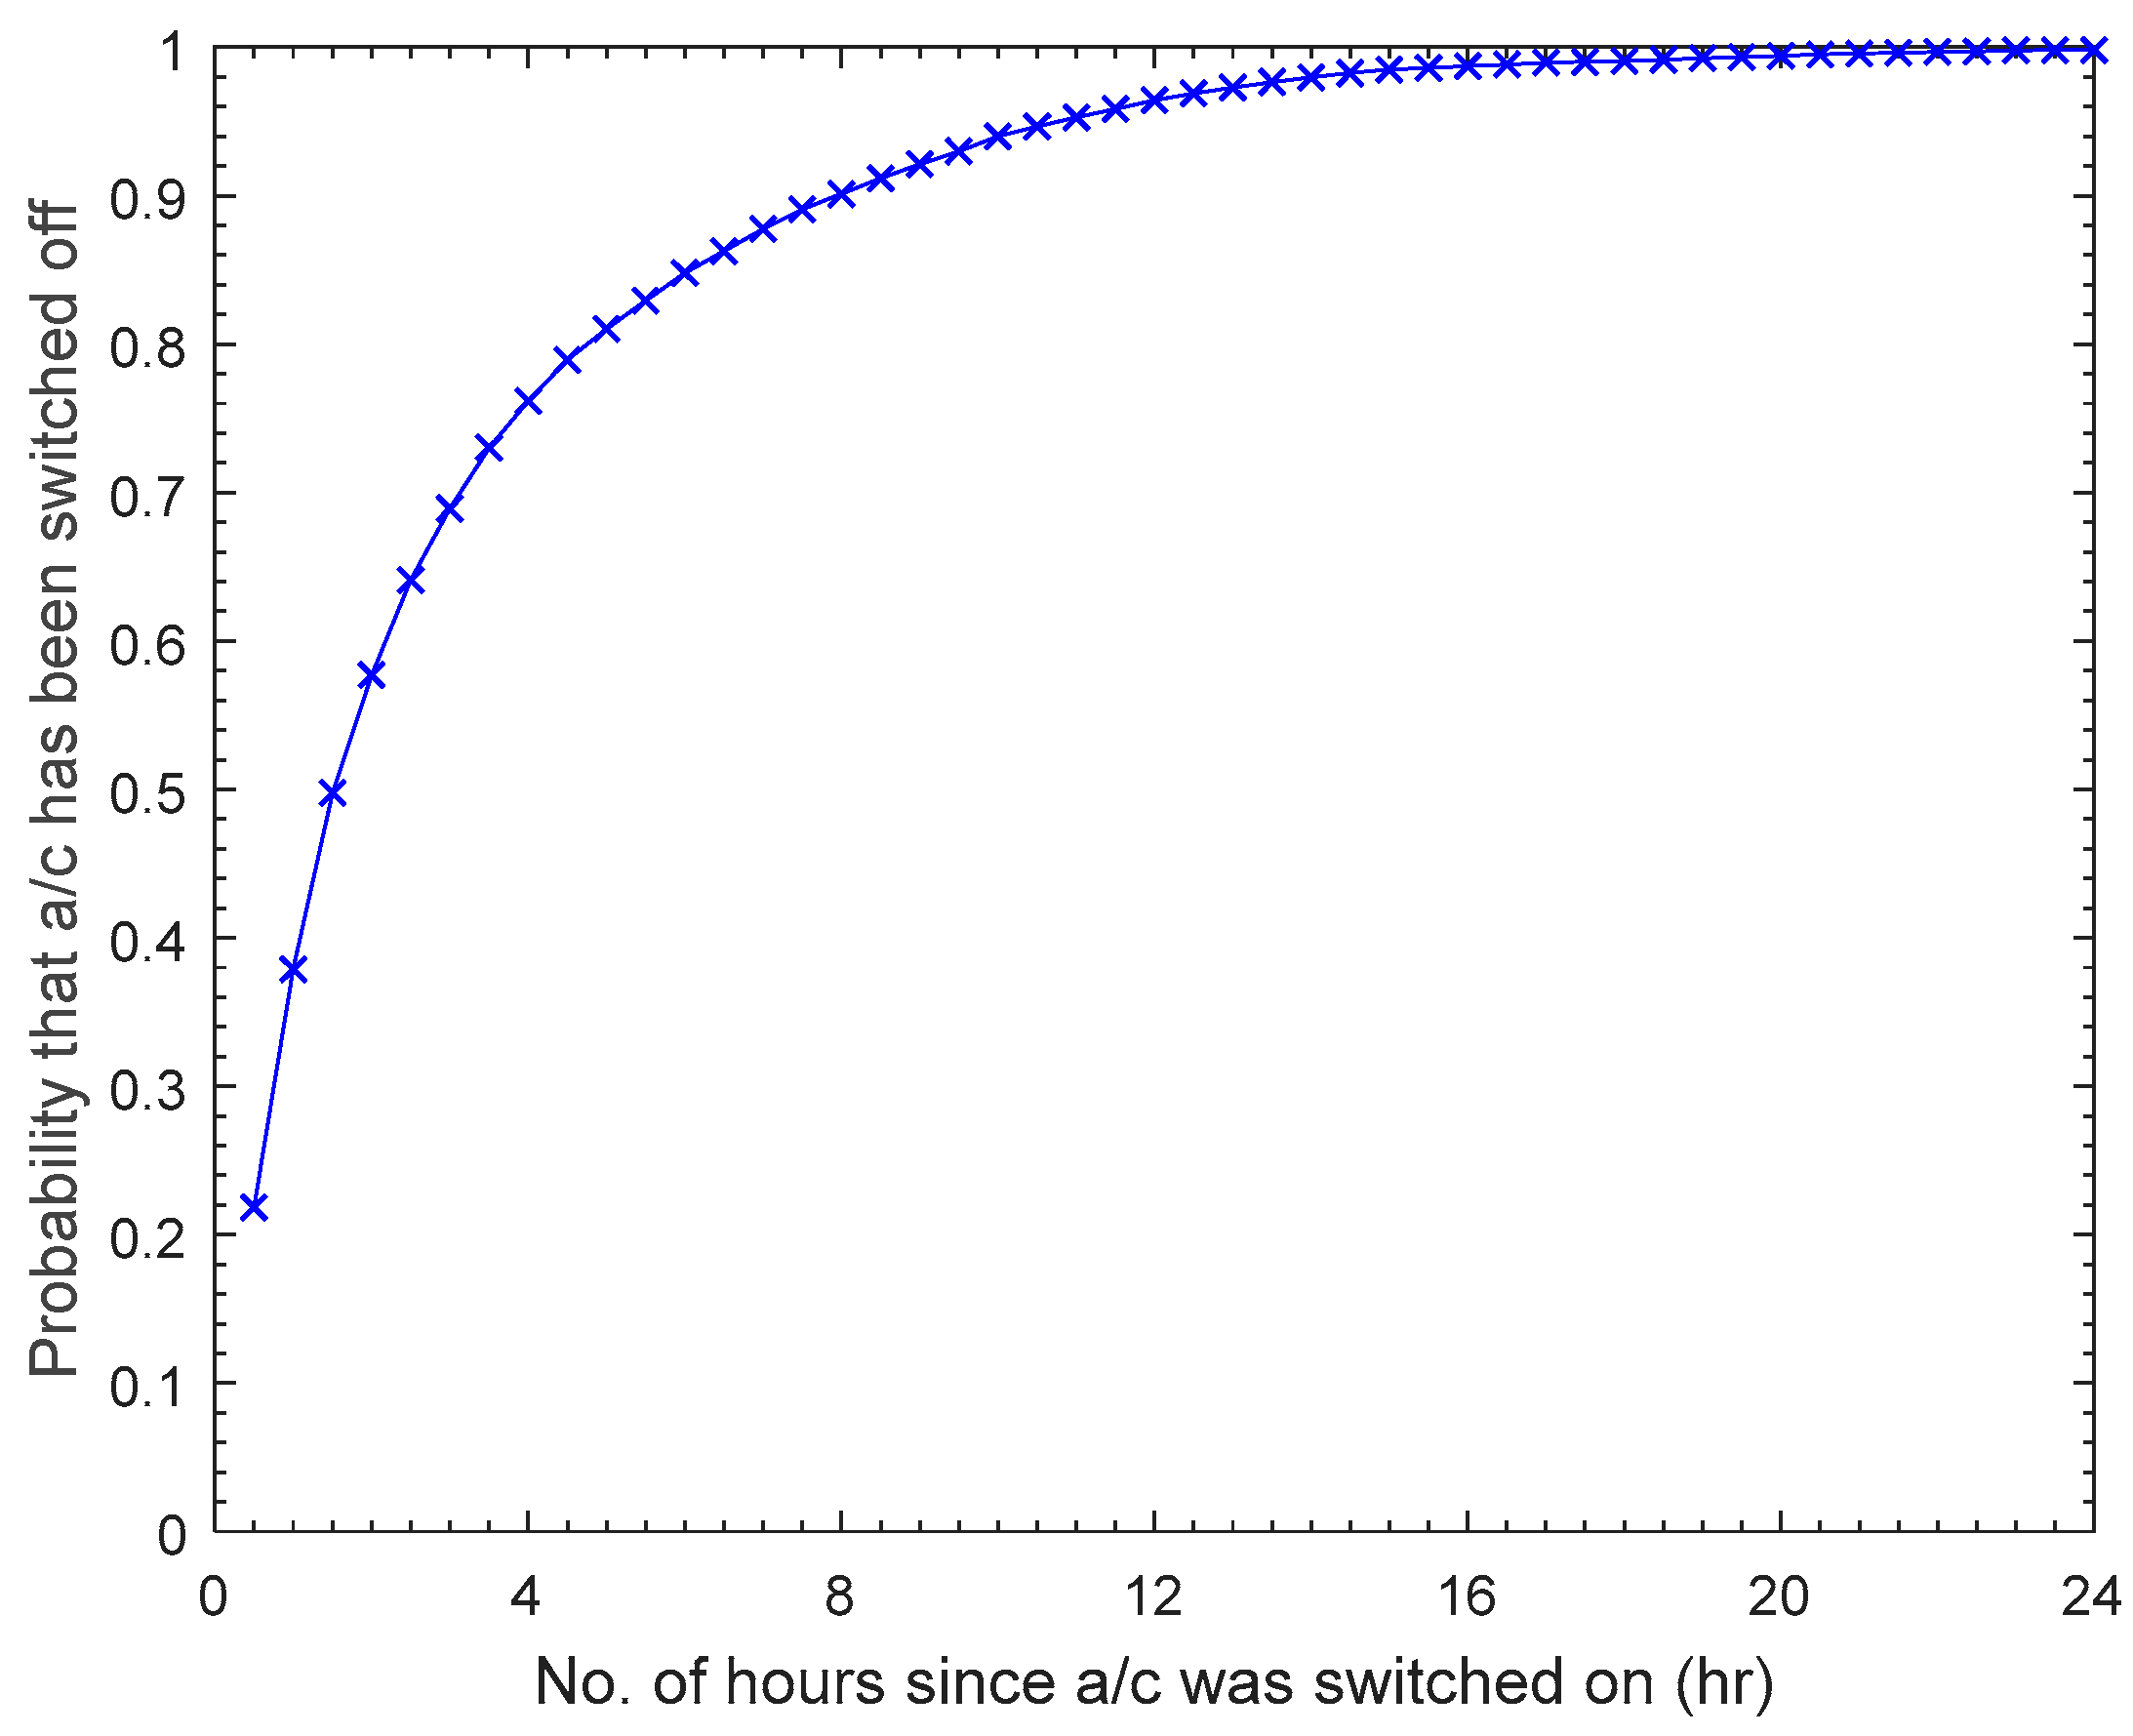
An alternate method of modelling a/c switch-off behaviour is based on the duration of running time. Figure 5 shows the average cumulative probability that the a/c has been switched off as a function of hours since a/c was switched on, again calculated across all households. Approximately 50% of the time, the operation period is less than 2 hours. Further analysis also shows an almost identical plot when the switch off period is required to be at least 1 hour suggesting that the analysis is correctly capturing actual occupant operation of the a/c system and not simply cycling of the a/c compressor operation.
Also of relevance to air-conditioner switch on/off behaviour is the time-dependence of these actions. Air conditioner “switch on” and “switch off” probabilities are shown in Figure 6 by time of day for approximately equal values of apparent ambient temperature. By comparing these probabilities for equal temperatures, the influence of time of day—and indirectly the duration of exposure—can be considered separately from the absolute temperature. Once again, only points based on more than 100 unique data values are plotted.
Switching off a/c is substantially more likely to occur in certain periods of the morning and evening. For those temperatures were there are sufficient data points, the pattern over the day is also somewhat independent of the ambient temperature. On the other hand, the switching on a/c pattern is relatively constant over the day with ambient temperature, with only small increases in probability observable in the morning and afternoon, particularly for temperatures below 34 °C. Given that temperatures above 34 °C occur relatively infrequently, and that these temperatures typically occur at the same times of the day, there is considerable scatter in the data for higher temperatures.
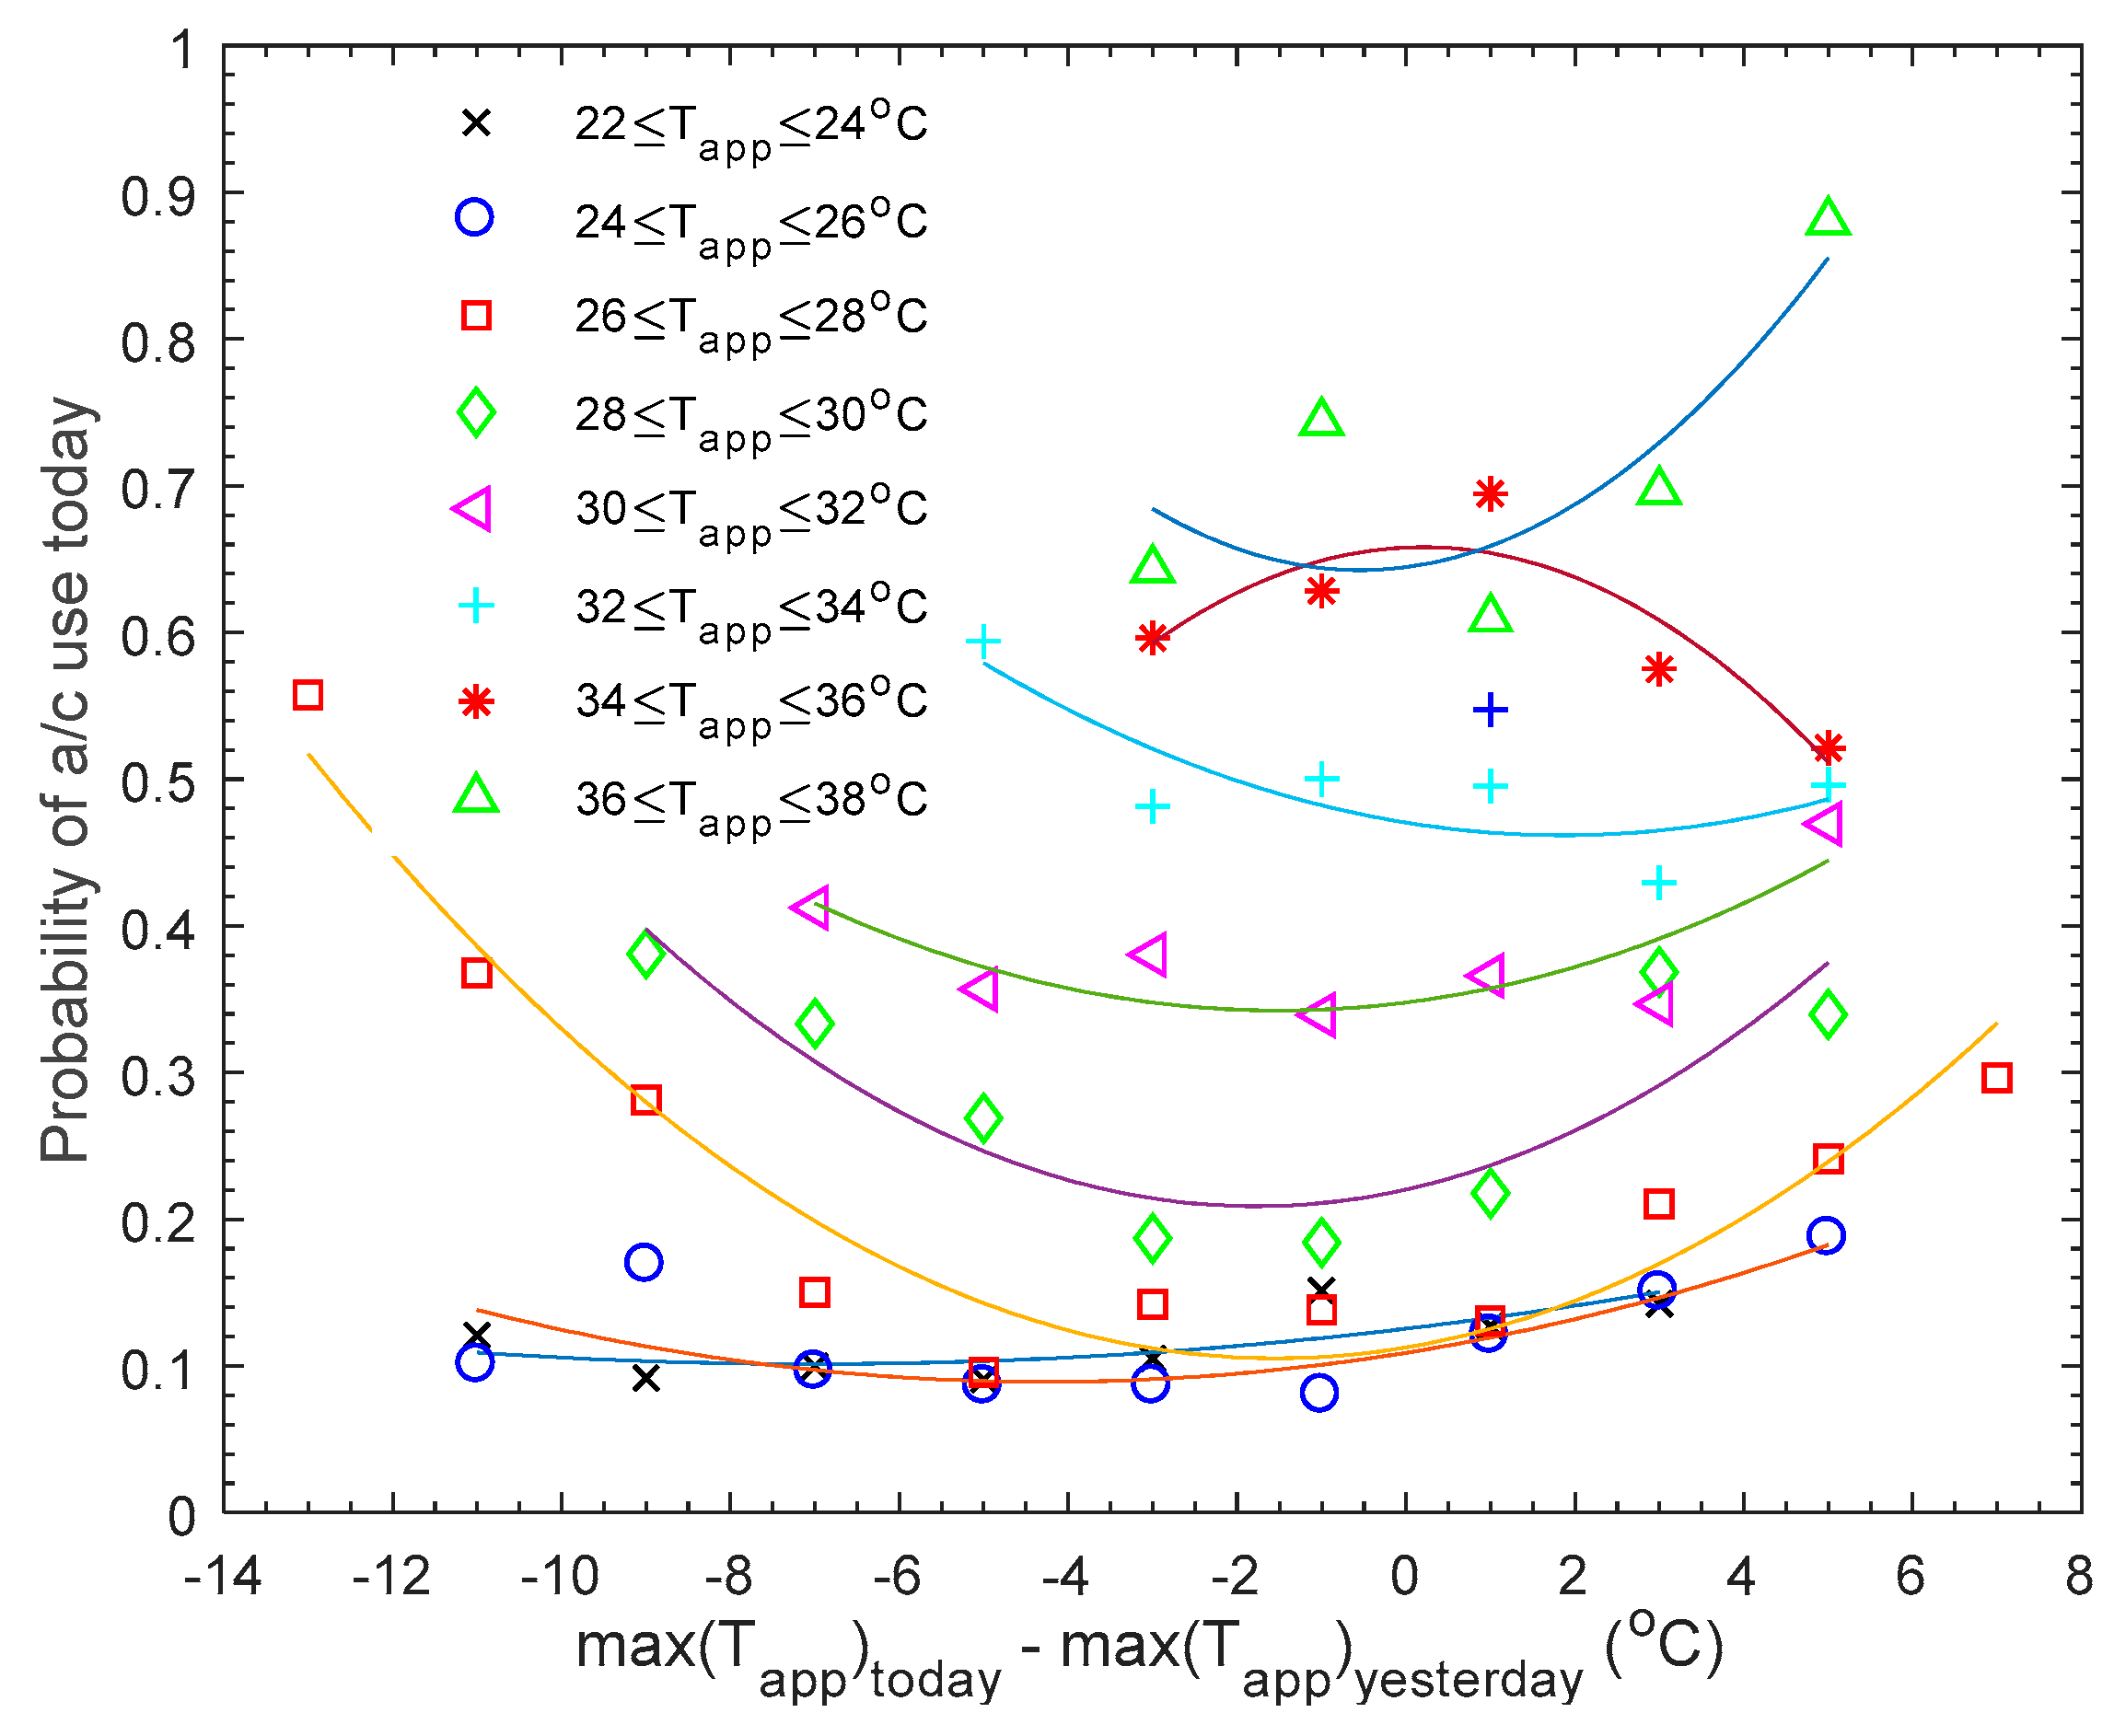
The potential influence of successive hot days on a/c use was also considered. The probability that a/c was used on a given day was calculated for different intervals of (i) the maximum apparent ambient temperature on the given day; and (ii) the maximum apparent ambient temperature on the previous day. Only temperatures above 20 °C for the given day were considered, and only days for which at least 10 readings were available. Figure 7 plots the average probability versus the difference between the daily temperature maximums, with separate sets of data points for different ranges of the maximum apparent temperature on the day of the reading. That is, each set of points compares usage for approximately equal values of the maximum apparent temperature on the given day, since the phenomena of interest is any trend of a/c-usage and not underlying characteristics of the weather—for example, a hot day being more likely to precede a hot day.
From the previous analysis, a trend of increasing probability of a/c use with increasing maximum temperature in the given day is expected and this is also shown in Figure 7. However, the most interesting result is that for a fixed maximum temperature on any given day, a/c energy use appears to be, in general, greater if the previous day had either a much higher or a much lower temperature. This effect is evident for temperatures in the range 24 °C to 32 °C. It is hypothesized that the two effects are potentially related to “temperature shock” (i.e., usage is more likely when there is a significant increase in temperature from the previous day; this is the region toward the right-hand-side in the figure), and to “usage routine” (i.e., if a/c was used yesterday it’s more likely to be used today, even if it’s not particularly hot; this is the region toward the left-hand-side). For the temperature range 34 °C to 36 °C, the trend is different; as noted above, particularly for the higher temperatures further data is required to confirm these trends given the scatter in the data. A final point worth noting is that the temperature difference scale extends much further toward negative values. This is a characteristic of the weather at the data locations; heat tends to build over several days, whereas cool changes that decrease the temperature rapidly regularly occur.
2.3.2. Regression Analysis of Predictors of Air-conditioner Use
It is also of interest to assess the influence of various household parameters—i.e., building, demographic, and behavioural—on four key overall quantities:
- Total a/c energy usage (kWh) at peak times (i.e., when the ambient temperature is above 30 °C and many households are likely to be using a/c).
- Total a/c energy usage (kWh) at times when the a/c is likely to be operating in cooling mode (i.e., when the ambient temperature is above 20 °C).
- Mean apparent indoor temperature (°C) at which the a/c is turned on. This gives a measure of the temperature conditions at which the occupants choose to use a/c (i.e., somewhat independent of the building).
- Mean apparent ambient temperature (°C) at which the a/c is turned on. This gives a measure of the building performance but is also influenced by the occupant behaviour.
A stepwise linear regression analysis was again used to successively remove the least useful predictor from the model. This is described further in the Appendix A. The results showed that:
- For predicting both total a/c cooling energy use and total a/c use on peak days, the most important predictors were the rated electrical power of the a/c equipment, the self-reported usage frequency (i.e., similar to Q5 in the survey discussed in Section 2.2) and whether the household purchases green power. Higher rated capacity, more frequent self-reported use, and greater percentage of green power all correspond with more a/c energy use.
- For predicting the mean apparent ambient temperature at which a/c will be switched on, the most important predictors were the self-reported frequency of a/c use, whether the household was motivated to save money on energy bills, the NatHERS building star rating, the presence of outside awnings or shutters on windows, and whether the occupants switched lights off in unoccupied rooms. Higher mean ambient temperature when a/c is switched on corresponds with less frequent self-reported usage, households with an economic motivation to save energy, a higher building star rating, outside awnings on windows, and occupants who switch off lights in unoccupied rooms.
- For predicting the mean apparent indoor temperature at which a/c will be switched on, the most important predictors were the rated electrical capacity of the a/c, the self-reported frequency of heater usage, the NatHERS estimate of total annual cooling energy consumption and the NaTHERS building star rating. Higher indoor temperature when a/c is switched on corresponds with households who had a small-capacity a/c, buildings with a theoretically greater cooling energy consumption, households who used heating less frequently, and buildings that had a lower star rating.
Of similar importance to the predictors that were significant are those that had no statistically significant influence on the results. This included most of the occupant reported self-assessment of their comparative behaviours and usage—as opposed to definite statements of how often or whether they perform a specific action—and for the total and peak a/c consumption, all of the building shell thermal efficiency related parameters.
The presence of some self-reported behaviours—for example whether lights were switched off in unoccupied rooms—as indicators of a/c usage should not necessarily be assumed to be due to a direct impact on energy consumption from the action itself; these results are more likely to be useful as general occupant psychological or behavioural indicators. This may also apply to some extent to physical features of the building whether these are user operable such as outside shutters. On the other hand, the direct impact on energy use of building features that aren’t user operable such as outside awnings may be more reliably attributed to that feature. This highlights the difficulty of constructing surveys that give the information necessary to address a particular question.
Interestingly the fact that occupants in buildings with a higher star rating switched on their a/c at a lower average indoor apparent temperature, but a higher average ambient apparent temperature suggests that in general, the building fabric for efficient buildings is performing well, creating, on average, cooler conditions in the building, but that the occupants in higher star-rated buildings are less tolerant of higher indoor temperatures (i.e., more likely to use a/c).
3. Discussion
The above case studies have explored a range of different approaches to using data to develop a general residential a/c usage model; each with different limitations.
From the aggregate level analysis of energy consumption linked to aggregate demographic and building data, it is difficult to decompose individual behaviour patterns such as typical a/c on/off usage when there are so many confounding factors. These include relatively well defined parameters such as climate and building physics, but also less well defined parameters such as occupant lifestyles, priorities, perceptions and expectations, as well highly interrelated factors such as the interaction between both active and passive building features and the occupants themselves.
While the survey provided useful indicative trends and behaviour patterns, without linking this with actual energy consumption or air-conditioner usage data it is difficult to build quantitative models without subjective interpretation.
The detailed sub-metered household energy analysis was the most comprehensive data-set and is extremely useful for validating and testing different models, but the participating households are unlikely to be representative of the broader population—due to both selection bias and the fact that all buildings were less than 10 years old. Although several detailed quantitative models of a/c usage behaviour could be implemented, statistically significant trends tended only to be clearly defined when analysing the aggregate response of all households, and so defining representative groups of behaviours is difficult. In addition, despite the statistically significant predictive strength of the key factors for predicting a/c use in the RBEE study, the overall regression coefficient—the accuracy of the prediction, given the values of the significant factors—was low: between 0.2 and 0.25. Even with the inclusion of well over 100 variables, and the prediction of annual averaged quantities, this indicates that there were still many more unknown factors contributing to the variation. However use of a much greater household sample size or the inclusion of more variables is not practical given the time and costs involved in such a study, and factoring in the willingness of individuals to participate.
A data framework and associated methodology is required that brings together the two aspects, data and model, in a rigorous manner.
4. Proposed Methodology for Developing a General a/c Usage Model
In Australia “smart-meters” or meters that record individual household energy data typically at 30 min intervals, are becoming increasingly common. In the state of Victoria a comprehensive program to install smart meters in all houses, both newly constructed and existing, has been completed with almost complete coverage. Elsewhere in Australia smart-meters are becoming increasingly common.
At a high level, one possible approach is to leverage this existing high resolution metering by undertaking the following steps:
- Conduct a targeted survey for a specific region (for example Victoria) to obtain statistics on a specific selected set of demographic, lifestyle, behavioural and building related parameters based on the case studies reported here and elsewhere. Critically, this survey information should be linked to the specific end-user smart meter data for each respondent.
- Link the smart meter data with readily available time dependent weather data and split the overall data set into several representative weather zones.
- For each weather zone, use load disaggregation and unsupervised clustering techniques to build a representative set of a/c daily normalised usage profiles.
- For each representative a/c usage profile, build a model that estimates a/c on/off events as a function of one or a combination of triggers such as time-based or environmental—e.g., temperature—information.
- Build a model that maps from the survey and weather data to the representative a/c usage models—for example using regression or neural network techniques—for each weather zone. This model will be able to estimate the probability that the a/c usage behaviour for a given household on a given day will be according to each of the specific a/c usage models.
- Use the developed model to simulate the a/c usage behaviour for a different portion of the data-set—for example several months of new measurements—and compare the predictions with the actual customer smart-meter data.
- Run a new survey targeting a broader geographic base linked to smart meter data for example in other states. Repeat the above steps for this new data set. Compare the resultant models across similar weather zones to assess the broader applicability of the method.
Such an approach is a compromise between costly highly detailed analysis of a small set of households and high-level analysis of a large population. Additional validation using aggregate data, survey results and data from detailed studies such as the RBEE study will be critical.
Because of the increasing use of “smart meters” a study such as this should be able to use data from several thousand individual customers and remain cost effective. The greater number of customers makes clustering techniques more viable, which should lead to a reduction in the model uncertainties seen in the case study analyses. The use of actual measured data should ensure data gathered from surveys remains grounded in truth, and the use of modelling techniques should fill the gaps where sub-metered data gathering is too costly.
As a final note, one particular aspect of the proposed approach that has been alluded to in the previous case studies but not clarified is the use of ambient versus indoor temperatures as the governing variable in an air-conditioner usage model. On the one hand, use of ambient temperature to construct a/c switch on probability functions for one type of behaviour would discount the effect of buildings on creating comfortable (or uncomfortable) conditions, although in a building simulation model the effect of the building fabric on a/c energy use would be accounted for once the a/c was switched on. On the other hand, whilst date and location alone is sufficient to have detailed knowledge of ambient temperature (via weather station data), data sources with indoor temperature are rare given the expense of temperature metering in individual rooms of dwellings.
This situation might be resolved by considering the occupant behaviour-building combination as an indivisible classification unit—that is, where a particular class of occupant-building combination has, for example, a specific probability function for switching on a/c determined as a function of ambient temperature, and that this particular function is only applicable to that specific class of occupant-building combination. This ensures that the a/c switch on usage model captures the actual behaviour for the specific occupant-building grouping, but it also means that the model applicability to predict the behaviour of that occupant grouping in, for example, a totally different building, is potentially reduced. However, if additional direct measurements or indirect building level information were available to link indoor temperature with the ambient temperatures recorded in the data set, then, it would be possible to separate occupant and building effects—i.e., to link the occupant a/c usage to the indoor building conditions—and so to apply the model for one occupant-building behaviour class to other buildings.
5. Conclusions
There is a mounting weight of evidence in the literature demonstrating the considerable importance of understanding occupant behaviour for predicting long term air-conditioner energy consumption in residential buildings. Key to the development of realistic usage models is the underlying data upon which they are based. Unfortunately, the comprehensive data required to build such models is not currently available. Here three case study analyses using different types of data were used to explore different aspects of the problem of deriving usage behaviour from the data. Each of these approaches has various limitations and so a unified methodology for developing a general a/c usage model was proposed. The next stage of work is to deploy this methodology. This work has important application in a number of areas including electricity network design and operation, building energy efficiency regulation, electricity tariff determination and appliance development.
Acknowledgments
This work was funded by the Department of Industry and Science under the Energy Use Data Model project. Thank you to Adam Berry for helpful comments and suggestions.
Conflicts of Interest
The author declares no conflict of interest.
Appendix A. Materials and Methods
The following section provides further details of the modelling methods used.
Case Study 1
To calculate the cooling and heating degree days the apparent temperature was used. This is appropriate for comfort applications and combines both temperature and humidity in one parameter. The CDD and HDD were calculated as the sum of the product of time above (cooling) or below (heating) a temperature threshold and the difference between the instantaneous temperature and the threshold. For cooling a threshold apparent temperature of 24 °C was selected and for heating 15 °C. The climate data was purchased from the Bureau of Meterology.
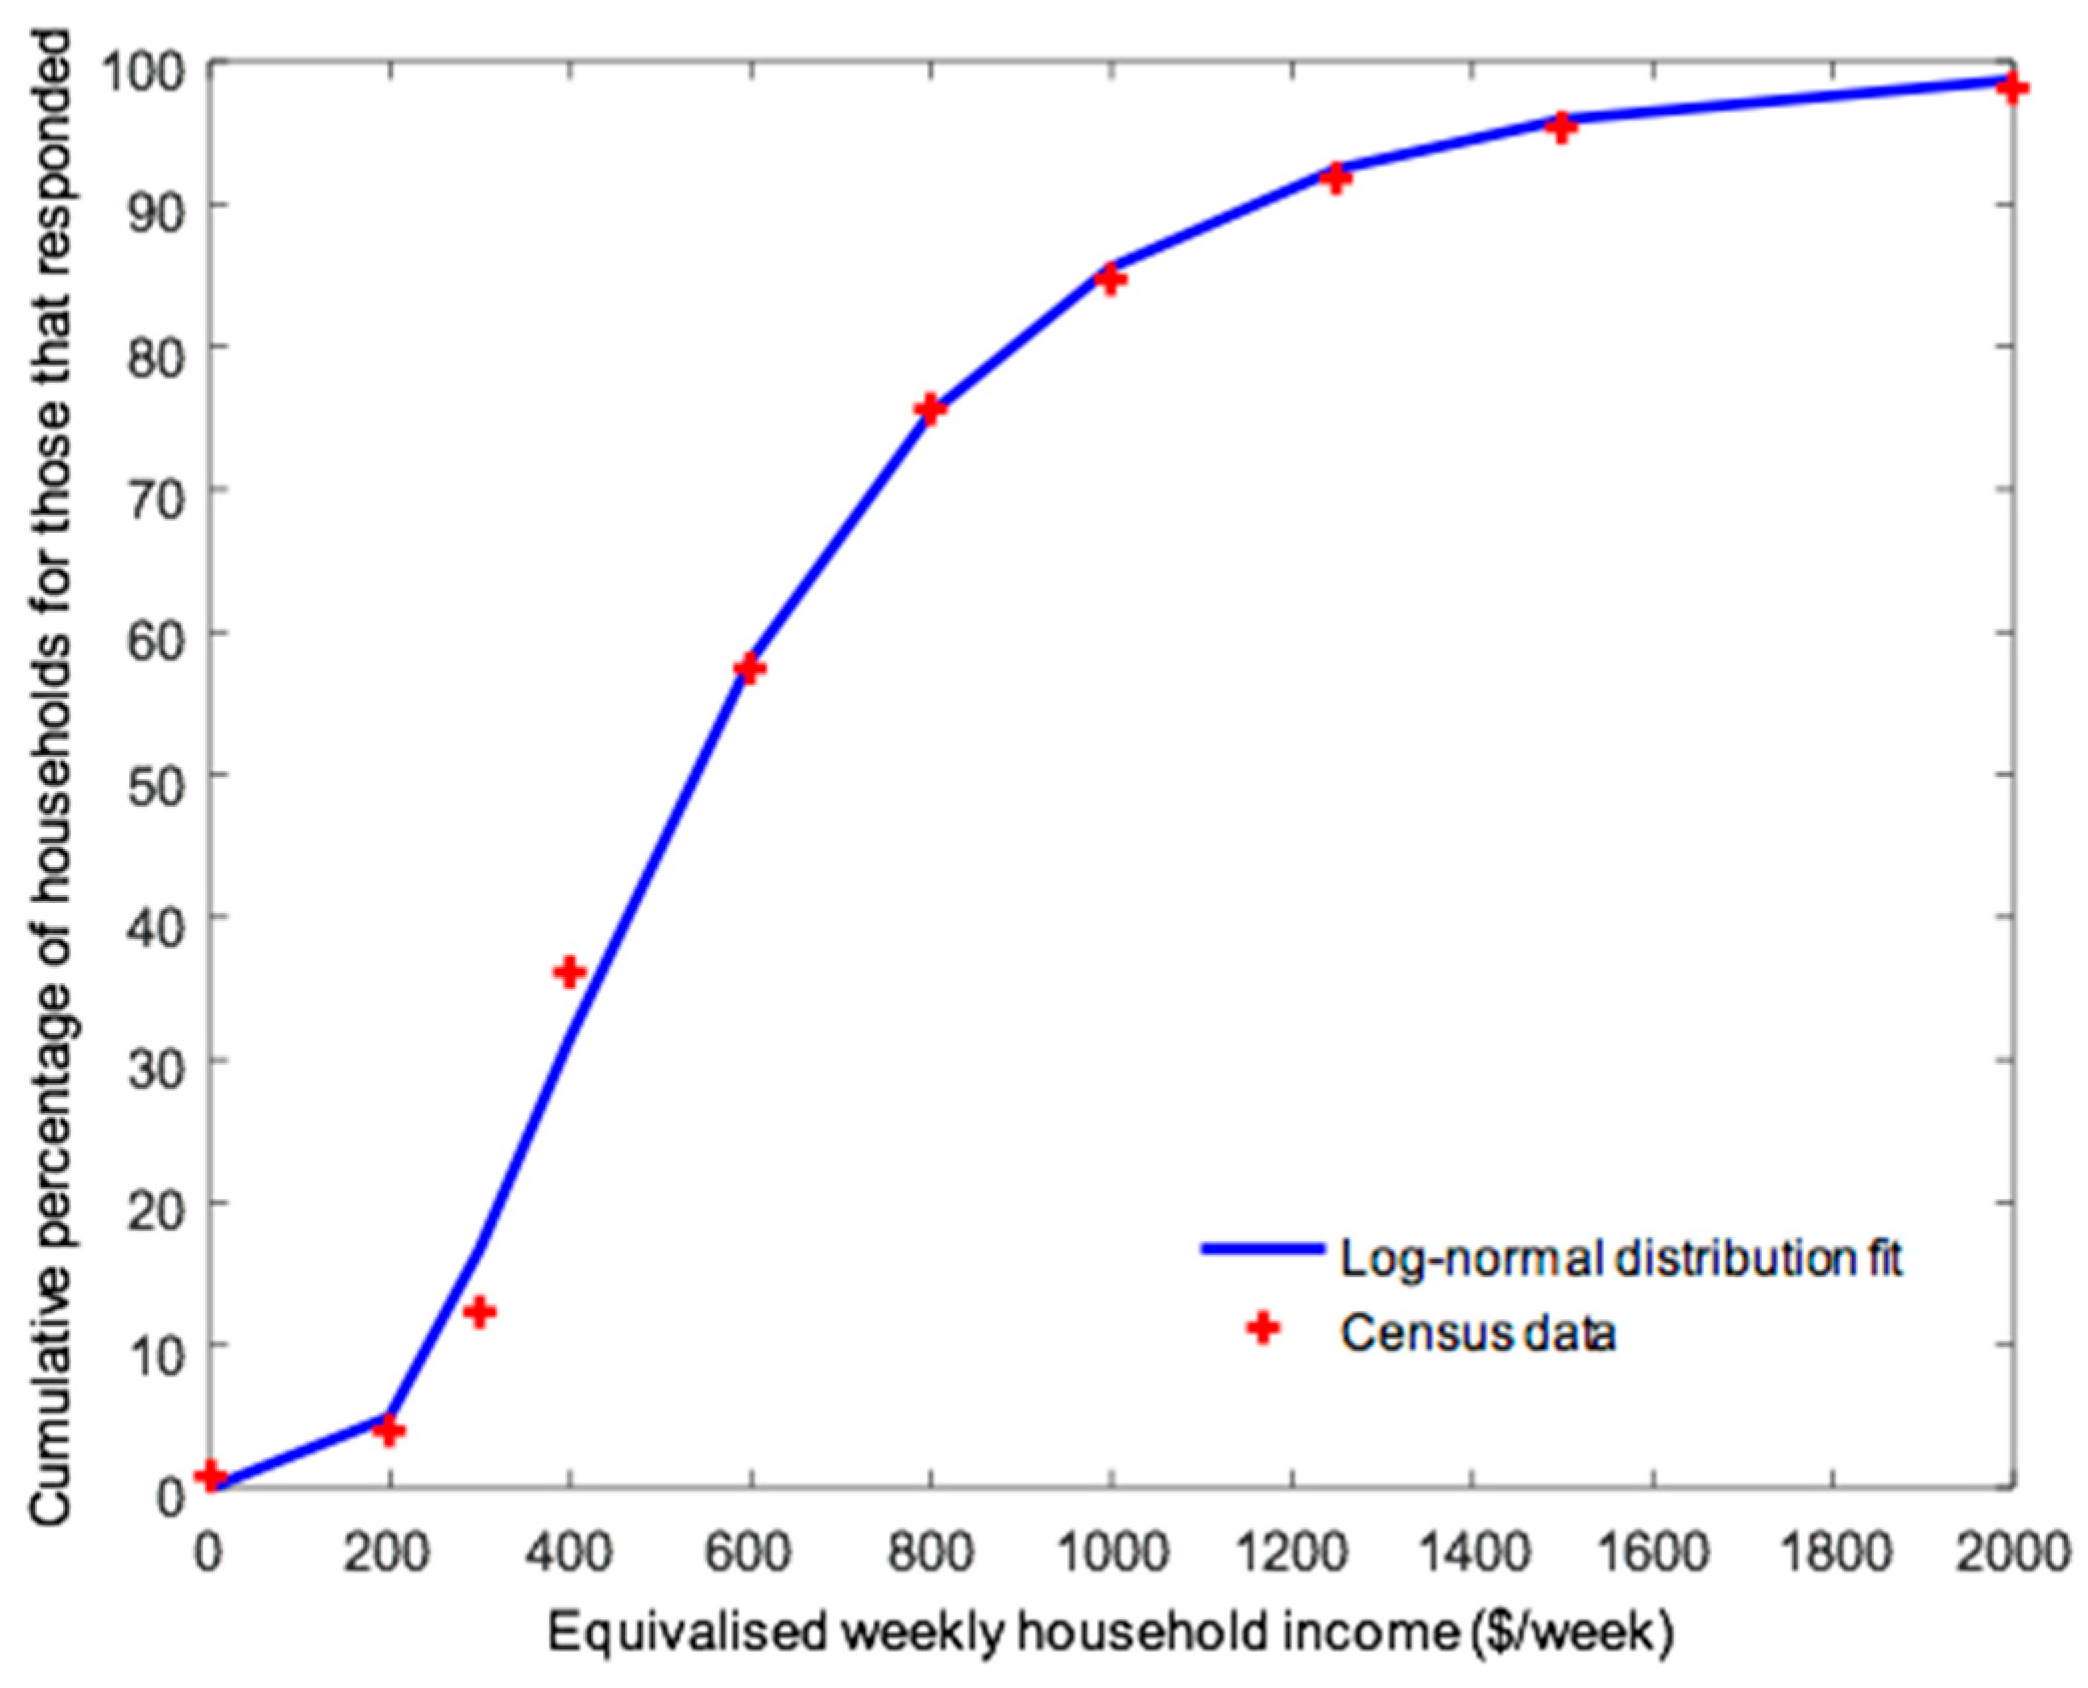
To incorporate the income information from the Census database in our regression model the following approach was used. The percentage of respondents in each income category were first normalised by excluding categories corresponding to households who gave no or only partial income information. Least squares regression was then used to fit a cumulative log-normal distribution function for income for each SA2 region. The RMS error of this fit across all regions was 0.55%. For example, Figure A1 shows the fitted income distribution for one randomly selected SA2 region (in this case Cowra, NSW). The fit to the Census data is typical of that for all regions. Finally the parameters of these distribution functions were used to represent income in the regression model. The Census data-set is available online [21].
Figure A1.
Comparison of log-normal cumulative regression fit of mean equivalised weekly income levels with base 2011 Census data for 1 randomly selected SA2 region (Cowra, NSW).
Figure A1.
Comparison of log-normal cumulative regression fit of mean equivalised weekly income levels with base 2011 Census data for 1 randomly selected SA2 region (Cowra, NSW).

The parameters obtained from the NEXIS data-set and included in the regression model were:
- Equalised weekly household income distribution (from 2011 Census) (mean and standard deviation parameters)
- Average number of persons per dwelling
- Fraction of households renting
- Fraction of households with indigenous occupants
- Fraction of households with a child under 5 years
- Fraction of households with all occupants over 65 years
- Fraction of households with a single parent family
- Fraction of households with all occupants having insufficient English language skills
- Fraction of households with all occupants having no higher education
- Fraction pf households with all occupants unemployed
- Fraction of separate (detached house) buildings
- Fraction of apartments (2 or more stories)
- Fraction of buildings built before 1980
- Fraction of buildings with brick veneer construction
- Fraction of buildings with timber construction
- Fraction of buildings with cavity brick or solid masonry construction
- Average floor area per dwelling
The NEXIS data-set is freely available online [22].
Case Study 2
The a/c usage survey question and response options are given in Table A1. The data from this survey is available as part of this publication. The ethical approval for release of this information was provided by CSIRO as part of the Energy Use Data Model (EUDM) project.
The survey was delivered online using the Google survey platform. Potential respondents had the option of completing the survey, choosing a different (unrelated) survey or not completing any survey. If a survey was completed, the user was given access to content on the website that would otherwise require payment, or would receive Google Play credits.
Nine questions were asked including an initial screening question (Q1) where potential respondents were asked if they would like to participate. Q2 was also used as a screening question with respondents whose household did not have a/c also excluded. Note that the online format only allowed for seven multiple-choice answer options, with strict question and answer word limits.
Along with the specific survey responses, Google also provides selected demographic, location and time-based information for each respondent. This may include age bracket, gender, income bracket, city, the date and time of completing the survey, and the response times for each survey question. Demographic information is obtained primarily from browsing history or directly from the respondent, while location is obtained from the internet service provider. Income was available for 24% of respondents, age for 74%, gender for 77% and location and time for all. Gaps in the demographic data were filled using a statistical multiple imputation technique known as trimmed squares regression [27]. This method is most reliable when the proportion of missing data is not too large. Hence, for the income information in particular, results should be treated with some caution. Here no weightings were applied to account for any population bias between the respondent population and the general population.
For the purpose of performing statistical analysis of the data, the overall a/c use frequency response options were encoded onto a scale of 1 to 6, with 1 corresponding to “continuously” and 6 to “rarely or never”. “Don’t know” responses were treated as missing values and the multiple imputation technique used to estimate their value. The proportion of these missing values was very low (<2%).

Table A1.
Survey questions and response options.
| Question | Question and Response Options | Percentage of Respondents | Number of Responses |
|---|---|---|---|
| 1 a,c | This survey will help CSIRO understand energy behaviour. | 5816 | |
| The research is funded by the Australian Government. | |||
| I would like to participate. | 18.2 (+1.0/−1.0) | ||
| I would not like to participate. → end survey | 81.8 (+1.0/−1.0) | ||
| 2 b,d | What type(s) of air-conditioning system do you have in your home? | 998 | |
| Split-system | 29.1 (+2.9/−2.7) | ||
| Wall or window mounted (i.e., box) | 21.4 (+2.7/−2.5) | ||
| Ducted | 19.1 (+2.6/−2.3) | ||
| Evaporative | 10.9 (+2.1/−1.8) | ||
| Portable | 5.9 (+1.6/−1.3) | ||
| None of the above → end survey | 23.3 (+2.7/−2.5) | ||
| 3 b,c | Is your dwelling a? | 749 | |
| Separate house | 69.2 (+3.2/−3.4) | ||
| Flat, unit or apartment | 16.6 (+2.8/−2.5) | ||
| Semi-detached house (e.g., townhouse or duplex) | 8.8 (+2.2/−1.8) | ||
| Other dwelling | 5.5 (+1.9/−1.4) | ||
| 4 a,c | Approximately what year was the building constructed? | 739 | |
| Pre 1950 | 11.1 (+2.5/−2.1) | ||
| 1950 to 1986 | 28.8 (+3.4/−3.1) | ||
| 1987 to 2004 | 26.7 (+3.3/−3.1) | ||
| 2005 to 2009 | 12.7 (+2.6/−2.2) | ||
| After 2010 | 13.0 (+2.6/−2.2) | ||
| Don’t know | 7.4 (+2.1/−1.7) | ||
| 5 a,c | In an average summer, how often does your household use at least one air-conditioner? | 730 | |
| Continuously | 12.2 (+2.6/−2.2) | ||
| A few hours each day | 35.5 (+3.5/−3.4) | ||
| A few times each week | 25.9 (+3.3/−3.0) | ||
| Once a week | 6.3 (+2.0/−1.5) | ||
| A few times a month | 9.5 (+2.3/−1.9) | ||
| Rarely or never | 8.8 (+2.3/−1.8) | ||
| Don’t know | 1.9 (+1.3/−0.8) | ||
| 6 b,d | During the summer months, when do you turn ON the air-conditioner? (Only select if the response is true most/all of the time.) | 723 | |
| When it feels uncomfortable inside | 72.8 (+3.1/−3.4) | ||
| When it’s hot outside | 21.2 (+3.1/−2.8) | ||
| When going to sleep | 16.6 (+2.9/−2.5) | ||
| When arriving home | 11.9 (+2.6/−2.2) | ||
| When it’s needed for medical reasons | 4.1 (+1.7/−1.2) | ||
| It turns of automatically (e.g., on a timer) | 2.6 (+1.4/−0.9) | ||
| Other (open-ended response) | 1.1 (+1.1/−0.5) | ||
| 7 b,d | During the summer months, when do you turn OFF the air-conditioner? (Only select if the response is true most/all of the time.) | 711 | |
| When it feels comfortable inside | 62.0 (+3.5/−3.6) | ||
| When leaving the house/room | 37.3 (+3.6/−3.5) | ||
| When going to sleep | 22.2 (+3.2/−2.9) | ||
| When it’s not hot outside | 21.4 (+3.2/−2.9) | ||
| After it’s been running for several hours | 18.0 (+3.0/−2.6) | ||
| It turns of automatically (e.g., on a timer) | 7.5 (+2.2/−1.7) | ||
| Other (open-ended response) | 1.4 (+1.2/−0.6) | ||
| 8 b,c | Does your household have a solar PV system (solar panels)? | 704 | |
| Yes | 22.4 (+3.2/−3.4) | ||
| No | 72.2 (+3.2/−2.9) | ||
| Don’t know | 5.4 (+1.9/−1.4) | ||
| 9 b,c | Is your household connected to an accredited Green Power electricity scheme through your electricity company? | 700 | |
| Yes | 17.3 (+3.0/−2.6) | ||
| No | 43.4 (+3.7/−3.6) | ||
| Don’t know | 39.3 (+3.7/−3.6) |
a Answers displayed in fixed order; b Answers displayed in random order; c Single answer allowed; d Multiple answers allowed.
Case Study 3
The sub-metered household energy use analysis was based on data from the Residential Building Energy Efficiency project [26] conducted by CSIRO. This data-set is not currently available for public distribution.
In addition to the energy use data, this data-set includes occupant survey derived data and detailed building and appliance information. In order to reduce the total number of categorical parameters considered in the regression analysis (given that there were in total over 150 behavioural, demographic and building parameters recorded for each household; in fact more than the total number of households), a number of parameters that were deemed to duplicate information or be unlikely to be a useful predictor for air-conditioner usage behaviour were removed from the analysis. In addition, some parameters and response options were combined into new parameters as shown in Table A2. This was considered necessary to improve the likelihood of identifying statistically significant trends given the comparatively small sample size.
Table A2.
Demographic, behavioural, building and air-conditioning system parameters used in analysis of the RBEE data-set.
Table A2.
Demographic, behavioural, building and air-conditioning system parameters used in analysis of the RBEE data-set.
| Building, a/c System, Demographic or Behavioural Parameter | Additional Information | Encoded Variable |
|---|---|---|
| Number of occupants in the household. | Derived from RBEE household survey Q3 | Ratio scale integer |
| Whether the household is occupied in the afternoon | Derived from RBEE survey Q2 | Y/N |
| Whether the household is occupied all day | Y/N | |
| Average annual spend on electricity | RBEE survey Q5 | Ordinal scale 1 to 5 (5 indicating higher spend) |
| Percentage of green power purchased | Combined from RBEE household survey Q6 and Q7. | Ratio scale 0, 10, 25, 50, 75 or 100. |
| Whether the house has ceiling, wall and floor insulation, tinted windows, double glazed windows, energy efficient lights, box pelmets, glass doors, large windows, passive design, outside awnings/shutters, and louvre windows. | RBEE household survey Q10. | Y/N for each feature |
| The frequency of use of televisions, computers, air-conditioner heater, dishwasher, washing machine and clothes dryer. | RBEE household survey Q15, Q17 | Ordinal scale 1 to 6 (1 indicating more frequent usage) |
| Whether steps are taken to limit household energy use. | RBEE household survey Q21. | Y/N |
| Frequency in the last twelve months of: turning appliance off at the power point, using cold water to wash clothes; reducing the length showers; isolating areas that don’t need cooling; the use of fans rather than a/c; switching off lights in unoccupied rooms; only using the washing machine or dishwasher with a full load; the use of blinds/curtains during the summer; not having the air-conditioner on too cold; and purchasing appliances with high energy efficiency rating. | RBEE household survey Q22. | Ordinal scale 1 to 5 (1 indicating more frequent action) |
| Presence of three types of motivation for wanting to reduce energy usage; “economic benefit”; “concern for the environment” and “societal” (encompassing “others are doing it” and “making a positive contribution” responses). | Derived from RBEE household survey question Q23. | Y/N for each motivation |
| Perception of whether the household is a high, medium or low energy user. | RBEE household survey Q31. | Ordinal scale 1 to 3 |
| Ranking as to how energy conserving the household considers itself to be. | RBEE household survey Q33. | Ordinal scale 1 to 6 (6 indicating very conserving). |
| Cooling system rated capacity | RBEE assessor survey | kW value |
| Presence of solar hot water, solar photovoltaics and gas cooking | RBEE household survey Q14 and RBEE assessor survey | Y/N for each technology |
| Building conditioned floor area | From AccuRate household assessment | m² value |
| NatHERS annual sensible and latent cooling loads | kWh value | |
| NatHERS building star rating | kWh value |
References
- Department of Environment, Water, Heritage and the Arts. Energy Use in the Australian Residential Sector 1986–2020; Australian Government: Canberra, Australia, 2008.
- Australian Energy Market Operator. National Electricity Forecasting Report Overview; Australian Energy Market Operator: Sydney, Australia, 2015. [Google Scholar]
- Australian Government, Department of Industry and Science. Nationwide House Energy Rating Scheme. Available online: http://www.nathers.gov.au/ (accessed on 18 August 2017).
- Delsante, A. A Validation of the AccuRate Simulation Engine using BESTEST; Australian Greenhouse Office: Canberra, Australia, 2004.
- Australian Bureau of Statistics. 8731.0 Building Approvals, Australia; Australian Bureau of Statistics: Canberra, Australia, 2016.
- Lutzenhiser, L.; Hu, H.; Moezzi, M.; Levenda, A.; Woods, J. Lifestyles, buildings and technologies: What matters most? In ACEEE Summer Study on Energy Efficiency in Buildings; American Council for an Energy-Efficient Economy: Washington, DC, USA, 2012; pp. 256–270. [Google Scholar]
- Li, Z.; Jiang, Y. Characteristics of cooling load and energy consumption of air conditioning in residential buildings in Beijing. Heat. Vent. Air Cond. 2006, 36, 1–6. [Google Scholar]
- Daniel, L.; Soebarto, V.; Williamson, T. House energy rating schemes and low energy dwellings: The impact of occupant behaviours in Australia. Energy Build. 2015, 88, 34–44. [Google Scholar] [CrossRef]
- Ren, Z.; Foliente, G.; Chan, W.Y.; Chen, D.; Ambrose, M.; Paevere, P. A model for predicting household end-use energy consumption and greenhouse gas emissions in Australia. Int. J. Sustain. Build. Technol. Urban Dev. 2013, 4, 210–228. [Google Scholar] [CrossRef]
- Rupp, R.F.; Vásquez, N.G.; Lamberts, R. A review of human thermal comfort in the built environment. Energy Build. 2015, 105, 178–205. [Google Scholar] [CrossRef]
- Soebarto, V.; Bennetts, H. Thermal comfort and occupant responses during summer in a low to middle income housing development in South Australia. Build. Environ. 2014, 75, 19–29. [Google Scholar] [CrossRef]
- Frontczak, M.; Wargocki, P. Literature survey on how different factors influence human comfort in indoor environments. Build. Environ. 2011, 46, 922–937. [Google Scholar] [CrossRef]
- Stevenson, F.; Rijal, H.B. Developing occupancy feedback from a prototype to improve housing production. Build. Res. Inf. 2010, 38, 549–563. [Google Scholar] [CrossRef]
- Yan, D.; O’Brien, W.; Hong, T.; Feng, X.; Gunay, H.B.; Tahmasebi, F.; Mahdavi, A. Occupant behaviour modelling for building performance simulation: Current state and future challenges. Energy Build. 2015, 107, 264–278. [Google Scholar] [CrossRef]
- Frederiks, E.R.; Stenner, K.; Hobman, E.V. The socio-demographic and psychological predictors of residential energy consumption: A comprehensive review. Energies 2015, 8, 573–609. [Google Scholar] [CrossRef]
- Ren, X.; Yan, D.; Wang, C. Air-conditioner usage conditional probability model for residential buildings. Build. Environ. 2014, 81, 172–182. [Google Scholar] [CrossRef]
- Feng, X.; Yan, D.; Wang, C.; Sun, H. A preliminary research on the derivation of typical occupant behaviour based on large-scale questionaire surveys. Energy Build. 2016, 117, 332–340. [Google Scholar] [CrossRef]
- Australian Buerau of Statistics. 4670.0 Household Energy Consumption Survey, Australia; Australian Buerau of Statistics: Canberra, Australia, 2012.
- Australian Bureau of Meterology. Climate Data Online; Bureau of Meterology: Canberra, Australia, 2016.
- Steadman, R.G. A universal scale of apparent temperature. J. Clim. Appl. Meteorol. 1984, 23, 1674–1687. [Google Scholar] [CrossRef]
- Australian Buerau of Statistics. 2011 Census of Population and Housing; Australian Buerau of Statistics: Canberra, Australia, 2011.
- Dunford, M.; Power, L.; Cook, B. National Exposure Information System (NEXIS); Geoscience Australia: Canberra, Australia, 2014.
- Eurostat. Manual for Statistics on Energy Consumption in Households; European Union: Luxembourg, 2013. [Google Scholar]
- Colmar Brunton. Queensland Household Energy Survey 2013; Colmar Brunton: Brisbane, Australia, 2014. [Google Scholar]
- Arup Group. Smart Grid, Smart City: Shaping Australia's Energy Future; Australian Government: Canberra, Australia, 2014.
- Ambrose, M.; James, M.; Law, A.; Osman, P.; White, S. The Evaluation of the 5-Star Energy Efficiency Standard for Residential Buildings; CSIRO: Newcastle, Australia, 2013. [Google Scholar]
- Arteaga, F.; Ferrer, A. Dealing with missing data in MSPC: Several methods, different interpretations, some examples. J. Chemom. 2002, 16, 408–418. [Google Scholar] [CrossRef]
Figure 1.
Conceptual diagram showing different inter-connections in the problem of developing a general residential air-conditioner usage model.
Figure 1.
Conceptual diagram showing different inter-connections in the problem of developing a general residential air-conditioner usage model.
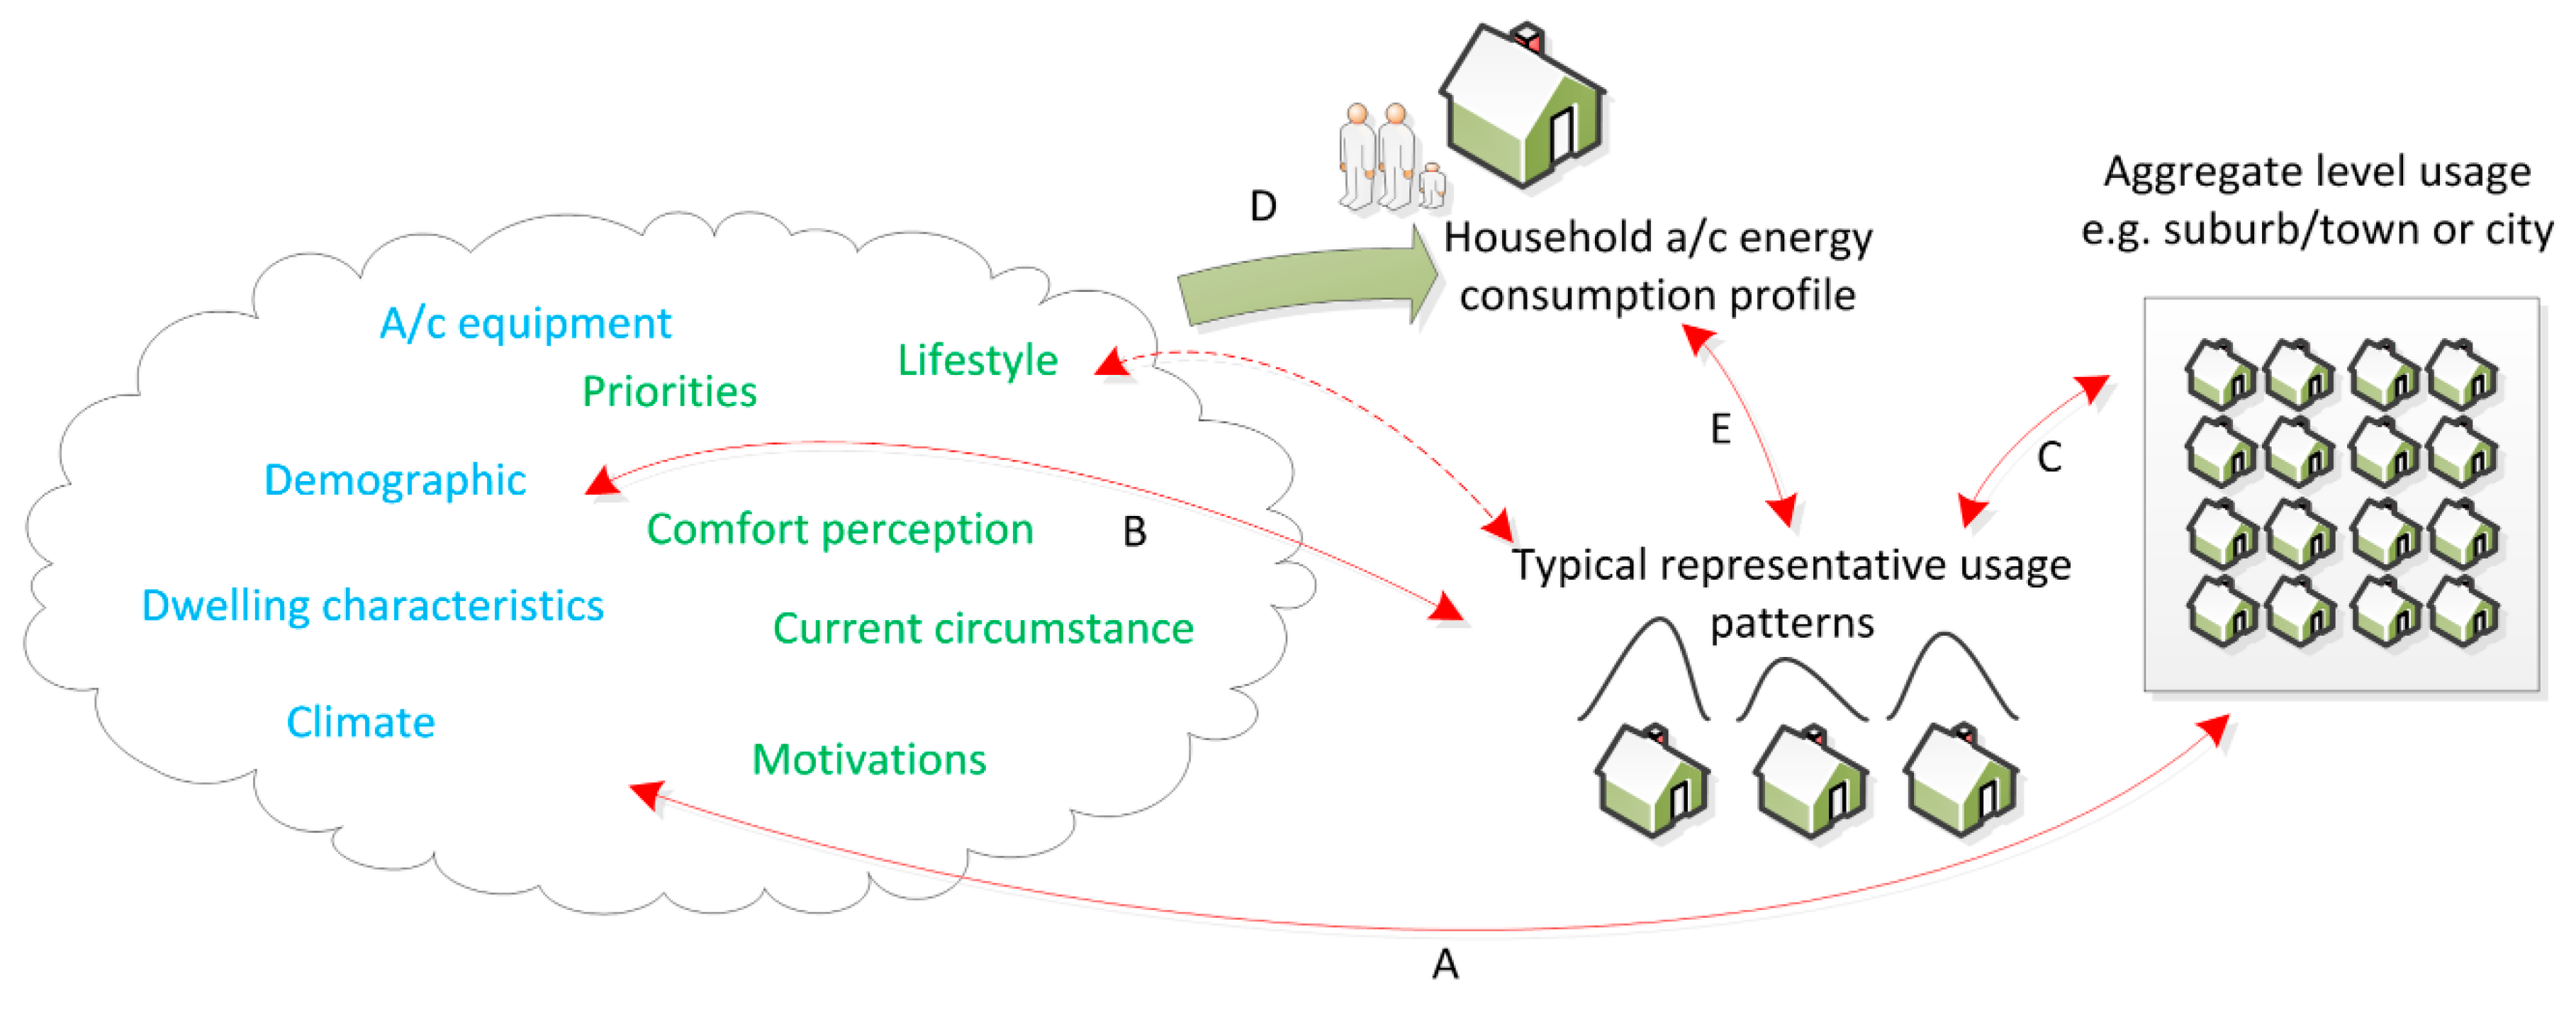
Figure 2.
(a) Contours of cooling degree days and (b) heating degree days across Australia based on apparent temperature as calculated using 2011 Bureau of Meteorology (BOM) weather station measurements.
Figure 2.
(a) Contours of cooling degree days and (b) heating degree days across Australia based on apparent temperature as calculated using 2011 Bureau of Meteorology (BOM) weather station measurements.

Figure 3.
(a,c) Regression fits of Weibull distribution scale parameter and shape parameter for distributions of annual energy consumption for Statistical Area Level 2 (SA2) regions across Australia; (b,d) Comparison of relative main effects sizes of significant regression predictors in the fitted models for scale parameter and shape parameter.


Figure 4.
Probability of air-conditioner (a/c) “switch on” action and “switch off” actions as a function of apparent ambient and apparent indoor temperatures for days.
Figure 4.
Probability of air-conditioner (a/c) “switch on” action and “switch off” actions as a function of apparent ambient and apparent indoor temperatures for days.

Figure 5.
Cumulative probability function for a/c switch off-behaviour as a function of duration on.
Figure 5.
Cumulative probability function for a/c switch off-behaviour as a function of duration on.

Figure 6.
Probability of air-conditioner “switch on” action (a) and “switch off” action (b) as a function of time of day separated by apparent ambient temperature (Tapp).
Figure 6.
Probability of air-conditioner “switch on” action (a) and “switch off” action (b) as a function of time of day separated by apparent ambient temperature (Tapp).
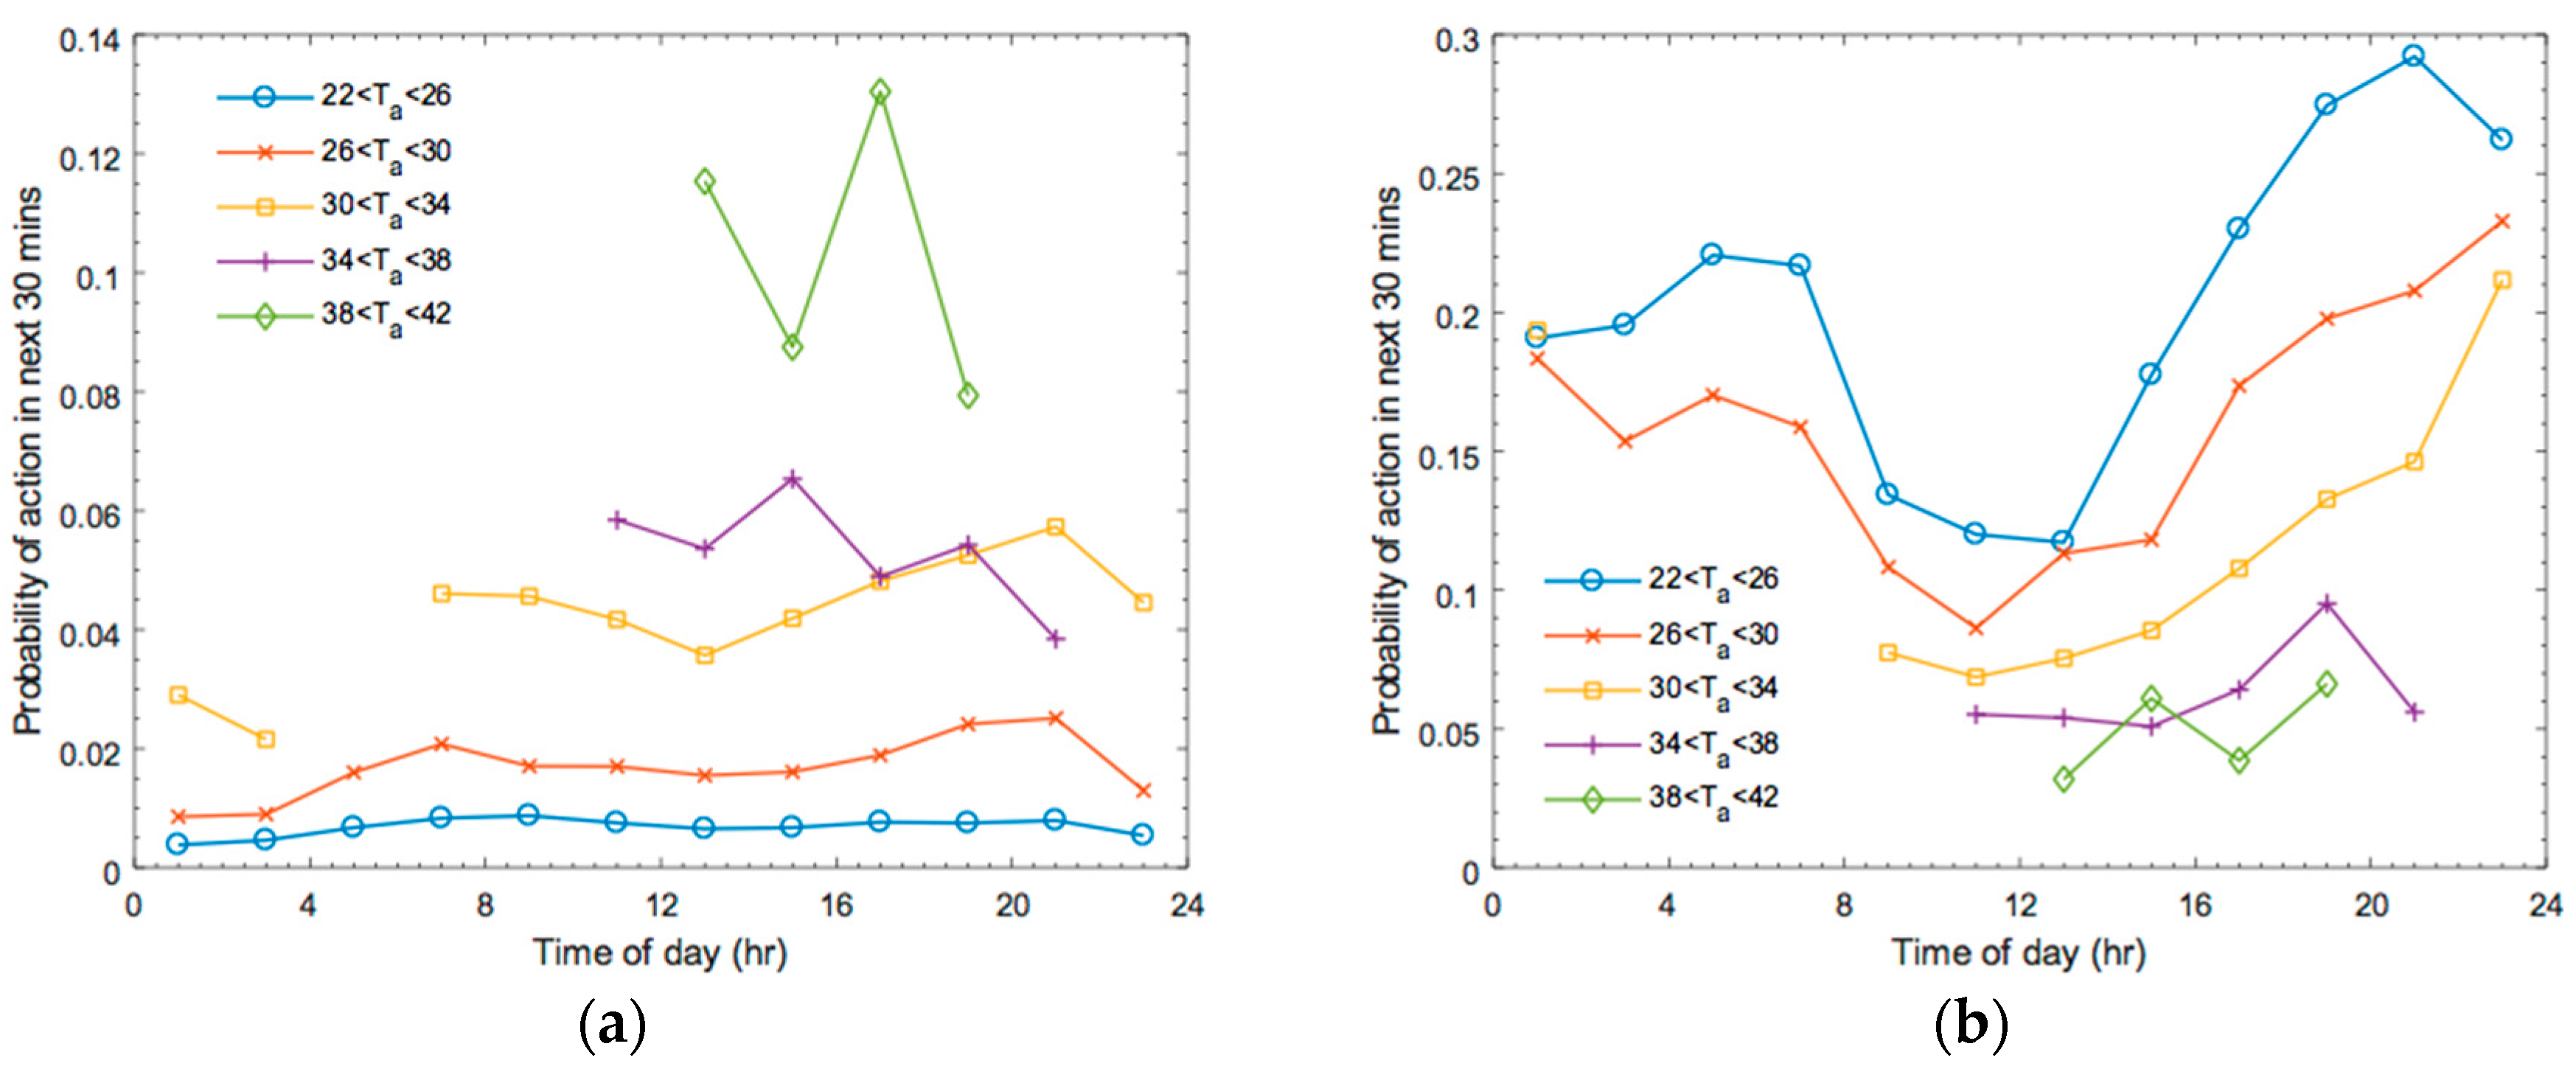
Figure 7.
Probability of a/c usage on the given day versus the difference between the given days maximum apparent ambient temperature (Tapp), and the maximum apparent temperature on the preceding day for different values of today’s maximum apparent temperature.
Figure 7.
Probability of a/c usage on the given day versus the difference between the given days maximum apparent ambient temperature (Tapp), and the maximum apparent temperature on the preceding day for different values of today’s maximum apparent temperature.

© 2017 by the author. Licensee MDPI, Basel, Switzerland. This article is an open access article distributed under the terms and conditions of the Creative Commons Attribution (CC BY) license (http://creativecommons.org/licenses/by/4.0/).
Share and Cite
MDPI and ACS Style
Goldsworthy, M. Towards a Residential Air-Conditioner Usage Model for Australia. Energies 2017, 10, 1256. https://doi.org/10.3390/en10091256
AMA Style
Goldsworthy M. Towards a Residential Air-Conditioner Usage Model for Australia. Energies. 2017; 10(9):1256. https://doi.org/10.3390/en10091256
Chicago/Turabian StyleGoldsworthy, Mark. 2017. "Towards a Residential Air-Conditioner Usage Model for Australia" Energies 10, no. 9: 1256. https://doi.org/10.3390/en10091256
Note that from the first issue of 2016, this journal uses article numbers instead of page numbers. See further details here.