The Importance of Government Effectiveness for Transitions toward Greater Electrification in Developing Countries


Crawford School of Public Policy, Australian National University, Acton, ACT 2601, Australia
*
Author to whom correspondence should be addressed.
Energies 2017, 10(9), 1247; https://doi.org/10.3390/en10091247
Submission received: 15 June 2017
/
Revised: 19 August 2017
/
Accepted: 20 August 2017
/
Published: 23 August 2017
(This article belongs to the Special Issue Energy Market Transitions)
Abstract
:Electricity is a vital factor underlying modern living standards, but there are many developing countries with low levels of electricity access and use. We seek to systematically identify the crucial elements underlying transitions toward greater electrification in developing countries. We use a cross-sectional regression approach with national-level data up to 2012 for 135 low- and middle-income countries. The paper finds that the effectiveness of governments is the most important governance attribute for encouraging the transition to increased electrification in developing countries, on average. The results add to the growing evidence on the importance of governance for development outcomes. Donors seeking to make more successful contributions to electrification may wish to target countries with more effective governments.
1. Introduction
Electricity is the highest-quality energy form and a vital facilitator of modern living standards and production processes. Providing access to modern energy services, such as electricity, is a key objective of developing countries (low- and middle-income countries based on World Bank income categories in 2016) [1], but there is considerable variation across countries. In 2012, in the average developing country, 68% of the population had residential access to electricity, but some countries had much lower coverage. Less than a quarter of the population had access to electricity in 2012 in many Sub-Saharan African countries and some Pacific Island countries [2]. In 2014, over one billion people, about three times the population of the United States, did not have access to electricity [3]. There is, however, relatively little systematic evidence on the reasons why some developing countries have progressed further in electricity transitions than others. This paper investigates a range of quantified measures of transition toward greater electrification in developing countries.
The importance of transitions toward greater electrification in developing countries is evident when considering a range of economic, social, health, and environmental impacts. Electricity is crucial from an economic perspective, as it is an important factor of production [4]. Economic impacts of electrification are also evident at the household level, with increased labor supply following electrification in some cases [5,6]. Children also benefit from electricity as there is more time available for education when electricity reduces the need to collect fuelwood [7]. In addition, electricity use can reduce a leading disease risk factor, household air pollution from solid fuel use [8]. Further, electricity can contribute to the transition toward low-carbon energy systems if low-carbon energy sources are used in electricity generation and electricity replaces use of solid fuels such as charcoal.
Institutions are important for economic growth [9,10] although there is less literature on the role of governance for broader development outcomes [11]. There are some studies that do assess the role of governance for development outcomes. Rajkumar and Swaroop [12] find that public spending improves health and education outcomes when governance is good, and Halleröd et al. [13] find that quality of governance affects basic human needs. Edwards [14] notes that poor government effectiveness can lead to education and health system failure. If governance also has an impact on electricity sector outcomes, there can be flow-on impacts to many development outcomes that relate to electricity availability.
There are a number of different governance attributes [15,16] that could be important for electricity transitions. For instance, governments that are effective in general are also more likely to be effective in electricity provision. Onyeji et al. [17] find that government effectiveness seems to explain more of the variation in electricity in Sub-Saharan African countries compared to other countries, while Magnani and Vaona [18] find that efficiency in revenue mobilization is positively related to access to electricity. The degree of corruption could be another governance attribute impacting on electricity outcomes. Dal Bó and Rossi [19] find that more corruption in a country is associated with lower efficiency in electric utility firms in a sample of Latin American countries. Estache et al. [20] also find that corruption has negative impacts for the electricity sector. Pless and Fell [21] identify a specific way that corruption can adversely affect electricity sectors, with increases in firm bribes for electricity connections associated with lower aggregate electricity supply reliability.
Effective governments could be important for electricity sectors for many reasons. Electricity transmission is an example of a natural monopoly. Also, secure supply of electricity can be regarded as possessing public good characteristics [22]. Public sector involvement in electrification is crucial when there are major obstacles for the private sector. Private sector involvement may be particularly limited in rural areas, due to reasons such as the small size of the market, population dispersion, and weak paying capacity of consumers [23]. In addition, the large scale and complexity of electrification programs requires long-term commitment, prioritization, and planning, along with the large up-front investments [24]. The major role of governments in electrification is emphasized by Bhattacharyya [25] (p. 265): ‘it is not sufficient to have the legal framework or organizational arrangement for a successful electrification programme. It requires a strong government commitment and financial support, a strong strategy and a systematic plan to bring success’. Strong government commitment is a common theme for developing countries achieving success in electrification, such as South Africa [23], Vietnam [26], and Indonesia [27]. In contrast to these successful historical outcomes, weak governance is associated with weak outcomes for electrification in some countries in Sub-Saharan Africa [23].
The degree of democracy in a country could be important for electrification. Democracies produce higher levels of public services than autocratic regimes [28] in some cases, including increased electrification in South Africa [29]. For a sample of African countries, Ahlborg et al. [30] find that democracy has a positive impact on household electricity consumption per capita. Trotter [31] presents evidence that there is a positive association between democracy and rural electrification in Sub-Saharan Africa. For small island developing states, Boräng et al. [32] find that democracy supports electricity consumption when the level of corruption is low. Others have suggested that more authoritarian governments could be beneficial: Wolfram et al. [33], for example, note the conjecture that electricity access in China is greater than India partly because of the strong authoritarian government in China.
A range of government reforms and policies can potentially affect electricity transitions. Reform related specifically to the electricity and energy sectors could potentially have major impacts on the electricity sector, although experiences are mixed. Electricity and energy reform has led to modest efficiency gains in the context of incomplete and uneven reform processes in developing countries [34,35,36]. Reform outside the energy sector could also be important. Nepal and Jamasb [37] note that power sector reform is interdependent with reforms in other sectors. The mixed results of electricity reforms and the potential impact of reform outside the electricity sector imply that general government effectiveness could be influential for electricity outcomes.
This paper contributes by comprehensively assessing the impact of government effectiveness on a range of quantified electricity measures including electricity capacity, access, consumption, transmission and distribution losses, and quality of supply. We focus on deep determinants rather than sector-specific government policies, controlling for many important variables, to assess the impact of enduring factors that contribute to electricity transitions. We use a sample of up to 135 low- and middle-income countries. This is the first paper to document the role of government effectiveness for electricity transitions with such a broad coverage of developing countries, electricity dimensions, and deep determinants. Robustness tests include an instrumental variable approach and a model that uses changes in the dependent variable, to address potential endogeneity. The next section considers variation in electricity use for developing countries, followed by the more systematic approach.
2. Initial Evidence
Figure 1 shows the countries with final electricity consumption per capita of less than 250 kilowatt hours per year. These countries are predominantly in Africa. For Asia and the Pacific it is more mixed; some countries have low consumption of electricity but most others have consumption above the 250 kilowatt hour per capita threshold in 2012. Nepal, Myanmar, Cambodia, Timor-Leste, Solomon Islands, Vanuatu, and Kiribati have electricity consumption per capita below 250 kilowatt hours in 2012. The highlighted countries are generally low-income or lower middle-income countries, emphasizing the importance of controlling for income when testing for the impact of government effectiveness on electricity consumption per capita.
While there is a positive relationship between government effectiveness and electricity consumption, evident in Figure 2, there is considerable variation around the line of best fit suggesting factors other than government effectiveness are important. Some countries such as Malaysia have relatively high electricity consumption and government effectiveness scores. In contrast, over half of developing countries have final electricity consumption per capita of less than one megawatt hour per year, including countries such as Chad, Sierra Leone, and Guinea-Bissau. One megawatt hour per capita equates to a value of zero for the log scale in Figure 2.
3. Method and Data
To assess the impact of government effectiveness on electricity transitions more systematically, this paper uses a cross-sectional regression approach with data up to 2012 for all low- and middle-income countries (subject to data availability; income groups are based on 2016 income classifications). The cross-sectional approach uses variation between countries, and is appropriate given that some of the dependent variables, including electricity quality and access to electricity, do not have extensive historical time series. For robustness, we also consider the between estimator with panel data. The between estimator is a suitable panel estimator for assessing long-run relationships [40].
We estimate the following equation:
We initially use ordinary least squares estimates with standard errors that are robust to heteroscedasticity. The error term is . For robustness, this paper also includes an instrumental variables approach with 1950 life expectancy used to instrument for 2012 government effectiveness, as described later.
is the electricity dependent variable in separate regressions for each of the electricity variables including log electricity capacity per capita, log final consumption of electricity per capita, log household consumption of electricity per capita, access to electricity, electricity transmission and distribution losses, and quality of electricity supply. The subscript is for each of the countries.
The electricity dependent variables are from the World Bank [2], United Nations [38], and World Economic Forum [41]. Data for household electricity consumption and for final consumption are from the UN, as is electricity capacity. World Bank [2] data includes the percentage of the population that has access to electricity, and electricity transmission and distribution losses as a percentage of output. The International Energy Agency is an alternative data source for electricity access, but offers less comprehensive data coverage. Electricity quality index values, measuring the reliability of supply, are from the World Economic Forum. Data quality for electricity consumption and capacity is probably better than for access to electricity; access data from the World Bank are collected from a number of sources, including nationally representative household surveys, but with some estimated data. The World Bank uses a modelling approach that incorporates regional electricity access data when there are missing data [42].
Our key independent variable, , is government effectiveness from the Worldwide Governance Indicators [39]. The variable is based on 48 components that measure perceptions of the quality of public service delivery, policy formulation, and policy implementation. While there is potential for measurement error in any governance indicator, including perceptions-based measures, the Worldwide Governance Indicators are widely relied upon [15]. Only two of the 48 components of government effectiveness relate to electricity: coverage of the electricity grid, and how problematic electricity is for growth of business. The government effectiveness variable is thus suitably distinct from variables measuring electricity capacity, consumption, access, transmission and distribution losses, and quality of supply. State effectiveness from the State Fragility Index [43] is an alternative measure. Electricity is not an explicit component of the state effectiveness variable that is comprised of four components: economic, social, political, and security effectiveness. Table 1 shows the range of values for government effectiveness, and also summarizes the data for the electricity dependent variables.
We also examine the relative importance of government effectiveness vis-à-vis other governance attributes. Using the Worldwide Governance Indicators [39], these other governance attributes are regulatory quality, political stability, voice and accountability, rule of law, and control of corruption. The governance attributes are described in Appendix A.
We control for a number of other variables in , as defined and included in the subsequent text and tables. There are a number of geographical or demographic aspects that could be important for differences in electricity transitions across countries. For instance, there could be electricity demand differences for heating and cooling purposes due to temperature differences between countries. Other factors include population density and the percentage of the population in rural areas. Electricity network extension would be more costly per person when population density is lower, while more dispersed rural populations may be harder to reach. A measure of hydro endowments is another control, as hydroelectricity is an important energy source in many developing countries [44].
Economic factors may contribute to electricity sector development. For instance, higher-income countries could afford to invest in greater levels of electricity infrastructure and to have higher consumption levels. For a component of total electricity use, Pfeiffer and Mulder [45] find that non-hydro renewable electricity is promoted by higher per capita income. In relation to analysis of household data from Mexico, Gertler et al. [46] suggest a nonlinear Engel curve with purchase of energy-using assets being much more likely above income thresholds. Price for electricity consumption may also impact on various electricity outcomes including consumption and losses in transmission and distribution.
We also control for policy and other differences across countries. We use a binary variable with value of one for countries in Africa and the Middle East. This binary variable controls for factors that are common across these countries. One common factor across countries in both Africa and the Middle East has been the stage of power sector reforms. Nagayama [47] notes that reforms have proceeded in Asia and South America, but have been delayed in Africa and the Middle East. We also use a power sector reform indicator [48], with values from zero to six, to control for lagged policy reform up to 1998 more directly. This indicator is the sum of binary sub-component indicators for the following six power sector reforms: corporatization, regulation, regulatory body, independent power producers, restructure of state-owned utility, and privatization of generation or distribution.
There are a number of data sources for the geographic, demographic, and economic variables included in . Temperature data are from the climate dataset CRU CY v.3.22 of the Climate Research Unit [49]. Electricity price for a business with a standardized warehouse, measured in US cents per kilowatt-hour, is from the World Bank [50] Doing Business data. From the World Development Indicators, the rural proportion of the population and gross domestic product (GDP) per capita in purchasing power parity terms in constant 2011 international dollars are other key independent variables. Population density, water resources per capita, country income groups, and region are also from the World Bank [2]. To account for the degree of democracy, we use the Polity2 variable from Marshall et al. [51]. GDP data from 1960 are from the Clio Infra [52] database.
Endogeneity from reverse causation or omitted variables is a potential issue. For instance, electricity availability and quality could affect the ability of governments to be effective. Omitted variables related to technology or political differences across countries could also bias results if these factors are correlated with both electricity and government effectiveness. We address the issue of potential endogeneity in a number of ways, including use of lagged variables, an instrumental variable approach, and dependent variables measuring changes rather than levels.
To reduce the risk of endogeneity from reverse causation, we use the lagged values of government effectiveness from 1996 in one table of results. 1996 is the first year of data for government effectiveness and is before the start of electricity transitions in many developing countries. For instance, total electricity capacity in low- and middle-income countries was nearly three times larger in 2012 compared to 1996. We also investigate using lagged values from 1996 for the controls that are more likely to be endogenous: log GDP per capita and rural population percentage. The power sector reform indicator includes reforms up to 1998. In another robustness test, GDP data from 1960 are used [52].
An instrumental variable approach is another way to address potential endogeneity. We use log life expectancy from 1950 to 1955 from the UN [53] World Population Prospects as an instrument for 2012 government effectiveness. Countries with higher life expectancy in the past have had a more conducive context and greater incentive for institutional development over time, allowing for higher levels of government effectiveness to develop. Life expectancy could also relate to other variables to a lesser extent, for instance geography, but we partly address this issue by controlling for important geographical aspects. The considerable positive correlation between 1950 life expectancy and 2012 government effectiveness (0.5) helps make 1950 life expectancy a suitable instrument. 1950 pre-dates much of the development of electricity systems [44], particularly in developing countries, reducing the risk of reverse causation. The instrumental variable approach is similar to the use of settler mortality as an instrument for current institutions [9].
We also use the model described by Equation (2) to focus on medium-term changes in the dependent variable. This helps to reduce the risk of endogeneity, showing the impact of initial levels of government effectiveness on subsequent electricity transitions:
is the average annual percentage change for the electricity quantity variables of capacity, final consumption, and household consumption over the period 1996–2012. is the percentage point change for the period 2000–2012 for electricity access, the percentage point change for the period 1996–2012 for electricity transmission and distribution losses, and the change in index value from 2006–2012 for electricity quality.
There is a different set of controls for the dependent variables in Equation (2) compared to Equation (1). In Equation (2), controls include GDP per capita growth over the period 1996–2012, the initial level of log GDP per capita in 1996, and also the initial level of the relevant electricity variable. If there is a negative relationship between the initial level and subsequent growth in an electricity use variable, there has been cross-country convergence.
4. Results
Table 2 shows initial results for the impact of government effectiveness on the log of final electricity consumption per capita without any controls. The impact of other governance attributes from the Worldwide Governance Indicators is also shown, allowing for a comparison of the relative importance of each governance attribute. Each of the governance attributes has positive coefficients that are significant at the one percent level, but government effectiveness has the largest coefficient of all the governance attributes. In addition, government effectiveness explains 33% of the variation in the log of final electricity consumption per capita, and this is considerably above the other governance attributes, with rule of law the next largest at 22%. Government effectiveness also explains more of the variation in other electricity variables such as generation capacity, household consumption, access rate of the population, transmission and distribution losses, and quality. Also, the regulatory quality variable that focuses on private sector development only explains 17% of the variation in the log of final electricity consumption per capita. Government effectiveness appears to be more important than other governance attributes for electricity consumption on average.
The results in Table 3 show that government effectiveness has a beneficial association with electricity sectors in developing countries, when controlling for other variables. There are positive coefficients for government effectiveness from 1996 in explaining four of the electricity dependent variables, with significance at the one percent level in column 3. Using state effectiveness from the State Fragility Index instead of government effectiveness from the Worldwide Governance Indicators also produces a corresponding significant coefficient in explaining the log of final electricity consumption per capita. In addition, the government effectiveness variable is still significant at the one percent level when regulatory quality is included as a control in the regression explaining the log of final electricity consumption per capita. A one-unit increase in government effectiveness is associated with an increase of 52% in final electricity consumption per capita on average, all else equal, based on Table 3. Column 5 suggests that a one-unit increase in government effectiveness is associated with 5% less transmission and distribution losses. A one-unit change in government effectiveness is equivalent to approximately 30% of the range of the values for government effectiveness in the low- and middle-income countries in our sample. The government effectiveness index has a standard deviation of one.
There are positive coefficients for the log of GDP per capita from 1996 in Table 3, significant in explaining the electricity variables in 2012 at the one percent level, except for electricity quality which has significance at the ten percent level, and the non-significance for electricity losses. The positive coefficients match expectation because countries with higher incomes have greater ability to increase electricity sector investment and greater demand to consume electricity, all else equal. Our use of the lagged value of log GDP per capita helps to partly address potential reverse causation from electricity to GDP per capita.
Higher proportions of populations in rural areas are associated with lower electricity access and use. The negative coefficient for rural population percentage in contributing to access to electricity is significant at the one percent level. This result matches expectation due to the greater difficulty in extending access to more dispersed populations. Having a larger rural share of the population is also associated with lower electricity capacity per capita, final electricity consumption per capita, and household electricity consumption per capita.
There are some significant coefficients for geographical variables in Table 3. Negative coefficients for temperature in explaining electricity dependent variables are significant at the one percent level in each of the first four columns. There is also some evidence that larger water resources support greater electricity capacity, with a positive coefficient and significance at the five percent level.
Electricity price is associated with significant impacts on electricity sectors in developing countries. Electricity price has a negative coefficient for household electricity consumption per capita, significant at the one percent level. While the electricity prices are from a survey for commercial business customers, it is reasonable to assume that household electricity prices across countries could be positively correlated with business prices. The negative coefficient for electricity price in the household electricity consumption regression is reasonable as higher electricity price would lower the quantity demanded. There would also be greater incentive to increase the quantity supplied when price is higher, but consumer capacity to pay high prices could be constrained in developing countries. Also, where the electricity price is higher, electricity transmission and distribution losses tend to be higher, as shown in column 5.
For the binary variable for countries in Africa and the Middle East, there are significant coefficients showing adverse effects for all six electricity dependent variables. The significance of the Africa/Middle East binary variable is not just related to common factors in Africa alone. With two binary variables, one for countries in the Middle East and North Africa, and one for countries in Sub-Saharan Africa, there are significant coefficients for each variable (results not shown). For the Middle East and North Africa binary variable, there are significant coefficients for three of the six electricity regressions. One possible explanation is that the lack of electricity sector reforms in these regions, identified by Nagayama [47], contributes in part to the significant coefficients. There are similar results when using an indicator of reform in electricity sectors [48] instead of the binary variable for countries in Africa and the Middle East. For example, the government effectiveness coefficient in the final electricity consumption regression changes from 0.522 to 0.527. The indicator of reform is not included in Table 3 as it would lower the sample size and because the paper focuses on deep determinants of electricity transitions rather than sector-specific determinants of electricity transitions. The key government effectiveness variable assesses government policy holistically, including power sector reform.
Table 4 confirms the important role of government effectiveness for electricity sectors in developing countries, supporting the case for a causal relationship rather than just correlation. The instrument, log life expectancy from 1950 to 1955, explains 18% of the variation in 2012 government effectiveness for the electricity quality regression after controlling for other variables in the first stage of the two-stage least squares process. Other changes to reduce the risk of endogeneity include using lagged data from 1960 for log GDP per capita and rural population percentage, and dropping two potentially endogenous variables, electricity price and democracy score, that do not have historical data prior to the commencement of major electricity sector development. There are statistically significant coefficients for government effectiveness in five of the six columns. The relationship between government effectiveness and final electricity consumption per capita is particularly strong. There is significance at the one percent level for government effectiveness in explaining the log of final electricity consumption per capita in Table 4 and also in Table 3. The government effectiveness variable is also significant at the one percent level in the electricity access column in Table 4, in contrast to the lack of significance for the corresponding coefficient in Table 3. The estimates in the first four columns of Table 4 pass the Stock-Yogo weak instrument test, with the F statistic on the excluded instrument exceeding the critical value.
There are similarities and differences for the controls in Table 4 compared to Table 3. The coefficients for log GDP per capita from 1960 are positive, but only column 6 has significance at the one percent level. For rural population percentage, the coefficient magnitudes are similar, as is statistical significance. There are again negative impacts of temperature for electricity capacity and consumption. The coefficients for population density and water resources are mostly not significant in Table 4. There are negative coefficients for the Africa/Middle East binary variable, but only in the electricity access regression in column 4 is there significance at the one percent level.
Table 5 shows the impact of initial government effectiveness levels on subsequent changes in electricity. Government effectiveness from 1996 has positive and significant coefficients for each of the electricity variables except electricity losses or the electricity quality index, with significance at the one percent level in both the household electricity consumption per capita and final electricity consumption per capita regressions. For a one-unit increase in the government effectiveness index, the per capita final consumption of electricity increases by 1.9 percentage points per annum on average. The positive coefficients for government effectiveness in explaining subsequent changes in electricity rather than levels are again suggestive of a causal relationship.
The signs of the coefficients for the controls in Table 5 match expectation. For the log of GDP per capita in 1996 from Table 5, the coefficients are positive and significant, except for the non-significant coefficients for the change in electricity losses and access to electricity. The positive coefficient for the log of GDP per capita in explaining the change in electricity is significant at the one percent level for both consumption variables and for electricity capacity. There are also positive and significant coefficients for GDP per capita growth, confirming that electricity use increases as economies grow. The magnitude of the coefficients for log of GDP per capita and the growth of GDP per capita are similar to the findings of Burke and Csereklyei [54].
Growth in electricity use is slower in countries that already use more electricity. For example, the log of final electricity consumption per capita in 1996 has a negative coefficient, significant at the one percent level, in explaining the change in final electricity consumption per capita for the period 1996–2012. These convergence-style coefficients are reasonable, as there may be less incentive for transitions toward greater electricity use when the initial levels are already higher. There could be diminishing returns to greater electricity use after a certain point.
A relatively large fraction of the variation in the electricity variables is explained by the regressions in each table. The R-squared values are approximately 0.8 for the regressions for electricity capacity, consumption, and access in Table 3, while the R-squared value for the change in final electricity consumption per capita is above 0.5 in Table 5.
5. Conclusions
The main finding is that government effectiveness is of central importance for electricity transitions in developing countries. The result holds for the level of electricity, and also for the impact of past government effectiveness on subsequent changes in electricity for the period 1996–2012. This paper uses a large sample of developing countries, combines numerous data sources, assesses multiple dimensions of electricity transitions, and controls for a wide range of important factors for explaining electricity variables. We use data for up to 135 developing countries up to 2012.
This paper adds to the evidence that institutions are important for economic growth [9,10] and development. In particular, it shows that government effectiveness is important for electricity transitions in developing countries. Improving government effectiveness could be a vital step towards meeting UN Sustainable Development Goal 7 of ensuring access to modern energy for all. Our finding provides an example of the wide-ranging impact of institutions, complementing other examples such as the finding of Collignon et al. [55] that poor governance contributes to the adverse public health outcome of antibiotic resistance.
Government effectiveness appears to be the key aspect of governance for electricity transitions in developing countries on average. Effective governments could impact on electricity outcomes through a number of channels, with quality of regulation being one possible channel. Whilst other studies have found that political instability has been a major negative factor in particular countries or small groups of countries [56,57], this paper finds that government effectiveness is crucial on average across a large sample of developing countries. The average effects estimated in this paper act as a complement to research on the key institutional barriers to electricity transitions in individual developing countries.
The importance of government effectiveness for electricity transitions may relate to the need for fundamental skills such as planning, committing, and prioritizing, while adapting to fit the specific context in each country. For instance, the electrification experience of Sub-Saharan African countries shows that ‘there is no single solution that fits all cases and each country would have to identify its own solution’ [23] (p. 153). Governments need to be effective to identify and then be able to successfully implement electrification plans. Sound regulatory quality in a country is not sufficient for electricity transitions, as governments play a more central role in electrification than just setting the rules for the private sector.
There are multiple quantifiable dimensions in electricity transitions, but results are similar for each dimension. For instance, electricity transitions can be assessed on criteria of access, quantity of consumption, capacity, transmission and distribution losses, or quality. Aspects of government effectiveness are important for each of these electricity dimensions. This suggests that policy to improve government effectiveness could have indirect benefits for many aspects of electricity.
Additional factors are also important for electricity transitions including economic and geographic factors, and these impacts match expectation. For instance, this paper finds that higher GDP per capita is associated with higher use of electricity. Higher temperatures are associated with lower electricity use; temperature could be relevant for electricity use due to direct reasons such as differing motivations for heating and cooling in countries with different temperatures, or other indirect reasons such as impacts on sectoral compositions of economies. We also find that a higher rural share of the population leads to lower electricity access.
Government effectiveness is an indirect channel promoting electricity transitions in developing countries. Policies to enhance government effectiveness can provide a solid foundation and be complementary to sector-specific policies to increase electricity access and use in developing countries.
Donors considering contributing to electrification in developing countries could expect more effective outcomes by focusing on countries with better governance. Kenya, for example, had a government effectiveness score above the average for Sub-Saharan Africa in 2012, and started to receive support from the African Development Bank in 2015 for the Last Mile Connectivity Project. This project aims to support government initiatives to increase electricity access [58]. Additional government input in Kenya could help to convert investment in electricity grid infrastructure into higher rates of electricity access [59]. Ethiopia is another country that had a government effectiveness score above the average for Sub-Saharan Africa in 2012. In addition, Ethiopia has relatively high renewable energy potential, particularly hydropower [60]. In contrast, countries with low government effectiveness could be more risky destinations for donor contributions to electrification.
There is scope for further research on factors affecting electrification. For instance, the impacts of economic structure and policies aiming to influence the industrial or services shares of GDP could be investigated. In addition, the impact of electrification on long-term economic, social, and environmental indicators is a related area for further research.
Acknowledgments
We are grateful for comments from Terence Wood, David Stern, Panittra Ninpanit, Bao Nguyen, anonymous reviewers, and participants at the following presentations: the Arndt-Corden Department of Economics Seminars (ANU), the Australian Agricultural and Resource Economics Society 2017 Conference, and the 2016 Annual Crawford School Conference (ANU). Funding was received from the Australian Research Council (DE160100750). This research was also supported by an Australian Government Research Training Program (RTP) Scholarship.
Author Contributions
Rohan Best and Paul J. Burke contributed to data analysis, statistical results, and writing.
Conflicts of Interest
The authors declare no conflict of interest.
Appendix A

| Variable | Source | Description |
| Electricity capacity per capita (log) | UN | Log of electricity capacity per capita in kilowatts. |
| Electricity—household consumption per capita (log) | UN | Log of household consumption of electricity per capita in megawatt-hours per year. |
| Electricity—final consumption per capita (log) | UN | Log of final consumption of electricity per capita in megawatt-hours per year. |
| Access to electricity | WDI | Access to electricity (percentage of population divided by 100). |
| Electricity transmission and distribution losses | WDI | Electricity transmission and distribution losses (percentage of output divided by 100). |
| Electricity quality index | WEF | Quality of electricity supply (lack of interruptions and lack of voltage fluctuations), 1 = extremely unreliable, 7 = extremely reliable. |
| Government effectiveness | WGI | An index representing quality of public services and quality of policy formulation and implementation. This and other governance index values are normally distributed with mean zero and standard deviation of one. |
| Voice and accountability | WGI | An index representing the degree of citizen participation in government selection and freedom of expression. |
| Political stability | WGI | An index relating to the lack of violence in addition to stability more generally. |
| Regulatory quality | WGI | An index giving an assessment of policies and regulations related to private sector development. |
| Rule of law | WGI | An index based on the quality of property rights and the judicial system. |
| Control of corruption | WGI | An index representing the extent to which public power being used for private gain is avoided. |
| Gross domestic product per capita (log) | WDI | Log of GDP per capita per year, purchasing power parity terms, constant 2011 international dollars. |
| Population | WDI | Number of people. |
| Rural population | WDI | Percentage of population living in rural areas. |
| Population density | WDI | People per square kilometer of land area, divided by one thousand. |
| Temperature | CRU | Average temperature, degrees Celsius. |
| Water resources per capita | WDI | Renewable internal freshwater resources per capita (thousand cubic meters). |
| Electricity prices | WB | Average of electricity price from 2015 and 2016 data in US cents per kilowatt-hour for a business with a standardized warehouse. Earlier years of data are not available. |
| Democracy/autocracy | PIV | Democracy score minus autocracy score (Polity2 variable). |
| Africa/Middle East | WDI | Binary variable equal to 1 for countries in Africa and the Middle East. |
| Log life expectancy (1950–1955) | UN | Log life expectancy at birth, both sexes combined 1950–1955, medium variant. |
| Policy reform indicator | ESM | Reform indicator for the power sector for reforms undertaken up to 1998. Countries have a score of between 0 and 6, with one point added for each reform undertaken in the power sector from the following list: utility commercialization/corporatization, energy law passed, regulatory body commenced work, private sector investment in new power plants, restructure/separation of state-owned power utility, privatization of electricity generation or distribution. |
| GDP per capita, 1960 (log) | CLIO | Log of GDP per capita per year in 1990 international Geary-Khamis dollars, data for 1960. |
Notes. Sources: UN: United Nations, WDI: World Development Indicators, WEF: World Economic Forum: Competitiveness Rankings, WGI: Worldwide Governance Indicators, WB: World Bank Doing Business—Getting Electricity, CRU: Climate Research Unit (UK). PIV: Polity IV project, ESM: ESMAP [48], CLIO: Clio Infra—secretarial function for database performed by International Institute of Social History and using a subsidy from the Netherlands Organisation for Scientific Research.
References
- Winkler, H.; Simöes, A.F.; La Rovere, E.L.; Alam, M.; Rahman, A. Access and affordability of electricity in developing countries. World Dev. 2011, 39, 1037–1050. [Google Scholar] [CrossRef]
- World Bank. World Development Indicators, 1998–2012. World Bank 2016. Available online: http://data.worldbank.org/ (accessed on 22 March 2016).
- World Bank. Overview: State of Electricity Access Report 2017; World Bank: Washington, DC, USA, 2017. [Google Scholar]
- Stern, D.I. The role of energy in economic growth. Ann. N. Y. Acad. Sci. 2011, 1219, 26–51. [Google Scholar] [CrossRef] [PubMed]
- Grogan, L.; Sadanand, A. Rural electrification and employment in poor countries: Evidence from Nicaragua. World Dev. 2013, 43, 252–265. [Google Scholar] [CrossRef]
- Salmon, C.; Tanguy, J. Rural electrification and household labor supply: Evidence from Nigeria. World Dev. 2016, 82, 48–68. [Google Scholar] [CrossRef]
- World Bank. Addressing the Electricity Gap. Background Paper for the World Bank Energy Sector Strategy; World Bank: Washington, DC, USA, 2010. [Google Scholar]
- Lim, S.S.; Vos, T.; Flaxman, A.D.; Danaei, G.; Shibuya, K.; Adair-Rohani, H.; AlMazroa, M.A.; Amann, M.; Anderson, H.R.; Andrews, K.G.; et al. A comparative risk assessment of burden of disease and injury attributable to 67 risk factors and risk factor clusters in 21 regions, 1990–2010: A systematic analysis for the Global Burden of Disease Study 2010. Lancet 2012, 380, 2224–2260. [Google Scholar] [CrossRef]
- Acemoglu, D.; Johnson, S.; Robinson, J.A. The colonial origins of comparative development: An empirical investigation. Am. Econ. Rev. 2001, 91, 1369–1401. [Google Scholar] [CrossRef]
- Acemoglu, D.; Johnson, S.; Robinson, J.A. Institutions as a fundamental cause of long-run growth. Handb. Econ. Growth 2005, 1, 385–472. [Google Scholar]
- Sen, K. Governance and Development Outcomes in Asia; Asian Development Bank Economics Working Paper Series, No. 384; Asian Development Bank: Mandaluyong, Philippines, 2014. [Google Scholar]
- Rajkumar, A.S.; Swaroop, V. Public spending and outcomes: Does governance matter? J. Dev. Econ. 2008, 86, 96–111. [Google Scholar] [CrossRef]
- Halleröd, B.; Rothstein, B.; Daoud, A.; Nandy, S. Bad governance and poor children: A comparative analysis of government efficiency and severe child deprivation in 68 low- and middle-income countries. World Dev. 2013, 48, 19–31. [Google Scholar] [CrossRef]
- Edwards, R.B. Mining away the Preston curve. World Dev. 2016, 78, 22–36. [Google Scholar] [CrossRef]
- Kaufmann, D.; Kraay, A.; Mastruzzi, M. Governance Matters VIII: Aggregate and Individual Governance Indicators 1996–2008; Policy Research Working Paper 4978; The World Bank Development Research Group, Macroeconomics and Growth Team: Washington, DC, USA, 2009. [Google Scholar]
- Kaufmann, D.; Kraay, A.; Mastruzzi, M. The Worldwide Governance Indicators: Methodology and Analytical Issues; Policy Research Working Paper 5430; The World Bank Development Research Group, Macroeconomics and Growth Team: Washington, DC, USA, 2010. [Google Scholar]
- Onyeji, I.; Bazilian, M.; Nussbaumer, P. Contextualizing electricity access in sub-Saharan Africa. Energy Sustain. Dev. 2012, 16, 520–527. [Google Scholar] [CrossRef]
- Magnani, N.; Vaona, A. Access to electricity and socio-economic characteristics: Panel data evidence at the country level. Energy J. 2016, 103, 447–455. [Google Scholar] [CrossRef]
- Dal Bó, E.; Rossi, M.A. Corruption and inefficiency: Theory and evidence from electricity utilities. J. Public Econ. 2007, 91, 939–962. [Google Scholar] [CrossRef]
- Estache, A.; Goicoechea, A.; Trujillo, L. Utilities reforms and corruption in developing countries. Util. Policy 2009, 17, 191–202. [Google Scholar] [CrossRef]
- Pless, J.; Fell, H. Bribes, bureaucracies, and blackouts: Towards understanding how corruption at the firm level impacts electricity reliability. Resour. Energy Econ. 2017, 47, 36–55. [Google Scholar] [CrossRef]
- Abbott, M. Is the security of electricity supply a public good? Electr. J. 2001, 14, 31–33. [Google Scholar] [CrossRef]
- Bhattacharyya, S.C. Chapter 6: Electrification Experiences from Sub-Saharan Africa. In Rural Electrification through Decentralised Off-Grid Systems in Developing Countries; Green Energy and Technology; Springer: London, UK, 2013. [Google Scholar]
- International Energy Agency (IEA). Energy for All: Financing Access for the Poor (Special Early Excerpt of the World Energy Outlook 2011); International Energy Agency (IEA): Paris, France, 2011. [Google Scholar]
- Bhattacharyya, S.C. Energy access programmes and sustainable development: A critical review and analysis. Energy Sustain. Dev. 2012, 16, 260–271. [Google Scholar] [CrossRef]
- Ostojic, D.; Jammi, R.; Barnes, D.; Sanghvi, A.; Mathur, S.; Zhang, Y.; Durix, L. One Goal, Two Paths: Achieving Universal Access to Modern Energy in East Asia and the Pacific; World Bank: Washington, DC, USA, 2011. [Google Scholar]
- Asian Development Bank. Achieving Universal Electricity Access in Indonesia; Asian Development Bank: Mandaluyong, Philippines, 2016. [Google Scholar]
- Lake, D.A.; Baum, M.A. The invisible hand of democracy: Political control and provision of public services. Comp. Polit. Stud. 2001, 34, 587–621. [Google Scholar] [CrossRef]
- Kroth, V.; Larcinese, V.; Wehner, J. A better life for all? Democratization and electrification in post-apartheid South Africa. J. Polit. 2016, 78, 774–791. [Google Scholar] [CrossRef]
- Ahlborg, H.; Boräng, F.; Jagers, S.C.; Söderholm, P. Provision of electricity to African households: The importance of democracy and institutional quality. Energy Policy 2015, 87, 125–135. [Google Scholar] [CrossRef]
- Trotter, P.A. Rural electrification, electrification inequality and democratic institutions in sub-Saharan Africa. Energy Sustain. Dev. 2016, 34, 111–129. [Google Scholar] [CrossRef]
- Boräng, F.; Jagers, S.C.; Povitkina, M. Political determinants of electricity provision in small island developing states. Energy Policy 2016, 98, 725–734. [Google Scholar] [CrossRef]
- Wolfram, C.; Shelef, O.; Gertler, P. How will energy demand develop in the developing world? J. Econ. Perspect. 2012, 26, 119–138. [Google Scholar] [CrossRef]
- Kessides, I.N. The impacts of electricity sector reforms in developing countries. Electr. J. 2012, 25, 79–88. [Google Scholar] [CrossRef]
- Pollitt, M. The role of policy in energy transitions: Lessons from the energy liberalisation era. Energy Policy 2012, 50, 128–137. [Google Scholar] [CrossRef]
- Jamasb, T.; Nepal, R.; Timilsina, G.R. A quarter century effort yet to come of age: A survey of electricity sector reform in developing countries. Energy J. 2017, in press. [Google Scholar] [CrossRef]
- Nepal, R.; Jamasb, T. Reforming the power sector in transition: Do institutions matter? Energy Econ. 2012, 34, 1675–1682. [Google Scholar] [CrossRef]
- United Nations Energy Statistics Database. 2016. Available online: http://data.un.org/Explorer.aspx?d=EDATA (accessed on 22 March 2016).
- Worldwide Governance Indicators. Available online: http://info.worldbank.org/governance/wgi/index.aspx#home (accessed on 29 March 2016).
- Stern, D.I. Between estimates of the emissions-income elasticity. Ecol. Econ. 2010, 69, 2173–2182. [Google Scholar] [CrossRef]
- World Economic Forum Competitiveness Rankings. Available online: http://reports.weforum.org/global-competitiveness-report-2014-2015/rankings/ (accessed on 24 July 2016).
- World Bank; International Energy Agency. Sustainable Energy for All 2013–2014: Global Tracking Framework Report; World Bank: Washington, DC, USA, 2014. [Google Scholar]
- Marshall, M.G.; Cole, B.R. Global Report 2014: Conflict, Governance, and State Fragility; Center for Systemic Peace: Vienna, VA, USA, 2014. [Google Scholar]
- Burke, P.J. Income, resources, and electricity mix. Energy Econ. 2010, 32, 616–626. [Google Scholar] [CrossRef]
- Pfeiffer, B.; Mulder, P. Explaining the diffusion of renewable energy technology in developing countries. Energy Econ. 2013, 40, 285–296. [Google Scholar] [CrossRef]
- Gertler, P.J.; Shelef, O.; Wolfram, C.D.; Fuchs, A. The demand for energy-using assets among the world’s rising middle classes. Am. Econ. Rev. 2016, 106, 1366–1401. [Google Scholar] [CrossRef]
- Nagayama, H. Impacts on investments, and transmission/distribution loss through power sector reforms. Energy Policy 2010, 38, 3453–3467. [Google Scholar] [CrossRef]
- Energy Sector Management Assistance Program (ESMAP). Global Energy Sector Reform in Developing Countries: A Scorecard; ESM 219; Energy Sector Management Assistance Programme: Washington, DC, USA, 1999. [Google Scholar]
- Harris, I.; Jones, P.D.; Osborn, T.J.; Lister, D.H. Updated high-resolution grids of monthly climatic observations—The CRU TS3.10 Dataset. Int. J. Climatol. 2014, 34, 623–642. [Google Scholar] [CrossRef] [Green Version]
- World Bank Doing Business: Measuring Business Regulations, World Bank. Available online: http://data.worldbank.org/ (accessed on 24 August 2016).
- Marshall, M.G.; Gurr, T.R.; Jaggers, K. Polity IV Project: Political Regime Characteristics and Transitions, 1800–2013; Center for Systemic Peace: Vienna, VA USA, 2014. [Google Scholar]
- Clio Infra Reconstructing Global Inequality Datasets. Available online: https://www.clio-infra.eu (accessed on 2 August 2016).
- United Nations World Population Prospects: The 2012 Revision. Available online: http://data.un.org/Data.aspx?d=PopDiv&f=variableID%3a68 (accessed on 22 April 2016).
- Burke, P.J.; Csereklyei, Z. Understanding the energy-GDP elasticity: A sectoral approach. Energy Econ. 2016, 58, 199–210. [Google Scholar] [CrossRef]
- Collignon, P.; Athukorala, P.-C.; Senanayake, S.; Khan, F. Antimicrobial resistance: The major contribution of poor governance and corruption to this growing problem. PLoS ONE 2015, 10. [Google Scholar] [CrossRef] [PubMed]
- Bhattacharyya, S.C. Power sector reform in South Asia: Why slow and limited so far? Energy Policy 2007, 35, 317–332. [Google Scholar] [CrossRef]
- Nepal, R.; Jamasb, T. Reforming small electricity systems under political instability: The case of Nepal. Energy Policy 2012, 40, 242–251. [Google Scholar] [CrossRef]
- African Development Bank. Kenya: Last Mile Connectivity Project II: Appraisal Report; African Development Bank: Abidjan, Côte d’Ivoire, 2016. [Google Scholar]
- Lee, K.; Brewer, E.; Christiano, C.; Meyo, F.; Miguel, E.; Podolsky, M.; Rosa, J.; Wolfram, C. Electrification for ‘under grid’ households in rural Kenya. Dev. Eng. 2016, 1, 26–35. [Google Scholar] [CrossRef]
- Howells, M.; Rogner, H.H.; Mentis, D.; Broad, O. Energy Access and Electricity Planning; World Bank: Washington, DC, USA, 2017. [Google Scholar]
Figure 1.
Countries shaded in red (dark shade) if final electricity consumption per capita in 2012 was less than 250 kilowatt hours. Data are available for 133 developing countries. The most populous country for which data are unavailable is Eritrea. Sources: [2,38].
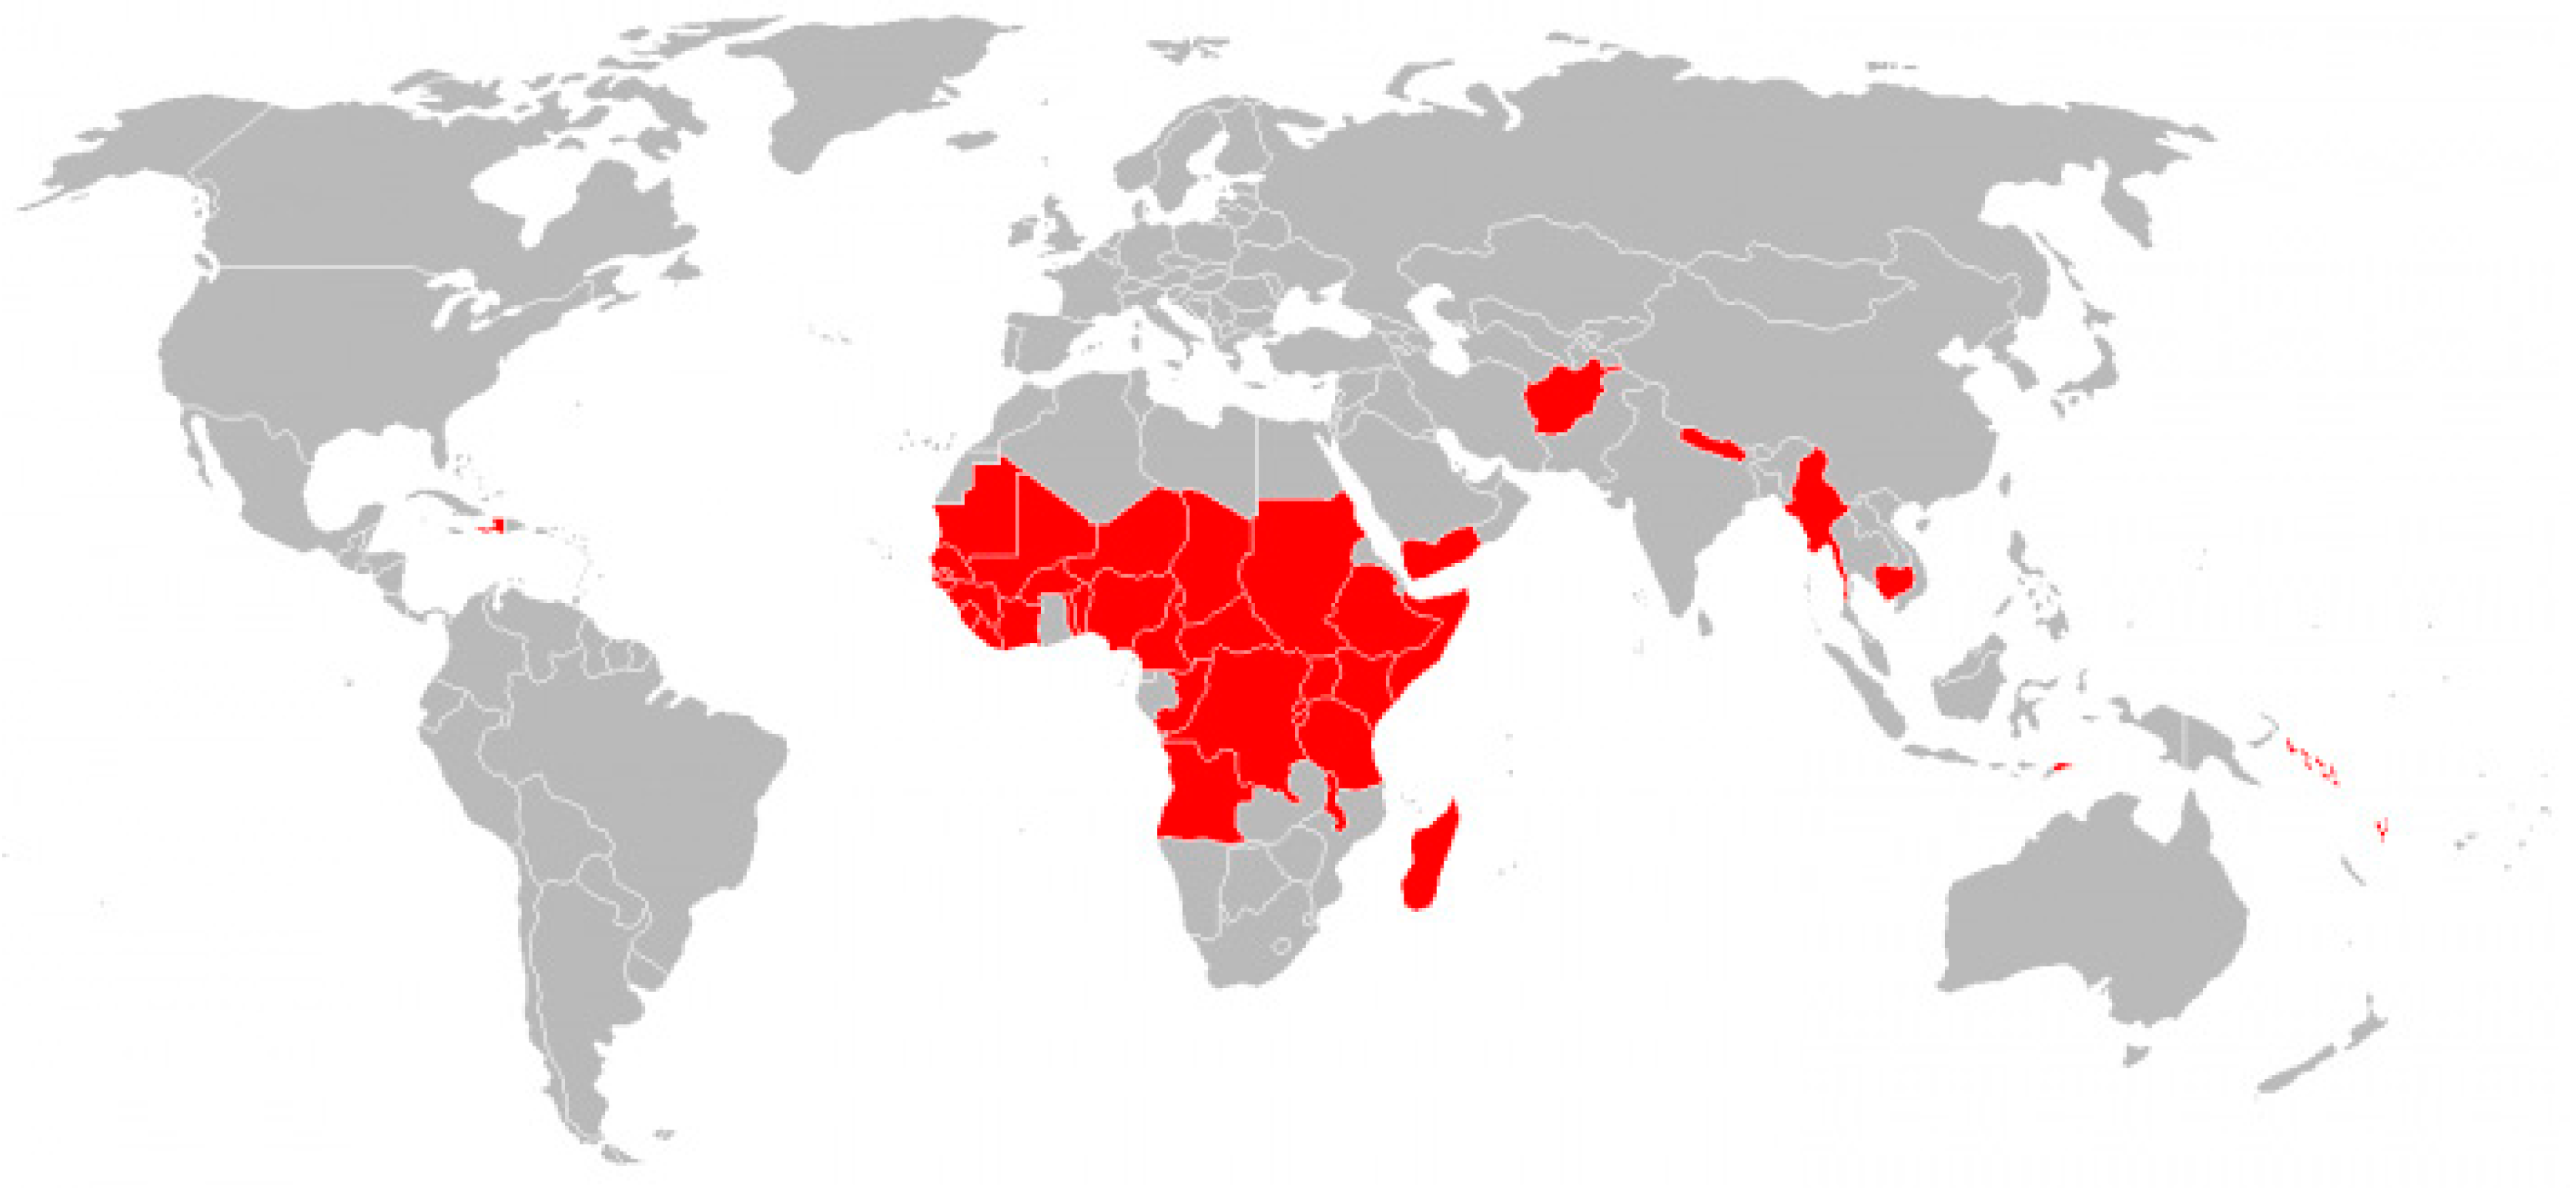
Figure 2.
Government effectiveness and log of final electricity consumption (megawatt hours per capita). Data are unavailable for some small countries. The most populous country for which data are unavailable is Eritrea. Sources: [2,38,39].

Table 1.
Electricity use and government effectiveness, developing countries, 2012.
| Variable | Min. | Mean | Max. | Standard Deviation |
|---|---|---|---|---|
| Electricity capacity per capita | 0.003 | 0.38 | 2.51 | 0.45 |
| Household electricity consumption per capita | 0.005 | 0.38 | 2.11 | 0.39 |
| Final electricity consumption per capita | 0.01 | 1.14 | 5.19 | 1.15 |
| Electricity access | 0.05 | 0.68 | 1.00 | 0.33 |
| Transmission and distribution losses | 0.06 | 0.17 | 0.83 | 0.11 |
| Electricity quality | 1.18 | 3.66 | 6.03 | 1.28 |
| Government effectiveness | −2.23 | −0.56 | 1.01 | 0.63 |
Notes. Electricity capacity is in kilowatts. Electricity consumption is in megawatt hours. Electricity access is percentage of population with access to electricity divided by 100. Electricity transmission and distribution losses are percentage of electricity output divided by 100. Electricity quality and government effectiveness are index values. Electricity quality ranges from 1 for extremely unreliable to 7 for extremely reliable. Government effectiveness is distributed over a standard normal.
Table 2.
Results, Worldwide Governance Indicators and log of final electricity consumption per capita, 2012.
Table 2.
Results, Worldwide Governance Indicators and log of final electricity consumption per capita, 2012.
| Dependent Variable: Log of Final Electricity Consumption Per Capita (Megawatt-Hours) | ||||||
|---|---|---|---|---|---|---|
| (1) | (2) | (3) | (4) | (5) | (6) | |
| Government | 1.350 *** | |||||
| effectiveness | (0.164) | |||||
| Control of | 1.030 *** | |||||
| corruption | (0.209) | |||||
| Voice and | 0.572 *** | |||||
| accountability | (0.145) | |||||
| Political stability/ | 0.496 *** | |||||
| no violence | (0.120) | |||||
| Regulatory | 0.890 *** | |||||
| quality | (0.180) | |||||
| Rule of | 1.107 *** | |||||
| law | (0.157) | |||||
| Number of countries | 133 | 133 | 133 | 133 | 133 | 133 |
| R2 | 0.333 | 0.164 | 0.098 | 0.099 | 0.168 | 0.223 |
Notes. *** shows statistical significance at the 1 per cent level. Robust standard errors are in brackets below the coefficients. Coefficients for constants are not shown. All variables are for 2012. The coefficient for government effectiveness is similar when using the between estimator with panel data for 2002–2012.
Table 3.
Results, lagged government effectiveness and electricity use, 2012.
| (1) Log of Electricity Capacity Per Capita (Kilowatts) | (2) Log of Household Consumption of Electricity Per Capita (Megawatt-Hours) | (3) Log of Final Consumption of Electricity Per Capita (Megawatt-Hours) | (4) Access to Electricity (Percentage of Population Divided by 100) | (5) Electricity Transmission and Distribution Losses (Percentage of Output Divided by 100) | (6) Electricity Quality Index | |
|---|---|---|---|---|---|---|
| Government | 0.308 * | 0.314 ** | 0.522 *** | −0.006 | −0.049 * | 0.551 ** |
| effectiveness 1996 | (0.183) | (0.142) | (0.171) | (0.038) | (0.026) | (0.249) |
| Log GDP | 0.604 *** | 0.801 *** | 0.678 *** | 0.157 *** | −0.014 | 0.345 * |
| per capita, 1996 | (0.163) | (0.124) | (0.166) | (0.028) | (0.025) | (0.196) |
| Rural population | −0.019 *** | −0.012 ** | −0.016 *** | −0.005 *** | 0.001 | −0.009 |
| (% of pop.), 1996 | (0.006) | (0.005) | (0.005) | (0.001) | (0.001) | (0.011) |
| Population | −0.079 | 0.343 | 0.114 | 0.295 * | −0.064 | −1.032 |
| density | (0.520) | (0.347) | (0.313) | (0.165) | (0.045) | (0.964) |
| Temperature | −0.050 *** | −0.041 *** | −0.053 *** | −0.008 *** | −0.001 | −0.010 |
| degrees Celsius | (0.016) | (0.013) | (0.013) | (0.003) | (0.002) | (0.020) |
| Water resources | 0.003 ** | 0.001 | 0.001 | −0.000 | 0.000 | −0.004 ** |
| per capita | (0.001) | (0.002) | (0.001) | (0.000) | (0.001) | (0.002) |
| Electricity | −0.017 | −0.026 *** | −0.014 | −0.002 | 0.004 * | 0.018 |
| price | (0.011) | (0.009) | (0.012) | (0.002) | (0.002) | (0.014) |
| Democracy/ | −0.023 | −0.010 | −0.021 * | −0.003 | 0.001 | −0.051 ** |
| autocracy | (0.015) | (0.013) | (0.012) | (0.004) | (0.003) | (0.021) |
| Africa/Middle | −0.928 *** | −0.621 *** | −0.702 *** | −0.243 *** | 0.062 ** | −0.824 ** |
| East | (0.189) | (0.134) | (0.140) | (0.041) | (0.024) | (0.365) |
| Number of countries | 100 | 97 | 100 | 100 | 73 | 83 |
| R2 | 0.804 | 0.831 | 0.843 | 0.812 | 0.214 | 0.423 |
Notes. ***, **, * show statistical significance at 1, 5 and 10 per cent level, respectively. Robust standard errors are in brackets below the coefficients. Coefficients for constants are not shown. Electricity price is the average of 2015 and 2016 data as earlier years of data are not available. Africa/Middle East is a binary variable equal to one for countries in Africa or the Middle East, and zero otherwise.
Table 4.
Instrumental variable results, government effectiveness and electricity use, 2012.
| (1) Log of Electricity Capacity Per Capita (Kilowatts) | (2) Log of Household Consumption of Electricity Per Capita (Megawatt-Hours) | (3) Log of Final Consumption of Electricity Per Capita (Megawatt-Hours) | (4) Access To Electricity (Percentage of Population Divided by 100) | (5) Electricity Transmission and Distribution Losses (Percentage of Output Divided by 100) | (6) Electricity Quality Index | |
|---|---|---|---|---|---|---|
| Government | 1.562 *** | 1.949 *** | 1.730 *** | 0.260 *** | −0.140 ** | 0.686 |
| effectiveness IV | (0.417) | (0.491) | (0.346) | (0.072) | (0.065) | (0.567) |
| Log GDP | 0.337 | 0.426 | 0.474 | 0.071 | 0.069 | 0.826 *** |
| per capita, 1960 | (0.324) | (0.352) | (0.290) | (0.073) | (0.059) | (0.319) |
| Rural population | −0.035 *** | −0.019 | −0.023 ** | −0.009 *** | 0.002 | 0.001 |
| (% of pop.), 1960 | (0.011) | (0.012) | (0.010) | (0.003) | (0.001) | (0.016) |
| Population | −0.780 | −0.781 | −0.868 | 0.108 | −0.024 | −1.694 ** |
| density | (0.771) | (0.918) | (0.913) | (0.116) | (0.067) | (0.688) |
| Temperature | -0.045 ** | −0.045 *** | −0.055 *** | −0.004 | 0.003 | −0.009 |
| degrees Celsius | (0.018) | (0.016) | (0.015) | (0.004) | (0.002) | (0.022) |
| Water resources | −0.001 | −0.001 | −0.005 | −0.000 | −0.001 | −0.012 * |
| per capita | (0.008) | (0.009) | (0.008) | (0.002) | (0.001) | (0.007) |
| Africa/Middle | −0.341 | −0.089 | −0.232 | −0.144 *** | −0.022 | -0.533 |
| East | (0.236) | (0.257) | (0.213) | (0.049) | (0.036) | (0.351) |
| Number of countries | 92 | 87 | 92 | 92 | 66 | 73 |
| R2 | 0.609 | 0.509 | 0.648 | 0.641 | 0.148 | 0.530 |
| Second-stage F stat | 27.98 *** | 17.97 *** | 32.65 *** | 33.21 *** | 1.32 | 10.70 *** |
| Instrument: Log life expectancy, 1950–1955 | ||||||
| F statistic (excluded) | 15.257 | 12.564 | 15.257 | 15.257 | 6.435 | 7.729 |
| Partial R2 | 0.162 | 0.168 | 0.162 | 0.162 | 0.088 | 0.181 |
Notes. ***, **, * show statistical significance at 1, 5 and 10 per cent level respectively. Robust standard errors are in brackets below the coefficients. Coefficients for constants are not shown. The Stock-Yogo test critical value at 5% significance level (15% maximal IV size) is 8.96.
Table 5.
Results, government effectiveness and change in electricity use, changes up to 2012.
| (1) Annual Percentage Change in Electricity Capacity Per Capita (1996–2012) | (2) Annual Percentage Change in Household Consumption of Electricity Per Capita (1996–2012) | (3) Annual Percentage Change in Final Consumption of Electricity Per Capita (1996–2012) | (4) Change in Access to Electricity (2000–2012) | (5) Change in Electricity Transmission and Distribution Losses (1996–2012) | (6) Change in Electricity Quality Index (2006–2012) | |
|---|---|---|---|---|---|---|
| Government | 0.011 ** | 0.016 *** | 0.019 *** | 0.021 * | −0.038 | −0.020 |
| effectiveness, 1996 | (0.005) | (0.005) | (0.006) | (0.011) | (0.026) | (0.218) |
| Log GDP | 0.021 *** | 0.017 *** | 0.021 *** | 0.006 | −0.023 | 0.489 *** |
| per capita, 1996 | (0.005) | (0.006) | (0.006) | (0.010) | (0.023) | (0.144) |
| GDP p.c. growth | 0.800 *** | 0.792 *** | 0.883 *** | 0.115 | −1.708** | 17.885 *** |
| p.a. 1996–2012 | (0.174) | (0.150) | (0.171) | (0.278) | (0.756) | (4.615) |
| Log electricity | −0.019 *** | |||||
| capacity pc, 1996 | (0.004) | |||||
| Log household | −0.020 *** | |||||
| elec. cons. pc, 1996 | (0.004) | |||||
| Log final electricity | −0.022 *** | |||||
| consumption pc, 96 | (0.003) | |||||
| Access to | -0.099 *** | |||||
| electricity, 2000 | (0.024) | |||||
| Electricity losses | −0.866 *** | |||||
| (% of output, 1996) | (0.108) | |||||
| Electricity quality | −0.438 *** | |||||
| index, 2006 | (0.142) | |||||
| Number of countries | 105 | 98 | 106 | 109 | 76 | 68 |
| R2 | 0.347 | 0.411 | 0.504 | 0.203 | 0.552 | 0.354 |
Notes. ***, **, * show statistical significance at 1, 5 and 10% level respectively. Robust standard errors are in brackets below the coefficients. Coefficients for constants are not shown.
© 2017 by the authors. Licensee MDPI, Basel, Switzerland. This article is an open access article distributed under the terms and conditions of the Creative Commons Attribution (CC BY) license (http://creativecommons.org/licenses/by/4.0/).
Share and Cite
MDPI and ACS Style
Best, R.; Burke, P.J. The Importance of Government Effectiveness for Transitions toward Greater Electrification in Developing Countries. Energies 2017, 10, 1247. https://doi.org/10.3390/en10091247
AMA Style
Best R, Burke PJ. The Importance of Government Effectiveness for Transitions toward Greater Electrification in Developing Countries. Energies. 2017; 10(9):1247. https://doi.org/10.3390/en10091247
Chicago/Turabian StyleBest, Rohan, and Paul J. Burke. 2017. "The Importance of Government Effectiveness for Transitions toward Greater Electrification in Developing Countries" Energies 10, no. 9: 1247. https://doi.org/10.3390/en10091247
Note that from the first issue of 2016, this journal uses article numbers instead of page numbers. See further details here.