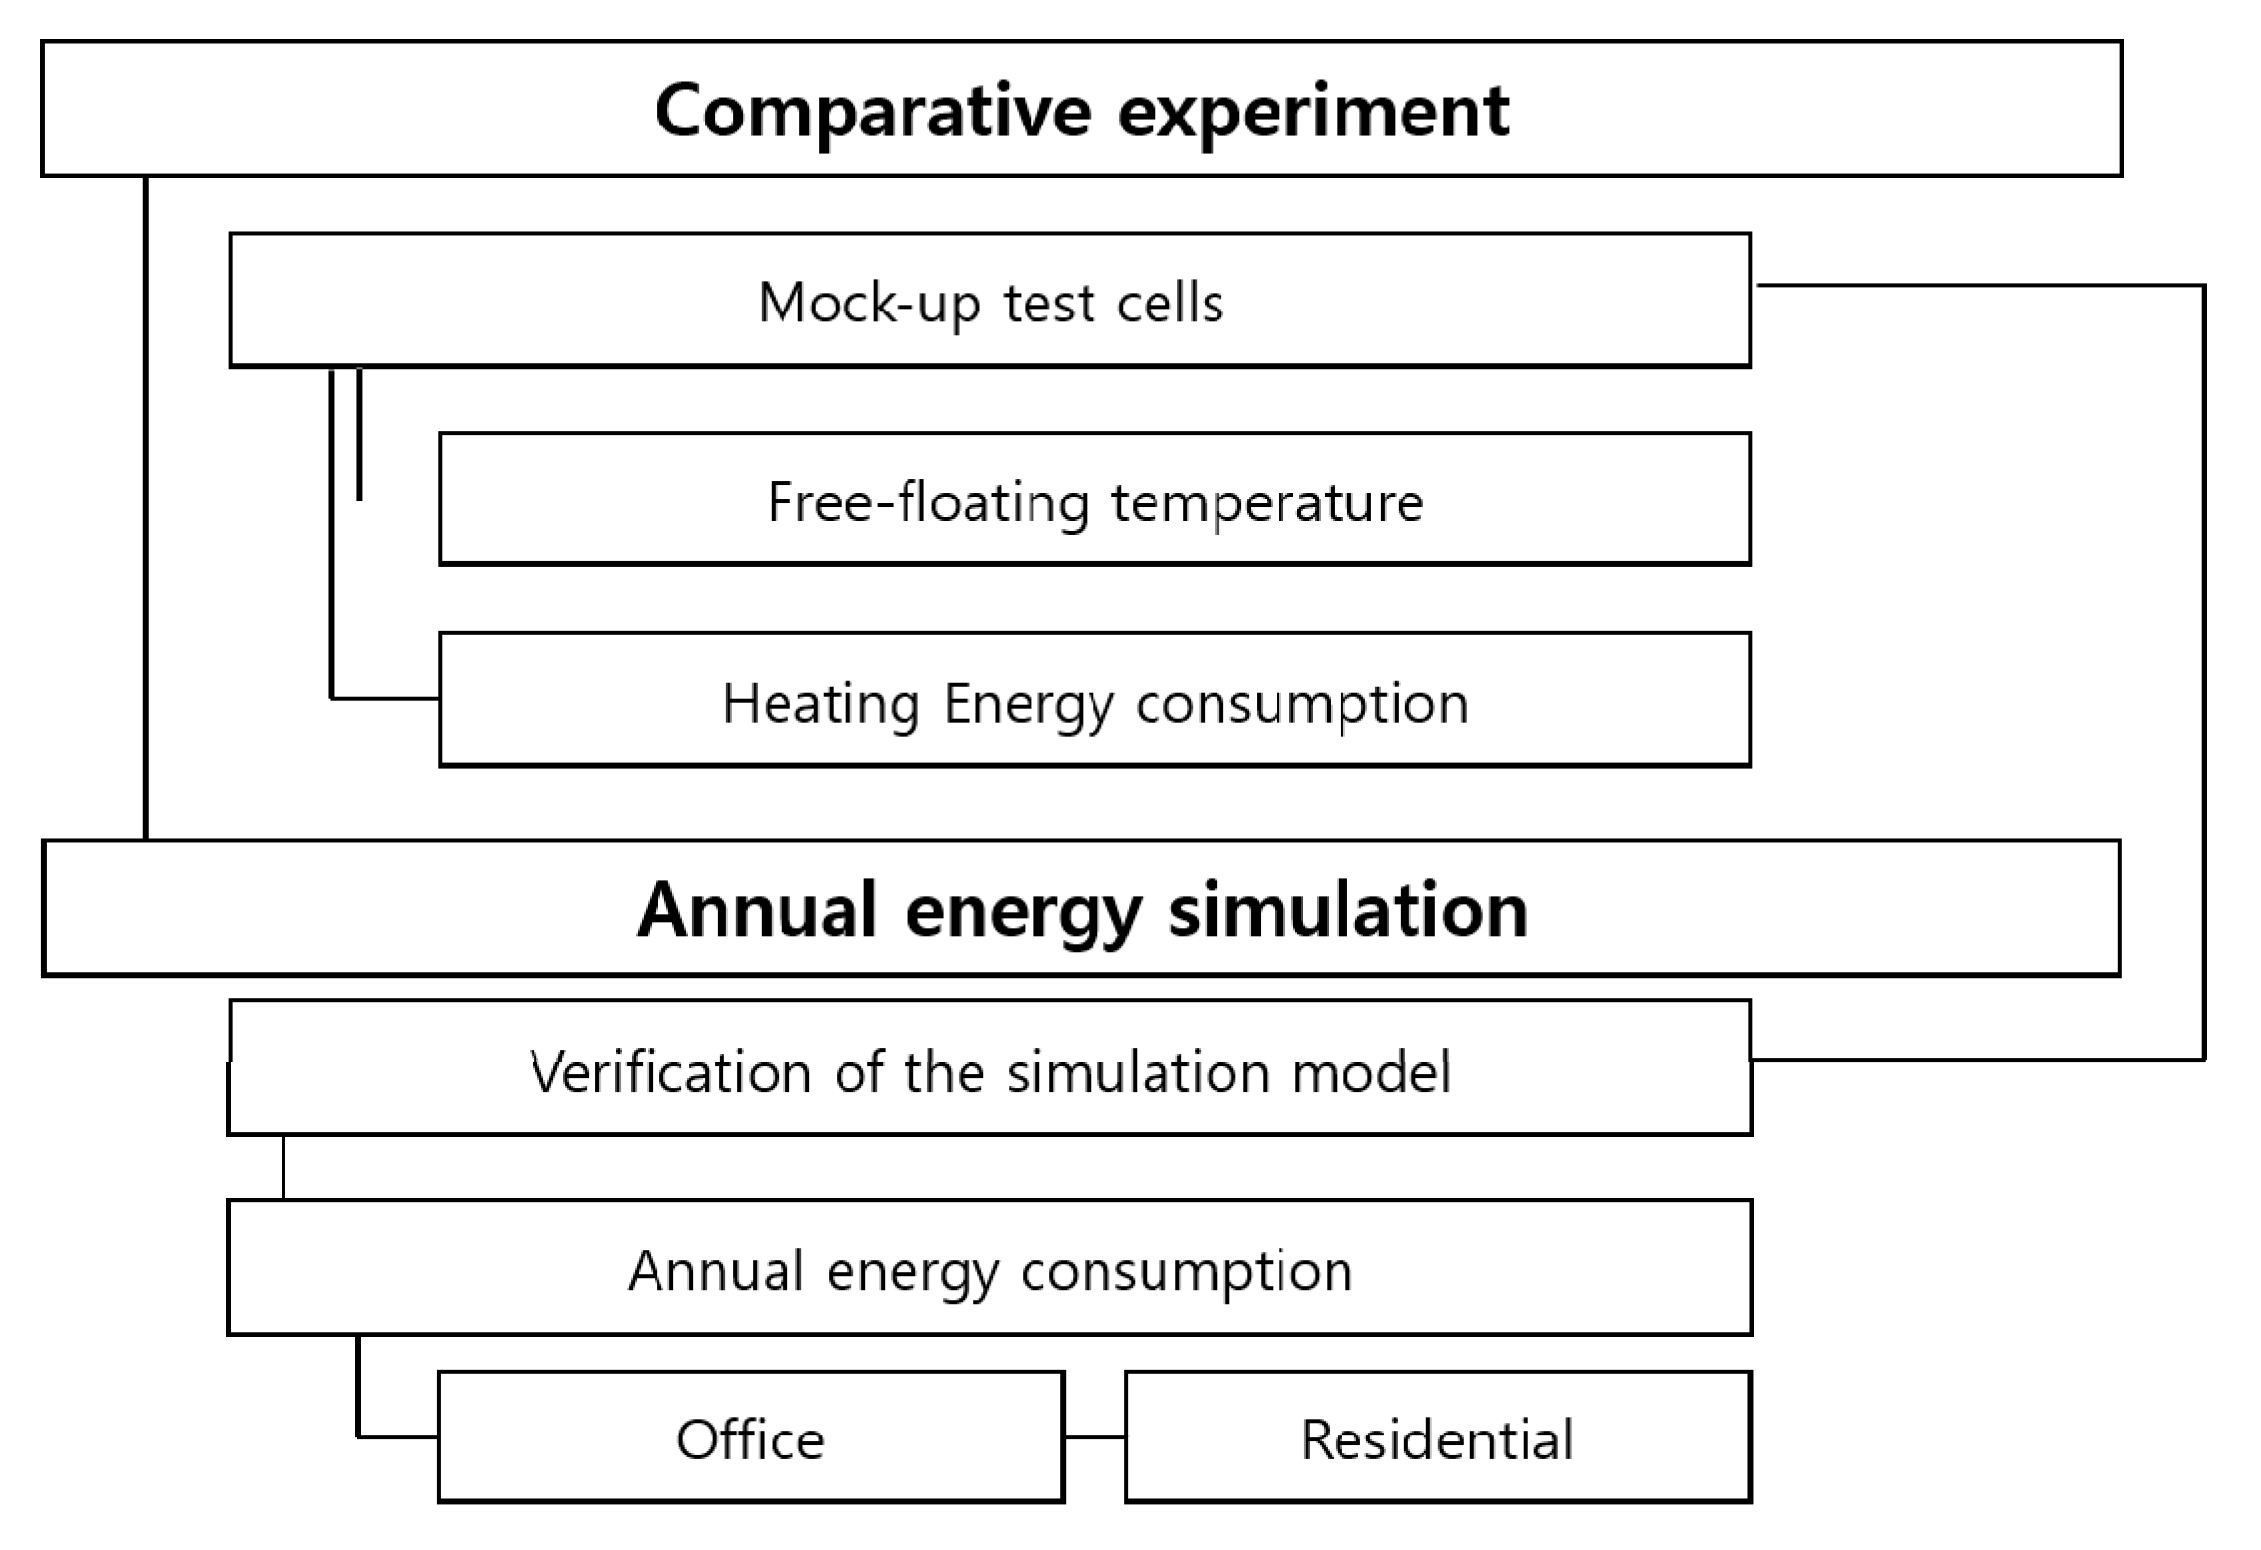
3.1. Simulation Overview
The results in
Section 3 show only the results for mock-up chambers for simultaneous comparisons, and the experimental period was rather short. This makes it difficult to characterize the entire winter season. Therefore, a simulation was conducted to evaluate the annual cooling and heating energy and determine the characteristics of each building type.
To do this, the mock-up chamber was first simulated and the experimental results were verified. An office building, which is used mainly during the day, and a residential building, which is used mainly during the night, were then simulated.
The simulation model for the experimental verification was based on the EnergyPlus model of a previous study [
15], which precisely simulated the field mock-up. The compared glazing types were analyzed by inputting the spectral data calculated using Window 7.4 software.
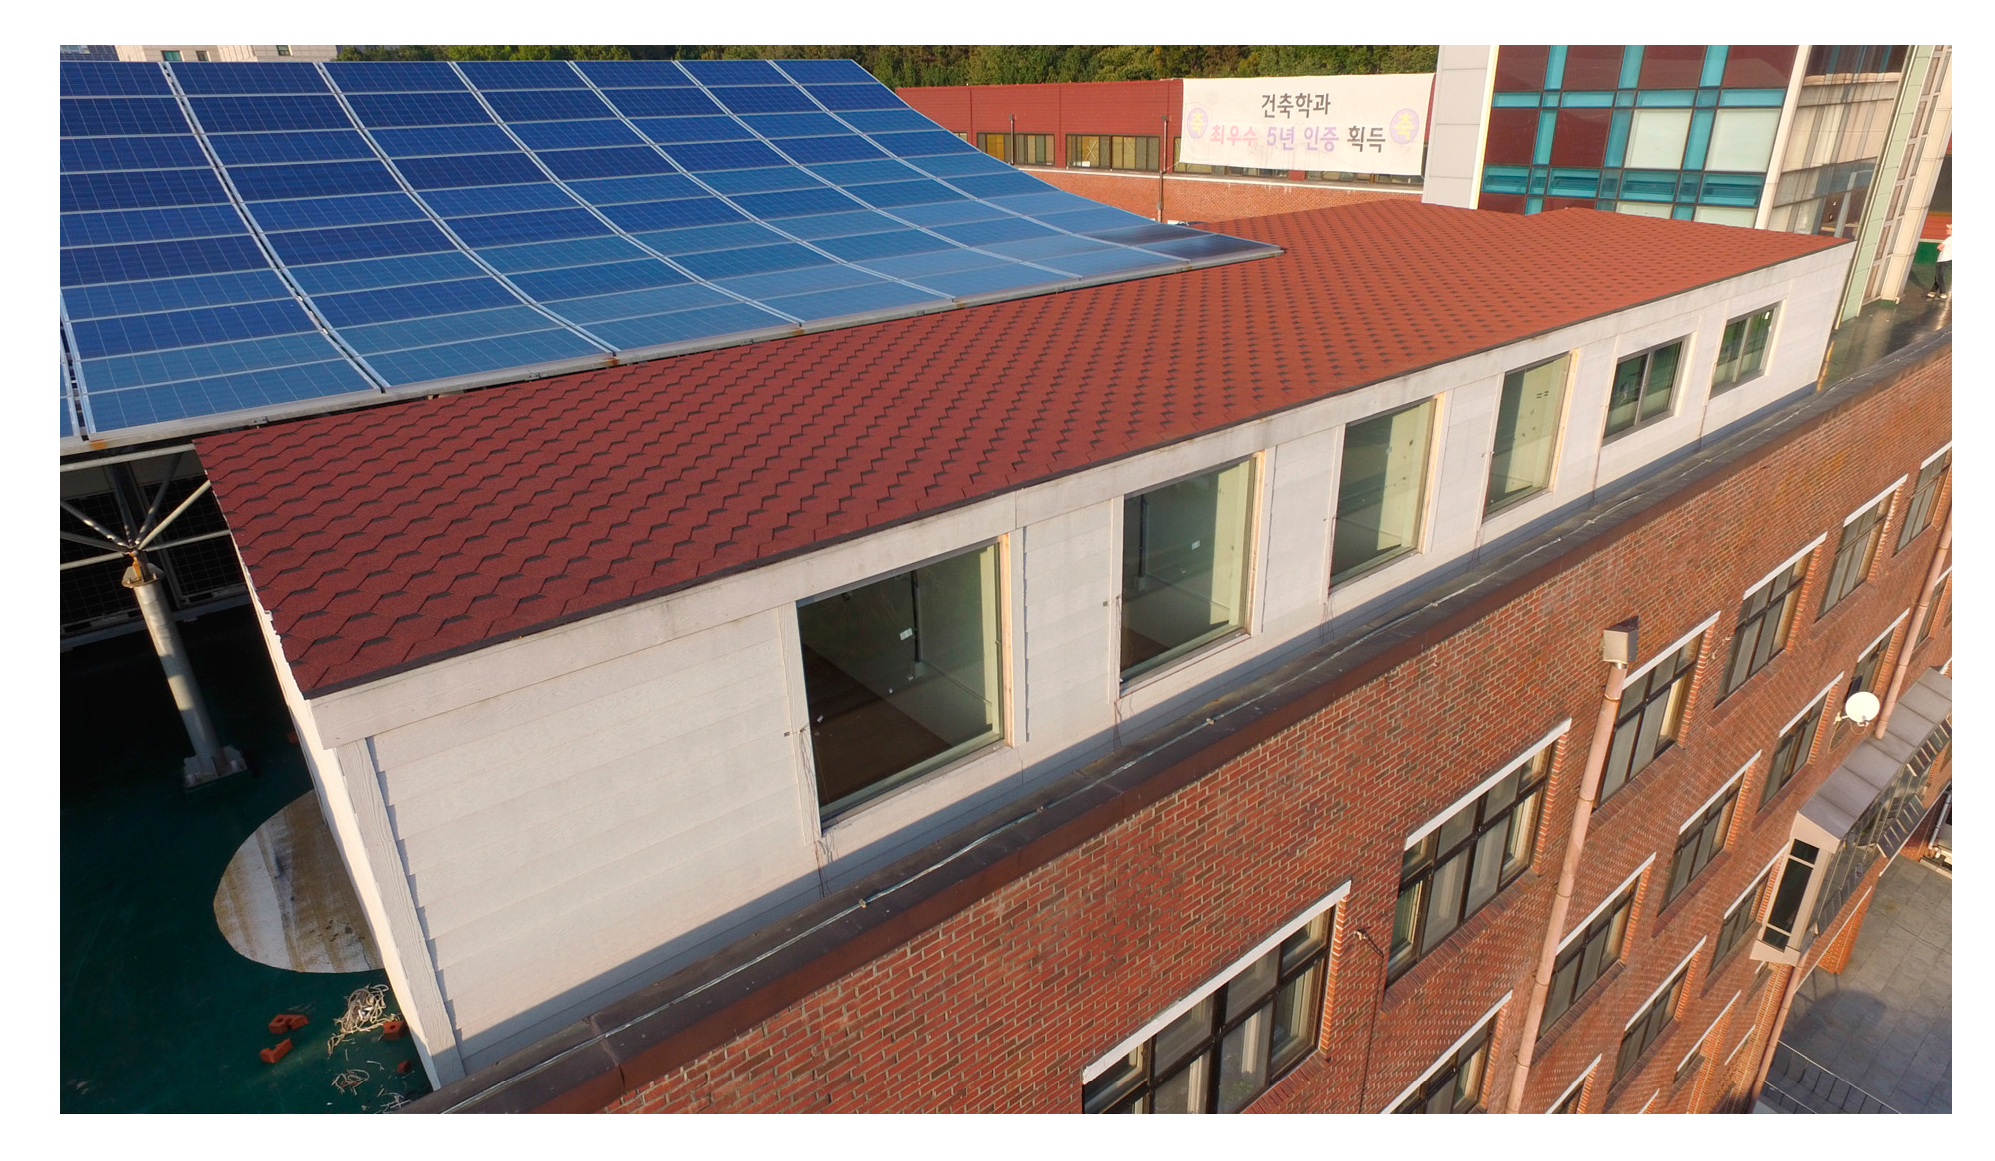
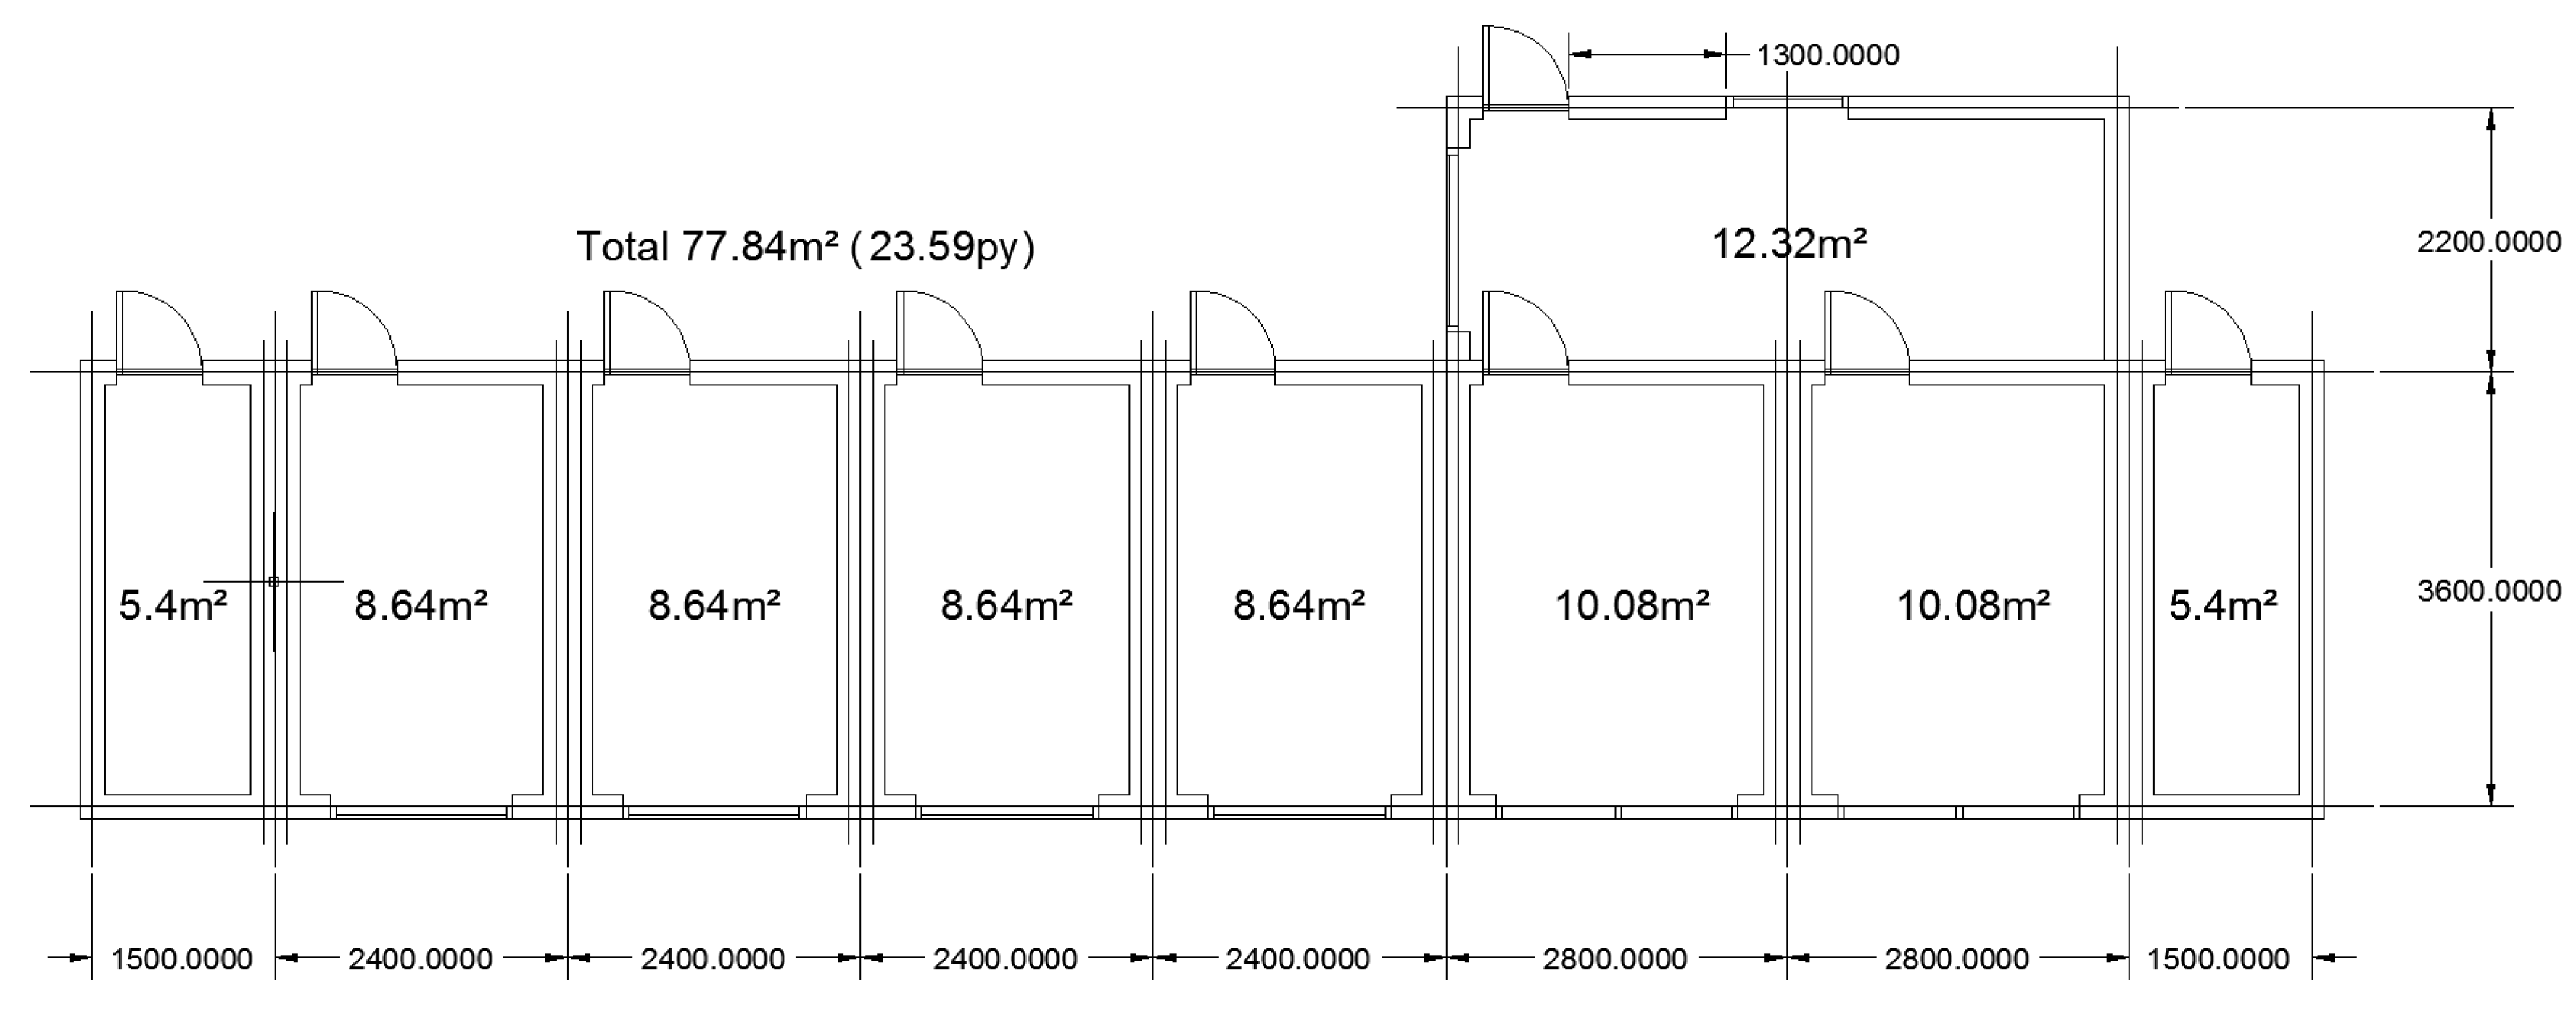
Figure 8 shows the mock-up chamber implemented in the simulation program.
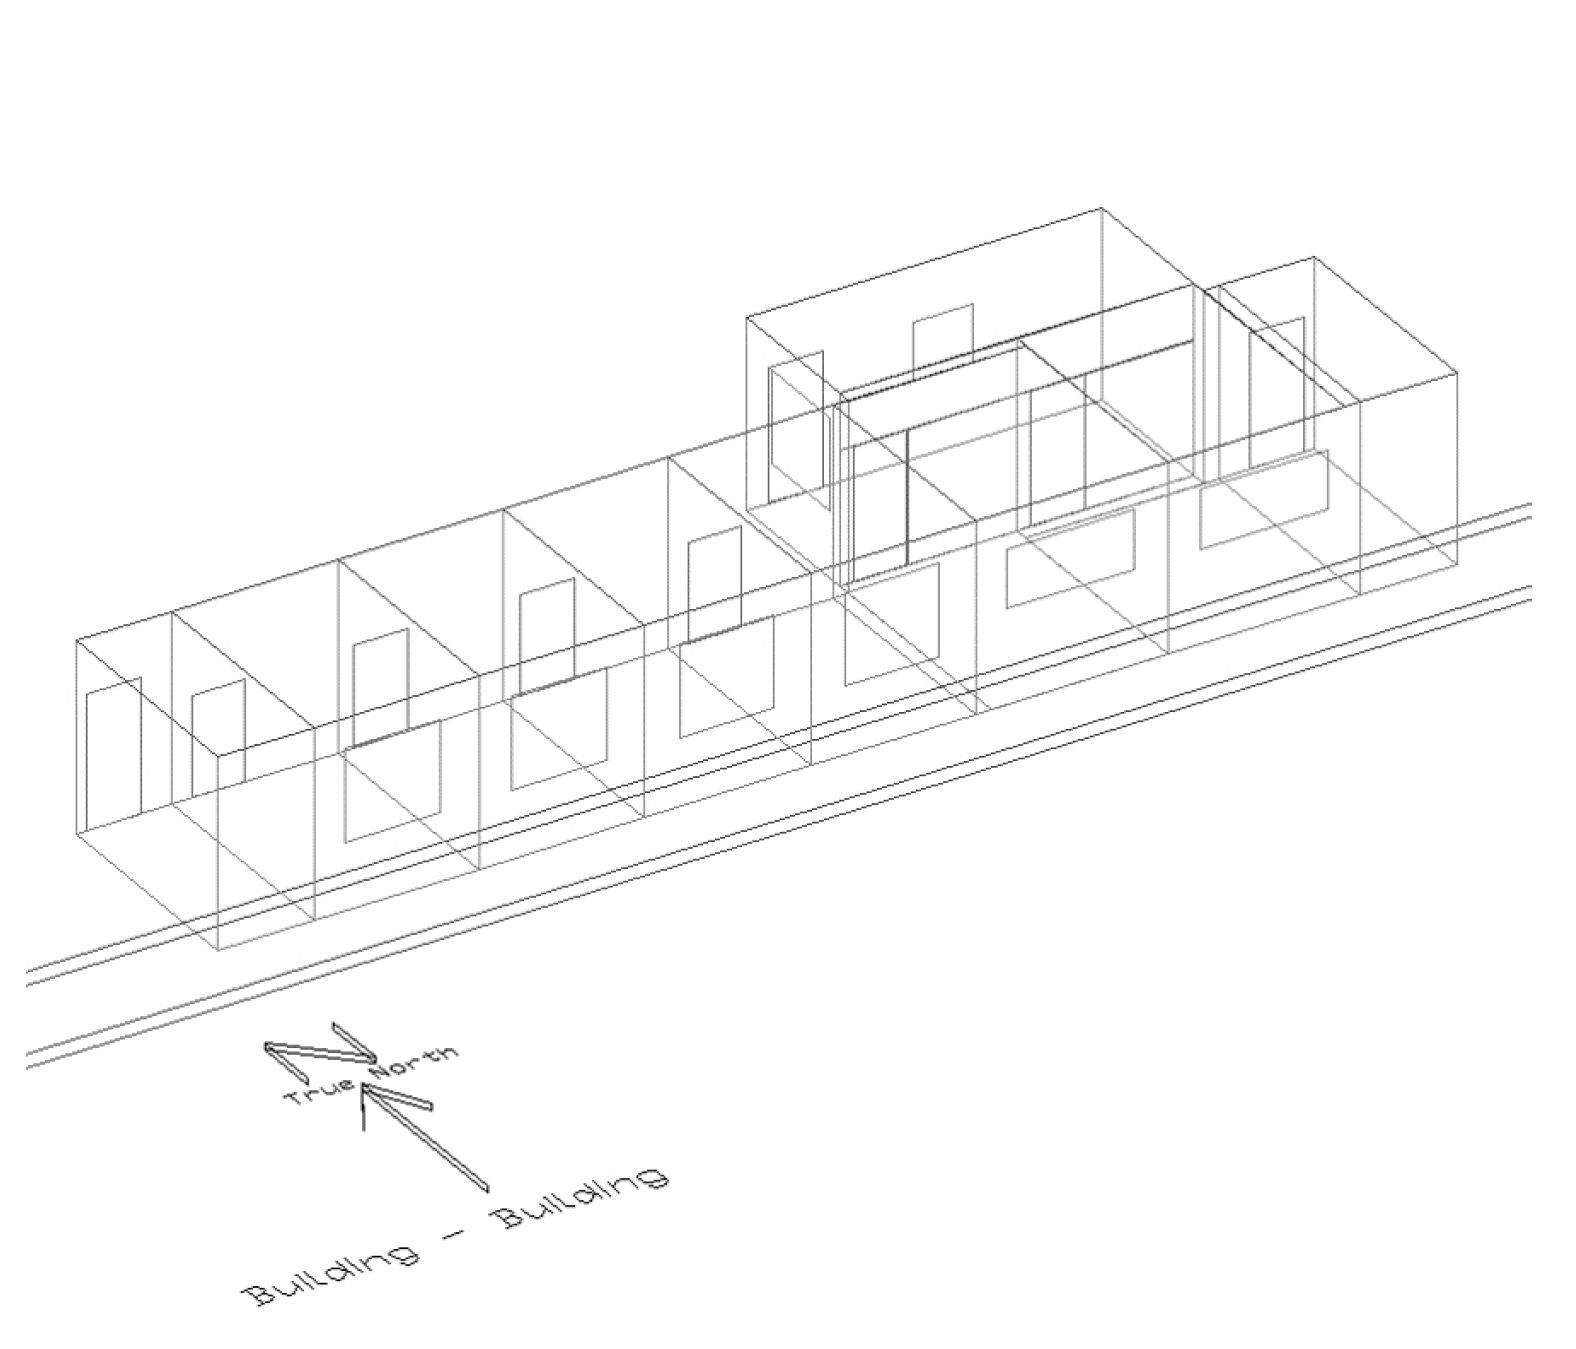
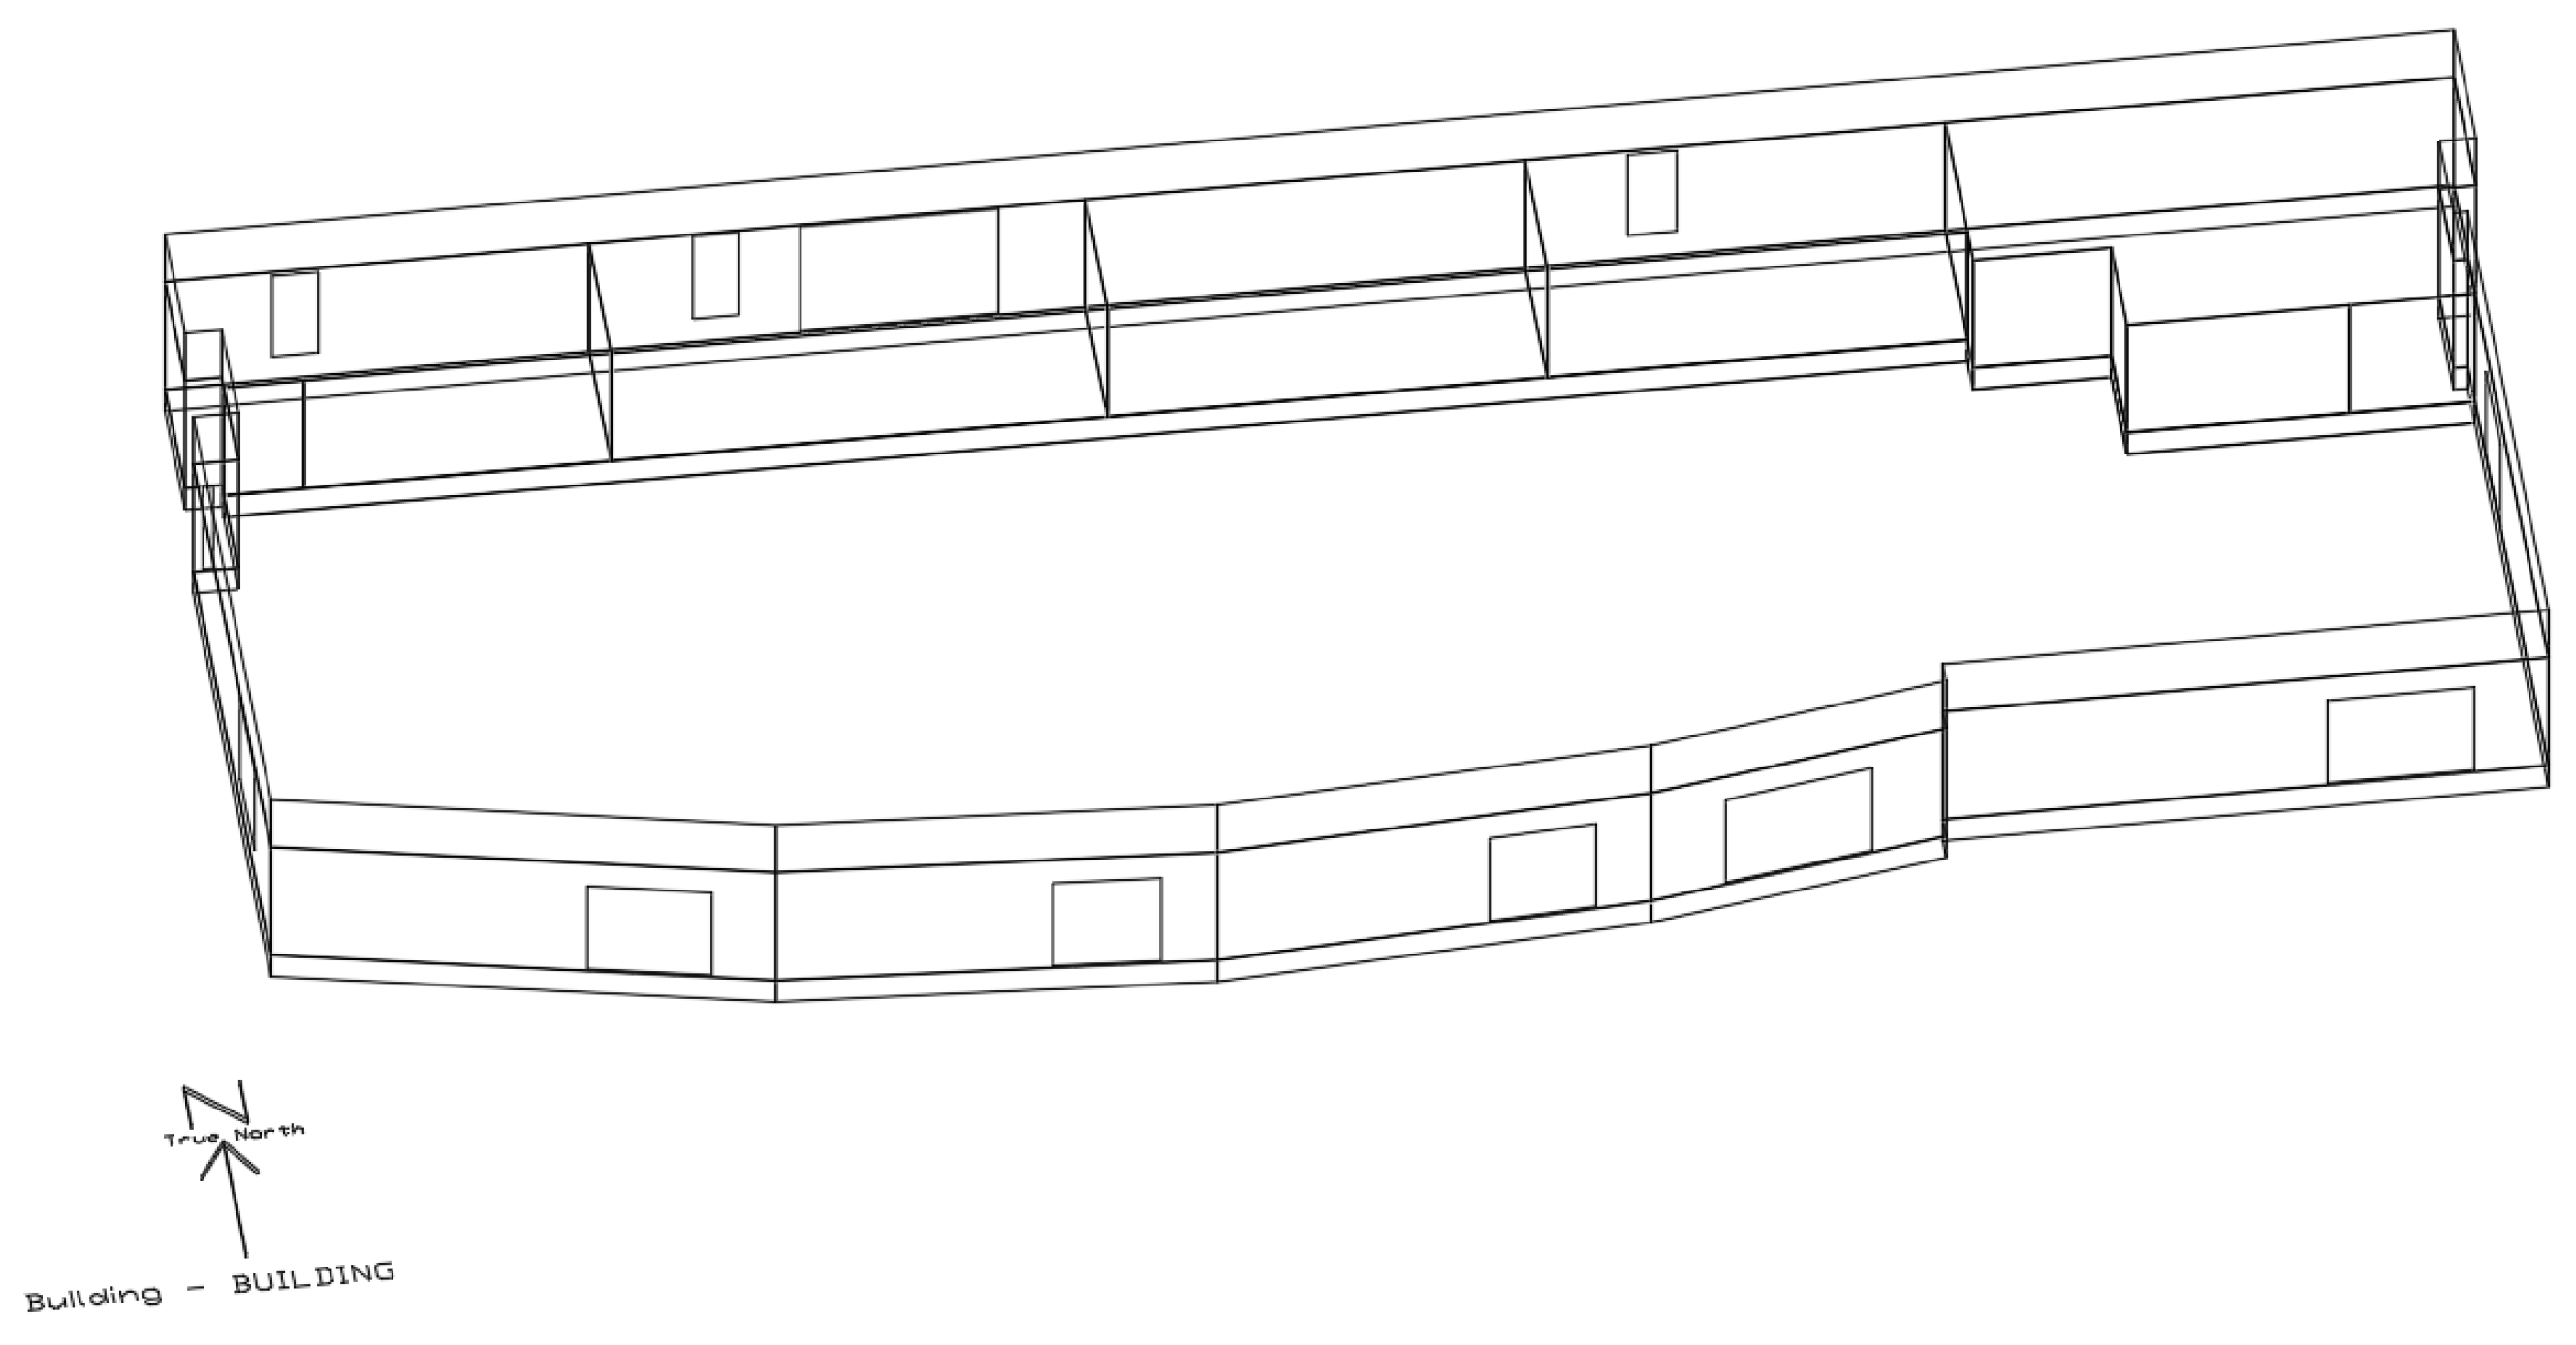
Figure 9 and
Figure 10 show the office and residential building models. The total energy consumption of the office buildings from September 2011 to August 2012 was 5566 MWh and, thus, 261.8 kWh/m
2·year. This is 1.3% lower than 265.1 kWh/m
2·year, which is the basic unit of office buildings in the Energy Consumption Survey [
16] issued by the Korea Energy Economics Institute during the year.
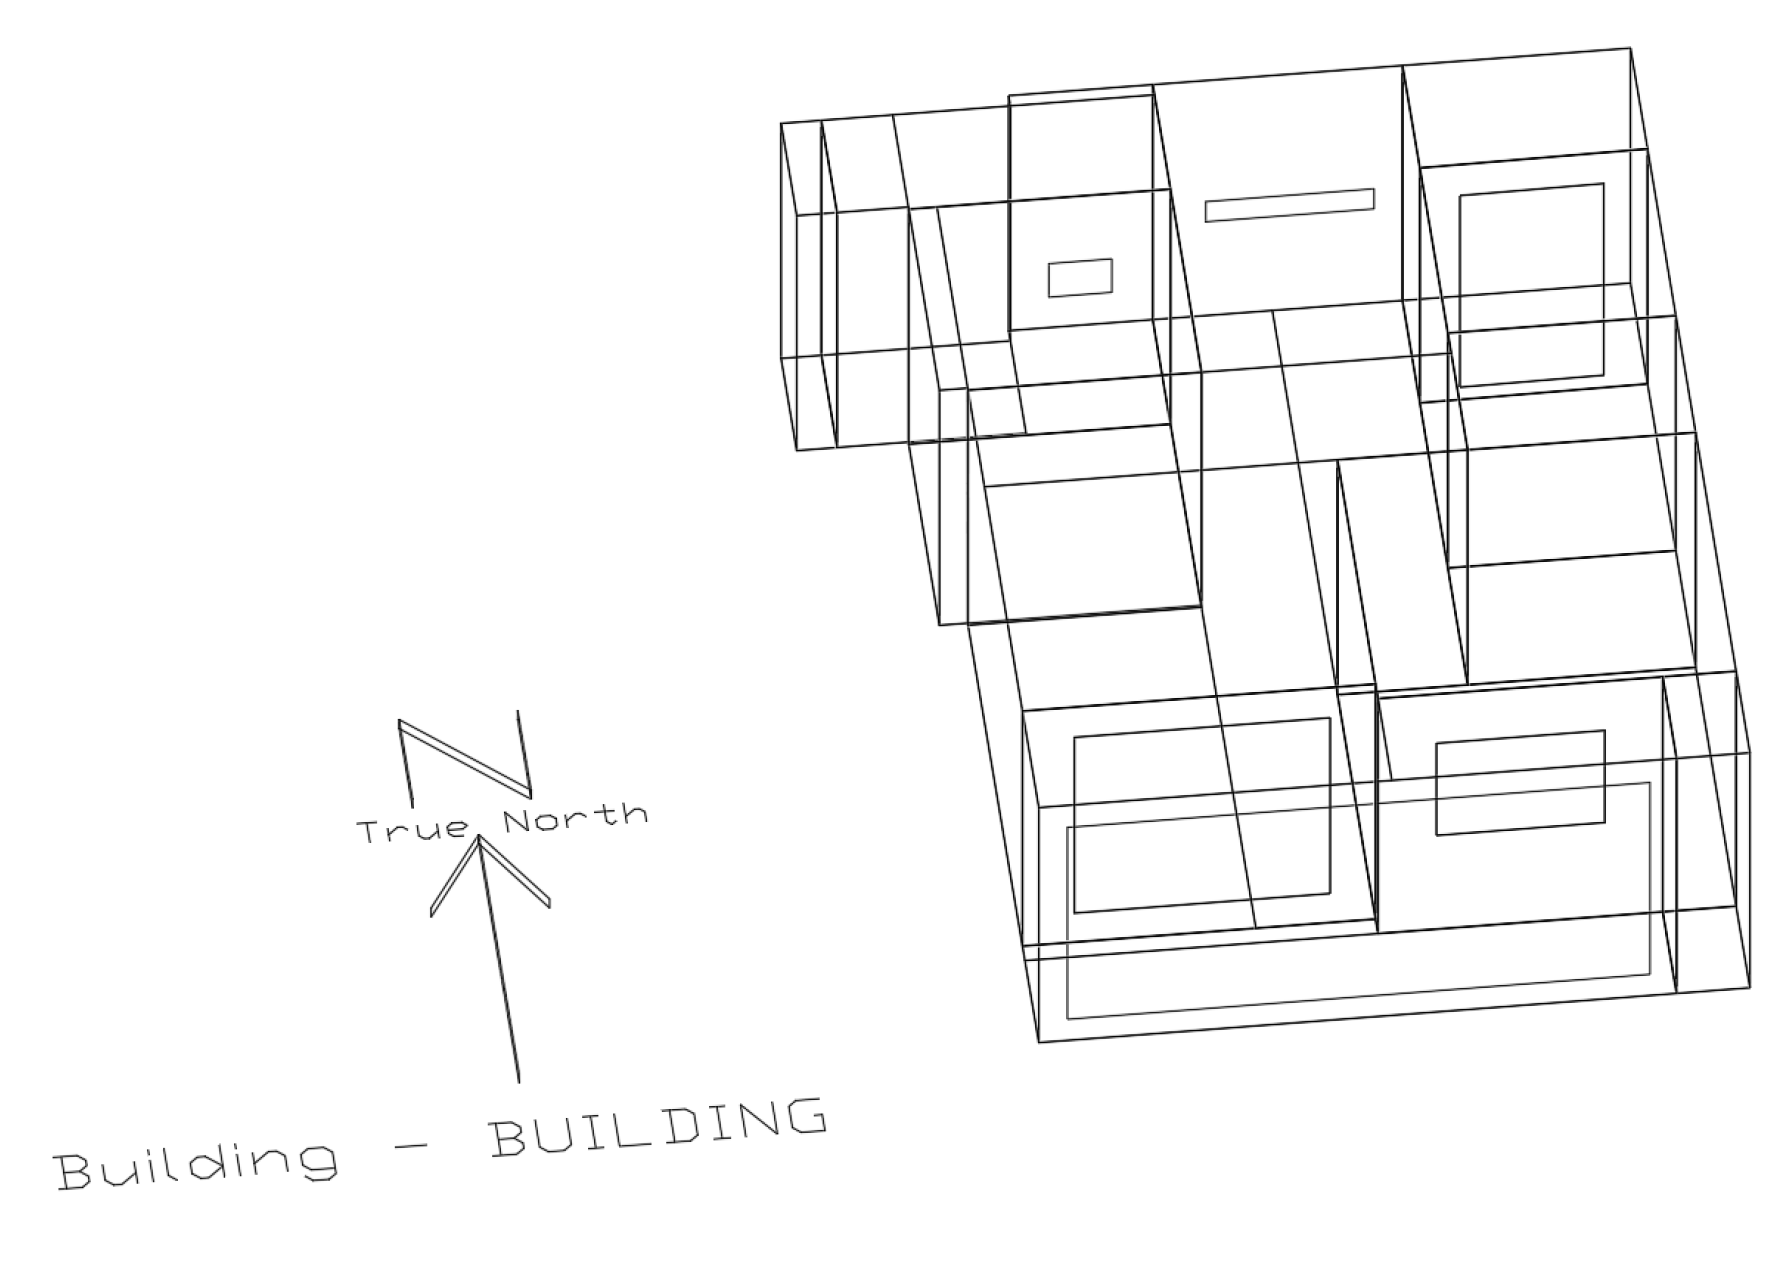
When it comes to residential buildings for a performance assessment, this study selected the apartment house which showed the highest proportion (approximately 48.1%) of the housing type according to a survey conducted by the National Statistical Office from 2006 to 2016 [
17].
The heating energy consumptions of the selected apartment for simulation and the Energy consumption survey [
16] were 199.3 kWh/m
2·year measured in 2008–2009 and 193.1 kWh/m
2∙year, respectively, which show a 3% difference between them. Therefore, the simulation model is considered representative of residential apartment buildings in Korea.
This study analyzed only the reference floor of the simulation model. The boundary conditions of the ceiling and floor were set as adiabatic, assuming that the upper and lower floors were operated at the same temperature and according to the same schedule.
Table 4 lists the input variables for office and residential buildings. Each input variable was entered based on the drawing.
The standard weather data used in the simulation is an IWEC (International Weather for Energy Calculations) in Inchon, South Korea. Korea is located at latitude between 33 and 43 °N, with a mild climate and monthly characteristics of the weather are shown in
Table 5.
3.2. Simulation Result
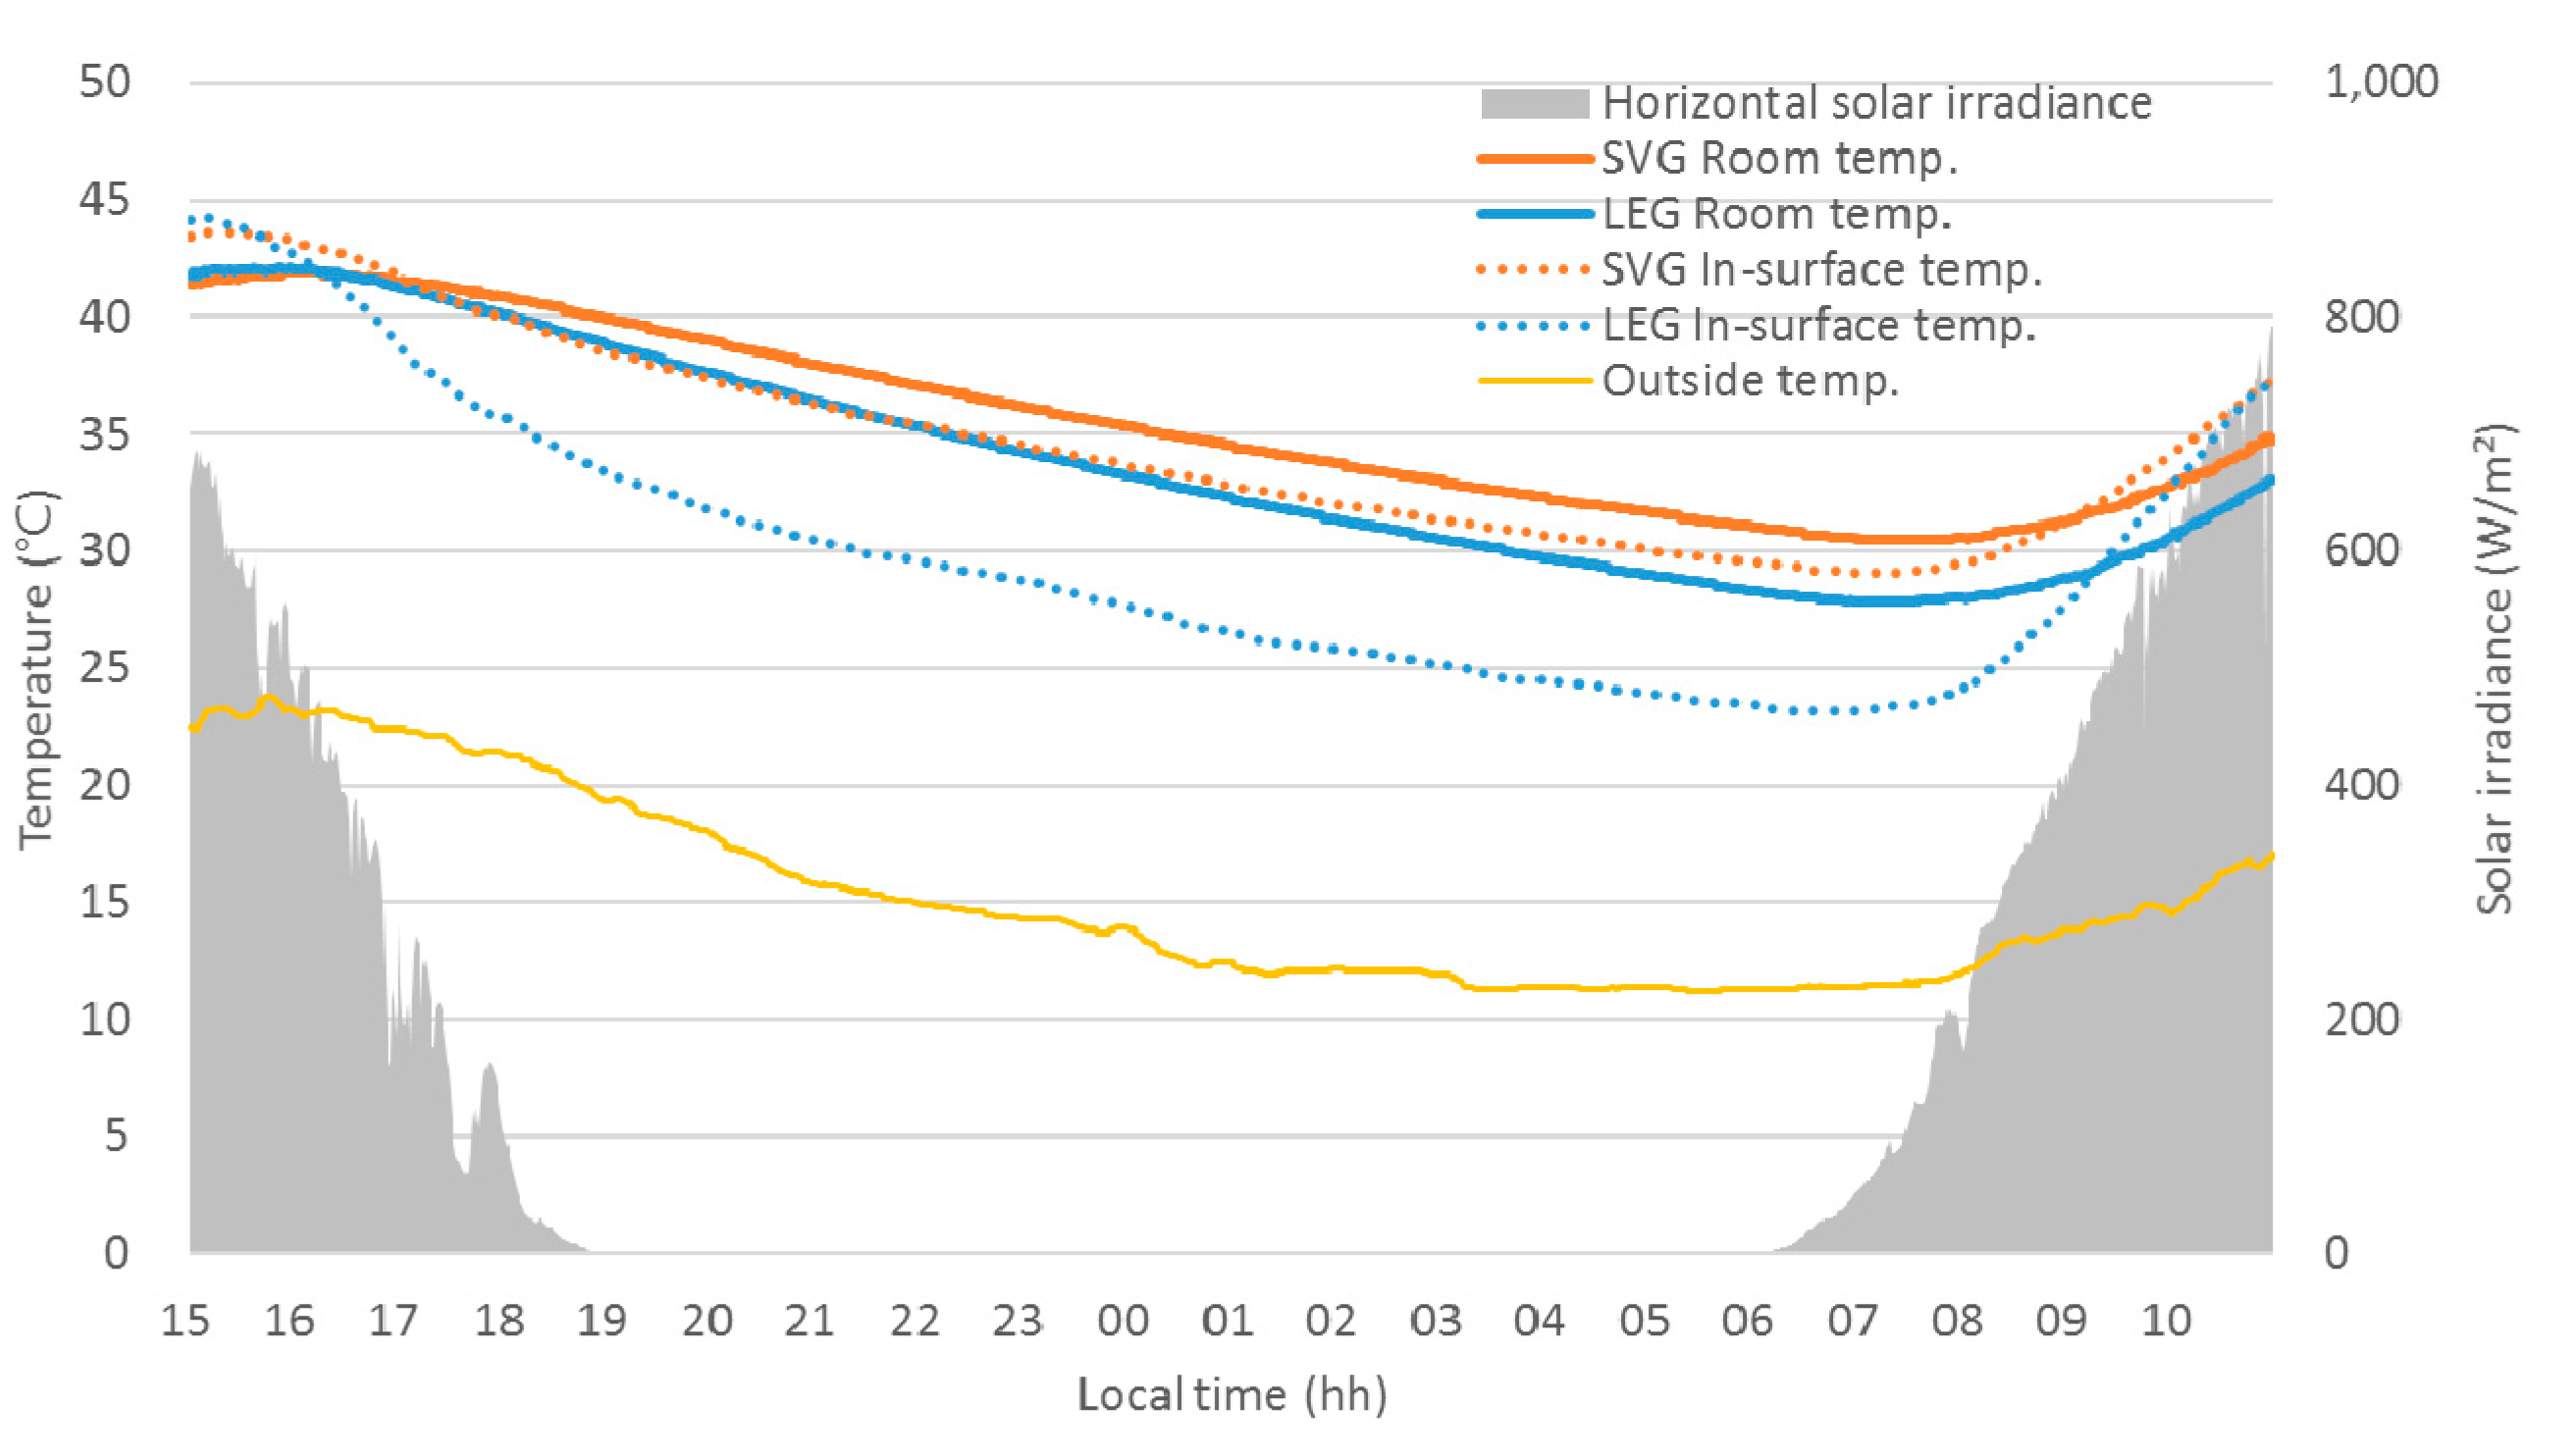
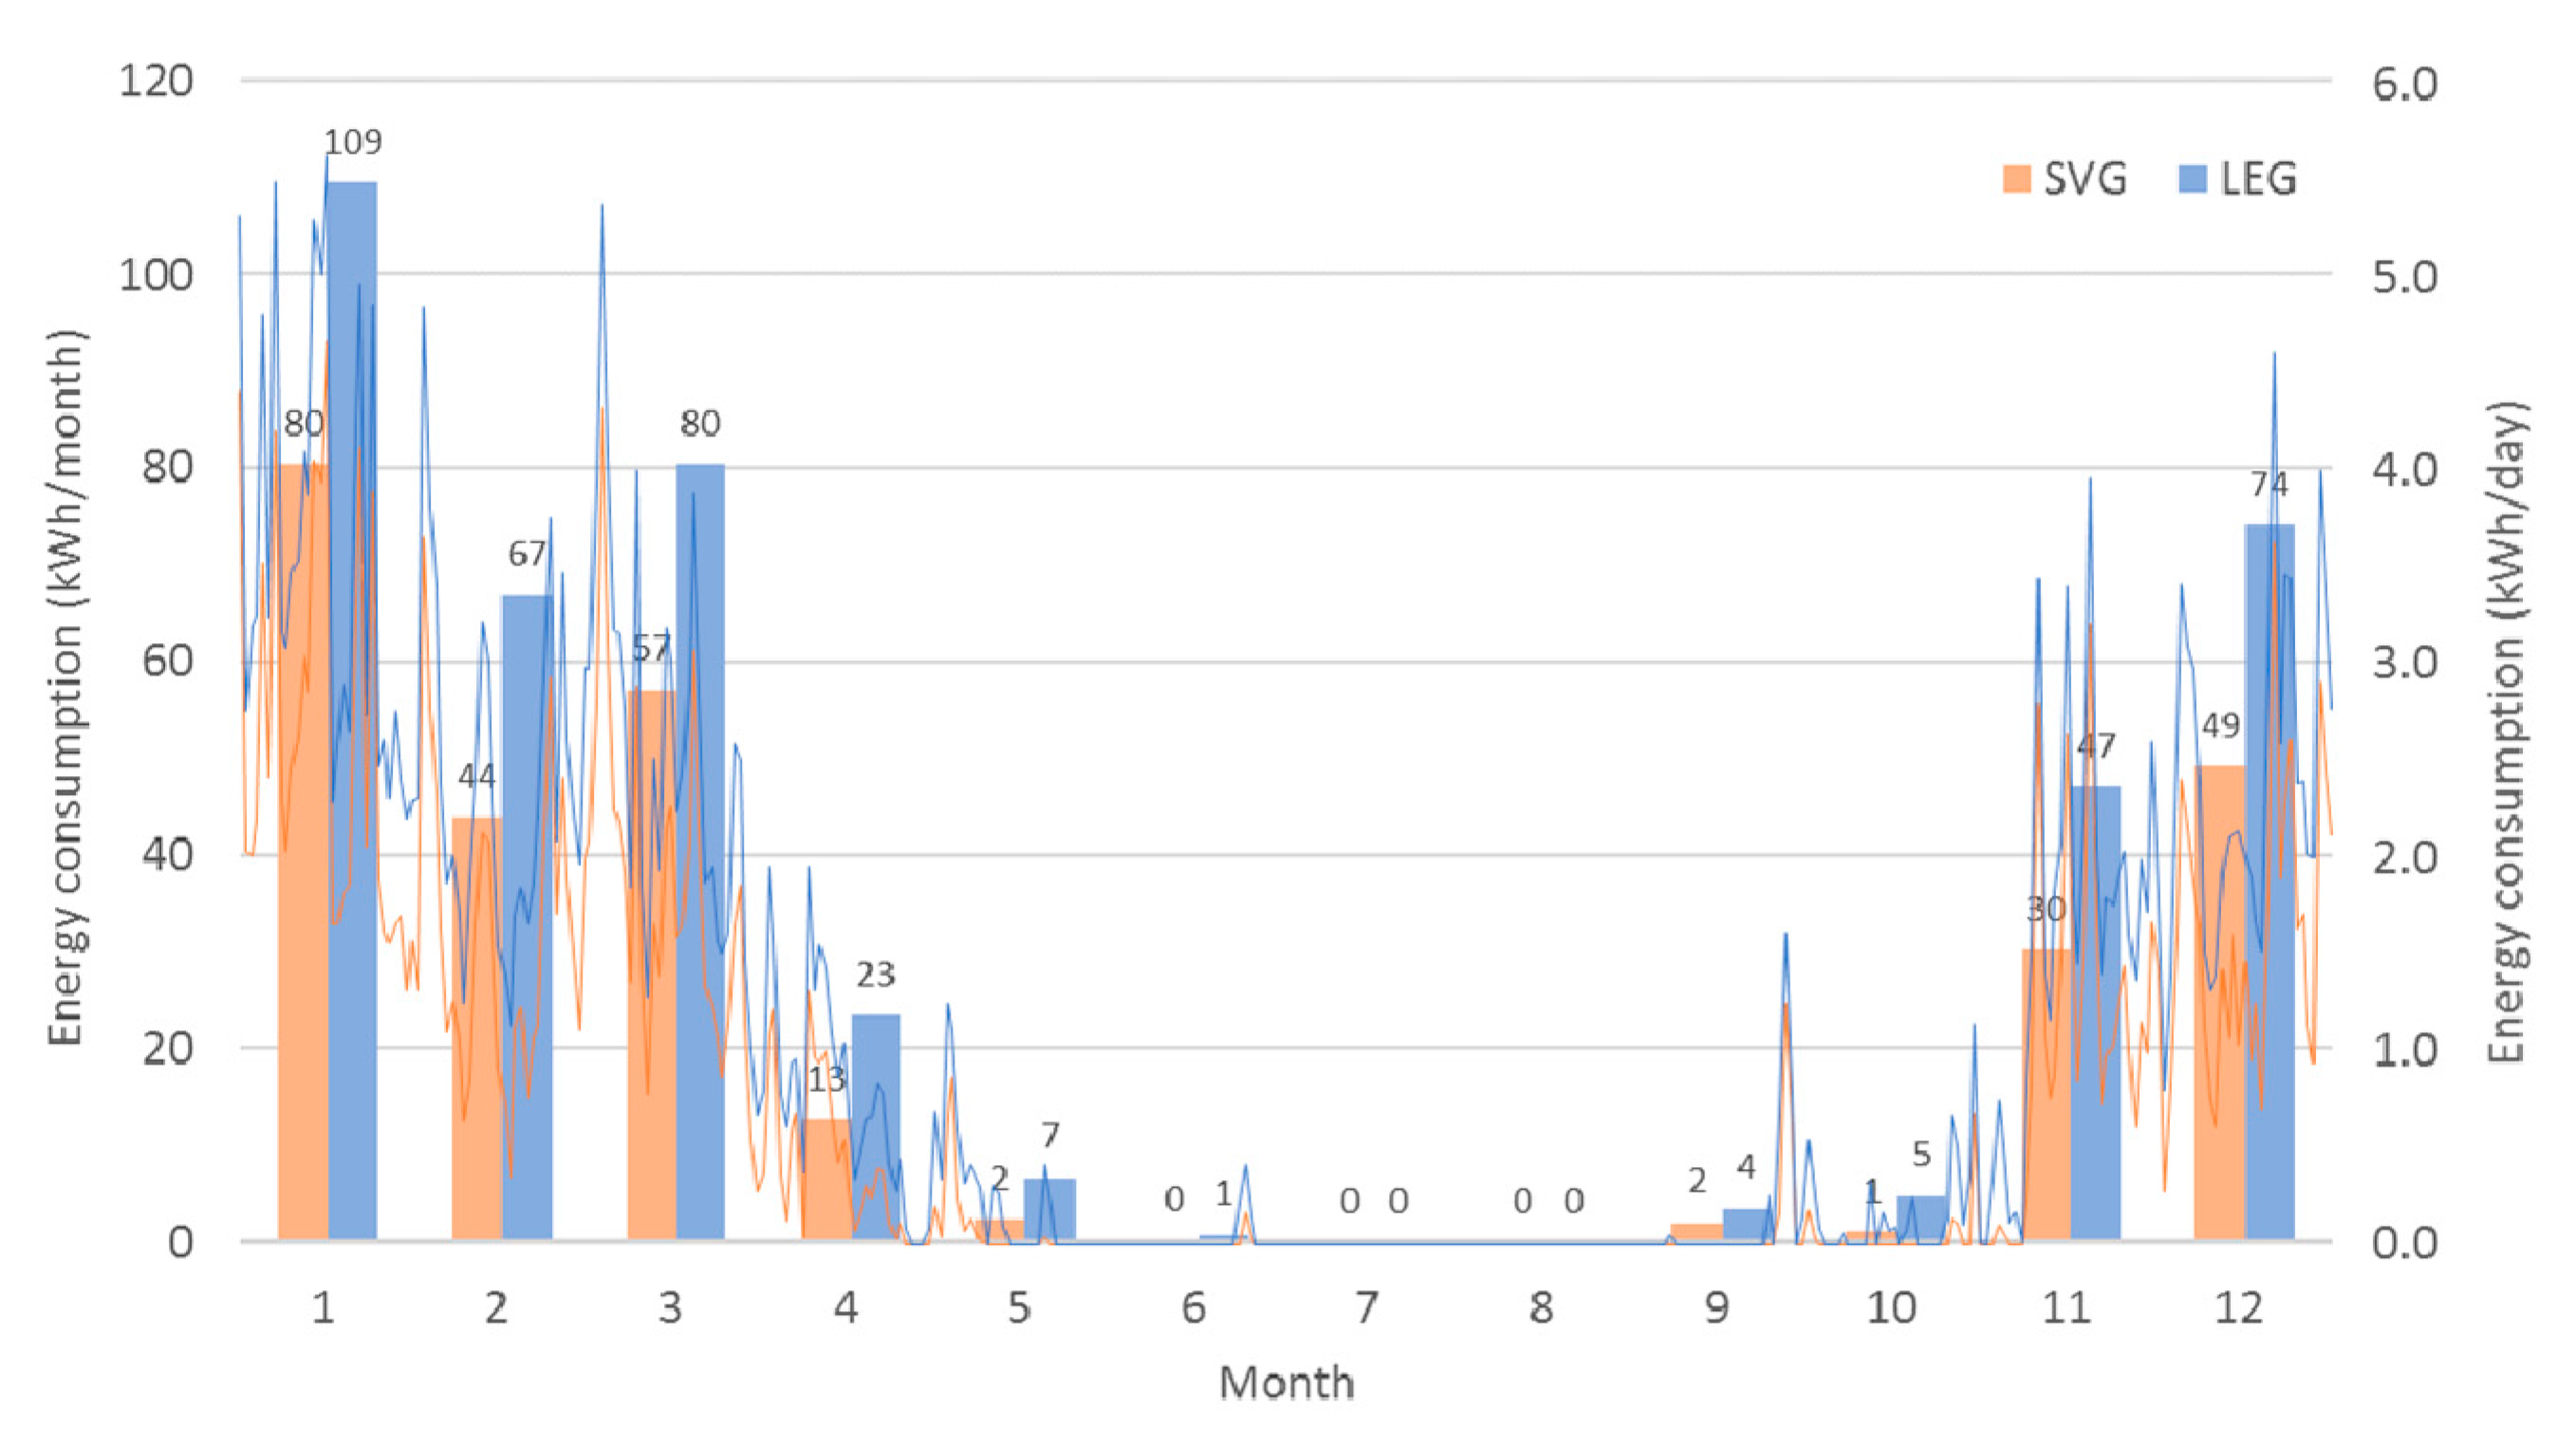
Figure 11 presents the monthly heating energy consumption of mock-up chambers, where SVG and LEG were applied. In winter, the energy saving rates of SVG compared to LEG were 27%, 34%, and 34% in January, February, and December, respectively. The annual heating energy demands were 279 and 417 kWh for SVG and LEG, respectively; SVG had an annual energy saving rate of 33.1% compared to LEG.
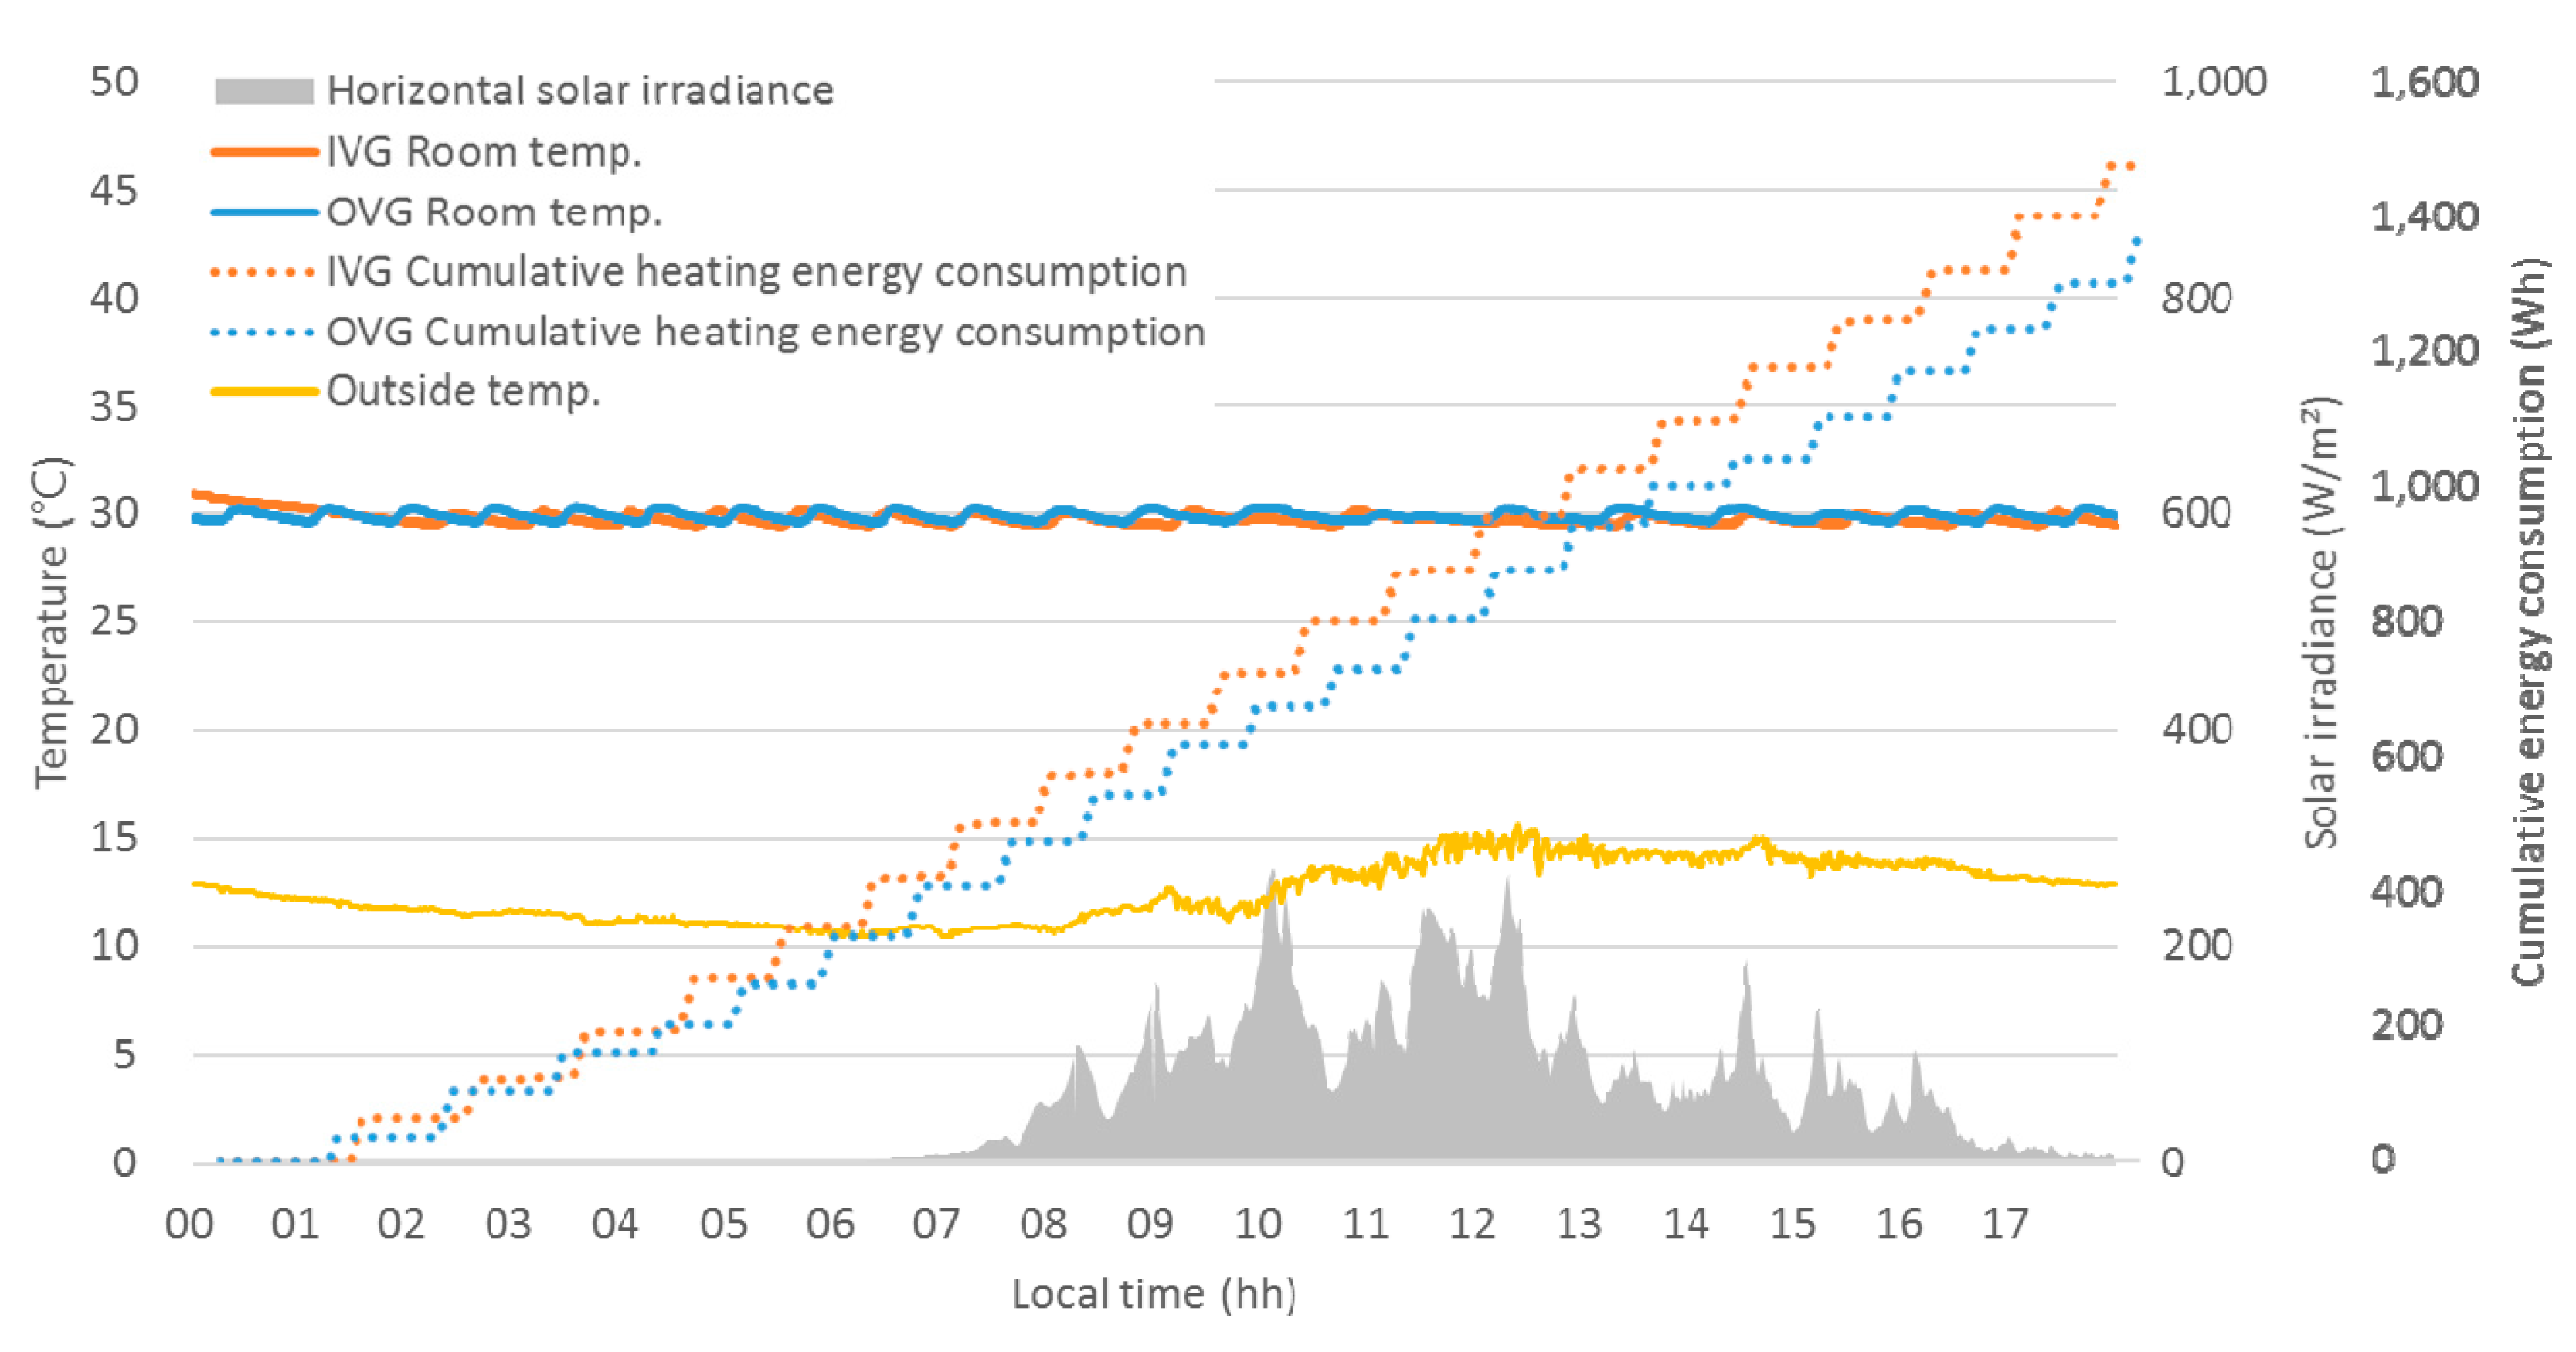
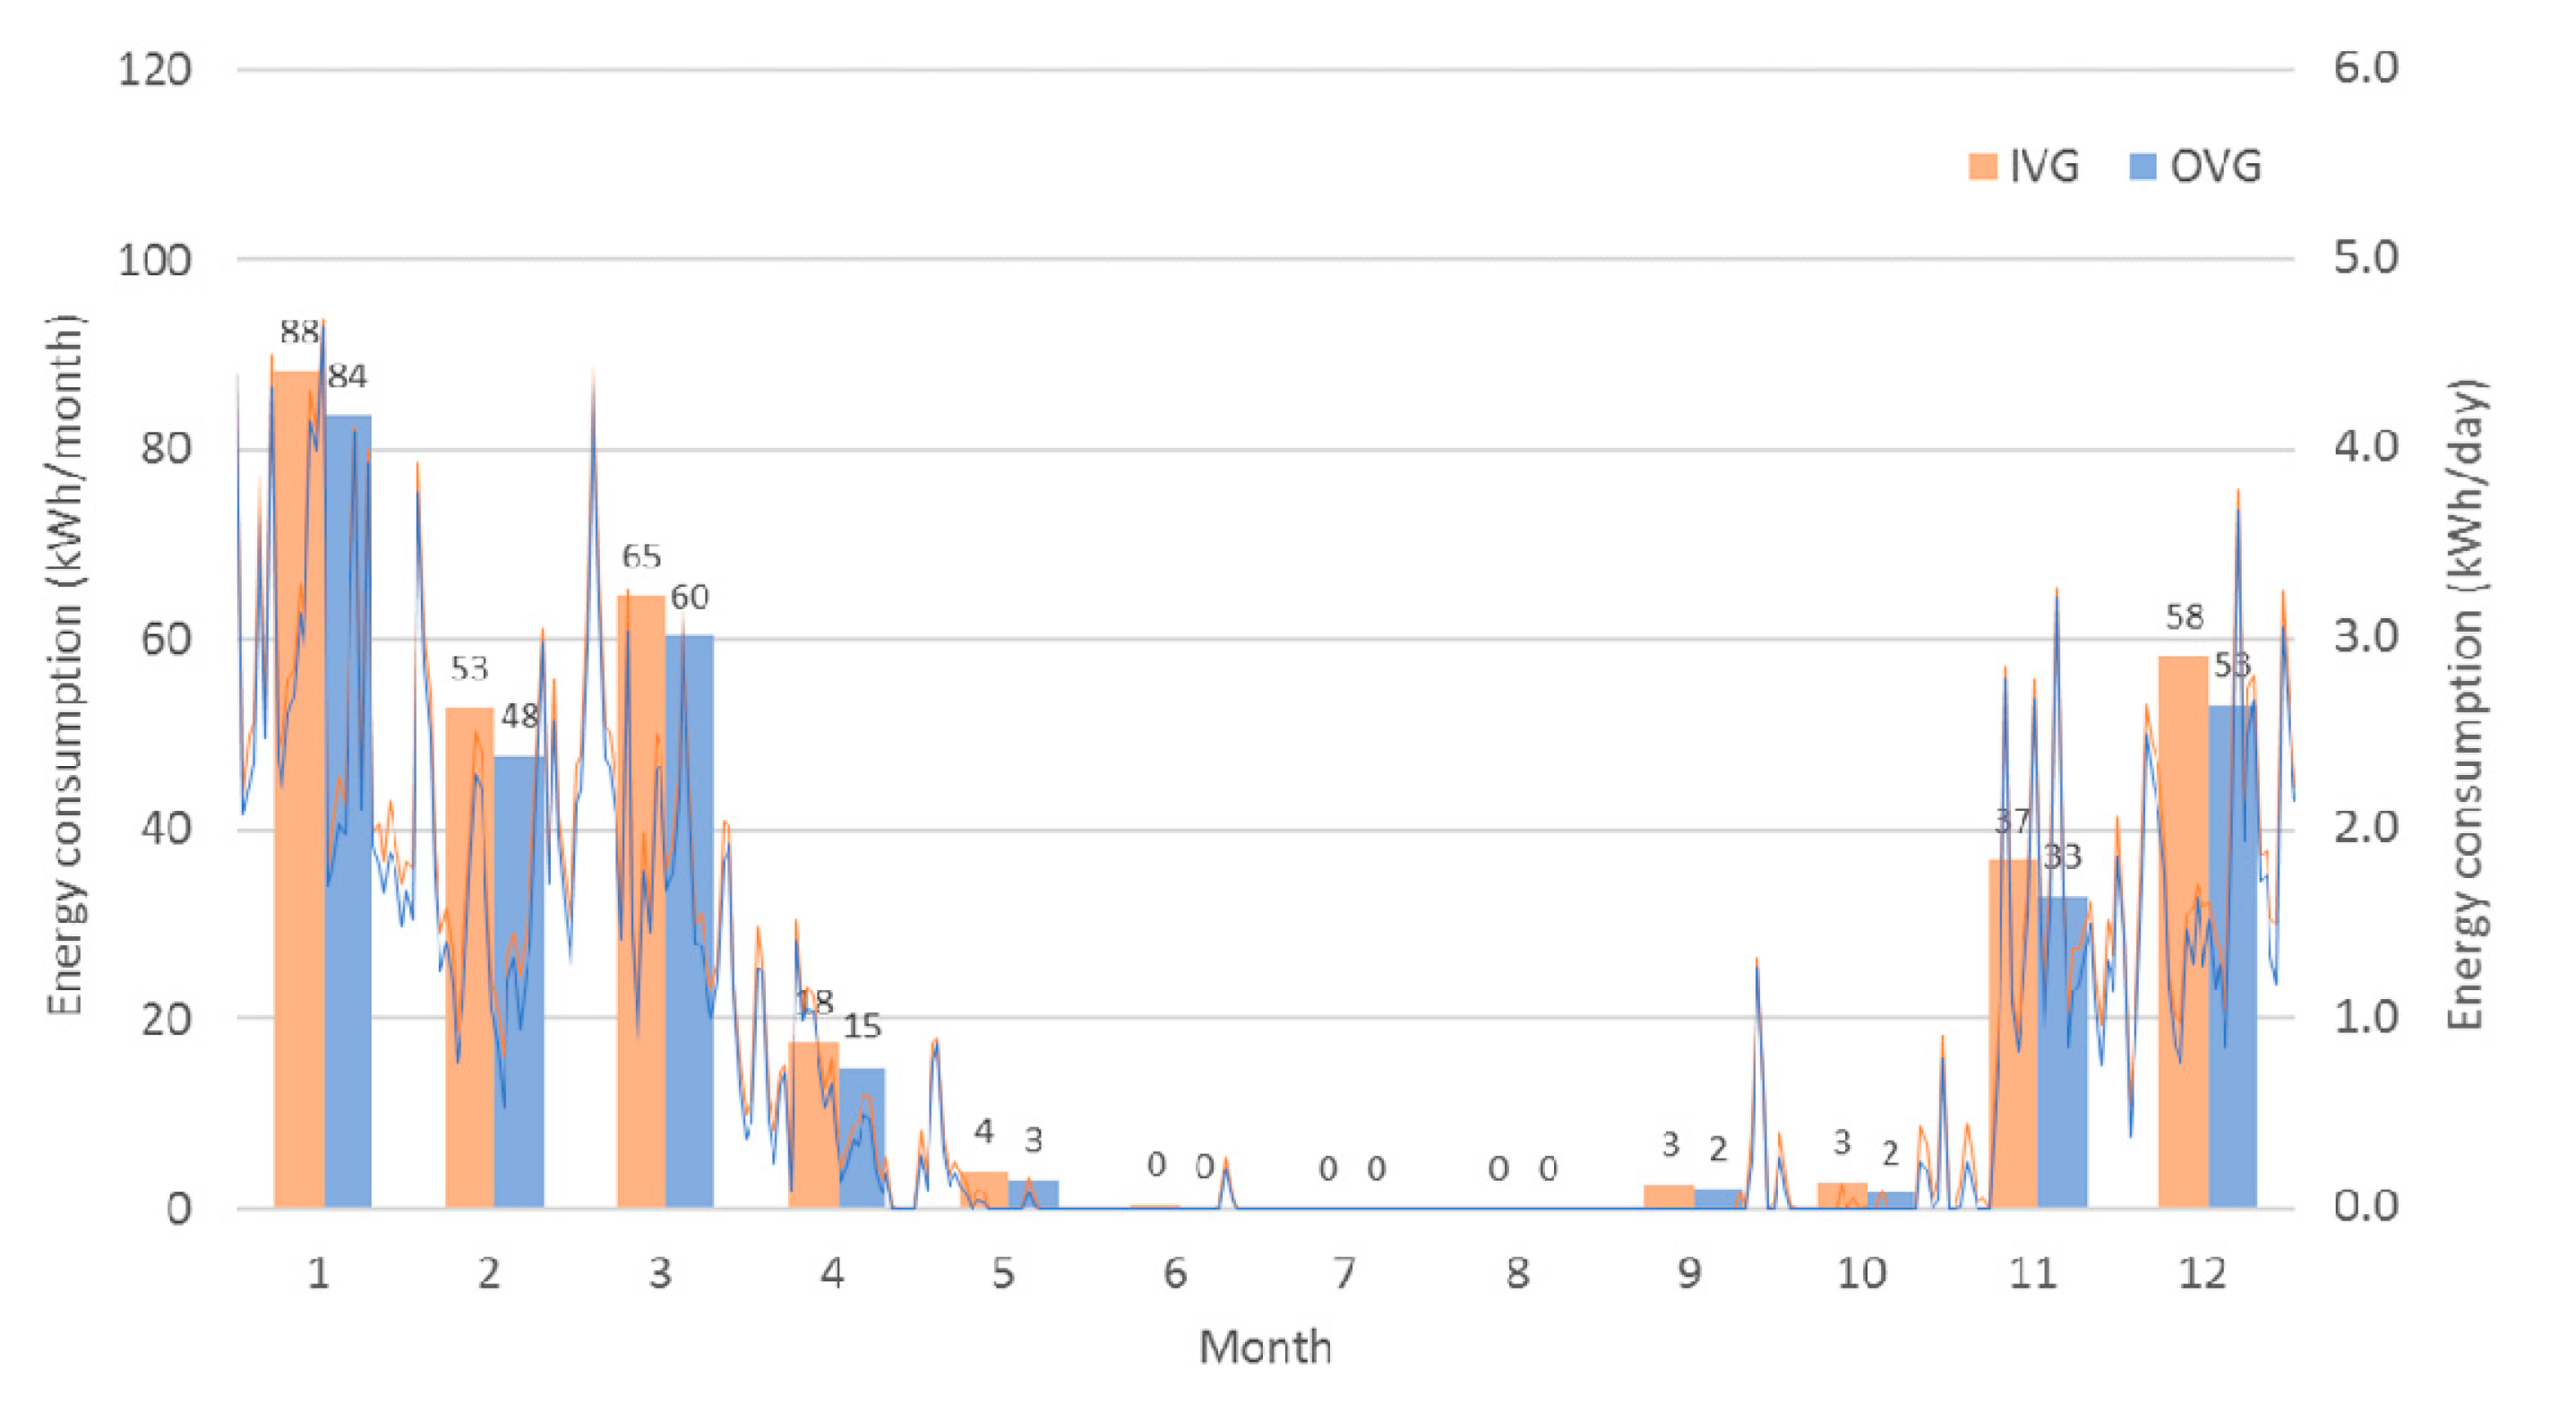
Figure 12 presents the monthly heating energy requirements of the mock-up chamber with OVG and IVG. In January, February, and December corresponding to the winter season, the application of OVG resulted in energy savings of 5%, 10%, and 9%, respectively, compared to IVG. The annual heating energy consumption was 299 and 327 kWh for OVG and LEG, respectively; OVG showed an annual energy saving rate of 8.5% compared to IVG.
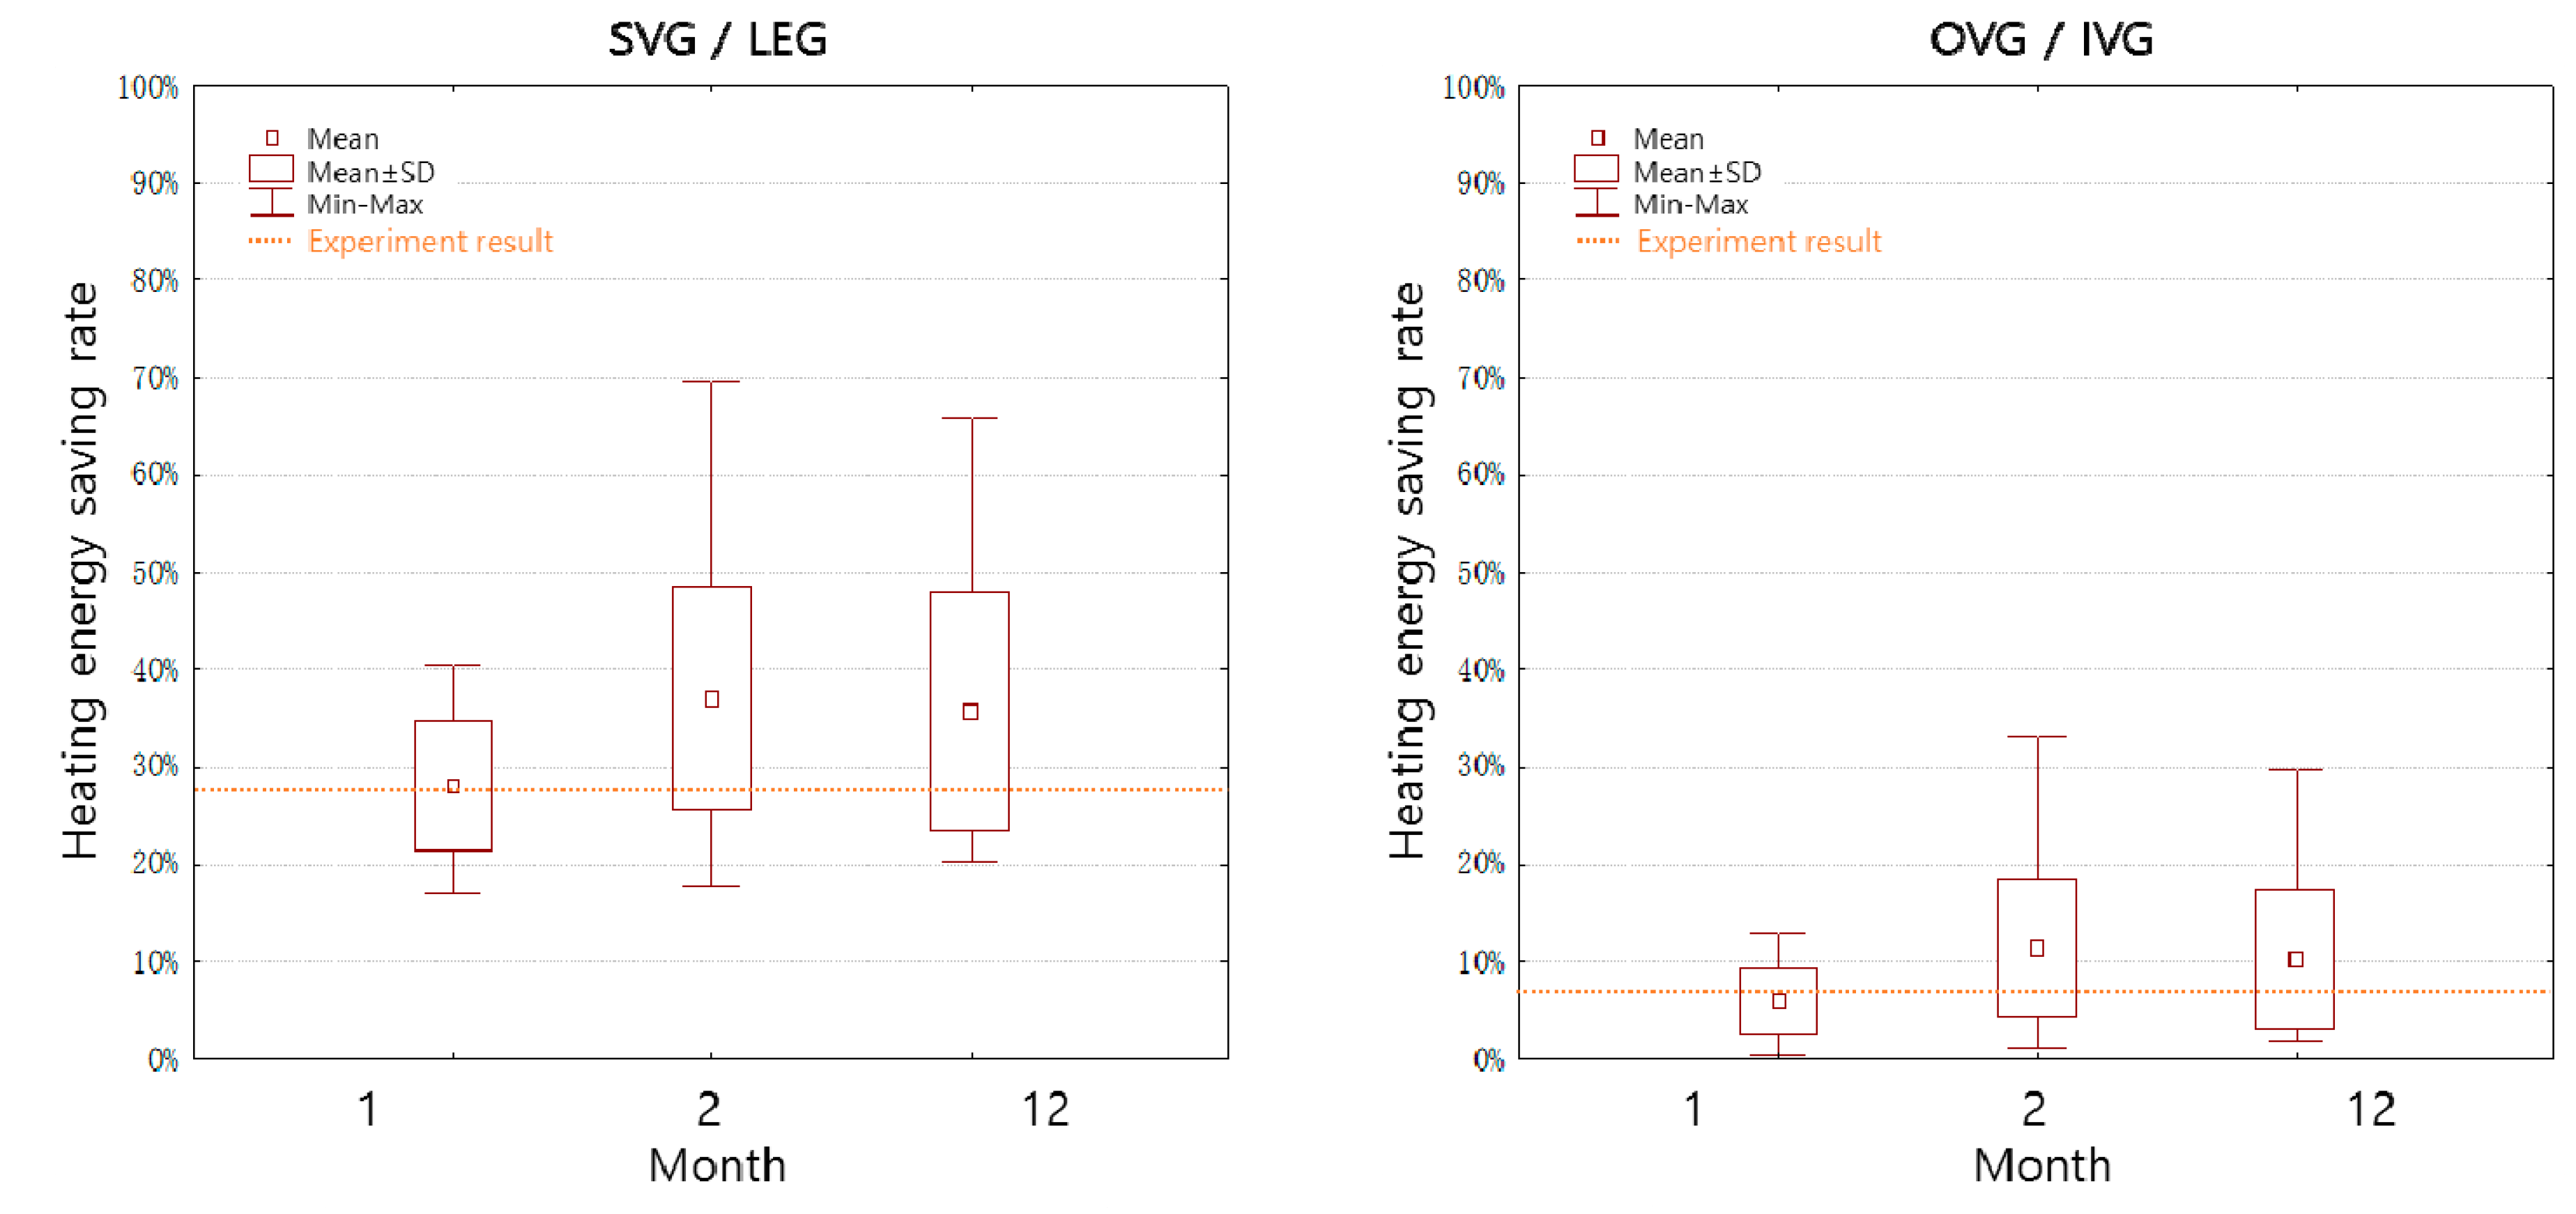
Figure 13 compares the heating energy saving rates in January, November, and December with the heating energy savings obtained from the experimental results. The experimental results were all within the standard deviation of the simulation. Therefore, the spectral data of the glazing types entered in the simulation were considered to simulate the actual product and applied to office and residential buildings for comparative analysis.
Figure 14 shows the annual cooling and heating energy consumption of the office buildings according to the simulation. Generally, as the insulation performance of glazing increases, the cooling energy consumption also increases.
On the other hand, in the case of IVG and OVG, which is composed of a multi-layer structure with three sheets of glazing, the cooling energy consumption did not increase significantly because the SHGC was reduced by the multi-layer structure.
Compared to the cooling energy consumption in the case of LEG, the cooling energy consumption was increased by 2%, 6%, and 4% for IVG, SVG, and OVG, respectively. On the other hand, heating energy consumption was reduced by 11%, 15%, and 13% for IVG, SVG, and OVG, respectively, compared to the value for LEG. In the total energy consumption for cooling and heating, IVG showed the highest saving rate of 3.6% compared to LEG, followed by OVG with 3.3% and SVG with 2.7%.
An analysis of the position of the vacuum layer showed that it is advantageous for saving energy to place the vacuum layer on the indoor side in an office building. This is because IVG has a similar U-value to OVG, but a relatively lower SHGC.
As a result, in office buildings, where the proportion of cooling and heating requirements are similar, the high thermal insulation function of vacuum glazing does not show a significant energy saving effect because it has different effects on the energy consumption in summer and winter.
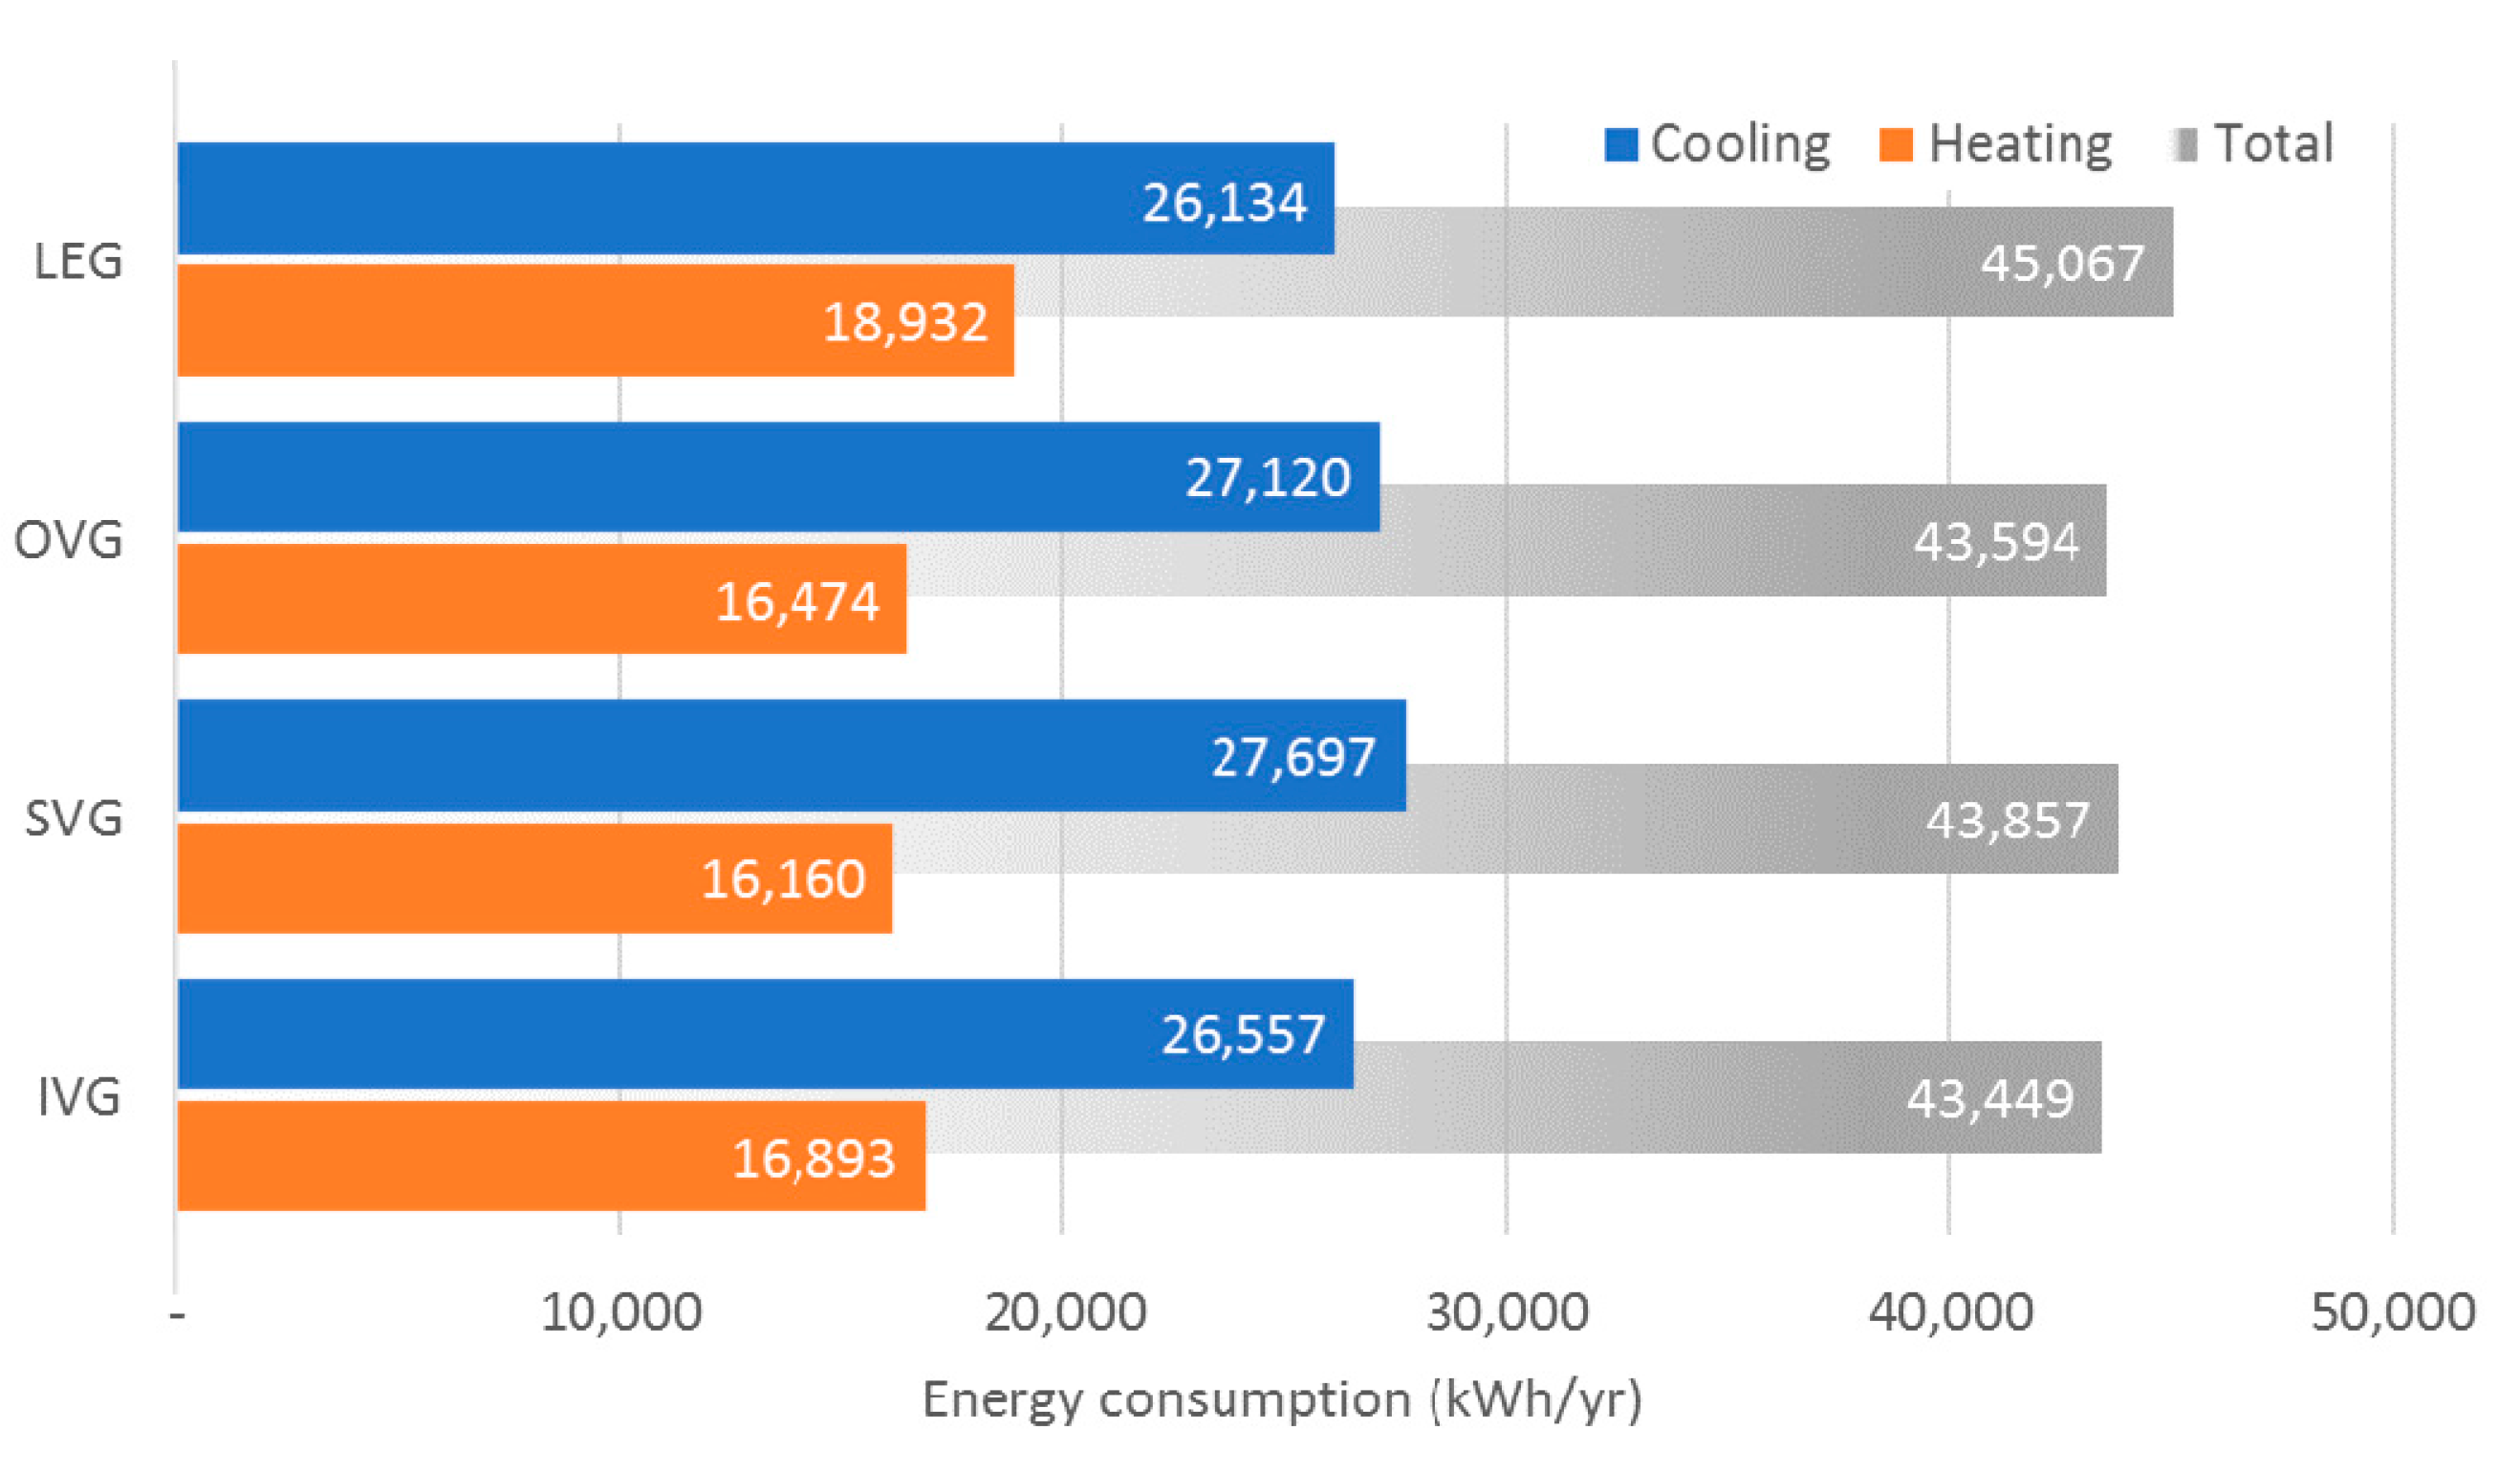
Figure 15 shows the annual cooling and heating energy consumption of residential buildings analyzed by simulations. IVG, SVG, and OVG showed 10%, 30%, and 20% higher cooling energy consumption, respectively, than LEG. On the other hand, the heating energy consumption of IVG, SVG, and OVG was reduced by 17%, 24%, and 21%, respectively, compared to LEG.
Although the increase rate of cooling energy consumption is similar to the reduction rate of heating energy consumption, heating energy consumption accounts for approximately 72% of the total energy consumption in residential buildings. Therefore, OVG, SVG, and IVG showed a 12.2%, 12.2%, and 11.4% lower total energy consumption, respectively, than LEG because of the total energy consumption of residential buildings with a high proportion of heating energy.
A comparison of the energy saving performance according to the position of the vacuum layer in the residential building showed that it is advantageous to place the vacuum layer on the outdoor side. This is because in residential buildings with a high heating energy consumption, it is advantageous to install glazing with a high SHGC to collect solar radiation in winter.
In particular, when SVG is applied, the annual cooling/heating energy consumption was calculated to be 3796 kWh, which was the same as in the case of applying OVG. SVG has a higher U-value than IVG or OVG, but a high SHGC, which is advantageous during winter.
As a result, it is important to maintain a high SHGC and a low U-value in residential buildings with a large heating demand ratio.
The commercial and residential buildings used in the simulations maintain a U-value at the time of construction, so they do not clearly indicate the thermal properties of vacuum glazing according to the continuously strengthened insulation standards. Therefore, the energy consumption was estimated according to the change in the U-value of the building envelope.
Figure 16 and
Table 6 present an estimation of the energy consumption of an office building according to the change in U-value. In office buildings, which are used mainly during the daytime and have high cooling energy consumption, installing the IVG with a low SHGC results in the highest energy saving rate when the U-value of the building envelope is low. In particular, as the U-value of building envelope is lowered, the energy savings rate due to IVG application is also higher.
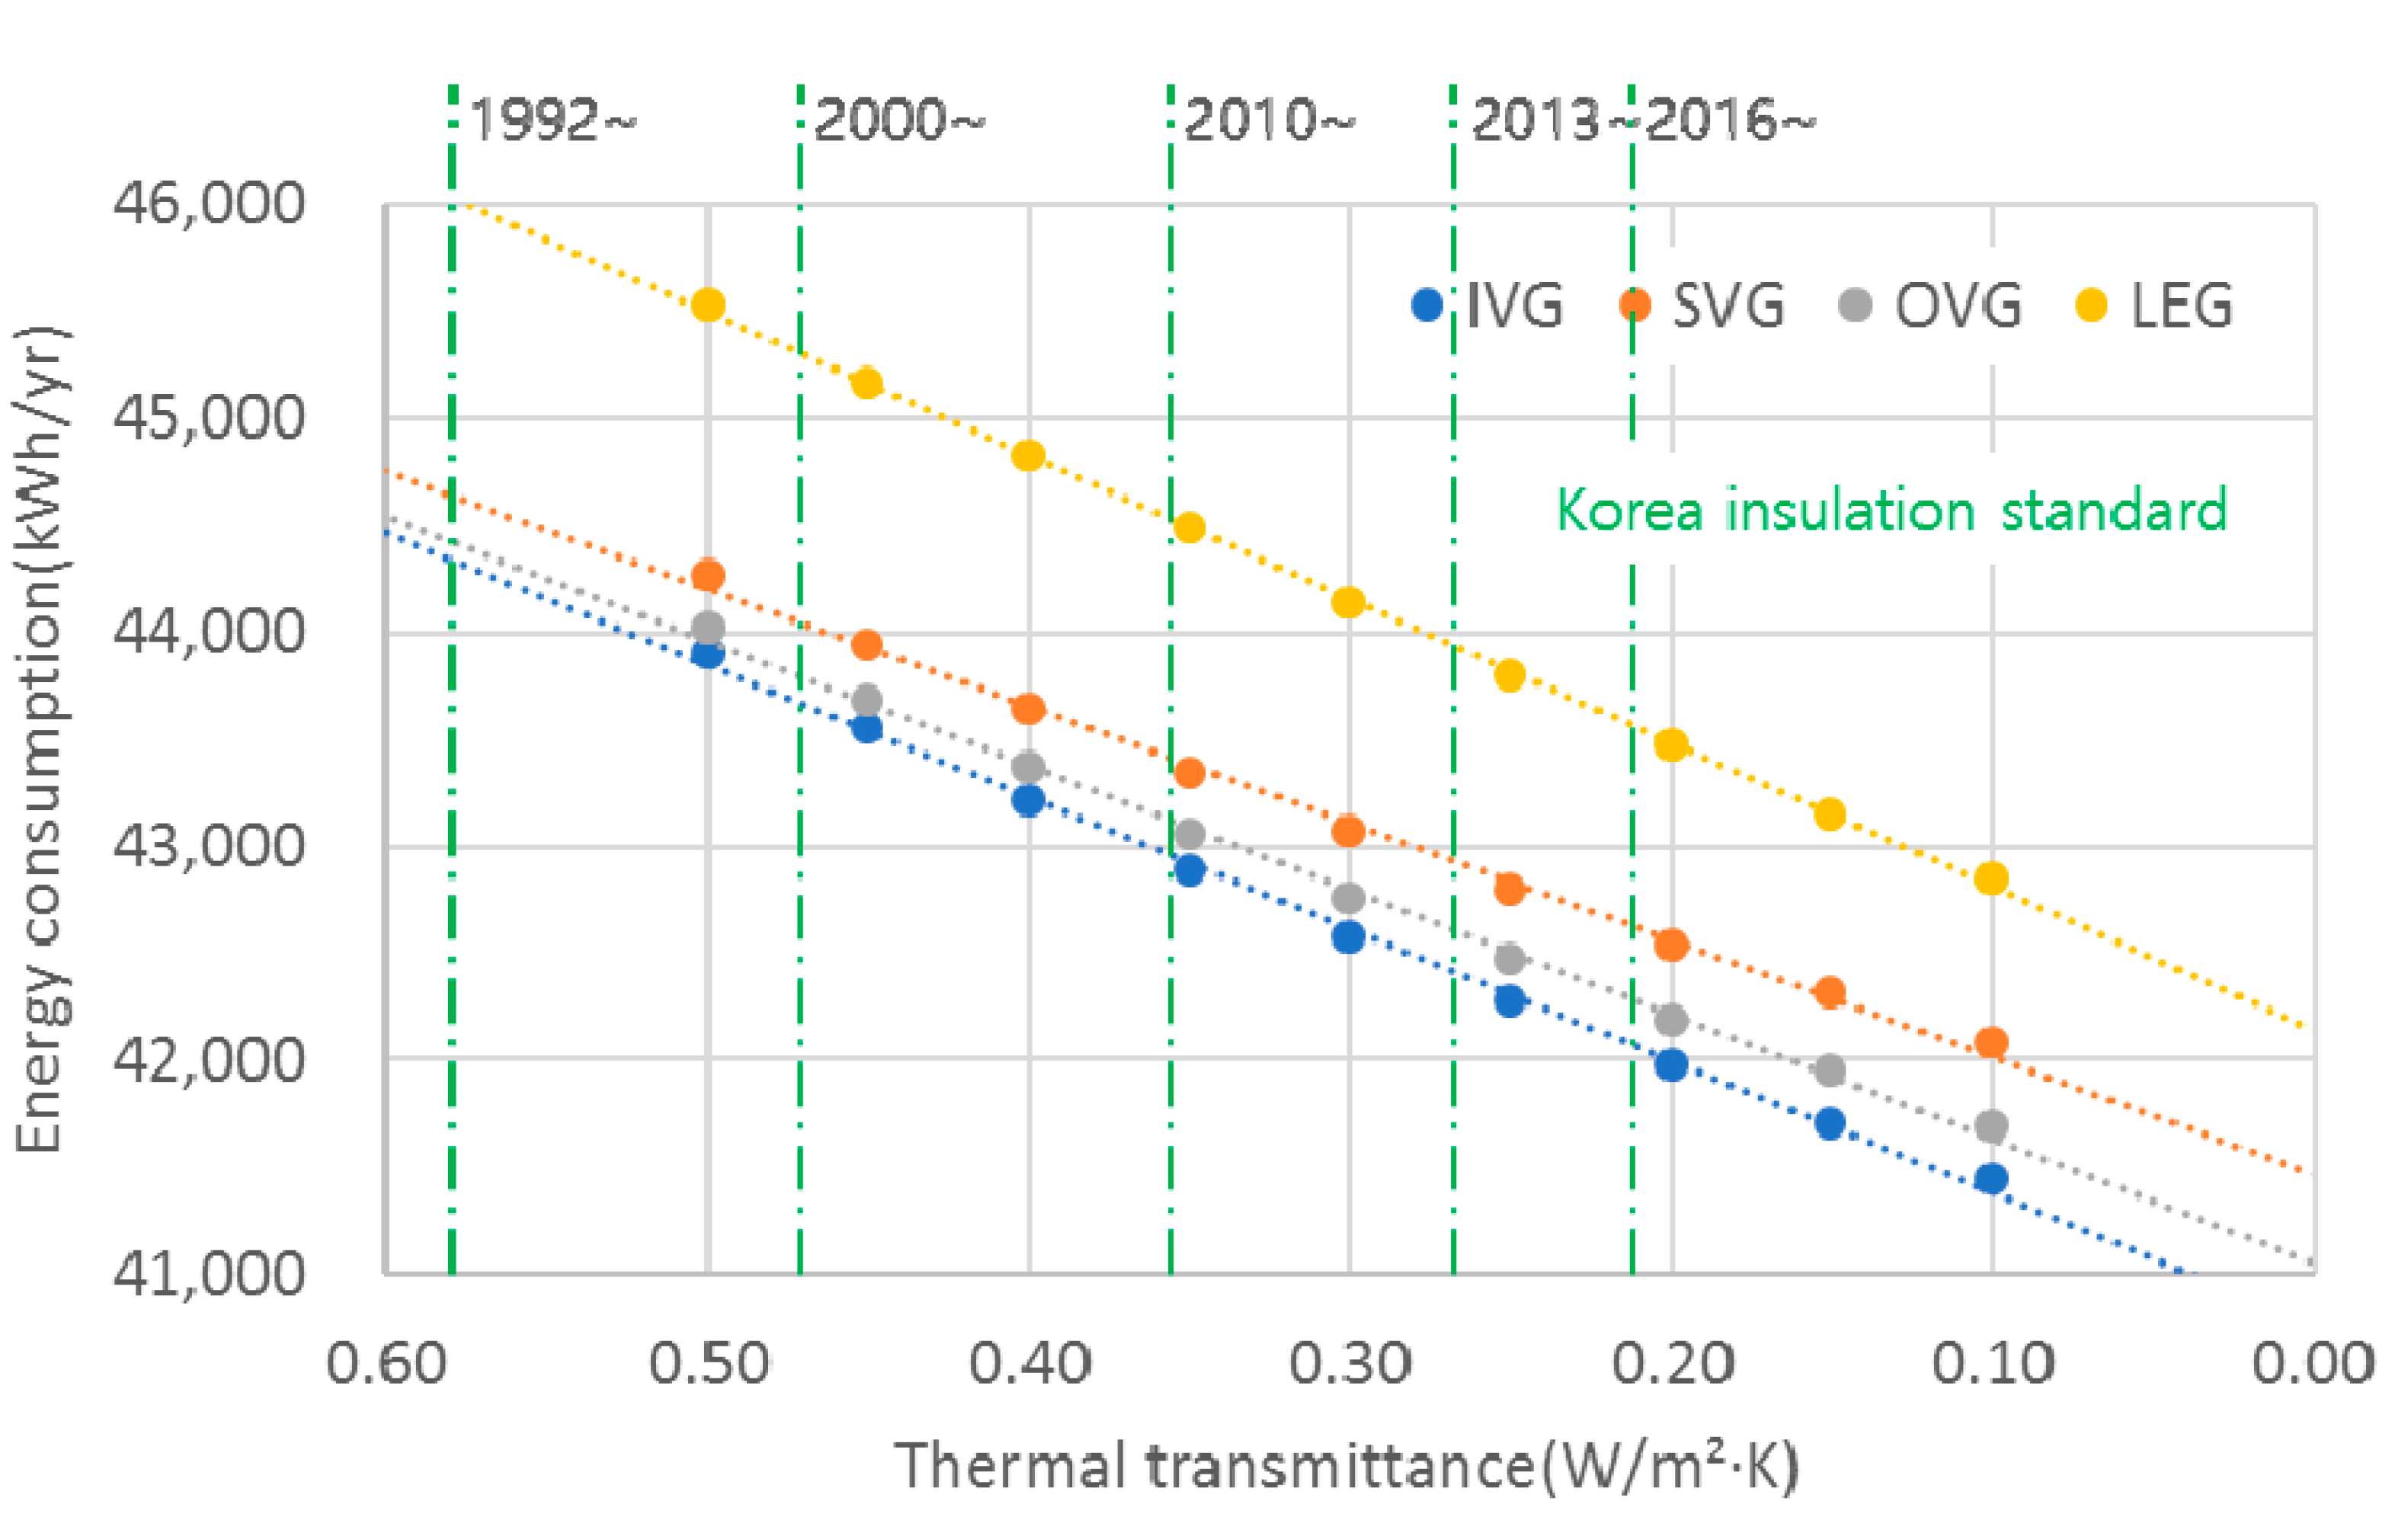
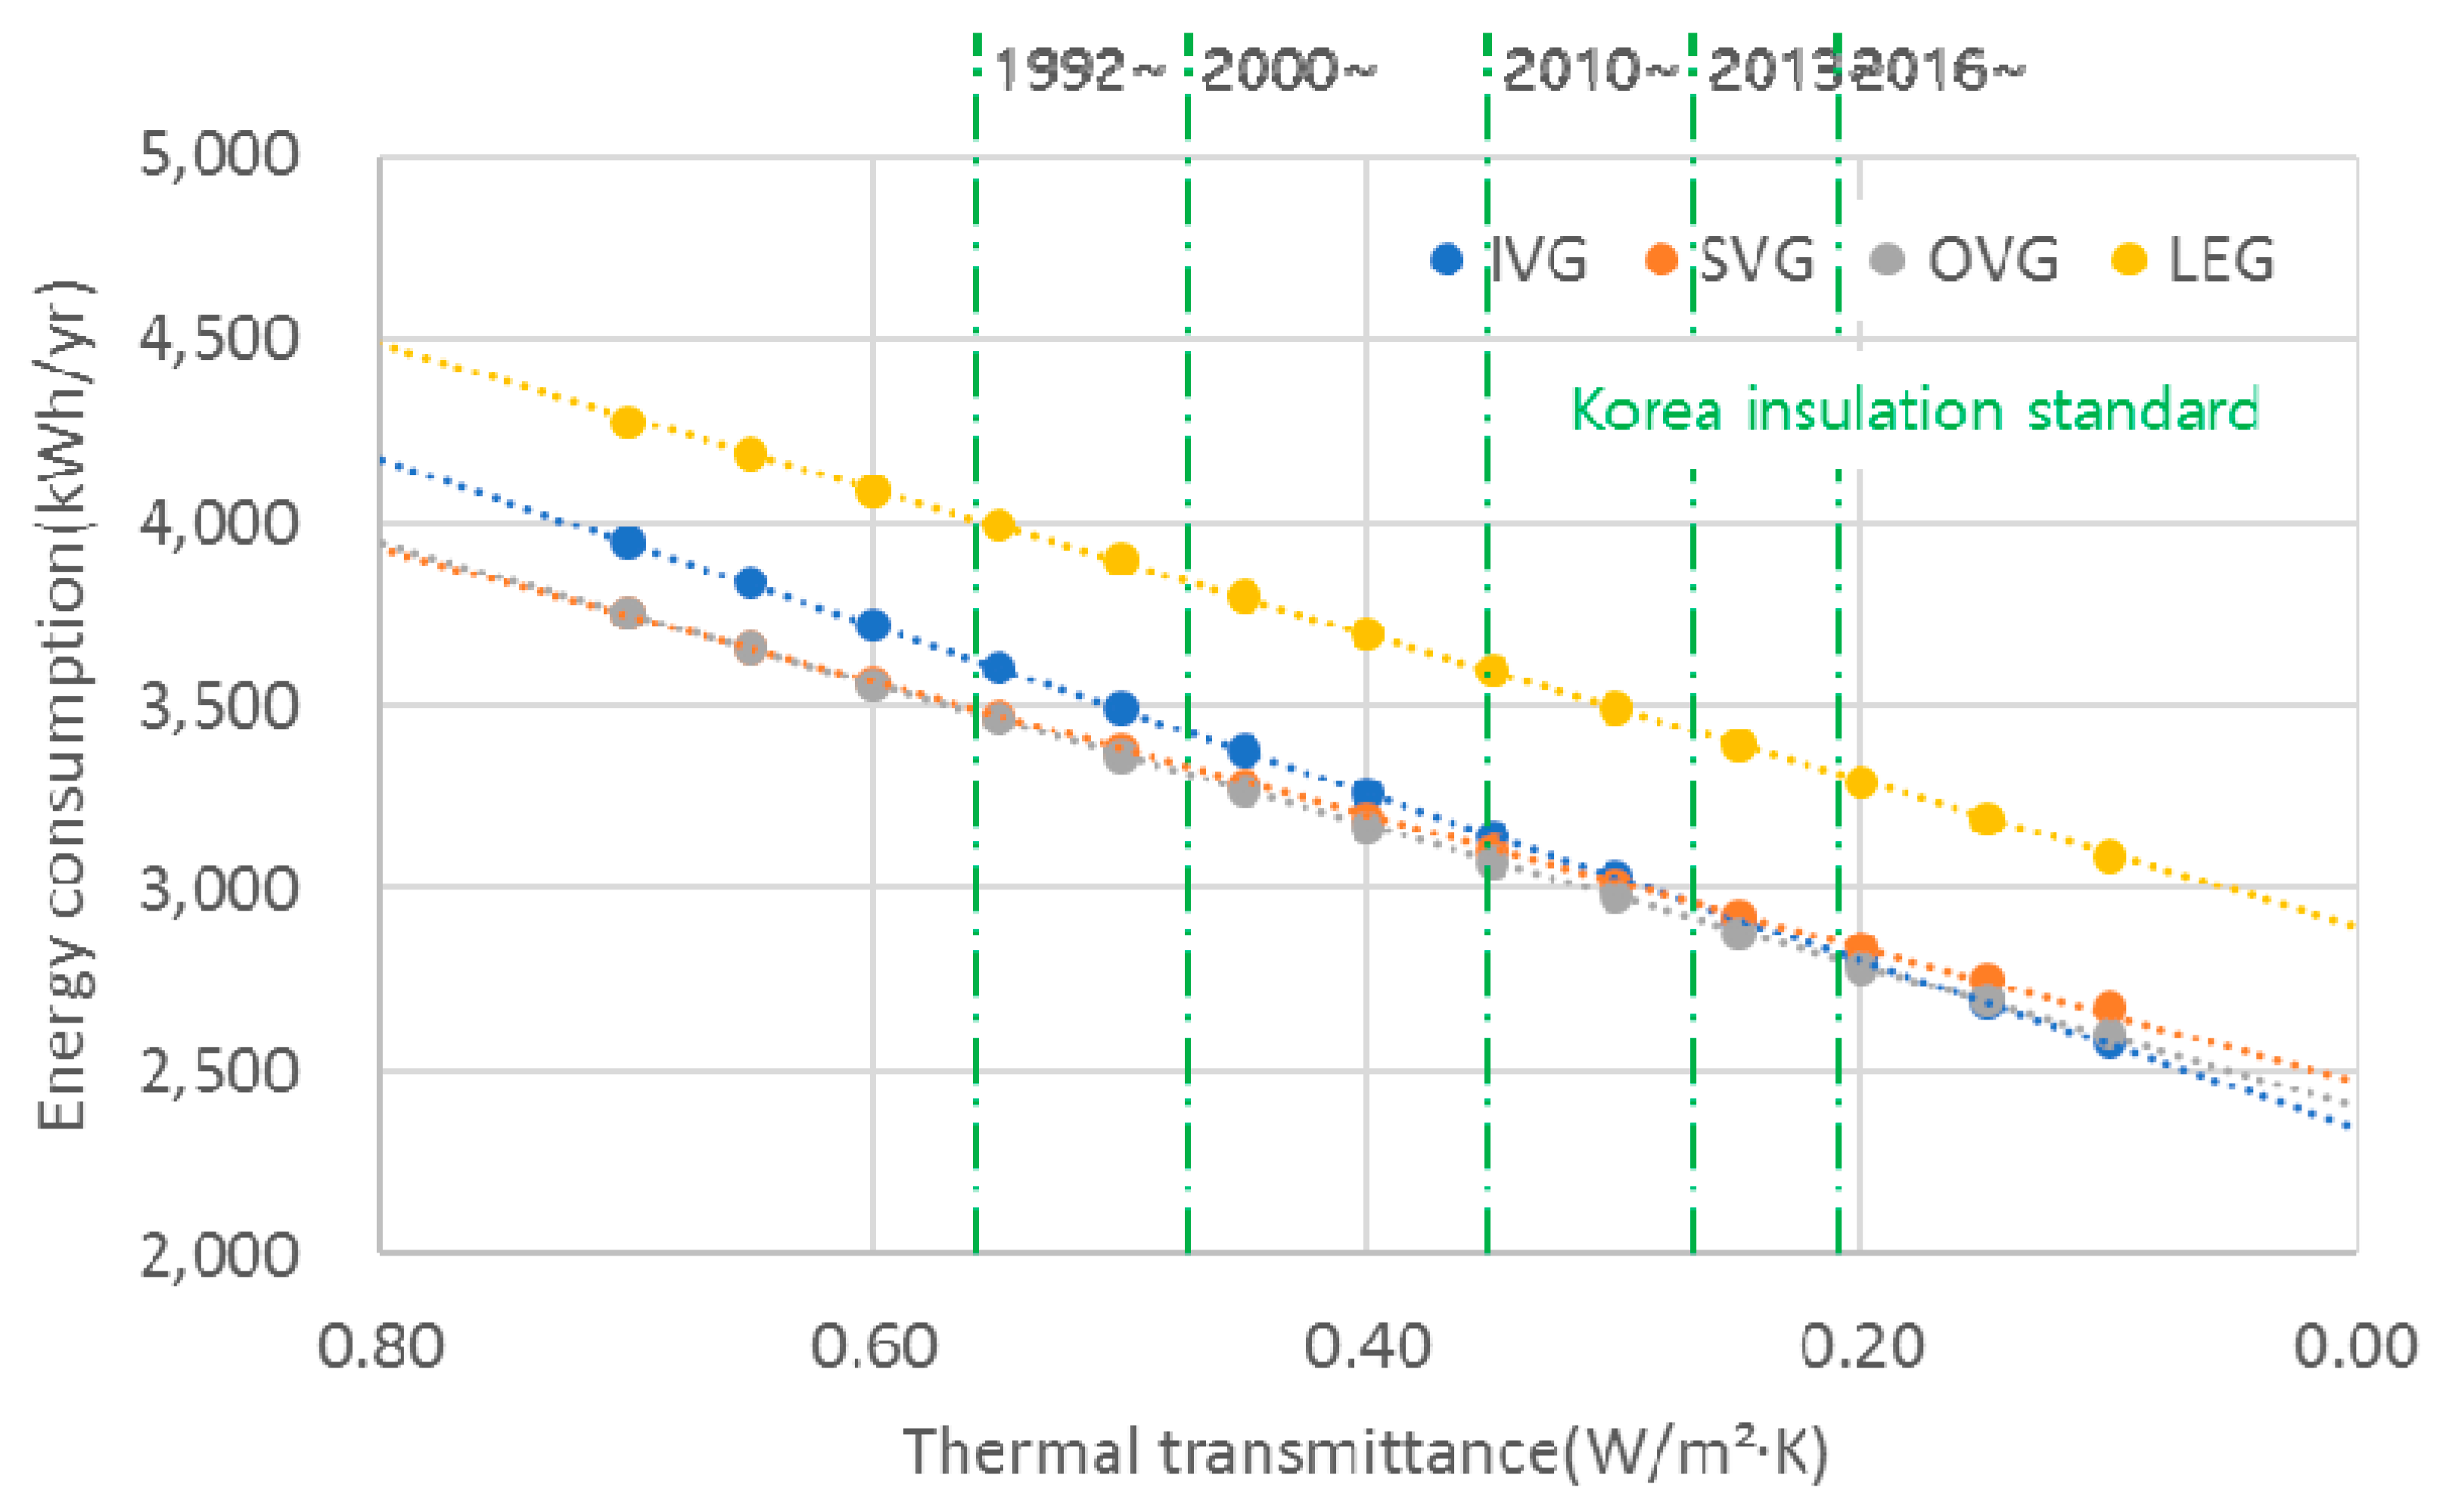
Figure 17 and
Table 7 show the results of an analysis of residential buildings. Since residential buildings are used mostly at night and have a high heating requirement, a high SHGC is required along with a low U-value under the insulation conditions of building envelopes, such as the insulation level of existing residential buildings. On the other hand, according to the analysis results, if the U-value of building envelopes is lower than a certain level, as in newly-built residential buildings, the application of IVG with a low SHGC will produce the largest reduction in energy requirement, as in office buildings.
Currently, there are no clear legal standards for SHGC in South Korea. The window certification system for energy efficiency gives a higher rating to windows with a lower U-value. On the other hand, as shown in the results of this study, because windows have both thermal and optical properties, both SHGC and the U-value of windows should be considered to achieve better energy savings in climate zones with distinct winter and summer seasons. In addition, the effect is greater as the insulation of the building is strengthened.


