1. Introduction
A monopile is a steel pipe pile with a diameter
D of approximately 4–8 m and an embedded pile length
L of approximately 30–50 m. A monopile has a simple geometric shape, can be easily constructed, and is therefore commonly used in commercial offshore wind farms [
1]. The ratio of embedded pile length
L to diameter
D for the support structure of the monopile is between 4 and 8 [
2], and monopile design is controlled by the lateral loading and moment. In ultimate limit states (ULS), lateral bearing capacity must be verified to ensure stability of monopile. In a serviceability limit state (SLS), the permanent inclination of the monopile foundation should be limited. During a dynamic analysis, the natural frequency of the support structure must be within an allowable turbine operating range. Arany et al. [
3] proposed a simple procedure for the basic conceptual design of a monopile: they assessed foundation stiffness and determined the initial size of a monopile through calculation of pile deformation. However, scour is not considered in the design conditions.
Methods for calculating the load-displacement response of soil-structure interactions include an elastic theory method [
4], a
p-
y curve method, and a finite element method [
5]. The
p-
y curve method is the most common method used in the engineering practice; it has been recommended by the American Petroleum Institute (API) [
6] and Det Norske Veritas and Germanischer Lloyd (DNV-GL) [
7]. The
p-
y curves were obtained through field tests on piles with diameter
D less than 2 m. If a
p-
y curve is applied to calculate the foundation deformation of a monopile (
D > 4 m), pile deformation may be underestimated [
8]. To analyze the deformation of monopile foundations, numerous researchers proposed methods involving modified
p-
y curves [
9,
10,
11,
12].
When the foundation of a monopile with a diameter greater than 4 m experiences waves and currents, a horseshoe vortex can occur at the mudline around the monopole, resulting in foundation scour [
13,
14,
15,
16]. According to DNV [
17] and DNV-GL [
7], for the foundation of a monopile, scour depth may reach approximately 1 to 1.5 times as large as pile diameter. If a monopile foundation design is unprotected against scour, scour will decrease the embedded pile length, increase the foundation lateral deformation [
18,
19], reduce the foundation stiffness, and increase the natural frequency of the support structure [
20,
21,
22].
Typical
p-
y curves constructed according to the results of field tests do not consider the geometric shapes of scour holes caused by local scour. When scour occurs around the pile foundation, the entire layer of soil above the bottom of scour hole will be ignored, then soil resistance will be underestimated and pile foundation design will be extremely conservative. Recently, several methods have considered the effect of scour with modified
p-
y curves [
23,
24,
25]. However, no relevant studies have conducted dynamic analysis of the support structure of offshore turbine.
Seasonal typhoons erode mountain river soils and form alluvia on the western seabed of Taiwan; in addition, because of the current effect, severe foundation scour occurs in marine environments. The Taiwan Power Company installed a meteorological mast and undertook water depth measurements around pile foundations. The results showed that with scour protection, differences in terrain elevation around a pile reached 1.3 m, which was approximately 0.34 times as large as the pile diameter [
26]. Therefore, foundation scour must be considered when designing an offshore wind farm in Taiwan; accordingly, the foundation stiffness of an offshore turbine in its lifetime can meet the requirements of its original design to ensure the safe operation of wind turbines.
2. The Influence of Pile Diameter on the Initial Stiffness of the p-y Curve
The
p-
y curve method assumes that the pile is considered as an elastic beam supported by a series of nonlinear springs; the soil resistance per length
p and horizontal pile deflection
y forms a
p-
y curve. Regarding the
p-
y curve for a foundation pile embedded in cohesionless soil, API [
6] suggested using Equation (1) to construct the
p-
y curve for depth
z:
For the pile encounter cyclic loading, the value of
equals 0.9. The ultimate soil resistance
can be determined by Equation (2) or (3), and the smaller of both values is to be considered:
The initial stiffness of
p-
y curve
can be obtained by calculating the differential of Equation (1); it has a linear relationship with depth
(refer to Equation (4)):
where
denotes the effective friction angle of soil (°);
denotes the effective unit weight (
);
D denotes pile diameter (m);
;
;
denotes the coefficient of lateral earth pressure at rest;
denotes the coefficient of the active lateral earth pressure;
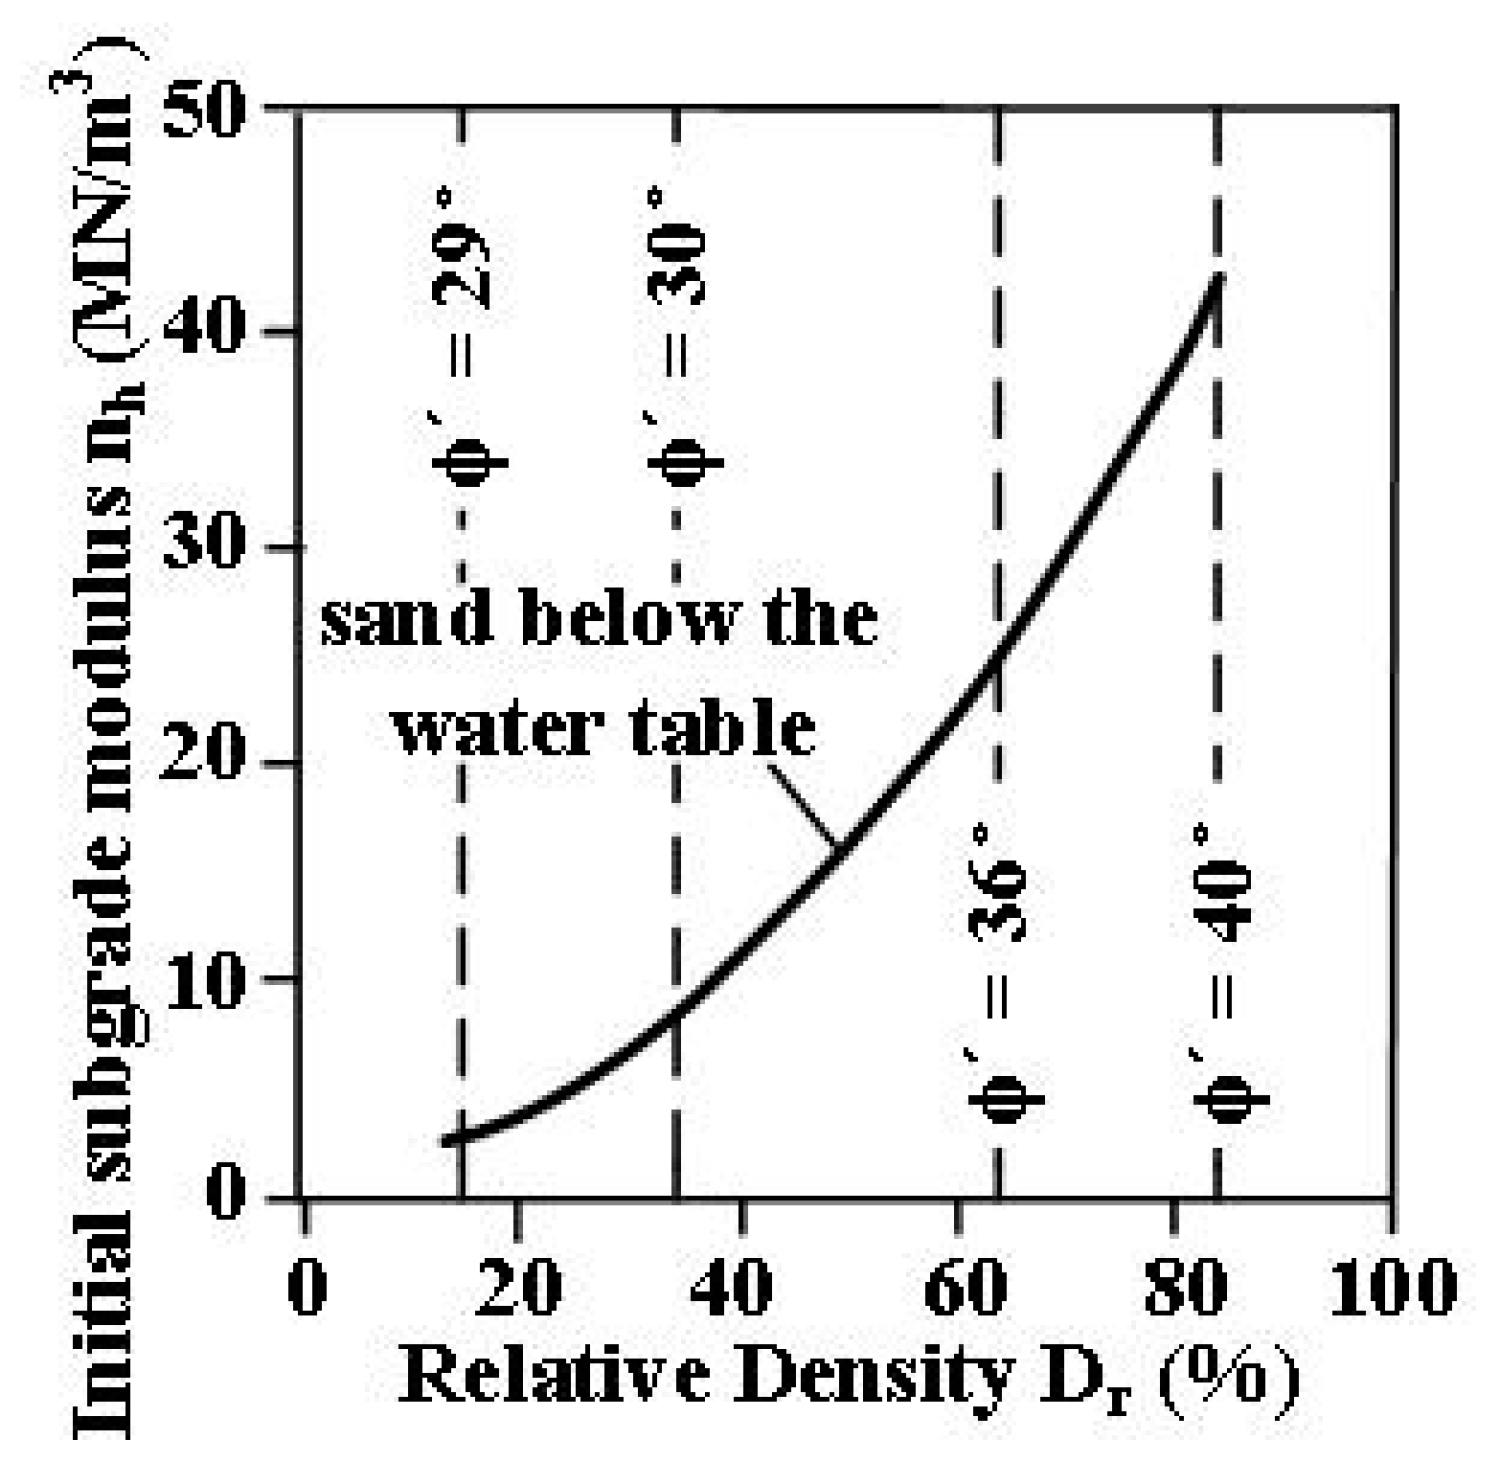
denotes the initial modulus of subgrade reaction (
). The initial modulus of subgrade reaction is given as a function of soil conditions and not dependent of pile diameter and depth. According to API [
27], the relationship of relative density and initial modulus of subgrade reaction can be graphed, as shown in
Figure 1.
Assume that the elastic modulus of cohesionless soil increases linearly with depth
. Wiemann and Lesny [
9] considered that the initial modulus of subgrade reaction
of the monopile below the critical pile length
might be overestimated. Therefore, Equation (5) proposed by Titze [
28] can be used to determine the critical pile length of a monopile subject to a lateral force (moment
). In addition, the oedometric modulus of soil at the bottom of the pile
can be employed to calculate the initial modulus of subgrade reaction
(refer to Equation (6)):
where the reference diameter
equals 1
m. The adjusted coefficient of pile diameter
a is influenced by soil relative density. For medium dense sand, the value of
a equals 0.6; for dense sand, the value of
a equals 0.5.
Sørensen et al. [
10] employed six laboratory tests to verify a numerical model, and calculated pile deformation. Sørensen et al. [
10] proposed the modification of
p-
y curve, the initial stiffness of
p-
y curve
increases nonlinearly with depth. The initial stiffness of the
p-
y curve for cohesionless soil obtained according to API [
6]; Equation (4) will be overestimated when the depth exceeds a specific value. Therefore, Sørensen et al. [
10] suggested that an adjusted initial modulus of subgrade reaction
, which is specified by Equation (7), should be substituted in Equation (4) to modify the initial stiffness of
p-
y curve
:
where reference depth
equals 1 m; reference diameter
equals 1 m; the initial modulus of subgrade reaction of the reference
p-
y curve
equals 50,000 kPa; the adjusted coefficient of depth
b equals 0.6; the adjusted coefficient of pile diameter
c equals 0.5; the adjusted coefficient of effective friction angle
d equals 3.6; the unit for the effective friction angle
is radians.
Sørensen [
11] proposed Equation (8) to modify the initial modulus of subgrade reaction
; Equation (8) includes the adjusted elastic modulus of soil that changes with depth:
where the reference depth
equals 1 m; reference diameter
equals 1 m; reference elastic modulus of soil
equals 1000 kPa; reference initial modulus of subgrade reaction
equals 1000 kPa; adjusted coefficient of depth
b equals 0.3; adjusted coefficient of pile diameter
c equals 0.5; adjusted coefficient of soil elastic modulus
d equals 0.8.
Kallehave et al. [
12] compared the measured natural frequencies of the support structures of three offshore turbines at the Walney offshore wind farm with the predicted natural frequencies of the support structures; the predicted frequencies were calculated from foundation stiffness values obtained from the
p-
y curve (Equation (4)). The results showed that the measured values were greater than the predicted values. Therefore, Kallehave et al. [
12] considered that using
p-
y curves based on current design guidelines to calculate load-deformation responses would underestimate soil stiffness; they therefore suggested modifying the initial modulus of subgrade reaction
(refer to Equation (9)). According to Kallehave et al. [
12], the adjusted initial stiffness of
p-
y curve
was higher than the unadjusted initial stiffness of the
p-
y curve:
In Equation (9), reference depth equals 2.5 m; reference diameter = 0.61 m; adjusted coefficient of depth m equals 0.6.
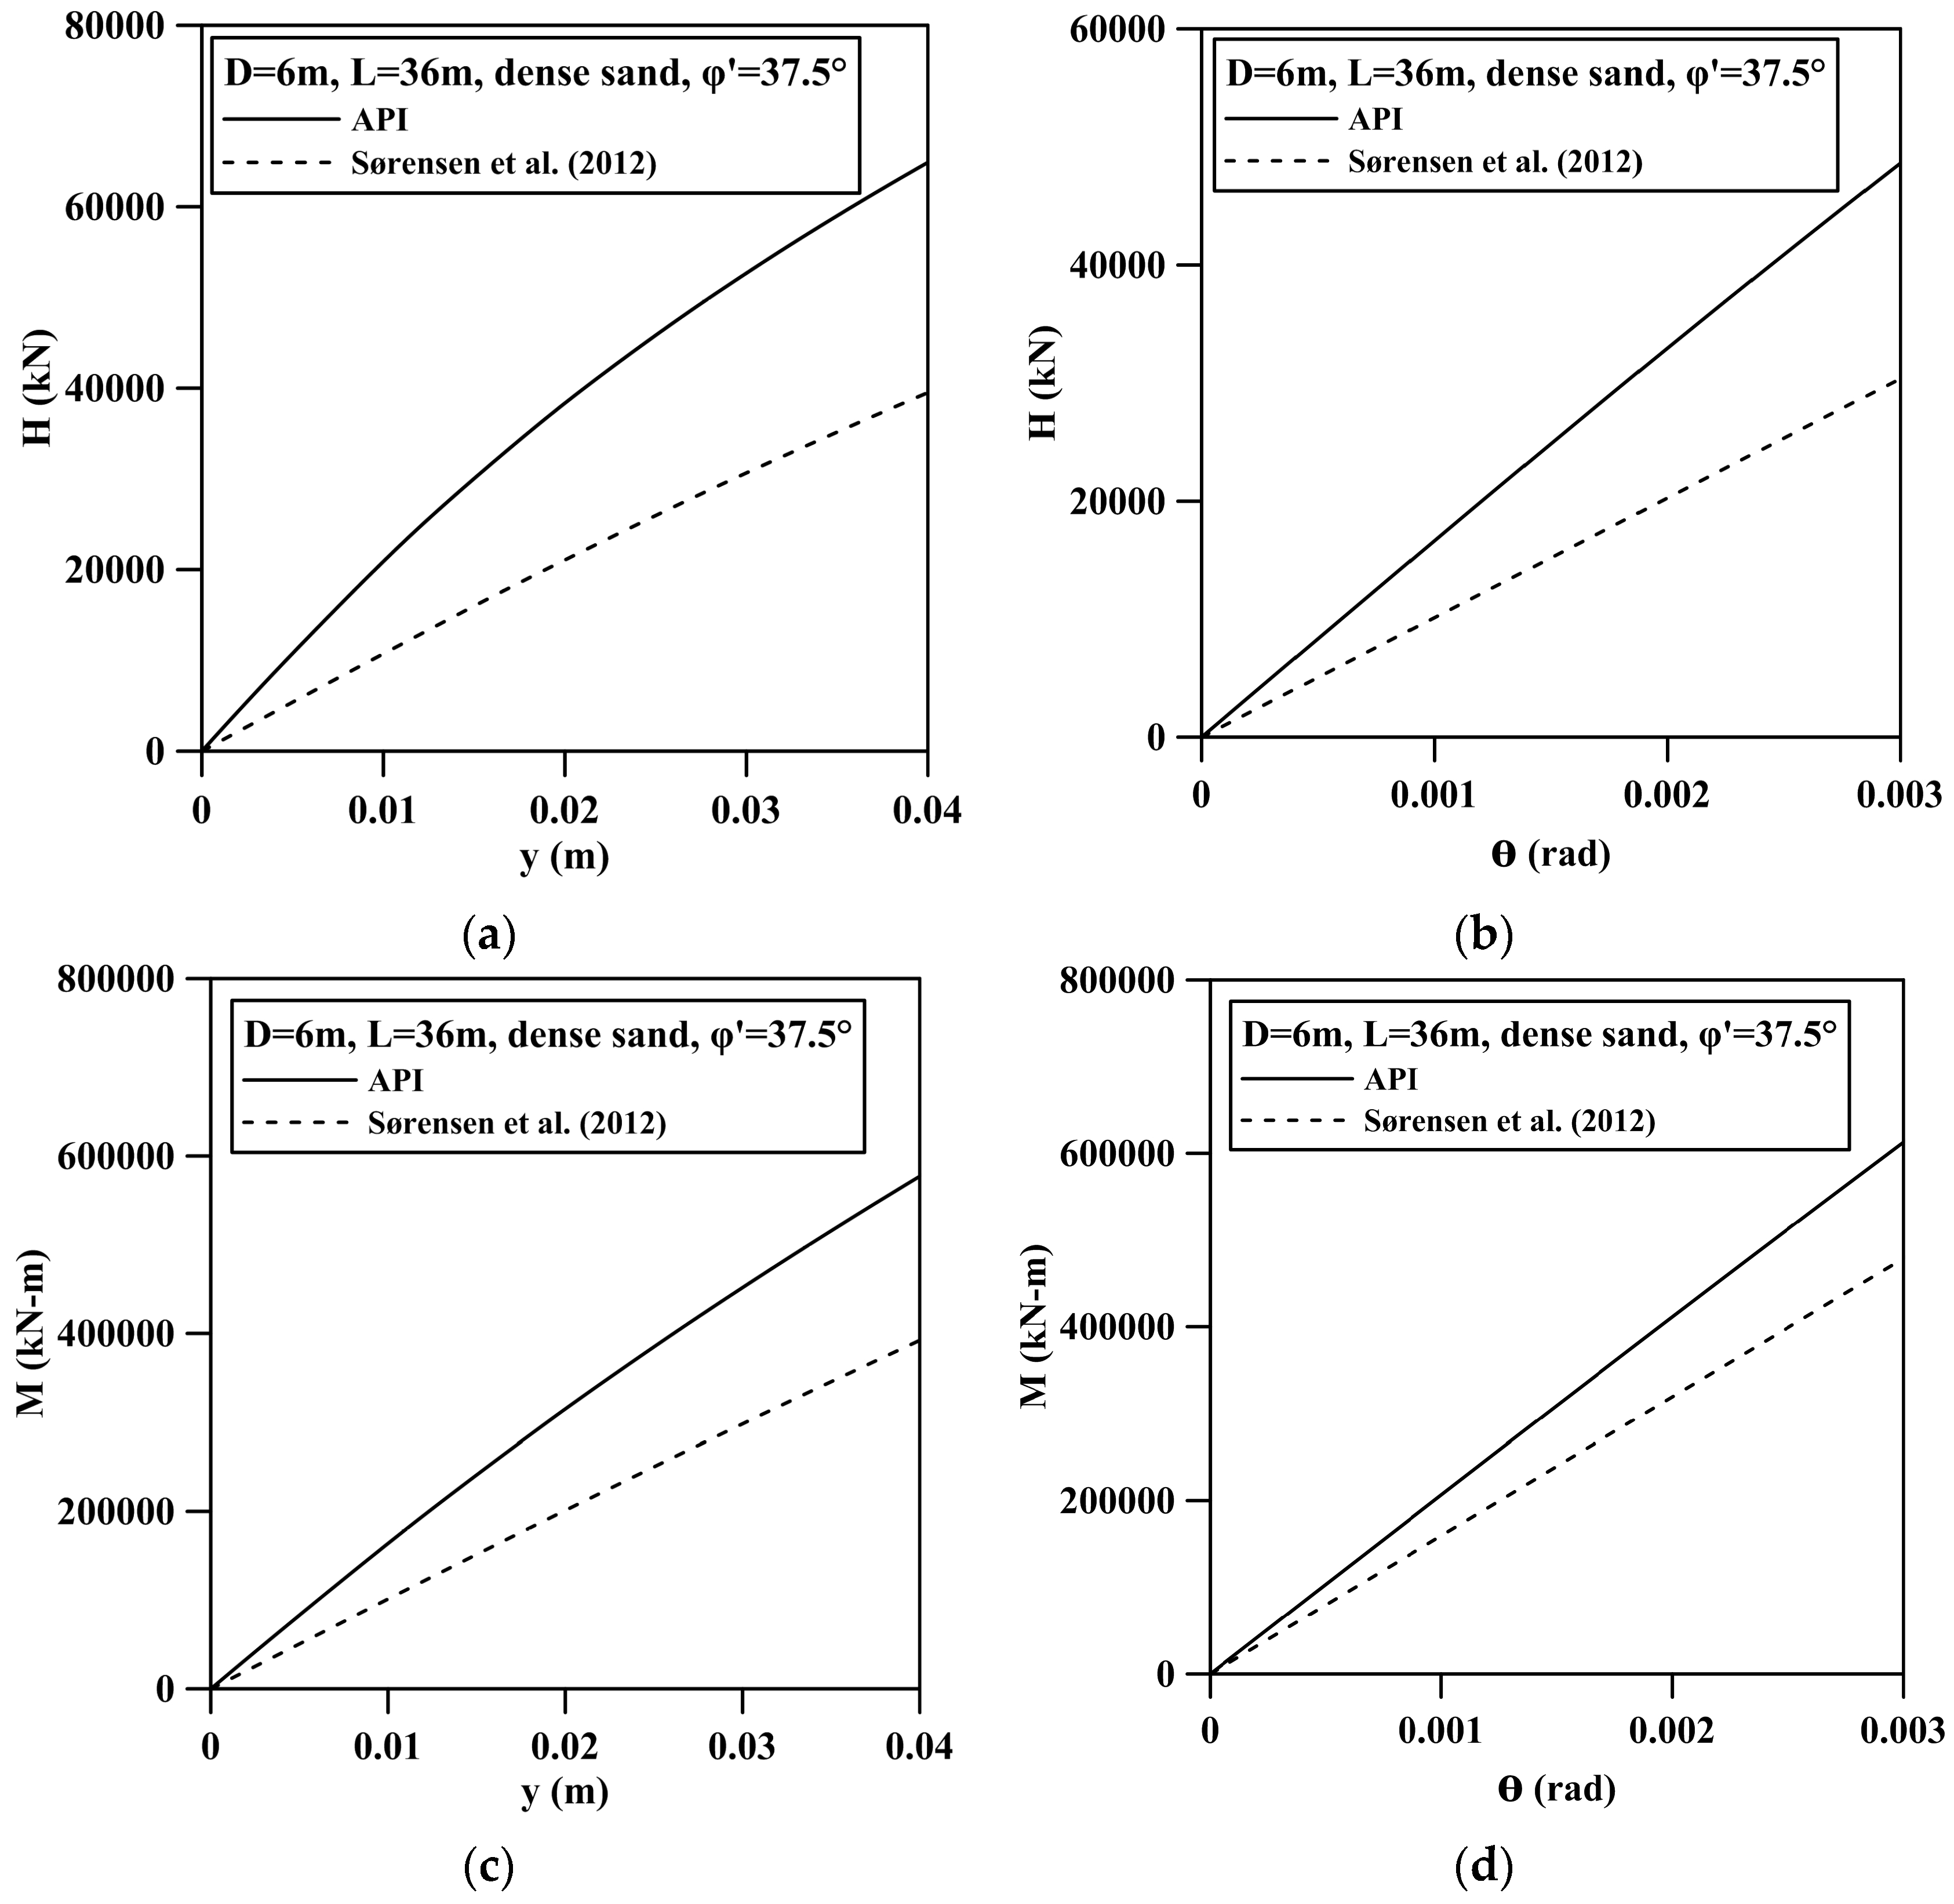
Assume that for a monopile foundation, the diameter of a pile embedded in cohesionless soil
D equals 6 m and the effective friction angle
equals 37.5°. According to API [
27], the initial modulus of subgrade reaction
equals 30,000
.
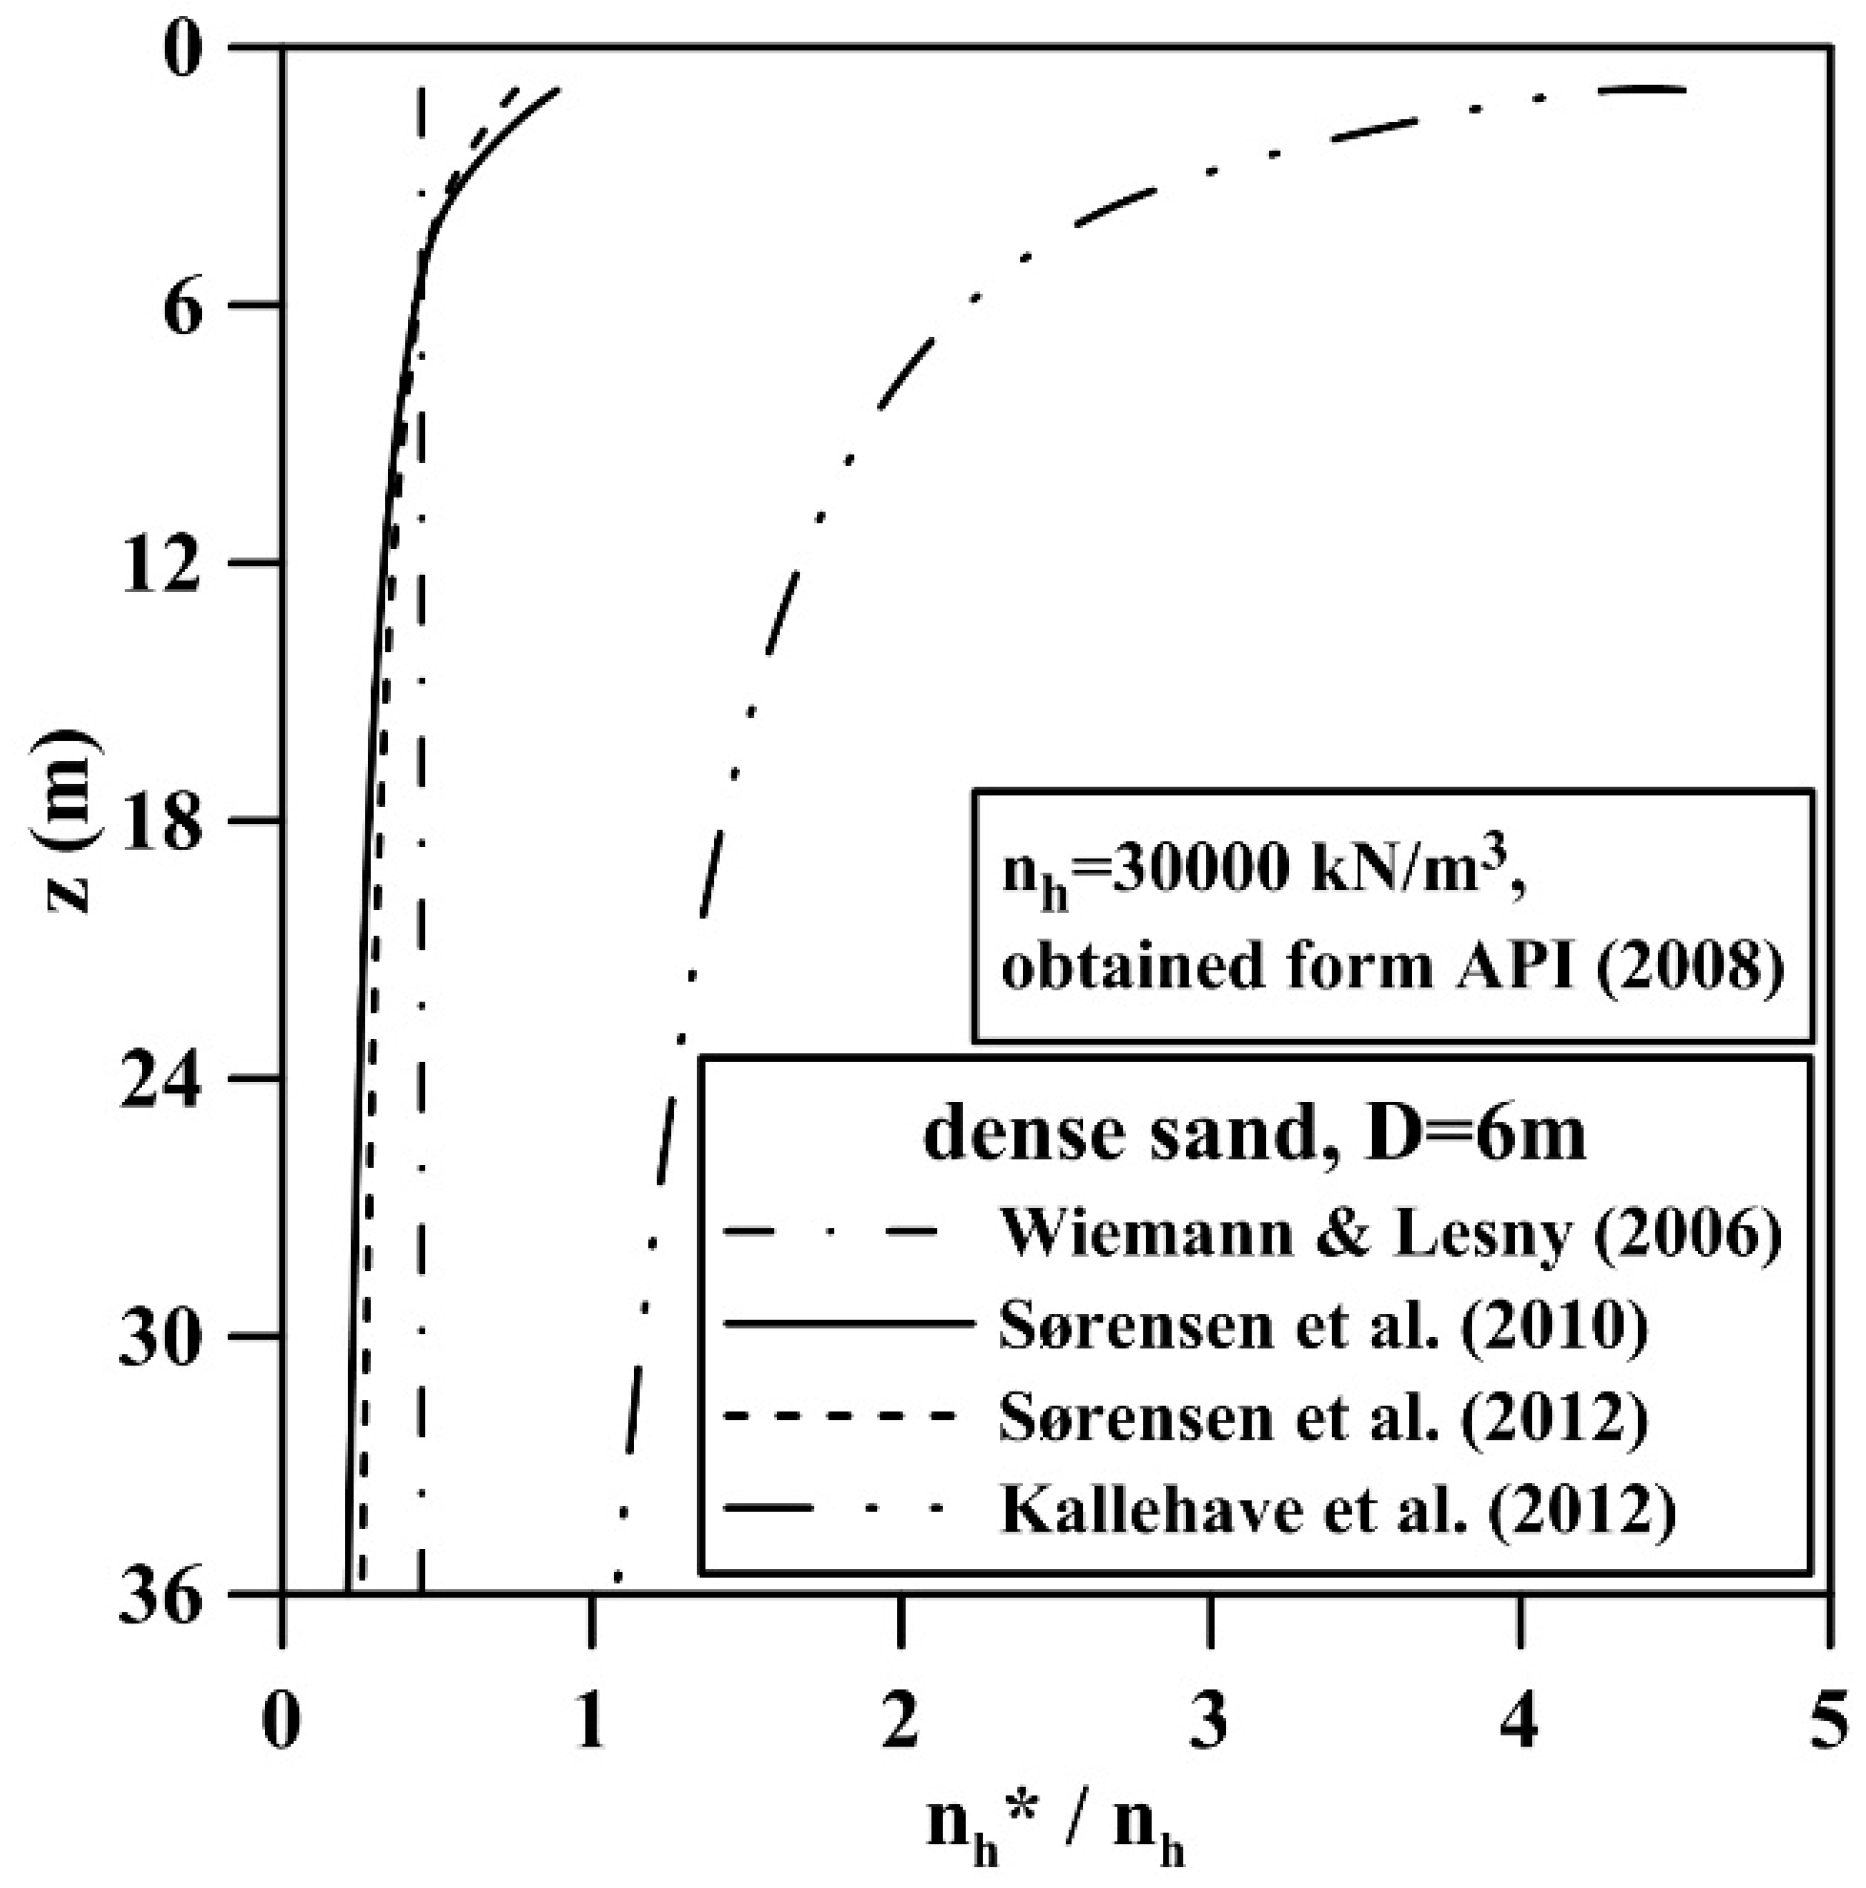
Figure 2 shows modified initial modulus of subgrade reaction suggested by various researchers.
According to Wiemann and Lesny [
9], Sørensen et al. [
10], Sørensen [
11], and Kallehave et al. [
12], the initial stiffness of
p-
y curve
for monopile foundation increased with depth. The initial modulus of subgrade reaction
with the suggestion of Wiemann and Lesny [
9], Sørensen et al. [
10], and Sørensen [
11] showed API [
6] overestimated the initial modulus of subgrade reaction. However, the initial modulus of subgrade reaction that calculated with the suggestion of Kallehave et al. [
12] showed that API [
6] underestimated the initial modulus of subgrade reaction. The reason is that Wiemann and Lesny [
9], Sørensen et al. [
10], and Sørensen [
11] used a pile deformation curve obtained according to a field test or numerical method to correct the initial stiffness of the
p-
y curve for a monopile foundation. Kallehave et al. [
12] modified the initial stiffness of the
p-
y curve for a monopile foundation that caused the predicted natural frequency of the support structure of an offshore turbine to fit the measured natural frequency of the offshore turbine supporting structure. The
p-
y curve suggested by API [
6] was based on the deformation of a foundation pile in a field test under low-frequency loading conditions (monotonic & cyclic). Therefore, the
p-
y curve suggested by API [
6] was unsuitable for assessing the initial modulus of subgrade reaction for dynamic deformation of monopile.
Achmus et al. [
29] used the Hardening Soil Model with Small-Strain Stiffness (HSS)-model implemented in the finite element software PLAXIS [
30] to calculate the pile deformations and compared with results from
p-
y curves according the API [
6], Sørensen [
11], Kallehave et al. [
12]. Achmus et al. [
29] calculated the lateral loading required at the pile head when an identical normalized pile head lateral deformation occurred. The results showed that for both SLS and ULS conditions, the lateral loading required at the pile head for the modified
p-
y curve of Kallehave et al. [
12] was greater than the simulated value based on the finite element model. For the modified
p-
y curve of Sørensen [
11], the lateral loading required at the pile head was similar to the simulated value based on the finite element model under both SLS and ULS conditions. For fatigue limit state (FLS) conditions the modified
p-
y curve of Kallehave et al. [
12] will be more appropriate. These differences resulted from various correction methods that had been used to serve various design regulations. DNV [
31] suggested that for a shear strain
of less than
, static foundation stiffness can be used to analyze the dynamic response of a support structure. Therefore, in this study, according to API’s suggestion [
7], a
p-
y curve for cohesionless soil was established; in addition, to explore the influence of scour on foundation deformation responses, the initial modulus of subgrade reaction for monopile foundation was corrected to fit the suggestion of Sørensen [
11].
3. The Influence of Scour on Ultimate Soil Resistance
Ultimate soil resistance per length of
p-
y curves
can be determined by Equations (2) or (3), and the smaller of both values is to be considered. Equations (2) and (3) are determined by effective friction angle of soil
, effective unit weight of soil
, and depth
. Currently, several researchers considered that the aforementioned parameters were influenced by scour and therefore proposed some parameter correction methods [
23,
24,
25].
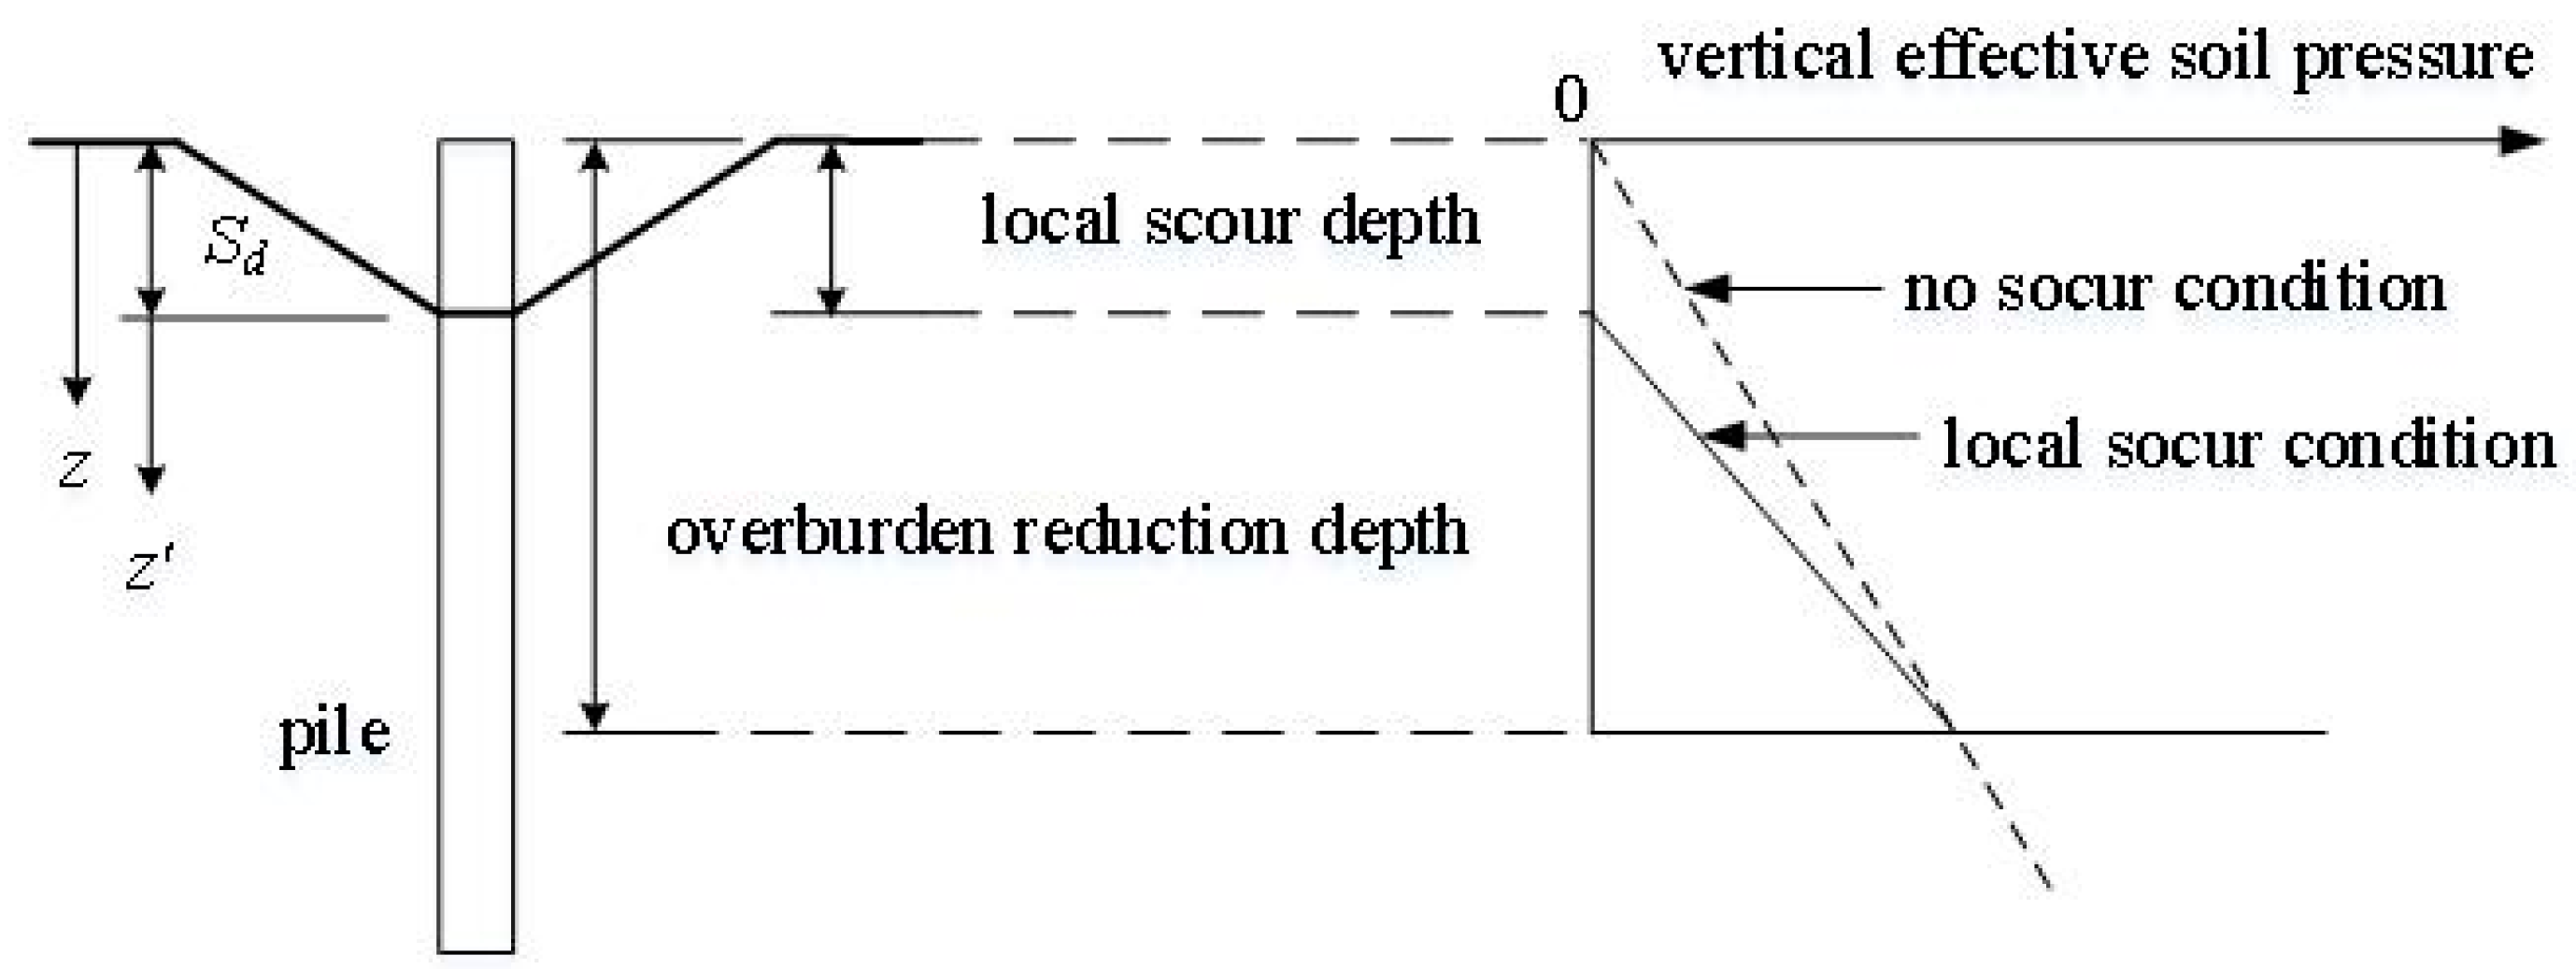
Scour can result in soil loss around a monopile’s foundation, thereby forming a conical local scour hole with a depth of
(
Figure 3). Scour can reduce the embedded pile length of the monopile foundation. API [
6] and Zaaijer [
23] reported that scour could influence the effective unit weight
of soil within six times the pile diameter
below the mudline; however, the effective unit weight
would not be influenced by scour at the depth deeper than six times the pile diameter
. Therefore, the effective unit weight
within the depth range between the bottom of the scour hole (
) and six times the pile diameter
can be determined from Equation (10):
Lin et al. [
24] claimed that when soil scour occurred around a monopile, overburden stress around the monopile would change from normally consolidated state to over-consolidated state and the coefficient of lateral earth pressure at rest would increase from
to
(Equations (11) and (12)). Scour can change soil stress and influence the void ratio of the sand
, the effective unit weight of sand
, the relative density of the sand
, and the effective friction angle of sand
. Equations (13)−(15) show the relationships of various parameters. On the basis of the change of the coefficient of lateral earth pressure at rest, the mean effective stress values before and after scour (
and
) can be calculated. The void ratio of the sand for scour-induced stress unloading from initial state and Equation (16) can be used to calculate the difference
between the void ratio of the sand before scour and the void ratio of the sand after scour. Through an iterative method, Equations (13)−(15) can be employed to obtain the relative density of the sand
, the effective friction angle of sand
, the effective unit weight of sand
, and the void ratio of the sand
after scour. However, the relative density and friction angle of sandy soil will not change significantly due to loading of remove soil during scour. The method proposed by Lin et al. [
24] need further verification of field tests:
where
denotes the unloading index;
denotes the over-consolidation ratio;
denotes the critical effective friction angle;
denotes the specific gravity of soil;
denotes the maximum void ratio of the sand;
denotes the minimum void ratio of the sand.
According to Zaaijer [
23] and Lin et al. [
24], the effective friction angle of sand
and the effective unit weight of sand
after scour can be obtained from Equation (10) or Equations (13) and (15); these values can be substituted into Equations (2) and (3) to calculate the ultimate soil resistance per length
around a pile at a depth of
after scour, then the modified
p-
y curves considering scour can be obtained.
The
p-
y curve established according to the aforementioned method did not account for the geometric shape of a scour hole due to local scour. In general engineering practice, when scour occurred around the pile, the local scour hole is assumed simply as the general scour for pile foundation design, the position with a scour depth
would be adjusted from the original mudline to the new mudline; soil depth is reduced from
to
(Equation (17)). Subsequently, Equation (2) would be used to calculate the ultimate soil resistance per length near the ground surface
. In this manner, the soil resistance per length
would be underestimated (refer to
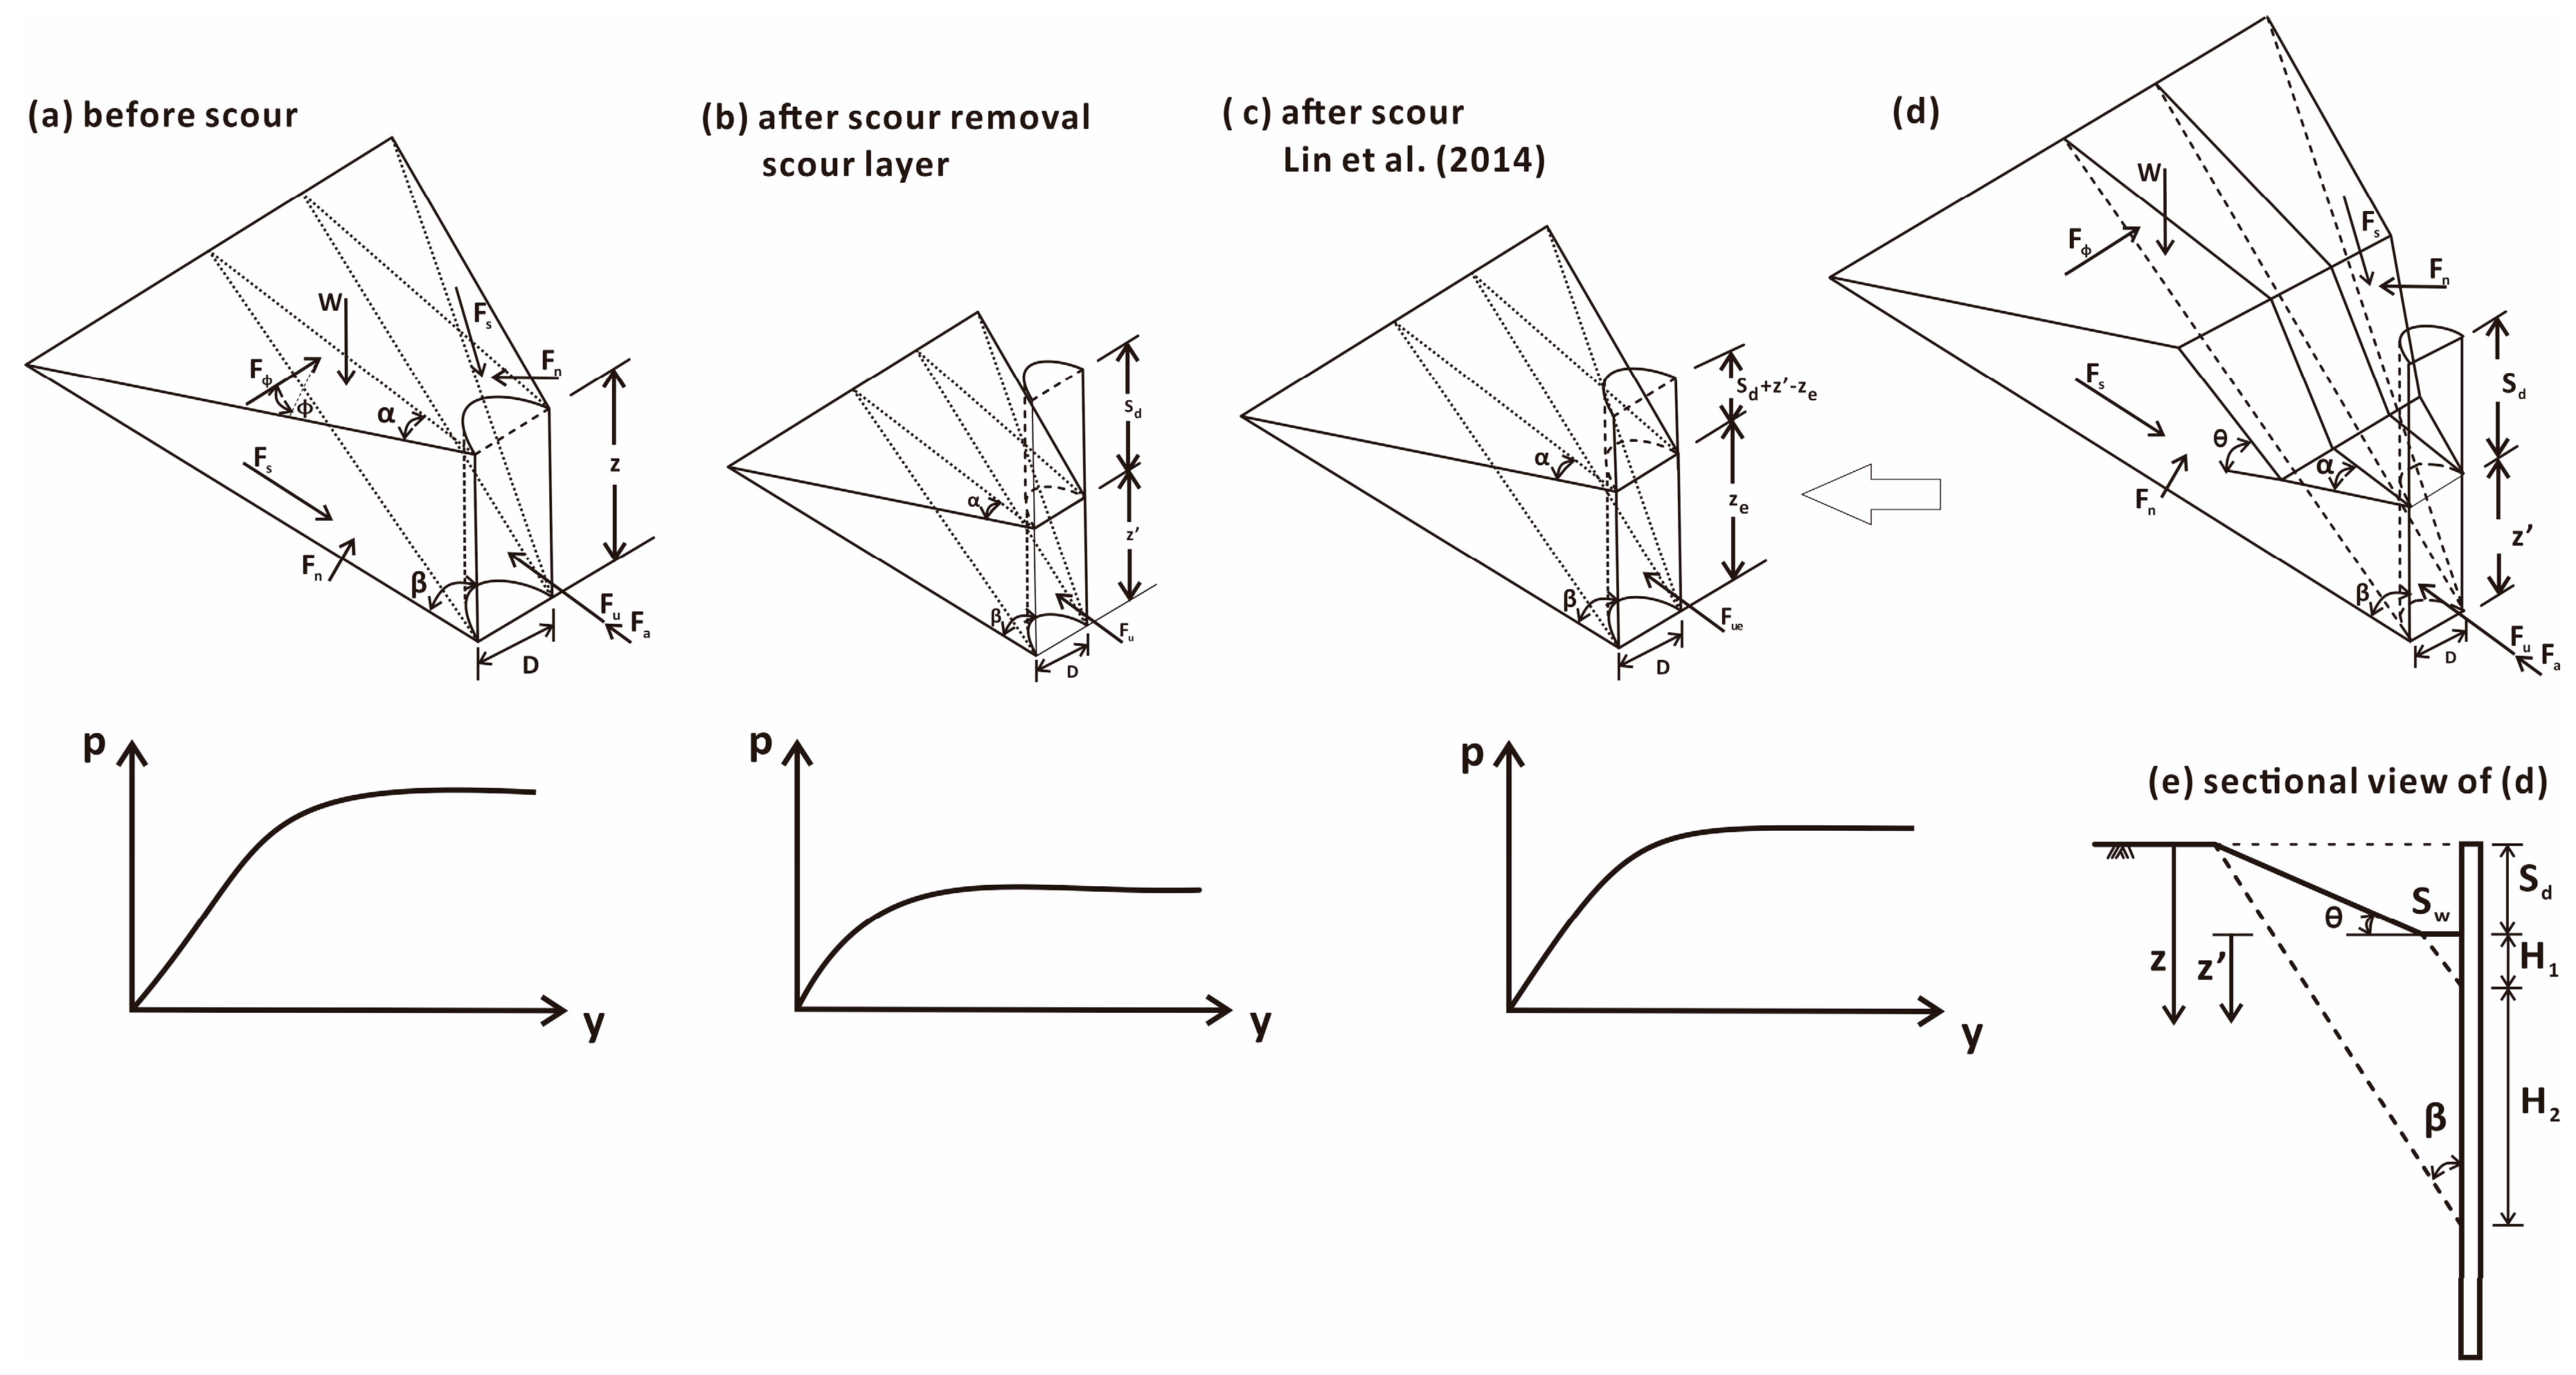
Figure 4a,b). Following the method of Reese et al. [
32], Lin et al. [
25] considered the shape of scour hole in soil wedge and recalculated the ultimate soil resistance per length near the ground surface
based on force equilibrium. Accordingly, Lin et al. [
25] employed an equivalent soil depth
to replace
, so the ultimate soil resistance per length near the ground surface
reasonably reflected the influence of soil around the scour hole (
Figure 4c):
The soil model suggested by Reese et al. [
32] considered the shear forces acting on the side plane of the wedge
, the normal forces acting on the side plane of the wedge
, the weight of the wedge
, the active earth thrust
, and the sliding resistance acting on the bottom side of the wedge
. Force balance was used to obtain the total lateral force per length
at the pile with a depth of
below the mudline. Various parameters were influenced by the shape of damaged soil wedge at failure (refer to Equation (18)).
Figure 4a shows the loading acted on soil wedge which does not consider the shape of scour hole. Equation (19) can be derived by substituting
,
,
, and
in Equation (18):
Lin et al. [
25] suggested that after scour occurred, the shape of the scour hole should be included in the shape of the soil wedge at failure (
Figure 4d). According to the results of the flume experiments conducted by Roulund et al. [
33] and Nielsen and Hansen [
34], the slope of the scour hole in cohesionless soil
was one-third to one-half times as large as the effective friction angle of sand
; therefore
is smaller than
(
Figure 4e). Because the shape of the soil wedge at failure changed according to the depth of the bottom of the scour hole
, the total lateral force per length
at the pile was recalculated on the basis of the depth
(
Table 1). The values of
and
in
Table 1 were obtained from Equations (20) and (21):
where
denotes the width of the scour hole bottom, and
denotes the influence of the shape of the scour hole. The value of
can be derived from Equation (22).
When
, the shape of the soil wedge at failure is identical to the shape of the soil wedge at failure before scour. Therefore, by replacing depth
in Equation (19) with
, the total lateral force
exerted on the pile can be obtained (Equation (23)):
When
, the shape of the soil wedge at failure changes. By recalculating
,
,
, and
, and substituting them into Equation (18), the total lateral force
exerted on the foundation pile can be obtained (Equation (24)).
When
, the shape of the soil wedge at failure changes again. By recalculating
,
,
, and
and substituting them into Equation (18), the total lateral force
exerted on the foundation pile can be obtained (Equation (25)):
The total lateral force (
,
, or
) that accounts for the shape of the scour hole is identical to the total lateral force (
) derived from the equivalent depth
that does not account for the shape of the scour hole (Equation (26)). Equations (23)–(26) can be used to calculate the equivalent depth
, which is in turn substituted into Equation (2) to modify the ultimate soil resistance per length near the ground surface
. By comparing
and
from Equation (3) and choosing the smaller value, the ultimate soil resistance per length
at depth
below the bottom of the scour hole considered the shape of the scour hole can be obtained:
The methods proposed by Zaaijer [
23] and Lin et al. [
24,
25] to modify the
p-
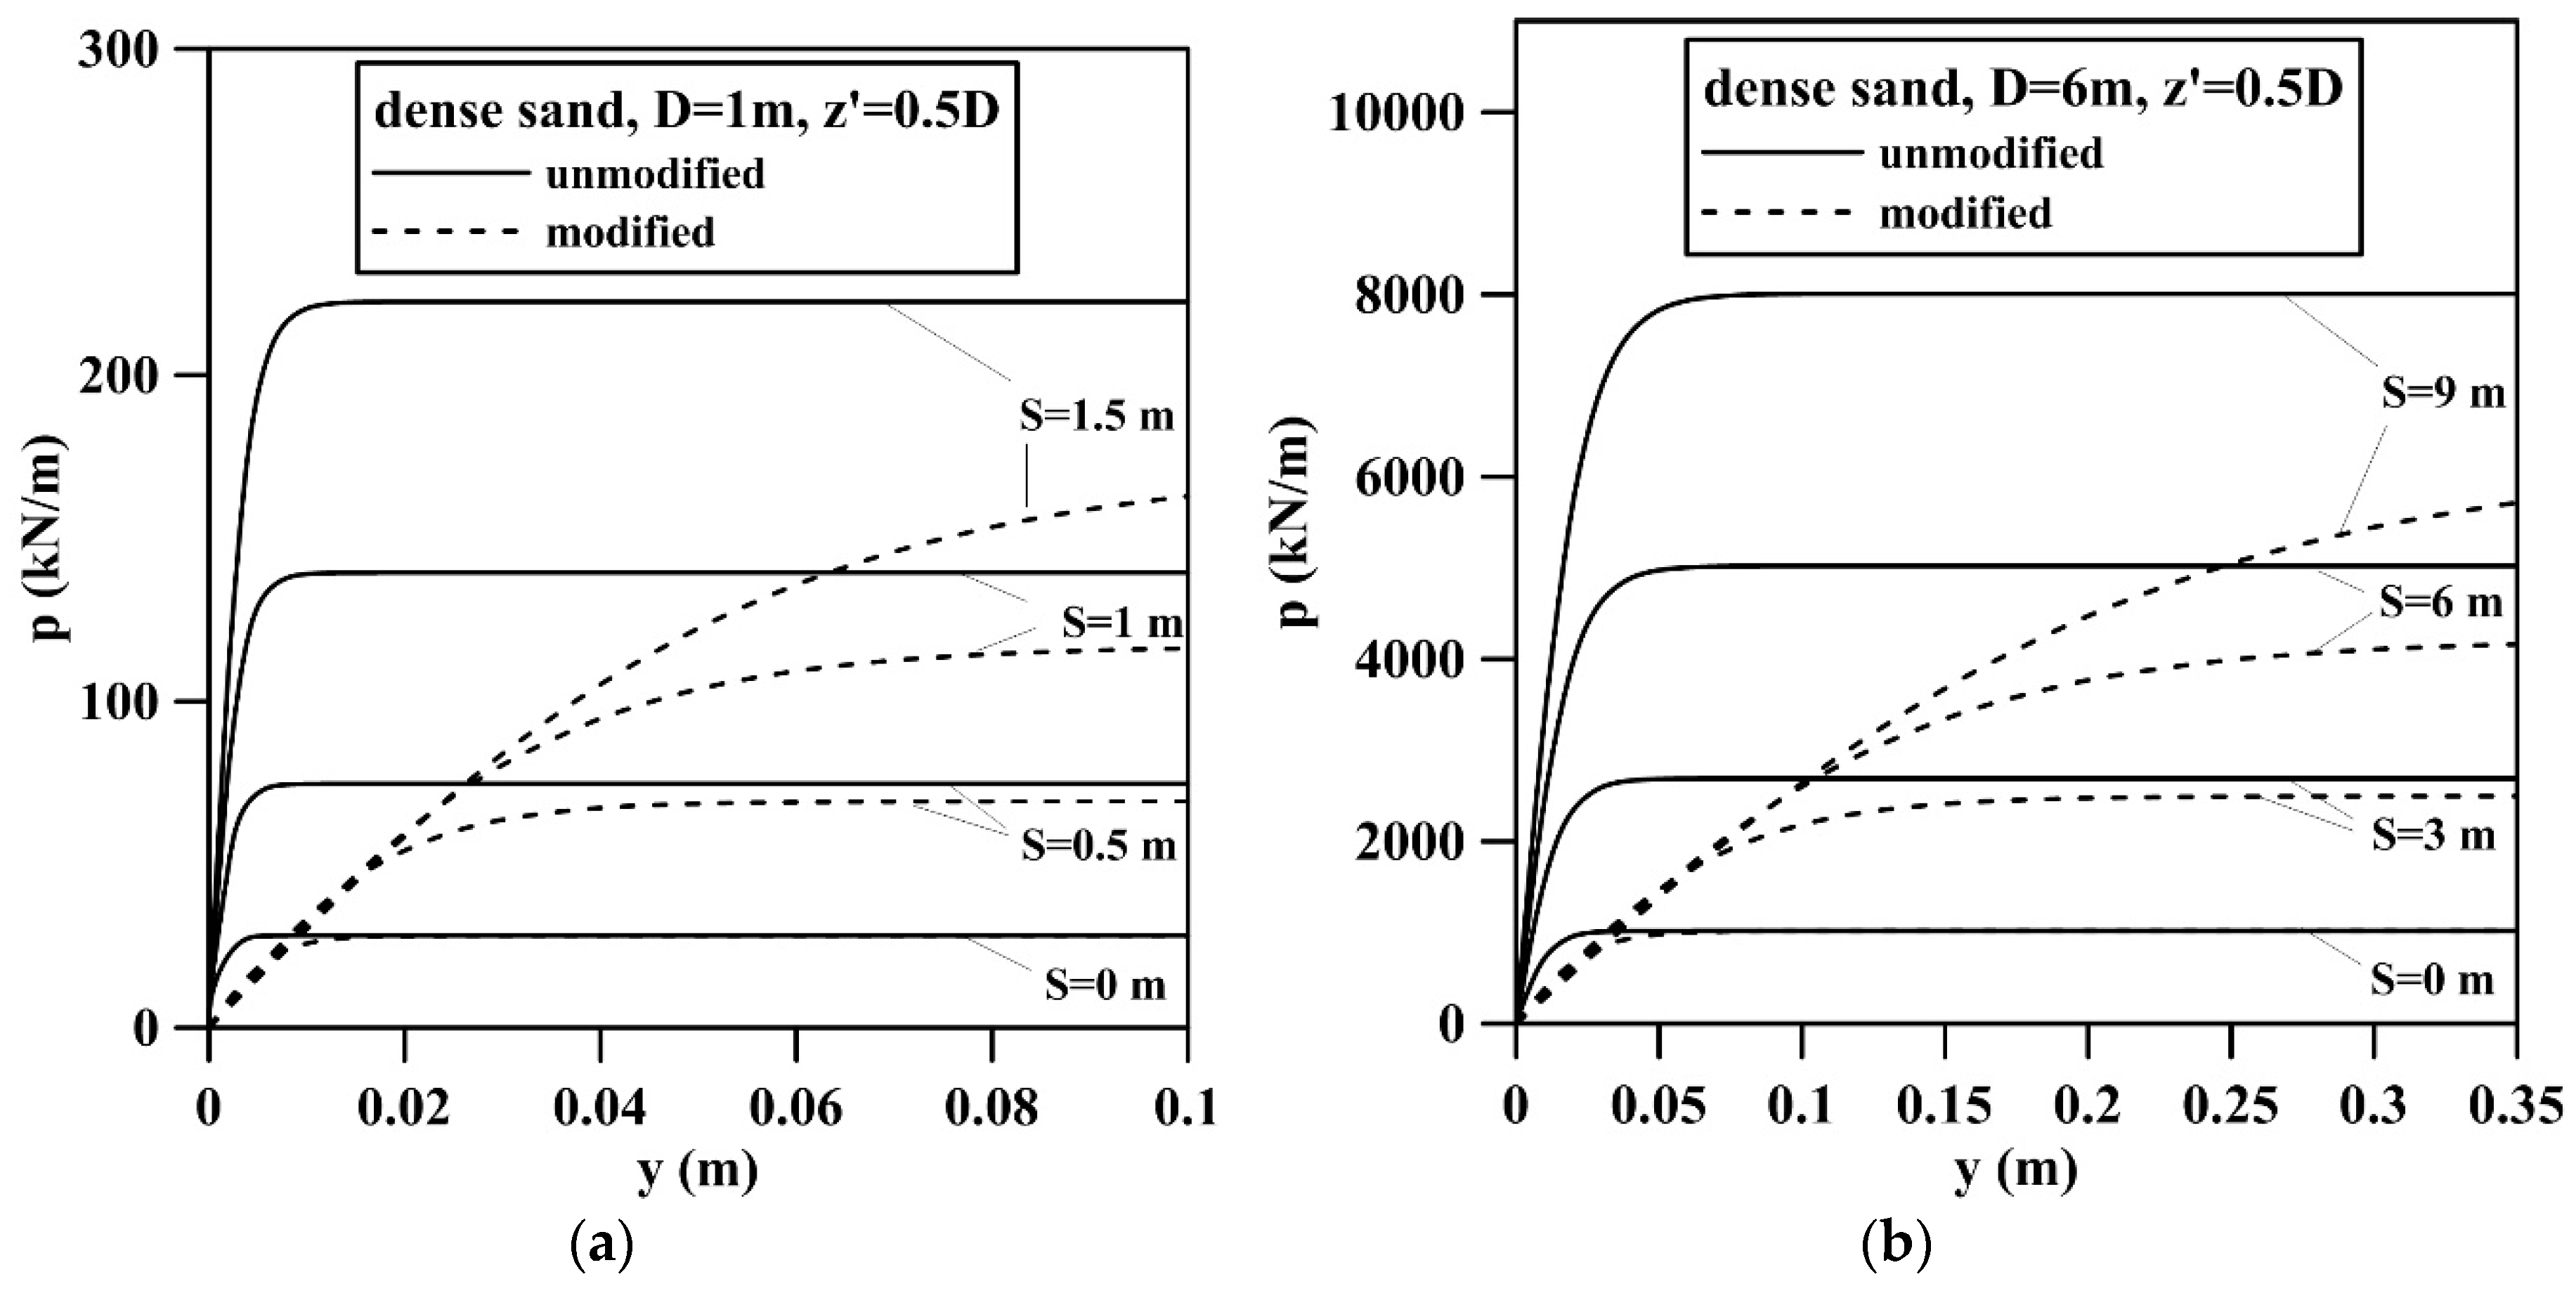
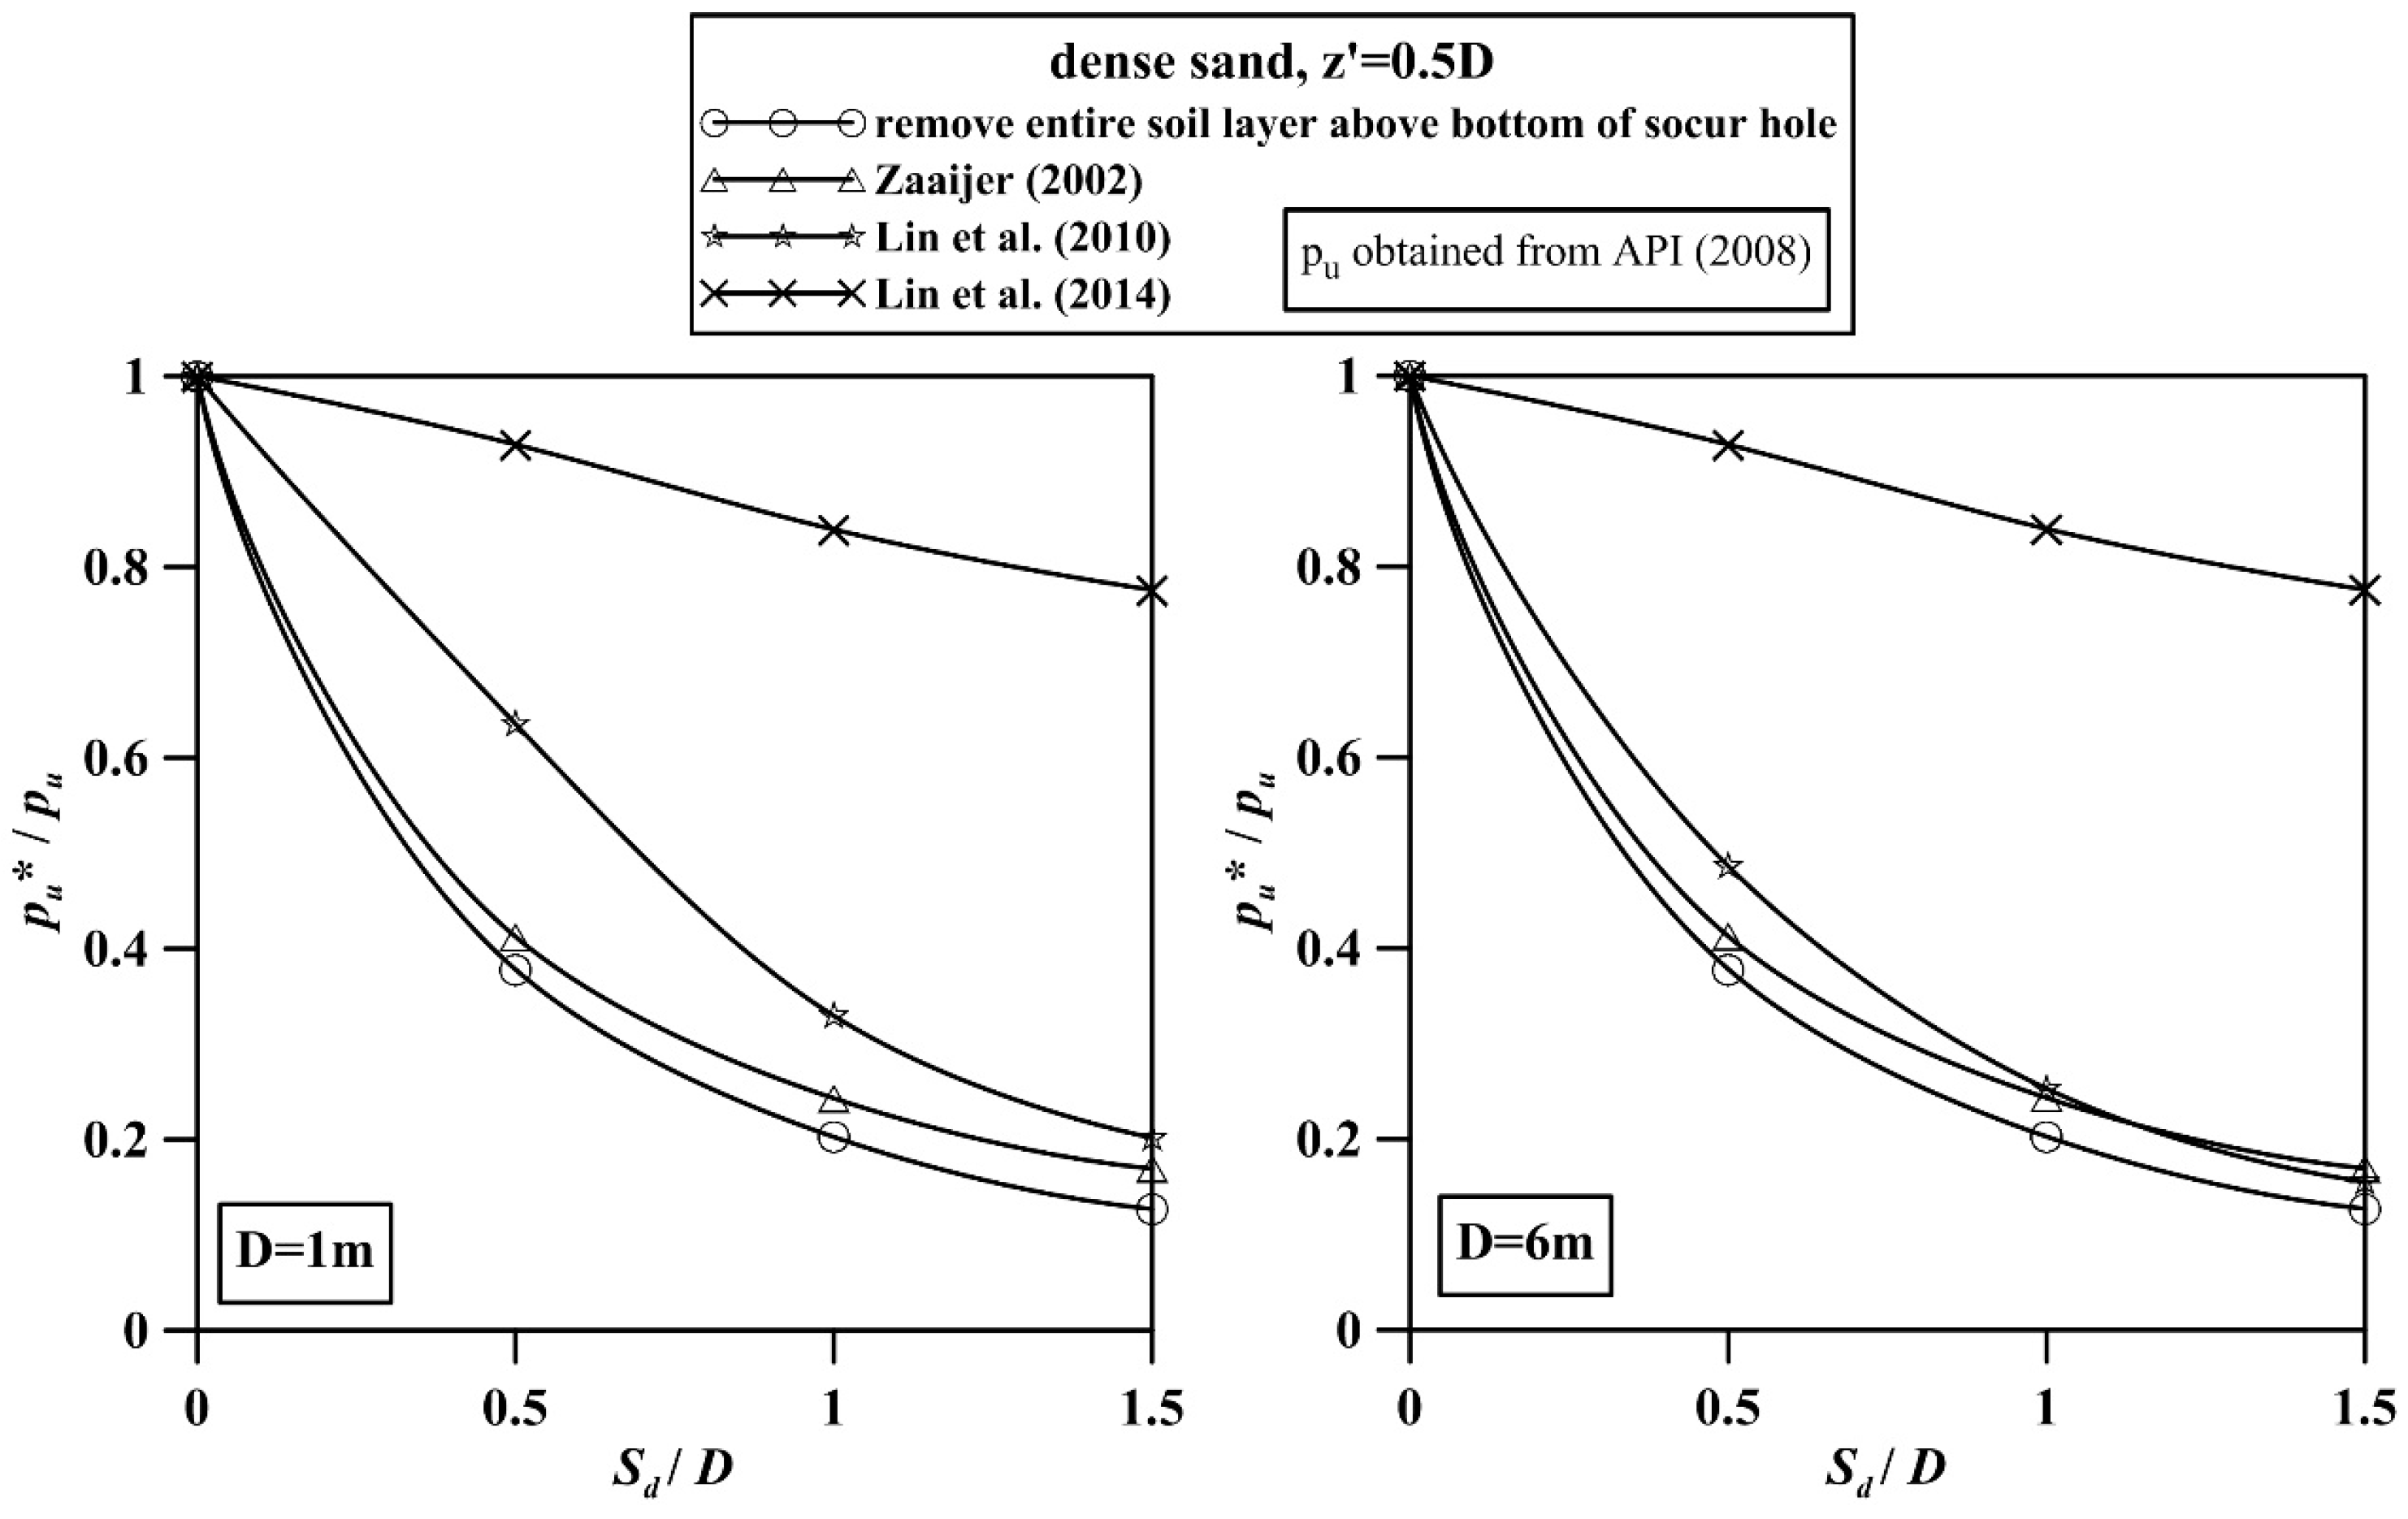
y curve reduced the lateral ultimate soil resistance at a specific depth around a pile.
Figure 5 shows the lateral ultimate soil resistance at depth of
below the bottom of scour hole for a monopile foundation with a diameter of 1
or 6
embedded in dense soil with various scour depths
. As shown in
Figure 5, after the scour soil layer was removed entirely, the lateral ultimate soil resistance was the most conservative. According to Zaaijer [
23] and Lin et al. [
24], only soil parameters were modified; therefore, the lateral ultimate soil resistance obtained was slightly greater than the lateral ultimate soil resistance after the entire scour soil layer was removed. In addition, the lateral ultimate soil resistance around the pile rapidly decreased as the scour depth increased. For the monopile (
), the
p-
y curve obtained with the methods of Zaaijer [
23] and Lin et al. [
24] was consistent with the
p-
y curve obtained after the entire scour soil layer was removed. In calculations done according to the model of Lin et al. [
25], the soil around the scour hole was included for calculation of the soil wedge at failure; therefore, after scour, the decrease of the lateral ultimate soil resistance around the pile was apparently smaller than the values obtained from other
p-
y curve modification methods. Qi et al. [
35] used the pile model test to simulate the load-displacement response for the local scour of a monopile and considered that the soil around the scour hole substantially enhanced the ultimate soil resistance per length near the ground surface. This view accorded with the approach of Lin et al. [
25]. Therefore, in this study, the method suggested by Lin et al. [
25] was used to modify the
p-
y curve for monopile foundations, and the influence of scour on the load-displacement response of monopile foundation was considered.


