Next Article in Journal
A Full Frequency-Dependent Cable Model for the Calculation of Fast Transients
Next Article in Special Issue
Correction: Hu, Z.; et al. Transport and Deposition of Carbon Nanoparticles in Saturated Porous Media. Energies 2017, 10, 1151
Previous Article in Journal
A Novel Observer for Lithium-Ion Battery State of Charge Estimation in Electric Vehicles Based on a Second-Order Equivalent Circuit Model
Previous Article in Special Issue
2D Numerical Simulation of Improving Wellbore Stability in Shale Using Nanoparticles Based Drilling Fluid
 
 
Correction published on 24 October 2017, see Energies 2017, 10(10), 1681.
Article

Transport and Deposition of Carbon Nanoparticles in Saturated Porous Media

1
School of Chemical and Process Engineering, University of Leeds, Leeds LS2 9JT, UK
2
School of Aeronautic Science and Engineering, Beihang University, Beijing 100191, China
*
Author to whom correspondence should be addressed.
Energies 2017, 10(8), 1151; https://doi.org/10.3390/en10081151
Submission received: 16 June 2017 / Revised: 31 July 2017 / Accepted: 2 August 2017 / Published: 5 August 2017
(This article belongs to the Special Issue Nanotechnology for Oil and Gas Applications)

Abstract

:
Carbon nanoparticles (CNPs) are becoming promising candidates for oil/gas applications due to their biocompatibility and size-dependent optical and electronic properties. Their applications, however, are always associated with the flow of nanoparticles inside a reservoir, i.e., a porous medium, where insufficient studies have been conducted. In this work, we synthesized CNPs with two different size categories in 200 nm carbon balls (CNP-200) and 5 nm carbon dots (CNP-5), via a hydrothermal carbonation process. Comprehensive experiments in packed glass bead columns, as well as mathematical simulations, were conducted to understand the transport and deposition of CNPs under various ionic strength, particle sizes and concentration conditions. Our results show that the retention of CNP-200 is highly sensitive to the salinity and particle concentrations, while both of them are unaffected in the transport of small CNP-5. Supplemented with Derjaguin-Landau-Verwey-Overbeek (DLVO) theory, the clean bed filtration theory with blocking effect can successfully fit the experimental breakthrough curves of CNP-200. However, the high breakthrough ability for CNP-5 regardless of ionic strength change is in conflict with the energy interactions predicted by traditional DLVO theory.

1. Introduction

The use of nanoparticles (NPs) for enhanced oil recovery (EOR) has received intensive attention since 2008, and much work has been conducted that can be generally categorized as: (i) the development of ‘contrast-agent’ type NPs to improve the detection limitation of seismic and EM techniques for better reservoir characterization [1,2,3]; (ii) the use of NPs as property modifiers, i.e., to alter rock wettability and interfacial tension at the oil/water interface in order to increase oil recovery rates [4,5,6,7]; and (iii) the use of NPs for conformance control such as nanoparticle-stabilized emulsions, and gelation materials to block the easy flow paths [8,9]. All these applications require nanoparticles to transport long distances in reservoir rocks with minimal retention. On the other hand, the widespread application of nanomaterials results in a large-scale deposition of particles in the environment with high possibilities of contamination. Understanding the mobility, sustainability [10] and final fate of these nanoparticles is of importance to reduce the environmental and health risks [3,10,11,12].
Carbon nanoparticles (CNPs) are emerging particles that have a wealth of advantages for oil/gas applications. For instance, there is no need to separate these particles from oil/gas products due to their intrinsic carbon-based components [13]. Some CNPs are biocompatible according to cell viability tests [14] and may minimize the contamination migrating from the environment to the biological chain. Retention and transport of CNPs in porous media has received considerable attention recently. For example, the retention and transport of dispersed aggregations of fullerene [15,16,17,18,19,20,21], graphene oxide nanoparticles [22,23,24] and carbon nanotubes [25,26,27] in saturated porous media have been studied. A broad range of factors that affect NPs’ retention and transport have been evaluated, such as flow velocity [15,19], NP’s surface potential [28], and the presence of organic species [18,29]. CNPs have also been used as NP cores to deliver probing materials into reservoir rocks. The oxidized carbon black (OCB)-based nanoparticles [30], Polyvinyl alcohol (PVA)-OCB, displayed good transport ability and stability in field rocks and selective release of hydrophobic compounds when contacting with hydrocarbon, but it suffered from stability problem with poor breakthrough efficiency at higher temperature (70 °C) and in positively charged dolomite rocks. To address these problems, Hwang et al. [2] chose sulfated PVA with appropriate molecular weight to keep the PVA-OCB NPs stable in high temperature, and also switched the NP core from OCB to a carboxyl group-functionalized carbon black (fCB) to improve its migration behavior in various porous media.
However, the investigations on nanoparticle migration in porous media to date are still largely incomplete, especially in the following three aspects: (i) the influence of ionic strength; (ii) the influence of particle size and concentration; and (iii) mathematical modelling of NP transport validated by reliable experimental data. Regarding the first aspect, the influence of ions, especially presence of divalent cations, which are abundant in oil reservoirs, on the particle transportation is unclear. While there is abundant research in terms of the effects of monovalent cation on the transport behavior of NPs [31], very limited attention was paid to the influence of divalent cations. It is expected that divalent cations Mg2+, Ca2+ and Ba2+ will be more effective in destabilizing nanoparticles, causing more agglomeration than the monovalent cation Na+ [32,33], reducing the transportation rate.
Regarding the second aspect, systematic studies on the effect of particle size on NPs’ transport remain limited [34]. A general conclusion from previous investigations on size effects using TiO2, Al2O3, and Fe0 NPs is that larger NPs have higher retention rates [11,28,34,35]. Nonetheless, it is difficult to draw conclusions because TiO2, Al2O3, and Fe0 NPs are easily agglomerated, affected by different ionic strength present [36,37]. It is unclear whether, how, and to what extent particle size plays a role in their transport. It has been suggested that there is a critical particle size for inorganic particle, i.e., 30 nm, that the properties for particle smaller than this value become significantly different to particle larger than this value. Studies of NP transport with stable particle sizes smaller than 30 nm are almost nonexistent [31]. There are also some inconsistent reports on the effect of particle concentration on the retention and transport of NPs. For instance, it was once reported that a large inlet concentration leads to increased relative colloidal retention at ionic strength (IS) > 0.1 mM [38]. However, the study from Wang et al. [31] showed that higher input concentration Co results in larger surface coverage θ for both low (1 mM) and high (100 mM) ionic strength, which is consistent with the research from Kasel et al. [39].
Finally, most current theoretical description of NPs’ retention and transport is limited to classical clean bed filtration theory (CFT) supplemented by DLVO theory. For instance, Li et al. [14] found that the measured attachment/sticking efficiency for fullerene deposition and transport, is more than one order of magnitude larger than the theoretical value predicted by DLVO theory. Conventional DLVO theory uses approximate expressions, i.e., the Derjaguin approximation [40], to represent electric double layer interaction. The assumptions under which the approximations hold [41], i.e., h γ N (i.e., separation distance is much less than NPs’ radius) and κh ≫ 1 (i.e., separation distance is much larger than the Debye length), however, may not be applicable to small NPs. Because inorganic NPs, especially those with sizes < 30 nm, may have unique properties (e.g., large specific surface area, exponentially increased surface atoms, and high interfacial reactivity) [12] or are smaller than the thickness of electrical double layer [42], the applicability of the DLVO theory for describing their agglomeration, retention, and transport behaviour of small particles should be revisited [43].
This work aims to advance our understanding of nanoparticle transport in saturated porous media by addressing the issues outlined above. Different sized carbon nanoparticles were synthesized, and a series of saturated column experiments were conducted to investigate: (1) the effect of background electrolyte solutions with divalent cation on particle transport behavior, for both large and small particle; (2) the effect of concentration and particle size on NPs’ retention and transport in saturated porous media.; and (3) the applicability of the DLVO theory to describe the deposition of CNPs on sand surfaces.

2. Material and Methods

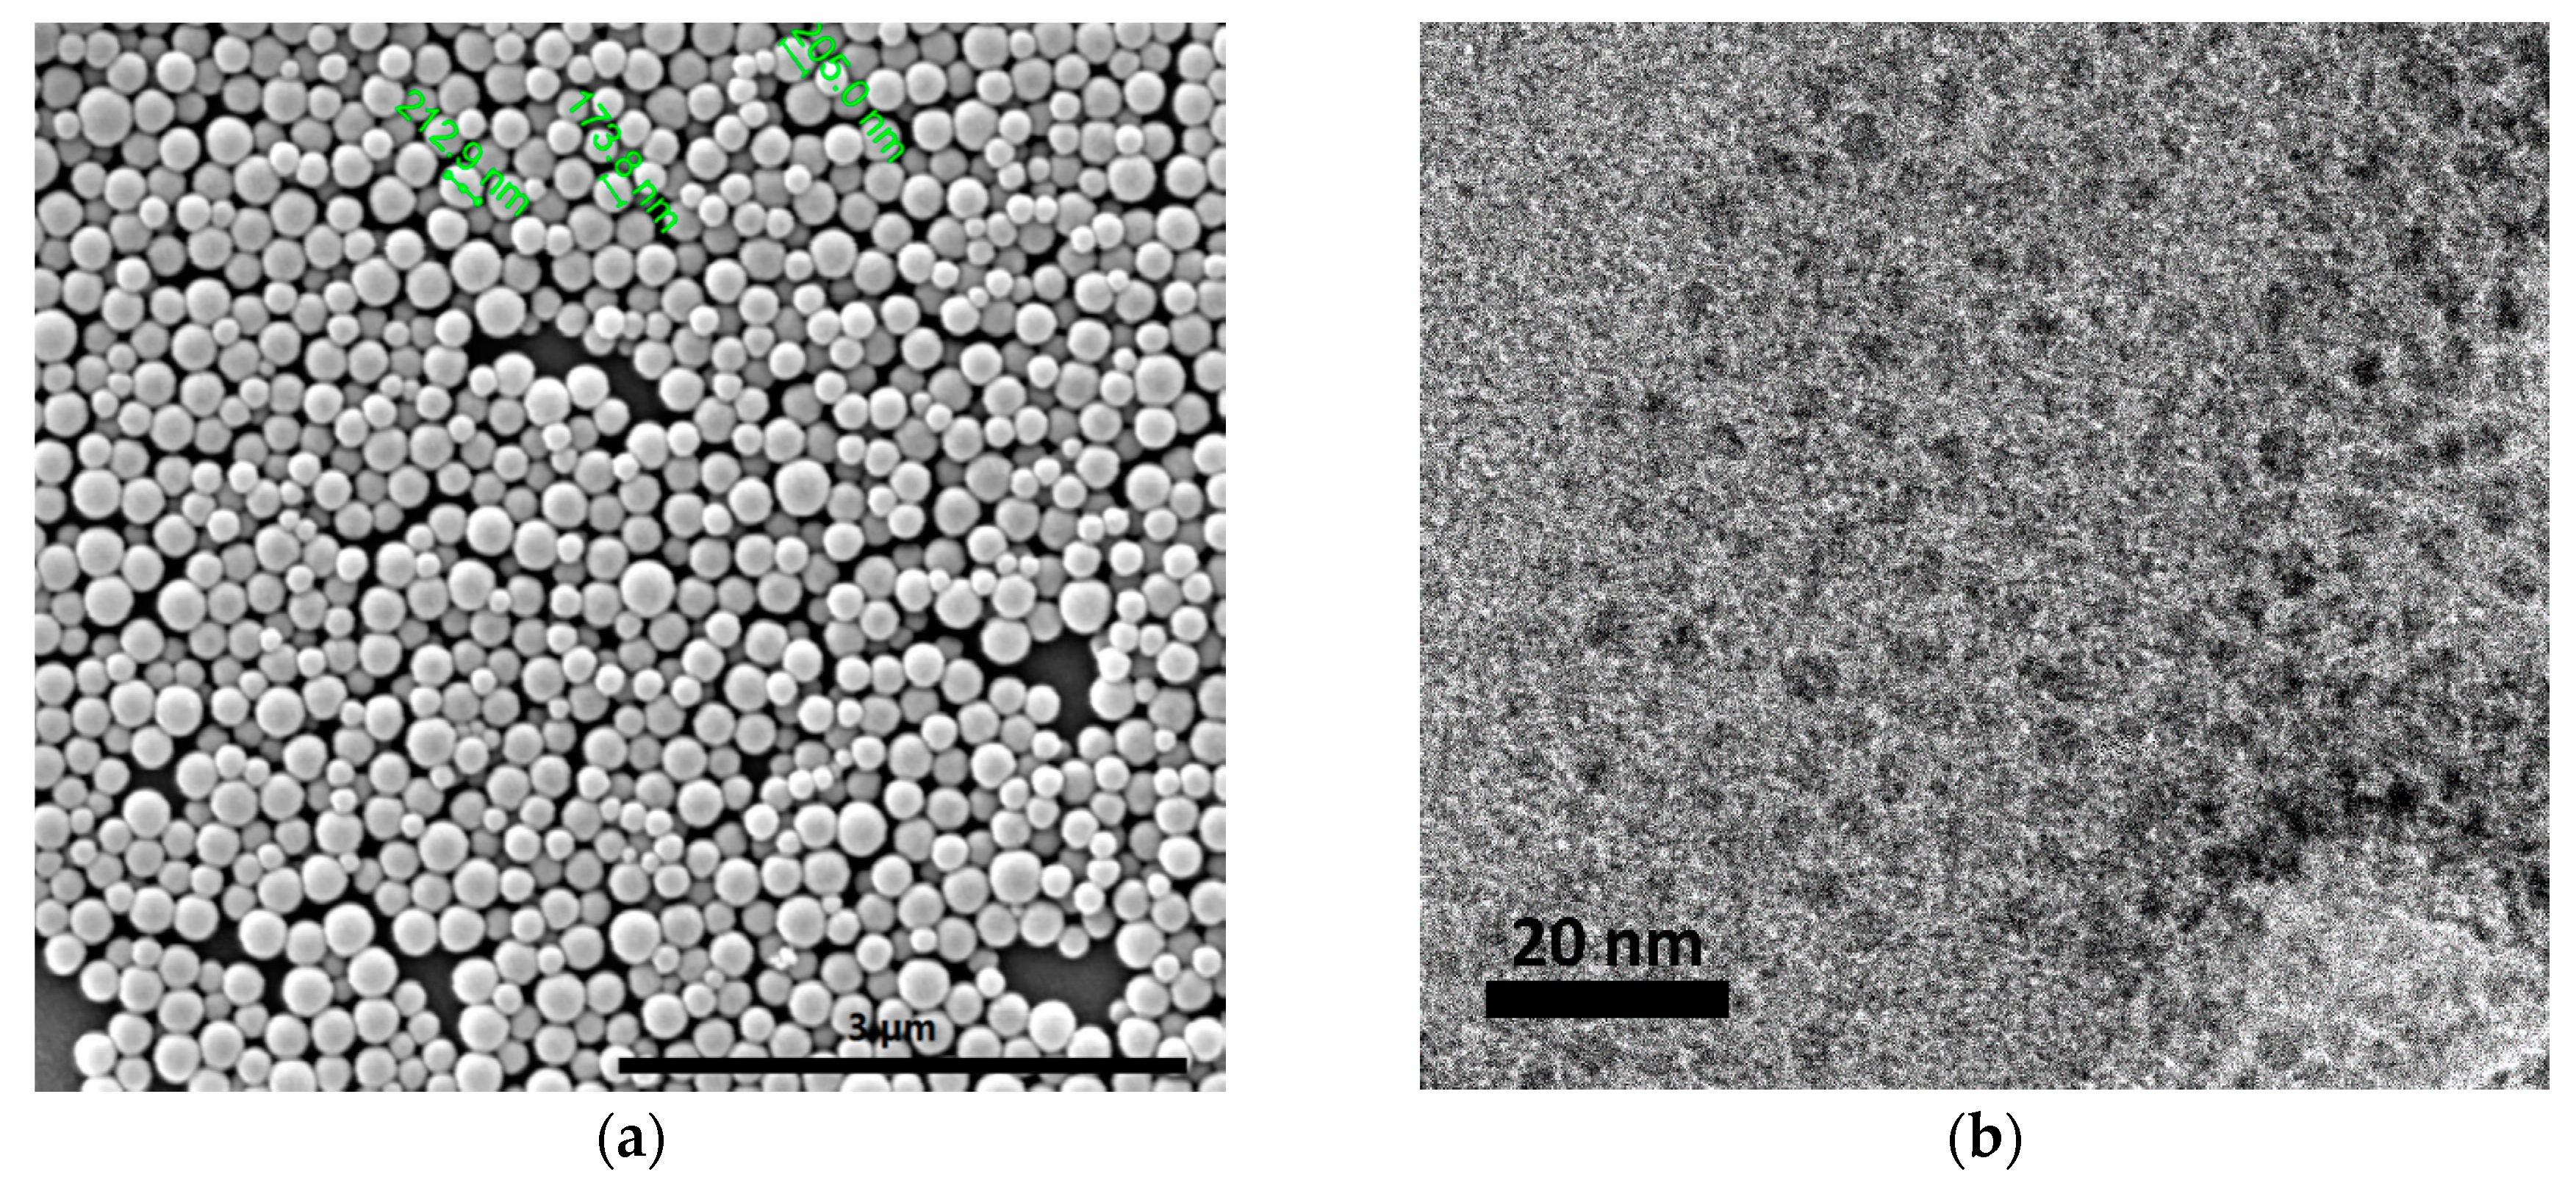
2.1. CNPs Synthesis and Characterization

A simplified hydrothermal reaction is used to produce carbon nanoparticles [14,44]. First, 0.2 g of D-(+)-xylose (C5H10O5) was dissolved in 20 mL of DI-water; then, the solution was transferred into a Teflon-lined, stainless steel autoclave. After being heated at 200 °C for 6 h and then cooled to room temperature, the obtained solution was centrifuged at 10,000 r/min for 30 min to get the solid black carbon ball precipitated. Afterward, the supernatant containing carbon dots was filtered using a standard syringe filter.
The morphologies of fabricated CNPs were detected by scanning electron microscopy (SEM, Quanta 650 FEG-ESEM, FEI, Leeds LEMAS center, Leeds, UK) and transmission electron microscopy (TEM, FEI Tecnai TF20, Leeds LEMAS center, Leeds, UK). The results show that carbon balls (CNP-200) possesses a relatively uniform size distribution with particle size ~200 nm, while carbon dots (CNP-5) are extremely small size, falling into the category of ~5 nm (Figure 1). The hydrodynamic particle sizes and zeta potential for CNPs under various salinities were also characterized by dynamic light scattering (DLS) method (Zetasizer Nano ZS, Malvern Instruments Ltd., Malvern, UK), as shown in Section 2.5.2. The zeta potential of carbon ball in distilled water was measured to be −43 mV.
Particle concentrations were determined by UV-Vis spectrophotometer (UV-1800, Shimadzu, Kyoto, Japan) based on Beers-lambert law at the wavelength of 320 nm for 200 nm particle and 310 nm for the 5 nm, respectively [45].

2.2. Design of Porous Media

Prior to use, the glass beads (Sigma Aldrich, Gillingham, Dorset, UK) with 30–40 mesh size fraction (425–600 µm) were thoroughly cleaned by using a sequential acid wash, DI water rinse, and oven-drying according to reference [20], to remove the metal oxides and other impurities. To ensure that the porous matrix in glass column packed with constant permeability and porosity, a rigorous packing procedures was followed. Firstly, the dried glass beads were saturated in distilled water, and then deposited into glass column in 1.5 cm increments with 0.5–1 cm thick of water on the top of glass beads. After adding each layer of 1.5 cm glass beads, vibration was applied for 3 min using a vortex mixer. During vibration, proper strength was applied on the top of the column by one hand to keep it vertical and prevent particles from bouncing. The packing length in column was 7–7.1 cm due to the addition of O-ring blockers on both ends. To prevent glass beads from flowing out of column, the inlet and column end blocker were fitted with three layers and two layers of filter paper (Whatman, Grade 2, Sigma Aldrich, Gillingham, UK), respectively. The permeability was computed as 97 ± 10 mD using the differential pressure measured based on Darcy’s law. The porosity of glass beads matrix ( ε ) was determined by extracting and oven-drying the glass beads in the already packed glass column. Due to the strict packing procedure, a constant pore volume of 12.8 ± 0.18 mL and corresponding porosity of 38.02% were obtained for different packings.

2.3. Solution Chemistry

Deionized (DI) water and ACS grade CaCl2 were used for the preparation of background solutions at desired IS. NP suspensions were prepared by mixing the background solutions with NPs’ stock suspensions and degassed thoroughly. Solution pH was thereafter buffered to 7 ± 0.3 by using NaOH/HCl solution at concentrated (0.1 M) and diluted (0.01 M) condition.

2.4. Column Study

A total of 10 experiments were conducted in pre-saturated packed glass columns to evaluate the transport and retention properties of CNPs under the influence of Ca2+. The column apparatus consisted of a piston pump (Series I, Scientific Systems, Inc., State College, PA, USA) equipped with pulse damper to minimize the pulsation, a syringe pump (KDS-410-CE, kdScientific, Holliston, MA, USA), UV-spectrophotometer (UV 1800, Shimadzu, Kyoto, Japan), a borosilicate glass column (10 cm L × 2.44 cm i.d., Glass solutions, Blacktrace Holding Ltd., Royston, UK), differential pressure transducer (150 psi, Omega, Manchester, UK) and a by-pass route to remove the bubble presenting in tubing.
Saline water containing 1 mM–2 M CaCl2 was introduced into the column by the piston pump in an up-flow mode at a Darcy velocity of 11.2 m/d, for at least 20 pore volumes (PV). Before injecting it into the column, the pH of the saline water was adjusted to 7 ± 0.3. After complete saturation of the column with saline water, 3 PV of nanoparticle suspension was introduced into the column at a Darcy velocity of 0.5 mL/min, which was followed by 3 PV of particle-free solution at the same flow rate. This flow rate corresponds to a pore-water velocity ( v p ) of 2.56 m/d, representing a column residence time of 0.25 h. The Reynolds number (Re) was equal to 0.0186, which is several orders of magnitude below the limit of laminar flow in packed beds (Re < 10) [46].
The column outlet was connected to a flow cell inserted into the UV-Vis spectrophotometer, whereby the effluent particle concentration was monitored in real-time. After each transport experiment, the porous media packed in column was dissected into seven sections with 1 cm increments for each, and the retained CNPs were extracted by addition of 10 g of DI water, followed by ultrasonication for 20 min. Experimental conditions for the 10 column studies were summarized in Table 1.

2.5. Mathematical Modelling Method

2.5.1. Nanoparticle Transport Modelling

The transport and retention properties in saline-saturated porous media can be described by 1-D advection-dispersion-reaction (ADR) equation [20]:
C t + ρ b ε S t = D H 2 C x 2 v p C x
where C is the concentration of nanoparticle in solution (mol/m3), S is the concentration of particle attached to solid phase (mol/kg), t is injection time (s), x is the distance parallel to flow direction (m), ρ b is the solid bulk density (kg/m3), D H is the hydrodynamic dispersion coefficient (m2/s), ε is the porosity of solid phase and v p is the pore fluids velocity (cm/min).
The kinetics of CNPs attachment was expressed as follows:
ρ b ε S t = k a t t ψ C ρ b ε k d e t S
where k a t t is the coefficient of particle attachment, k d e t is the coefficienct of particle detachment (equal to 0 for irreversible retention). The function ψ in the attachment term is a generic term that depends on the attachment mechanisms that have to be modelled (i.e., clean bed, blocking, ripening, etc.). The following attachment mechanisms are considered to simulate the experimental results in this paper.
• Clean bed filtration (CFT) model. ψ = 1
The rate of carbon NPs attachment k a t t can be expressed as below [31,47]:
k a t t = v p L ln ( C o C )
where L is column length (cm), C o is input NPs’ number concentration (mol/m3), and C is effluent NPs’ concentration (mol/m3) which was represented by steady-state concentration in the present study. The obtained k a t t was then used to calculate the attachment/sticking efficiency ( α ) using the following equation:
α = 2 k a t t d c 3 ( 1 ε ) v p η o
where d c is the diameter of sand grain, α represents the sticking efficiency (the ratio of particle remaining attached to glass beads to all particles colliding with collector), and η o is the single collector efficiency which can be expressed using the following correlation [48]:
η o = 2.4 A s 1 / 3 N R 0.081 N P e 0.715 N v d w 0.052 + 0.55 A s N R 1.675 N A 0.125 + 0.22 N R 0.24 N G 1.11 N v d w 0.053
where As can be calculated from Equation (5), and the other parameters in Equation (5) has been fully defined in ref. [48]:
A s = 2 ( 1 γ 5 ) 2 3 γ + 3 r 5 2 γ 6
where γ = ( 1 ε ) 1 / 3 . According to [45], the experimental sticking efficiency α e x p can also be obtained from the following expression derived for the case where particles move across a packed bed of identical collectors with length L:
α e x p = 4 3 d c ( 1 θ w ) L η o In ( C / C o )
where C/Co is the normalized NP concentration acquired from the experimental breakthrough curves (BTCs). From [49], the average value of C/Co between PVs of 1.8 to 2.0 was applied for normalization, where the initial (clean bed) phase of NP elution exists.
• Clean bed with site blocking model, where a maximum retention capacity S m a x was added to constrain the NPs deposition [19], given by the equations below:
ψ = S m a x S S m a x
When S m a x is much larger than S, ψ reduced to 1 and Equation (2) will converge to the clean bead filtration model. Initially there are no nanoparticles associated with the solid phase and the site blocking term is unity. With increasing nanoparticle attachment, S approaches S m a x and the site blocking term approaches 0. Where, k a t t is calculated as same when ψ equals to 1.
It has been found that hydrodynamic properties, such as flow velocity, particle size, collector size, and grain geometry, can strongly influence the S m a x , and it is consistent with the concept of ‘shadow zone’ proposed by Ko and Elimelech [50]. Cullen et al. [51] also applied this correlation for CNPs mobility at the field scale. The S m a x enables the effluent concentration to increase equal to the influent concentration as injecting enough pore volume (PV) of suspension. However, the modified theory with only irreversible deposition will miss the attachment features, such as delay or tailing edge during particle-free post injection of the breakthrough curve.
• Kinetic Langmuir effect model. A model combining site blocking (straining) and detachment is formally equivalent to Kinetic Langmuir effect model. In this case, k a t t is a first order straining coefficient and ψ is a dimensionless straining function [52]:
k a t t = 3.32 ( d c d 50 ) 1.23 ε 3.46
ψ = ( 1 + x d 50 , s ) β s t r
where x is the length of the path of the particles in the porous media (i.e., in laboratory experiments the distance from the inlet point), and β s t r is a fitting parameter which controls the shape of the particle spatial distribution. Experimental evidence has shown that β s t r can be taken equal to 0.432 with good results [53].

2.5.2. Derjaguin-Landau-Verwey-Overbeek (DLVO) Interactions Energy Profiles

The nanoparticle deposition in porous media is conceptualized as a two-step process consisting of particle transport to the vicinity of glass beads surface, followed by attachment [19].The transport process is controlled by the models described in Section 2.5.1, while the particle attachment process is governed by the interaction forces between particle and grain surface, which is controlled by the DLVO theory.
In classic DLVO theory, the Van der Waals interactions are computed using the formulation from Gregory (1981), which is valid for a single species of mono-valent electrolyte at a separation distance h (between the two surfaces) lower than 0.1 times of the sphere diameter. For large particle CNP-200, the interaction energies between CNP the solid surface were calculated based on the DLVO theory by Equations (11) and (12). A Hamaker constant of 4.71 × 10⁻²¹ J was estimated based on a C60-C60 Hamaker number of 7.5 × 10⁻²⁰. The zeta potentials and hydrodynamic sized measured for CNP-200, CNP-5 and glass beads were summarized in Table 2 and Table 3.
Particle-Collect   interaction : A V D W = A d c 6 h ( 1 + 14 h λ )
Particle-Particle   interaction : A V D W = A d c 12 h ( 1 + 14 h λ )
For small particle CNP-5, the VDW and EDL interaction potential are calculated by the equations proposed by Guzman et al. [28], which are applicable to nanoparticles with small separation distance, i.e., similar to the particle radius without the need of the Derjaguin approximation:
Φ V D W = A H 6 ( γ N h + γ N h + 2 a + l n ( h h + 2 a ) )
Φ E D L = π ε o ε r κ ( ζ s 2 + ζ p 2 ) 0 a ( c o t h [ κ ( h + a a 1 ( r / a ) a ) ] + c o t h [ κ ( h + a + a 1 ( r / a ) 2 ) ] + 2 ζ s ζ p ( ζ s 2 + ζ p 2 ) { c s c h [ κ ( h + a a 1 ( r / a ) a ) ] c s c h [ κ ( h + a + a 1 ( r / a ) 2 ) ] } ) r   d r
κ 1 = ( ε o ε r k B T 2 e 2 1000 I c N A ) 0.5
where, ε o is free space permittivity (F/m), ε r is relative permittivity, κ is inverse of Debye length (nm−1), ζ s and ζ p are surface potentials of sphere and plate, respectively, and are usually approximated as zeta-potentials [41], h is minimum surface-to-surface separation distance (nm), and A is non-retarded Hamaker constant (6.3 × 10⁻²¹ J).

3. Results and Discussion

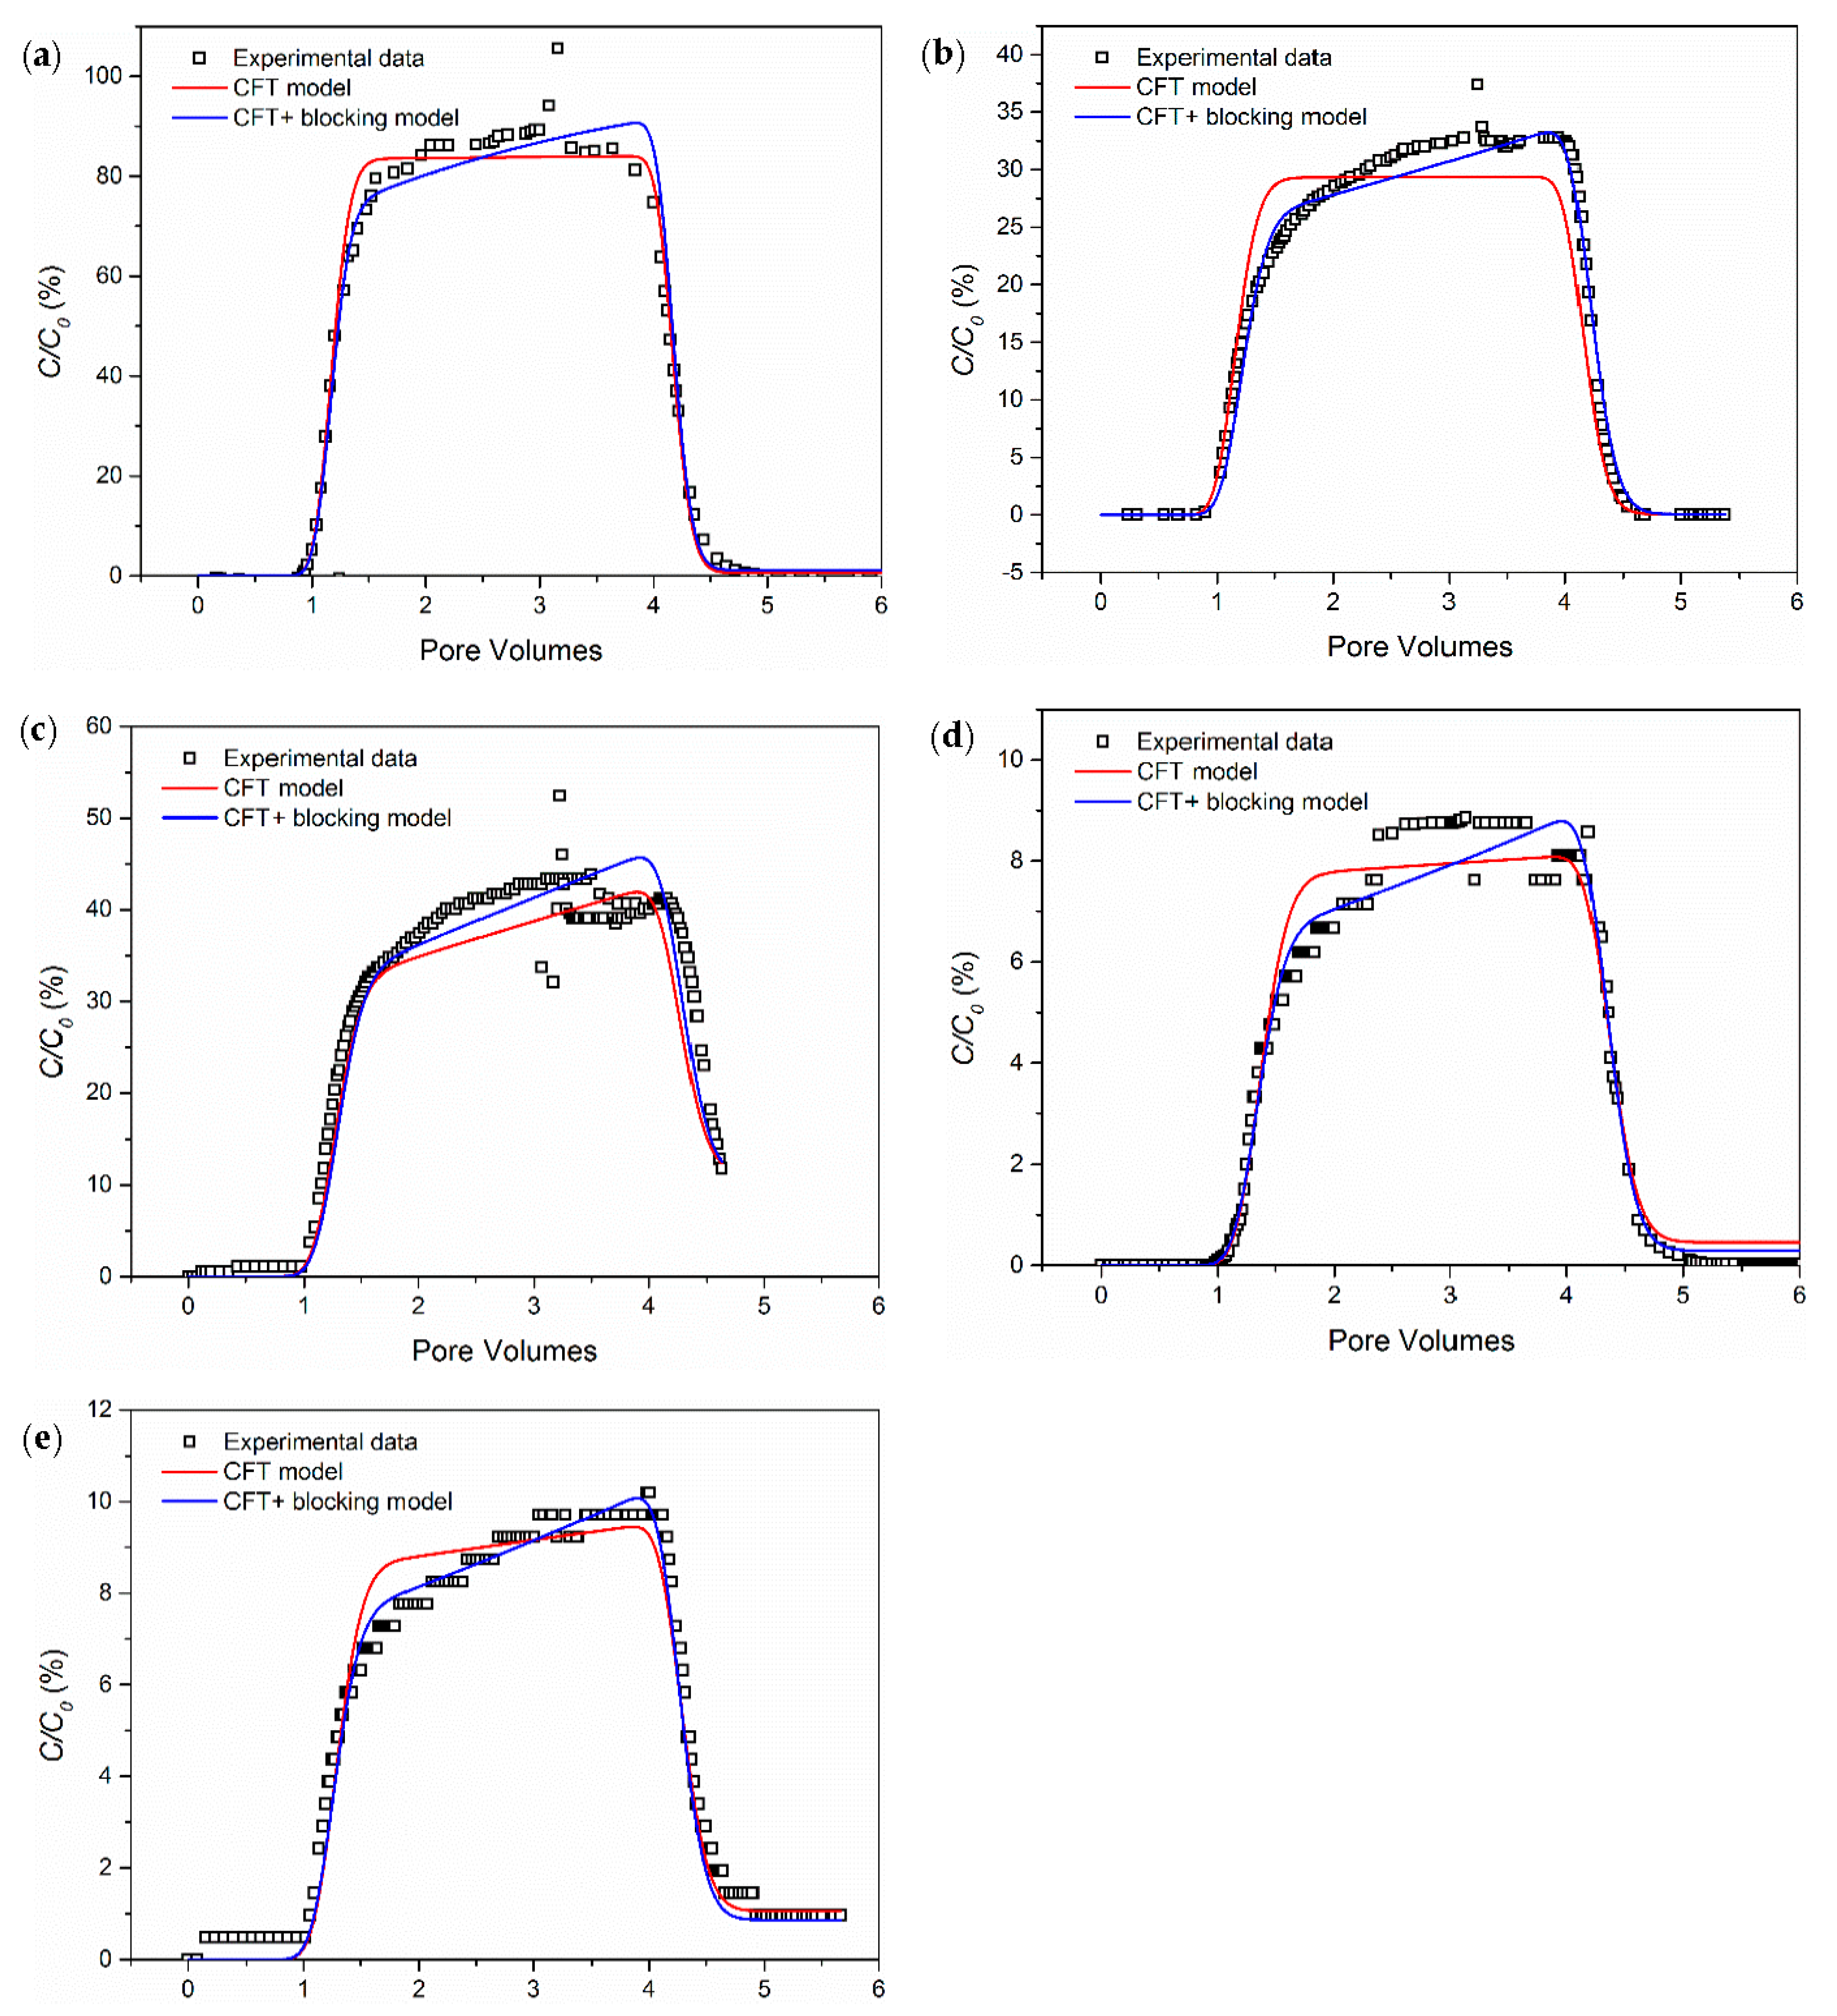
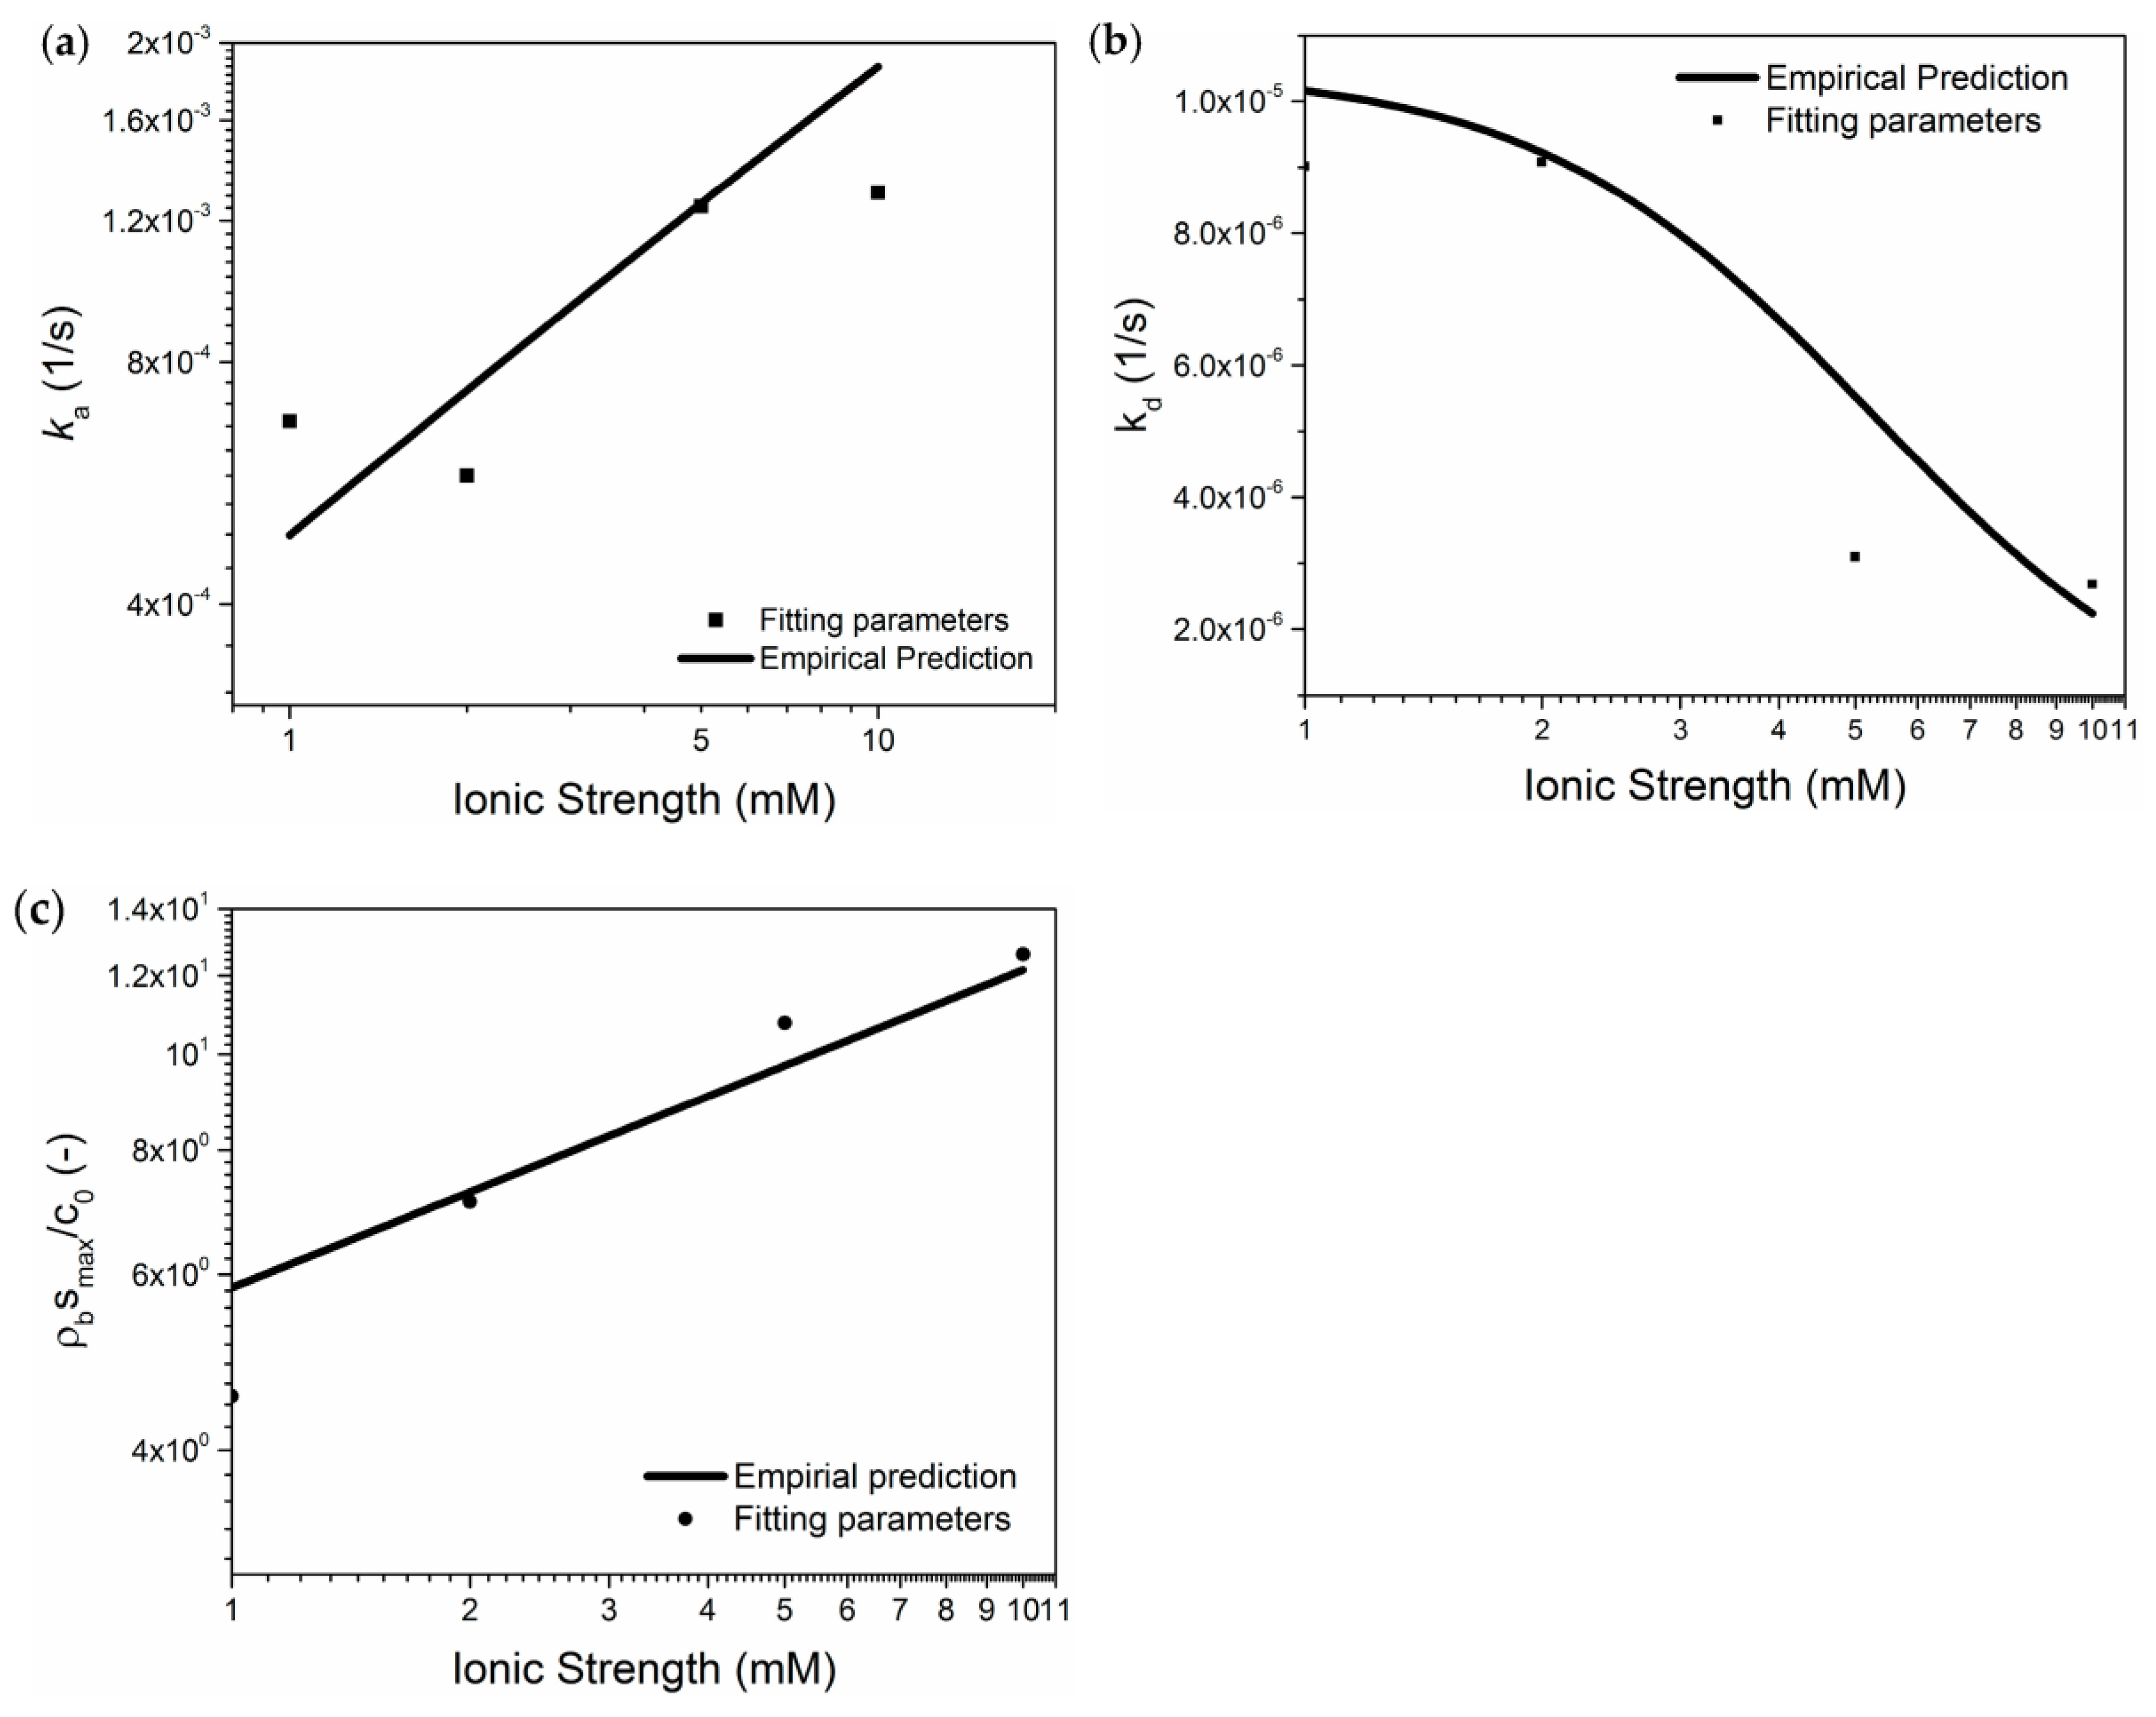
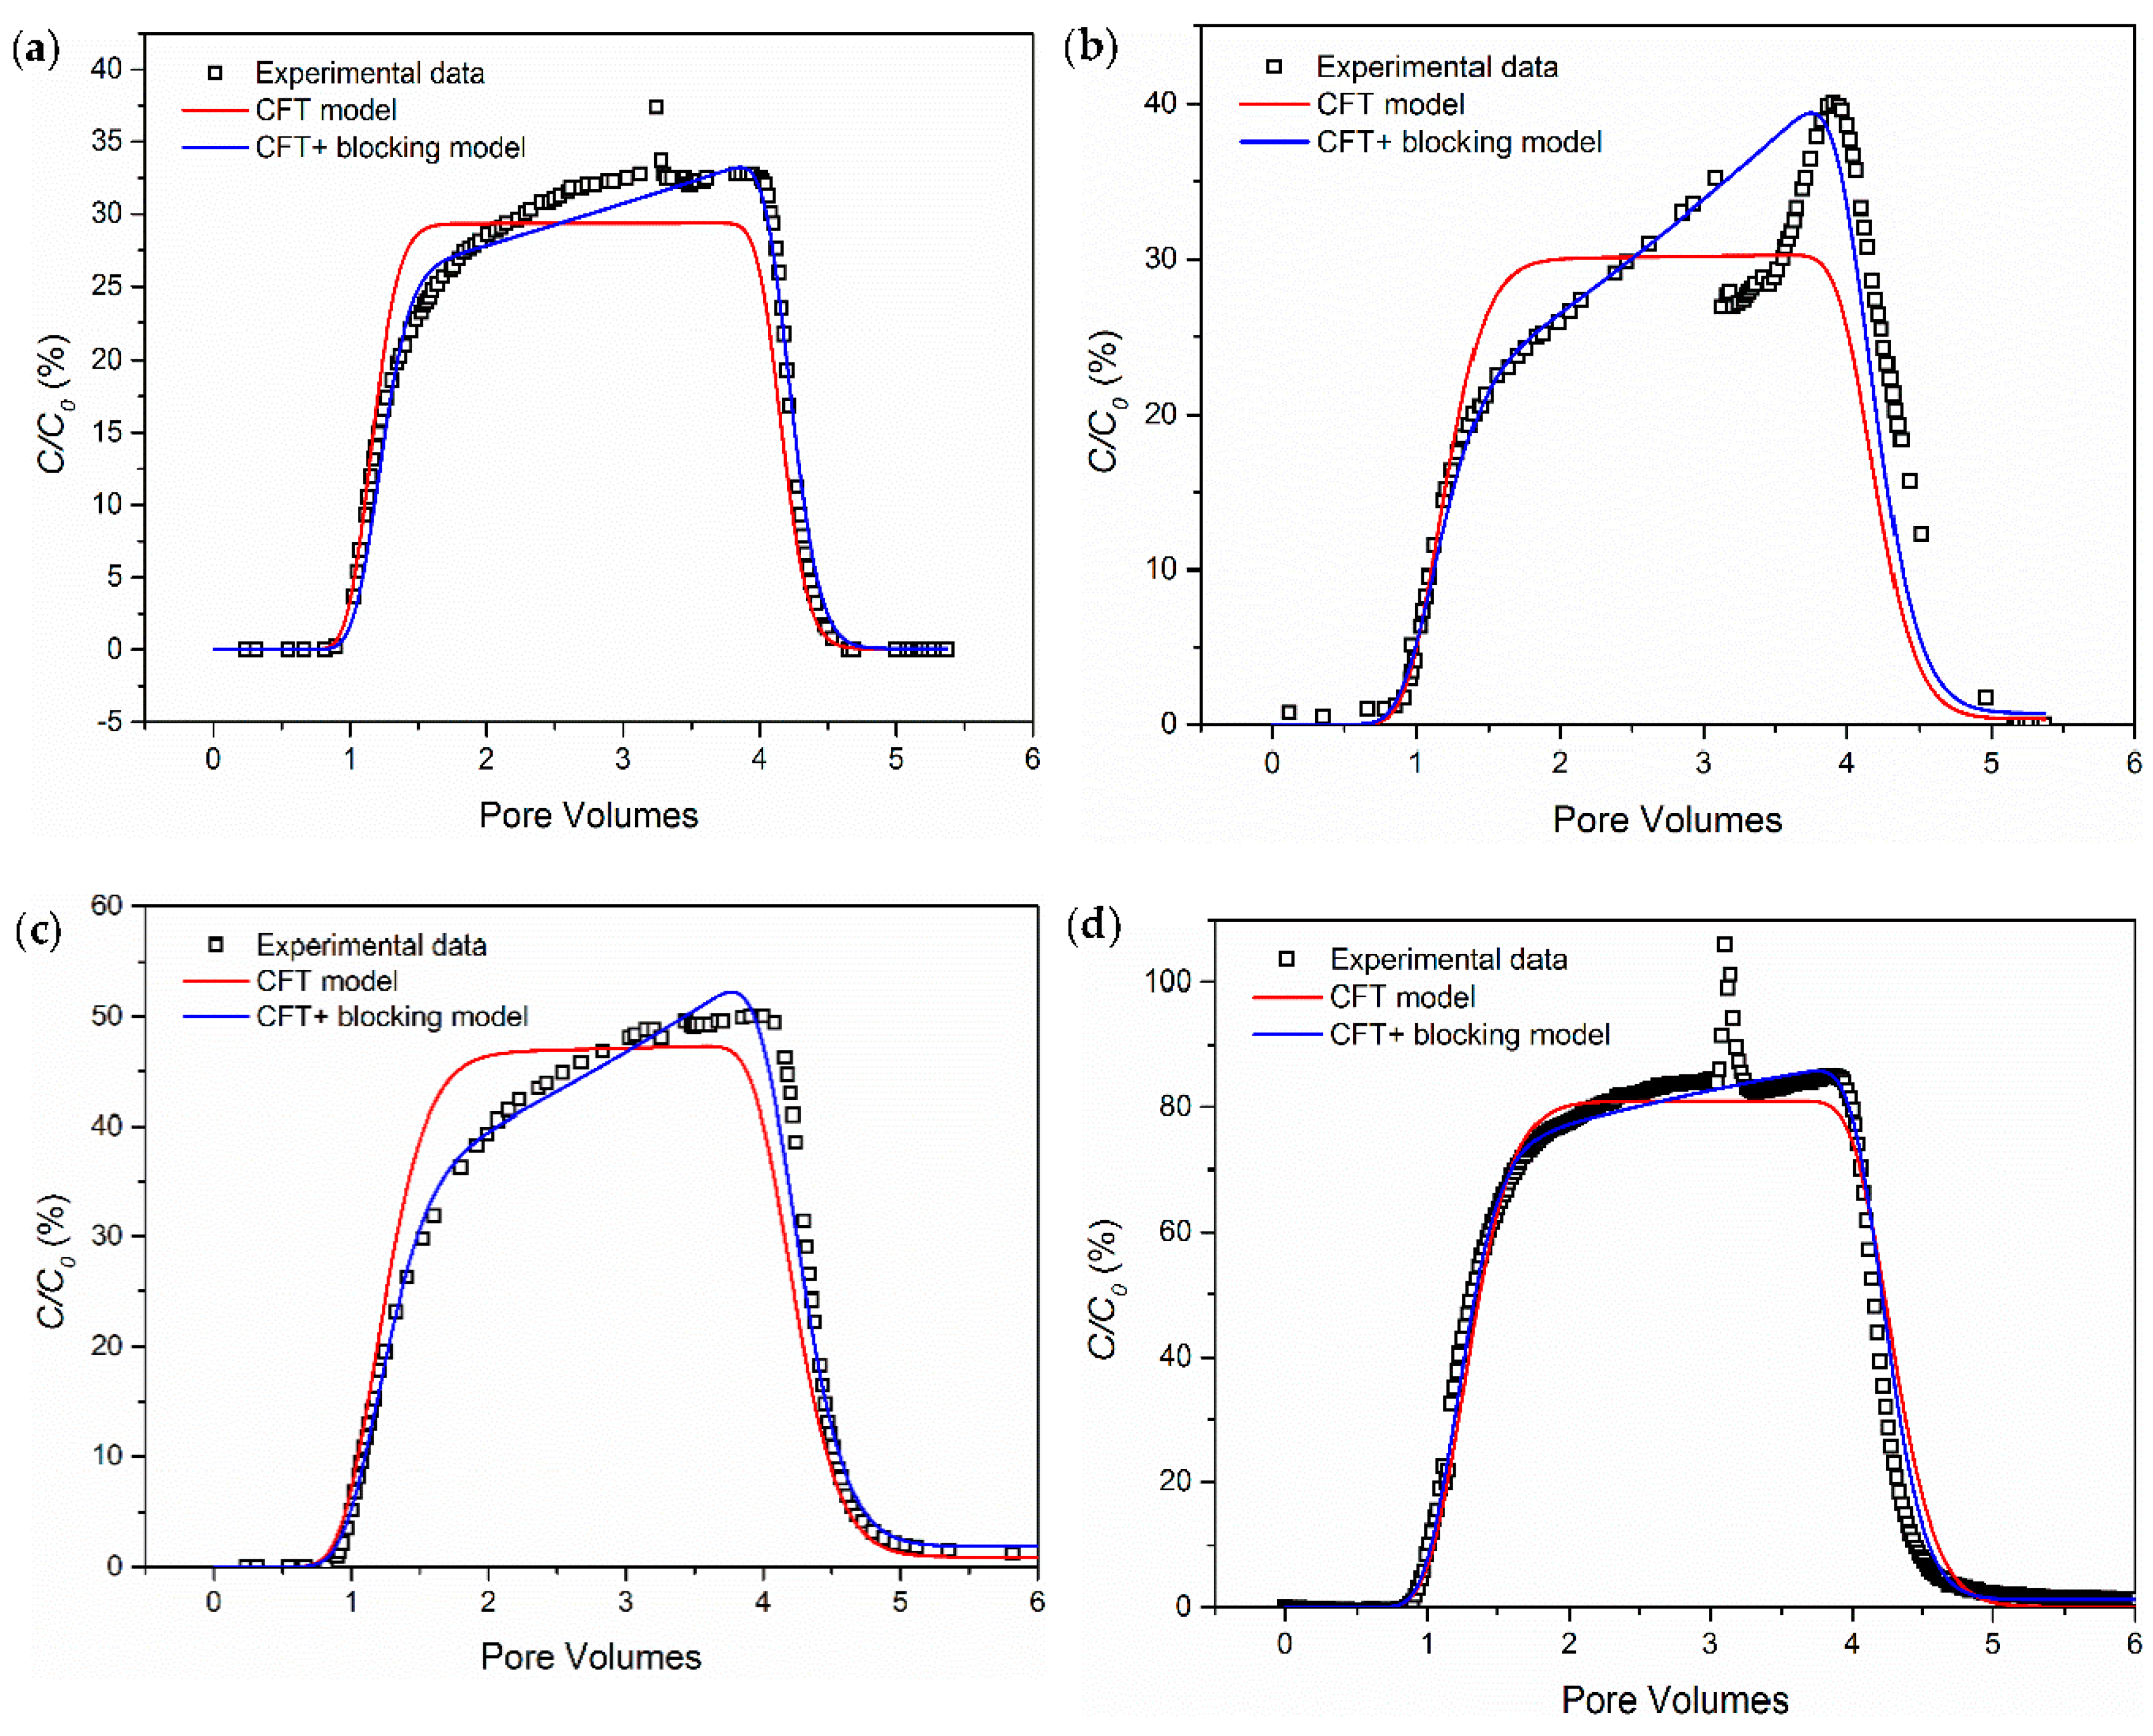
3.1. The Influence of Ionic Strength

Using CNP-200 (3.2 ppm) as the example, the breakthrough curves as salt concentrations varying from 0.001 mM (DI water) to 10 mM are presented in Figure 2. No delay is observed for the breakthrough time, which is contrary to the observation in [48,49]. As expected, in the case of DI water, the breakthrough curve (BTC) is steep and the peak effluent concentration reaches the maximum value in a very short time, but with increasing ionic strength, the maximum ability to break through is decreased from ~90% for DI water to ~9.5% at 10 mM electrolyte background.
Considering the large particle size (~200 nm), both CFT and CFT blocking effects are employed to simulate particle transport in porous media as shown in Figure 2. The modified filtration theory (blocking model) successfully matches most of the experimental effluent histories and their retention with large NP diameter. From both experimental BTCs and ADR simulation, it is clear that salinity has a strong influence on the breakthrough ability of CNP-200 in porous medium. This can be understood from two aspects. First, the calculations in Figure 3 show that increasing CaCl2 concentration tends to increase the attachment efficiency and consequently facilitate the deposition rate coefficient and maximum retention capacity S m a x , which is quantitatively consistent with the literature result [54]. Then, according to DLVO theory, increasing CaCl2 concentration reduces the repulsion force between nanoparticles significantly, as shown Section 3.4. Thus, the higher salinity causes the formation of large-size aggregates, which will increase the chance of physical retention, such as gravitational sedimentation, interception and straining. In addition, the repulsion between NPs and glass beads is weakened due to the increase of ionic strength, which increases the chance of physic interception. Therefore, both colloid filtration theory and DLVO support the experiment results.
Three nanoparticle transport parameters and the fitted model curves are also plotted in Figure 3 to appreciate their trend as a function of ionic strength (exp. G1–G5). The maximum retention capacity s m a x is reported as a dimensionless parameter maximum number of particles per unit dry mass of glass grains ρ b s m a x / c o .The functional relationship prediction properly simulates the trend of parameters (Figure 3c).
As shown in Figure 3, the higher value of k a t t at a high CaCl2 concentration was likely due to a deeper secondary energy minimum or smaller repulsion force between CNPs and glass beads, resulting in higher solid phase migration of particle [55,56]. The larger value of ρ b S m a x / c o at higher ionic strength was due to larger localized favourable sites, produced by cation bridging, for deposition. This research is consisted with study from Wang et al. [31]. Higher particle concentration induce a higher surface coverage, which means a higher S m a x .

3.2. The Influence of Concentration

Different concentrations of CNP-200 were used to investigate the influence of concentration on the break-through performance at an ionic strength of 1 mM CaCl2, as shown in Figure 4. For all concentrations, a steeper rise is observed from ~1 PV, followed by a gradual increase to the maximum relative concentration. For lower concentration injections (from 3.1 ppm to 6.4 ppm), the maximum or plateau concentrations are not achieved after injecting 3 PV of CNP-200. In addition, the middle portion (2–3 PV) of the BTCs exhibits similar gradual climbing shape, irrespective of input concentration, suggesting that the capacity of the solid phase to retain CNP-200 has not been exceeded for the concentration applied. However, for the highest concentration (8.0 ppm), the breakthrough concentration nearly approaches the maximum ability and plateaus after 2 PV, which indicates that the maximum retention ability is reached. That means the surface coverage at specific time (e.g., 2 PV) of collectors is increasing with NPs concentration. This observation is supported by the equations developed in ref [31], where the surface coverage is proportional to C o .
Similar to Figure 2, the CFT with blocking mode can successfully fit the experimental data, whereas the unmodified CFT model shows some deviation. This means that the pre-deposition particle on the surface of glass beads could prevent the continuous deposition of NPs on site according to the definition of blocking model [57], namely S < S m a x . The maximum density of retained particles on collector grain surfaces could be a monolayer, considering the high zeta potential among CNPs at 1 mM. The BTCs of CNP-200 (Figure 4) show that the values of steady-state effluent concentration ( C / C o ) increase with C o , suggesting that higher C o led to lower relative retention.
The current work shows that the particle retention is very sensitive to the nanoparticle concentration. Only two-folder increase shows remarkable difference in breakthrough behavior, which is different from the study of ref. [31], where the differences were reported when two-order-of-magnitude increase was applied for NPs concentration. The possible reason behind this is owing to the fact that the particle size applied in this paper (~200 nm) is much higher than the particle size in the reference study (52 nm and 8 nm).

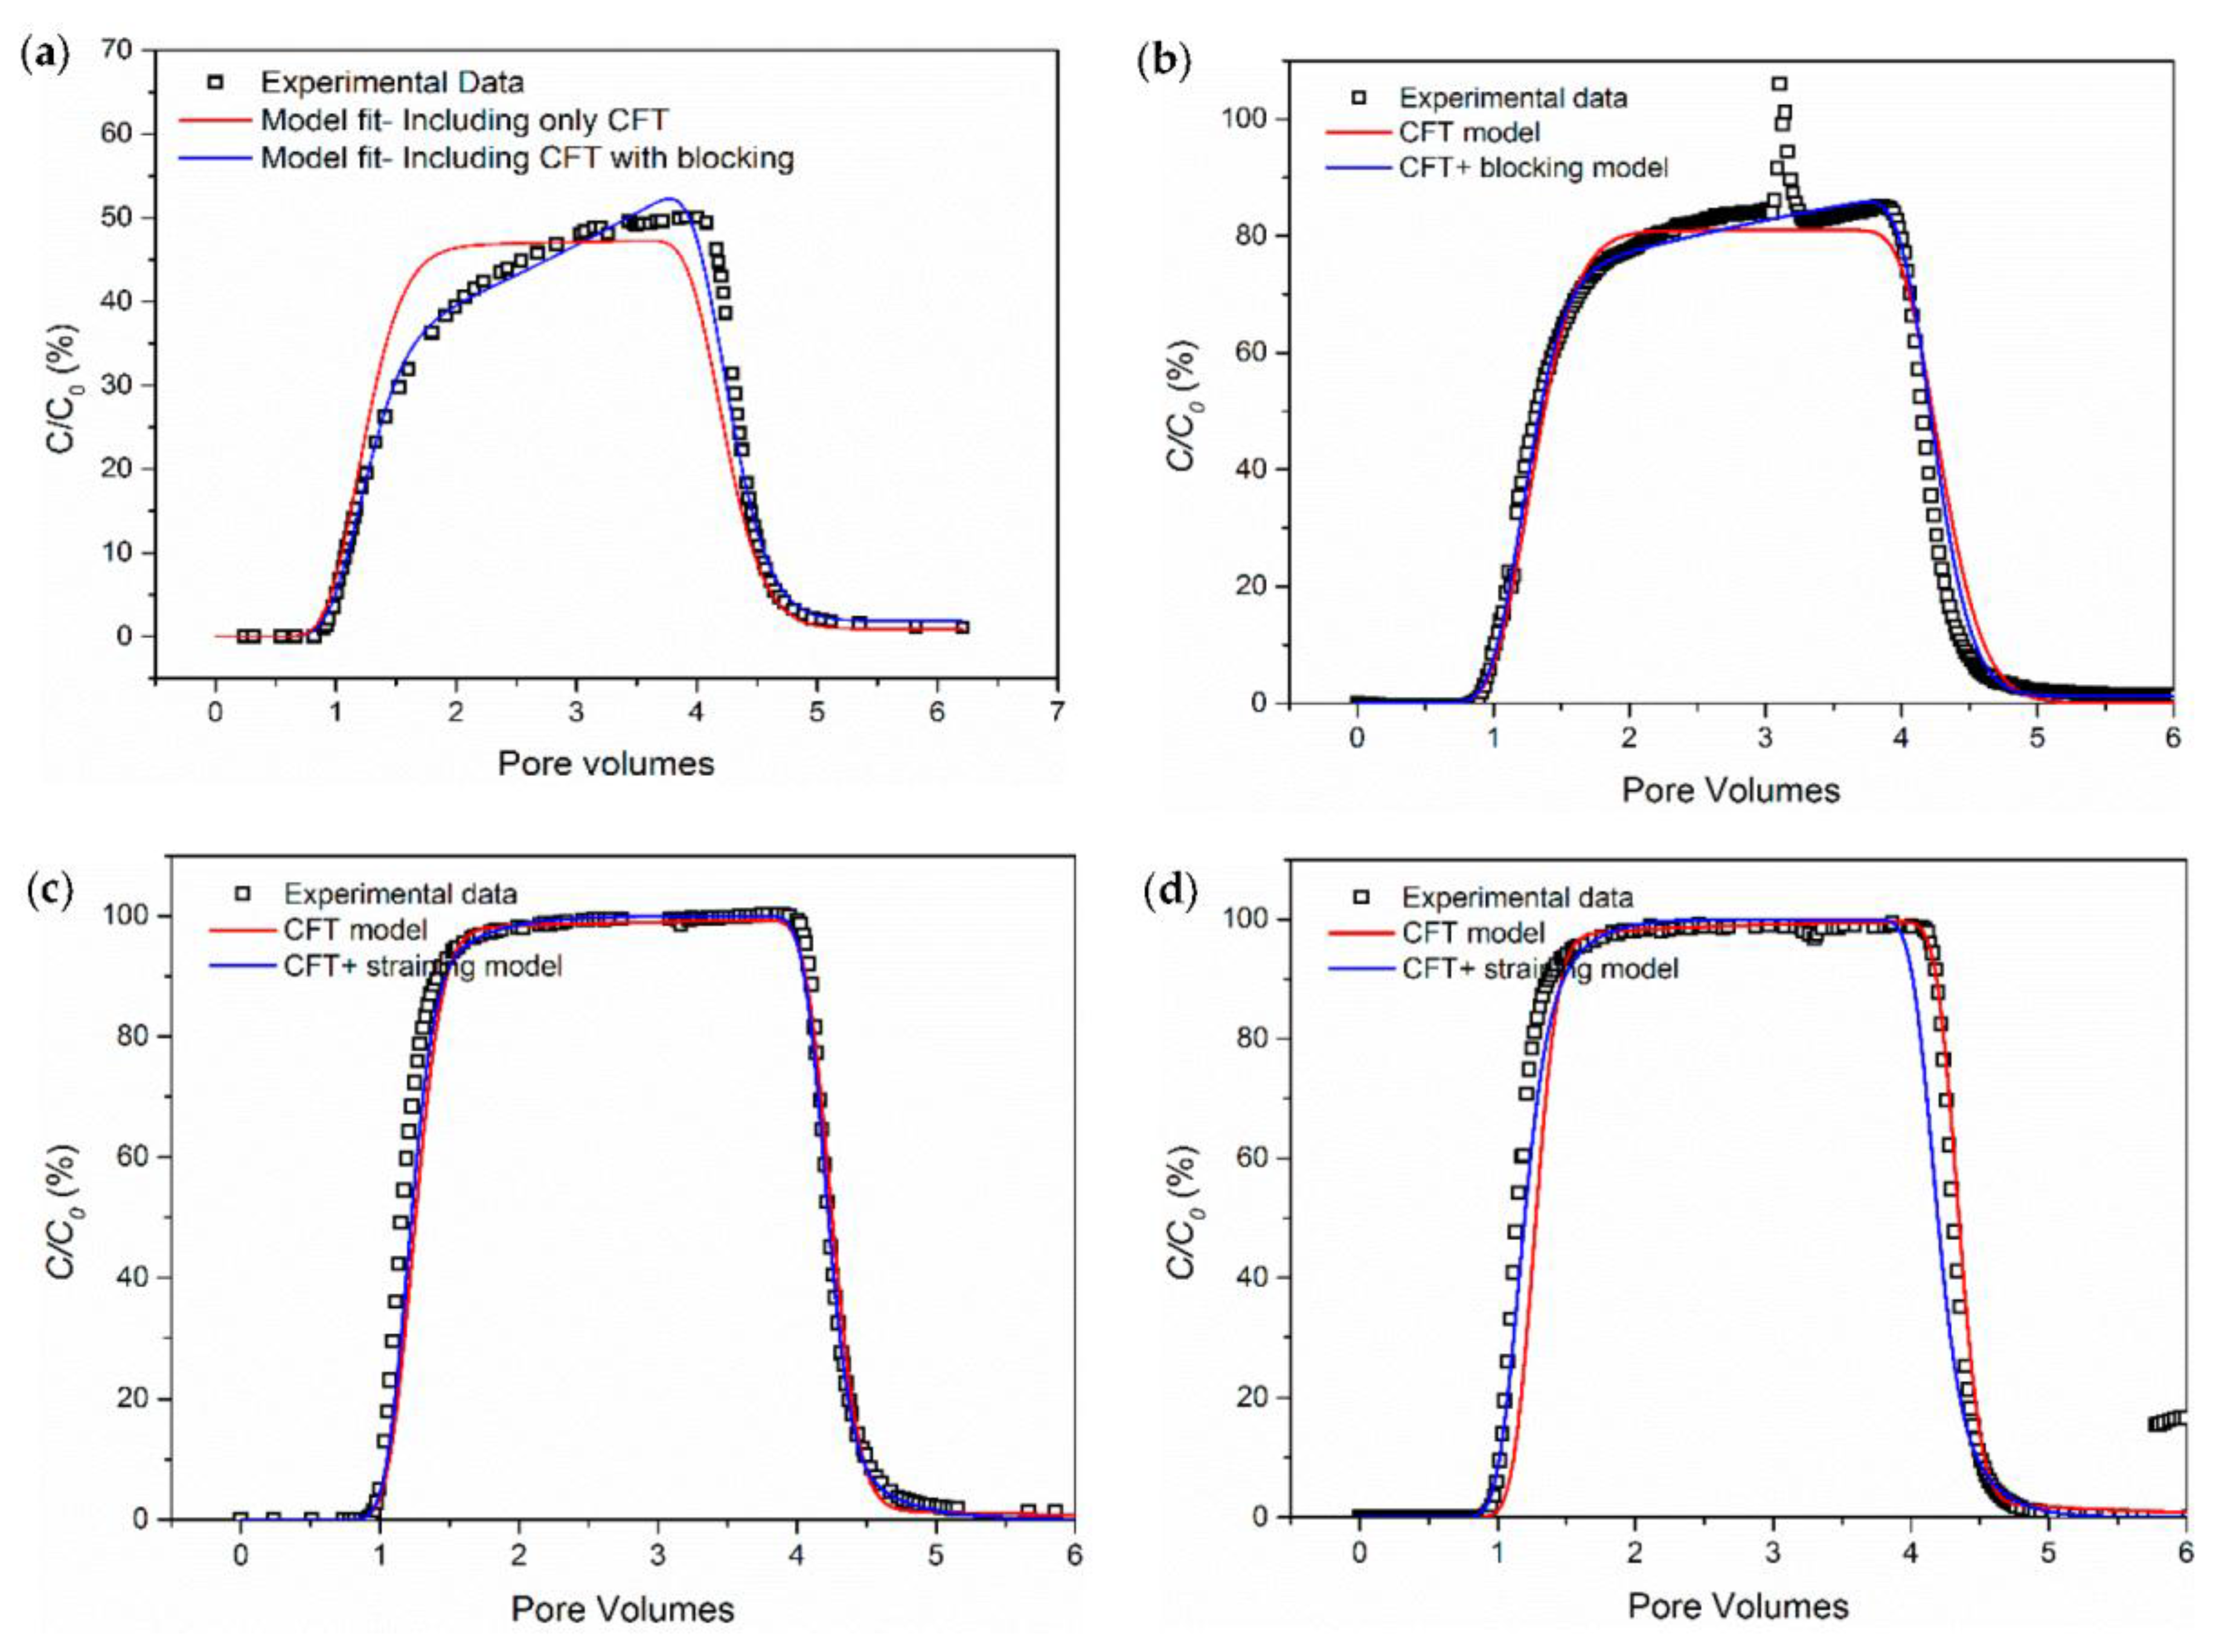
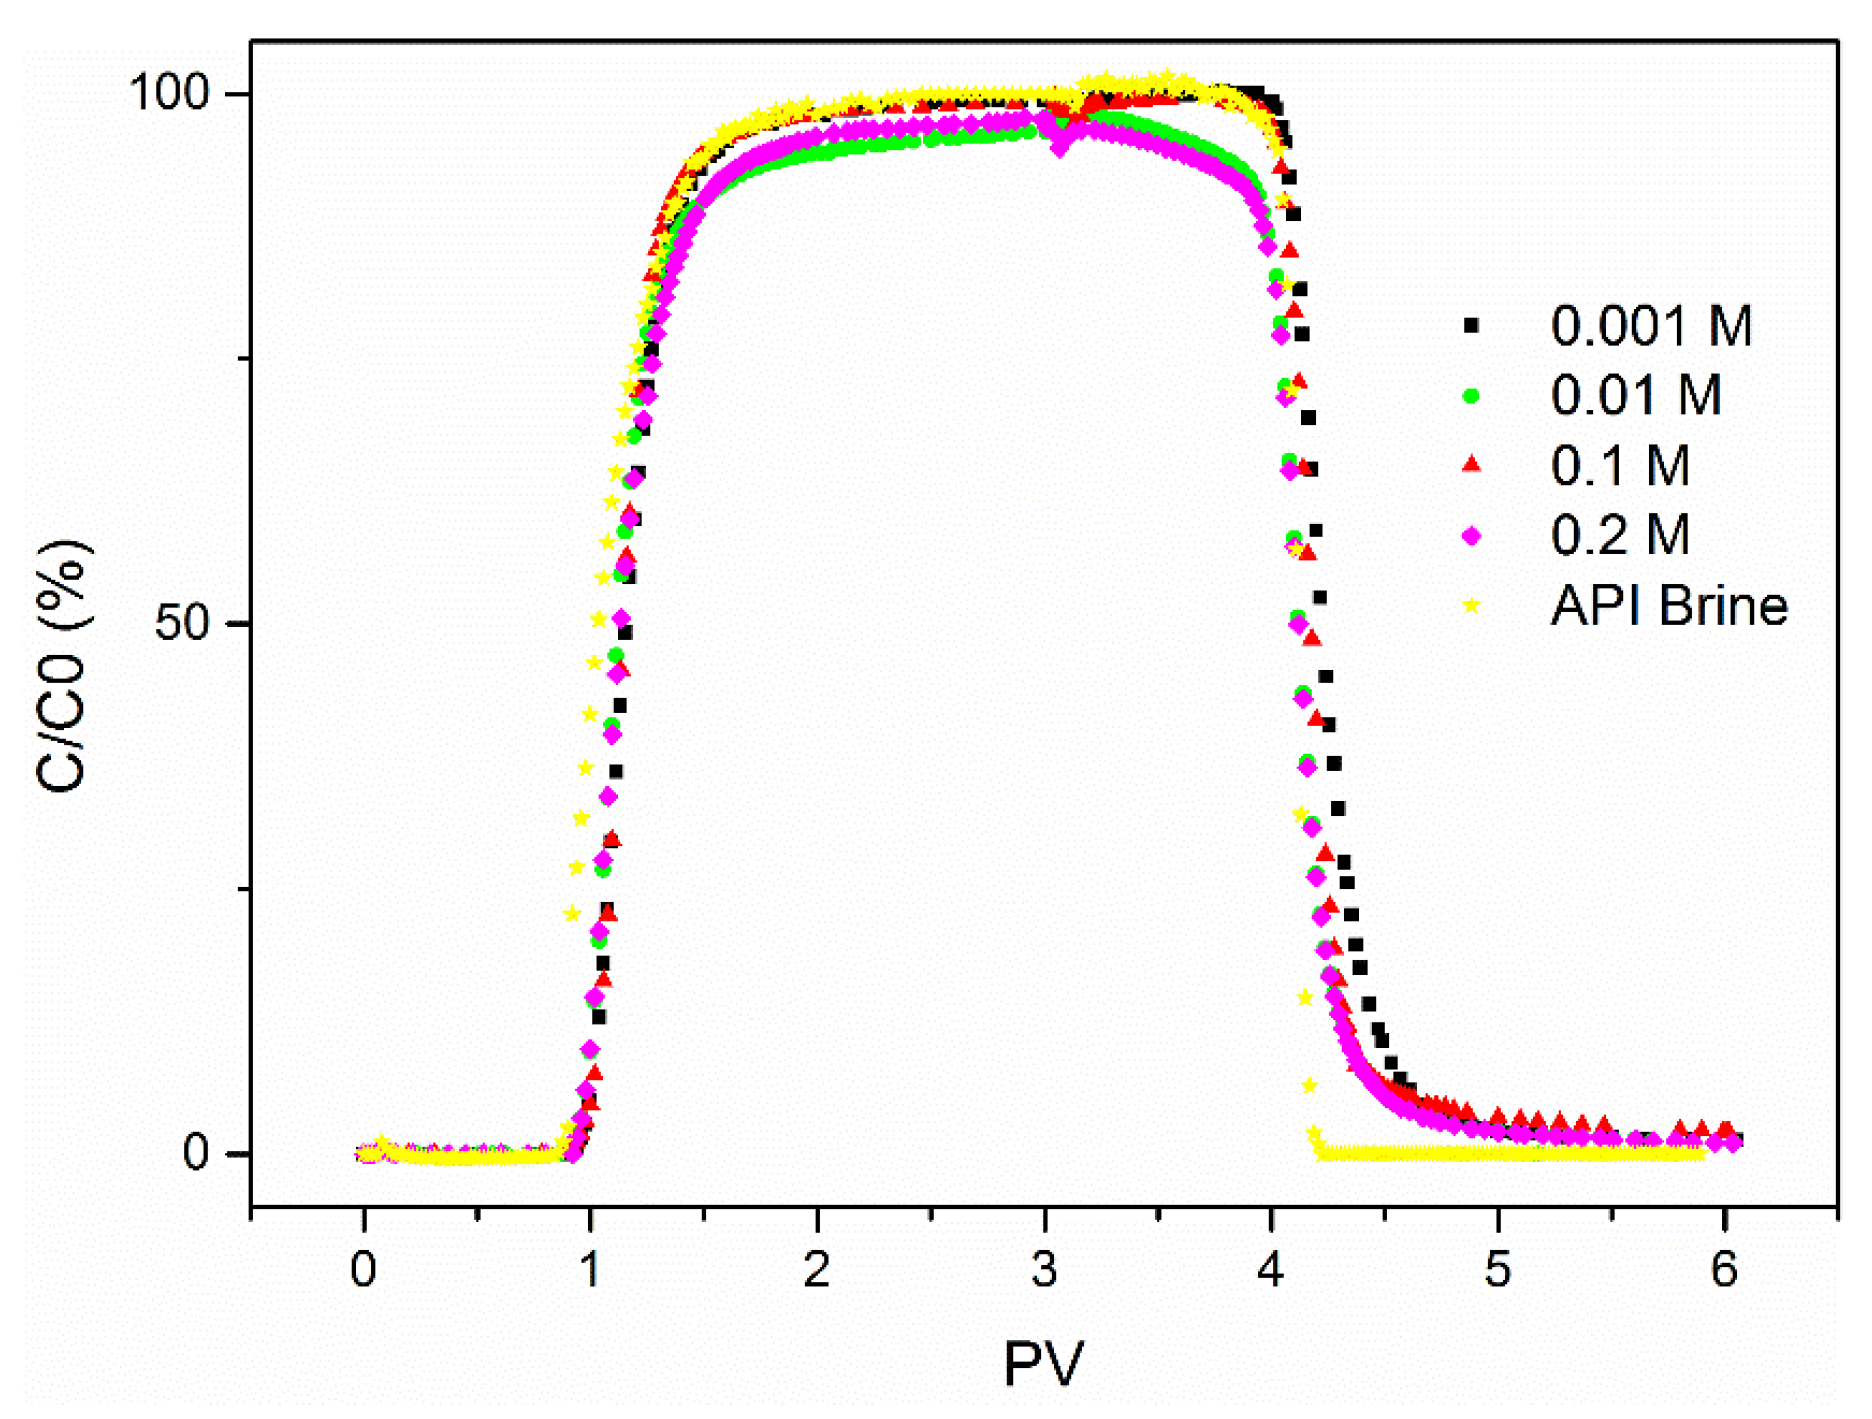
3.3. The Influence of Particle Size

The breakthrough curves in Figure 5 show that the relative retention is much higher for 200 nm CNPs than that of 5 nm ones in the presence of 1 mM CaCl2, which is adverse to the observation from Wang et al. [31]. Table 4 indicates that 5 nm CNPs (exp. G9 and G10) have a much larger k d e t values than that for 200 nm CNPs (exp. G1–G8). These calculated results suggest that, at similar particle concentration, the smaller CNP-5 would deposit more slowly.
The results in Figure 5 show that for CNP-5, only CFT is sufficient to simulate the experiment data very well, with little delays in both leading edge and trailing edge. There is no need to include the blocking effects, because trapping of NPs in small pores does not occur in the porous media. However, employing the kinetic Langmuir model described in Section 2.5.1 shows that the CNP-5 has a larger detachment rate comparing to CNP-200, as shown in Table 4 where the model parameters are displayed. The lower deposition rate and much higher detachment rate relative to CNP-200 maybe the main contribution for the prominent breakthrough ability for CNP-5. It is also amazing to find even in API brine (8 wt % NaCl and 2 wt % CaCl2), 5 nm CNP’s breakthrough ratio can be as high as 100 % (Figure 6), unaffected by the increase of ionic strength.

3.4. Applicability of Classic DLVO Theory

Reviewing the particle transport results in Figure 2, Figure 5 and Figure 6, they show that CNP-5 had a much better breakthrough ability than CNP-200, and both deposited CNP-200 and CNP-5 particles can be flushed out during the post brine injection (from 3 to 6 PVs). However, the retention of CNP-5 after post flush is prominently less than CNP-200. Mass balance calculation indicates that CNP-5 had less than 2% retention rate relative to the total injection amount; whereas the retention of CNP-200 was as high as 62.6%.
The significant retention of CNP-200 can be explained by the DLVO theory. Both of the energy barriers of particle-particle (Figure 7a) and particle-collector (Figure 7b) were significantly diminished for CNP-200 as the salinity increases, which could facilitate the NPs aggregation and retention in packed beads matrix. However, even though the trend of energy barriers change for CNP-5 calculated by classic DLVO theory (Figure 7c,d) is similar to those of CNP-200, i.e., the energy barriers for particle-particle and particle-collector are significantly reduced at high salinity, its transport ability is remarkably different with CNP-200. As shown in Figure 6, CNP-5 can be nearly 100% passing through the packed bed and unaffected by ionic strength. This might be for the reason that, in addition to the double layer repulsion and van der Waals attraction, other short-range interactions (e.g., hydration and born) may also play an important role for 5 nm carbon dots, resulting in the failure of the classic DLVO prediction.
The extended DLVO theory takes into account of steric interaction (including osmotic repulsion and elastic repulsion), magnetic interaction and born repulsion, etc. [22,58]. Neither steric interaction nor magnetic interaction are applicable to CNPs in this work. Born interaction would add the possibility to predict the CNP-5, which is likely to approach the surface of glass beads closer than few nanometers. On the other hand, when NPs are very small so that the overlap of diffuse double layers is complete, classic DLVO theory may not be valid.

4. Conclusions

This study provides insights into the transportation and deposition behavior of synthesized carbon nanoparticles with different sizes under various concentrations and ionic strength conditions. The study also identifies possible mechanisms controlling their depositions and release in porous media via three different transport models. The results suggested that:
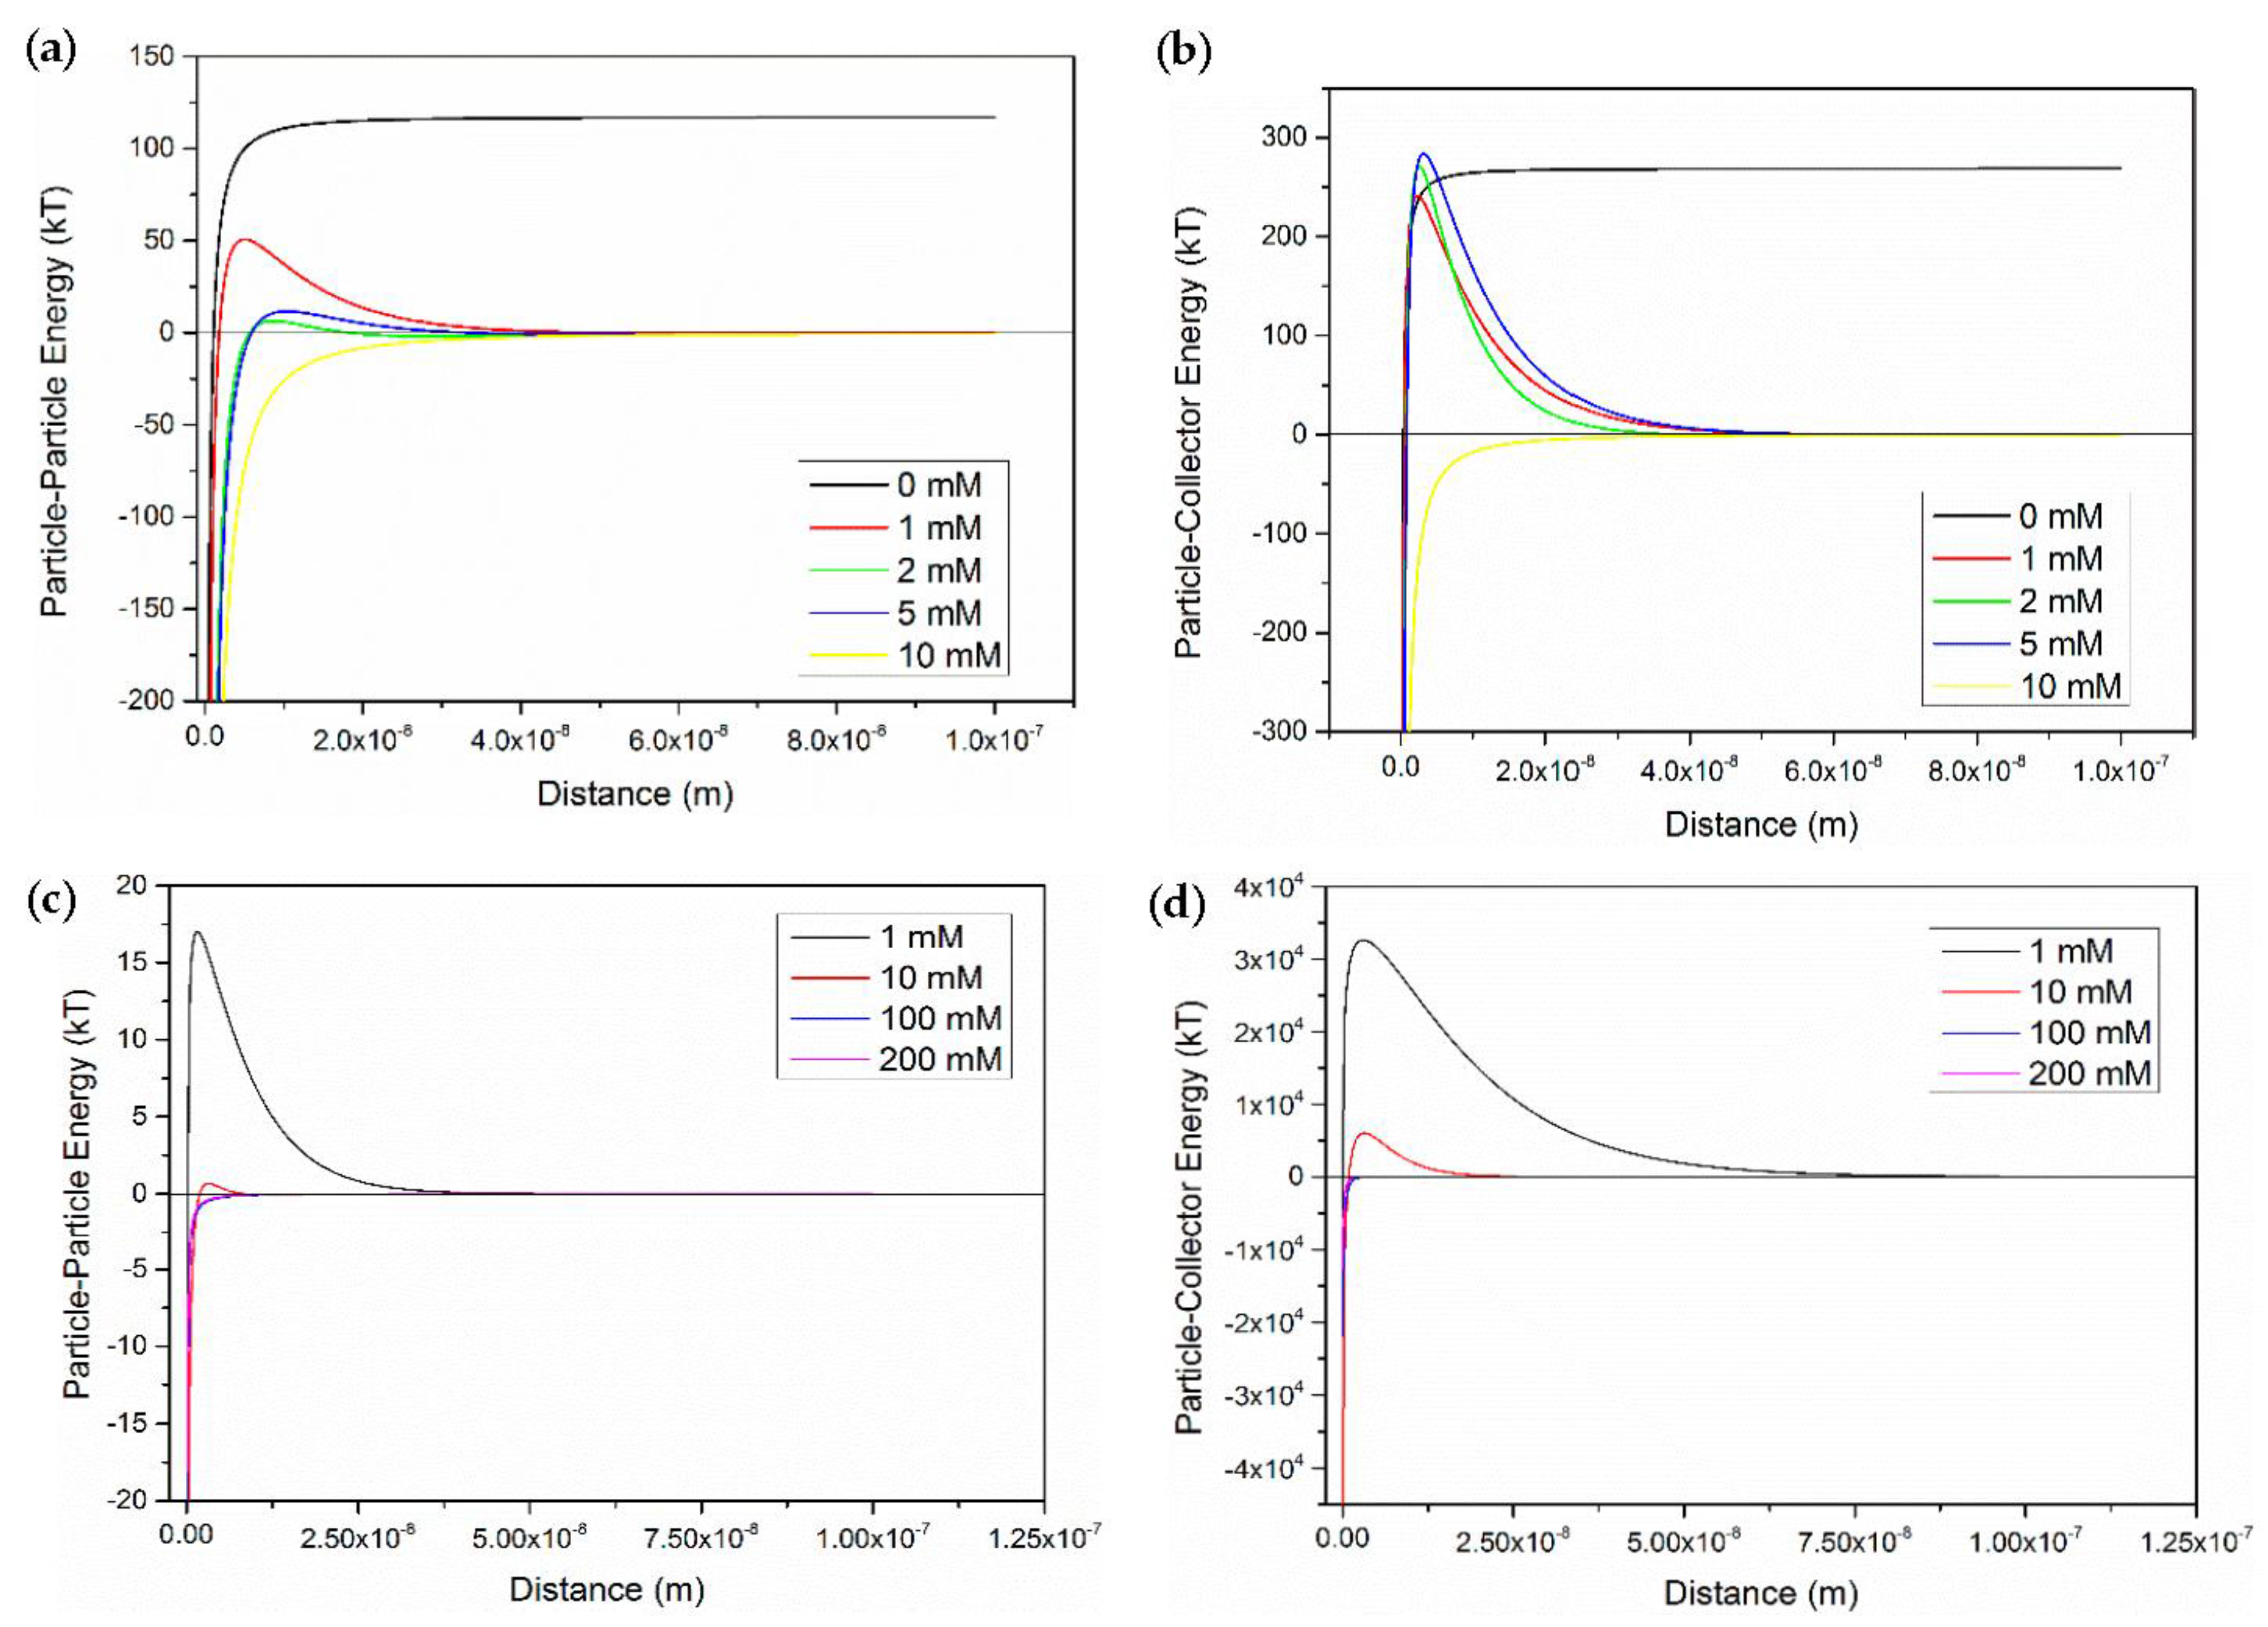
  • Salinity has a strong influence on the breakthrough ability of CNP-200 in a porous medium, which is due to the reduced energy barrier determined by DVLO theory and blocking caused by the formation of large-size aggregation. Hence, the CFT model with blocking effect can fit the BTCs of carbon balls.
  • For CNP-200, the retention is very sensitive to the particle concentration, with a higher concentration leading to a higher relative breakthrough (C/Co).
  • The increase of ionic strength and concentration are unaffected to the transport behavior of CNP-5, even when the ionic strength increased to the level of API brine. The Kinetic Langmuir effect model shows that the detachment for CNP-5 rate is much higher than its deposition rate.
  • The classic DLVO theory without considering other short-range interaction (like Born effect) may be limited to explain the transport behavior of CNP-5.

Acknowledgments

The work is supported by the European Research Council (ERC-2014-CoG, Project reference: 648375) and the China Scholarship Council (CSC).

Author Contributions

Dongsheng Wen conceived the research framework. Zhongliang Hu carried out the particle transport experiments, analyzed the data and wrote the paper. Jin Zhao did the simulation using ADR and DLVO theory. Hui Gao synthesized and characterized the carbon nanoparticles. Ehsan Nourafkan helped to develop the model. All authors contributed to the analysis of data and discussed the results.

Conflicts of Interest

The authors declare no conflict of interest.

References

  1. Alaskar, M. In-Situ Multifunctional Nanosensors for Fractured Reservoir Characterization. Ph.D. Thesis, Stanford University, Stanford, CA, USA, August 2013. [Google Scholar]
  2. Hwang, C.C.; Wang, L.; Lu, W.; Ruan, G.; Kini, G.C.; Xiang, C.; Samuel, E.L.G.; Shi, W.; Kan, A.T.; Wong, M.S.; et al. Highly stable carbon nanoparticles designed for downhole hydrocarbon detection. Energy Environ. Sci. 2012, 5, 8304. [Google Scholar] [CrossRef]
  3. Hwang, C.C.; Ruan, G.; Wang, L.; Zheng, H.; Samuel, E.L.; Xiang, C.; Lu, W.; Kasper, W.; Huang, K.; Peng, Z.; et al. Carbon-based nanoreporters designed for subsurface hydrogen sulfide detection. ACS Appl. Mater. Interfaces 2014, 6, 7652–7658. [Google Scholar] [CrossRef] [PubMed]
  4. Li, S.; Hendraningrat, L.; Torsater, O. Improved Oil Recovery by Hydrophilic Silica Nanoparticles Suspension: 2-Phase Flow Experimental Studies. In Proceedings of the International Petroleum Technology Conference, Beijing, China, 26–28 March 2013. [Google Scholar]
  5. Karimi, A.; Fakhroueian, Z.; Bahramian, A.; Pour Khiabani, N.; Darabad, J.B.; Azin, R.; Arya, S. Wettability Alteration in Carbonates using Zirconium Oxide Nanofluids: EOR Implications. Energy Fuels 2012, 26, 1028–1036. [Google Scholar] [CrossRef]
  6. Roustaei, A.; Saffarzadeh, S.; Mohammadi, M. An evaluation of modified silica nanoparticles’ efficiency in enhancing oil recovery of light and intermediate oil reservoirs. Egypt. J. Pet. 2013, 22, 427–433. [Google Scholar] [CrossRef]
  7. Ehtesabi, H.; Ahadian, M.M.; Taghikhani, V.; Ghazanfari, M.H. Enhanced Heavy Oil Recovery in Sandstone Cores Using TiO2 Nanofluids. Energy Fuels 2014, 28, 423–430. [Google Scholar] [CrossRef]
  8. Singh, R.; Mohanty, K.K. Synergy between Nanoparticles and Surfactants in Stabilizing Foams for Oil Recovery. Energy Fuels 2014, 29, 467–479. [Google Scholar] [CrossRef]
  9. Pei, H.H.; Zhang, G.C.; Ge, J.J.; Zhang, J.; Zhang, Q.; Fu, L.P. Investigation of Nanoparticle and Surfactant Stabilized Emulsion to Enhance Oil Recovery in Waterflooded Heavy Oil Reservoirs. In Proceedings of the SPE Canada Heavy Oil Technical Conference, Calgary, AB, Canada, 9–11 June 2015. [Google Scholar]
  10. Guo, F.; He, J.; Johnson, P.A.; Aryana, S.A. Stabilization of CO2 foam using by-product fly ash and recyclable iron oxide nanoparticles to improve carbon utilization in EOR processes. Sustain. Energy Fuels 2017, 1, 814–822. [Google Scholar] [CrossRef]
  11. Darlington, T.K.; Neigh, A.M.; Spencer, M.T.; Nguyen, O.T.; Oldenburg, S.J. Nanoparticle characteristics affecting environmental fate and transport through soil. Environ. Toxicol. Chem. 2009, 28, 1191–1199. [Google Scholar] [CrossRef] [PubMed]
  12. Auffan, M.; Rose, J.; Bottero, J.Y.; Lowry, G.V.; Jolivet, J.P.; Wiesner, M.R. Towards a definition of inorganic nanoparticles from an environmental, health and safety perspective. Nat. Nanotechnol. 2009, 4, 634–641. [Google Scholar] [CrossRef] [PubMed]
  13. Bhunia, S.K.; Saha, A.; Maity, A.R.; Ray, S.C.; Jana, N.R. Carbon nanoparticle-based fluorescent bioimaging probes. Sci. Rep. 2013, 3, 1473. [Google Scholar] [CrossRef] [PubMed]
  14. Gao, H.; Sapelkin, A.V.; Titirici, M.M.; Sukhorukov, G.B. In Situ Synthesis of Fluorescent Carbon Dots/Polyelectrolyte Nanocomposite Microcapsules with Reduced Permeability and Ultrasound Sensitivity. ACS Nano 2016, 10, 9608–9615. [Google Scholar] [CrossRef] [PubMed]
  15. Lecoanet, H.F.; Wiesner, M.R. Velocity effects on fullerene and oxide nanoparticle deposition in porous media. Environ. Sci. Technol. 2004, 38, 4377–4382. [Google Scholar] [CrossRef] [PubMed]
  16. Chen, K.L.; Elimelech, M. Aggregation and deposition kinetics of fullerene (C60) nanoparticles. Langmuir 2006, 22, 10994–11001. [Google Scholar] [CrossRef] [PubMed]
  17. Espinasse, B.; Hotze, E.M.; Wiesner, M.R. Transport and Retention of Colloidal Aggregates of C60 in Porous Media: Effects of Organic Macromolecules, Ionic Composition, and Preparation Method. Environ. Sci. Technol. 2007, 41, 7396–7402. [Google Scholar] [CrossRef] [PubMed]
  18. Chen, K.L.; Elimelech, M. Interaction of Fullerene (C60) Nanoparticles with Humic Acid and Alginate Coated Silica Surfaces: Measurements, Mechanisms, and Environmental Implications. Environ. Sci. Technol. 2008, 42, 7607–7614. [Google Scholar] [CrossRef] [PubMed]
  19. Li, Y.; Wang, Y.; Pennell, K.D.; Abriola, L.M. Investigation of the Transport and Deposition of Fullerene (C60) Nanoparticles in Quartz Sands under Varying Flow Conditions. Environ. Sci. Technol. 2008, 42, 7174–7180. [Google Scholar] [CrossRef] [PubMed]
  20. Wang, Y.; Li, Y.; Fortner, J.D.; Hughes, J.B.; Abriola, L.M.; Pennell, K.D. Transport and retention of nanoscale C60 aggregates in water-saturated porous media. Environ. Sci. Technol. 2008, 42, 3588–3594. [Google Scholar] [CrossRef] [PubMed]
  21. Wang, Y.; Li, Y.; Pennell, K.D. Influence of Electrolyte Species and Concentration on the Aggregation and Transport of Fullerene Nanoparticles in Quartz Sands. Environ. Toxicol. Chem. 2008, 27, 1860–1867. [Google Scholar] [CrossRef] [PubMed]
  22. Feriancikova, L.; Xu, S. Deposition and remobilization of graphene oxide within saturated sand packs. J. Hazard. Mater. 2012, 235–236, 194–200. [Google Scholar] [CrossRef] [PubMed]
  23. Sun, Y.; Gao, B.; Bradford, S.A.; Wu, L.; Chen, H.; Shi, X.; Wu, J. Transport, retention, and size perturbation of graphene oxide in saturated porous media: Effects of input concentration and grain size. Water Res. 2015, 68, 24–33. [Google Scholar] [CrossRef] [PubMed]
  24. Fan, W.; Jiang, X.; Lu, Y.; Huo, M.; Lin, S.; Geng, Z. Effects of surfactants on graphene oxide nanoparticles transport in saturated porous media. J. Environ. Sci. 2015, 35, 12–19. [Google Scholar] [CrossRef] [PubMed]
  25. Tian, Y.; Gao, B.; Ziegler, K.J. High mobility of SDBS-dispersed single-walled carbon nanotubes in saturated and unsaturated porous media. J. Hazard. Mater. 2011, 186, 1766–1772. [Google Scholar] [CrossRef] [PubMed]
  26. Liu, X.; O’Carroll, D.M.; Petersen, E.J.; Huang, Q.; Anderson, C.L. Mobility of multiwalled carbon nanotubes in porous media. Environ. Sci. Technol. 2009, 43, 8153–8158. [Google Scholar] [CrossRef] [PubMed]
  27. Jaisi, D.P.; Saleh, N.B.; Blake, R.E.; Elimelech, M. Transport of Single-Walled Carbon Nanotubes in Porous Media: Filtration Mechanisms and Reversibility. Environ. Sci. Technol. 2008, 42, 8317–8323. [Google Scholar] [CrossRef] [PubMed]
  28. Guzman, K.A.; Finnegan, M.P.; Banfield, J.F. Influence of surface potential on aggregation and transport of titania nanoparticles. Environ. Sci. Technol. 2006, 40, 7688–7693. [Google Scholar] [CrossRef] [PubMed]
  29. Jiang, X.; Tong, M.; Kim, H. Influence of natural organic matter on the transport and deposition of zinc oxide nanoparticles in saturated porous media. J. Colloid Interface Sci. 2012, 386, 34–43. [Google Scholar] [CrossRef] [PubMed]
  30. Berlin, J.M.; Yu, J.; Lu, W.; Walsh, E.E.; Zhang, L.; Zhang, P.; Chen, W.; Kan, A.T.; Wong, M.S.; Tomson, M.B.; et al. Engineered nanoparticles for hydrocarbon detection in oil-field rocks. Energy Environ. Sci. 2011, 4, 505–509. [Google Scholar] [CrossRef]
  31. Wang, C.; Bobba, A.D.; Attinti, R.; Shen, C.; Lazouskaya, V.; Wang, L.P.; Jin, Y. Retention and transport of silica nanoparticles in saturated porous media: Effect of concentration and particle size. Environ. Sci. Technol. 2012, 46, 7151–7158. [Google Scholar] [CrossRef] [PubMed]
  32. French, R.A.; Jacobson, A.R.; Kim, B.; Isley, S.L.; Penn, R.L.; Baveye, P.C. Influence of ionic strength, pH, and cation valence on aggregation kinetics of titanium dioxide nanoparticles. Environ. Sci. Technol. 2009, 43, 1354–1359. [Google Scholar] [CrossRef] [PubMed]
  33. Metin, C.O.; Lake, L.W.; Miranda, C.R.; Nguyen, Q.P. Stability of aqueous silica nanoparticle dispersions. J. Nanopart. Res. 2011, 13, 839–850. [Google Scholar] [CrossRef]
  34. Lecoanet, H.F.; Bottero, J.Y.; Wiesner, M.R. Laboratory Assessment of the Mobility of Nanomaterials in Porous Media. Environ. Sci. Technol. 2004, 38, 5164–5169. [Google Scholar] [CrossRef] [PubMed]
  35. Phenrat, T.; Kim, H.J.; Fagerlund, F.; Illangasekare, T.; Tilton, R.D.; Lowry, G.V. Particle Size Distribution, Concentration, and Magnetic Attraction Affect Transport of Polymer-Modified Fe0Nanoparticles in Sand Columns. Environ. Sci. Technol. 2009, 43, 5079–5085. [Google Scholar] [CrossRef] [PubMed]
  36. Petosa, A.R.; Jaisi, D.P.; Quevedo, I.R.; Elimelech, M.; Tufenkji, N. Aggregation and deposition of engineered nanomaterials in aquatic environments: Role of physicochemical interactions. Environ. Sci. Technol. 2010, 44, 6532–6549. [Google Scholar] [CrossRef] [PubMed]
  37. Solovitch, N.; Labille, J.; Rose, J.; Chaurand, P.; Borschneck, D.; Wiesner, M.R.; Bottero, J.Y. Concurrent aggregation and deposition of TiO2 nanoparticles in a sandy porous media. Environ. Sci. Technol. 2010, 44, 4897–4902. [Google Scholar] [CrossRef] [PubMed]
  38. Zhang, W.; Morales, V.L.; Cakmak, M.E.; Salvucci, A.E.; Geohring, L.D.; Hay, A.G.; Parlange, J.Y.; Steenhuis, T.S. Colloid transport and retention in unsaturated porous media: Effect of colloid input concentration. Environ. Sci. Technol. 2010, 44, 4965–4972. [Google Scholar] [CrossRef] [PubMed]
  39. Kasel, D.; Bradford, S.A.; Simunek, J.; Heggen, M.; Vereecken, H.; Klumpp, E. Transport and retention of multi-walled carbon nanotubes in saturated porous media: Effects of input concentration and grain size. Water Res. 2013, 47, 933–944. [Google Scholar] [CrossRef] [PubMed]
  40. Hogg, R.; Healy, T.W.; Fuerstenau, D.W. Mutual coagulation of colloidal dispersions. Trans. Faraday Soc. 1966, 62, 1638–1651. [Google Scholar] [CrossRef]
  41. Elimelech, M.; Gregory, J.; Jia, X.; Williams, R.A. Particle Deposition & Aggregation: Measurement, Modelling and Simulation, 2nd ed.; Butterworth-Heinemann: Woburn, MA, USA, 1995; ISBN 0-7506-7024-X. [Google Scholar]
  42. Kallay, N.; Zalac, S. Stability of nanodispersions: A model for kinetics of aggregation of nanoparticles. J. Colloid Interface Sci. 2002, 253, 70–76. [Google Scholar] [CrossRef] [PubMed]
  43. He, Y.T.; Wan, J.; Tokunaga, T. Kinetic stability of hematite nanoparticles: The effect of particle sizes. J. Nanopart. Res. 2007, 10, 321–332. [Google Scholar] [CrossRef]
  44. Gao, H.; Wen, D.S.; Sukhorukov, G.B. Composite silica nanoparticle/polyelectrolyte microcapsules with reduced permeability and enhanced ultrasound sensitivity. J. Mater. Chem. B 2015, 3, 1888–1897. [Google Scholar] [CrossRef]
  45. Shen, C.; Li, B.; Huang, Y.; Jin, Y. Kinetics of Coupled Primary- and Secondary-Minimum Deposition of Colloids under Unfavorable Chemical Conditions. Environ. Sci. Technol. 2007, 41, 6976–6982. [Google Scholar] [CrossRef] [PubMed]
  46. Wang, Y.G.; Li, Y.S.; Costanza, J.; Abriola, L.M.; Pennell, K.D. Enhanced Mobility of Fullerene (C-60) Nanoparticles in the Presence of Stabilizing Agents. Environ. Sci. Technol. 2012, 46, 11761–11769. [Google Scholar] [CrossRef] [PubMed]
  47. Zhuang, J.; Qi, J.; Jin, Y. Retention and Transport of Amphiphilic Colloids under Unsaturated Flow Conditions: Effect of Particle Size and Surface Property. Environ. Sci. Technol. 2005, 39, 7853–7859. [Google Scholar] [CrossRef] [PubMed]
  48. Tufenkji, N.; Elimelech, M. Correlation Equation for Predicting Single-Collector Efficiency in Physicochemical Filtration in Saturated Porous Media. Environ. Sci. Technol. 2004, 38, 529–536. [Google Scholar] [CrossRef] [PubMed]
  49. Esfandyari Bayat, A.; Junin, R.; Derahman, M.N.; Samad, A.A. TiO2 nanoparticle transport and retention through saturated limestone porous media under various ionic strength conditions. Chemosphere 2015, 134, 7–15. [Google Scholar] [CrossRef] [PubMed]
  50. Ko, C.H.; Elimelech, M. The “Shadow Effect” in Colloid Transport and Deposition Dynamics in Granular Porous Media: Measurements and Mechanisms. Environ. Sci. Technol. 2000, 34, 3681–3689. [Google Scholar] [CrossRef]
  51. Cullen, E.; O’Carroll, D.M.; Yanful, E.K.; Sleep, B. Simulation of the subsurface mobility of carbon nanoparticles at the field scale. Adv. Water Resour. 2010, 33, 361–371. [Google Scholar] [CrossRef]
  52. Rottman, J.J. Fundamentals and Application of Porous Media Filtration for The Removal of Nanoparticles From Industrial Wastewater. Ph.D. Thesis, University of Arizona, Tucson, AZ, USA, July 2012. [Google Scholar]
  53. Bradford, S.A.; Simunek, J.; Bettahar, M.; Van Genuchten, M.T.; Yates, S.R. Modeling Colloid Attachment, Straining, and Exclusion in Saturated Porous Media. Environ. Sci. Technol. 2003, 37, 2242–2250. [Google Scholar] [CrossRef] [PubMed]
  54. Tosco, T.; Tiraferri, A.; Sethi, R. Ionic Strength Dependent Transport of Microparticles in Saturated Porous Media: Modeling Mobilization and Immobilization Phenomena under Transient Chemical Conditions. Environ. Sci. Technol. 2009, 43, 4425–4431. [Google Scholar] [CrossRef] [PubMed]
  55. Torkzaban, S.; Bradford, S.A.; Wan, J.; Tokunaga, T.; Masoudih, A. Release of quantum dot nanoparticles in porous media: Role of cation exchange and aging time. Environ. Sci. Technol. 2013, 47, 11528–11536. [Google Scholar] [CrossRef] [PubMed]
  56. Yuan, H.; Shapiro, A.A. A mathematical model for non-monotonic deposition profiles in deep bed filtration systems. Chem. Eng. J. 2011, 166, 105–115. [Google Scholar] [CrossRef]
  57. Johnson, P.R.; Elimelech, M. Dynamics of Colloid Deposition in Porous Media: Blocking Based on Random Sequential Adsorption. Langmuir 1995, 11, 801–812. [Google Scholar] [CrossRef]
  58. Worthen, A.J.; Tran, V.; Cornell, K.A.; Truskett, T.M.; Johnston, K.P. Steric stabilization of nanoparticles with grafted low molecular weight ligands in highly concentrated brines including divalent ions. Soft Matter 2016, 12, 2025–2039. [Google Scholar] [CrossRef] [PubMed]
Figure 1. (a) SEM picture for Carbon ball at ~200 nm; (b) TEM picture for carbon dots at ~5 nm.
Energies 10 01151 g001
Figure 2. Measured and simulated breakthrough curves for representative CNP-200 transport experiments at ionic strength varying from 1 mM to 10 mM in brine-saturated columns packed with glass beads: (a) DI water; (b) 1 mM; (c) 2 mM; (d) 5 mM; (e) 10 mM. The pH was buffered to around 7 by using HCl and NaOH solution, both are available at 0.1 M and 0.01 M.
Energies 10 01151 g002
Figure 3. Values of (a) attachment term ( k a t t ); (b) detachment term ( k d e t ) and (c) dimensionless ρ b s m a x / c o as a function of ionic strength, obtained from the simulations of each transport experiment and their empirical prediction curves. (Figures are plotted in logarithmic scale.).
Energies 10 01151 g003
Figure 4. BTCs of CNP-200 corresponding to different influent concentration: (a) 3.1 ppm; (b) 4.5 ppm; (c) 6.4 ppm; (d) 8.0 ppm. The ionic strength is 1 mM.
Energies 10 01151 g004
Figure 5. Size dependent retention of CNPs at 1 mM CaCl2: (a) Carbon ball (~200 nm), 6.4 ppm; (b) Carbon ball (~200 nm), 8.0 ppm; (c) carbon dots (~5 nm), 10 ppm; (d) carbon dots (~5 nm), 24.8 ppm.
Energies 10 01151 g005
Figure 6. Breakthrough of CNP-5 (10 ppm) in glass beads-packed column at room temperature with ionic strength ranging from 1 mM CaCl2 to the standard of API brine.
Energies 10 01151 g006
Figure 7. Total interaction energy between particles and collectors as a function of distance at various ionic strength, at pH 7. (a) the interaction energy between CNP-200 particle-particle; (b) the interaction energy between CNP-200 particle- collector (glass beads); (c) the interaction energy between CNP-5 particle-particle; (d) the interaction energy between CNP-5 particle-collector (glass beads).
Energies 10 01151 g007
Table 1. Experimental conditions of CNPs transport in water-saturated glass column.
ColumnSizeInfluent Concentration (ppm)Ionic Strength (mM CaCl2)Mass Balance (%)
G12002505.33
G22003.117.5
G32003.020
G42003.450
G52003.3100
G62004.513.8
G72006.417.32
G82008.010
G9524.810
G10510.610
Table 2. Measured zeta potential and size of CNP-200 and glass beads in various salinity.
CaCl2 (mM)012510
zeta potential (mV)CNP-200−43.4−32.8−19.8−17−0.24
Glass beads−63.7 −38−20−19−63.7
Size (nm)176.5304.3691.0743.0750.2
Table 3. Measured zeta potential and hydrodynamic size for nanoparticle ( ζ s ) at various salinity.
CaCl2 (mM)110100200
zeta potential (mV)−40.3−10.5−0.35−0.21
Size (nm)25.526.816.313.6
Table 4. Simulated parameters used to fit carbon nanoparticle BTCs in water-saturated columns packed with glass beads.
Exp.Size (nm)Ionic Strength (mM CaCl2)Measured Retention after Postflushing (%)Simulated Retention from Better Fitting (%) Simulated S m a x (µg/g) k a t t (1/h) k d e t (1/h)
G1200010.910.52.28 × 10−50.6160.062
G2200127.727.23.74 × 10−52.4340.036
G3200244.243.65.86 × 10−52.0810.033
G4200562.661.88.87 × 10−54.5720.011
G52001062.562.71.04 × 10−44.6440.010
G6200146.345.92.51 × 10−52.9700.014
G7200135.536.19.64 × 10−54.1040.015
G8200118.618.11.02 × 10−50.5870.057
G9510.20.21.04 × 10−41.4477.452
G10511.71.73.58 × 10−43.46011.952

