A Demand-Side Perspective on Developing a Future Electricity Generation Mix: Identifying Heterogeneity in Social Preferences


Abstract
:1. Introduction
2. Literature Review: Optimal Electricity Generation Mix
3. Materials and Methods
3.1. The Model
3.2. Data
4. Results and Discussion
4.1. Heterogeneity in Social Preferences for Electricity Attributes
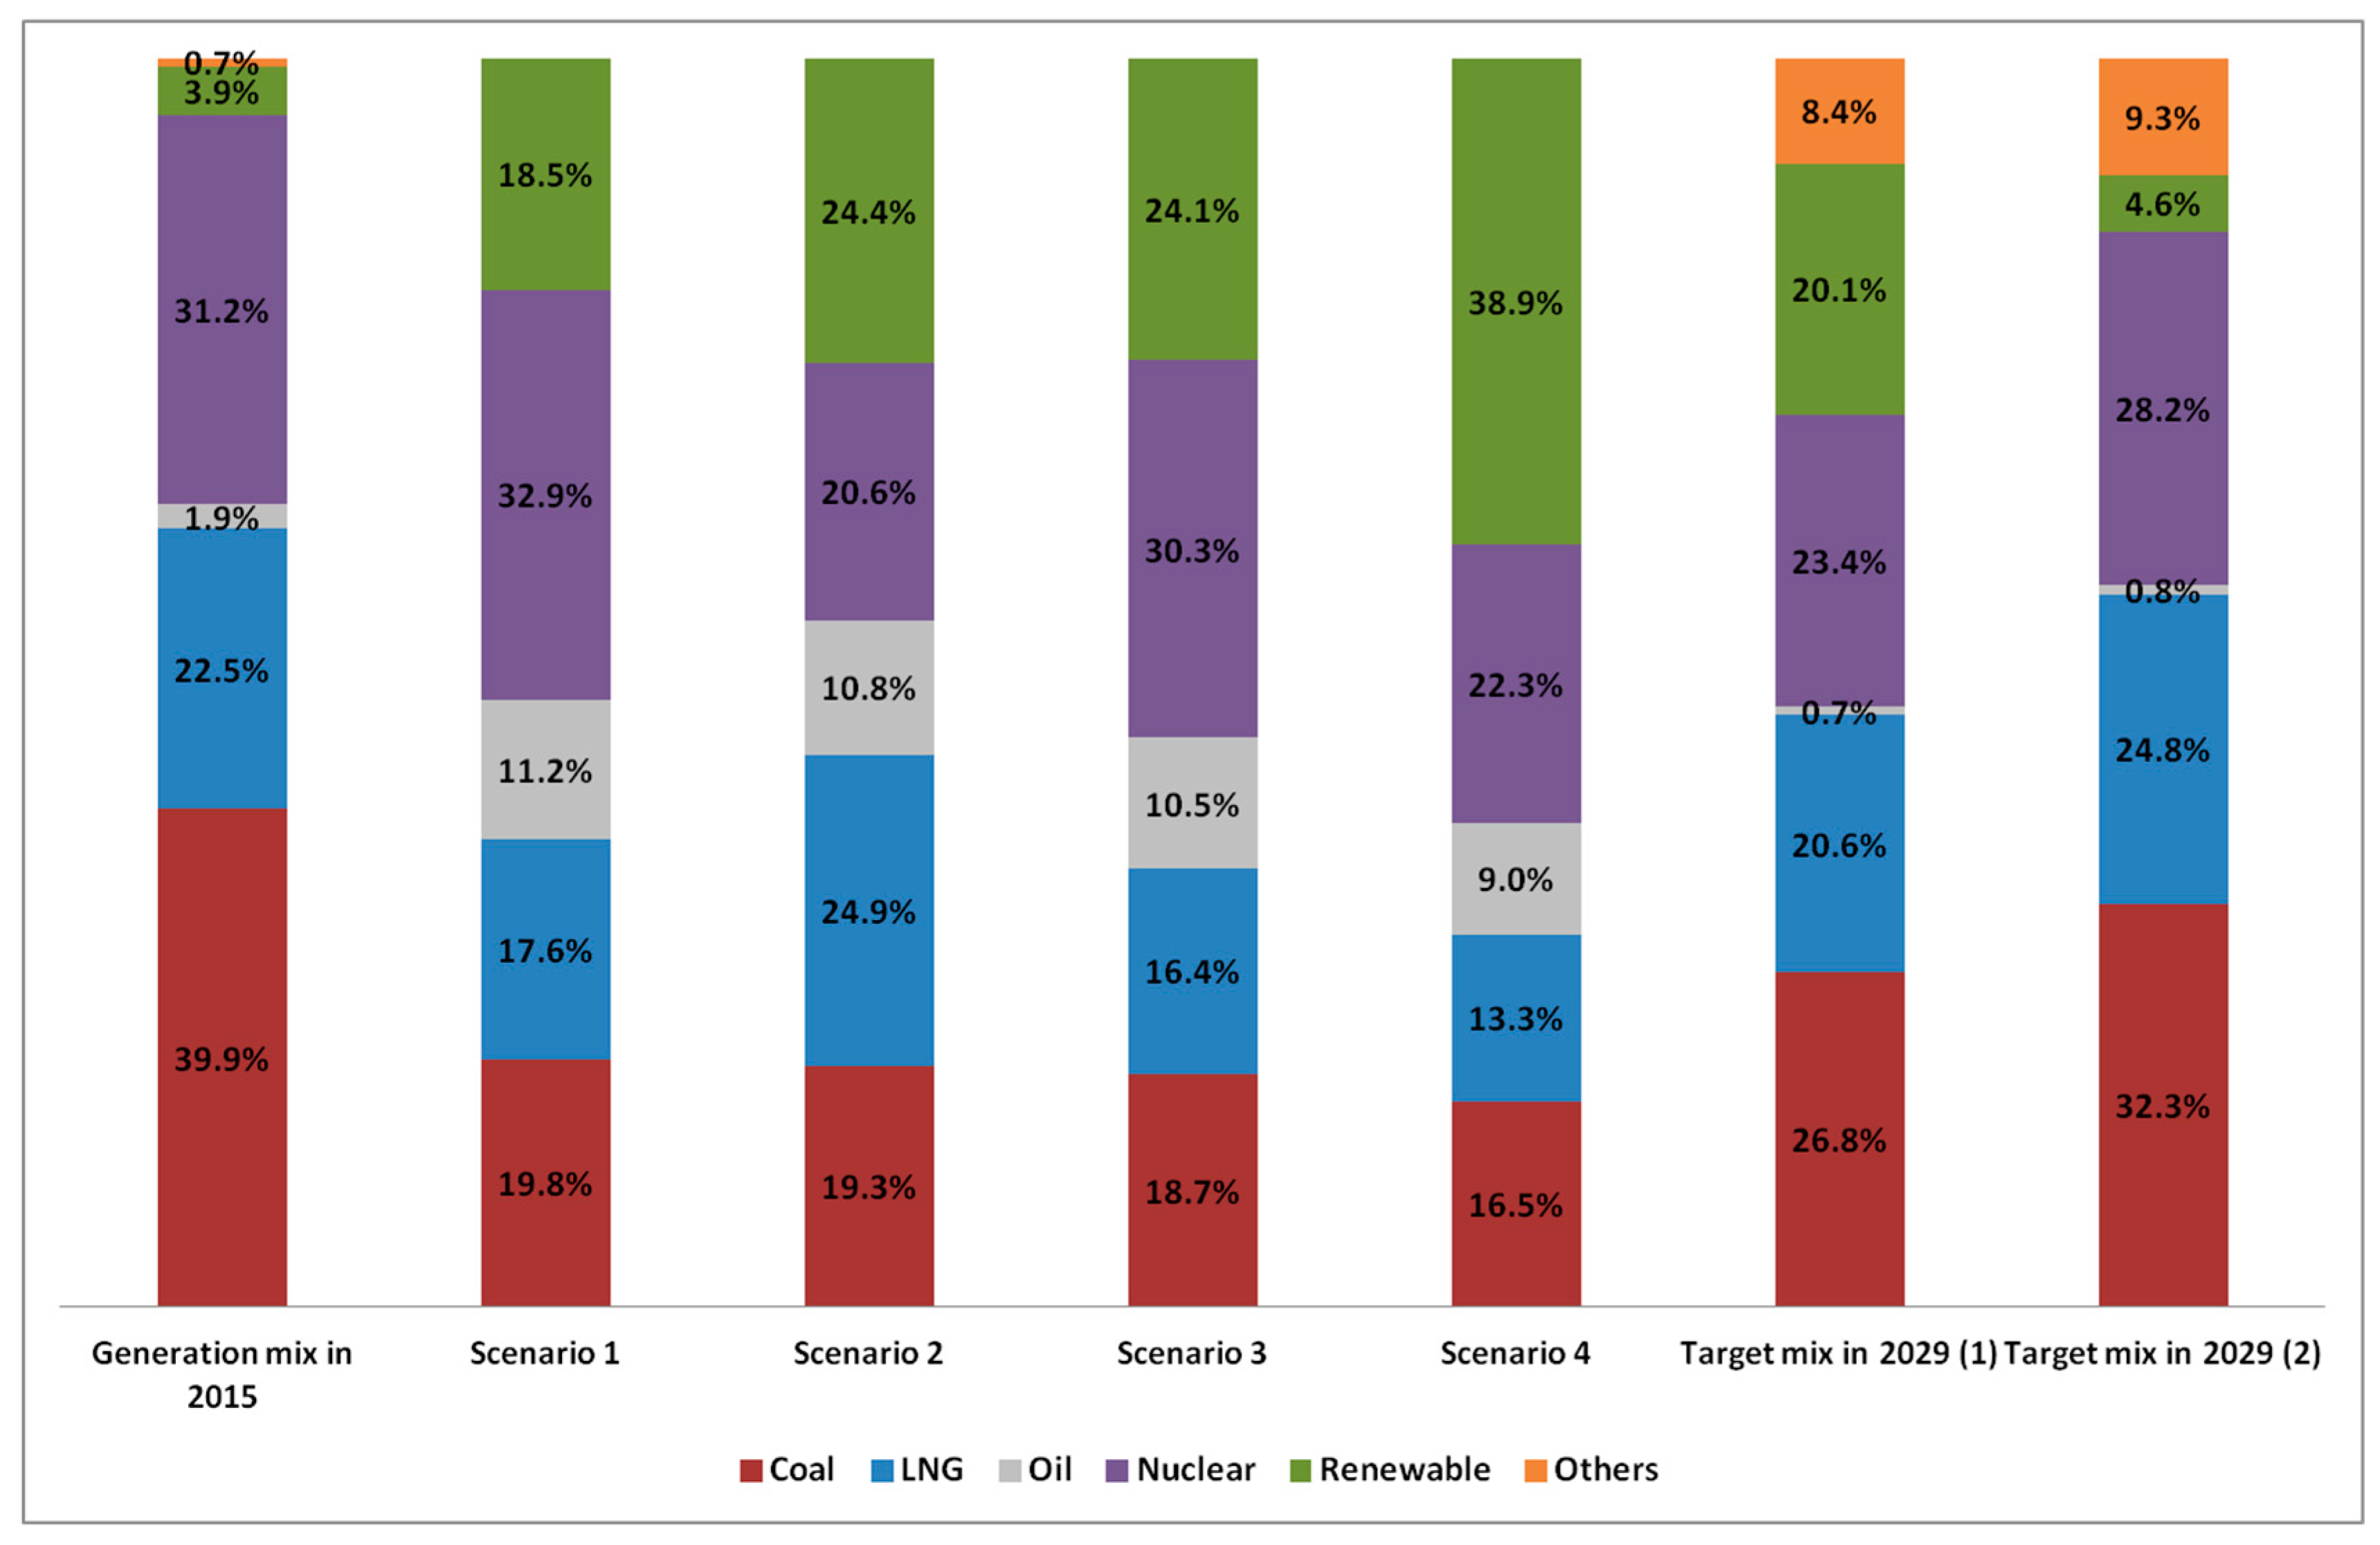
4.2. Development of the Electricity Mix from a Demand-Side Perspective
5. Conclusions
Acknowledgments
Author Contributions
Conflicts of Interest
Appendix A. Alternatives Used in the Discrete Choice Experiment

| Attributes | Type A | Type B | Type C | Type D |
|---|---|---|---|---|
| 1. Greenhouse gas emissions | 50% reduction | 0% reduction | 50% reduction | 100% reduction |
| 2. Fine particulate matter emissions | 100% reduction | 100% reduction | 50% reduction | 100% reduction |
| 3. Electricity charges | 100% increase | 50% decrease | 50% decrease | 0% increase |
| 4. Risk | Low | High | Low | High |
| 5. Annual outage time | About 30 min/year | About 30 min/year | About 30 min/year | About 30 min/year |
| 6. Dependence on the import of energy source | 100% import of energy source | 100% import of energy source | 0% import of energy source | 0% import of energy source |
| Choose the one which you most preferred | - | - | - | - |
| Attributes | Type A | Type B | Type C | Type D |
|---|---|---|---|---|
| 1. Greenhouse gas emissions | 100% reduction | 50% reduction | 0% reduction | 100% reduction |
| 2. Fine particulate matter emissions | 0% reduction | 100% reduction | 100% reduction | 100% reduction |
| 3. Electricity charges | 50% decrease | 0% increase | 50% decrease | 50% decrease |
| 4. Risk | High | Low | Low | High |
| 5. Annual outage time | About 0 min/year | About 0 min/year | About 0 min/year | About 30 min/year |
| 6. Dependence on the import of energy source | 100% import of energy source | 0% import of energy source | 100% import of energy source | 0% import of energy source |
| Choose the one which you most preferred | - | - | - | - |
| Attributes | Type A | Type B | Type C | Type D |
|---|---|---|---|---|
| 1. Greenhouse gas emissions | 100% reduction | 0% reduction | 50% reduction | 100% reduction |
| 2. Fine particulate matter emissions | 0% reduction | 0% reduction | 0% reduction | 50% reduction |
| 3. Electricity charges | 100% increase | 0% increase | 50% decrease | 0% increase |
| 4. Risk | Low | Low | High | High |
| 5. Annual outage time | About 30 min/year | About 30 min/year | About 0 min/year | About 0 min/year |
| 6. Dependence on the import of energy source | 100% import of energy source | 0% import of energy source | 0% import of energy source | 100% import of energy source |
| Choose the one which you most preferred | - | - | - | - |
| Attributes | Type A | Type B | Type C | Type D |
|---|---|---|---|---|
| 1. Greenhouse gas emissions | 100% reduction | 100% reduction | 0% reduction | 100% reduction |
| 2. Fine particulate matter emissions | 100% reduction | 50% reduction | 50% reduction | 100% reduction |
| 3. Electricity charges | 50% decrease | 50% decrease | 100% increase | 100% increase |
| 4. Risk | High | Low | High | Low |
| 5. Annual outage time | About 0 min/year | About 30 min/year | About 0 min/year | About 0 min/year |
| 6. Dependence on the import of energy source | 0% import of energy source- | 100% import of energy source | 0% import of energy source- | 100% import of energy source |
| Choose the one which you most preferred | - | - | - | - |
References
- Korea Energy Economics Institute. Yearbook of Energy Statistics; Korea Energy Economics Institute: Ulsan, Korea, 2016. (In Korean) [Google Scholar]
- Awerbuch, S. Portfolio-based electricity generation planning: Policy implications for renewables and energy security. Mitig. Adapt. Strateg. Glob. Chang. 2006, 11, 693–710. [Google Scholar] [CrossRef]
- Huang, Y.H.; Wu, J.H. A portfolio risk analysis on electricity supply planning. Energy Policy 2008, 36, 627–641. [Google Scholar] [CrossRef]
- Biegler, T. The Hidden Costs of Electricity: Externalities of Power Generation in Australia; The Australian Academy of Technological Sciences and Engineering: Parkville, Australia, 2009. [Google Scholar]
- Weinzettel, J.; Havránek, M.; Scasny, M. A consumption-based indicator of the external costs of electricity. Ecol. Indic. 2012, 17, 68–76. [Google Scholar] [CrossRef]
- Cabello, J.M.; Luque, M.; Miguel, F.; Ruiz, A.B.; Ruiz, F. A multiobjective interactive approach to determine the optimal electricity mix in Andalucía (Spain). Top 2014, 22, 109–127. [Google Scholar] [CrossRef]
- Rentizelas, A.; Georgakellos, D. Incorporating life cycle external cost in optimization of the electricity generation mix. Energy Policy 2014, 65, 134–149. [Google Scholar] [CrossRef] [Green Version]
- Purwanto, W.W.; Pratama, Y.W.; Nugroho, Y.S.; Warjito; Hertono, G.F.; Hartono, D.; Deendarlianto; Tezuka, T. Multi-objective optimization model for sustainable Indonesian electricity system: Analysis of economic, environment, and adequacy of energy sources. Renew. Energy 2015, 81, 308–318. [Google Scholar] [CrossRef]
- Sithole, H.; Cockerill, T.T.; Hughes, K.J.; Ingham, D.B.; Ma, L.; Porter, R.T.J.; Pourkashanian, M. Developing an optimal electricity generation mix for the UK 2050 future. Energy 2016, 100, 363–373. [Google Scholar] [CrossRef]
- Ryu, H.; Dorjragchaa, S.; Kim, Y.; Kim, K. Electricity-generation mix considering energy security and carbon emission mitigation: Case of Korea and Mongolia. Energy 2014, 64, 1071–1079. [Google Scholar] [CrossRef]
- Augutis, J.; Martišauskas, L.; Krikštolaitis, R. Energy mix optimization from an energy security perspective. Energy Conv. Manag. 2015, 90, 300–314. [Google Scholar] [CrossRef]
- Bhattacharya, A.; Kojima, S. Power sector investment risk and renewable energy: A Japanese case study using portfolio risk optimization method. Energy Policy 2012, 40, 69–80. [Google Scholar] [CrossRef]
- Vazhayil, J.P.; Balasubramanian, R. Optimization of India’s electricity generation portfolio using intelligent Pareto-search genetic algorithm. J. Electr. Power Energy Syst. 2014, 55, 13–20. [Google Scholar] [CrossRef]
- Ahn, J.; Woo, J.; Lee, J. Optimal allocation of energy sources for sustainable development in South Korea: Focus on the electric power generation industry. Energy Policy 2015, 78, 78–90. [Google Scholar] [CrossRef]
- Thangavelu, S.R.; Khambadkone, A.M.; Karimi, I.A. Long-term optimal energy mix planning towards high energy security and low GHG emission. Appl. Energy 2015, 154, 959–969. [Google Scholar] [CrossRef]
- Tahir, A.C.; Bañares-Alcántara, R. A knowledge representation model for the optimisation of electricity generation mixes. Appl. Energy 2012, 97, 77–83. [Google Scholar] [CrossRef]
- Vidal-Amaro, J.J.; Østergaard, P.A.; Sheinbaum-Pardo, C. Optimal energy mix for transitioning from fossil fuels to renewable energy sources: The case of the Mexican electricity system. Appl. Energy 2015, 150, 80–96. [Google Scholar] [CrossRef]
- Geem, Z.W.; Kim, J.H. Optimal energy mix with Renewable Portfolio Standards in Korea. Sustainability 2016, 8, 423. [Google Scholar] [CrossRef]
- Bronfman, N.C.; Jimenez, R.B.; Arevalo, P.C.; Cifuentes, L.A. Understanding social acceptance of electricity generation sources. Energy Policy 2012, 46, 246–252. [Google Scholar] [CrossRef]
- Heo, E. Global energy environment change and issues in Korea’s future energy mix. Korean Energy Econ. Rev. 2011, 10, 187–205. (In Korean) [Google Scholar]
- Contu, D.; Strazzera, E.; Mourato, S. Modeling individual preferences for energy sources: The case of IV generation nuclear energy in Italy. Ecol. Econ. 2016, 127, 37–58. [Google Scholar] [CrossRef]
- Van Rijnsoever, F.J.; Van Mossel, A.; Broecks, K.P.F. Public acceptance of energy technologies: The effects of labeling, time, and heterogeneity in a discrete choice experiment. Renew. Sustain. Energy Rev. 2015, 45, 817–829. [Google Scholar] [CrossRef]
- Willis, K.; Scarpa, R.; Gilroy, R.; Hamza, N. Renewable energy adoption in an ageing population: Heterogeneity in preferences for micro-generation technology adoption. Energy Policy 2011, 39, 6021–6029. [Google Scholar] [CrossRef]
- Yoo, J.; Ready, R.C. Preference heterogeneity for renewable energy technology. Energy Econ. 2014, 42, 101–114. [Google Scholar] [CrossRef]
- Foley, A.M.; Gallachóir, B.Ó.; Hur, J.; Baldick, R.; McKeogh, E.J. A strategic review of electricity systems models. Energy 2010, 35, 4522–4530. [Google Scholar] [CrossRef]
- Byun, H.; Lee, C.Y. Analyzing Korean consumers’ latent preferences for electricity generation sources with a hierarchical Bayesian logit model in a discrete choice experiment. Energy Policy 2017, 105, 294–302. [Google Scholar] [CrossRef]
- Grösche, P.; Schröder, C. Eliciting public support for greening the electricity mix using random parameter techniques. Energy Econ. 2011, 33, 363–370. [Google Scholar] [CrossRef]
- Kaenzig, J.; Heinzle, S.L.; Wustenhagen, R. Whatever the customer wants, the customer gets? Exploring the gap between consumer preferences and default electricity products in Germany. Energy Policy 2013, 53, 311–322. [Google Scholar] [CrossRef]
- Huh, S.Y.; Woo, J.; Lim, S.; Lee, Y.G.; Kim, C.S. What do customers want from improved residential electricity services? Evidence from a choice experiment. Energy Policy 2015, 85, 410–420. [Google Scholar] [CrossRef]
- Welsch, H.; Biermann, P. Electricity supply preferences in Europe: Evidence from subjective well-being data. Resour. Energy Econ. 2014, 38, 38–60. [Google Scholar] [CrossRef]
- Train, K.E. Discrete Choice Methods with Simulation, 3rd ed.; Cambridge University Press: New York, NY, USA, 2009. [Google Scholar]
- Zhu, Q.; Zhang, Z. On using individual characteristics in the MNL latent class conjoint analysis: An empirical comparison of the nested approach versus the regression approach. Mark. Bull. 2009, 20, 1–12. [Google Scholar]
- Greene, W.H.; Hensher, D.A. A latent class model for discrete choice analysis: Contrasts with mixed logit. Transp. Res. Part B Methodol. 2003, 37, 681–698. [Google Scholar] [CrossRef]
- Magidson, J.; Vermunt, J.K. Latent class models for clustering: A comparison with K-means. Can. J. Mark. Res. 2002, 20, 37–44. [Google Scholar]
- Goett, A.A.; Hudson, K.; Train, K.E. Customers’ choice among retail energy suppliers: The willingness-to-pay for service attributes. Energy J. 2000, 21, 1–28. [Google Scholar] [CrossRef]
- Borchers, A.M.; Duke, J.M.; Parsons, G.R. Does willingness to pay for green energy differ by source? Energy Policy 2007, 35, 3327–3334. [Google Scholar] [CrossRef]
- Gracia, A.; Barreiro-Hurle, J.; Perez, L.P. Can renewable energy be financed with higher electricity prices? Evidence from a Spanish region. Energy Policy 2012, 50, 784–794. [Google Scholar] [CrossRef]
- Van Putten, M.; Lijesen, M.; Ozel, T.; Vink, N.; Wevers, H. Valuing the preferences for micro-generation of renewables by househoulds. Energy 2014, 71, 596–604. [Google Scholar] [CrossRef]
- Korea Electric Power Corporation. The Monthly Report on Major Electric Power Statistics; Korea Electric Power Corporation: Naju, Korea, 2016. (In Korean) [Google Scholar]
- Chen, X.; Peterson, M.N.; Hull, V.; Lu, C.; Lee, G.D.; Hong, D.; Liu, J. Effects of attitudinal and sociodemographic factors on pro-environmental behavior in urban China. Environ. Conserv. 2011, 38, 45–52. [Google Scholar] [CrossRef]
- Kim, Y.; Kim, W.; Kim, M. An international comparative analysis of public acceptance of nuclear energy. Energy Policy 2014, 66, 475–483. [Google Scholar] [CrossRef]
- National Energy Technology Laboratory. Life Cycle Greenhouse Gas Emissions: Natural Gas and Power Production. 2015. Available online: https://www.eia.gov/conference/2015/pdf/presentations/skone.pdf (accessed on 27 July 2017).
- Commission for Environment Cooperation. North American Power Plant Air Emissions. 2011. Available online: http://www3.cec.org/islandora/en/item/10236-north-american-power-plant-air-emissions-en.pdf (accessed on 27 July 2017).
- Ebright, R. Nuclear Power: An Environmental Friendly, Clean, Reliable and Safe Electrical Power Source for Today and for the Future. 2011. Available online: https://energy.nd.edu/assets/37714/ebright_slides_02_21_20112.pdf (accessed on 27 July 2017).
- Shin, J.; Woo, J.; Huh, S.Y.; Lee, J.; Jeong, G. Analyzing public preferences and increasing acceptability for the Renewable Portfolio Standard in Korea. Energy Econ. 2014, 42, 17–26. [Google Scholar] [CrossRef]
- International Energy Agency. Projected Costs of Generating Electricity, 2015th ed.; OECD: Paris, France, 2015. [Google Scholar]
- Bloomberg New Energy Finance. Levelized Cost of Electricity Update: H1 2016. 2016. Available online: https://about.bnef.com/ (accessed on 27 July 2017).
- So, J. A Study on Economics of Solar and Wind Power Generation with Emphasis on Grid Stability; Korea Energy Economics Institute: Ulsan, Korea, 2014. (In Korean) [Google Scholar]
- Lee, C.Y. Forecasting Price for the Renewable Energy Certificate in South Korea; Korea Energy Economics Institute: Ulsan, Korea, 2015. (In Korean) [Google Scholar]
- Verbruggen, A. Renewable and nuclear power: A common future? Energy Policy 2008, 36, 4036–4047. [Google Scholar] [CrossRef]
- Aguilera, R.F. The role of natural gas in a low carbon Asia Pacific. Appl. Energy 2014, 113, 1795–1800. [Google Scholar] [CrossRef]
- Korea Power Exchange. Power Market Statistics in 2015; Korea Power Exchange: Naju, Korea, 2016. (In Korean) [Google Scholar]
- Korean Government Ministry of Trade Industry and Energy (MOTIE). The 7th Basic Plan of Long-Term Electricity Supply and Demand; MOTIE: Sejong, Korea, 2015. (In Korean) [Google Scholar]
- Orme, B. Formulating Attributes and Levels in Conjoint Analysis; Sawtooth Software: Washington, DC, USA, 2002. [Google Scholar]
| Attributes | Level |
|---|---|
| Greenhouse gas emissions | No greenhouse gas emissions (100% reduction) Greenhouse gas emissions at half the level of fossil fuel (50% reduction) Greenhouse gas emissions at the level of fossil fuel (0% reduction) |
| Fine particulate matter emissions (Air pollutant emission) | No occurrence of fine particulate matter (100% reduction) Occurrence of fine particulate matter at half the current level (50% reduction) Occurrence of fine particulate matter at the current level (0% reduction) |
| Electricity charges | Half of current electricity charges (50% decrease, 63 KRW/kWh) Current level of electricity charges (0% increase, 125 KRW/kWh) Twice the current electricity charges (100% increase, 250 KRW/kWh) |
| Risk | High: possible local damage such as radiation poisoning Low: almost no damage from earthquake or war |
| Annual outage time (electric-power supply stability) | About 0 min/year (almost no outage per household in a year) About 30 min/year (about 30-min outage per house in a year) |
| Dependence on the import of energy source | 0% import of energy source 100% import of energy source |
| Characteristics | Number of Respondents | Component Ratio (%) | |
|---|---|---|---|
| Total | 615 | 100 | |
| Gender | Male | 311 | 50.6 |
| Female | 304 | 49.4 | |
| Age | 19–29 | 108 | 17.6 |
| 30–39 | 112 | 18.2 | |
| 40–49 | 130 | 21.1 | |
| 50–59 | 126 | 20.5 | |
| >60 | 139 | 22.6 | |
| Education Level | Under High school | 197 | 32.0 |
| College | 36 | 5.9 | |
| University | 19 | 3.1 | |
| Above graduate school | 363 | 59.0 | |
| Average Monthly Income (USD) | 3748 | ||
| Attribute | Estimates | Standard Deviation | MWTP | RI |
|---|---|---|---|---|
| Greenhouse gas emission reduction (1%) | 0.0146 *** | 0.0029 | 1.37 KRW/kWh·% | 21.5% |
| Fine particulate matter emission reduction (1%) | 0.0144 *** | 0.0029 | 1.35 KRW/kWh·% | 21.2% |
| Electricity charges (KRW/kWh) | −0.0107 *** | 0.0024 | - | 29.3% |
| Risk (High = 1) | −0.5763 *** | 0.2179 | −54.08 KRW/kWh | 8.5% |
| Annual outage (1 min) | −0.0174 *** | 0.0037 | −1.63 KRW/kWh·min | 7.7% |
| Dependence on the import of energy source (1%) | −0.0081 *** | 0.0009 | −0.76 KRW/kWh·% | 11.9% |
| Attribute | Estimates | Standard Deviation | MWTP | RI |
|---|---|---|---|---|
| Greenhouse gas emission reduction (1%) | 0.0000 | 0.0013 | 0.01 KRW/kWh·% | 0.1% |
| Fine particulate matter emission reduction (1%) | −0.0053 *** | 0.0018 | −0.94 KRW/kWh·% | 12.7% |
| Electricity charges (KRW/kWh) | −0.0057 *** | 0.0009 | - | 25.1% |
| Risk (High = 1) | −1.6199 *** | 0.1961 | −286.47 KRW/kWh | 38.5% |
| Annual outage (1 min) | −0.0168 *** | 0.0051 | −2.97 KRW/kWh·min | 12.0% |
| Dependence on the import of energy source (1%) | −0.0049 *** | 0.0008 | −0.87 KRW/kWh·% | 11.7% |
| Variable | Estimates | Standard Deviation | |
|---|---|---|---|
| Characteristics of class 1 compared to class 2 | Gender | 0.1852 | 0.2151 |
| Age | 0.0233 *** | 0.0079 | |
| Household income | −0.0998 ** | 0.0476 | |
| Constant | −0.6855 | 0.4291 |
| Power Source Type | Greenhouse Gas Reduction (%) | Fine Particulate Matter Reduction (%) | Risk (High = 1) | Annual Outage (min) | Dependence on the Import (%) | SC 1 | SC 2 | SC 3 | SC 4 |
|---|---|---|---|---|---|---|---|---|---|
| LCOE (KRW/kWh) | |||||||||
| Coal | 0 | −108.3 | 0 | 0 | 98.41 | 93.89 | 89.60 | 93.89 | 93.89 |
| LNG | 56.6 | 42.2 | 0 | 0 | 99.12 | 132.83 | 91.84 | 132.83 | 132.83 |
| Oil | 2.1 | 1.1 | 0 | 0 | 100 | 150.29 | 150.29 | 150.29 | 150.29 |
| Nuclear | 96.7 | 98.7 | 1 | 0 | 100 | 45.27 | 105.28 | 45.27 | 45.27 |
| Renewables | 92.8 | 78.0 | 0 | 30 | 10 | 191.20 | 166.88 | 210.60 | 125.79 |
| Scenario | Respondents | Coal | LNG | Oil | Nuclear | Renewables |
|---|---|---|---|---|---|---|
| SC 1 (Baseline) | Total | 19.8% | 17.6% | 11.2% | 32.9% | 18.5% |
| Class 1 | 2.3% | 14.6% | 4.0% | 56.3% | 22.8% | |
| Class 2 | 38.0% | 20.7% | 18.7% | 8.7% | 13.9% | |
| SC 2 | Total | 19.3% | 24.9% | 10.8% | 20.6% | 24.4% |
| Class 1 | 2.5% | 24.6% | 4.4% | 35.3% | 33.1% | |
| Class 2 | 36.6% | 25.2% | 17.5% | 5.4% | 15.3% | |
| SC 3 | Total | 18.7% | 16.4% | 10.5% | 30.3% | 24.1% |
| Class 1 | 2.1% | 13.4% | 3.7% | 51.8% | 29.0% | |
| Class 2 | 35.9% | 19.5% | 17.6% | 8.1% | 19.1% | |
| SC 4 | Total | 16.5% | 13.3% | 9.0% | 22.3% | 38.9% |
| Class 1 | 1.5% | 9.7% | 2.7% | 37.3% | 48.9% | |
| Class 2 | 32.0% | 17.0% | 15.5% | 6.9% | 28.6% |
| Scenarios | Coal | LNG | Oil | Nuclear | Renewables |
|---|---|---|---|---|---|
| SC 1 | 35.7%p | 6.2%p | 14.6%p | 47.6%p | 8.9%p |
| SC 2 | 34.0%p | 0.6%p | 13.0%p | 29.8%p | 17.8%p |
| SC 3 | 33.8%p | 6.1%p | 13.9%p | 43.7%p | 10.0%p |
| SC 4 | 30.5%p | 7.4%p | 12.8%p | 30.4%p | 20.3%p |
| Average | 33.5%p | 5.1%p | 13.6%p | 37.9%p | 14.3%p |
© 2017 by the authors. Licensee MDPI, Basel, Switzerland. This article is an open access article distributed under the terms and conditions of the Creative Commons Attribution (CC BY) license (http://creativecommons.org/licenses/by/4.0/).
Share and Cite
Huh, S.-Y.; Lee, C.-Y. A Demand-Side Perspective on Developing a Future Electricity Generation Mix: Identifying Heterogeneity in Social Preferences. Energies 2017, 10, 1127. https://doi.org/10.3390/en10081127
Huh S-Y, Lee C-Y. A Demand-Side Perspective on Developing a Future Electricity Generation Mix: Identifying Heterogeneity in Social Preferences. Energies. 2017; 10(8):1127. https://doi.org/10.3390/en10081127
Chicago/Turabian StyleHuh, Sung-Yoon, and Chul-Yong Lee. 2017. "A Demand-Side Perspective on Developing a Future Electricity Generation Mix: Identifying Heterogeneity in Social Preferences" Energies 10, no. 8: 1127. https://doi.org/10.3390/en10081127