An Energy Efficient Lighting Design Strategy to Enhance Visual Comfort in Offices with Windows


1
School of Design, Creative Industries Faculty, Queensland University of Technology (QUT), Brisbane 4001, Australia
2
School of Chemistry, Physics and Mathematical Engineering, Science and Engineering Faculty, Queensland University of Technology (QUT), Brisbane 4001, Australia
*
Author to whom correspondence should be addressed.
Energies 2017, 10(8), 1126; https://doi.org/10.3390/en10081126
Submission received: 12 June 2017
/
Revised: 24 July 2017
/
Accepted: 28 July 2017
/
Published: 1 August 2017
(This article belongs to the Special Issue Smart Lighting Environments: Sensing and Control)
Abstract
:A high luminance contrast between windows and surrounding surfaces can increase the risk of discomfort glare, which can diminish office workers’ satisfaction and productivity. Accordingly, it can lead to occupant interventions, such as drawing window blinds or increasing electric light levels, which are intended to enhance indoor visual comfort but counterproductively act to increase energy consumption. Increasing the luminance of the areas surrounding the windows using a supplementary lighting system, such as wall-washing with light emitting diode (LED) linear luminaires, could reduce discomfort glare arising from windowed walls. This paper reports on the results of a study in a typical office room in Brisbane, Australia. The outcomes of this study indicate that creating a luminance contrast of between 11:1 and 12:1 on the window wall in an office room with a 45% window-to-exterior-wall ratio using a supplementary LED system leads to improved subjective assessments of window appearance. The results suggest that such an enhancement could significantly reduce discomfort glare from windows, as well as diminishing the likelihood of the users intending to turn on the ceiling lights or to move the blinds.
1. Introduction
The significance of utilizing daylight inside buildings has been highlighted by several studies [1,2,3,4]. Daylight availability in buildings provides a vehicle to adapt and control the environment in sustainable ways in order to enhance energy efficiency [5]. While lighting is estimated to represent roughly 40% of total electric usage in office buildings, it has been reported that daylight harvesting can lead to 20–77% savings in the lighting consumption of buildings [6,7]. Daylight availability inside buildings can also have multiple health advantages for building users, such as decreasing fatigue, relieving seasonal affective disorder, and diminishing depressive symptoms [8]. Access to daylight can provide information about time and weather, as well as reducing feelings of isolation, stress, and claustrophobia [9,10]. Research suggests that daylighting in working environments is associated with higher satisfaction and productivity, lower absenteeism, and a positive attitude [11,12].
Office buildings usually rely on side daylighting strategies through vertical windows for daylight harvesting. The outcomes of a large field study illustrated that office workers’ satisfaction with indoor lighting were most strongly influenced by access to windows in their working environment that can provide both natural light and an outside view [13]. Vertical windows influence both the energy consumption of buildings and the visual comfort of the occupants [14]. A building with a typical facade, which has about a 30–40% window-to-external-wall ratio, is likely to consume less energy than a building with a fully glazed façade [15]. Meek and Wymelenberg [15] argue that the distribution of daylight illumination across a floor area remains similar when the window wall ratio is between 30% and 40% or above 40%.
Therefore, while vertical windows are often found in existing office buildings, they usually create high and variable brightness, particularly when they are limited to a small portion of the window wall [15]. The resulting luminance contrast (LC) between the window surface and the immediate surrounds can cause discomfort glare, especially when windows are in the occupants’ field of view (FOV). Discomfort glare may not necessarily impair visual performance (unlike disability glare), but may cause certain physiological and psychological symptoms, such as headache or stress, over time [16]. It may also lead to interventions by the occupants in lighting conditions; for example, through closing blinds and/or turning on the lights to improve indoor visual comfort. Given that occupants typically leave the blinds closed even when the source of discomfort glare is long gone, occupant interventions in lighting conditions can reduce the designed energy savings achieved through the use of daylighting.
As such, there is a significant motivation to explore daylighting strategies that limit the occupants’ experience of glare. The largest field study on the effectiveness of side-lighting controls for daylighting (examining 123 buildings with installed photosensor-control systems) illustrated that there is a relatively constant relationship between the amount of illuminance from windows and the turning on of lights by occupants, even when dimming control systems work perfectly [17]. In addition, this study showed that, as the illuminance from windows increases, the likelihood of turning on the lights to diminish LC increases up to 60%. Heschong, et al. [17] also illustrated that less than 25% of the predicted (modeled) energy savings arising from daylight harvesting systems were being realized in practice. This tendency to turn on indoor lighting as the illuminance from windows increases suggests an attempt by occupants to reduce the contrast between windows and the surrounding wall.
2. Luminance Contrast
While it is essential to provide a good task visibility with no distracting glare in office spaces [5], building professionals and lighting designers are frequently challenged to control glare inside buildings [18]. Glare inside buildings usually occurs as a result of lighting systems, and there is a linear association between the average luminance of glare patches and the average luminance of the visual field [19,20]. Discomfort glare can be prevented through the limiting of the absolute lighting level of any surface, daylight element, windows, or electric lights [21]. It is well understood that some amount of LC is necessary to improve visual performance [22]; however, high LC should be avoided to prevent discomfort glare.
According to Bean [23], vertical surfaces in an environment play a significant role in the perception of discomfort glare, and a range of specific luminance contrasts have been suggested for different applications. The Chartered Institution of Building Services Engineers (CIBSE) and the Illuminating Engineering Society of North America (IESNA) recommend that the LC between light sources and adjacent areas, and anywhere within the normal FOV, should be less than 20:1 and 40:1, respectively [5,24]. The Swedish Agency for Economic and Regional Growth (NUTEK) in Sweden has stricter recommendations: that the luminance contrasts between any points within FOV should not exceed 1:20 [5]. Other recommendations suggest that the LC between the task surface, immediate surrounds, and distant areas should be less than the ratios 1:3:10 [25]. Despite these recommendations, there is a limited investigation of what LC provides in term of optimal visual comfort, and whether this LC changes at different levels of overall illuminance and office settings.
Rating tools exist to assess indoor environment quality and the energy performance of buildings, such as the Building Research Establishment Environmental Assessment Method (BREEAM), the Leadership in Energy and Environmental Design (LEED), and Green Star [26]. As an example, the Green Star environmental rating system is a recognised rating tool, which has been launched and developed by the green building council of Australia (GBCA) since 2003 [27]. However, these rating systems may not capture visual comfort effectively. A previous study in Brisbane, Australia found that roughly 50% of full-time employees who work in buildings that are at least five-star rated by GBCA experience discomfort glare from daylight sources at their computer unit [28,29]. Another study with 2540 participants in 36 sustainable (green) buildings across 11 countries also indicated that glare from daylight is a major issue.
3. Novel Strategies to Reduce Window Wall Luminance Contrast
Innovative side and top daylighting systems have been developed to enhance indoor lighting quality in office buildings. The main aim of these systems is to send daylight deeper into the building, while simultaneously reducing glare from sunrays and excessive solar gains [30,31]. This is mainly achieved by using optical devices, materials, and elements, including louvres, blinds, lightshelves, screens, and light filters, especially in side-lit office buildings. According to Mayhoub [32], the major challenges of the existing daylighting strategies are the maintainance of daylighting quality, cost-efficiency, applicability, and ease of installation and operation to penetrate the market. Accordingly, the market penetration of some of the existing innovative daylighting systems is very limited due to their high cost and risk of discomfort glare [33].
For existing office buildings, one potential strategy to reduce the LC between window and wall (and therefore improve window appearance) is to increase the luminance of the areas immediately surrounding the window. This could be achieved by mounting a light emitting diode (LED) linear luminaire around the window frame, the use of which (over time) would result in lower energy consumption than occupant use of the indoor lighting system to its full capacity. The benefit of using such a supplementary LED lighting system is that it can be fitted into existing buildings with minimal construction modifications and at a low cost.
This study builds on previous work which investigated visual comfort in two single typical office rooms with dissimilar orientations (southwest and northwest) and window types (punch window and strip window) in Brisbane, Australia. These rooms were chosen because of their window wall ratios, which were approximately 40%, typical of many office environments and likely to consume less energy than a fully glazed facade. A preliminary study with 35 participants conducted in an office room facing southwest with a punch window suggested that a supplementary LED system of approximately 18 W could reduce the LC on the window wall from values in the order of 117:1 to 33:1 under sunny sky conditions [34]. It also indicated that this supplementary strategy could diminish the mean users’ intention to turn on the ceiling lights by approximately 27%, as well as reducing the probability of moving the blind down to up to 90%. Furthermore, another study in the same test office room reported that increased electricity consumption of an approximately 18 W LED lighting system is offset where there is roughly a one-fourth reduction in users’ intention to intervene in lighting conditions [35].
The hypothesis of the current study is that the use of linear LED luminaires, mounted around the window frame so as to wash the window wall with light, would increase visual comfort in typical single office rooms, as well as reducing negative occupant interventions in lighting conditions. The aim of this study is to demonstrate the impact of using a supplementary LED lighting system on the occupants’ scale appraisal of window appearance, as well as their propensity to intervene in lighting conditions. This study examines how occupants might respond to different luminance patterns brought about by changes to lighting design. Specifically, it investigates whether a mounted LED wall-washing strategy to enhance window appearance by reducing LC between window and the surrounding wall can reduce occupant visual discomfort and intention to intervene in lighting conditions. Furthermore, although a uniform luminance distribution across a room is generally not desirable, the most acceptable LC for the visual comfort of the occupants is still unknown [5]. As a result, this study investigates the effects of a range of light intensity levels from a proposed LED wall-washing system on the perceived window appearance and indoor visual quality. This investigation will enhance our understanding of an integrated lighting design solution for a better acceptance of the window appearance, which could reduce the intention of the occupants to intervene in lighting conditions. The outcomes of this study present a valuable insight into how a supplementary LED lighting system could increase energy savings in typical office buildings through the improvement of window appearance.
4. Method
This study used a repeated-measures design to assess participant ratings of discomfort glare and lighting acceptability under four different lighting conditions: no supplementary lighting (condition 1), and LED wall-washing of the window surrounds at three different power levels (low power level with about 18 W, medium power level with around 24 W, and high power level with approximately 30 W: conditions 2, 3 and 4, respectively). Following a random presentation of the lighting conditions, participants were asked to adjust the luminaire power of the lighting LED system to their preferred comfort level. Forty participants with normal or corrected to normal vision participated in this study. Table 1 describes the demographic characteristics of the participants.
4.1. Experimental Setting
The experiment was conducted in a typical office room in Brisbane, Australia from December 2015 to March 2016. The selected test office room was a single office room facing northwest and located on the seventh floor of a seven-story building at Gardens Point Campus of Queensland University of Technology (QUT). The central business distinct (CBD) of Brisbane and the sky can be seen from inside this room. The room was 4.22 m deep by 2.93 m wide and 2.6 m high with white walls, white ceiling tiles, and a floor finished with grey carpet. Daylight penetration was controlled by external shading projecting horizontally from the top of the window wall, as well as a manual fabric roller blind inside the room. The window of this room had a head height at 2.4 m, a sill height at 1.05 m, and a window width of 2.38 m, resulting in a window wall ratio inside this office room of approximately 45%. The room was furnished with an L-shaped desk and chair, which were located in front of the window, with the chair located at about a 45° angle to the window surface. The room had two recessed mounted fluorescent luminaires with a channel diffuser, which could only be turned on or off together. Figure 1 shows the furniture plan and sections of this office room.
4.2. Supplementary LED Lighting Intervention
Cool-light LED linear luminaires with a correlated colour temperature (CCT) of 6000 K to 6500 K were chosen to manipulate the lighting contrast in the FOV of participants by providing a wall-washing light on surfaces around the window. They were pre-assembled in a channel diffuser to reduce the bright spots generally associated with LED strip lighting and to distribute light evenly. The proposed LED strategy was chosen both because of its energy efficiency and for its convenience as an “off-the-shelf”, pre-assembled luminaire system. Each luminaire contained an LED light strip with 30 mm width, 12 mm height, and 513 mm length. Each LED strip had luminaire power of 9 W and needed a constant-voltage driver to convert mains voltage (240 V) to 12 V. They were also equipped with a suitable compatible dimmer switch to enable adjustment of the light level from 0 to 100%. Six metal surfaces with 525 mm length and 8 mm width, which were bent at a 45° angle, were used to shield the participants from direct view of the LED and facilitate the wall-washing function (See Figure 1). The LED luminaires were mounted on the left window side with head height at 2.2 m and on the bottom of the window surface to illuminate the walls surrounding the window (see Figure 1).
4.3. Questionnaire
Upon presentation of different lighting scenes using the LED system at different power levels, the participants responded to lighting appraisal questions designed to assess their ratings of discomfort glare and indoor visual comfort, as well as their intention to turn on the ceiling lights or move the blind down. The questions in this study were closed question types to allow the comparability of participant responses on a standard scale. The number of questions used in this survey was kept to a minimum to avoid fatiguing or boring the respondent, while still capturing the information required. It is frequently challenging to find predictable, practical relationships between a physical stimulus and a subjective reaction in the field of lighting; however, many studies have asked participants to rate their perceived discomfort glare from daylight using descriptors of imperceptible, perceptible, disturbing, and intolerable [36,37,38]. In this study, these descriptors were used to elicit participant ratings of perceived discomfort glare, as well as semantic differential (SD) rating scales using a set of bipolar adjectives, which were used to gather ratings regarding the suitability of the lighting environment.
Figure 2 shows the questions that were used in this study. The questionnaire was divided into three sections. The first part of the questionnaire collected demographic and personal information relevant to the participant’s glare susceptibility, and addressed (1) the participants’ gender and age group, (2) the use of prescription glasses or contact lenses, and (3) whether they considered themselves as a glare-sensitive person (rated using SD scaling).
The second section of the survey was administered during the experiment, and researchers verbally asked participants to rate their discomfort and satisfaction of each of the four different luminaire power conditions as they were presented. In each section, the first question asked participants to rate the level of perceived discomfort glare from the window when it was in their field of view on the following scale: imperceptible, perceptible, disturbing, and intolerable. To reduce uncertainty over the meaning of each discomfort glare descriptor used in this research, the borderline between imperceptible and perceptible was defined as the turning point where discomfort glare would first be noticed. Furthermore, the borderline between disturbing and intolerable glare was defined as the changeover point where participants would no longer be able to tolerate the lighting conditions. The second question asked participants to rate the indoor visual comfort on a scale of 1–5, where one was very dissatisfied, two was somewhat dissatisfied, three was indifferent, four was somewhat satisfied, and five was very satisfied. The borderline between somewhat dissatisfied and very dissatisfied was defined as the changeover point where participants would no longer tolerate indoor lighting conditions for working with a laptop. The boundary between somewhat satisfied and very satisfied was defined as the turning point where indoor visual quality could be slightly improved for working with a laptop. Finally, the last two questions of each section asked participants whether they wanted to move the blind down or turn on the ceiling lights, using a yes/maybe/no answer format.
Finally, participants were asked to indicate their LC preferences while ceiling lights are off. In this section, participants were asked to adjust the luminaire power of the LED strip cases to a setting where they felt more comfortable with the window appearance, and then the closest luminaire power to the luminaire of LED system was recorded. The second question asked whether the participants still perceived discomfort glare from the window (yes/no answer) after changing the power settings. Finally, the last two questions asked participants whether they intended to move the blind down or turn on the ceiling lights to improve the indoor lighting quality (answering yes, maybe, or no).
4.4. Lighting Measures
Physical lighting measures (luminance and illuminance) were collected during each stage of the experiment using a Nikon Coolpix 8400 digital camera (Nikon Corporation, Tokyo, Japan) with a fisheye lens, as well as Konica Minolta LS100 (Konica Minolta, Tokyo, Japan) luminance and Topcon IM-3 (Topcon Technohouse Corporation, Tokyo, Japan) illuminance meters. The digital camera was used to take high dynamic range (HDR) images to observe the luminance distribution at the window and the surrounding surfaces. To capture a field of view which is relatively similar to the human eye, an FC-E9 fisheye lens (focal length = 5.6 mm, 190° field of view) was used. The camera was located as close as practically possible to the heads of the participants, using a tripod (see Figure 1). Multiple pictures of the same scene were captured during each experiment to achieve a single HDR image with relative luminance (using Photosphere software (Anyhere Software, Berkeley, CA, USA)). The luminance meter (LS100) was used to measure the luminance value of a single white spot inside the room for HDR calibration in Photosphere, using the response curve of the camera and attached lens. The illuminance meter was used to record the illuminance measurement on the working plane (the desk in the test room), which was 0.72 m above the floor and 0.6 m from the window.
4.5. Procedure
To reduce variation in factors associated with the time of day, such as external brightness and temperature, experimental sessions were conducted between 11 am and 2 pm under clear sky conditions. However, the participants were not able to see the sun at any point during the test conditions. Participants completed the study individually in the test office room, and before commencing the experiment, participants were asked to sit in the office room for at least five minutes to adapt to the indoor ambient light. Participants sat at an approximately 45° angle to, and approximately 1.5 m away from, the window wall surface. The researcher stood behind them. A 13ʺ MacBook Air was located on the working plane in front of the participants at about a 45° angle to the window surface (see Figure 1 and Figure 6). A diagonal arrangement of the workstation was selected to reduce the participants’ intention to move their head or to deviate their sight between the visual display unit (VDU) and the window during the experiment, and to ensure that the VDU did not obstruct the window view. During the first five minutes, each participant was clearly informed of the purpose of the research and was shown the light measurement tools.
Figure 3 indicates the process of each experimental session. The participants were asked to complete the first section of the questionnaire themselves. Then, participants were asked to use the provided laptop while each lighting condition was presented in a random order. They were asked to surf the internet or to read an article online. After taking quantitative measurements of luminance and illuminance, during which participants were adapting to the change in lighting, the researcher completed the second section of the questionnaire by directly asking the survey questions to the participants. This enabled participants to remain focused on the VDU during the experiment. The four different lighting conditions were tested randomly to eliminate order effects. The same questions were asked over the course of all four conditions, and the participants were asked to work with the provided laptop while responding to the questions.
After rating the randomly-presented four lighting conditions, participants were asked to adjust the lighting level of the LED luminaires to a power setting at which they perceived the least amount of discomfort glare from the window appearance while working on the provided laptop. The aim of this stage was to give freedom to the participants to adjust the LC on the window wall themselves using the proposed LED system. After collecting physical lighting measures, the researcher filled in the third part of the questionnaire by directly asking the survey questions to the participants.
5. Results
Physical measurements and responses to the participant survey questions were entered into IBM SPSS version 23 for further analysis. Descriptive and inferential analyses are reported in Section 5.1, Section 5.2, Section 5.3, Section 5.4, Section 5.5 and Section 5.6.
5.1. Participants
Table 1 shows the collected demographic data of the participants, including their gender, age, use of corrective lenses, and their glare sensitivity. There were slightly more male than female participants, most were below thirty years old, more than half reported wearing glasses for at least some tasks, and 44% of participants reported being moderately or very much sensitive to glare.
Ratings of glare sensitivity did not differ across gender. The average reported glare sensitivity for males was 3.18 (SD = 0.11, reported on a 1 to 5 scale where 1 was not at all and 5 was very much), and for females it was 3.17 (SD = 0.129). Perceived discomfort glare ratings during the first four test conditions were similar for males (M = 2.00, SD = 0.08) and females (M = 1.85, SD = 0.09), where a rating of 1 meant imperceptible and 4 meant intolerable). Therefore, both males and females, on average, considered themselves as indifferent to discomfort glare at the beginning of each experiment, and reported mild discomfort glare from the window wall while working on a laptop during the experiment.
5.2. Window Wall Luminance Contrast Calculation Method
Calibrated HDR images of each test condition during all experiments were used for the luminance calculation on the window wall. Figure 4 illustrates an example of an HDR image captured by the digital camera in the absence of all indoor lighting. This image shows the separate areas for which luminance was calculated from the calibrated HDR pictures using Photosphere software. The vast majority of the participants reported that the left-hand side of the window was more in their FOV compared to the right-hand side of the window wall while working on the laptop. Additionally, the right-hand side of the window was framed with a perpendicular side wall, rather than a surrounding wall area (see Figure 4). This meant that the side wall reflected the entering daylight, and did not suffer from the same contrast problems typical of a window wall. As such, the LED lighting system was not installed on the right-hand side of the window, and the LC for this right side was not calculated. Because the area surrounding the window was not symmetrical, LC was calculated for the left and right side of the window, as well as for the window as a whole. Finally, as the distribution of luminance values on the window wall areas was not normal at the beginning of each stage, the median LC was considered to be the best representation of the LC during each test condition, and all subsequent results are based on the median LC for each area.
Figure 4 shows the different areas used to calculate the luminance contrasts of interest in this study, as well as the calculation equations. To obtain the median window wall LC on the left-hand side of the window wall, the median window luminance in area one was compared to the average median wall luminance in areas three and four. Similarly, the median window luminance in area two was compared to the median wall luminance in area five to determine the median LC on the right-hand side of the window wall. Moreover, the median luminance of areas one and two (window surface) were averaged and compared to the average median luminance of areas three to five (surrounding walls) to obtain the median LC of the whole window wall area during each test condition.
5.3. Impact of the LED Lighting System on the Window Wall Luminance Contrast
Table 2 summarizes the LC of both the left and right-hand side on the window wall, calculated as per the previous section, as well as the LC of the whole window wall areas during each lighting condition. It shows that, on average, as the intensity of the LED strip lighting increased, the LC of the whole window wall area decreased from approximately 16:1 when the LED strip lighting was not activated to approximately 9:1 at the highest (high power level with around 30 W) setting.
Analysis via one-way analysis of variance (ANOVA) showed that the LED lighting strategy significantly reduced the LC of the window wall (left side: F (3, 153) = 19.26, p < 0.001, right side: F (3, 153) = 12.73, p < 0.001, and whole window F (3, 153) = 18.69, p < 0.001). Post-hoc comparisons with bonferroni adjustment showed that the LC when no LED lighting was used was significantly greater than the LC of all LED power conditions, but that differences between power levels were not significant (see Table 2). This shows that the LED lighting strategy did effectively reduce the average contrast between the window and surrounding wall. However, the range of LC measured on the window wall (both left and right sides, as well as the whole window) was wide during each lighting condition; for instance, the range of LC of the whole window wall areas during Stage 1, when the supplementary LED system was off, was between 8:1 and 34:1. Horizontal illuminance was also calculated, and as expected, despite the LED lighting strategy resulting in changes in the LC on the window wall, horizontal luminance on the desk did not differ significantly across lighting conditions (M range: 670–687 lux, F (3, 156) = 0.10, p = 0.962).
Analysis via one-way ANOVA indicated that the average median luminance of the VDU did not change considerably during Stages 1 to 4 (M range: 116–134 cd/m2, F (3, 150) = 1.36, p = 0.258). As mentioned in the literature review, the LC between the task surface and distant areas should be less than 1:10 to avoid visual discomfort. To obtain the median LC of the task surface (VDU) and the window surface, the average median window luminance of areas one and two were normalized to the median task luminance (VDU). Similarly, the average median wall luminance of areas three to five was normalized to the median VDU luminance to obtain the median LC of the VDU and the walls surrounding the window frame. Table 3 summarizes the LC between the VDU and the window surface, as well as the LC of the VDU and the walls surrounding the window during Stages 1 to 4. It shows that the LC between the VDU and the window surface during the first four lighting conditions (M range: 1:12.1–1:15.2) was slightly more than the recommended value. However, there was no significant difference between the LC of the VDU and the window surface during Stages 1 to 4 (F (3, 149) = 0.31, p = 0.817). Overall, Table 3 indicates that the LC of the VDU and the walls surrounding the window frame (M range: 1:1.04–1:1.54) was below 1:10 across lighting conditions that minimize the probability of perceived visual discomfort from the task surface during the tests.
5.4. Reported Glare and Satisfaction with the Use of the LED Lighting System
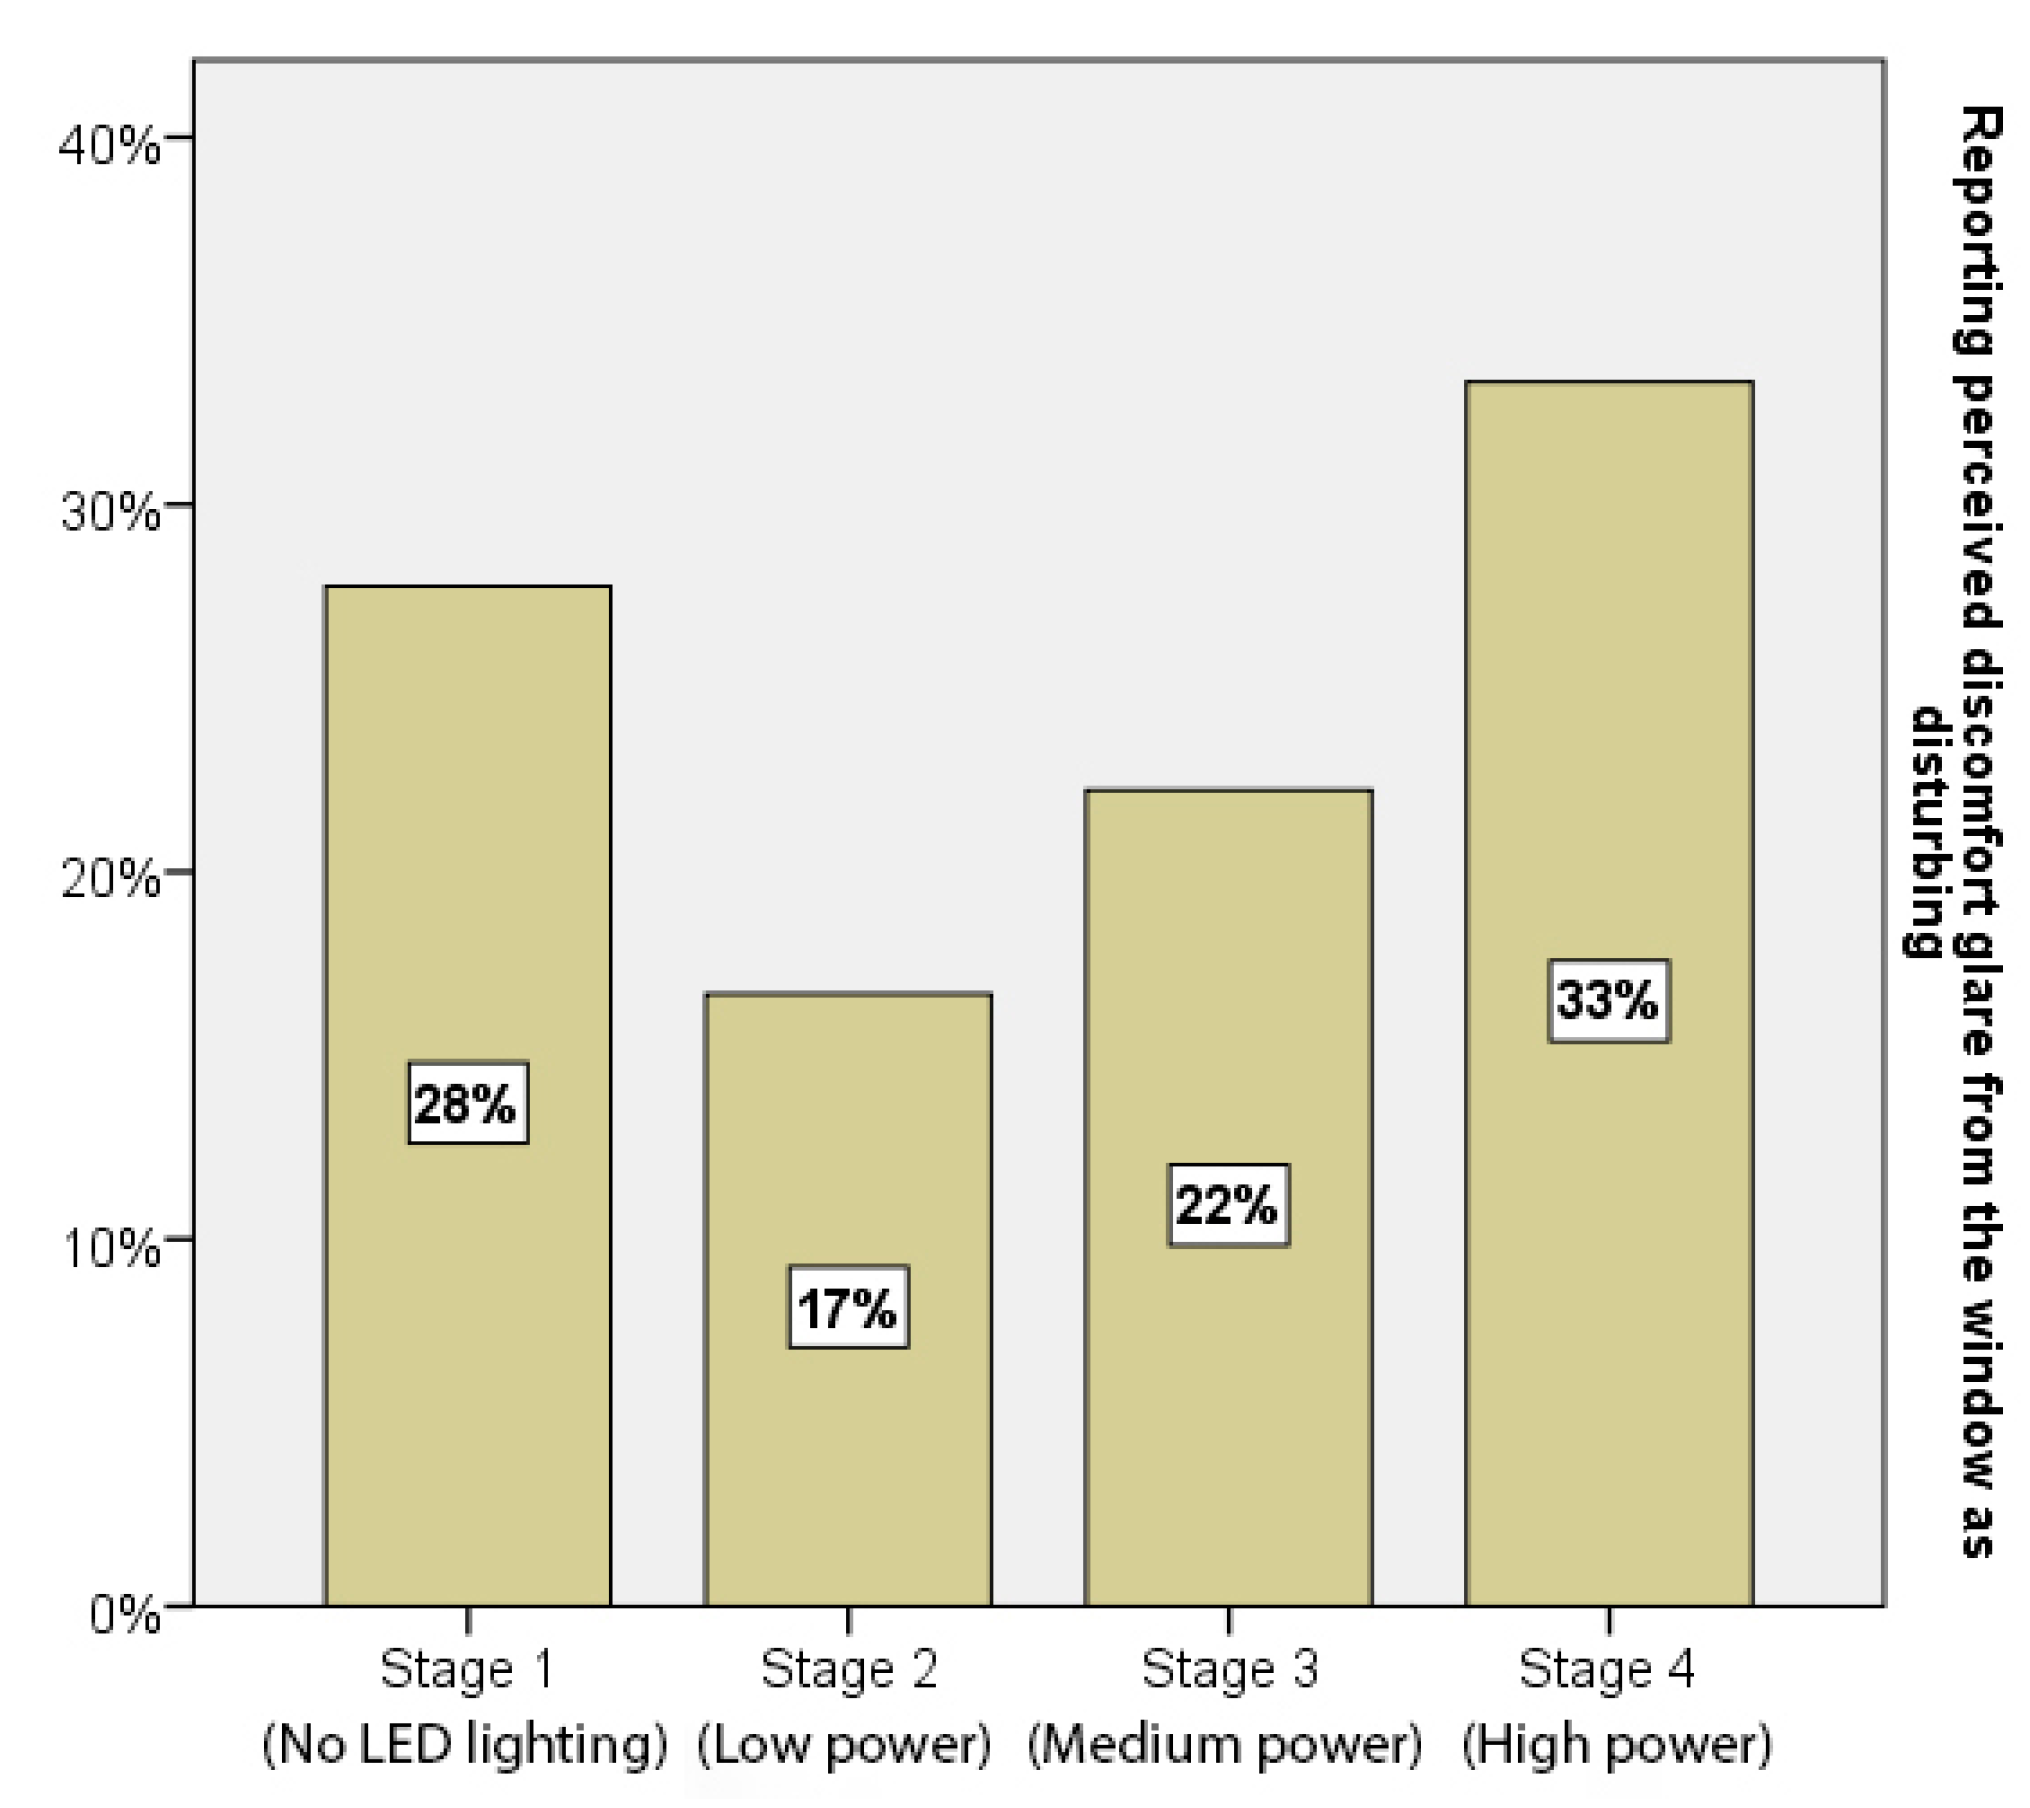
Examination of the participants’ discomfort glare ratings revealed only one rating of intolerable discomfort glare (the highest discomfort rating) across all participants and conditions, limiting the meaningful comparison of this rating level. Therefore, the proportion of participants reporting disturbing discomfort glare from the window was compared to those reporting imperceptible or perceptible glare. Figure 5 shows the percentage of participants who reported discomfort glare from the window as disturbing during Stages 1 to 4. Fewer participants reported discomfort glare as disturbing at the beginning of Stage 2 compared with the other lighting conditions; however, the proportion of participants rating the glare as disturbing or intolerable in the absence of LED lighting was not significantly different to that in Stage 2 (McNemar’s chi-square test, p = 0.219). There was also no significant difference between these proportions between the low power setting and high power setting (p = 0.065).
Participants also rated their satisfaction with the lighting quality when working with the provided laptop in each lighting condition. Participants were most satisfied with the medium power setting (M = 3.65, SD = 0.92), and least satisfied when the LED system was not on (M = 3.43, SD = 1.01); however, a repeated measures ANOVA demonstrated no significant differences between ratings of satisfaction with the lighting quality across lighting conditions (F (3, 117) = 0.66, p = 0.582).
As expected, across all presented lighting conditions, participants who reported increased discomfort glare were less satisfied with the indoor lighting overall. For example, approximately 8% of participants were very satisfied with the indoor lighting conditions when their responses for perceiving discomfort glare from daylight were perceptible, while approximately 43% of participants were very satisfied when they did not report perceived discomfort glare from the window. There was a significant negative correlation (Rho = −0.559, p < 0.001) between perceiving discomfort glare and indoor lighting satisfaction.
5.5. Acceptable Luminance Contrast on the Window Wall
The low power (around 18 W) setting was rated most comfortable by participants and, on average, resulted in a LC of approximately 11:1. Table 4 shows the median LC of the left and right-hand side on the window wall, as well as the median LC of the whole window wall areas for each level of rated discomfort glare (across all four manipulated lighting conditions). The correlation between the LC on the window wall and perceived discomfort from the window was not significant (Spearman’s Rho correlations with left side rs = 0.02 p = 0.840, right side rs = −0.11, p = 0.154, whole rs = −0.06, p = 0.444). However, an examination of the average LC associated with each level of rated discomfort glare revealed that, when participants reported imperceptible discomfort glare from the window while working on the provided laptop, the average LC was approximately 12:1.
When participants were asked to set their preferred lighting level, the mean LC on the window wall was 11.06 (SD = 5.67) on the left, 10.51 on the right (SD = 5.86), and 10.78 (SD = 5.86) overall. Additionally, the mean LC of the VDU and the window surface was 12.1 (SD = 8.5), and the mean LC of the VDU and the walls surrounding the window surface was 1.3 (SD = 0.77) when participants were told to set their preferred lighting level. Table 5 shows the average LC on the window wall and the participants’ responses for perceived discomfort glare from the window during Stage 5. It indicates that the LC on the left and right-hand side of the window wall was approximately 12:1 and 11:1, respectively, when participants did not perceive discomfort. The average median LC of the whole window wall was 11.17 (SD = 6) at Stage 5 when participants did not perceive discomfort glare from the window. However, there was no significant difference in the LC on left, right, or the entire window wall between those who did or did not report glare (Mann-Whitney U = 153, 180, 170, p = 0.630, 0.336, 0.843, respectively).
5.6. Participants’ Intention to Intervene in Lighting Conditions
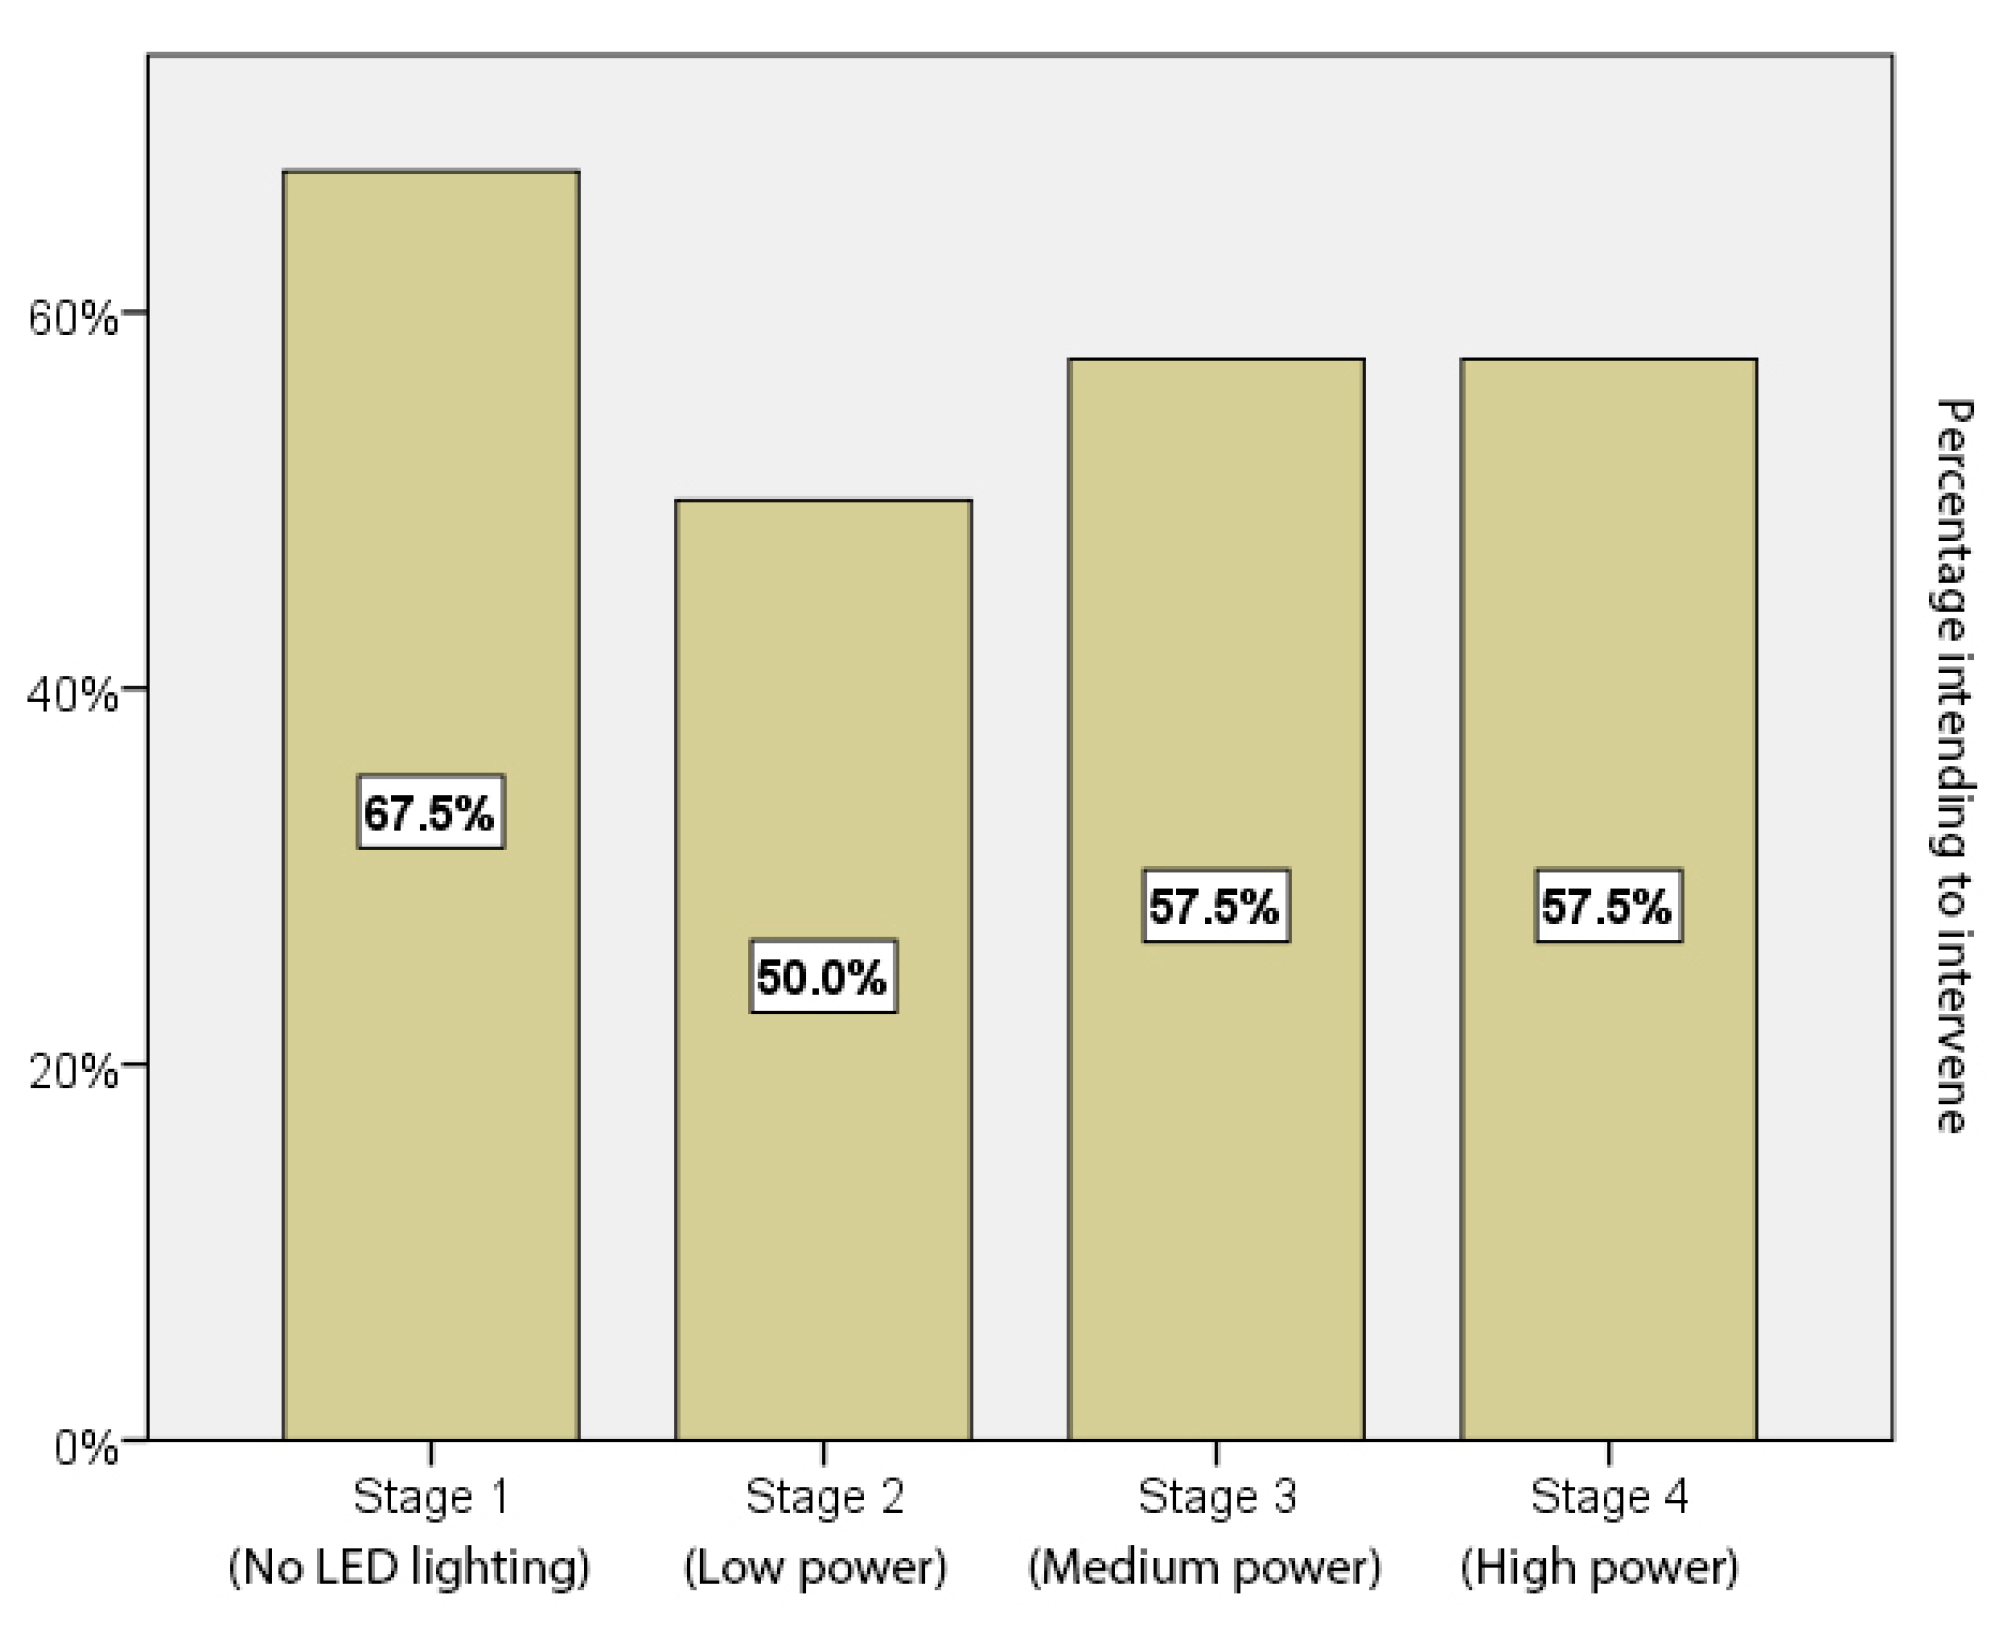
During presentation of the four lighting conditions, participants were also asked whether they would either move the blinds down or turn on the ceiling lights if given the opportunity. Figure 6 shows that participants were most likely to report they would either move the blinds or activate the ceiling lights when there was no supplementary LED lighting, and were least likely to want to intervene at the lowest LED lighting level; however these differences were not significant (McNemars tests, p range = 0.143–1.00). Additionally, there was no significant difference between the LC on the window wall when participants said they would intervene compared to whether participants said they would maybe intervene or not.
Across all four lighting conditions, when participants rated the glare as disturbing or intolerable, significantly more intended to move the blinds or turn on the celing lights than when glare was rated as imperceptible or perceptible (89.19% and 48.78%, respectively, χ2 (1, n = 160) = 19.08, p < 0.001).
Figure 6.
Percentage of participants indicating that they would turn on overhead lights or move the blinds down during each lighting condition.
Figure 6.
Percentage of participants indicating that they would turn on overhead lights or move the blinds down during each lighting condition.
6. Discussion
The main aim of this study was to examine the effectiveness of a retrofittable LED wall-washing system to reduce LC and discomfort glare in offices with windows. We proposed that improving the window appearance could reduce the users’ ratings of glare, enhance satisfaction with the lighting and reduce the intention to intervene in lighting conditions, with a potential for savings to the electricity consumption in buildings. The introduction of the LED wall-washing system did effectively reduce the corresponding LC on the window wall; however, this reduction in LC was not reflected in the participants’ perceptions of glare, satisfaction with the lighting in the room, or intentions to move the blinds or turn on the ceiling lights, and there were no significant differences between lighting conditions with these measures.
It is possible that a LC of approximately 11:1 to 12:1 between the window, as the source of daylight, and the surrounding walls may be an ideal ratio to achieve visual comfort via the proposed LED wall-washing system, as this is the ratio that occurred when participants were able to adjust the lighting system themselves. This study also suggests that if the building occupants do not experience glare, their intention to switch on the ceiling lights or move the blind reduces significantly.
The fact that the LC was not significantly related to perceptions of glare or satisfaction may explain the lack of the effects of subjective measures. It is possible that this occurred due to the fact that the LC on the window wall before any lighting intervention was not particularly high (with an approximately 16:1 ratio). Our previous research, using a supplementary LED system, found that more dramatic reductions in LC (from approximately 117:1 to 22:1) could be achieved using a similarly low-powered system [34]. Therefore, it is possible that this system might be useful in high LC offices, but may have limited effects upon occupant ratings in lower LC offices.
Future research should therefore assess whether the wall-washing approach described in this study could improve both the observed luminance contrasts and subjective ratings in different room conditions. In particular, we recommend the investigation of this strategy in rooms where the LC with lights off is higher than that in the room tested in this study. Additionally, this system could also be tested in rooms with different room layouts, orientations and window types (punch window type and strip window type), to determine whether it effectively reduces luminance contrasts in those settings, and whether that reduction is accompanied by changes in occupant perceptions. More investigation is also needed to examine the impact of participant lighting preferences on the acceptable LC between the window and surrounding walls using the supplementary LED lighting system.
Despite the many advantages of using shading devices to limit discomfort glare, the retrofitting of shading devices to older buildings is not always feasible. Additionally, shading devices can hinder occupant view and connection to the outdoors (which occupants typically value highly) and are not as easily adaptable to changing lighting conditions. It is therefore worthwhile to explore supplementary electric light strategies, such as that presented here, to reduce the negative impact of bright windows. A distinct advantage of the tested LED system is not only its low cost and retrofittable nature, but also its customizability to suit user preferences and changing outdoor lighting conditions. Although this study provides a suggested starting point for the optimal window-wall LC, one benefit of such systems is that they are easily adaptable, and the preferred power setting can be set by the user to ensure personal visual comfort. Such a system would integrate easily with Internet of Things technologies, and its easy customizability means that power levels could vary automatically across the day and in-line with user preferences. Therefore, it could be considerd as an additional option for lighting design that minimizes visual discomfort while maximizing energy savings. As LED technology advances, increases in the amount of light produced per unit power input (i.e., luminous efficacy) will also enable a reduction in the power required to generate the beneficial effects seen from these supplementary lighting systems. The system demonstrated in this paper showed an effective design solution using an 18 W LED product; however, the same positive effect can be achieved with a lower power solution by using purpose-designed, higher-efficacy LED products.
7. Conclusions
An integrated lighting design solution to improve window appearance which potentially leads to increased energy savings of buildings is introduced in this paper. A supplementary LED lighting system was mounted on the bottom and the left window side in a single office room in Brisbane, Australia (see Figure 1). This LED lighting system was designed to illuminate the walls surrounding the window to decrease the LC on the window wall. Although the system was effective in significantly reducing the LC on the window wall, it did not reduce the participants’ ratings of glare or satisfaction with the lighting. The LED wall-washing strategy reduced the LC to below 11:1 without significant changes in horizontal illuminance.
Future research should investigate whether this system is able to match reductions in LC with changes in subjective ratings, particularly in higher LC environments, to determine whether there are optimal luminance contrasts to achieve occupant satisfaction. Because daylight is dynamic and changes in intensity, spectrum, and direction as the time and weather change, future research could also incorporate linking supplementary lighting systems to photosensor-based controls that modify window appearance throughout the day and year. Finally, the proposed system would be significantly more energy efficient than the use of overhead lighting; however, the energy savings achieveable are contingent on the design of the supplementary system and the overhead lighting strategies they seek to replace. The optimization of the product design of supplementary LED lighting systems is required to maximize the energy savings available from this design strategy.
Acknowledgments
This research did not receive any specific grant from funding agencies in the public, commercial, or not-for-profit sectors.
Author Contributions
The paper was a collaboration effort between the authors. Mehdi Amirkhani was the main contributor to design and implementation of the experiment, data analysis, as well as writing the paper. Veronica Garcia-Hansen, Gillian Isoardi and Alicia Allan coordinated the work, contributing to experimental design, data analysis and writing.
Conflicts of Interest
The authors declare no conflict of interest.
References
- Farley, K.M.J.; Veitch, J.A. A Room With A View: A Review of the Effects of Windows on Work and Well-Being; IRC-RR-136; Institute for Research in Construction; National Research Council Canada: Ottawa, ON, Canada, 2001; pp. 1–33.
- Boubekri, M.; Cheung, I.N.; Reid, K.J.; Wang, C.H.; Zee, P.C. Impact of windows and daylight exposure on overall health and sleep quality of office workers: A case-control pilot study. JCSM 2014, 10, 603–611. [Google Scholar] [CrossRef] [PubMed]
- Hourani, M.M.; Hammad, R.N. Impact of daylight quality on architectural space dynamics: Case study: City mall-amman, Jordan. Renew. Sustain. Energy Rev. 2012, 16, 3579–3585. [Google Scholar] [CrossRef]
- Ozorhon, I.F.; Uraz, T.U. Natural light as a determinant of the identity of architectural space. J. Archit. Urban. 2014, 38, 107–119. [Google Scholar] [CrossRef]
- Boubekri, M.; Boyer, L.L. Effect of window size and sunlight presence on glare. Light. Res. Technol. 1992, 24, 69–74. [Google Scholar] [CrossRef]
- Krarti, M. Energy Audit of Building Systems: An Engineering Approach, 2nd ed.; CRC Press: Baton Rouge, LA, USA, 2016. [Google Scholar]
- Bodart, M.; de Herde, A. Global energy savings in offices buildings by the use of daylighting. Energy Build. 2002, 34, 421–429. [Google Scholar] [CrossRef]
- Aries, M.B.C.; Aarts, M.P.J.; van Hoof, J. Daylight and health: A review of the evidence and consequences for the built environment. Light. Res. Technol. 2015, 47, 6–27. [Google Scholar] [CrossRef]
- Aries, M.B.C.; Veitch, J.A.; Newsham, G.R. Windows, view, and office characteristics predict physical and psychological discomfort. J. Environ. Psychol. 2010, 30, 533–541. [Google Scholar] [CrossRef]
- Boyce, P.; Hunter, C.; Howlett, O. The Benefits of Daylight through Windows; Lighting Research Center, Rensselaer Polytechnic Institute: New York, NY, USA, 2003; pp. 1–88. [Google Scholar]
- Boccia, A.; Chella, F.; Zazzini, P. Natural light from a wall in buildings: Experimental analysis of the ventilated illuminating wall performances. Sol. Energy 2014, 108, 178–188. [Google Scholar] [CrossRef]
- Edwards, L.; Torcellini, P.A. A Literature Review of the Effects of Natural Light on Building Occupants; NREL/TP-550-30769; National Renewable Energy Laboratory: Golden, CO, USA, 2002; pp. 1–56.
- Leder, S.; Newsham, G.R.; Veitch, J.A.; Mancini, S.; Charles, K.E. Effects of office environment on employee satisfaction: A new analysis. Build. Res. Inf. 2016, 44, 34–50. [Google Scholar] [CrossRef]
- Ochoa, C.E.; Aries, M.B.C.; van Loenen, E.J.; Hensen, J.L.M. Considerations on design optimization criteria for windows providing low energy consumption and high visual comfort. Appl. Energy 2012, 95, 238–245. [Google Scholar] [CrossRef]
- Meek, C.; Wymelenberg, K.V.D. Daylighting and Integrated Lighting Design; Routledge Ltd: Hoboken, NJ, USA, 2015. [Google Scholar]
- Tashiro, T.; Kawanobe, S.; Kimura-Minoda, T.; Kohko, S.; Ishikawa, T.; Ayama, M. Discomfort glare for white LED light sources with different spatial arrangements. Light. Res. Technol. 2015, 47, 316–337. [Google Scholar] [CrossRef]
- Heschong, L.; McHugh, J.; Pande, A.; Howlett, O.; Reschke, E.; Sipp, B. Sidelighting Photocontrols Field Study. Commercial Market Research Report: Final Report; Heschong Mahone Group: Fair Oaks, CA., USA, 2006; pp. 1–178. [Google Scholar]
- Suk, J.Y.; Schiler, M.; Kensek, K. Development of new daylight glare analysis methodology using absolute glare factor and relative glare factor. Energy Build. 2013, 64, 113–122. [Google Scholar] [CrossRef]
- Gordon, G. Interior Lighting for Designers, 4th ed.; Wiley: New York, NY, USA, 2003. [Google Scholar]
- Kim, W.; Kim, J.T. The Variation of the glare source luminance according to the average luminance of visual field. Indoor Built Environ. 2012, 21, 98–108. [Google Scholar] [CrossRef]
- Steffy, G.R. Architectural Lighting Design; John Wiley & Sons: Hoboken, NJ, USA, 2008. [Google Scholar]
- Alrubaih, M.S.; Zain, M.F.M.; Alghoul, M.A.; Ibrahim, N.L.N.; Shameri, M.A.; Elayeb, O. Research and development on aspects of daylighting fundamentals. Renew. Sustain. Energy Rev. 2013, 21, 494–505. [Google Scholar] [CrossRef]
- Bean, R. Lighting: Interior and Exterior; Taylor and Francis: Oxford, UK, 2012. [Google Scholar]
- Chartered Institution of Building Services Engineers (CIBSE). Code for Interior Lighting; CIBSE: London, UK, 1994. [Google Scholar]
- Arup, O.N.; Arup, L. Lighting: Technical Review; RIBA Publishing: London, UK, 2007. [Google Scholar]
- Iyer-Raniga, U.; Moore, T.; Wasiluk, K. Residential building sustainability rating tools in Australia. Environ. Des. Guide 2014, 80, 1–14. [Google Scholar]
- Green Building Council Australia (GBCA). What is Green Star? Available online: https://www.gbca.org.au/green-star/green-star-overview/ (accessed on 23 June 2016).
- Hirning, M.B.; Isoardi, G.; Coyne, S.; Garcia Hansen, V.; Cowling, I. Post occupancy evaluations relating to discomfort glare: A study of green buildings in Brisbane. Build. Environ. 2013, 59, 349–357. [Google Scholar] [CrossRef] [Green Version]
- Hirning, M.B.; Isoardi, G.; Cowling, I. Discomfort glare in open plan green buildings. Energy Build. 2014, 70, 427–440. [Google Scholar] [CrossRef] [Green Version]
- Garcia-Hansen, V. Innovative Daylighting Systems for Deep-Plan Commercial Buildings. Ph.D. Thesis, Queensland University of Technology, Brisbane, Australia, December 2006. [Google Scholar]
- Rea, M.S. The IESNA Lighting Handbook: Reference & Application, 9th ed.; Illuminating Engineering Society of North America: New York, NY, USA, 2000. [Google Scholar]
- Mayhoub, M.S. Innovative daylighting systems’ challenges: A critical study. Energy Build. 2014, 80, 394–405. [Google Scholar] [CrossRef]
- Tsangrassoulis, A. A Review of innovative daylighting systems. Adv. Build. Energy Res. 2008, 2, 33–56. [Google Scholar] [CrossRef]
- Amirkhani, M.; Garcia-Hansen, V.; Isoardi, G. Improving the Impact of Luminance Contrast on the Window Appearance in a Conventional Office Room: Using Supplementary Lighting Strategies. Available online: https://eprints.qut.edu.au/87816/16/87816%28a%29.pdf (accessed on 29 July 2017).
- Amirkhani, M.; Garcia-Hansen, V.; Isoardi, G. LED lighting design strategies to enhance window appearance and increase energy savings in daylit office spaces. In Proceedings of the Asia-Pacific Lighting Systems Workshop, Sydney, Australia, 27–29 May 2015; pp. 1–7. [Google Scholar]
- Suk, J.Y.; Schiler, M.; Kensek, K. Investigation of existing discomfort glare indices using human subject study data. Build. Environ. 2017, 113, 121–130. [Google Scholar] [CrossRef]
- Wienold, J.; Christoffersen, J. Evaluation methods and development of a new glare prediction model for daylight environments with the use of CCD cameras. Energy Build. 2006, 38, 743–757. [Google Scholar] [CrossRef]
- Yamin Garreton, J.A.; Rodriguez, R.G.; Pattini, A.E. Glare indicators: An analysis of ocular behaviour in an office equipped with venetian blinds. Indoor Built Environ. 2014, 25, 69–80. [Google Scholar] [CrossRef]
Figure 1.
Plan and sections of the test office room, with details of LED lighting system placement and construction.
Figure 1.
Plan and sections of the test office room, with details of LED lighting system placement and construction.
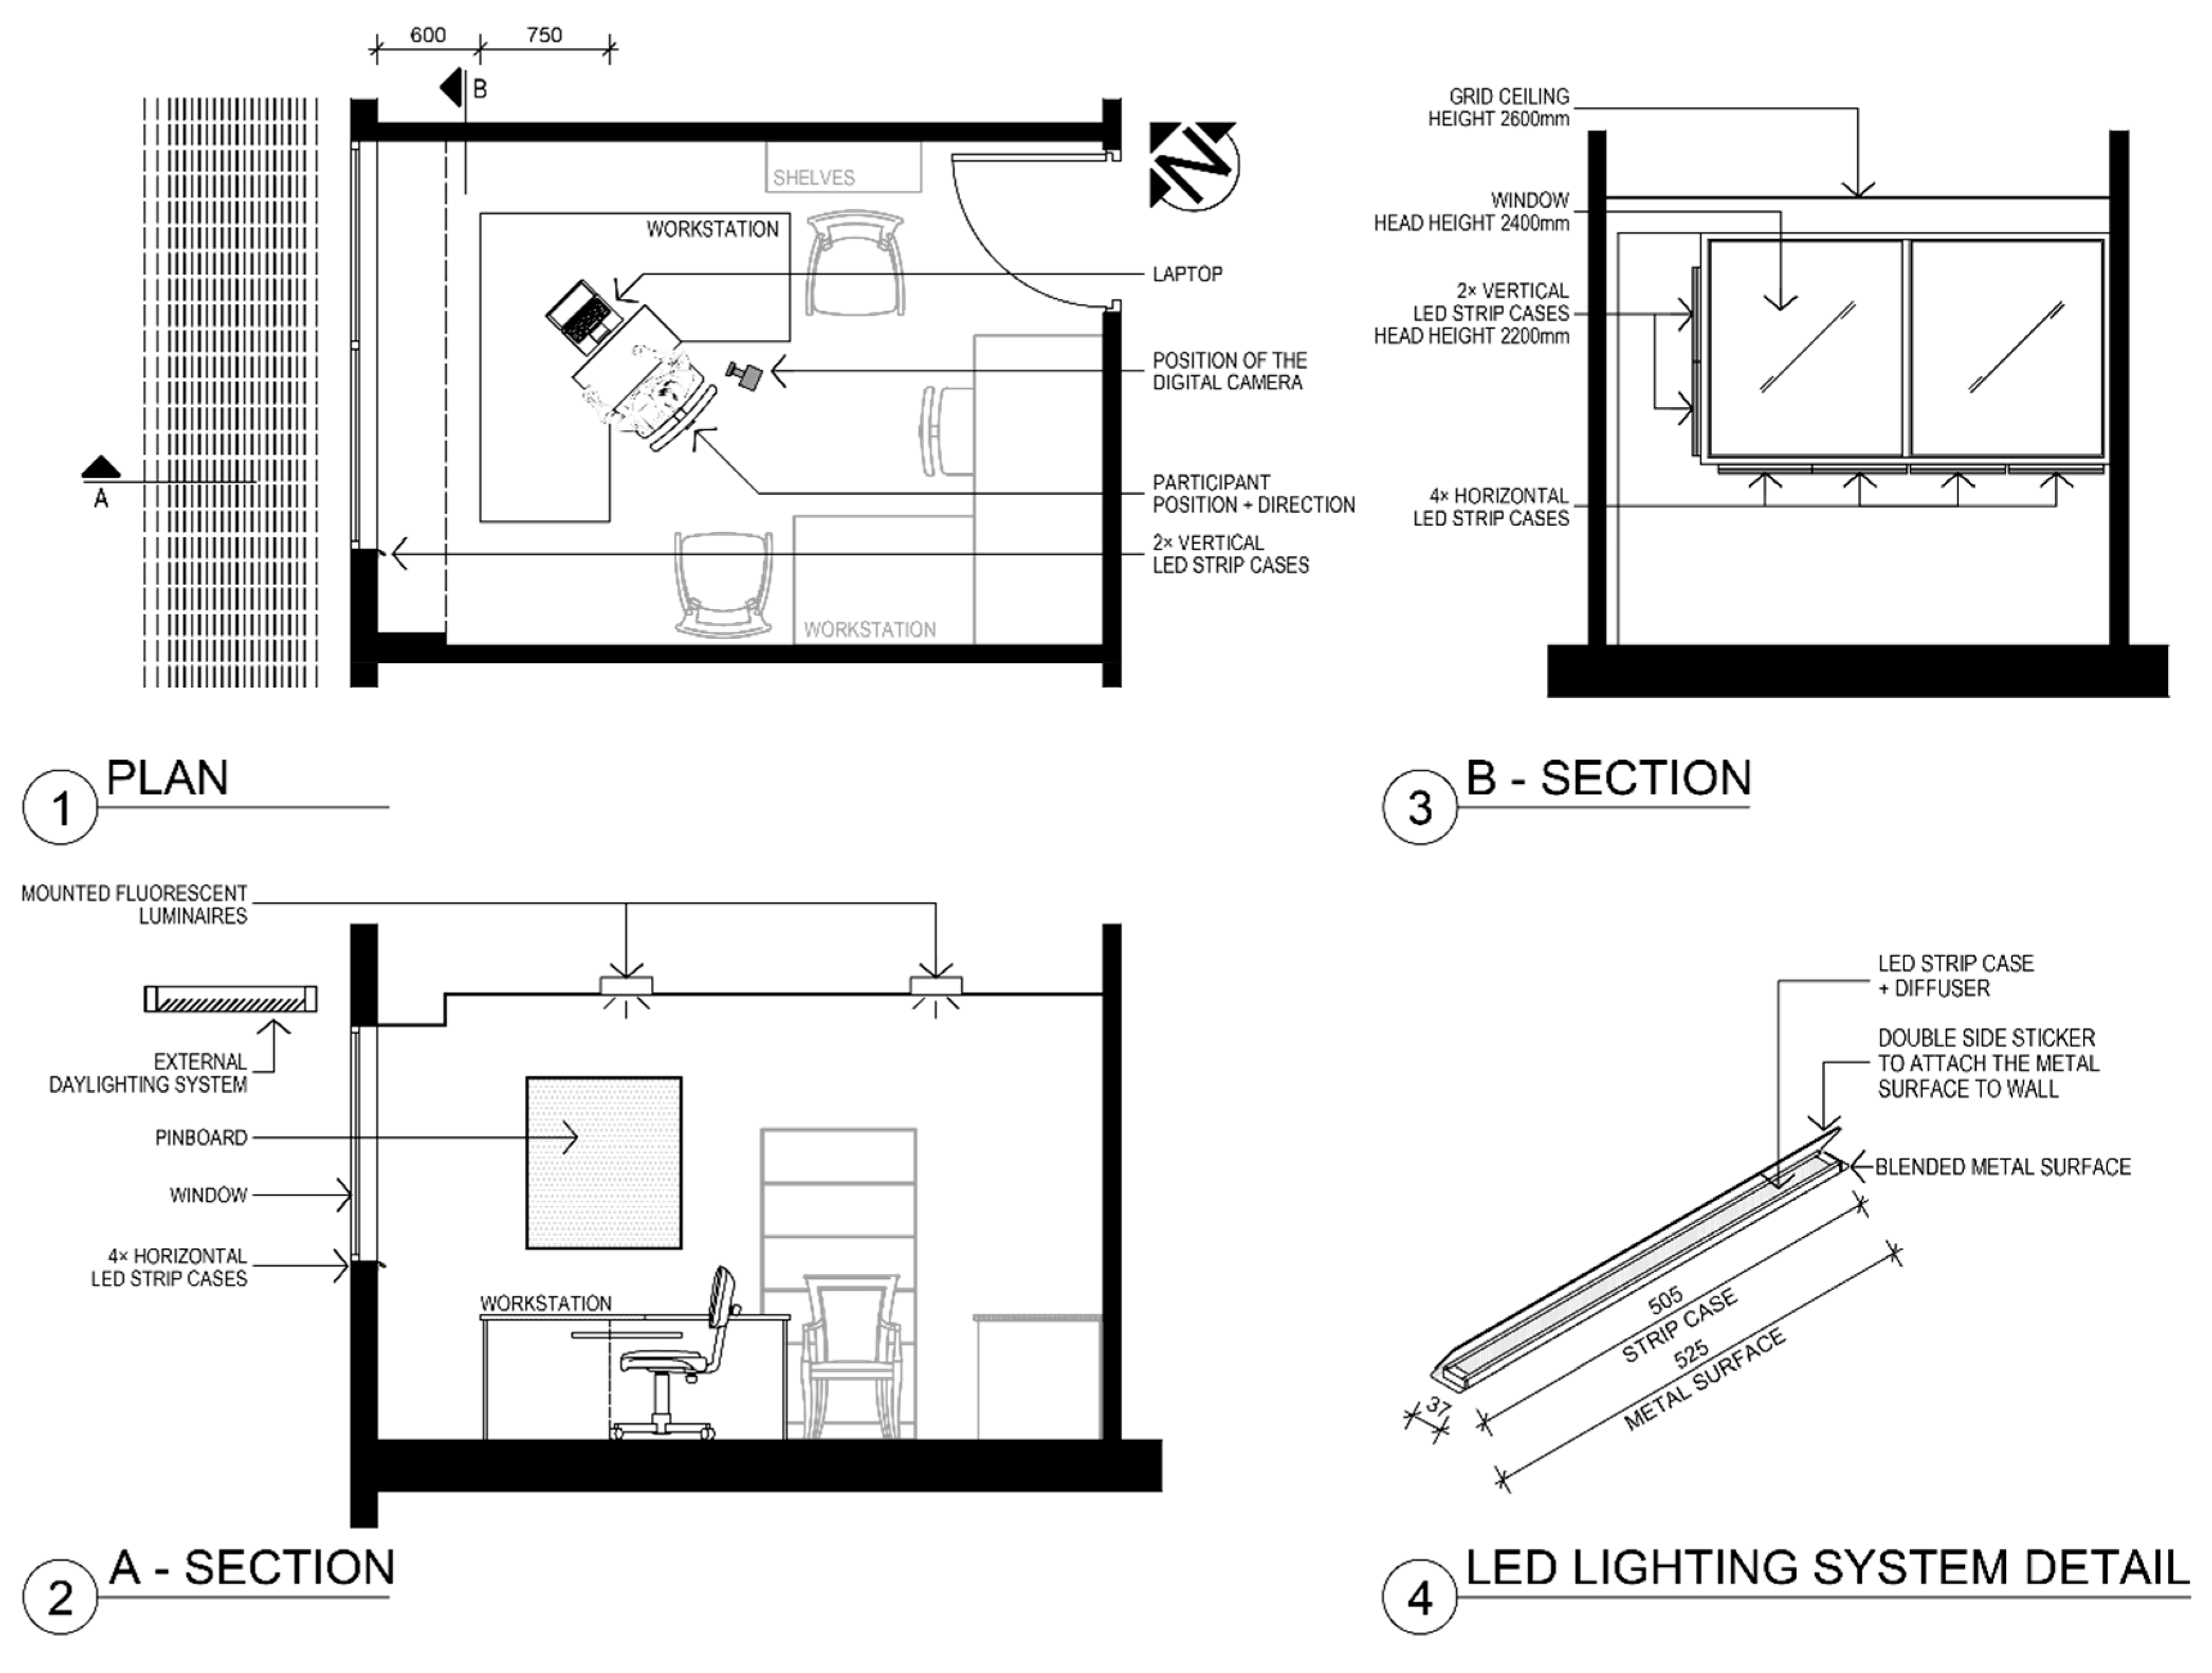
Figure 2.
The questionnaire measuring participant characteristics, responses to lighting conditions and preferred luminance contrasts.
Figure 2.
The questionnaire measuring participant characteristics, responses to lighting conditions and preferred luminance contrasts.
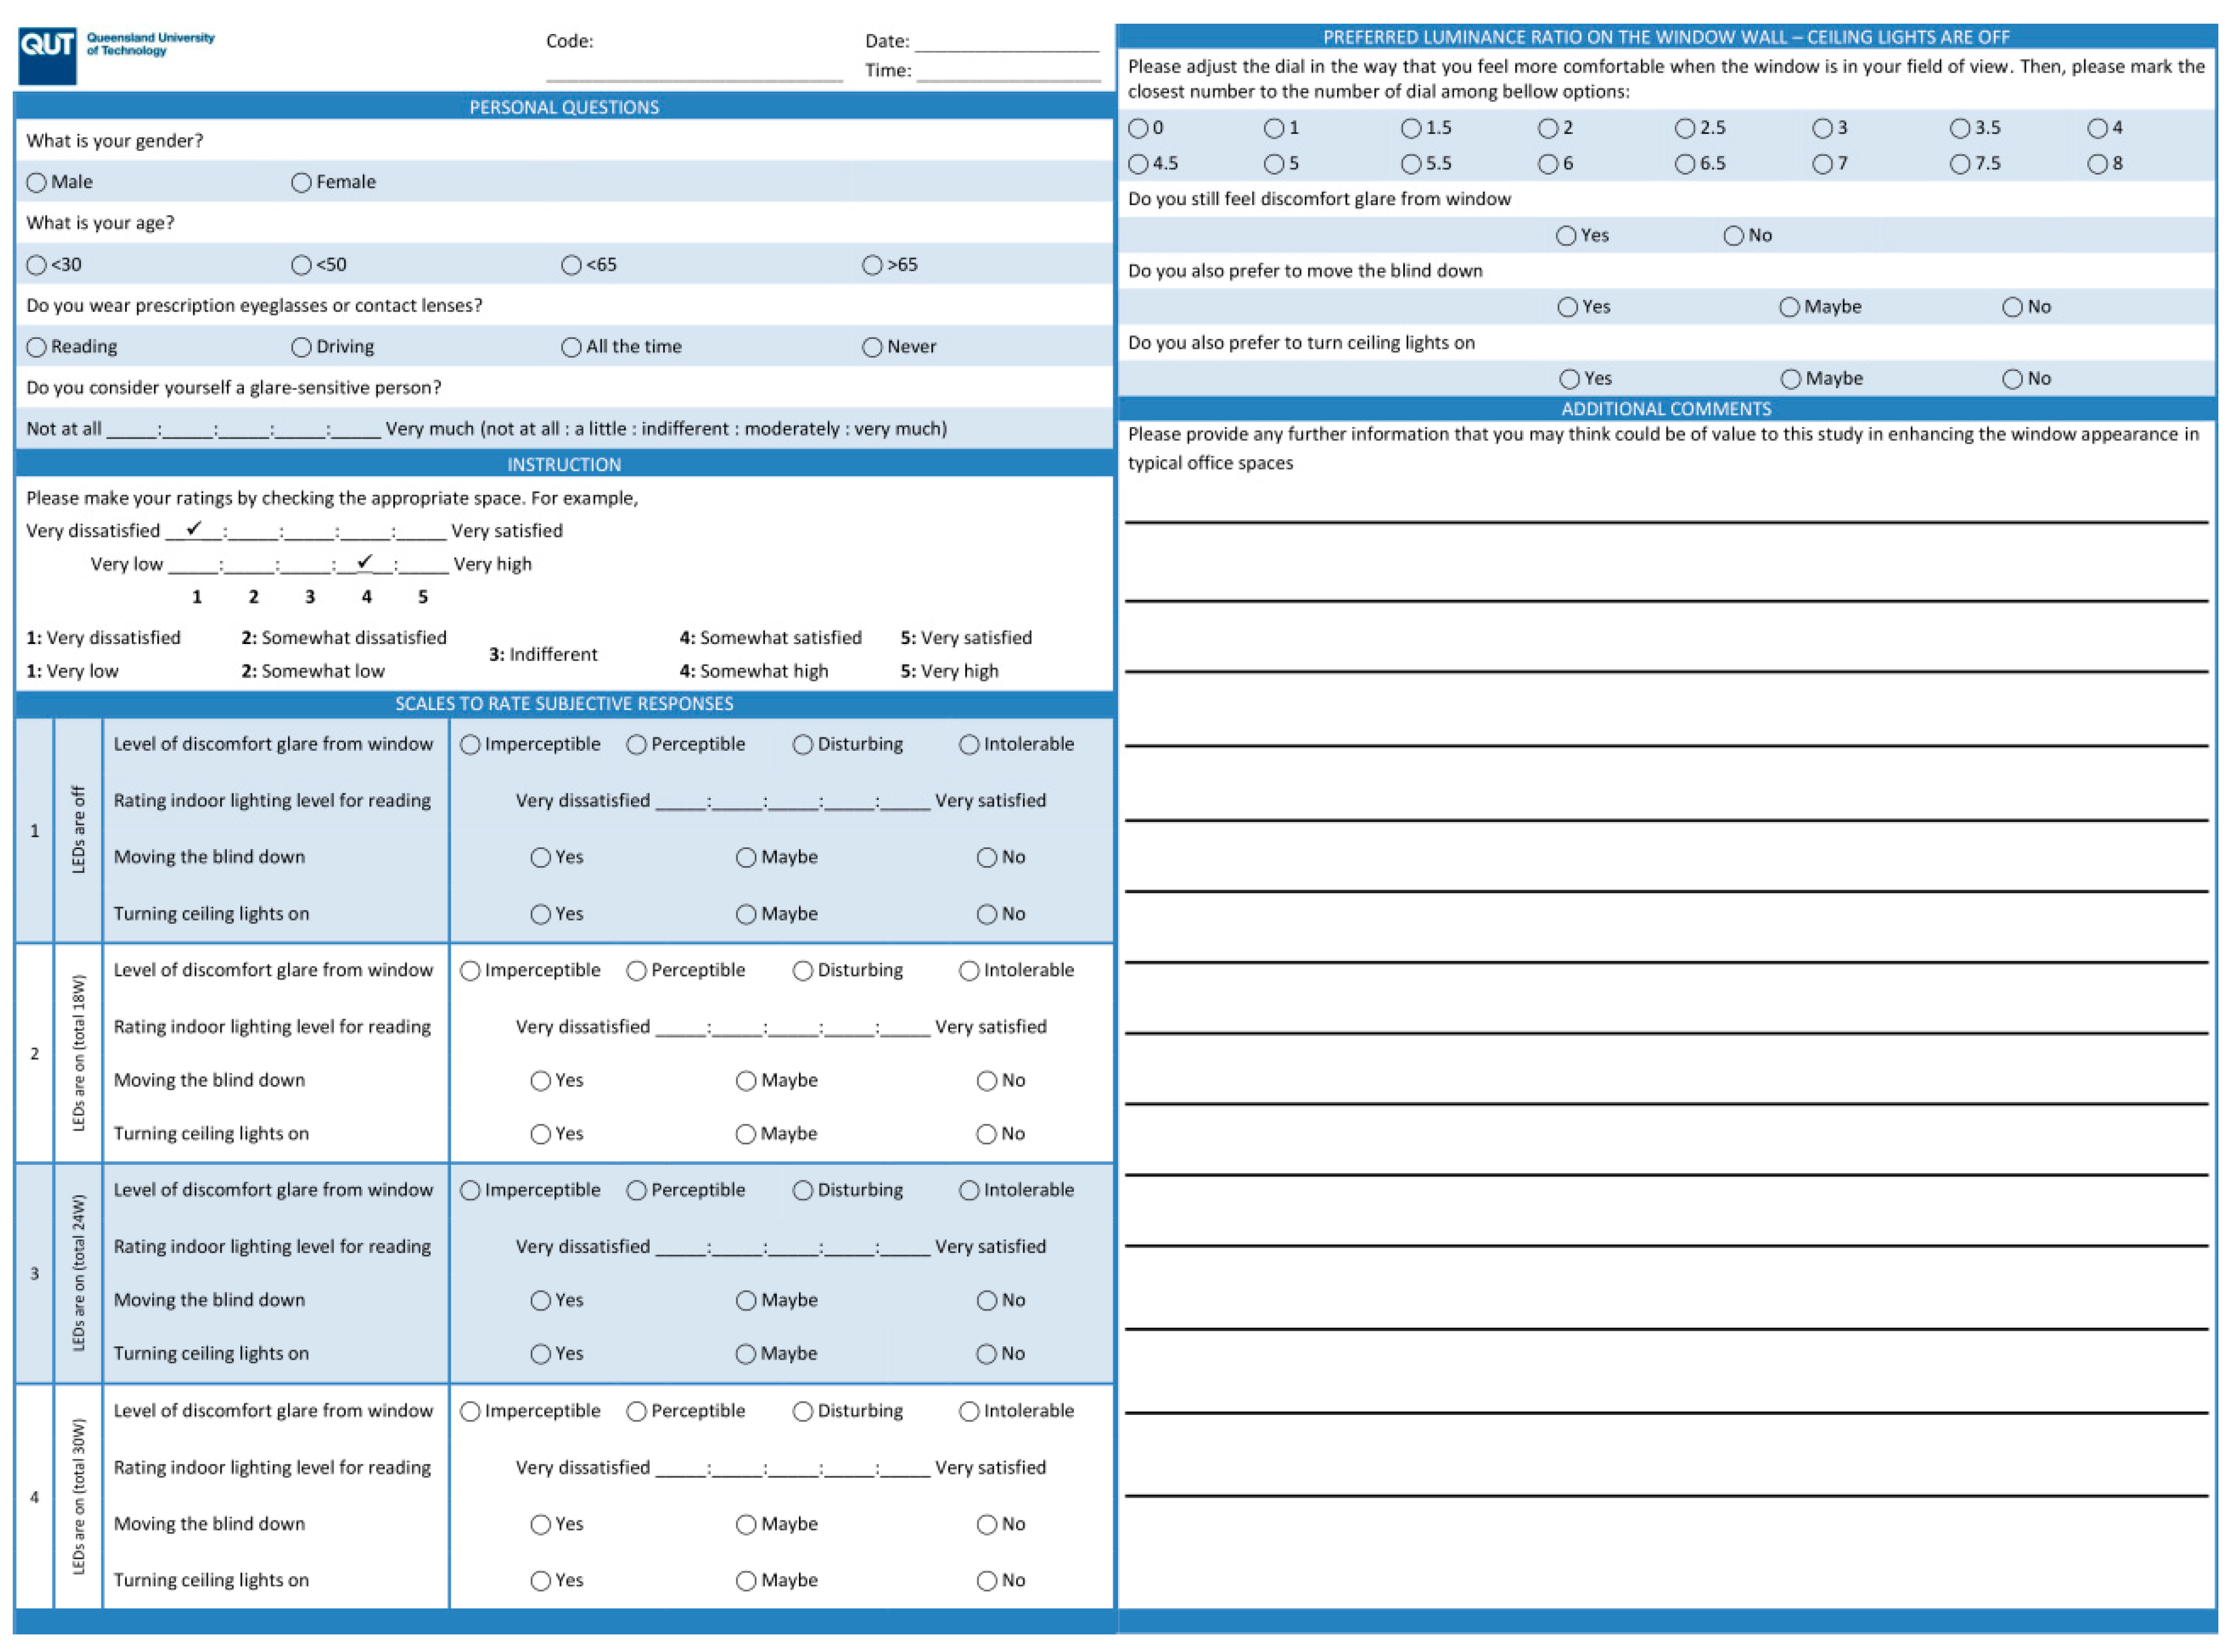
Figure 3.
Experimental flow in the test office room.
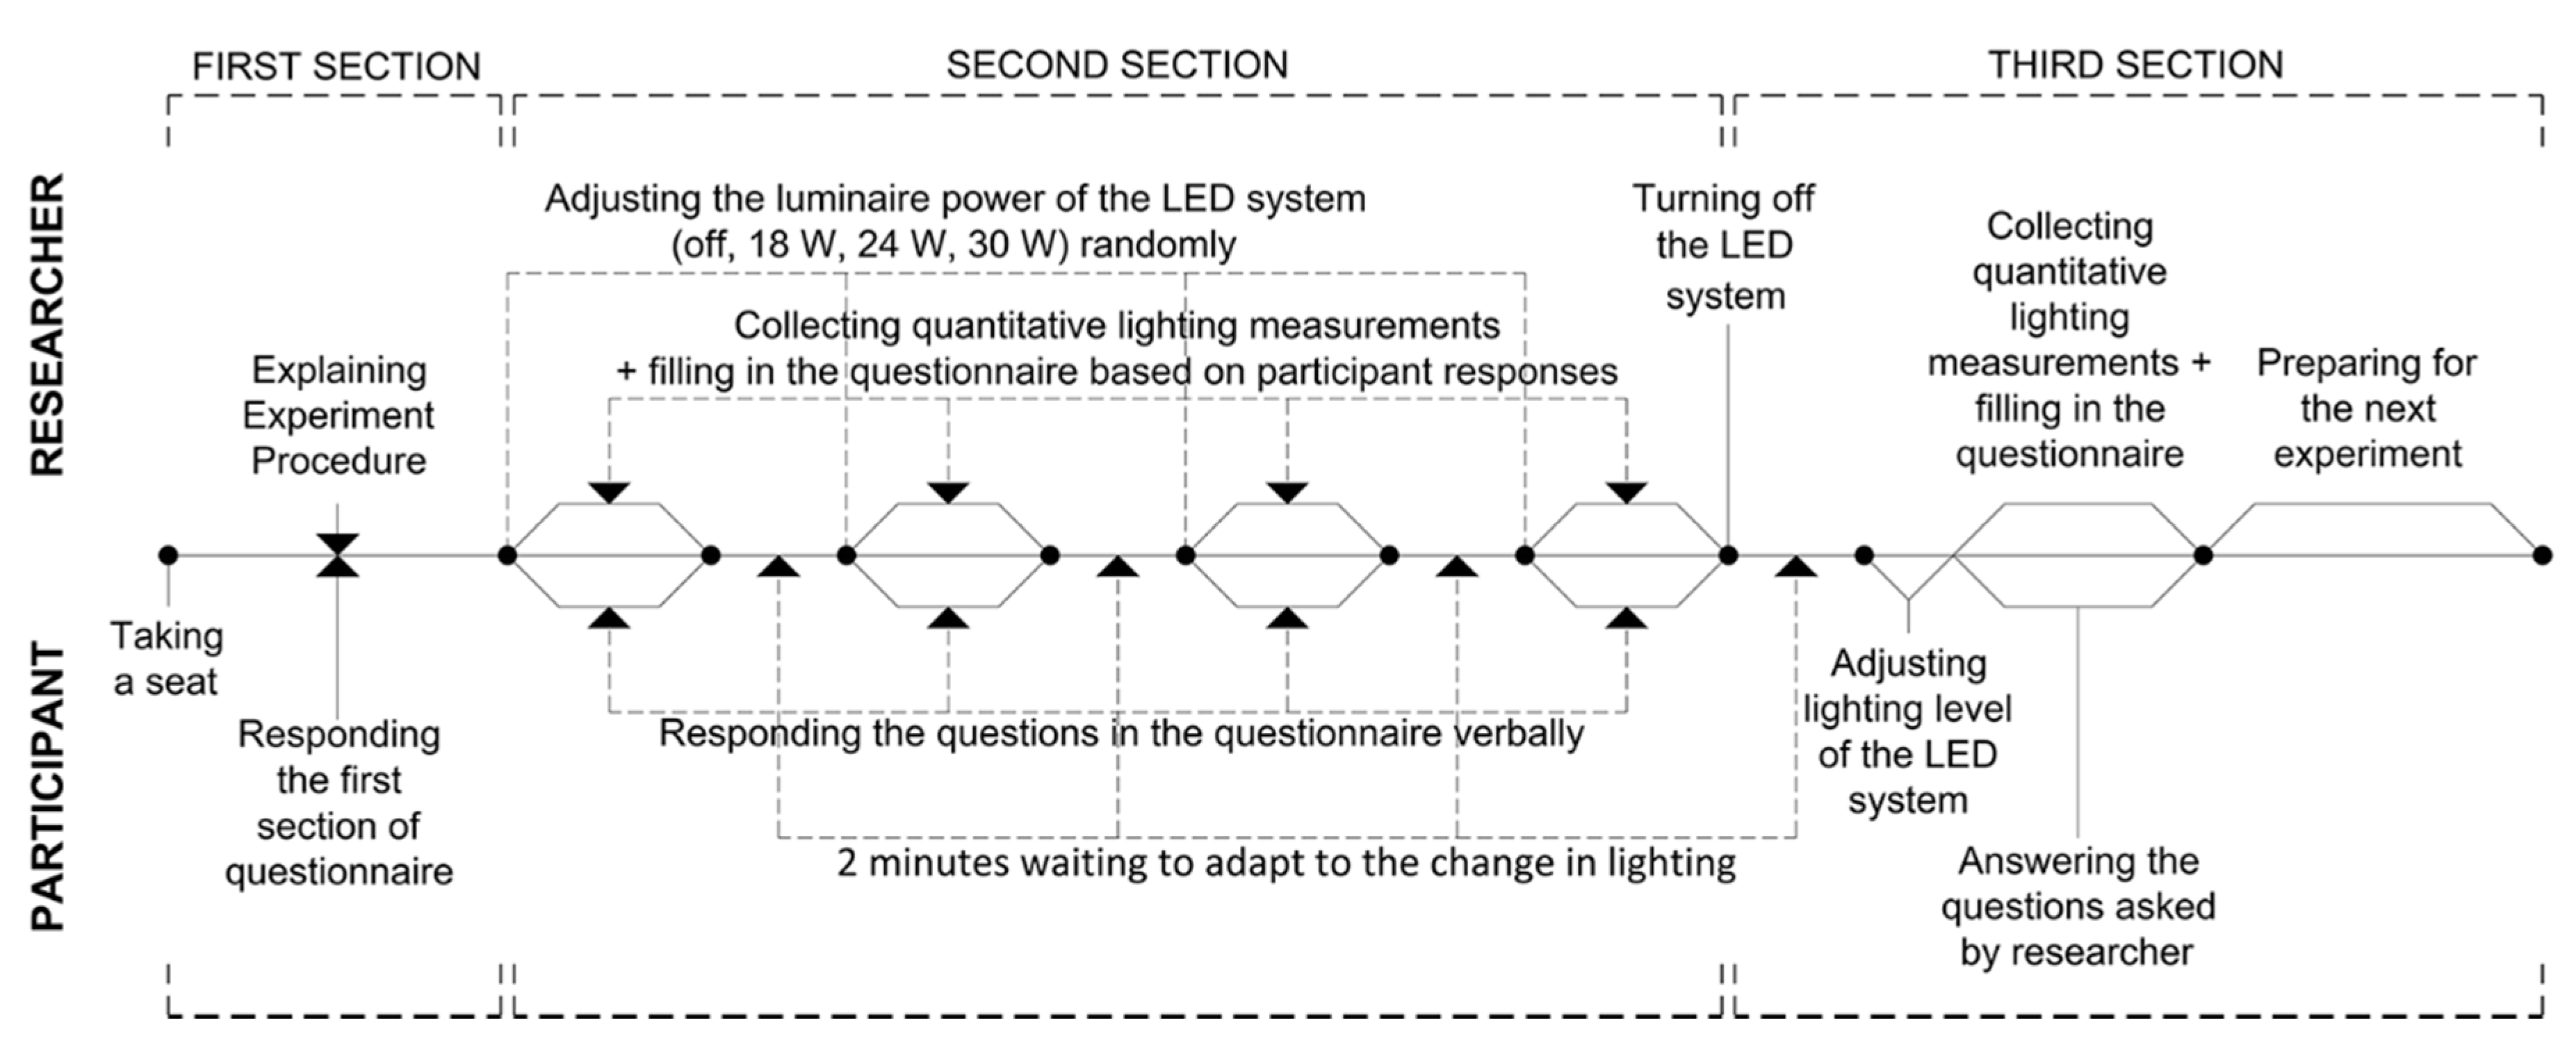
Figure 4.
Captured high dynamic range (HDR) image from the test office room and window wall luminance contrast (LC) calculation equations.
Figure 4.
Captured high dynamic range (HDR) image from the test office room and window wall luminance contrast (LC) calculation equations.
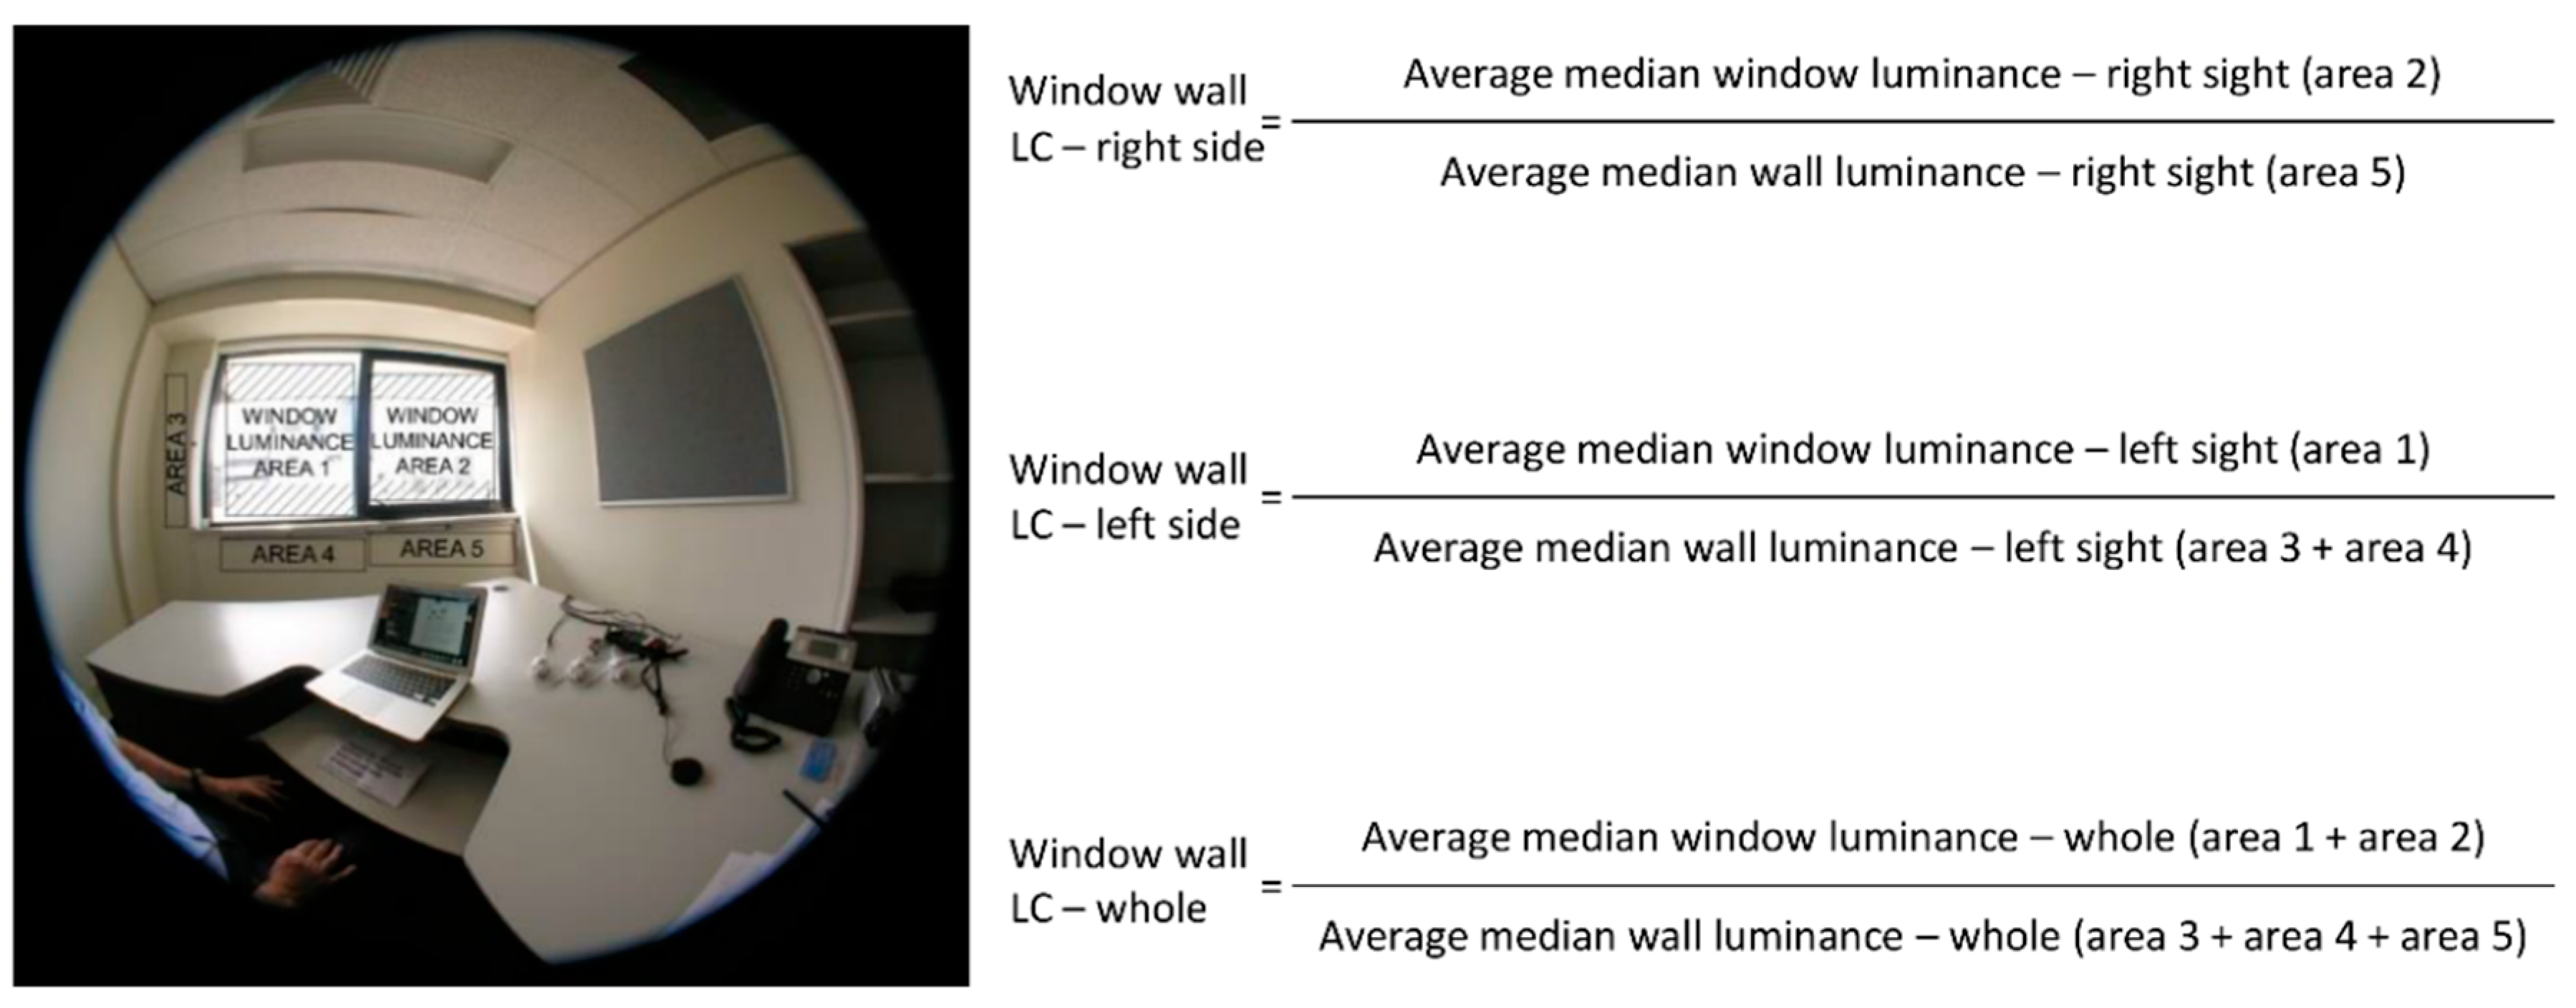
Figure 5.
Percentage of participants reporting discomfort glare as disturbing during each lighting condition.
Figure 5.
Percentage of participants reporting discomfort glare as disturbing during each lighting condition.

Table 1.
Demographic data of participants.
| Question | Options | Number of Participants | Percentage |
|---|---|---|---|
| Gender | Male | 22 | 55% |
| Female | 18 | 45% | |
| Age | Less than 30 | 22 | 55% |
| Between 30 and 50 | 14 | 35% | |
| Between 50 and 65 | 2 | 5% | |
| More than 65 | 2 | 5% | |
| Prescription glasses | Reading | 5 | 12.5% |
| Driving | 2 | 5% | |
| All the time | 16 | 40% | |
| Never | 17 | 42.5% | |
| Glare sensitive | Not at all | 4 | 10% |
| A little | 8 | 20% | |
| Indifferent | 10 | 25% | |
| Moderately | 13 | 32.5% | |
| Very much | 5 | 12.5% |
Table 2.
Average median luminance contrast of the left and right-hand side on the window wall, as well as the luminance contrast of the whole window wall areas during each lighting condition.
Table 2.
Average median luminance contrast of the left and right-hand side on the window wall, as well as the luminance contrast of the whole window wall areas during each lighting condition.
| Lighting conditions | Window Wall Luminance Contrast | ||
|---|---|---|---|
| Left Side | Right Side | Whole | |
| Stage 1 (no LED lighting) | 15.8 | 14.79 | 15.92 |
| Stage 2 (low power) | 10.78 | 10.23 | 10.57 |
| Stage 3 (medium power) | 10.26 | 9.13 | 9.77 |
| Stage 4 (high power) | 8.96 | 8.16 | 8.63 |
Table 3.
Average median luminance contrast of the visual display unit (VDU) and the walls surrounding the window frame, as well as the luminance contrast of the VDU and the window surface.
Table 3.
Average median luminance contrast of the visual display unit (VDU) and the walls surrounding the window frame, as well as the luminance contrast of the VDU and the window surface.
| Lighting Conditions | VDU | : | Walls Surrounding the Window Frame | : | Window Surface |
|---|---|---|---|---|---|
| Stage 1 (no LED lighting) | 1 | : | 1.04 | : | 15.2 |
| Stage 2 (low power) | 1 | : | 1.43 | : | 14.0 |
| Stage 3 (medium power) | 1 | : | 1.54 | : | 13.7 |
| Stage 4 (high power) | 1 | : | 1.53 | : | 12.1 |
Table 4.
Average luminance contrast for each level of perceived glare during experimental lighting conditions.
Table 4.
Average luminance contrast for each level of perceived glare during experimental lighting conditions.
| Discomfort Glare Rating | Number of Responses | Window Wall Luminance Contrast | ||
|---|---|---|---|---|
| Left Side | Right Side | Whole | ||
| Intolerable | 1 | 10.82 | 8.75 | 9.96 |
| Disturbing | 36 | 11.72 | 9.97 | 10.94 |
| Perceptible 1 | 73 | 10.94 | 9.69 | 10.43 |
| Imperceptible 2 | 47 | 12.11 | 12.51 | 12.32 |
1 Missing n = 1, 2 Missing n = 2.
Table 5.
Average median luminance contrast and participants’ responses for perceived discomfort glare from the window during stage 5.
Table 5.
Average median luminance contrast and participants’ responses for perceived discomfort glare from the window during stage 5.
| Perceived Glare During Self-Selected Lighting Level | Number of Responses | Median Window Wall Luminance Contrast | ||
|---|---|---|---|---|
| Left Side | Right Side | Whole | ||
| Yes | 17 | 10.39 | 10.42 | 10.28 |
| No 1 | 22 | 11.58 | 10.58 | 11.17 |
1 Missing n = 1.
© 2017 by the authors. Licensee MDPI, Basel, Switzerland. This article is an open access article distributed under the terms and conditions of the Creative Commons Attribution (CC BY) license (http://creativecommons.org/licenses/by/4.0/).
Share and Cite
MDPI and ACS Style
Amirkhani, M.; Garcia-Hansen, V.; Isoardi, G.; Allan, A. An Energy Efficient Lighting Design Strategy to Enhance Visual Comfort in Offices with Windows. Energies 2017, 10, 1126. https://doi.org/10.3390/en10081126
AMA Style
Amirkhani M, Garcia-Hansen V, Isoardi G, Allan A. An Energy Efficient Lighting Design Strategy to Enhance Visual Comfort in Offices with Windows. Energies. 2017; 10(8):1126. https://doi.org/10.3390/en10081126
Chicago/Turabian StyleAmirkhani, Mehdi, Veronica Garcia-Hansen, Gillian Isoardi, and Alicia Allan. 2017. "An Energy Efficient Lighting Design Strategy to Enhance Visual Comfort in Offices with Windows" Energies 10, no. 8: 1126. https://doi.org/10.3390/en10081126
Note that from the first issue of 2016, this journal uses article numbers instead of page numbers. See further details here.