1. Introduction
Clathrate hydrates are nonstoichiometric crystalline compounds formed by encapsulating guest molecules with appropriate sizes into the hydrogen-bonded structures of water molecules [
1]. Facilitated by low temperature and high pressure conditions, the formation of gas hydrates could be a frequent occurrence in petroleum production. With the development of oil and gas entering the deep seas, hydrate plugging has become the major concern in flow assurance for its threat to operational safety and potentially heavy losses [
2]. The high expenses and environmental problems caused by traditional thermodynamic hydrate inhibitors (THIs) hinder its further application with increasing produced water, while the anti-agglomerant (AA) presents itself as a potential alternative with significantly reduced dosage and cost [
3,
4,
5,
6]. By preventing the agglomeration of formed particles, hydrates could be transported as slurry with controlled risk [
7]. Study on hydrate formation and flow rules is an important field of this risk-control technique [
8]. The determination of viscosity of stable hydrate slurries formed from water/oil emulsions is also significant for the application of hydrate slurry technology.
Camargo et al. [
9] reported shear thinning and thixotropic properties of hydrate slurries formed in the asphaltic crude oil in a rheological cell. Peng et al. [
10] and Yan et al. [
11] also observed shear thinning behavior of a hydrate slurry formed in the condensate or diesel oil in a flow loop. Moradpour et al. [
12] measured viscosities of hydrate slurry formed in systems with over 50% water cuts in a variable volume cell, and proposed a revised viscosity model by correlating viscosity with hydrate volume fraction. Webb et al. [
13,
14,
15] examined viscosity of hydrate slurry formed in oil with and without a surfactant addition for different water cuts in a high-pressure rheometer during methane hydrate formation and dissociation. Pressure, temperature and shear rate were claimed to among the important factors affecting viscosity during hydrate formation. However, currently the effects of different AAs were not considered and few experiments were conducted with respect to hydrates of natural gas.
In this work, a high-pressure viscometer was used to investigate in-situ viscosities of emulsions and natural gas hydrate slurry. The effects of different AAs, water cuts, temperatures and annealing on the viscosity of emulsions and hydrate slurry were analyzed. System viscosity during hydrate formation and equilibrium viscosity of hydrate slurry were investigated. This work implied that AA could effectively reduce the sensitivity of hydrate slurry viscosity to the volume fraction of hydrates and temperature, control agglomeration and prevent plugging in high water cut systems. This study should be significant for the application of slurry flow technology to the petroleum industry.
2. Results and Discussion
2.1. Viscosities of Water-in-Oil Emulsions with Different AAs
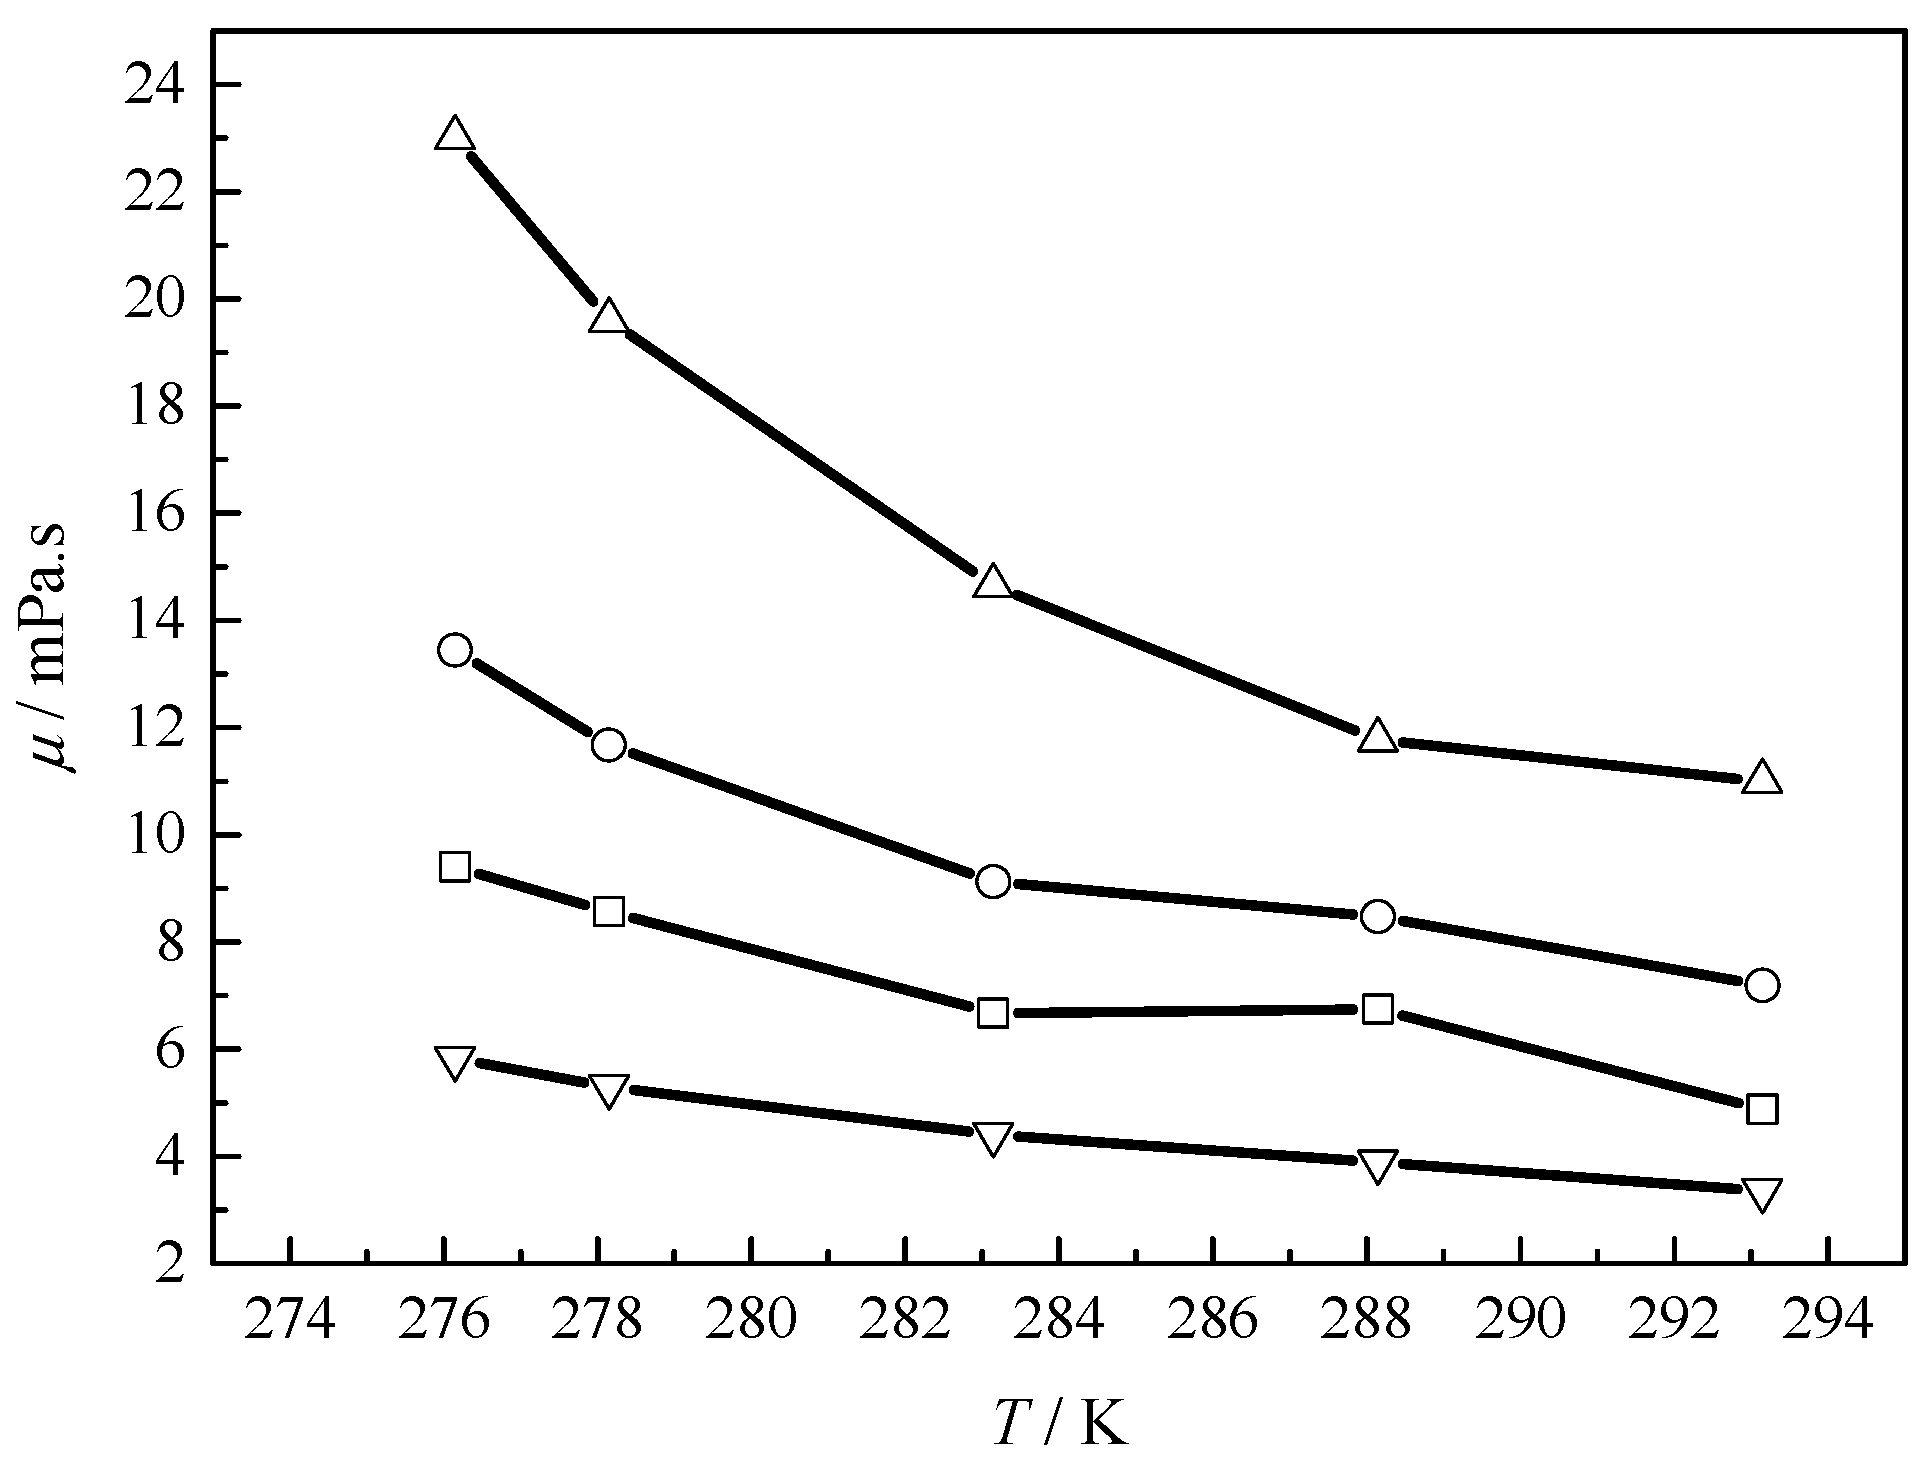
The viscosity of water-in-oil emulsion with AA and different water cuts was examined at 276.2 MPa to 293.2 K under atmospheric pressure, and the results are presented in
Figure 1,
Figure 2,
Figure 3,
Figure 4 and
Figure 5. In accordance with Yan’s observations [
16], viscosity increases with the water cut due to enhanced interactions between dispersed phase and continuous phase [
17]. When the water cut is lower than 20%, emulsion viscosity increases linearly with the decrease in temperature. When the water cut is higher, depending on the type of AA, the emulsion viscosity exhibits a more significant rise with drop in temperature compared with the viscosity of pure oil. Because of the amount of added AA being proportional to the water cut, the emulsion viscosity somehow demonstrated more sensitivity to temperature with higher water content, especially for systems with AA-1, AA-3 and AA-5.
The viscosity of emulsion could be expressed in relative viscosity, eliminating the effect of variation in the viscosity of the continuous phase. The relevant factors affecting the viscosity of the emulsion could mainly be the concentration of the inner phase, the viscosity of continuous phase, temperature and size distribution of dispersed phase. The relative viscosity
μr of an emulsion could be expressed by the Einstein equation if the emulsion is infinitely dilute [
18]:
where
is a constant that may vary from one emulsion system to another, and
stands for the dispersed-phase concentration. During the 1940s and 50s, researchers retained more terms in a power series to express emulsion viscosity as follows:
Richardson [
19] observed an exponential increase in relative viscosity as a function of
and proposed the following equation:
where
k is a constant. One modification of Richardson’s original model was proposed by Broughton and Squires [
20] with another system-dependent parameter
A.
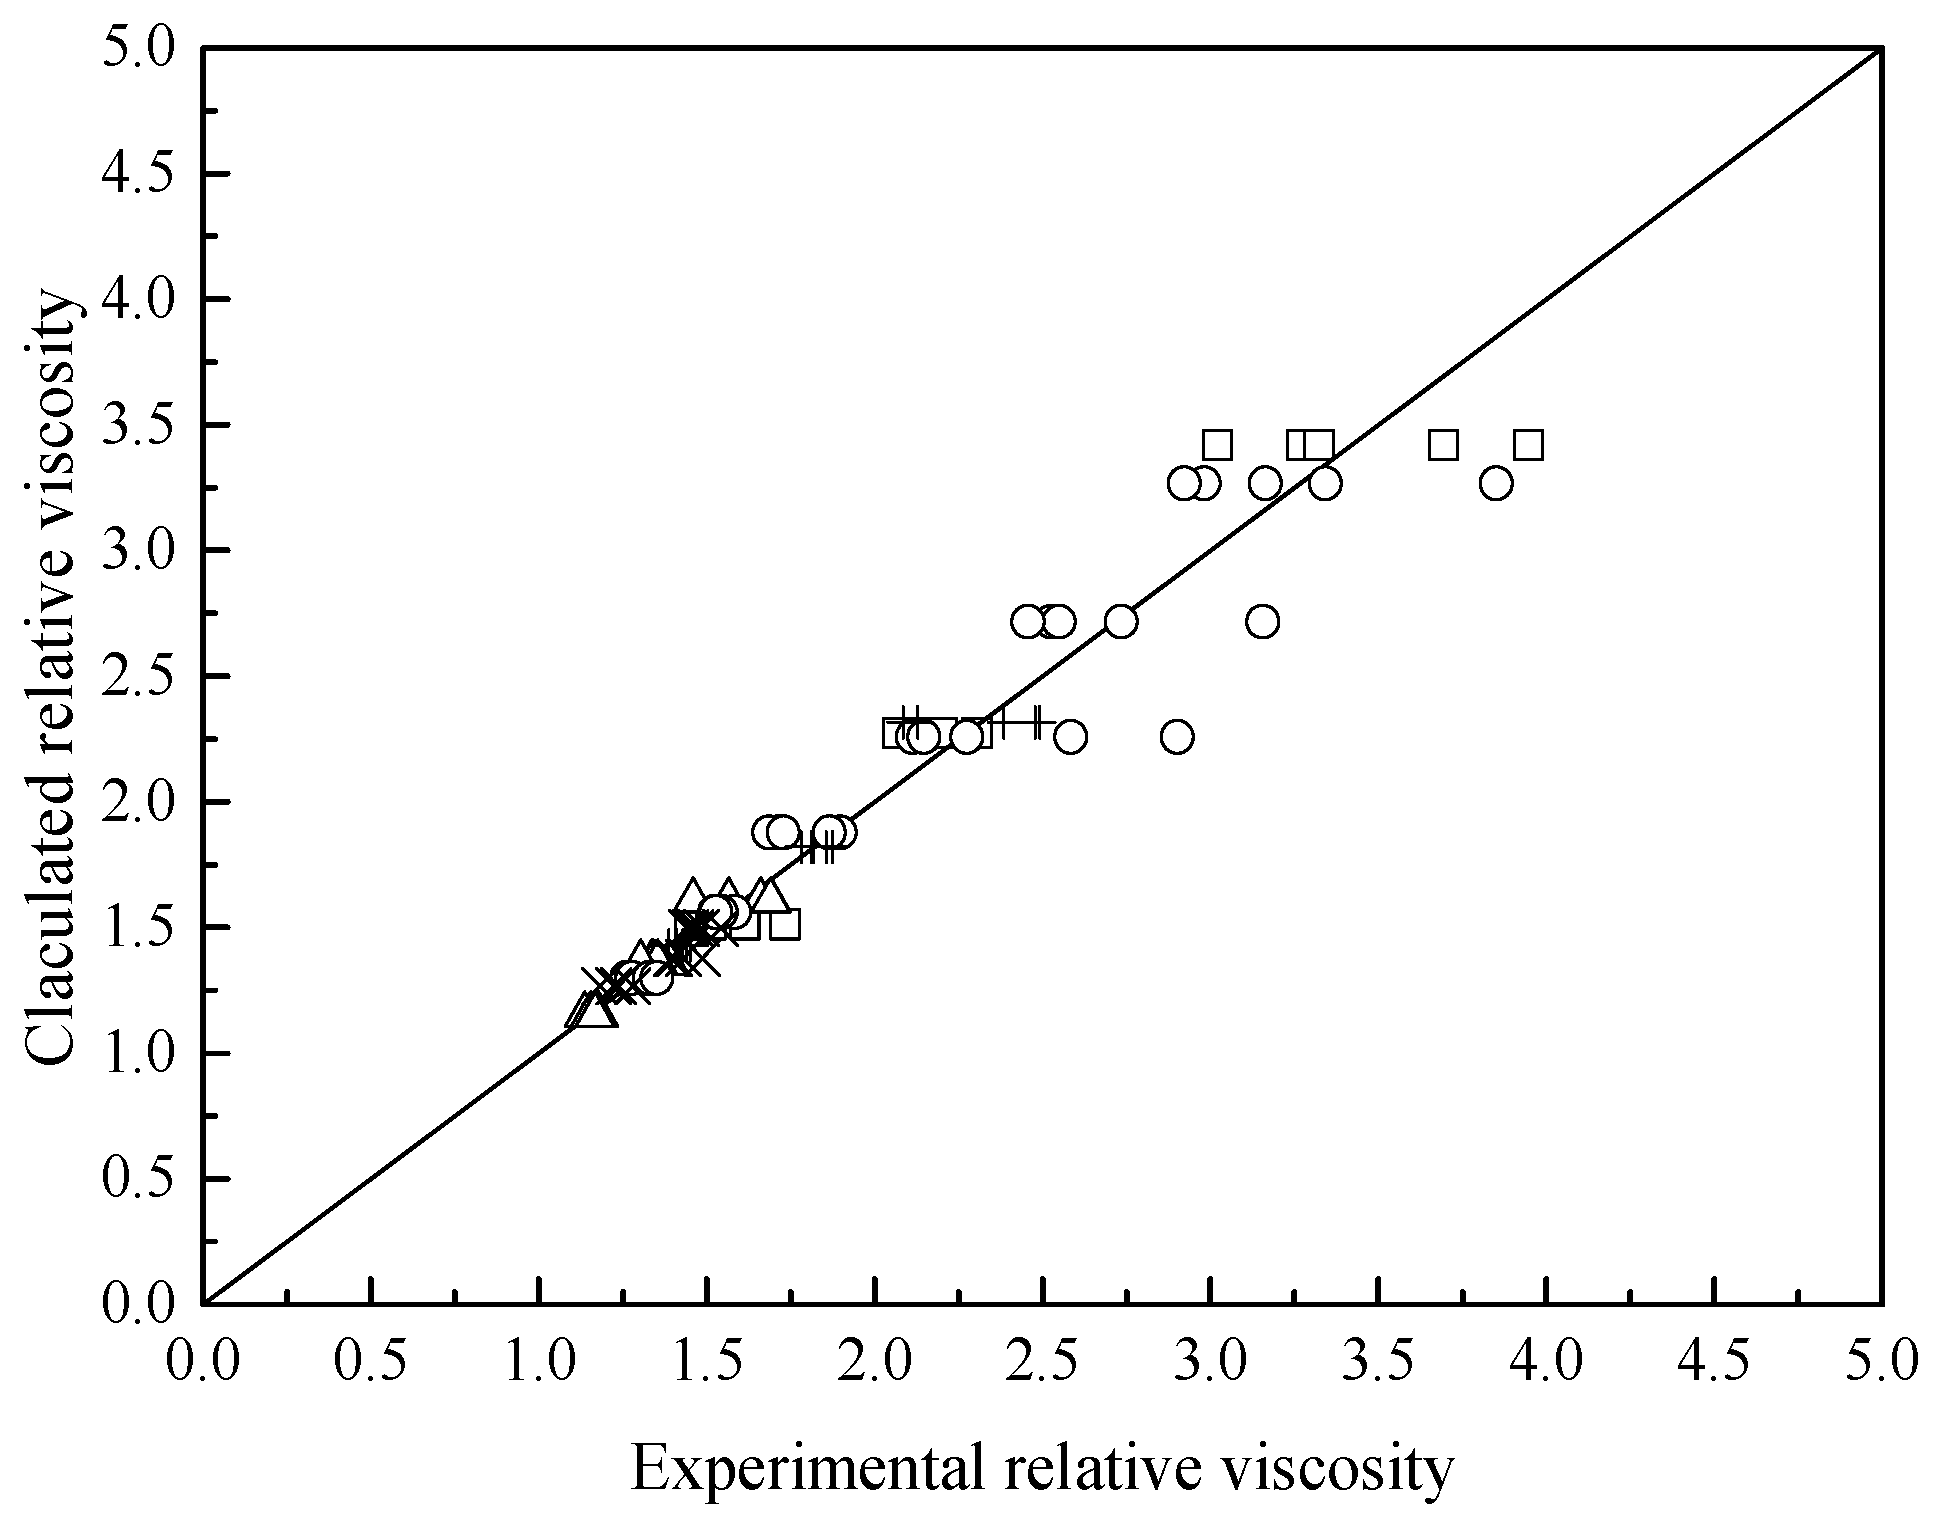
The measured emulsion viscosities were correlated and the corresponding models and regressed parameters
A and
k in Equation (4) are listed in
Table 1. As shown in
Figure 6, the calculated results using the obtained parameters show a good agreement with experimental relative viscosity of emulsion, except for the high water cut (≥25%) systems with AA-1 or AA-3 due to their relative viscosity being highly temperature-dependent; the effect of temperature is neglected in all the above equations. This implies that Broughton model is comparatively appropriate to describe relative viscosity of emulsions with AAs, particularly for low water cut systems.
2.2. A Typical Trend of System Viscosity during Hydrate Formation
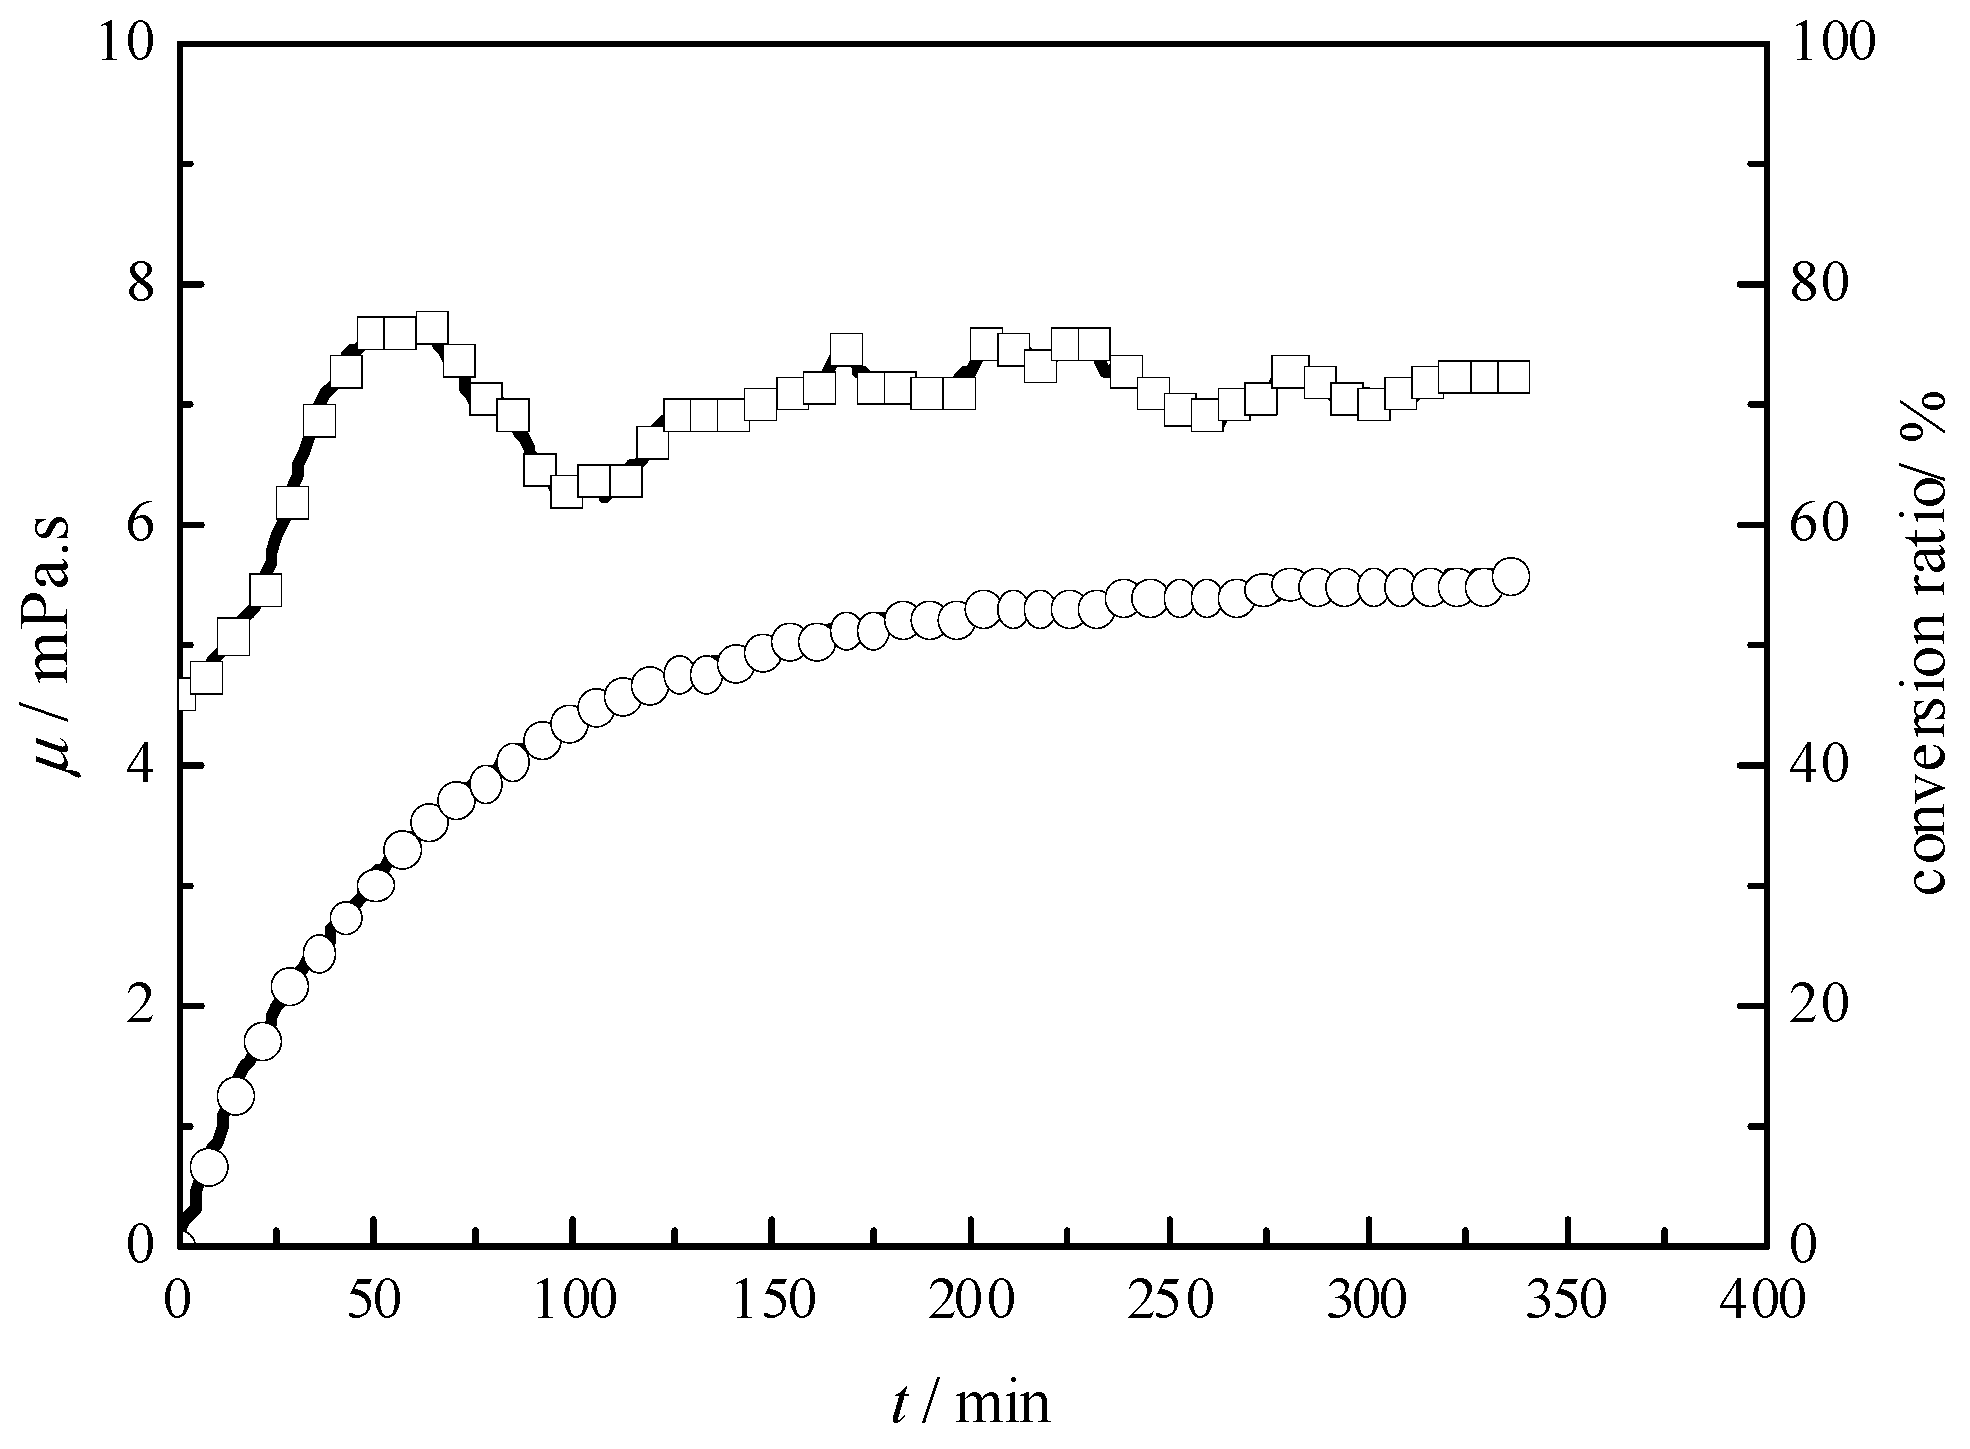
A typical trend of viscosity during hydrate formation at 278.2 K with an initial pressure of 6.0 MPa and 300 rpm is presented in
Figure 7 for a 10% water cut system with AA-2. Upon nucleation, as shown in
Figure 7 at time zero, system viscosity usually rises gradually and fluctuates with increasing conversion ratio of water. After conversion for 6 h, conversion ratio of water reaches approximately 56% and stabilizes when formation ceases due to the depletion of free water [
21] and mass transfer resistance [
1]. With the notably decreased formation rate, viscosity tends to level off. This indicates that change in volume fraction of hydrates is the primary factor affecting slurry viscosity. Hydrate formation is closely related to the agglomeration behaviors of particles. The depletion of free water would lead to a smaller capillary bridge force between particles [
13,
14]. With continuous flow shear, particle size distribution tends to stabilize [
21]. Thus viscosity would drop slightly and remain constant. It is noted that fluctuation of viscosity mainly occurs when water conversion increases rapidly and more free water is present in the system.
2.3. Viscosity of Annealed Hydrate Slurry with AA-2
After hydrate formation, particles could further anneal and agglomerate with time [
14,
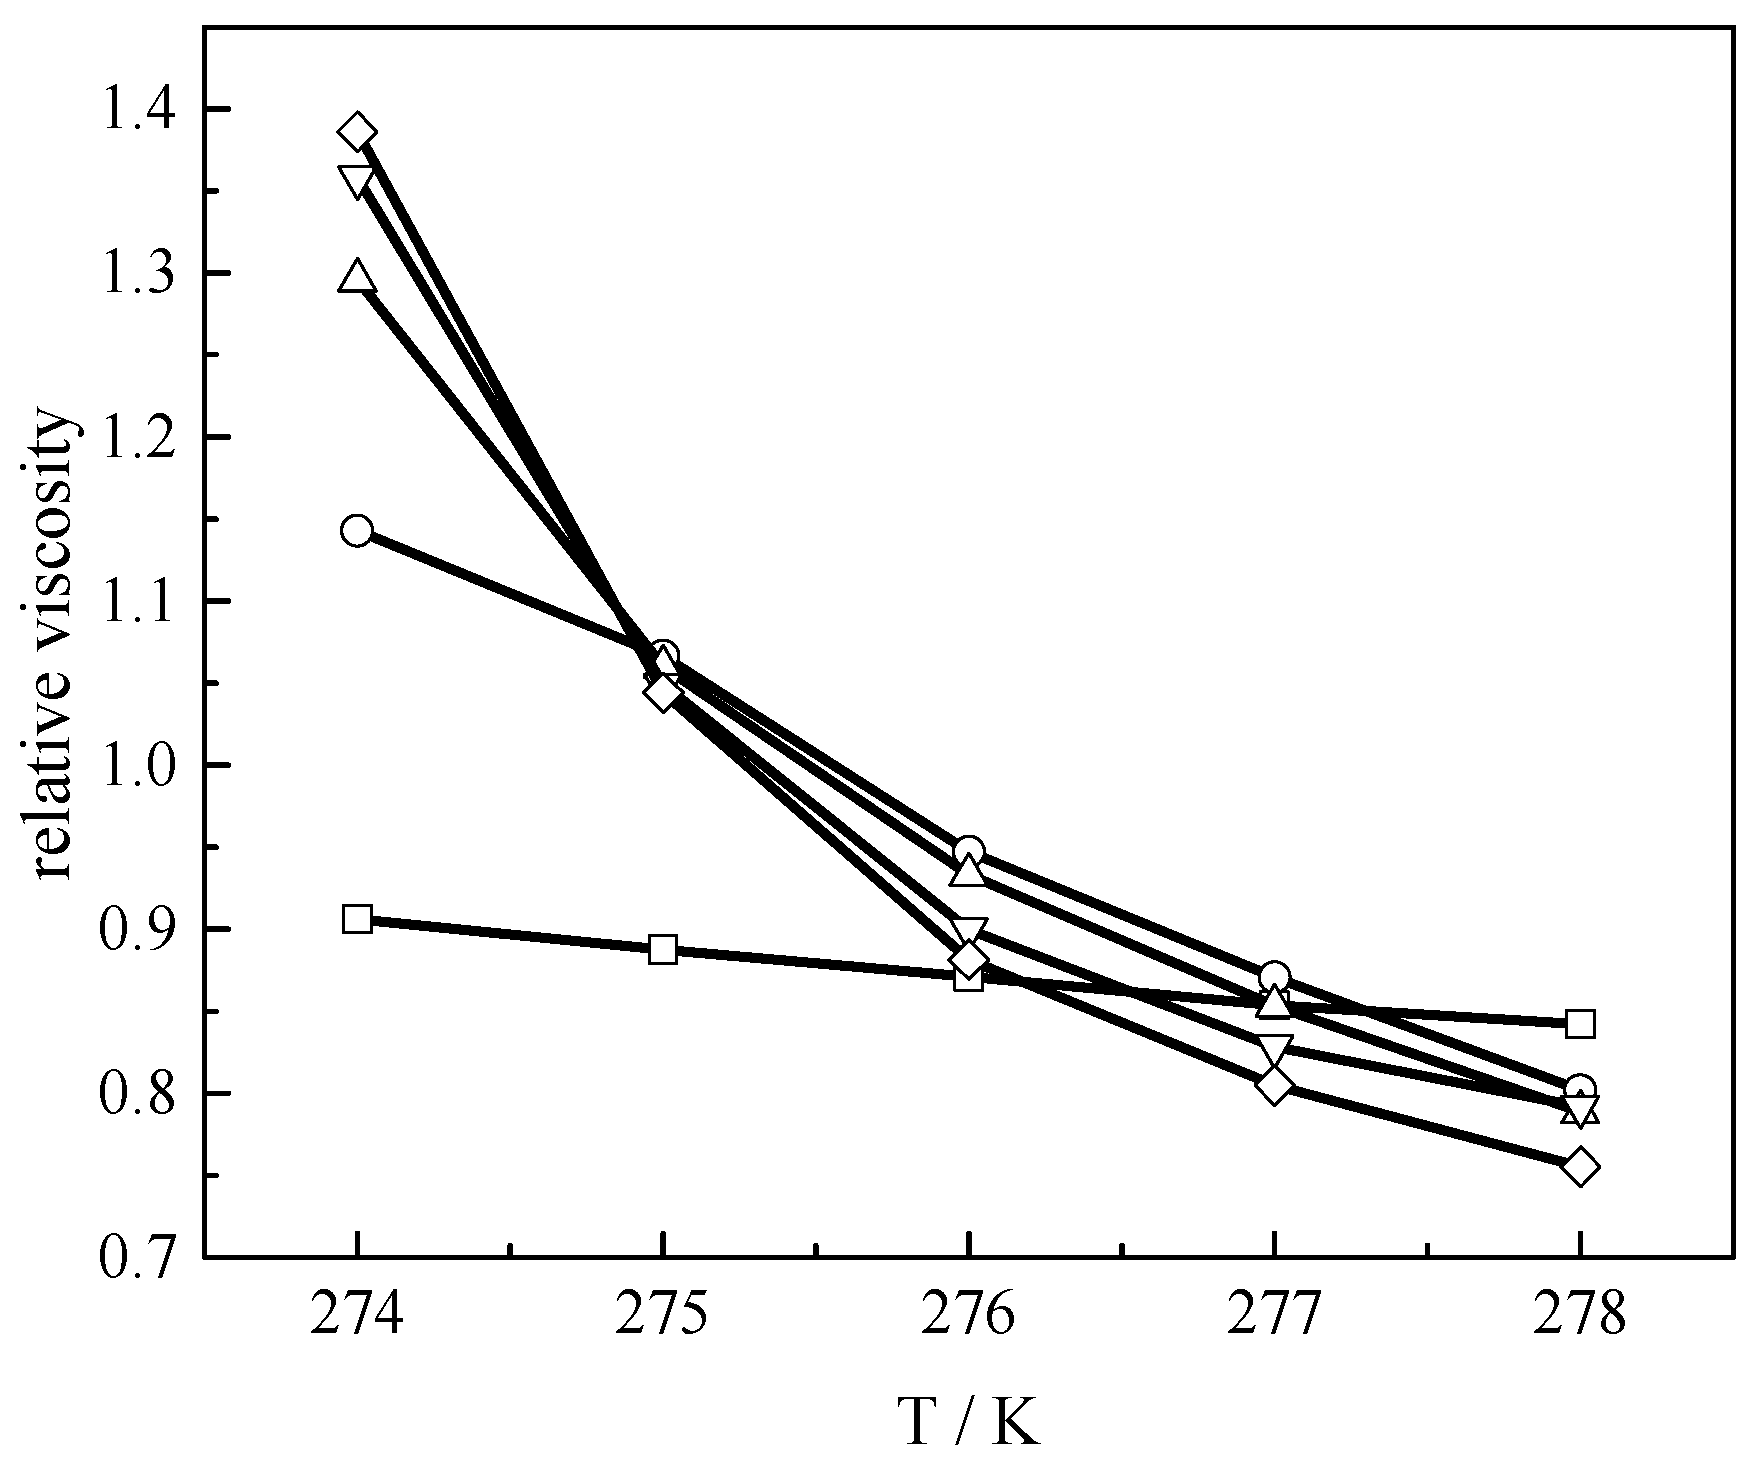
15]. To investigate the effects of annealing, the viscosity of slurry with AA-2 and volume fraction of water from 5% to 25% was measured at different temperatures after formation for 12 h. The obtained results are shown in
Figure 8. Equilibrium slurry viscosities of low water cut systems change almost linearly with temperature, while the sensitivity of relative viscosity to temperature increases with water cut. In the presence of AA-2, the relative viscosity of slurry generally increases slightly with a water cut at lower temperatures. In many cases, the relative viscosity of slurry is less than 1.0 indicating the viscosity of live slurry with gas is even smaller than that of gas-free emulsions. This is because gas dissolution into the oil phase resulted in a slurry viscosity decrease, which is more significant when the water cut is higher and less oil was present in the system as a solvent of gas. Thus the viscosity increase caused by higher volume fractions of solids (more significant at lower temperatures) and downward offset of relative viscosity due to gas dissolution led to smaller relative viscosities of high water cut systems compared with those of low water cut systems at higher temperatures.
After conversion for 12 h, the constant temperature and pressure conditions correspond to the natural gas hydrate stability field, while formation ceases and water is far from full conversion, as indicated in
Table 2. This implies that remaining water is encapsulated in hydrate layers hindering the contact and reaction of host and guest molecules [
1,
21]. After formation stops, the volume fraction of particles, distribution of different phase, particle size distribution and relevant viscosity tend to stabilize. Thus, the remaining/encapsulated water would constitute the effective volume fraction of hydrate particles. The sum of volume fractions of hydrate crystals and unreacted water (hydrate + water) is listed in
Table 2 in addition to the volume fractions of each phase. The volume fraction of hydrate crystals increases with the decrease in temperature and further conversion of water at lower temperatures. It could be inferred that the effective volume fraction of aggregated particles (as shown in the column of hydrate + water in
Table 2) hardly changes after annealing, and that the equilibrium slurry viscosity is sufficiently low at different temperatures and water cuts.
2.4. Equilibrium Viscosity of Hydrate Slurry with Different AAs
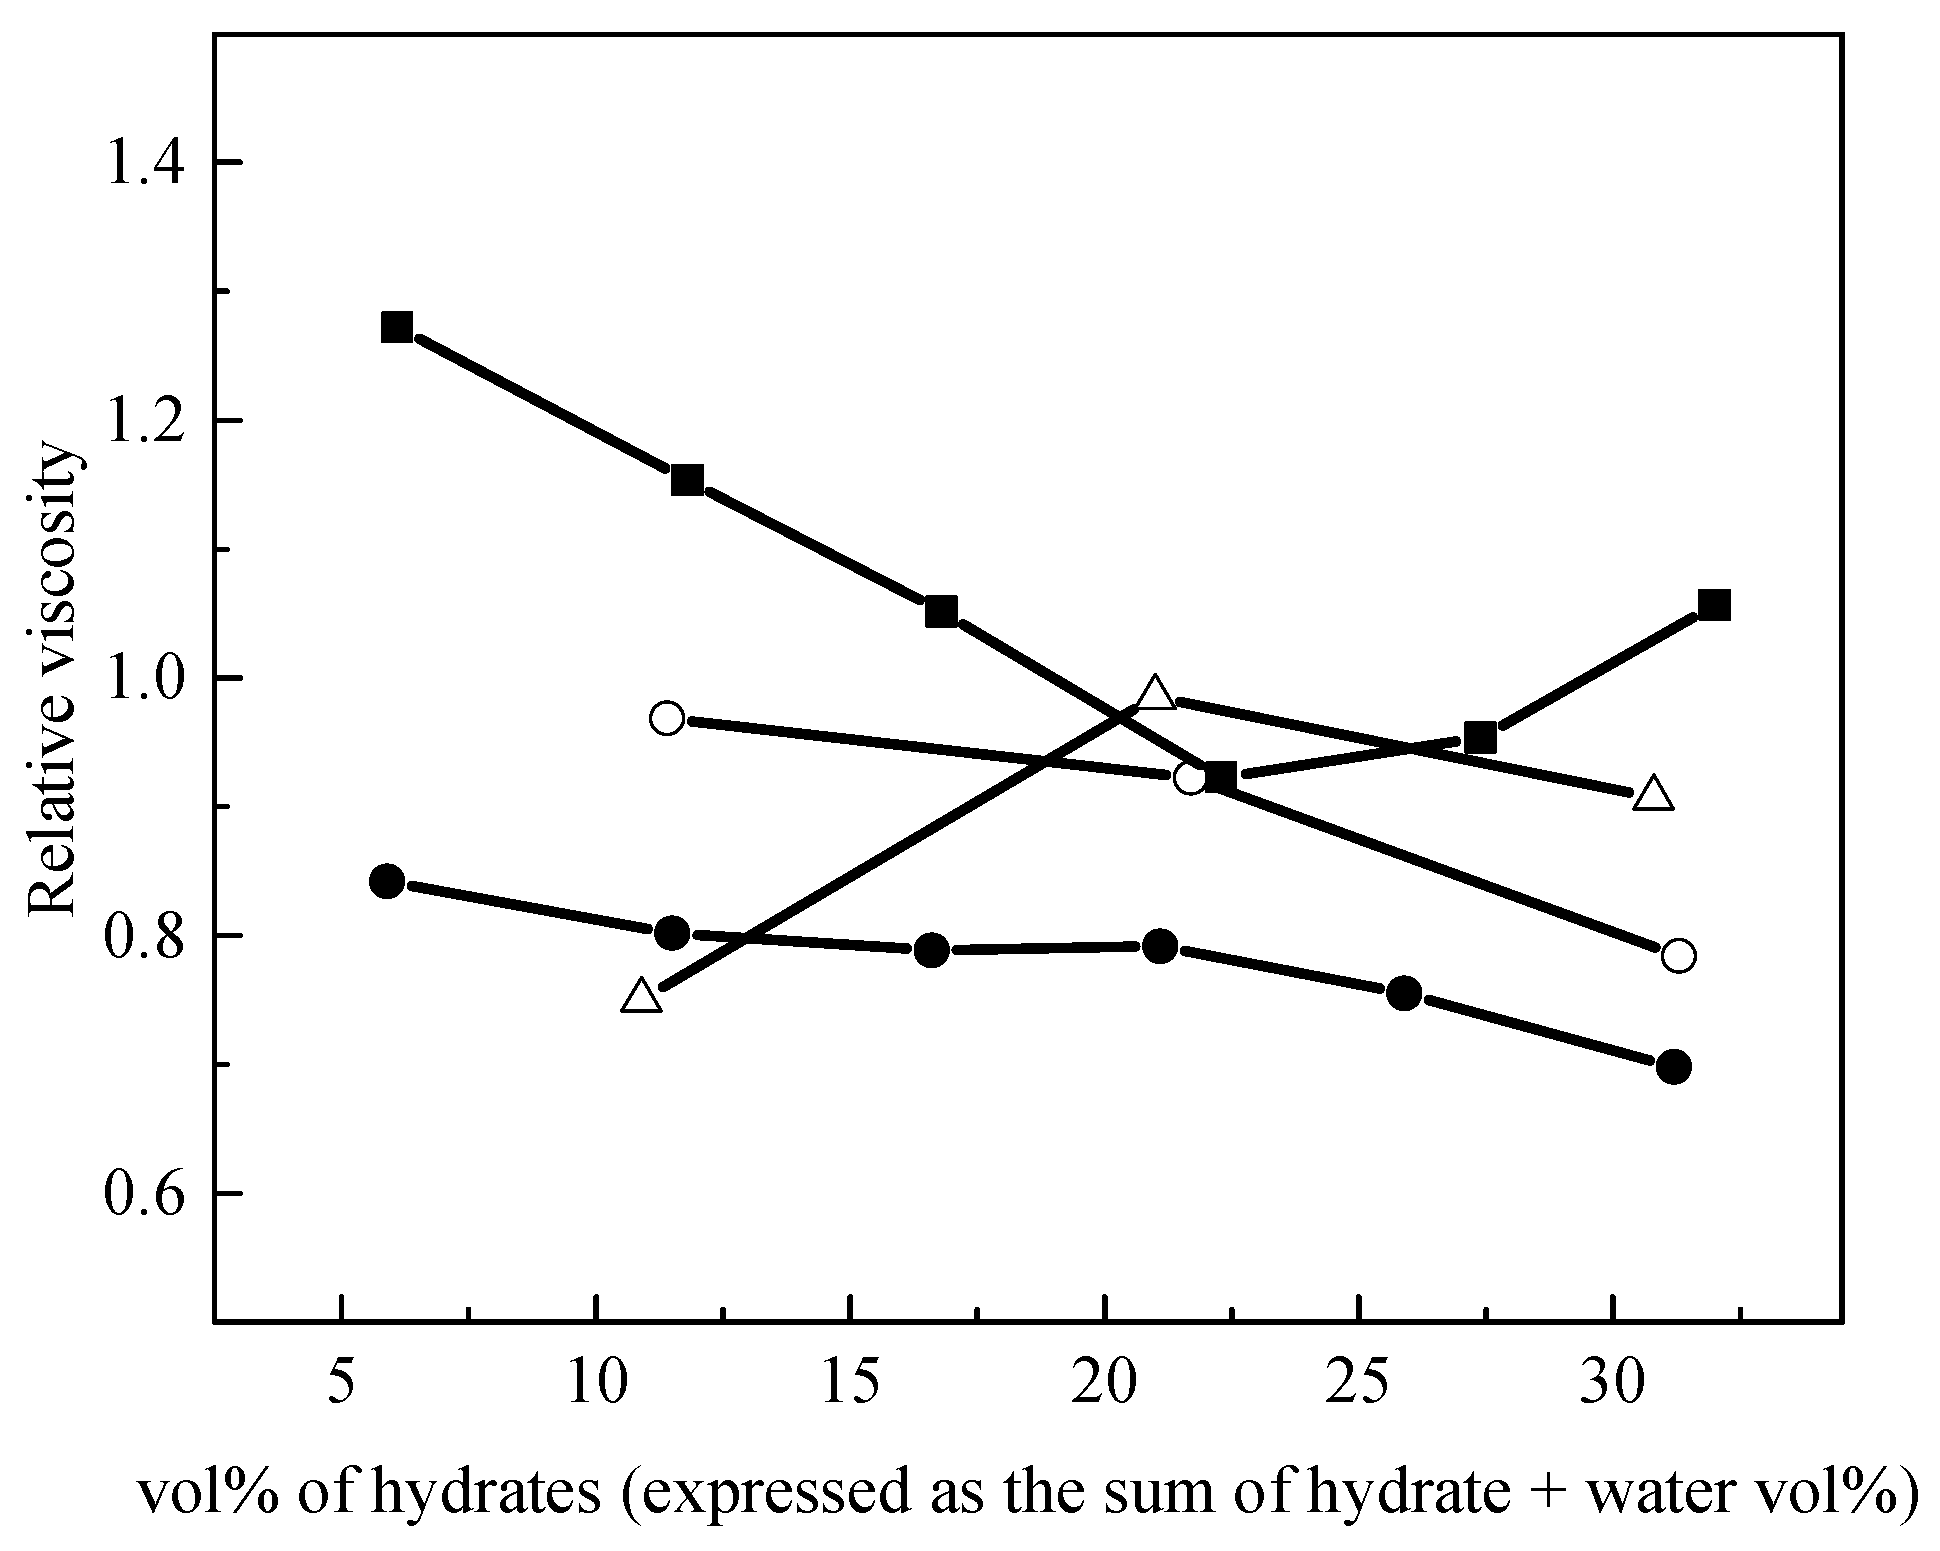
To investigate the effects of different AAs (AA-1 to AA-3) on equilibrium viscosity, the relative viscosity of slurries with different water cuts after formation can be found in
Figure 9. For oil-dominated systems, a higher water cut is accompanied by an increased volume fraction of hydrates and a higher plugging risk. As discussed above, free water is unlikely to be present after a long time conversion and at least should attach to hydrophilic hydrate aggregates; therefore, the volume fraction occupied by the hydrate phase should better be expressed as the sum of vol % of hydrates and the remaining water. The relative viscosity of slurry with AA-1 initially increases with the water cut increase and then remains in the range of 0.9 to 1.0, while relative viscosity with AA-3 first demonstrates a decrease and then increases with the water cut increase. Considering the relatively high absolute viscosity values of corresponding gas-free emulsions, these trends indicate high risks associated with higher water cuts. By contrast, the relative viscosity of slurry with AA-2 exhibits decrease with the water cut increase and the trend of viscosity at 276.2 K is consistent with that at 278.2 K. This implies that for AA-2, with the increase in the water cut, influences of gas dissolution are more significant than the effects of increase in volume fraction of solids on slurry viscosity. These behaviors of relative viscosity of slurry should depend on the effects of different AAs on interfacial properties of hydrate particles.
With an increasing water cut, the hydrate layers may not be able to encapsulate all the droplets and there is likely to be excess free water during formation. The collision and agglomeration of particles and droplets would also cause the formation of water film around hydrate particles [
21]. The location and amount of water could be an important variable in determining overall cohesive force [
22]. Thus excess free water and/or the presence of water film should affect cohesive force [
22,
23,
24,
25,
26], interparticle aggregation and viscosity. According to the proposed mechanism of anti-agglomeration [
3] in oil-dominated systems, Span 20 may disperse water droplets into the oil phase evenly, while another component of AA may interact with hydrate surface to prevent particles from agglomeration. Recent studies [
27] demonstrated that the natural cooperative effect of the active components constituting FJ-1 in AA-2 prevailed in hydrate agglomeration prevention. Active components in FJ-1 may adhere to hydrate crystals due to the hydrogen bond and hydroxyl, which may destroy regular crystalline configurations, thereby limiting crystal size. The surface wettability of hydrate crystal would be changed by the oleophilic phenyl group and the C-C double bond in active components. Thus, smaller hydrate crystals could disperse evenly in oil with AA-2 without agglomeration. Hoiland et al. [
28] assessed the wettability of Freon hydrates formed in water/crude oil emulsions and claimed that reduced risks of plugging were related to the formation of oil-wet hydrates. With respect to natural gas hydrates, the effects of AA on interfacial properties should largely determine anti-agglomeration performance [
22,
29], while higher water cut is a greater challenge to AA performance.
The volume fractions of different phases for the corresponding systems are listed in
Table 3. The experiments performed with higher water cuts display smaller conversion ratios of water than those with lower water content. After formation, more water is likely to be encapsulated in hydrate layers in high water cut systems. With an identical water cut, the effective volume fractions of hydrates (as indicated in the column of hydrate + water in
Table 3) are found to be comparable for different AAs. Therefore, the viscosity of a system is almost entirely dependent on the anti-agglomeration effects of AA. As shown in
Figure 9, AA-2 addition leads to notably low sensitivity of the relative viscosity to volume fraction of hydrates and demonstrates optimal anti-agglomeration performance.
3. Materials and Methods
3.1. Materials
Diesel oil was used to form dispersion system and its composition was listed in
Table 4. Twice distilled water was prepared in our laboratory with electrical conductivity <10
−4 S·m
−1. Four anti-agglomerants (Esters polymer, Benzimidazole, tetra-n-butyl ammonium bromide (TBAB) and FJ-1) were combined with sorbitan monolaurate (Span 20) to enhance performance in this work. FJ-1 was developed in our research group [
30] and its performance was evaluated using high-pressure cells and a flow loop [
11,
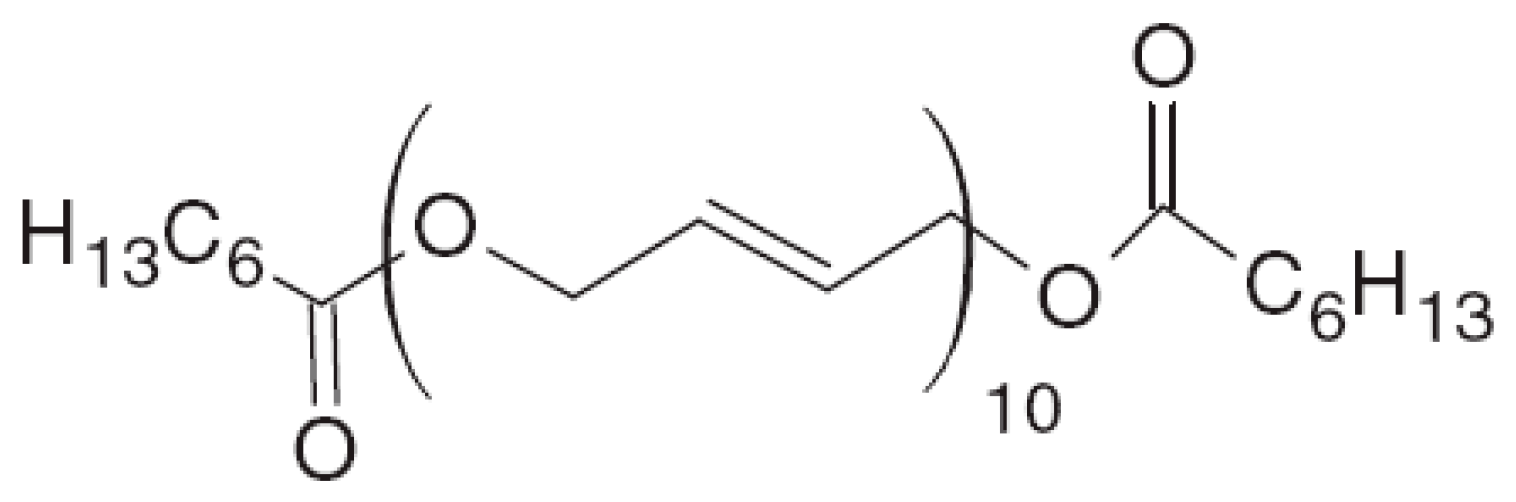
31]. Esters polymer was provided by HenanTitaning Chemical Technology Co., Ltd. (Zhengzhou, China) and its structure was shown in
Figure 10. For more information on esters polymer one can refer to the previous literature [
10]. The cationic surfactant TBAB, Benzimidazole and Span 20 were purchased from Sinopharm Chemical Reagent Beijing Co., Ltd. (Beijing, China). The compositions of tested AAs were summarized in
Table 5. To simulate hydrate formation in the oil and gas transportation pipeline, a gas mixture collected from a gas field was adopted whose composition is listed in
Table 6. Analytical grade nitrogen of 99.99 vol % was supplied by Beijing Beifen Gas Industry Company (Haidian, Beijing, China).
3.2. Apparatus
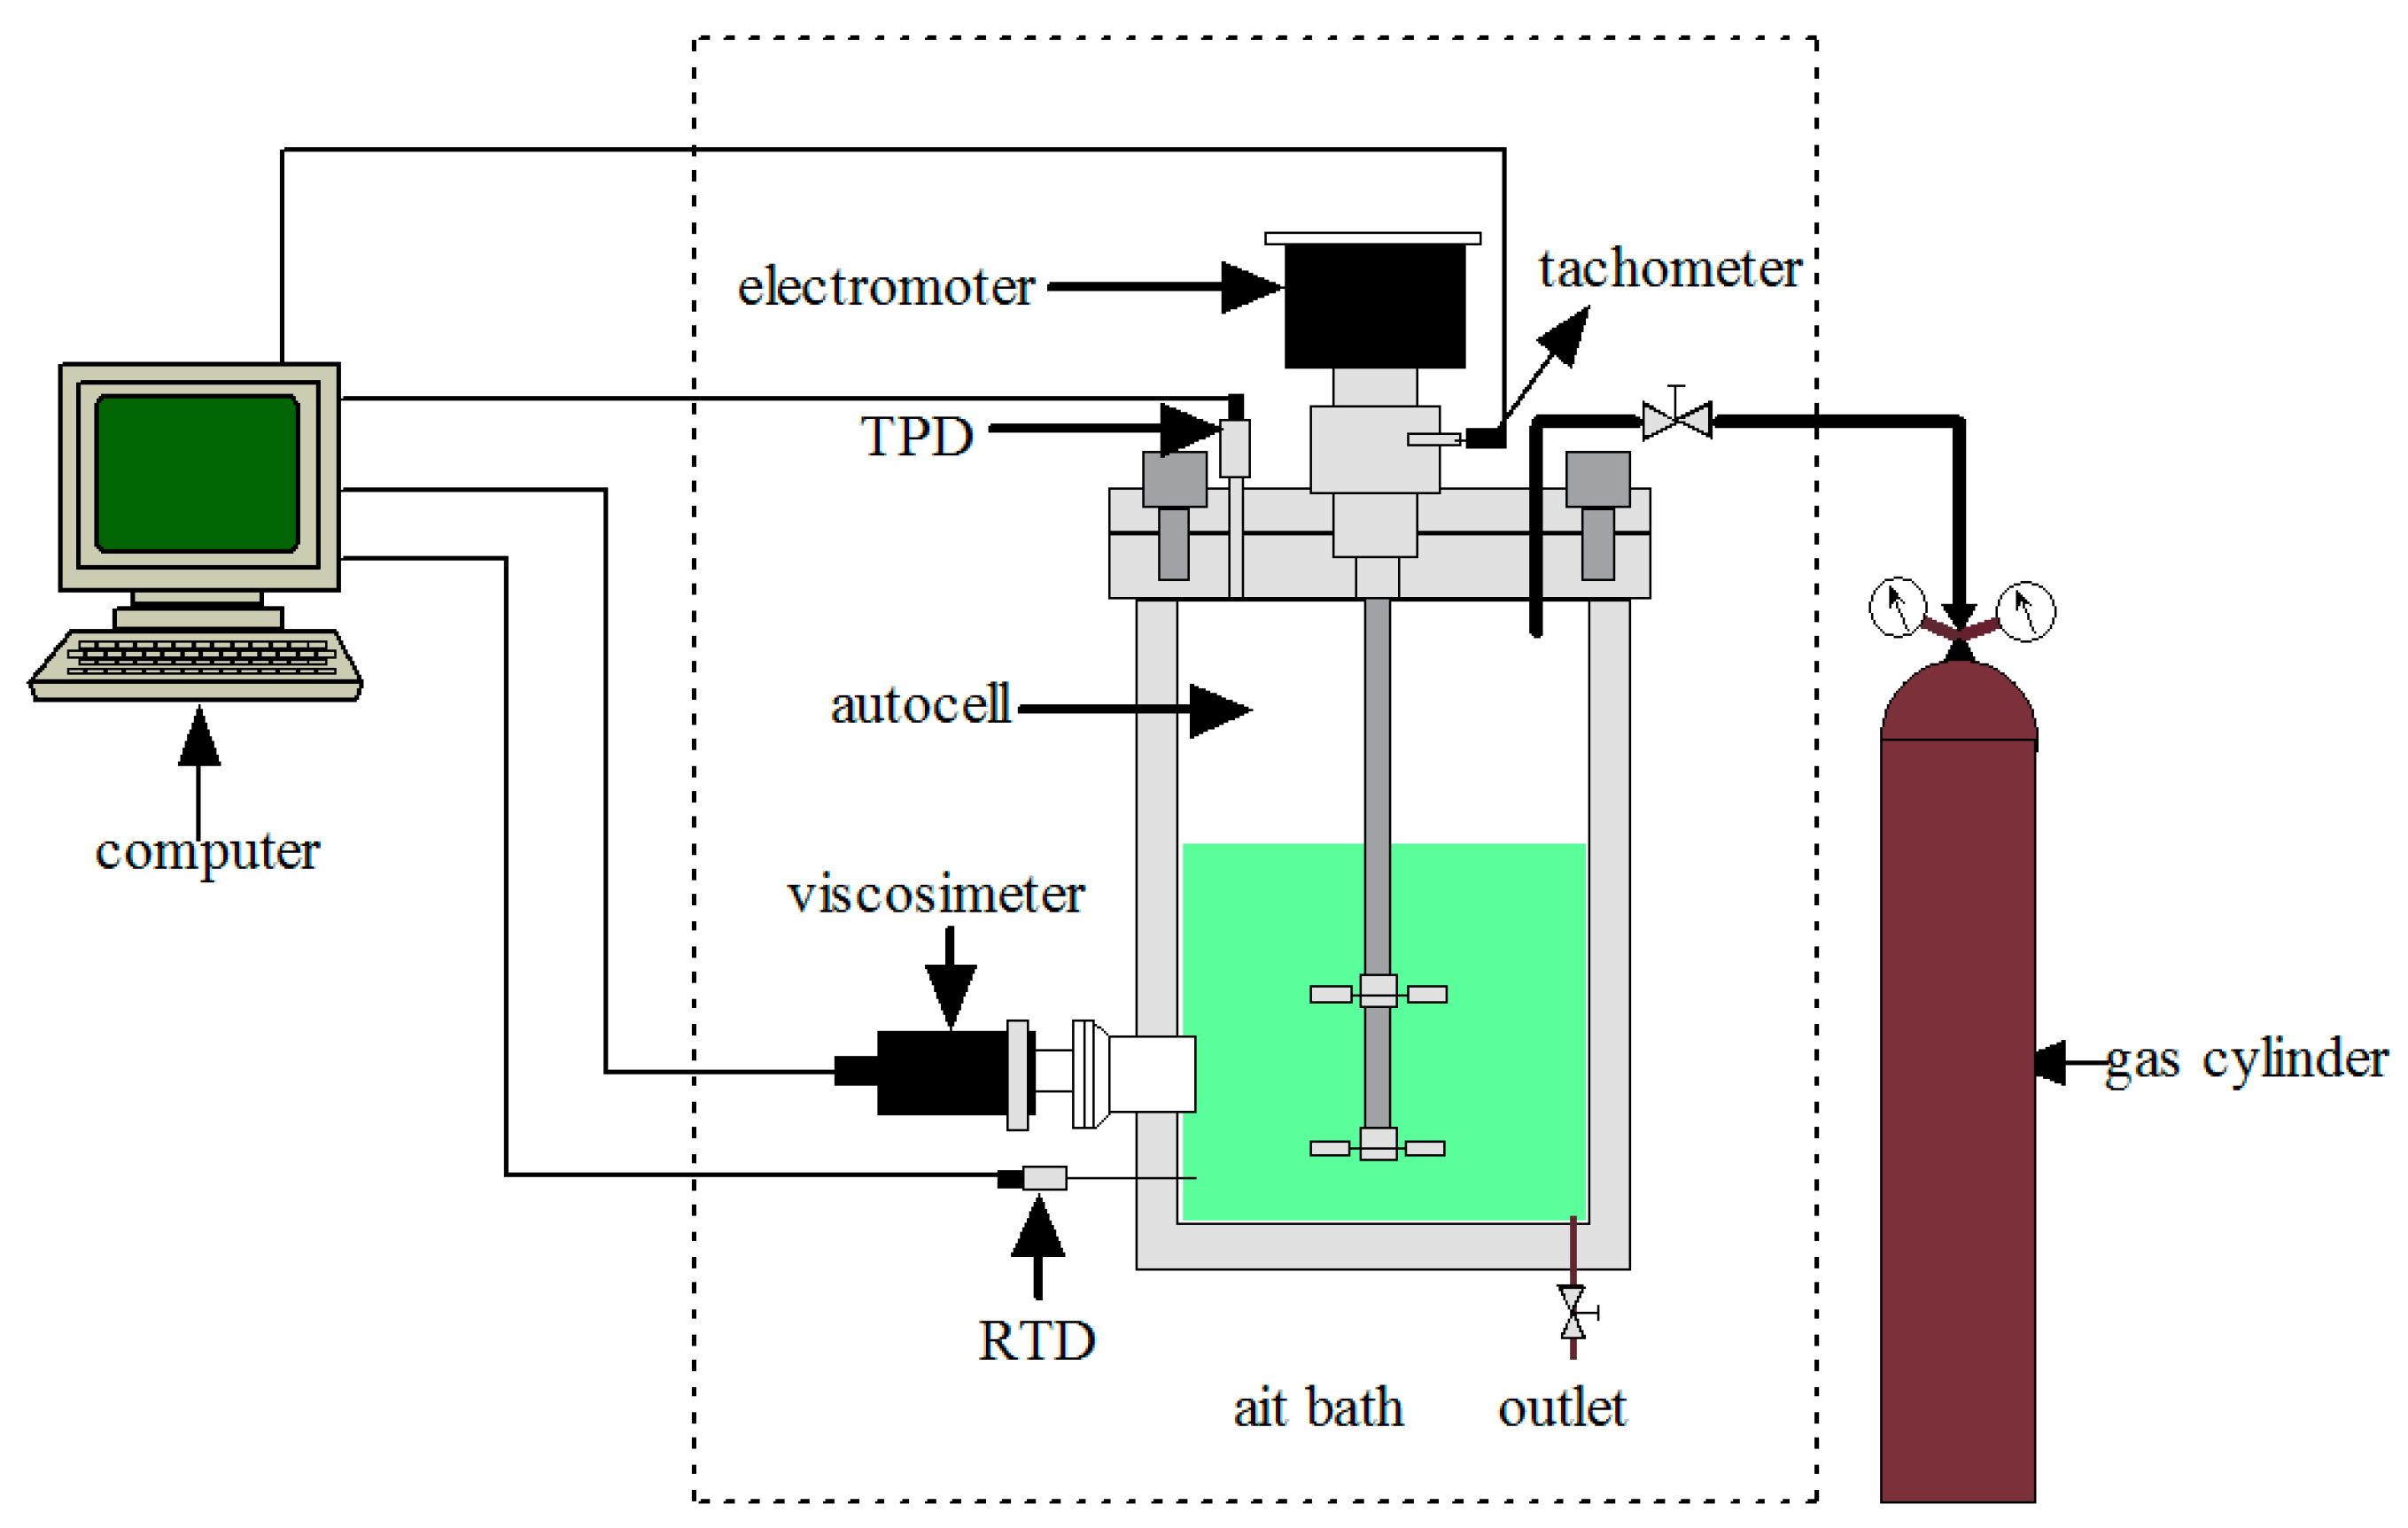
As shown in
Figure 11, the experimental apparatus is mainly constituted by a high-pressure reactor with magnetic stirrer in a test chamber, a viscosity probe and a data acquisition system. The high pressure reactor is made of 316 L stainless steel. The reactor had an internal volume of 763 cm
3. The temperature of the system is controlled by a RGDJ-150 test chamber (manufactured by Tianjin Surui Science and Technology Development Co., Ltd., Tianjin, China) with a precision of ±0.10 K within the range of 233.3 K to 473.2 K. The magnetic stirrer includes impellers and a magnetic stirring motor with adjustable speed. Temperature and pressure data could be collected and recorded by the data acquisition system including a thermal couple (precision: ±0.10 K) at the bottom of the cell and a pressure transducer (precision: ±0.01 MPa). The viscosity probe is VISCOpro 2000, manufactured by Cambridge Viscosity Inc. (Medford, OR, USA). This piston-style viscometer includes one piston and two coils within a sensor. In the measurement chamber, when the piston is surrounded by the fluid sample, the coils could magnetically force the piston back and forth at a preset distance. The time required for the piston to complete a two-way cycle is regarded as an accurate measure of viscosity. The relative uncertainty of obtained viscosity ranges from ±0.07% (viscosity = 0.3–7.4 cp) to ±0.12% (viscosity = 10–30 cp) for relevant measurements. This probe is also made of 316 L stainless steel and operates at pressures up to 7 MPa with a viscosity range of 5–100 mPa·s. The viscosity probe was located in the middle of the high-pressure reactor to ensure that reliable trends of viscosity are obtained by representative sample deflected into the probe. The ability of adopted anti-agglomerants to disperse particles evenly was confirmed through sapphire-cell experiments [
11] and observations by particle video microscope (PVM) and focused beam reflectance measurement (FBRM) probes with small flow shear rate [
21]. The experiments were maintained at stirring condition during the whole process and, thus, the fluid should be fully dispersed owing to the addition of anti-agglomerant as emulsifier [
3,
31] in the water/oil systems and continuous shear. Good reproducibility in different measurements and stability of slurry viscosity after hydrate formation in each single measurement should also verify the generally homogeneous dispersion of the system. Primary tests indicated that system viscosity without AA addition was not measurable at all and hydrates quickly plugged the measurement chamber, thus in this work AA was added in each viscosity experiment.
3.3. Procedures
The reactor, all the connectors and the probe were first washed by deionized water and then dried by nitrogen. The water/oil dispersion was prepared according to the oil/water ratios and with 3% of mass fraction of anti-agglomerant in water. The total volume of the liquid phase was 300 cm3. The prepared dispersion was poured into the cell and the reactor was evacuated by a vacuum pump for 10 min to remove residual air. The temperature of the test chamber was then set to required value and the stirrer was started at 300 rpm. When the system temperature turned constant, the viscosity probe was turned on. Stable viscosity value was regarded as the viscosity of emulsion at this temperature. In a formation test, after system temperature became constant, natural gas was injected into the system until pressure reached 6.0 MPa. The inlet valve was closed and the agitation was maintained at 300 rpm when hydrate formation continued. When the system pressure had stayed constant for over 2 h, the equilibrium viscosity of hydrate slurry was determined. The remaining gas was sampled and analyzed by gas chromatography (HP 7890). Since the gas mixture involves different gas components and isochoric conditions were used, hydrate formation in this work is actually a process when the formation driving force lowered significantly due to pressure and compositional change. Eventually, system conditions became close to equilibrium conditions and the final driving force was small, especially for experiments at 278.15 K. However, this kinetics behavior of hydrate formation was not particularly discussed in detail in this work, which mainly focused on slurry viscosity after the formation ended. In an annealing test, hydrate slurry was left for formation for 12 h at 278.2 K and an initial pressure of 6.0 MPa with 300 rpm before viscosity measurements were carried out. System temperature was then lowered by 1 K in each step. A stable value of slurry viscosity was obtained after formation when the system temperature was constant at the required value.
3.4. Data Analysis
The calculations of conversion and volume fractions of different phases were based on the equilibrium composition of the natural gas after formation ended. The calculation of percentage of converted water into hydrates is based on mass balance. According to dissolution experiments, the rate of gas-liquid mass transfer at the gas-liquid interface is significantly larger than the rate of gas consumption by hydrate formation. This is also likely to be true after hydrate nucleation [
32]. Therefore the moles of dissolved gas could be calculated by gas-oil flash calculation. The total moles of gas molecules in the system consist of molecules in gas phase, oil phase, and hydrate phase, as shown in the following equation:
where
ng represents the moles of gas molecules in the gas phase, subscript 0 refers to the time of hydrate nucleation and
t stands for time
t after nucleation,
nd denotes the amount of dissolved gas molecules in the oil phase,
nhyd represents the moles of accumulated gas molecules encapsulated in hydrate at time
t.
The gas volume can be estimated by subtracting the volumes of oil phase and initial water phase from the total volume. The moles of gas in the gas phase are given by:
where
Pt is system pressure and
Tt is temperature,
V denotes gas volume at time
t after nucleation,
Zt stands for the compressibility factor and was calculated by the Patel-Teja equation of state [
33]. The mole conversion percentage of water
Ft and the formation volume ratio
f (the volume fraction of hydrates in the liquid-hydrate mixed phase) can be inferred as follows:
where
Vrw is the volume of reacted water and
Vw is the total volume of water added. The value of 1.27 refers to the expansion factor and 300 cm
3 represents the total volume of the liquid phase. The value of 6.35 refers to the hydration number corresponding to equilibrium gas composition.
mj is the mass of water initially added and
Mw is the molar weight of water.
4. Conclusions
A high-pressure viscometer was used to determine the viscosity of water-in-oil emulsions and natural gas hydrate slurries during and after hydrate formation with different AAs. The results indicate that variation of emulsion viscosity with water cut and temperature is dependent on the AA type. Emulsion viscosities correlate well with current viscosity models. Upon hydrate nucleation, the viscosity of slurry with AA increases gradually and fluctuates with the increasing conversion ratio of the water. With a decreased formation rate, viscosity tends to level off with the stabilized volume fraction of hydrates and the depletion of free water.
After formation, the equilibrium viscosity of hydrate slurry with AA-1 or AA-3 displayed higher sensitivity to an increase in the water cut than that with AA-2, which showed best compatibility for different temperatures and water cuts. It indicates that AA could effectively reduce the sensitivity of slurry viscosity to the volume fraction of hydrates, control agglomeration and prevent plugging in high water cut systems. After formation at 278.2 K and stirring with speed of 300 rpm for 12 h with an initial pressure of 6.0 MPa, the viscosity of annealed hydrate slurry with AA-2 demonstrated slightly increased the temperature sensitivity with higher water cuts and good temperature compatibility within the range of 274.2 K to 278.2 K. It is supposed that the adhesion of active components in AA-2 to crystals and change in surface wettability of hydrates enable even the dispersion of small hydrate crystals in oil.
In conclusion, this work implies that AA could notably affect the sensitivity of hydrate slurry viscosity to the volume fraction of hydrates and temperature. With respect to the anti-agglomeration mechanism of AA, further research should focus on the influences of AA on interfacial and the microscopic agglomeration behaviors of hydrates.
Acknowledgments
The financial support received from National Natural Science Foundation of China (51576209, 51306208, 51274218, 51376195, 51534007, 51134006), National Science & Technology Major Project (No. 2016ZX05028-004-001) and Science Foundation of China University of Petroleum-Beijing (2462014YJRC006, 2462015YQ0404) is gratefully acknowledged.
Author Contributions
Qinglan Ma and Guangjin Chen conceived and designed the experiments; Yining Lv, Yintang Guan, Shudi Guo, Lanying Yang, Kai Guo, Wei Qin and Yubo Qiao performed the experiments; Qinglan Ma, Changyu Sun, Guangjin Chen and Jing Gong analyzed the data; Jing Gong and Bohui Shi contributed analysis tools; Yintang Guan, Shudi Guo and Qinglan Ma wrote the manuscript.
Conflicts of Interest
The authors declare no conflict of interest.
References
- Sloan, E.D. Fundamental principles and applications of natural gas hydrates. Nature 2003, 426, 353–363. [Google Scholar] [CrossRef] [PubMed]
- Sum, A.K.; Koh, C.A.; Sloan, E.D. Developing a comprehensive understanding and model of hydrate in multiphase flow: From laboratory measurements to field applications. Energy Fuels 2012, 26, 4046–4052. [Google Scholar] [CrossRef]
- Chen, J.; Sun, C.Y.; Peng, B.Z.; Liu, B.; Si, S.; Jia, M.L.; Mu, L.; Yan, K.L.; Chen, G.J. Screening and compounding of gas hydrate anti-agglomerants from commercial additives through morphology observation. Energy Fuels 2013, 27, 2488–2496. [Google Scholar] [CrossRef]
- Gao, S. Hydrate risk management at high watercuts with anti-agglomerant hydrate inhibitors. Energy Fuels 2009, 23, 2118–2121. [Google Scholar] [CrossRef]
- Huo, Z.; Freer, E.; Lamar, M.; Sannigrahi, B.; Knauss, D.; Sloan, E. Hydrate plug prevention by anti-agglomeration. Chem. Eng. Sci. 2001, 56, 4979–4991. [Google Scholar] [CrossRef]
- Kelland, M.A.; Svartås, T.M.; Andersen, L.D. Gas hydrate anti-agglomerant properties of polypropoxylates and some other demulsifiers. J. Petrol. Sci. Eng. 2009, 64, 1–10. [Google Scholar] [CrossRef]
- Shi, B.H.; Gong, J.; Sun, C.Y.; Zhao, J.K.; Ding, Y.; Chen, G.J. An inward and outward natural gas hydrates growth shell model considering intrinsic kinetics, mass and heat transfer. Chem. Eng. J. 2011, 171, 1308–1316. [Google Scholar] [CrossRef]
- Lv, X.; Shi, B.; Wang, Y.; Gong, J. Study on gas hydrate formation and hydrate slurry flow in a multiphase transportation system. Energy Fuels 2013, 27, 7294–7302. [Google Scholar] [CrossRef]
- Camargo, R.; Palermo, T.; Sinquin, A.; Glenat, P. Rheological characterization of hydrate suspensions in oil dominated systems. Ann. N. Y. Acad. Sci. 2000, 912, 906–916. [Google Scholar] [CrossRef]
- Peng, B.Z.; Chen, J.; Sun, C.Y.; Dandekar, A.; Guo, S.H.; Liu, B.; Mu, L.; Yang, L.Y.; Li, W.Z.; Chen, G.J. Flow characteristics and morphology of hydrate slurry formed from (natural gas + diesel oil/condensate oil + water) system containing anti-agglomerant. Chem. Eng. Sci. 2012, 84, 333–344. [Google Scholar] [CrossRef]
- Yan, K.L.; Sun, C.Y.; Chen, J.; Chen, L.T.; Shen, D.J.; Liu, B.; Jia, M.L.; Niu, M.; Lv, Y.N.; Li, N. Flow characteristics and rheological properties of natural gas hydrate slurry in the presence of anti-agglomerant in a flow loop apparatus. Chem. Eng. Sci. 2014, 106, 99–108. [Google Scholar] [CrossRef]
- Moradpour, H.; Chapoy, A.; Tohidi, B. Bimodal model for predicting the emulsion-hydrate mixture viscosity in high water cut systems. Fuel 2011, 90, 3343–3351. [Google Scholar] [CrossRef]
- Webb, E.B.; Koh, C.A.; Liberatore, M.W. High pressure rheology of hydrate slurries formed from water-in-mineral oil emulsions. Ind. Eng. Chem. Res. 2014, 53, 6998–7007. [Google Scholar] [CrossRef]
- Webb, E.B.; Koh, C.A.; Liberatore, M.W. Rheological properties of methane hydrate slurries formed from aot + water + oil microemulsions. Langmuir 2013, 29, 10997–11004. [Google Scholar] [CrossRef] [PubMed]
- Webb, E.B.; Rensing, P.J.; Koh, C.A.; Sloan, E.D.; Sum, A.K.; Liberatore, M.W. High-pressure rheology of hydrate slurries formed from water-in-oil emulsions. Energy Fuels 2012, 26, 3504–3509. [Google Scholar] [CrossRef]
- Yan, K.L.; Guo, K.; Sun, C.Y.; Niu, S.S.; Liu, B.; Shen, D.J.; Chen, J.; Zhong, R.Q.; Chen, G.J.; Li, Q.P. Experimental and modeling studies on the viscosity of (diesel oil + water + anti-agglomerant) system at high pressures. Fluid Phase Equilib. 2014, 377, 9–15. [Google Scholar] [CrossRef]
- Farah, M.A.; Oliveira, R.C.; Caldas, J.N.; Rajagopal, K. Viscosity of water-in-oil emulsions: Variation with temperature and water volume fraction. J. Petrol. Sci. Eng. 2005, 48, 169–184. [Google Scholar] [CrossRef]
- Pal, R.; Rhodes, E. Viscosity/concentration relationships for emulsions. J. Rheol. 1989, 33, 1021–1045. [Google Scholar] [CrossRef]
- Richardson, E.G. Über die viskosität von emulsionen. Colloid Polym. Sci. 1933, 65, 32–37. [Google Scholar] [CrossRef]
- Broughton, G.; Squires, L. The viscosity of oil-water emulsions1. J. Phys. Chem. 1937, 42, 253–263. [Google Scholar] [CrossRef]
- Lv, Y.N.; Sun, C.Y.; Liu, B.; Chen, G.J.; Gong, J. A water droplet size distribution dependent modeling of hydrate formation in water/oil emulsion. AIChE J. 2017, 63, 1010–1023. [Google Scholar] [CrossRef]
- Aman, Z.M.; Joshi, S.E.; Sloan, E.D.; Sum, A.K.; Koh, C.A. Micromechanical cohesion force measurements to determine cyclopentane hydrate interfacial properties. J. Colloid Interface Sci. 2012, 376, 283–288. [Google Scholar] [CrossRef] [PubMed]
- Aman, Z.M.; Brown, E.P.; Sloan, E.D.; Sum, A.K.; Koh, C.A. Interfacial mechanisms governing cyclopentane clathrate hydrate adhesion/cohesion. Phys. Chem. Chem. Phys. 2011, 13, 19796–19806. [Google Scholar] [CrossRef] [PubMed]
- Balakin, B.V.; Alyaev, S.; Hoffmann, A.C.; Kosinski, P. Micromechanics of agglomeration forced by the capillary bridge: The restitution of momentum. AIChE J. 2013, 59, 4045–4057. [Google Scholar] [CrossRef]
- Camargo, R.; Palermo, T. Rheological properties of hydrate suspensions in an asphaltenic crude oil. In Proceedings of the 4th International Conference on Gas Hydrates, Yokohama, Japan, 19–23 May 2002. [Google Scholar]
- Nicholas, J.W.; Dieker, L.E.; Sloan, E.D.; Koh, C.A. Assessing the feasibility of hydrate deposition on pipeline walls—Adhesion force measurements of clathrate hydrate particles on carbon steel. J. Colloid Interface Sci. 2009, 331, 322–328. [Google Scholar] [CrossRef] [PubMed]
- Wang, X.Q.; Qin, H.B.; Ma, Q.L.; Sun, Z.F.; Yan, K.L.; Song, Z.Y.; Guo, K.; Liu, D.M.; Chen, G.J.; Sun, C.Y. Hydrate antiagglomeration performance for the active components extracted from a terrestrial plant fruit. Energy Fuels 2017, 31, 287–298. [Google Scholar] [CrossRef]
- Hoiland, S.; Askvik, K.M.; Fotland, P.; Alagic, E.; Barth, T.; Fadnes, F. Wettability of Freon hydrates in crude oil/brine emulsions. J. Colloid Interface Sci. 2005, 287, 217–225. [Google Scholar] [CrossRef] [PubMed]
- Aman, Z.M.; Koh, C.A. Interfacial phenomena in gas hydrate systems. Chem. Soc. Rev. 2016, 45, 1678–1690. [Google Scholar] [CrossRef] [PubMed]
- Chen, G.J.; Li, W.Z.; Li, Q.P.; Sun, C.Y.; Mu, L.; Chen, J.; Peng, B.Z.; Yang, Y.T.; Meng, H. A Saponin Plant-Extract Hydrate Anti-Agglomerant. China Patent ZL201110096579.2, 16 July 2014. [Google Scholar]
- Chen, J.; Wang, Y.F.; Sun, C.Y.; Li, F.G.; Ren, N.; Jia, M.L.; Yan, K.L.; Lv, Y.N.; Liu, B.; Chen, G.J. Evaluation of gas hydrate anti-agglomerant based on laser measurement. Energy Fuels 2015, 29, 122–129. [Google Scholar] [CrossRef]
- Turner, D.J.; Miller, K.T.; Dendy Sloan, E. Methane hydrate formation and an inward growing shell model in water-in-oil dispersions. Chem. Eng. Sci. 2009, 64, 3996–4004. [Google Scholar] [CrossRef]
- Patel, N.C.; Teja, A.S. A new cubic equation of state for fluids and fluid mixtures. Chem. Eng. Sci. 1982, 37, 463–473. [Google Scholar] [CrossRef]
Figure 1.
Viscosity of (▽) diesel oil and water-in-oil emulsion with anti-agglomerant (AA)-1 for a water cut of (□) 10 vol %; (○) 20 vol %; (△) 30 vol %. Lines are provided to guide the eye.
Figure 1.
Viscosity of (▽) diesel oil and water-in-oil emulsion with anti-agglomerant (AA)-1 for a water cut of (□) 10 vol %; (○) 20 vol %; (△) 30 vol %. Lines are provided to guide the eye.
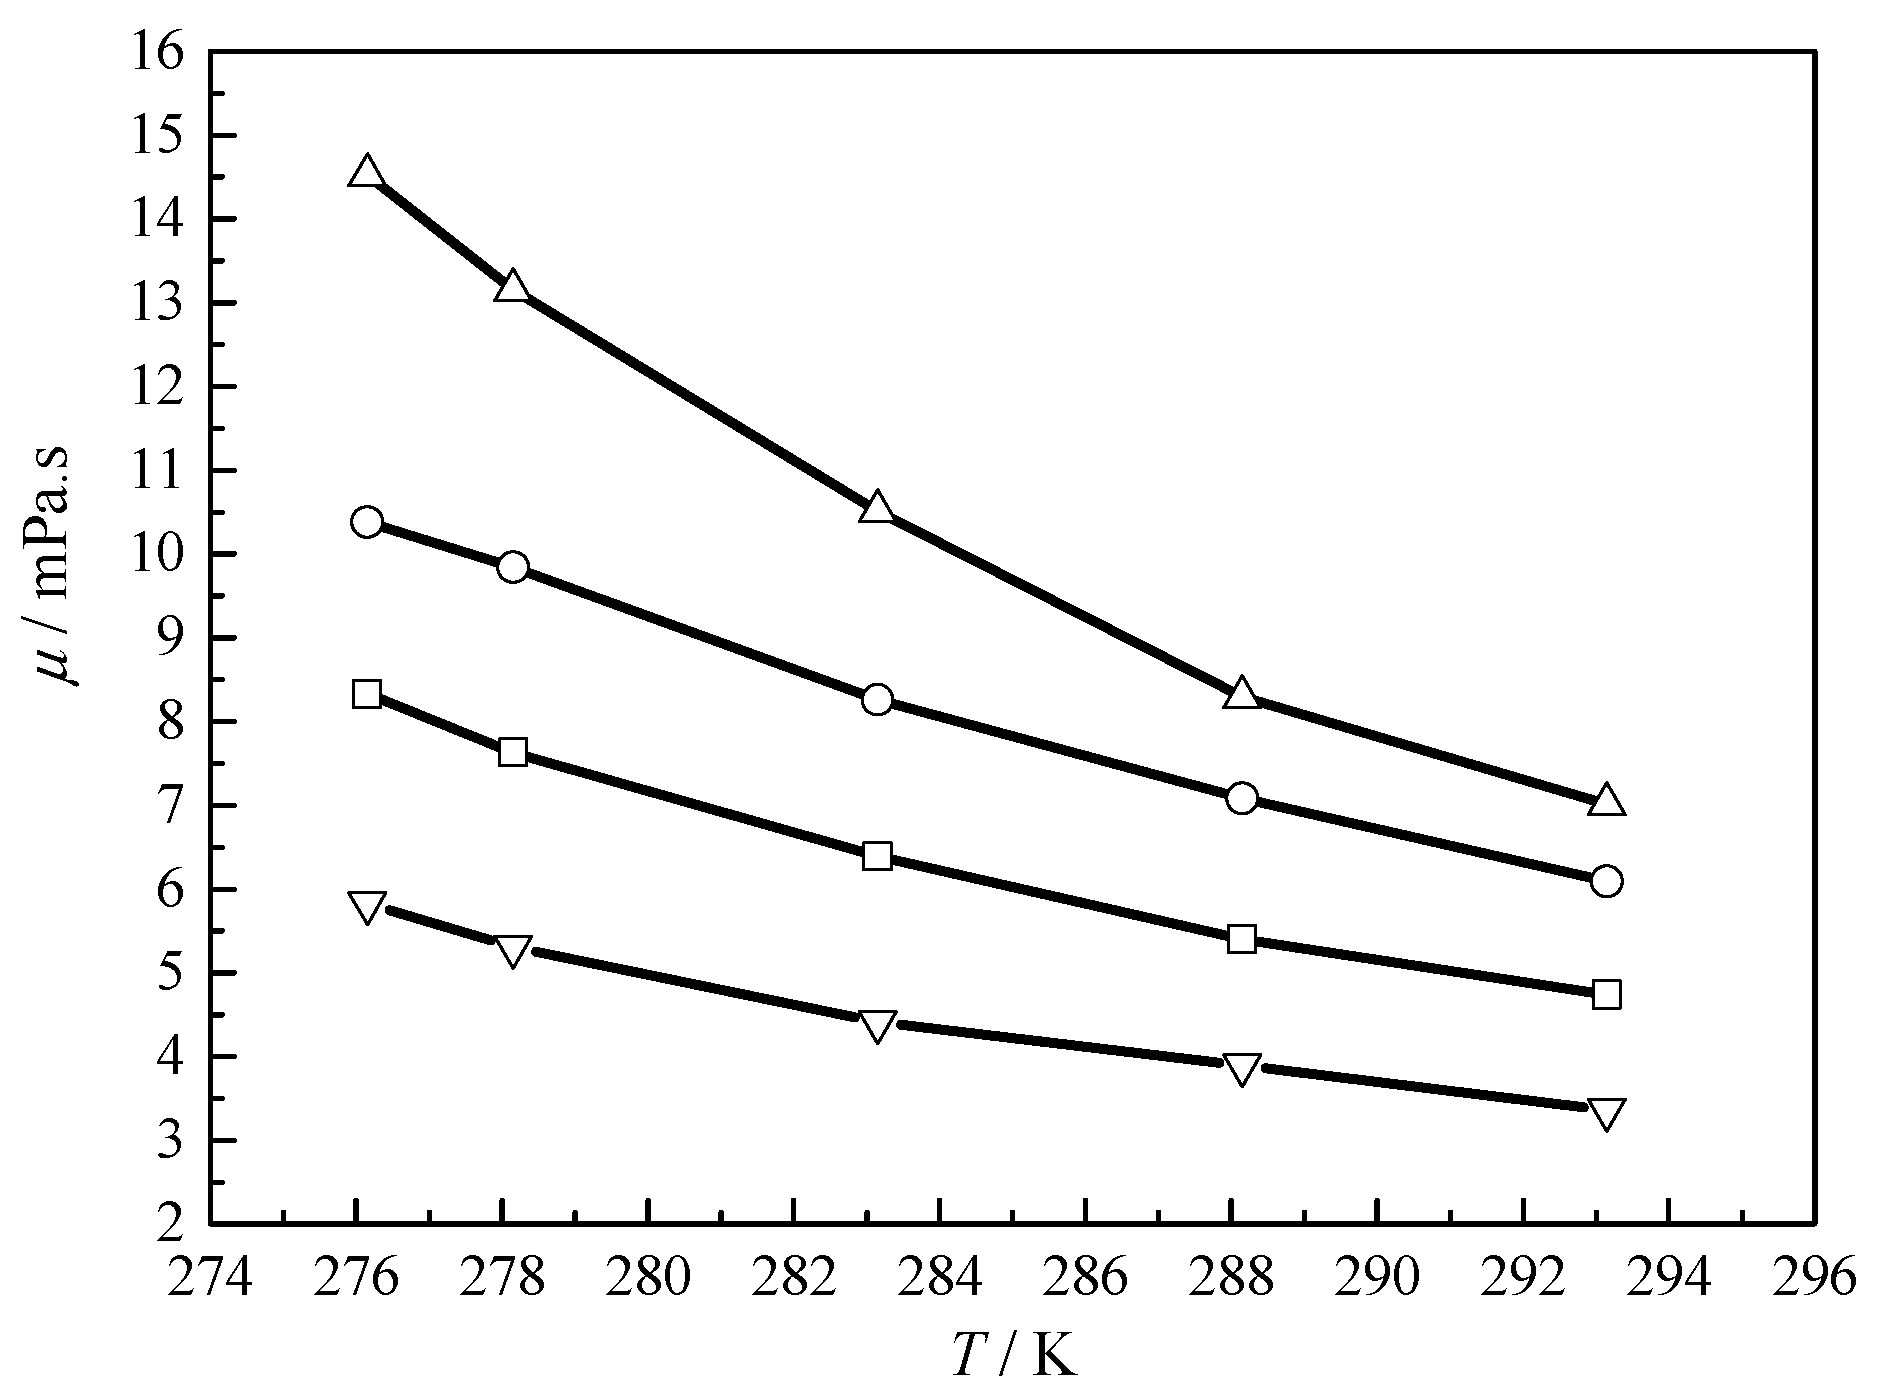
Figure 2.
Viscosity of (▽) diesel oil and water-in-oil emulsion with AA-2 for a water cut of (□) 10 vol %; (○) 20 vol %; (△) 30 vol %. Lines are provided to guide the eye.
Figure 2.
Viscosity of (▽) diesel oil and water-in-oil emulsion with AA-2 for a water cut of (□) 10 vol %; (○) 20 vol %; (△) 30 vol %. Lines are provided to guide the eye.
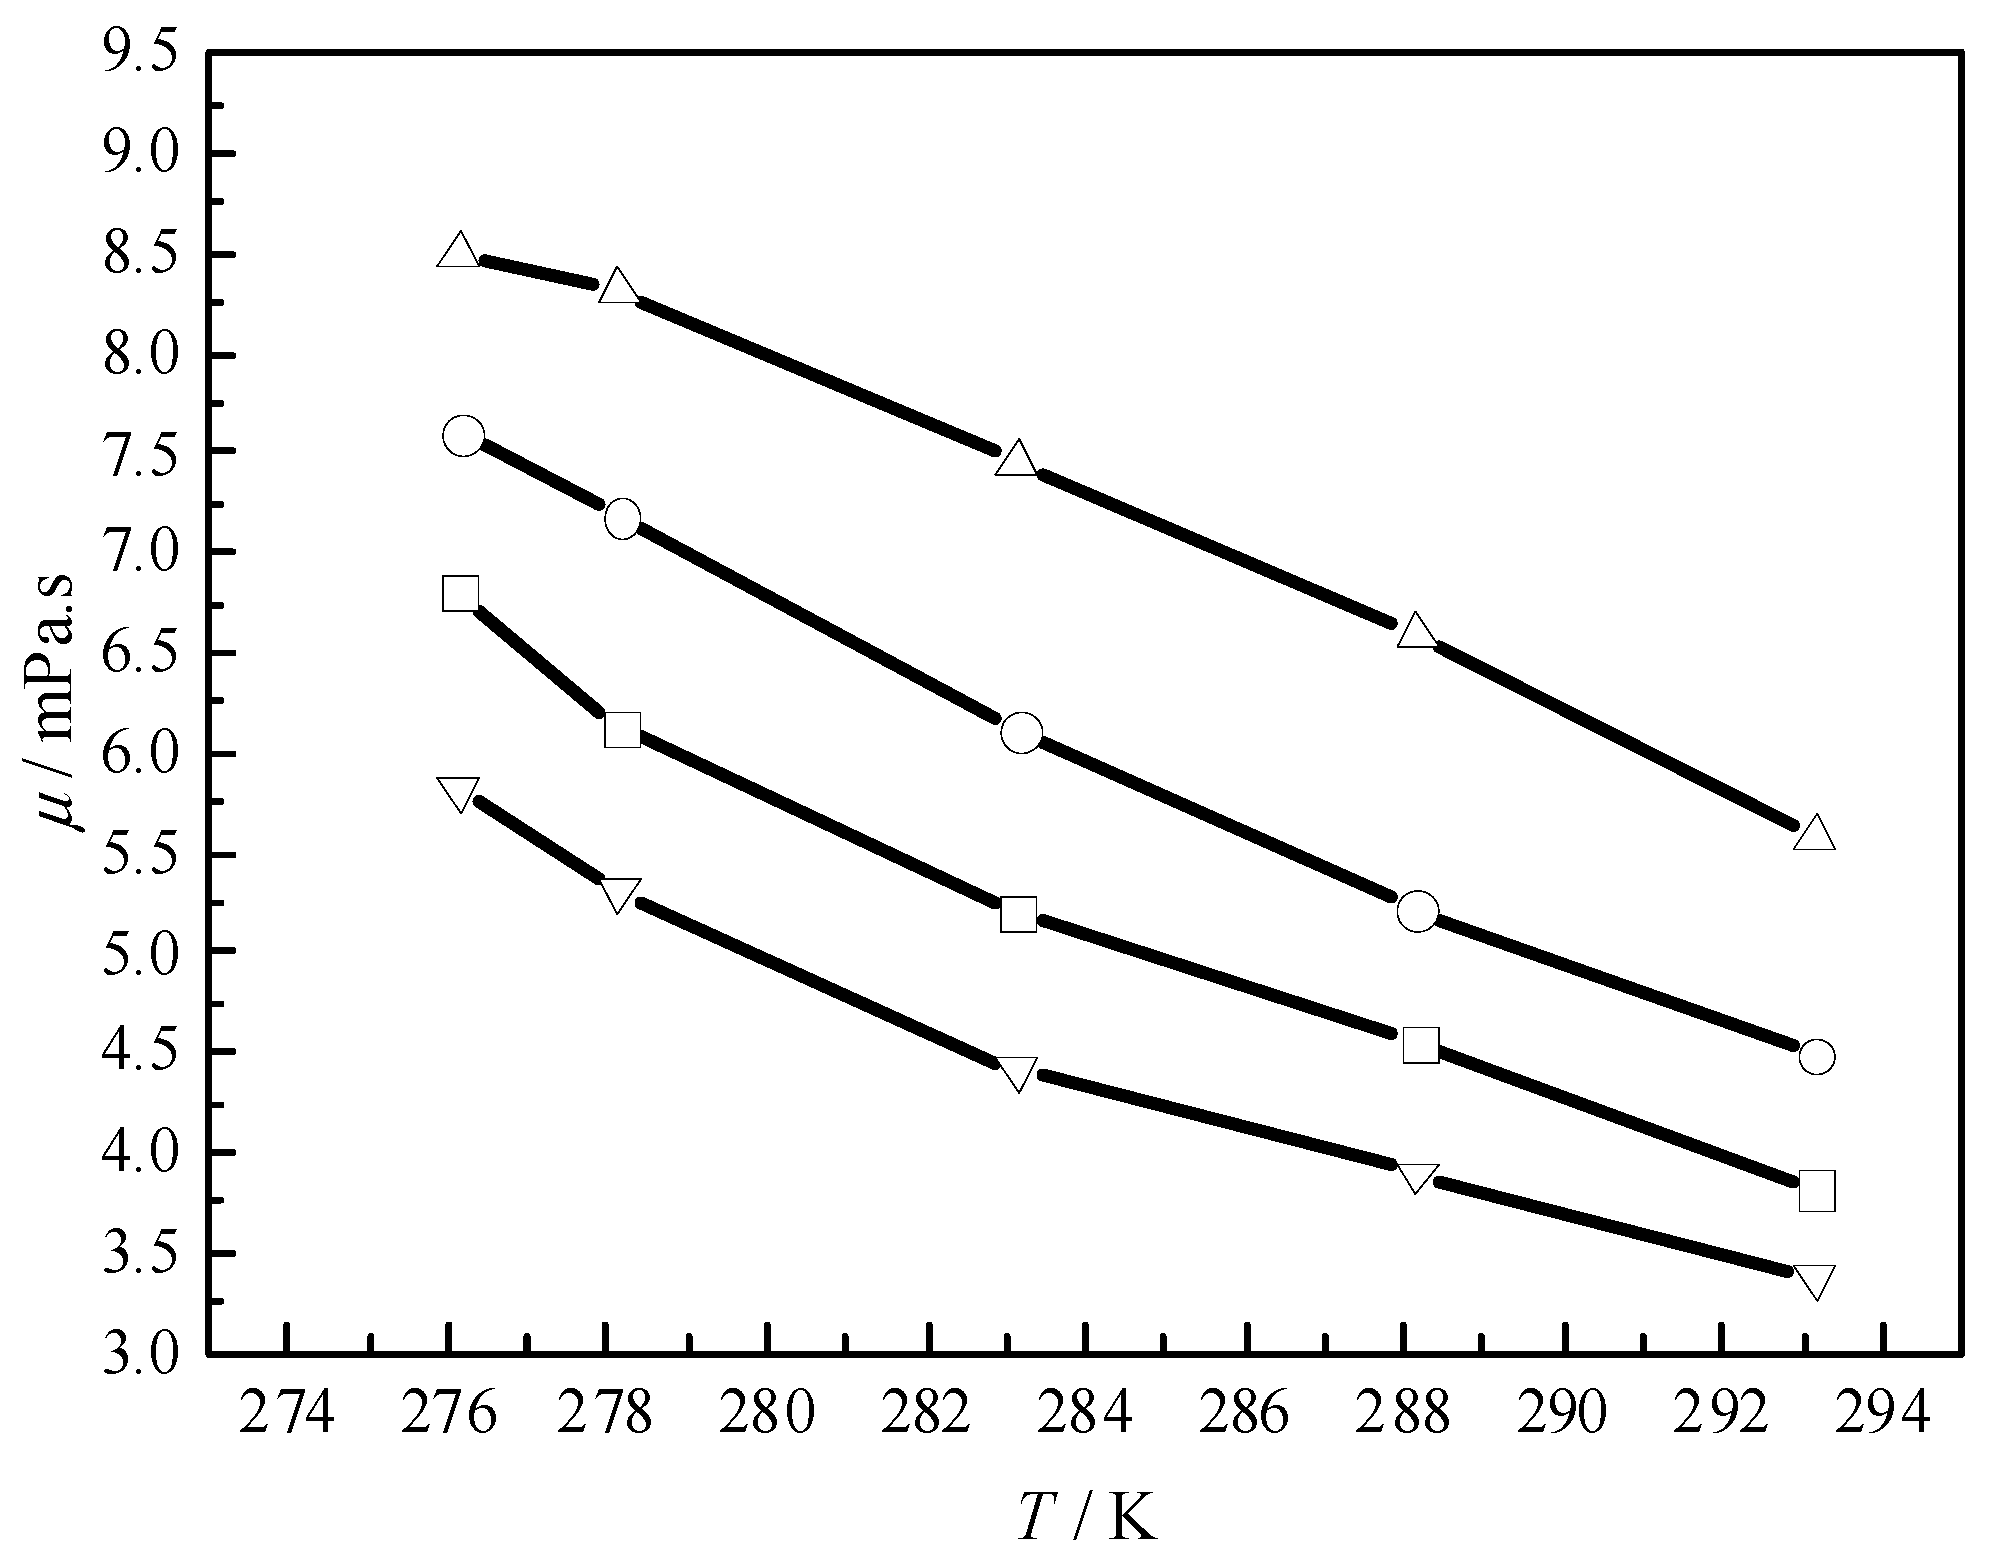
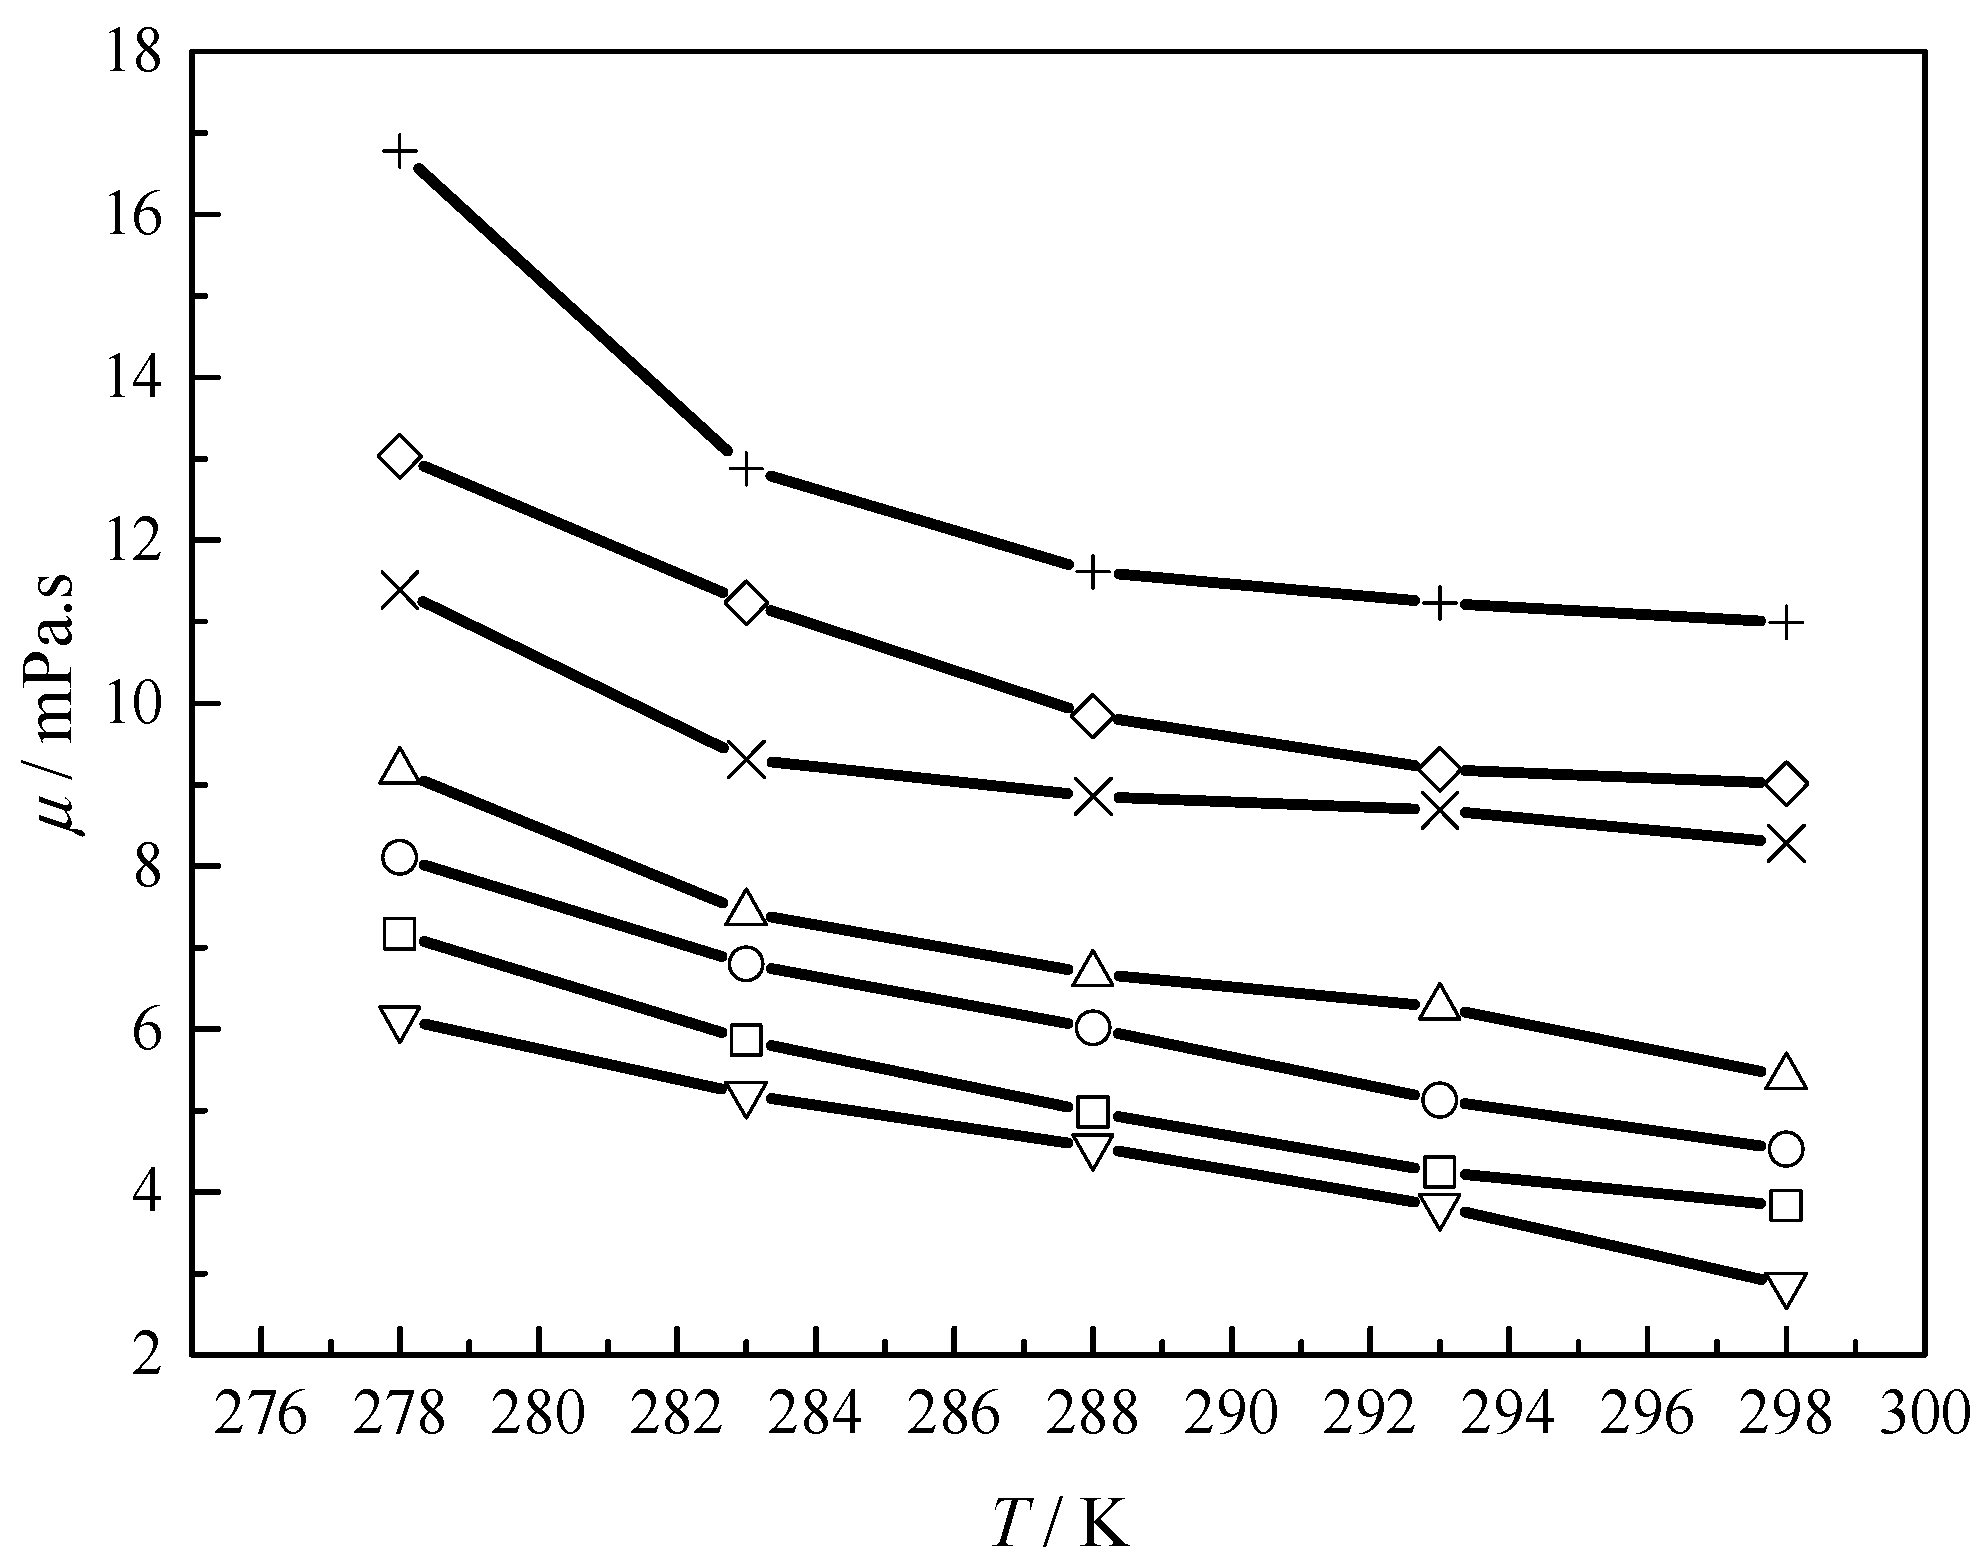
Figure 3.
Viscosity of (▽) diesel oil and water-in-oil emulsion with AA-3 for a water cut of (□) 5 vol %; (○) 10 vol %; (△) 15 vol %; (×) 20 vol %; (◊) 25%; (+) 30%. Lines are provided to guide the eye.
Figure 3.
Viscosity of (▽) diesel oil and water-in-oil emulsion with AA-3 for a water cut of (□) 5 vol %; (○) 10 vol %; (△) 15 vol %; (×) 20 vol %; (◊) 25%; (+) 30%. Lines are provided to guide the eye.
Figure 4.
Viscosity of (▽) diesel oil and water-in-oil emulsion with AA-4 for water cut of (□) 5 vol %; (○) 10 vol %; (△) 15 vol %. Lines are provided to guide the eye.
Figure 4.
Viscosity of (▽) diesel oil and water-in-oil emulsion with AA-4 for water cut of (□) 5 vol %; (○) 10 vol %; (△) 15 vol %. Lines are provided to guide the eye.
Figure 5.
Viscosity of (▽) diesel oil and water-in-oil emulsion with AA-5 for water cut of (□) 10 vol %; (○) 20 vol %; (△) 30 vol %. Lines are provided to guide the eye.
Figure 5.
Viscosity of (▽) diesel oil and water-in-oil emulsion with AA-5 for water cut of (□) 10 vol %; (○) 20 vol %; (△) 30 vol %. Lines are provided to guide the eye.
Figure 6.
Comparison between the experimental relative viscosity data and calculated values for emulsions with (□) AA-1; (△) AA-2; (○) AA-3; (×) AA-4; (+) AA-5.
Figure 6.
Comparison between the experimental relative viscosity data and calculated values for emulsions with (□) AA-1; (△) AA-2; (○) AA-3; (×) AA-4; (+) AA-5.
Figure 7.
Typical trend of (□) viscosity and (○) conversion ratio variations with time during hydrate formation at 278.2 K, with an initial pressure of 6.0 MPa and stirring speed of 300 rpm for 10% water cut system with AA-2. Lines are provided to guide the eye.
Figure 7.
Typical trend of (□) viscosity and (○) conversion ratio variations with time during hydrate formation at 278.2 K, with an initial pressure of 6.0 MPa and stirring speed of 300 rpm for 10% water cut system with AA-2. Lines are provided to guide the eye.
Figure 8.
Relative viscosities of slurries (equilibrium slurry viscosities divided by viscosity of gas-free water-in-oil emulsions with the same temperature and water cut) versus temperature for annealed hydrate slurry with AA-2 formed at 278.2 K with initial pressure of 6.0 MPa and stirring speed of 300 rpm and a water cut of (□) 5%; (○) 10%; (△) 15%; (▽) 20%; (◊) 25%. Lines are provided to guide the eye.
Figure 9.
Relative viscosities of hydrate slurries (equilibrium slurry viscosities divided by viscosity of gas-free water-in-oil emulsions with the same temperature and water cut) for (△) 276.2 K with AA-1-, (○) 276.2 K & (●) 278.2 K with AA-2- and (■) 278.2 K, with AA-3-contained systems with an initial pressure of 6.0 MPa, a stirring speed of 300 rpm and a water cut from 5% to 30%. Lines are provided to guide the eye.
Figure 10.
The molecular structure of esters polymer.
Figure 10.
The molecular structure of esters polymer.
Figure 11.
High-pressure hydrate slurry viscometer setup.
Figure 11.
High-pressure hydrate slurry viscometer setup.
Table 1.
Correlation equations and regressed parameters A and k for emulsions with different AAs.
Table 1.
Correlation equations and regressed parameters A and k for emulsions with different AAs.
| AA | Equation | Parameters |
|---|
| A | k |
|---|
| AA-1 | 4 | 1.00601 | 4.07919 |
| AA-2 | 4 | 0.97219 | 1.68698 |
| AA-3 | 4 | 1.07927 | 3.69215 |
| AA-4 | 4 | 1.16246 | 1.69291 |
| AA-5 | 4 | 1.1215 | 2.41917 |
Table 2.
Conversion ratios of water and volume fractions of different phases for equilibrium viscosities for annealed hydrate slurries with AA-2 formed at 278.2 K, with initial pressure of 6.0 MPa and stirring speed of 300 rpm and a water cut from 5% to 25% 1.
Table 2.
Conversion ratios of water and volume fractions of different phases for equilibrium viscosities for annealed hydrate slurries with AA-2 formed at 278.2 K, with initial pressure of 6.0 MPa and stirring speed of 300 rpm and a water cut from 5% to 25% 1.
| Water Cut | Temperature/K | Conversion/% | Hydrate/Vol % | Water/Vol % | Hydrate + Water/Vol % | Oil/Vol % |
|---|
| 5.0% | 278.2 | 71.1 | 4.5 | 1.4 | 5.9 | 94.1 |
| 277.2 | 74.6 | 4.7 | 1.3 | 6.0 | 94.1 |
| 276.2 | 75.3 | 4.7 | 1.2 | 5.9 | 94 |
| 275.2 | 78.3 | 4.9 | 1.1 | 6.0 | 94 |
| 274.2 | 79.3 | 5.0 | 1 | 6.0 | 94 |
| 10.0% | 278.2 | 61.3 | 7.7 | 3.8 | 11.5 | 88.5 |
| 277.2 | 69.5 | 8.7 | 3 | 11.7 | 88.3 |
| 276.2 | 74.4 | 9.3 | 2.5 | 11.8 | 88.2 |
| 275.2 | 78.4 | 9.8 | 2.1 | 11.9 | 88.1 |
| 274.2 | 80.3 | 10.0 | 1.9 | 11.9 | 88.1 |
| 15.0% | 278.2 | 46 | 8.6 | 7.9 | 16.5 | 83.4 |
| 277.2 | 52.7 | 9.8 | 6.9 | 16.7 | 83.2 |
| 276.2 | 58 | 10.8 | 6.2 | 17.0 | 83 |
| 275.2 | 62.9 | 11.7 | 5.4 | 17.1 | 82.9 |
| 274.2 | 67.5 | 12.5 | 4.8 | 17.3 | 82.7 |
| 20.0% | 278.2 | 24.6 | 6.2 | 14.9 | 21.1 | 78.9 |
| 277.2 | 27.7 | 6.9 | 14.2 | 21.1 | 78.8 |
| 276.2 | 31.3 | 7.8 | 13.5 | 21.3 | 78.7 |
| 275.2 | 33.7 | 8.4 | 13 | 21.4 | 78.6 |
| 274.2 | 39.3 | 9.8 | 11.9 | 21.7 | 78.3 |
| 25.0% | 278.2 | 18.8 | 5.9 | 20 | 25.9 | 74.1 |
| 277.2 | 22.4 | 7.0 | 19.1 | 26.1 | 73.9 |
| 276.2 | 26.6 | 8.3 | 18 | 26.3 | 73.7 |
| 275.2 | 33 | 10.2 | 16.4 | 26.6 | 73.4 |
| 274.2 | 40.6 | 12.5 | 14.5 | 27.0 | 73 |
Table 3.
Conversion ratios of water and volume fractions of different phases for equilibrium viscosities of hydrate slurries for AA-1 (formed at 276.2 K), AA-2 (formed at 276.2 K and at 278.2 K) and AA-3 (formed at 278.2 K) systems with an initial pressure of 6.0 MPa, stirring speed of 300 rpm for all systems and a water cut from 5% to 30% 1.
| System | Water Cut | Conversion Ratio | Hydrate/Vol % | Water/Vol % | Hydrate + Water/% | Oil/Vol % |
|---|
| AA-1 at 276.2 K | 10.0 | 35.6 | 4.5 | 6.4 | 10.9 | 89.1 |
| 20.0 | 24.1 | 6.0 | 15.0 | 21.0 | 79.0 |
| 30.0 | 14.6 | 5.5 | 25.3 | 30.8 | 69.2 |
| AA-2 at 276.2 K | 10.0 | 61.2 | 7.6 | 3.8 | 11.4 | 88.5 |
| 20.0 | 39.7 | 9.9 | 11.8 | 21.7 | 78.3 |
| 30.0 | 23.0 | 8.6 | 22.7 | 31.3 | 68.7 |
| AA-2 at 278.2 K | 5.0 | 71.1 | 4.5 | 1.4 | 5.9 | 94.1 |
| 10.0 | 61.3 | 7.7 | 3.8 | 11.5 | 88.5 |
| 15.0 | 46.0 | 8.6 | 8.0 | 16.6 | 83.4 |
| 20.0 | 24.6 | 6.2 | 14.9 | 21.1 | 79.0 |
| 25.0 | 18.8 | 5.9 | 20.0 | 25.9 | 74.1 |
| 30.0 | 21.0 | 7.9 | 23.3 | 31.2 | 68.8 |
| AA-3 at 278.2 K | 5.0 | 80.6 | 5.1 | 1.0 | 6.1 | 94.0 |
| 10.0 | 73.5 | 9.2 | 2.6 | 11.8 | 88.2 |
| 15.0 | 53.1 | 9.9 | 6.9 | 16.8 | 83.2 |
| 20.0 | 53.7 | 13.3 | 9.0 | 22.3 | 77.7 |
| 25.0 | 49.1 | 15.1 | 12.3 | 27.4 | 72.6 |
| 30.0 | 37.7 | 13.9 | 18.1 | 32.0 | 67.9 |
Table 4.
Composition of the Diesel Oil Used in This Work.
Table 4.
Composition of the Diesel Oil Used in This Work.
| Component | Mol % | Wt % |
|---|
| C7 | Heptanes | 0.219 | 0.100 |
| C8 | Octanes | 1.345 | 0.698 |
| C9 | Nonanes | 3.595 | 2.094 |
| C10 | Decanes | 3.703 | 2.393 |
| C11 | Undecanes | 5.899 | 4.187 |
| C12 | Dodecanes | 5.156 | 3.988 |
| C13 | Tridecanes | 8.336 | 6.979 |
| C14 | Tetradecanes | 13.612 | 12.263 |
| C15 | Pentadecanes | 11.370 | 10.967 |
| C16 | Hexadecanes | 10.084 | 10.369 |
| C17 | Heptadecanes | 9.587 | 10.469 |
| C18 | Octadecanes | 8.713 | 10.070 |
| C20 | Eicosanes | 11.422 | 14.656 |
| C24 | Tetracosanes | 6.807 | 10.469 |
| C28+ | Octacosanes plus | 0.152 | 0.298 |
| Total | 100.000 | 100.000 |
Table 5.
Specification of tested AAs.
Table 5.
Specification of tested AAs.
| AA No. | Composition (wt %) |
|---|
| Span 20 | Esters Polymer | Tetra-n-Butyl Ammonium Bromide (TBAB) | Benzimidazole | FJ-1 |
|---|
| AA-1 | 80 | 20 | | | |
| AA-2 | 33.3 | | | | 66.6 |
| AA-3 | 100 | | | | |
| AA-4 | 16.6 | | 83.3 | | |
| AA-5 | 13.3 | | | 86.7 | |
Table 6.
Composition of Natural Gas Used to Form Hydrates.
Table 6.
Composition of Natural Gas Used to Form Hydrates.
| Component | Mol % |
|---|
| N2 | 2.92 |
| CO2 | 1.47 |
| CH4 | 92.46 |
| C2H6 | 0.49 |
| C3H8 | 2.15 |
| i-C4H10 | 0.33 |
| n-C4H10 | 0.12 |
| i-C5H12 | 0.03 |
| n-C5H12 | 0.02 |
© 2017 by the authors. Licensee MDPI, Basel, Switzerland. This article is an open access article distributed under the terms and conditions of the Creative Commons Attribution (CC BY) license (http://creativecommons.org/licenses/by/4.0/).

 ,
, 


