Multi-Objective Optimization Considering Battery Degradation for a Multi-Mode Power-Split Electric Vehicle


National Engineering Laboratory for Automotive Electronic Control Technology, Shanghai Jiao Tong University, 800 Dongchuan Rd, Shanghai 200240, China
*
Author to whom correspondence should be addressed.
Energies 2017, 10(7), 975; https://doi.org/10.3390/en10070975
Submission received: 8 June 2017
/
Revised: 1 July 2017
/
Accepted: 9 July 2017
/
Published: 11 July 2017
(This article belongs to the Special Issue Energy Management, Control, and System Architectures for Electric Vehicle Applications)
Abstract
:A multi-mode power-split (MMPS) hybrid electric vehicle (HEV) has two planetary gearsets and clutches/grounds which results in several operation modes with enhanced electric drive capability and better fuel economy. Basically, the battery storage system is involved in different operation modes to satisfy the power demand and minimize the fuel consumption, whereas the complicated operation modes with frequent charging/discharging will absolutely influence the battery life because of degradation. In this paper, firstly, we introduce the solid electrolyte interface (SEI) film growth model based on the previous study of the battery degradation principles and was verified according to the test data. We consider both the fuel economy and battery degradation as a multi-objective problem for MMPS HEV by normalization with a weighting factor. An instantaneous optimization is implemented based on the equivalent fuel consumption concept. Then the control strategy is implemented on a simulation framework integrating the MMPS powertrain model and the SEI film growth map model over some typical driving cycles, such as New European Driving Cycle (NEDC) and Urban Dynamometer Driving Schedule (UDDS). Finally, the result demonstrates that these two objectives are conflicting and the trade-off reduces the battery degradation with fuel sacrifice. Additionally, the analysis reveals how the mode selection will reflect the battery degradation.
1. Introduction
Electrification is the trend in clean and efficient vehicle development [1]. Considering the battery cost and customers’ anxiety of driving mileage, hybrid electric vehicles are still the key technology from an industrial viewpoint. Power-split hybrid vehicles dominate the blooming hybrid electric vehicle market. The core of the power-split powertrain is the hybrid transmission of the planetary gearset which splits and couples the mechanical power from the engine and two electric machines. The configuration can take advantages of both series and parallel hybrid vehicles [2,3].
Two representative power-split hybrid vehicles are Toyota’s Prius and the Chevrolet Volt. The former uses an input-split configuration with single planetary gearset (PG) [4]. The latter uses an output-split configuration with a single PG, as well, whereas the Volt has three clutches and four operating modes [5]. Furthermore, GM released a new hybrid propulsion system on second-generation Volt and Cadillac CT6 sedans recently. The second-generation Volt reforms the hybrid transmission, which has been researched as a Multi-Mode Power-Split (MMPS) configuration with two planetary gearsets [6,7]. The CT6 adopts a more complicated transmission with three planetary gearsets which can satisfy the drivability requirement from the luxury sedan, benefitting from the abundant driving modes [8].
Despite of the number of planetary gearsets, the alternation of the connection between planetary gearsets with clutch/ground provides many propulsion schemes and there has been much concern on this topic [9,10]. Using two planetary gearsets, or more, can provide more operation modes when clutches are used [11,12]. Based on different configurations, performance, such as fuel economy, is more likely to be analyzed [11,12,13,14,15].
Motivated by the optimal goal of fuel economy, proposed methods include a wide range of numerical techniques. For the supervisory control strategy of HEVs, various methods have been studied and implemented [16]. Heuristic and empirical control methods cannot reveal the full potential on fuel economy. As a global optimization problem, dynamic programming (DP) can give the optimal solution over the whole time horizon with the knowledge of the driving cycle, however, the greatest shortcoming is the heavy computation load which increases exponentially with state variables [17]. Stochastic dynamic programming uses a Markov chain to represent the drive cycle distribution without the non-causality as deterministic dynamic programming [9]. The equivalent consumption minimization strategy (ECMS) is an instantaneous optimization which solves the instantaneous fuel cost at each time step, which is not equivalent to the global optimization problem, but is much easier to calculate achieving a nearly-global optimization [18,19]. These strategies are optimized for specific objectives, such as fuel consumption, emission, and drivability.
From the control viewpoint, the battery storage on board improves the fuel economy by acting the role providing an electrical path besides mechanical path, which increase the control degree of freedom of energy management strategy [20]. Through the electrical path, fuel consumption can be reduced by power flow optimization during driving and regenerative braking during deceleration. However, the frequent charging/discharging could harm the battery system and accelerate the degradation, especially serious over the long lifetime. Battery degradation mechanisms are still not as well-understood as their electrical behavior due to their complex, non-linear characteristics [21]. Promising electrochemical models have been proposed to predict battery degradation based on which power management has been implemented on plug-in hybrid electric vehicles [22] and fuel-cell plug-in hybrid vehicles [23].
Regardless of the technique, power management strategies considering battery degradation as an additional optimal goal is still uncommon. Especially the MMPS HEV can dominate the degree of electrification among the operation modes, e.g., parallel, power-split, electric driving. The effects of MMPS acting on the fuel economy and battery degradation deserves to be investigated.
Considering both fuel consumption and battery degradation as integral terms over time, we solve the multi-objective optimal problem by extending the equivalent fuel consumption.
The paper outline is as follows: In Section 2 we define the MMPS configuration and also the proposed battery degradation model. Section 3 presents the multi-objective optimization, which is implemented based on the ECMS concept with a normalization method. In Section 4 simulation results over NEDC and UDDS driving cycles are analyzed. Conclusions are drawn in the last section.
2. Multi-Mode Power Split (MMPS) Model
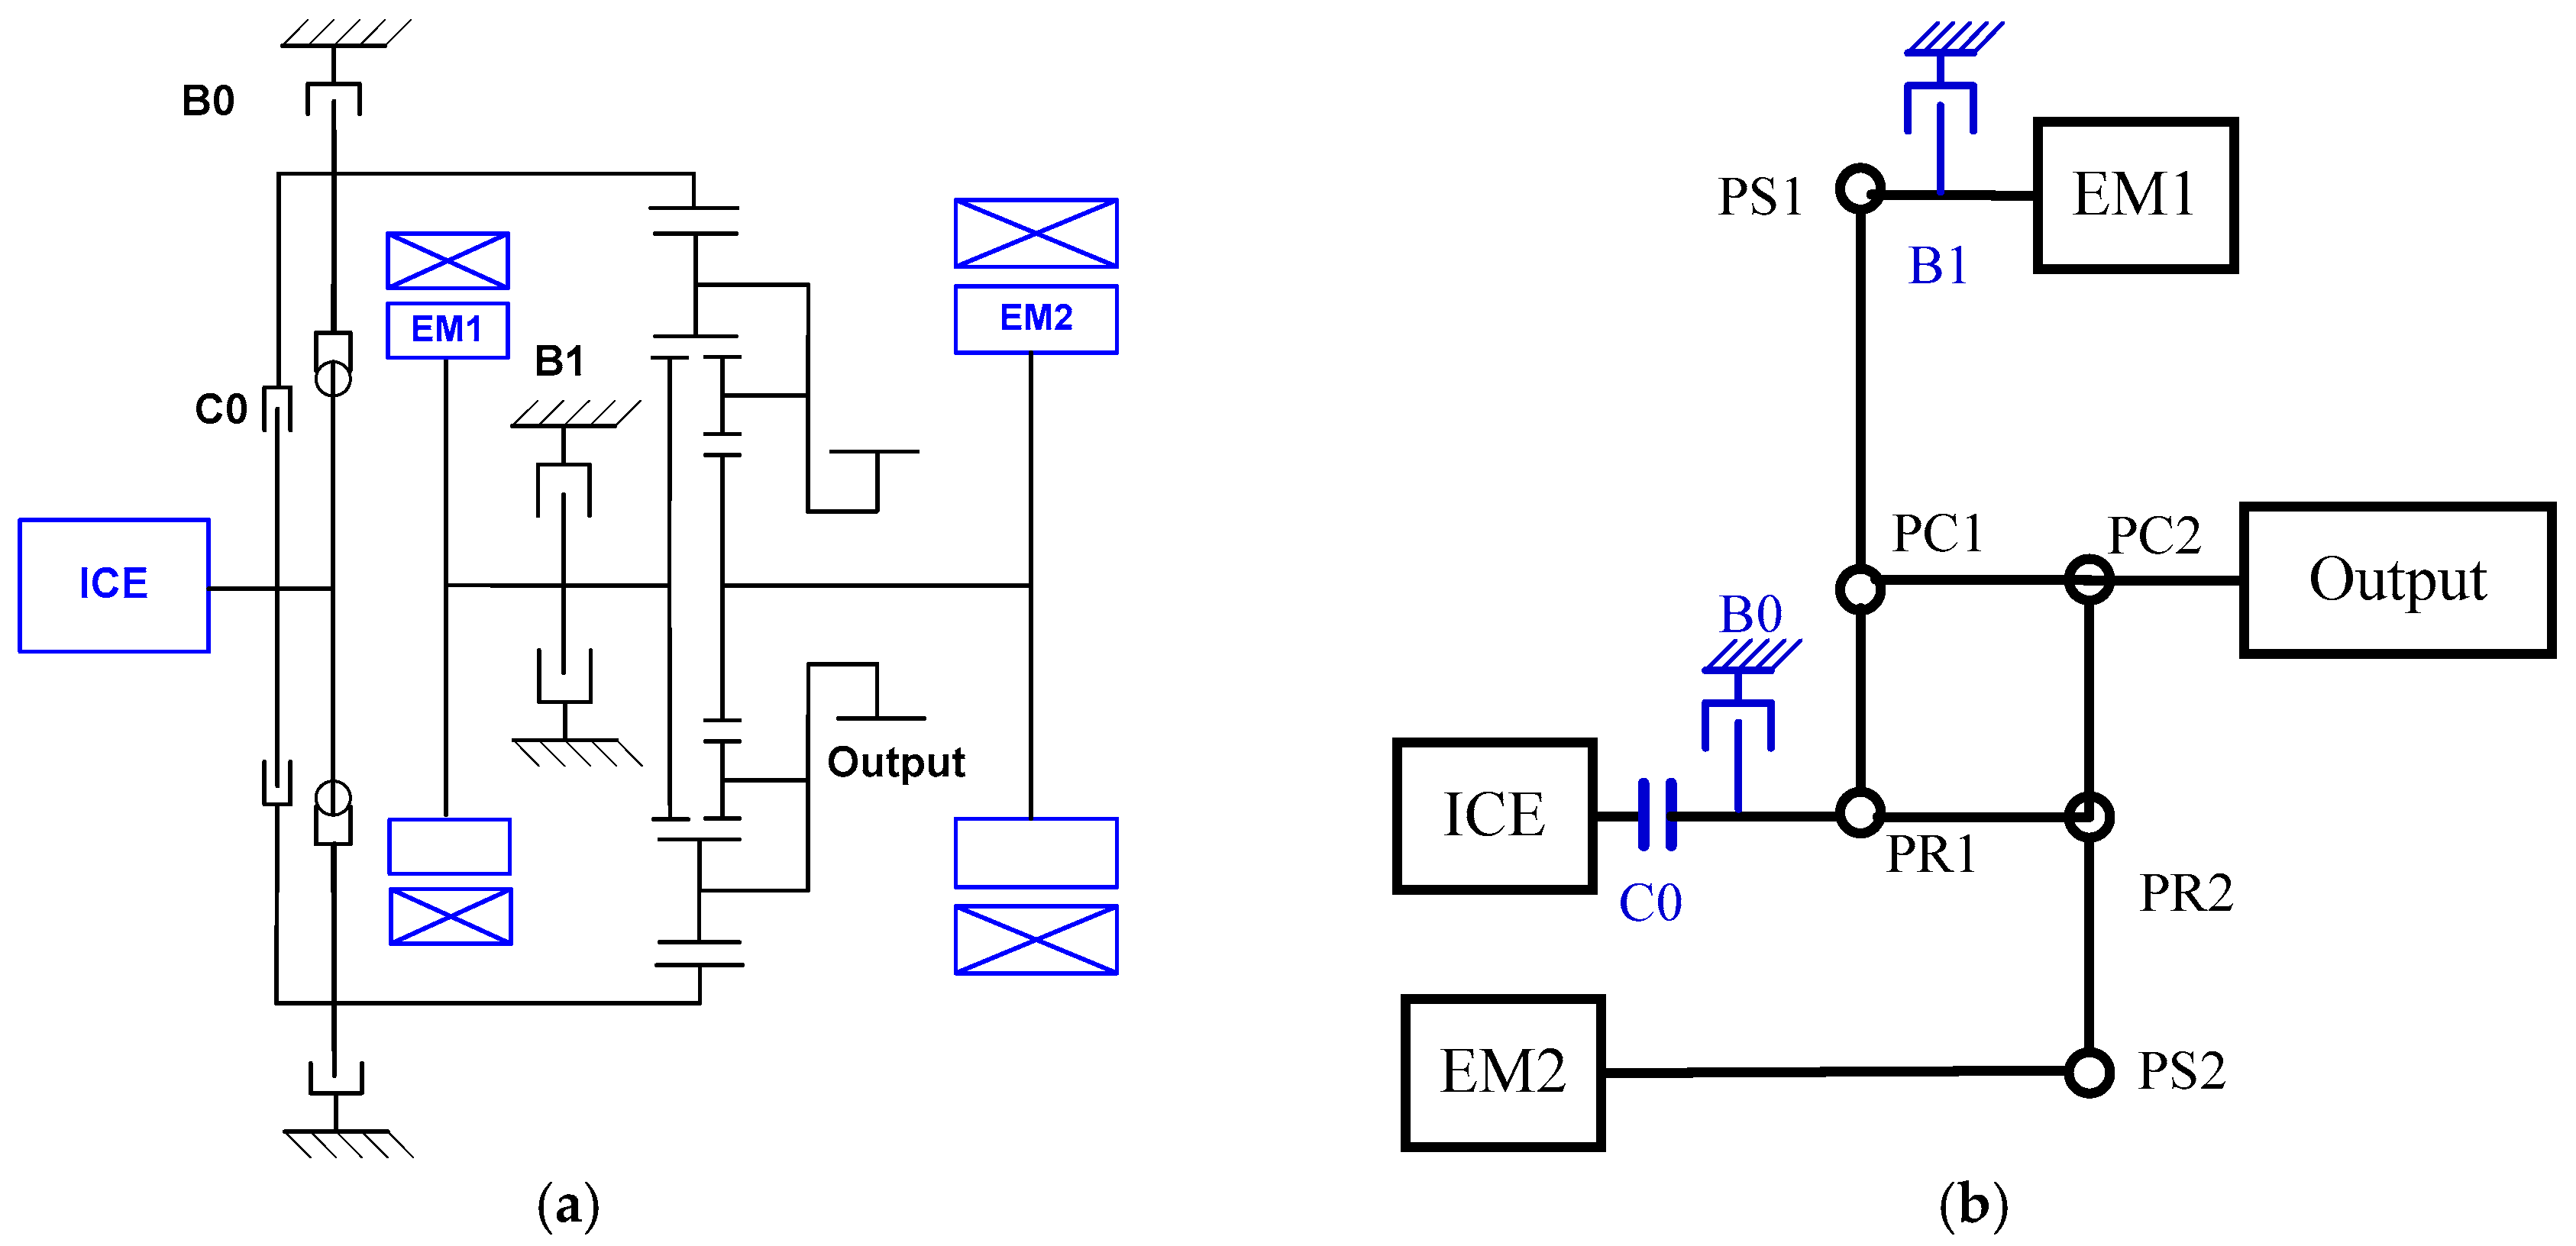
The 2-PG configuration implemented as the hybrid transmission couples the power from power elements, e.g., internal combustion engine (ICE), electric machines (EMs), to the output shaft (Output). Therefore, the possible design of the four-shaft E-CVT configuration is the permutation of the four nodes and the four elements (ICE, EM1, EM2, and Output) as much as . A typical design is picked that transforms the basic Ravigneaux configuration into a new four-shaft hybrid transmission working as a power-split device [24], as shown in Figure 1a.The simplified lever scheme is also shown in Figure 1b, where PS1 is the sun gear in the first planetary gearset (PG1) connecting with Electric Machine A(EMA) with a brake B1 that can lock up the rotation of these two components; PC1 is the carrier in the first planetary gearset (PG1) also sharing with the second planetary gearset (PG2) as PC2 and connected with the output shaft, PR1 is the ring gearset sharing with the second planetary gearset (PG2) as PR2 and also can be connected or locked with ICE via the clutch C0 or the brake B0, PS2 is the sun gear in the second planetary gearset (PG2) which is always connected with EMB.
Compared with the no clutch power-split design like the Prius with the Toyota Hybrid System (THS) which is a typical input-split configuration, the proposed MMPS is constituted of two planetary gearsets, one pair of clutch and brakes at the input node, and another brake at the node connecting with an electric machine. The components of planetary gearsets and clutch/brake are denoted as PG1, PG2, C0, B0, and B1. The ring gear, sun gear, and carrier are respectively denoted as PR, PS, and PC in the scheme.
As listed in Table 1, the combination of the clutch and brakes enables the MMPS with four feasible modes, two of which are hybrid modes and the other two are electric drive modes also regenerative braking modes. Benefiting from the pair of clutch/brake denoted as C0/B0, the novel MMPS enhances the electric drive capability. Otherwise, B1 makes the powertrain switches between the parallel mode and the compound split mode, which are two representative hybrid modes.
2.1. Kinetic Analysis and Equations of Powertrain System
2.1.1. State-Space Equations of MMPS
The state-space representation for dynamics of 2-PG powertrain in [9] is adopt to derive the Equations describing the multi-mode configuration. The state-space equations are also the theory of the powertrain model, whose dynamics associated with energy management in Section 3 are of a relatively low-bandwidth nature. The transient dynamics of clutches and engine are ignored in this paper due to the high-bandwidth characteristic which is always taken into consideration in drivability problems, but not quasi-steady simulation [25]. Additionally, the gear and shaft losses are ignored here. The state-space equations of MMPS are listed as (1)–(4). Equations (1)–(3) describe the dynamics of the power-split mode, parallel mode and dual-EV mode, where is the mass of the vehicle, is the radius of the tire, and is the final drive ratio. , and , , and , , and are the inertia , speed, and torques of the engine, the first electric machine, and the second electric machine, respectively. is the speed of transmission output shaft. is the load imposed by the rolling resistance and aerodynamic drag during driving which is defined at the transmission output shaft. with subscript denotes the inertia of the nodes connected with power components, the subscripts indicate the sun gear , the ring gear, and the carrier, and the subscripts 1 and 2 indicate PG1 and PG2. Similarly, are the radius of the ring gear and sun gear in PG1 and PG2. is the internal force between gear teeth in PG1 and PG2.
- (1)
- Power-split mode:
- (2)
- Parallel mode:
- (3)
- Dual-EM mode:
- (4)
- Single EM mode:
Single EM is the particular case in the parallel mode or dual-EM mode when the ICE or EMA idles. Compared the ratio between output speed and EMB speed, the parallel mode can provide relatively larger torque while at low vehicle speed, which is proper for the single EM condition. Therefore, here we assume that the ratio between the output shaft and EMB in the Single EM mode is the same as in the parallel mode.
2.1.2. Power Capability of MMPS
The method of lever diagram [26] directly gives the basic relationship and equations of the torque and speed among the lever nodes, by which we can get the maximum torque and power versus vehicle speed for each mode, within the limits of power components’ torque and power.
The maximum output torque and power for different modes are shown in Figure 2. Benefiting from the decouple characteristic of the power-split, the compound split mode can cover a wide vehicle speed range, while the parallel mode is limited by the engine maximum speed. However, in the parallel mode more torque can be output compared with the compound split mode at the same vehicle speed, which is powerful especially for climbing and accelerating. The dual-EM mode can be considered as the enhanced electric drive version of the single-EM mode.
The maximum power curves give out the direct impression about the powertrain power performance. Additionally, the maximum power for each mode is used as the hard constraints during the optimal control iteration.
2.1.3. Electric Subsystem
The electric subsystem containing two electric machines EMA and EMB. Their dynamics are ignored since their transient characteristics are much quicker than the typical time step of 1 s in power management problems. Nonetheless, the power loss for operating are accounted for in the static efficiency maps. The power equations for the electric subsystem are shown as:
where , , and are MGA, MGB, and the electrical transferring path efficiency, respectively.
2.2. Battery Model
2.2.1. Anode-Side SEI Growth Model of Battery Aging
The cell degradation mechanism of SEI layer growth has been detailed by Ramadass et al. [27].
The most common source of capacity fade is the loss of lithium to the Solid-Electrolyte-Interphase (SEI), which will typically form at the negative electrode during charging. Initially, SEI formation protects the electrode against solvent decomposition at large negative voltage, but over time it leads to a gradual capacity fade as the SEI layer thickens. In general, SEI growth results from irreversible electrochemical decomposition of the electrolyte, which competes with the desired Faradaic half-cell reaction at the electrode surface. For Li-ion batteries, SEI is formed at the negative electrode because typical electrolytes are not stable at the operating potential of this electrode during charging. The product of this decomposition forms a solid layer on the surface of the active material. During the SEI formation, the reaction is undertaken as:
where the solvent, the electron, and the lithium will be combined as SEI compounds, and intercalated in the active material.
The SEI film growth model is presented here [28]; for the negative electrode the local volumetric transfer current density is given by a sum of the intercalation current density and the side reaction current density :
where is computed via the Butler–Volmer electrochemical kinetic expression:
which is driven by the over-potential:
where i0,n is the exchange current density and is the equilibrium potential which is evaluated as a function of the solid phase concentration at the surface of the particle.
The kinetics of the side reaction are described using a Tafel equation, which assume that the side reaction is considered irreversible:
and the side reaction over-potential is described as:
Once the side reaction current, has been calculated, the change in the film thickness during charging can be calculated by:
where is the average molecular weight of the constituent compounds of the SEI layer and is the average density of the constituent compounds. This allows the overall film resistance to be calculated as:
where is the initial film resistance that is produced during the formation period of the battery, and is the conductivity of the film.
In addition to the resistance change, there is a capacity loss caused by the side reaction current during charging, leading to capacity changing via the relationship:
To effect an optimal control strategy with the SEI film growth model, the model should be simplified to accelerate the speed of calculation. Here three additional assumptions are made to create a volume-averaged 0-D reduced-order model for calculating , , and Q:
- (1)
- The cell is always in a quasi-equilibrium state, allowing the exchange current density to be calculated from the cell SOC alone, neglecting local variations in electrolyte and solid surface concentration.
- (2)
- The intercalation current density and the side-reaction current densities are uniform over the anode. This allows us to state that the total reaction current density is related to the applied cell current by the following relationship:
- (3)
- The anodic and cathodic charge-transfer coefficients are equal ().
From the above assumptions, the incremental reduced-order model (ROM) equations could be deduced as:
According to the above equations, we can calculate the SEI film growth versus battery current and state of charge (SOC). The 3-D map is shown in Figure 3.
The steady map demonstrates how the SOC and the current affect the SEI film growth is represented as the absolute value of instananeous degradation rate with the unit as as mentioned in [28].
2.2.2. Equivalent Circuit Model
In this paper we utilize the most common also simple model of battery, the equivalent circuit model:
where is the resistance of the battery cell, is the battery power, is the open circuit voltage, and is the capacity of the battery. The current calculated from the battery model is used to find the anode-side growth discussed in Section 2.2.1.
3. Instantaneous Multi-Objective Optimization (MOO)
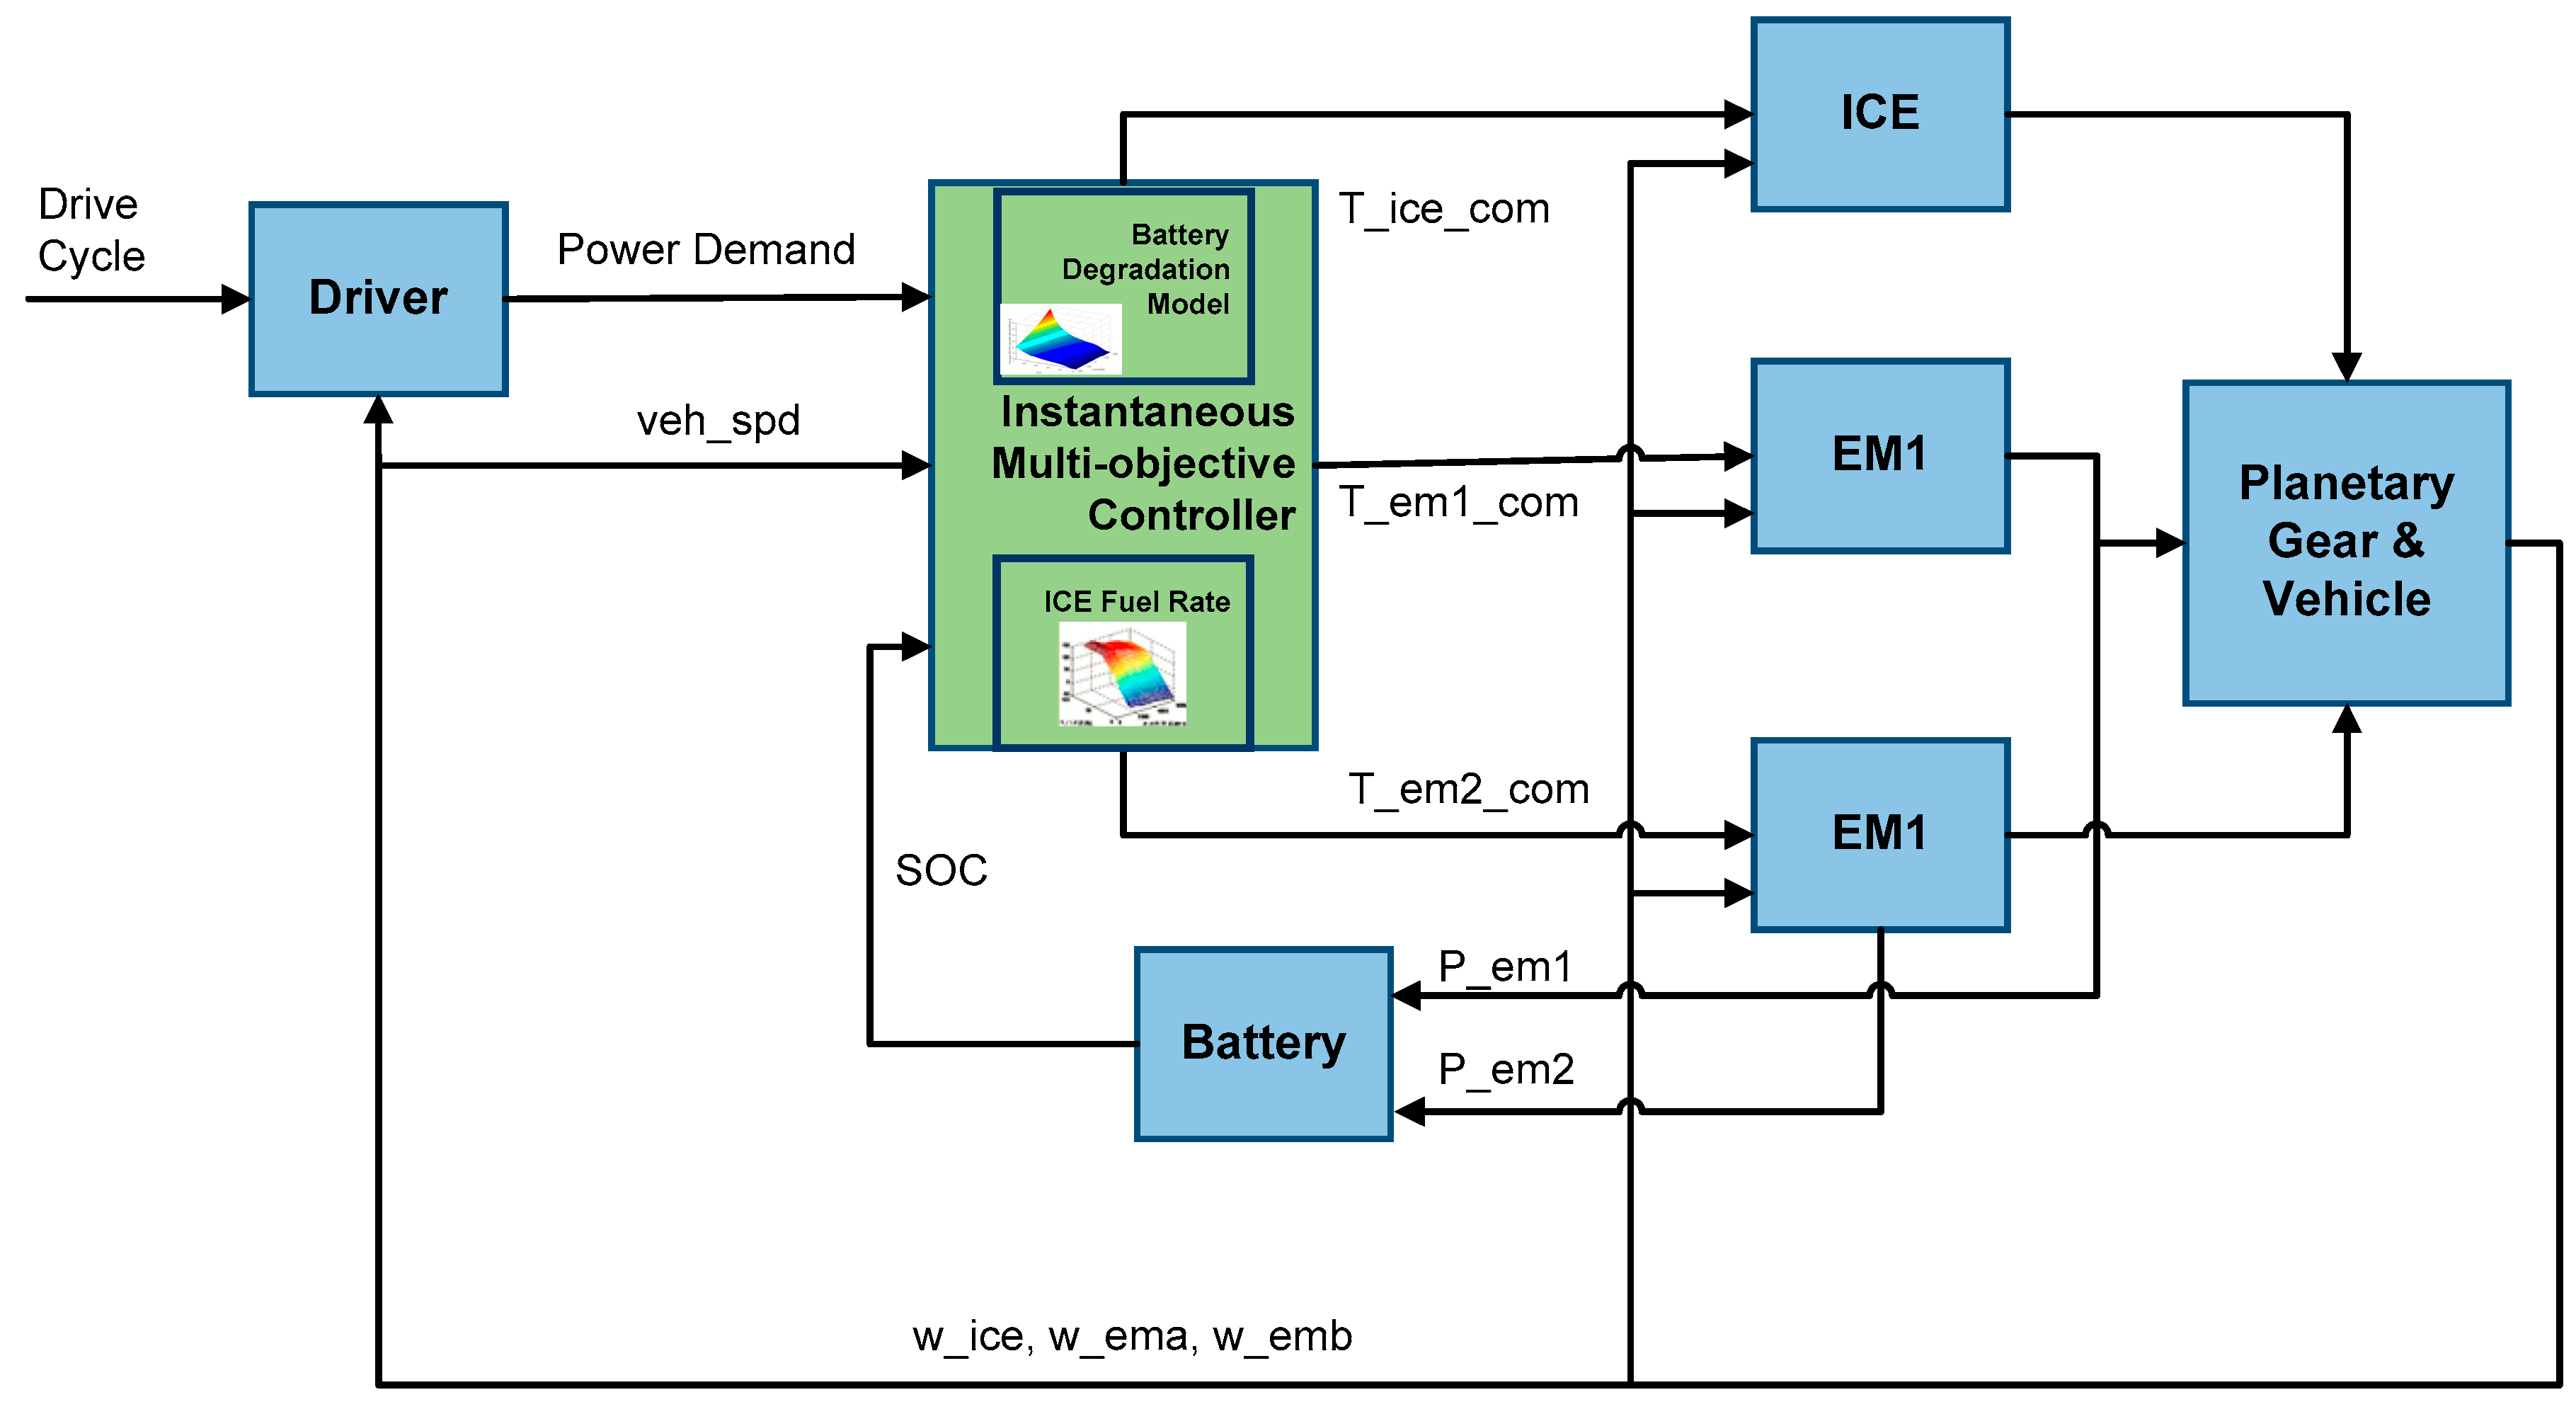
To integrate battery-health models with instantaneous optimal control, we build a control framework for the multi-objective power management strategy design as shown in Figure 4. It is based on an ECMS control concept. With the feedback of variables, such as battery current and SOC, the battery degradation can be estimated from a simplified battery aging model.
To synthesize the fuel consumption and battery-health degradation, which is a multi-objective optimal control problem, we combine both objectives into a scalar objective with a weighting factor α. The general mathematical formulation is as given as:
where the individual objective functions and are the normalized battery degradation term and equivalent fuel consumption term, respectively, and the state variable is indicated in the state space Equations (1)–(3) and Equations (19)–(21), e.g., in the power-split mode: and ; in the parallel mode: and ; in the dual-EM mode and ; and in the single-EM mode: and .
The equivalent fuel consumption has the same formulation as the instantaneous equation used in ECMS:
where the engine operating along the BSFC curve has a near-linear relationship between fuel consumption and engine power; SOC weighting factor can adapt along with the SOC derivation from the target value.
Equivalence factor has a physical meaning between electric power and engine fuel consumption conversion [18], when the battery discharges , the electric machines turn the electric power into mechanical power, which relieves the engine load with less engine fuel consumption.
In simplified form, is the combination factor of and , when the current is less than , encourages the powertrain to use the engine to recharge the battery; vice versa when higher than , encourages the powertrain to work as an EV to decrease fuel consumption. Thus, plays the role to regulate the SOC trajectory as a charge-sustaining progress.
The electric system contains electric machines, inverters, and battery. The power flows in the electric system is calculated as shown in Equation (4).
The battery degradation term is represented by the anode-side SEI film growth rate as Equation (11). Then the term of battery degradation in optimal objective can be calculated as:
The state constraints are given by:
The control variable constraints are given by:
Additionally, as both objectives have different meaning and number scale, they are normalized by scaling the range of their natural values to values between zero and one.
Based on the knowledge of the relationship between fuel consumption and battery degradation from previous global optimization [29], we pick the typical weighting factor denoted as a combined situation compared with denoted as a fuel-only situation.
The vehicle parameters are listed in Appendix A in Table A1.
4. Results and Analysis
Simulations have been run with respect to the framework shown in Figure 4, where the multi-objective controller calculates the solution iteratively through feasible operating points. The plant model includes the power components’ static characteristics, planetary gear sets’ kinetics, vehicle dynamics, and battery, which are also respectively validated in previous research work [22,24,30].
To evaluate the effect of the MOO control strategy, two solutions are obtained with factors and which, respectively, correspond to emphasizing fuel saving and a balance between consumption and battery aging.
Additionally, as the MMPS performance is related with driving demand, simulations are also implemented over two typical driving cycles, NEDC and UDDS, to investigate the impact optimization of battery degradation and fuel economy, comprehensively.
4.1. NEDC Driving Cycle
The simulation starts from initial SOC which equals to 0.6 and since the second successive NEDC cycle, the CS (charge-sustaining) strategies with two different weighting factors both sustain the SOC trajectory balanced at 0.66 over one single driving cycle. The concerned performance with balanced SOC is listed in Table 2.
Firstly, the performance indicated there exists conflict between the two optimal goals. The MOO controller reduces the SEI film growth by 4.3% with 1 L/100 km fuel increased during the CS stage.
Figure 5 shows the mode selection and SOC trajectory over the NEDC cycle where the actual vehicle speed can follow the desired vehicle speed.
Over one NEDC cycle both controllers ensure that SOC starts and ends at the same point, while the mode selection is different especially during the first low-speed stage. Compared with the strategy considering only the fuel economy, the multi-objective method prefers the enhanced EV mode with two electric machines which leads to lower SOC trajectory. On the other hand, to maintain charge-sustaining (CS) during the following low-speed stages, the compound split mode is employed as a supplement to the dual-EM mode, while the former control strategy only adopts the parallel mode during the low-speed stage, and regenerative braking energy helps to sustain the SOC trajectory.
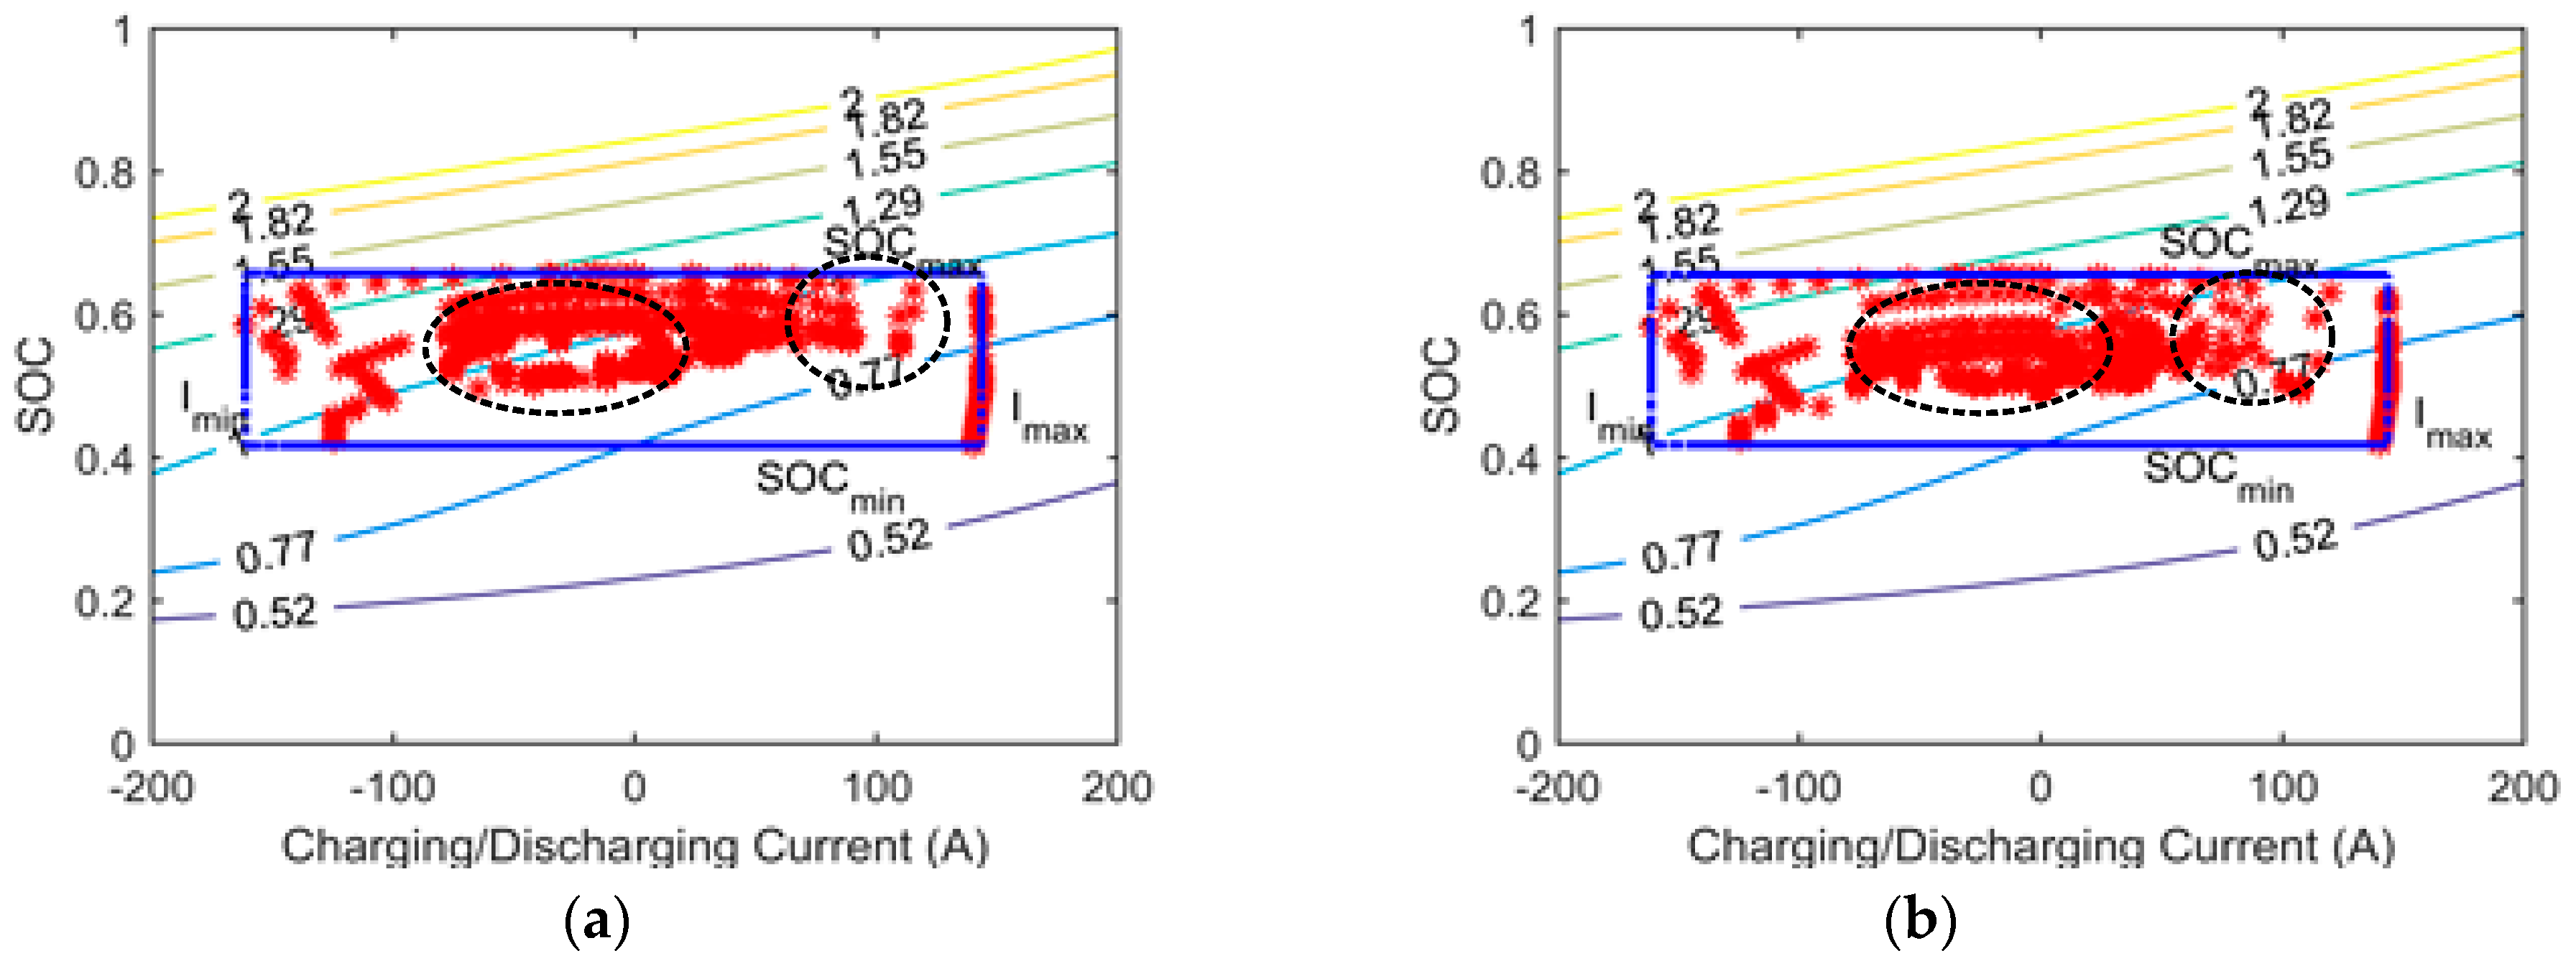
To investigate how the SOC trajectory affects the battery degradation, the distributions of two different controllers are shown in Figure 6, where the rectangle is the boundary of SOC and current. The contour proves the SEI film growth rate is very sensitive to SOC compared with the equivalent fuel consumption, because the Li-ion battery has nearly constant open-circuit voltage with respect to SOC in the allowable SOC range. Thus, multi-objective optimization intends to keep the SOC variates in a lower interval as shown in the circled area.
4.2. UDDS Driving Cycle
As another typical and urban driving cycle, UDDS cycle contains more dynamic speed variation. The multi-objective-optimization also runs over the UDDS cycle and the conventional optimization considering only the fuel economy. The balanced SOC for single-objective and multi-objective simulations are, respectively, 0.56 and 0.54, and the fuel consumption and battery degradation terms are listed below in Table 3.
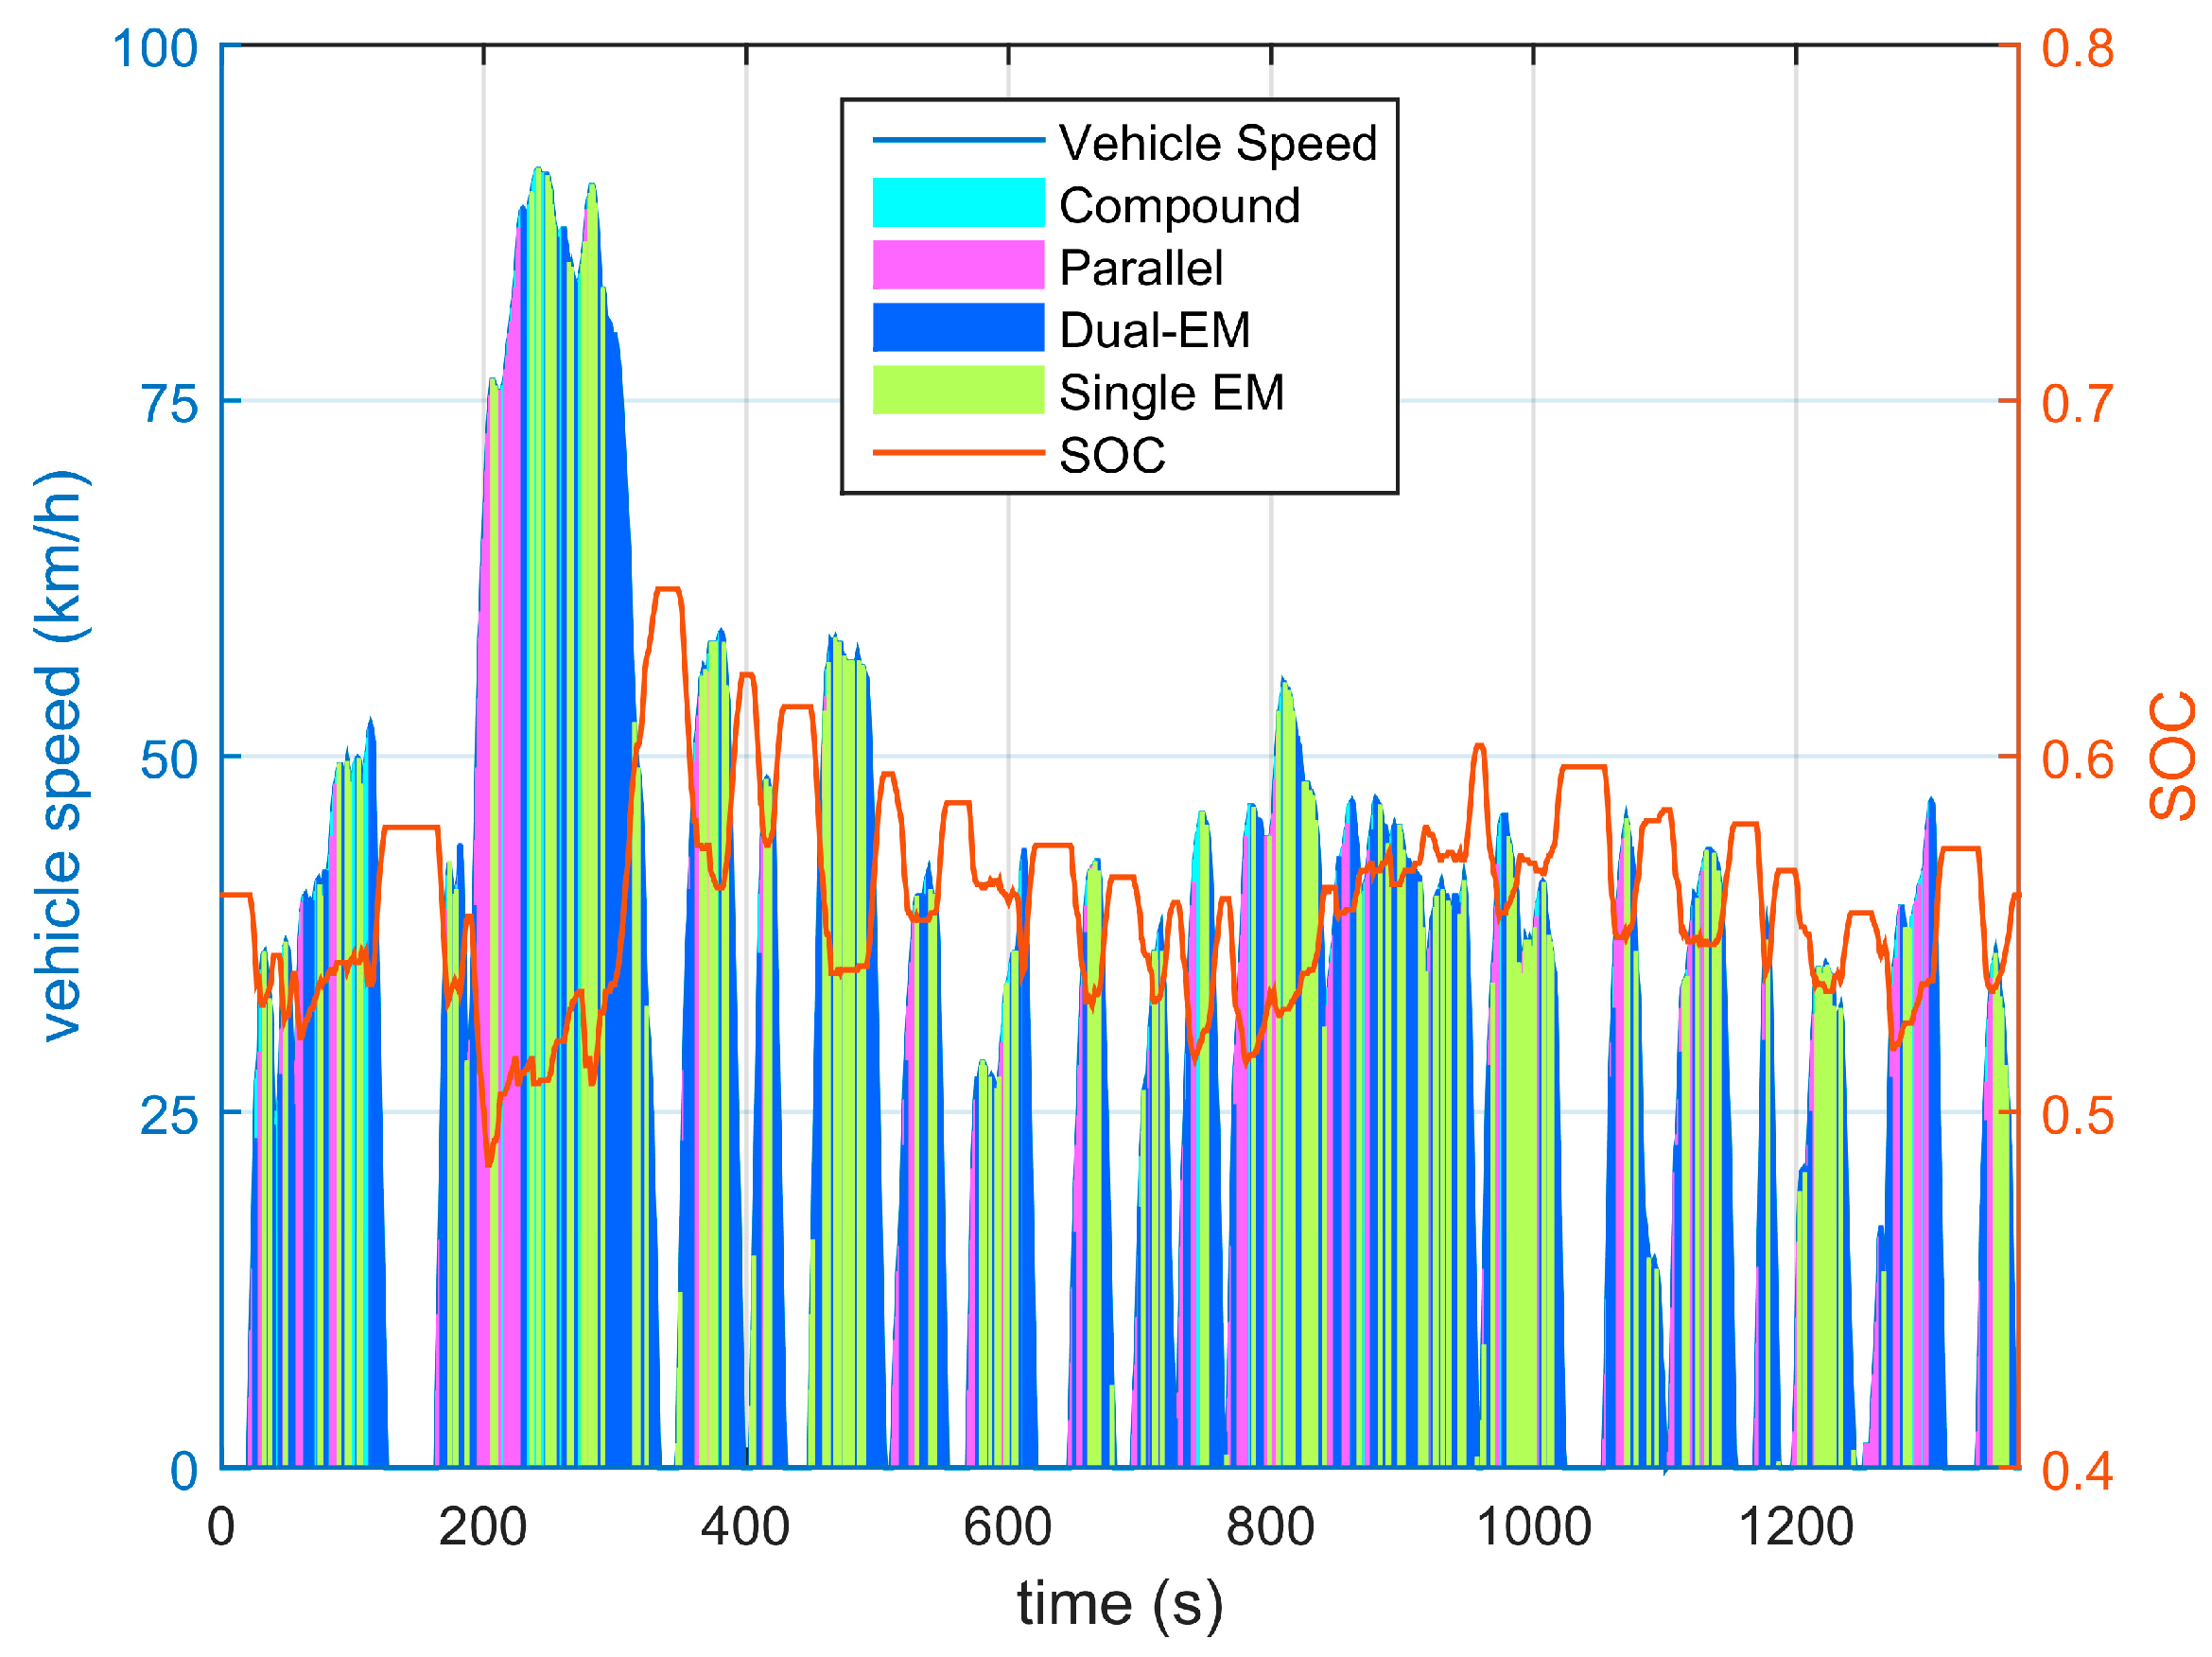
The conflict between the fuel minimization and battery ageing is also obvious from the simulation results. Compared with NEDC cycle, both fuel consumption and battery degradation deteriorate over the UDDS cycle due to the intense power demand and vehicle speed fluctuation, which are shown in Figure 7 and Figure 8.
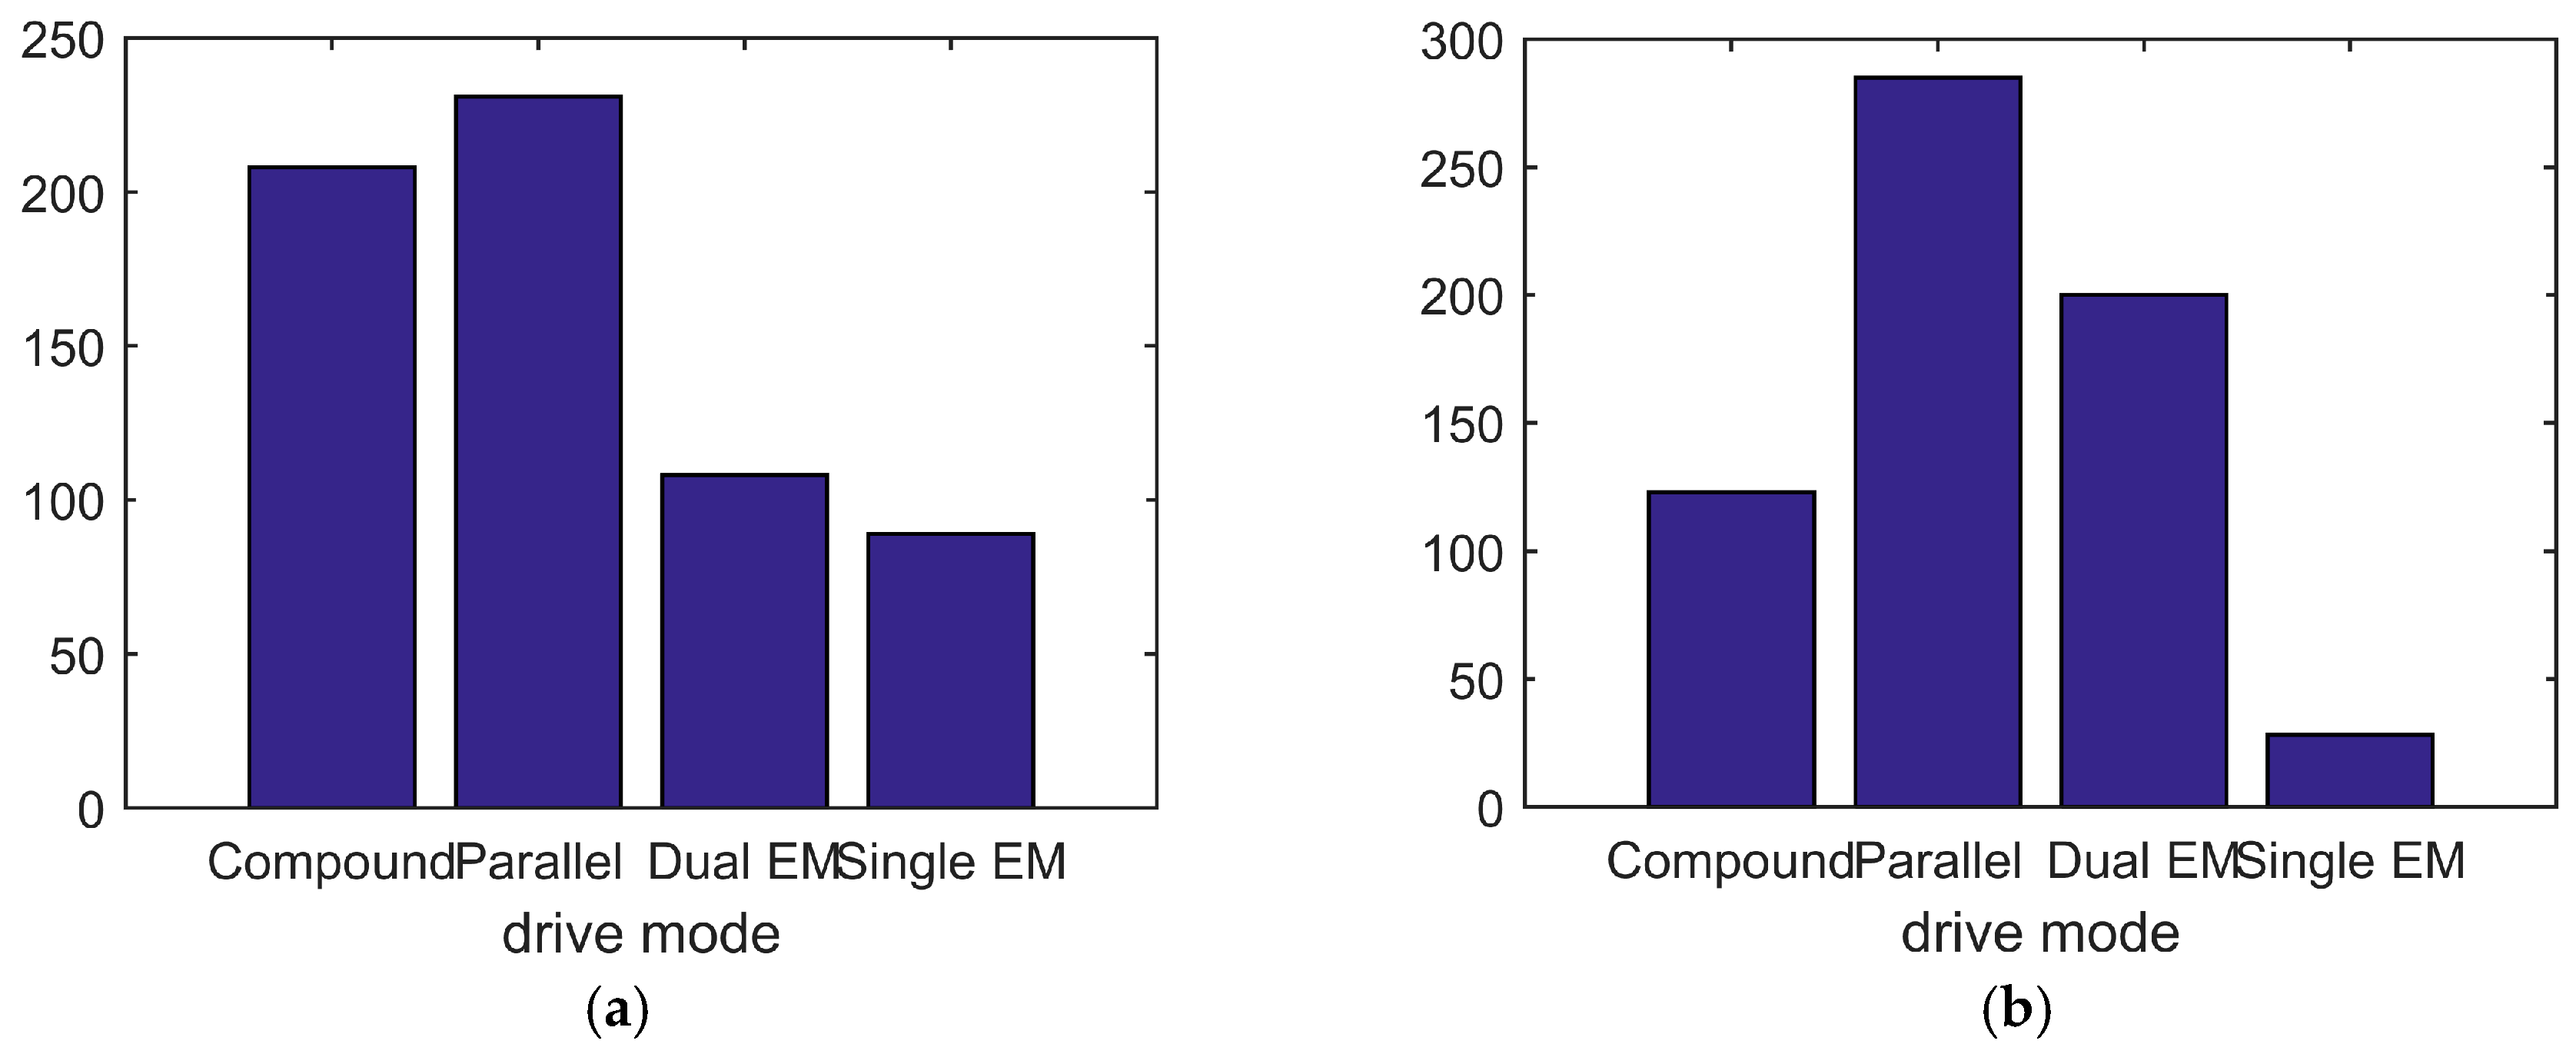
Figure 7 and Figure 8 demonstrate the mode switch. The multi-objective optimization intends to keep the SOC trajectory in a lower level than the single optimization. Therefore, more electric driving modes are selected within the available speed and SOC range. While the SOC acutely drops, the parallel mode is called and provides power from the engine. The statistics of mode selection are shown in Figure 9.
The enhanced electric drivability of the MMPS is significant in the latter optimization which can be directly seen from the mode preference in Figure 9b compared with Figure 9a. Additionally, parallel mode substitutes some of the compound split mode as the dual-EM mode substitutes more of the single EM mode.
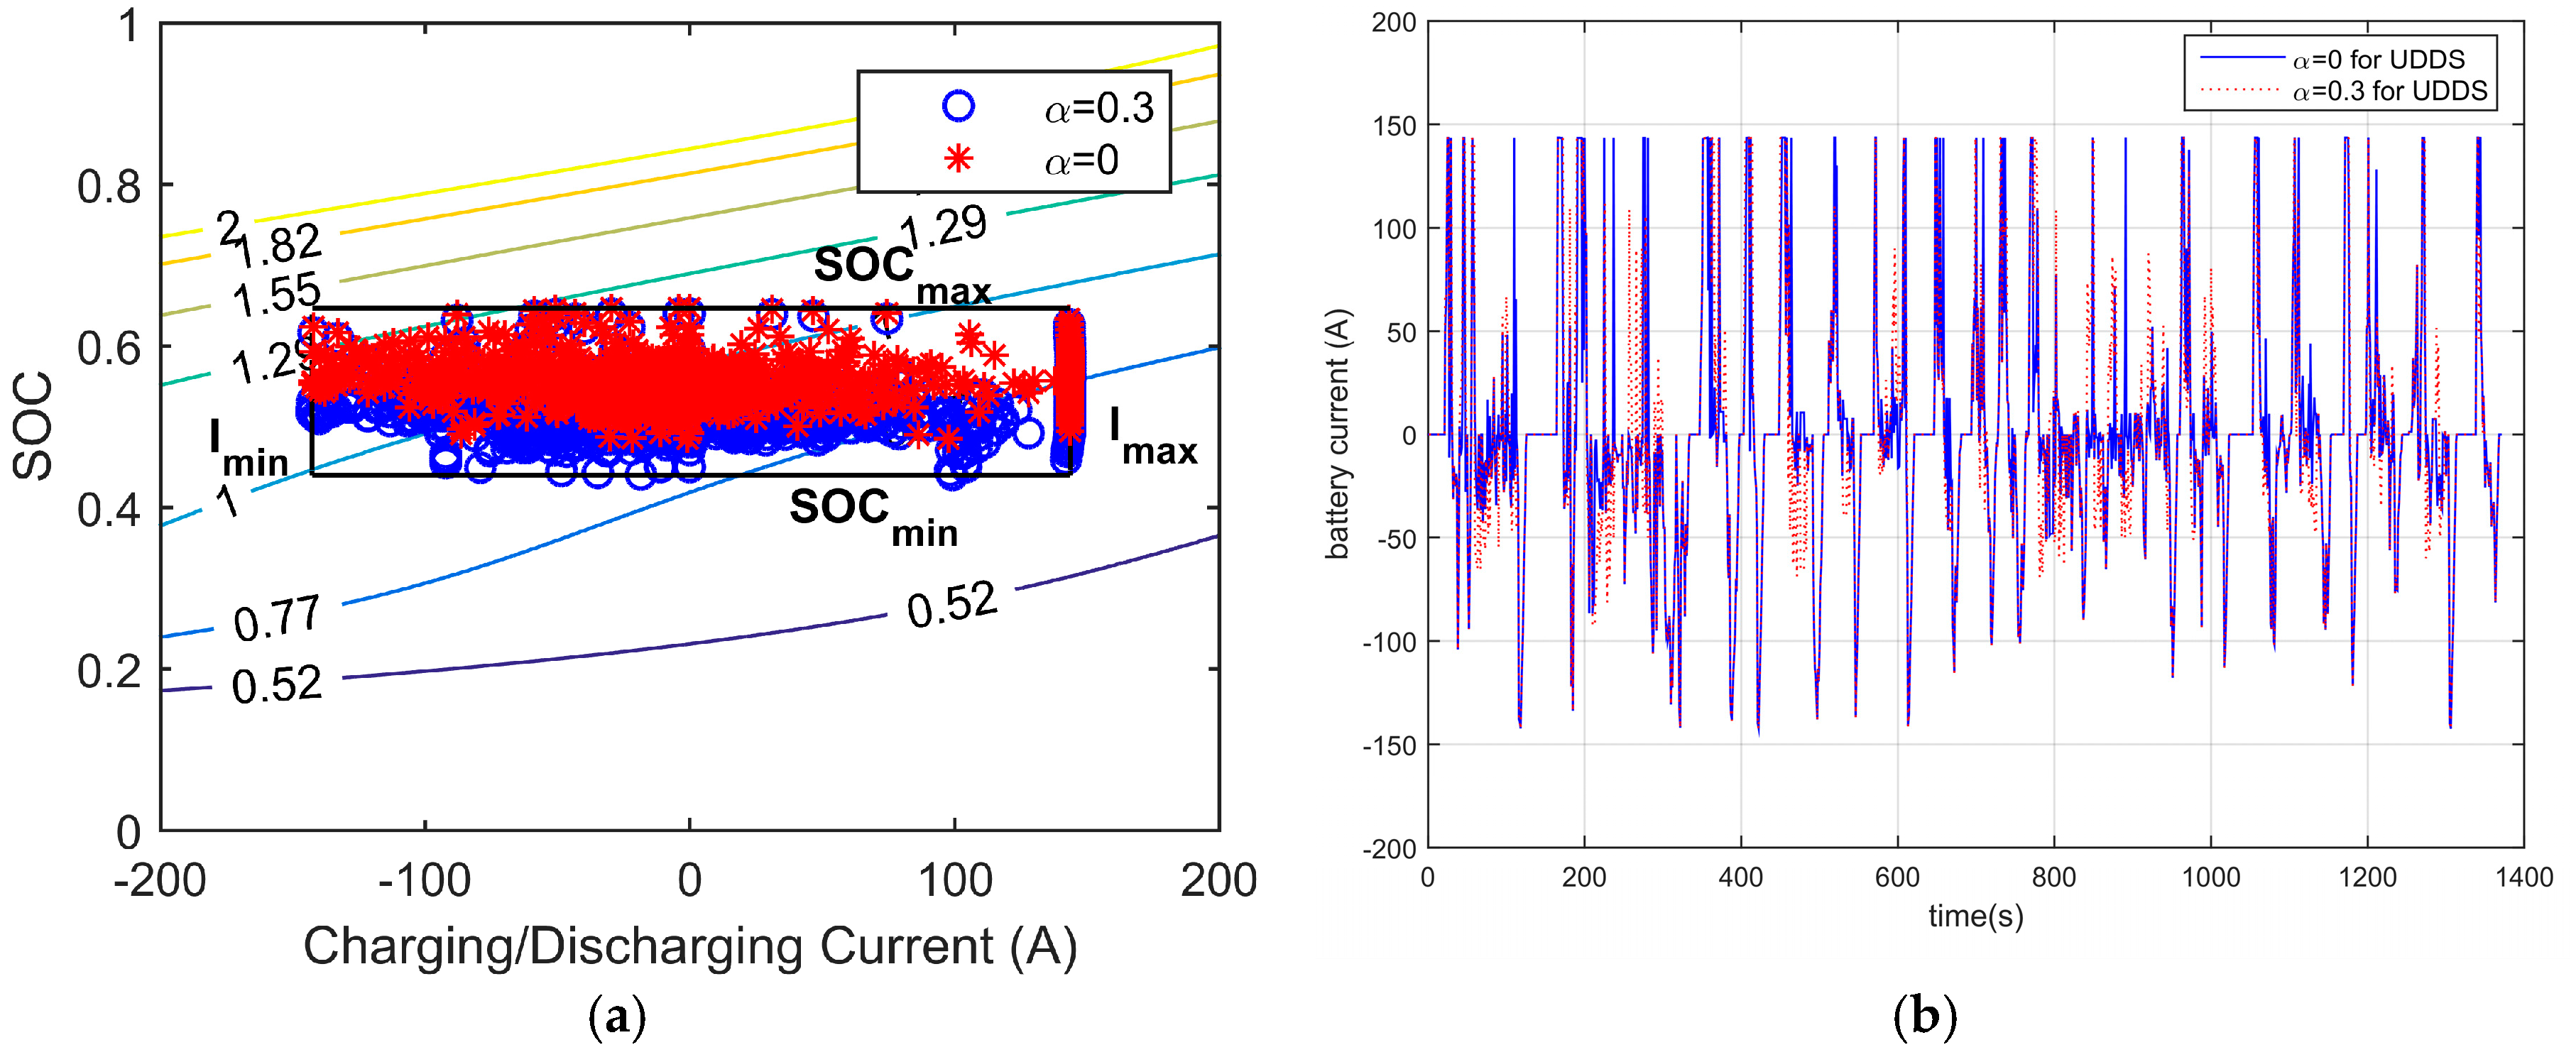
The distribution of for both of the different optimizations, respectively, with α = 0 and α = 0.3 indicates a similar pattern as the NEDC cycle. The results are shown in Figure 10a.
5. Conclusions
The proposed multi-objective optimization has been implemented on a hybrid electric vehicle with a novel MMPS powertrain on board. This particular powertrain is not only efficient, but also provides additional control degree of freedom.
The SEI film growth model with 3-D map is integrated in the optimization, so the battery degradation can be treated as an integral term, like fuel consumption of the engine. The goals of the multi-objective optimization are obviously conflicting and affected by the power splitting between the mechanical path from the engine and the electric path from the battery. However, the relationship is complex due to the non-linear nature of the battery degradation model.
The instantaneous optimization control-oriented framework provides a unified modeling environment, based on which the optimization process is simulated with different weighting factors and over two typical driving cycles.
The simulation results indicates that during the charge-sustaining stage, the strategy considering battery aging directs the SOC trajectory within a lower range. As a result, more electric driving modes, especially the dual-EM mode, are employed over both NEDC and UDDS cycles. For hybrid driving, more parallel modes are selected as an optimal solution. Due to the relatively low SOC, the MOO controller prefers the parallel mode, which eliminates the circuitous power between EMA and EMB in the electric path compared with the compound split mode.
The research in this paper proves the multi-objective optimization, including battery degradation-consciousness, is effective as an instantaneous control method for the MMPS configuration. It can reduce the battery degradation and instruct the mode selection and, especially fully explore the enhanced electric driving capability. For charge-sustaining stage, SOC distribution is supposed to concentrate in the lower range.
Different from CS operating for HEV, charge depleting (CD) and CD-CS blended mode are particular in PHEV, where the batteries discharge/charge more deeply with EV modes. Therefore, the patterns which affect the battery aging process is different. The balanced SOC obtained from the CS stage can be used as a reference. In future work, we will make efforts to explore the relevant research based on the instantaneous control framework. Battery degradation is a very complex and long-term state, which needs more experimental data to validate the state variation. In the future related experiments need to be implemented with different control strategies. Over a long lifetime of the battery pack, the degradation will be more obvious and significant, as well as the users’ cost of fuel consumption. Therefore, more research can also be expanded deeply from the viewpoint of cost and the relevance between the battery capacity loss and fuel consumption
Acknowledgments
The research work in this paper is supported by a grant from US-China Clean Energy Research Collaboration: Collaboration on cutting edge technology development of electric vehicle (Program of International S&T Cooperation) (2010DFA72760).
Author Contributions
Xuerui Ma and Yong Zhang conducted the main work of the modeling, algorithm, simulation, and analysis of the optimization results; Xuerui Ma designed the control algorithm with multi-objectives considering battery degradation and also wrote the paper; Yong Zhang contributed to the modeling of the power-split hybrid system and simulation process; Shifei Yuan contributed the battery degradation modeling and verification; and Chengliang Yin provided insightful suggest and revised the paper.
Conflicts of Interest
The authors declare no conflict of interest. The founding sponsors had no role in the design of the study; in the collection, analyses, or interpretation of data; in the writing of the manuscript, and in the decision to publish the results.
Appendix A

Table A1.
Vehicle Parameters.
| Vehicle | Mass (kg) | 1380 |
| Frontal Area (m2) | 2.33 | |
| Cd | 0.25 | |
| Tire Radius (m) | 0.308 | |
| Final Drive | 3.267 | |
| Transmission | PG1 ratio | 2.35 |
| PG2 ratio | 3.175 | |
| Engine | Max speed (rpm) | 5200 |
| Max torque (Nm) | 142 @ 4000 | |
| Max power (kW) | 73 | |
| EMA | Max speed (rpm) | 12,000 |
| Max torque (Nm) | 140 | |
| Max power (kW) | 42 | |
| EMB | Max speed (rpm) | 12,000 |
| Max torque (Nm) | 200 | |
| Max power (kW) | 60 | |
| Battery (LiFePO4) | Capacity (Ah) | 6.5 |
| High Voltage | 201.6 V |
References
- Benefits and Considerations of Electricity as a Vehicle Fuel. Available online: https://www.afdc.energy.gov/fuels/electricity_benefits.html (accessed on 1 July 2017).
- Brendan, C. Comparative Analysis of Single and Combined Hybrid Electrically Variable Transmission Operating Modes. SAE Tech. Pap. 2005. [Google Scholar] [CrossRef]
- Miller, J.M. In Hybrid electric vehicle propulsion system architectures of the e-CVT type. IEEE Trans. Power Electron. 2006, 21, 756–767. [Google Scholar] [CrossRef]
- Meisel, J. An analytic foundation for the two-mode hybrid-electric powertrain with a comparison to the single-mode Toyota Prius THS-II powertrain. SAE Tech. Pap. 2009. [Google Scholar] [CrossRef]
- Miller, M.A.; Holmes, A.G.; Conlon, B.M.; Savagian, P.J. The GM “Voltec” 4ET50 Multi-Mode Electric Transaxle. SAE Int. J. Engines 2011, 4, 1102–1114. [Google Scholar] [CrossRef]
- Grewe, T.M.; Conlon, B.M.; Holmes, A.G. Defining the General Motors 2-Mode Hybrid Transmission. SAE World Congr. Exhib. 2007. [Google Scholar] [CrossRef]
- Hendrickson, J.; Holmes, A.; Freiman, D. General motors front wheel drive two-mode hybrid transmission. SAE Tech. Pap. 2009. [Google Scholar] [CrossRef]
- Khan, A.; Grewe, T.; Liu, J.; Anwar, M.; Holmes, A.; Balsley, R. The GM RWD PHEV Propulsion System for the Cadillac CT6 Luxury Sedan. SAE World Congr. Exhib. 2016, 1. [Google Scholar] [CrossRef]
- Liu, J. Modeling, Configuration and Control Optimization of Power-Split Hybrid Vehicles; The University of Michigan: Ann Arbor, MI, USA, 2007. [Google Scholar]
- Zhang, X.; Chiao-Ting, L.I.; Dongsuk, K.; Peng, H. Prius+ and Volt- : Configuration Analysis of Power-Split Hybrid Vehicles With a Single Planetary Gear. IEEE Trans. Veh. Technol. 2012, 61, 3544–3552. [Google Scholar] [CrossRef]
- Wang, C.; Zhao, Z.; Zhang, T.; Dai, X.; Yuan, X. Development of a Compact Compound Power-Split Hybrid Transmission Based on Altered Ravigneaux Gear Set. SAE Tech. Pap. 2014. [Google Scholar] [CrossRef]
- Mashadi, B.; Emadi, S.A.M. Dual-mode power-split transmission for hybrid electric vehicles. IEEE Trans. Veh. Technol. 2010, 59, 3223–3232. [Google Scholar] [CrossRef]
- Kim, N.; Kwon, J.; Rousseau, A. Trade-off between Multi-mode Powertrain Complexity and Fuel Consumption. In Proceedings of the 25th World Battery, Hybrid and Fuel Cell Electric Vehicle Symposium & Exhibition, Shenzhen, China, 5–9 November 2010. [Google Scholar]
- Yu, H.S.; Zhang, J.W.; Zhang, T. Control strategy design and experimental research on a four-shaft electronic continuously variable transmission hybrid electric vehicle. Proc. Inst. Mech. Eng. J. Automob. Eng. 2012, 226, 1594–1612. [Google Scholar] [CrossRef]
- Zhu, F.; Chen, L.; Yin, C. Design and Analysis of a Novel Multimode Transmission for a HEV Using a Single Electric Machine. IEEE Trans. Veh. Technol. 2013, 62, 1097–1110. [Google Scholar] [CrossRef]
- Salmasi, F.R. Control Strategies for Hybrid Electric Vehicles: Evolution, Classification, Comparison, and Future Trends. IEEE Trans. Veh. Technol. 2007, 56, 2393–2404. [Google Scholar] [CrossRef]
- Liu, J.; Peng, H. Control optimization for a power-split hybrid vehicle. In Proceedings of the American Control Conference, Minneapolis, MN, USA, 14–16 June 2006. [Google Scholar]
- Musardo, C.; Rizzoni, G.; Guezennec, Y.; Staccia, B. A-ECMS: An Adaptive Algorithm for Hybrid Electric Vehicle Energy Management. Eur. J. Control 2005, 11, 509–524. [Google Scholar] [CrossRef]
- Serrao, L.; Onori, S.; Rizzoni, G. ECMS as a Realization of Pontryagin's Minimum Principle for HEV Control. In Proceedings of the 2009 conference on American Control Conference, St. Louis, MO, USA, 10–12 June 2009; pp. 3964–3969. [Google Scholar]
- Pisu, P.; Rizzoni, G. A Comparative Study of Supervisory Control Strategies for Hybrid Electric Vehicles. Int. Mech. Eng. Congr. Expo. 2004, 15, 506–518. [Google Scholar] [CrossRef]
- Barré, A.; Deguilhem, B.; Grolleau, S.; Gérard, M.; Suard, F.; Riu, D. A review on lithium-ion battery ageing mechanisms and estimations for automotive applications. J. Power Sources 2013, 241, 680–689. [Google Scholar] [CrossRef]
- Moura, S.J.; Stein, J.L.; Fathy, H.K. Battery-Health Conscious Power Management in Plug-In Hybrid Electric Vehicles via Electrochemical Modeling and Stochastic Control. IEEE Trans. Control Syst. Technol. 2013, 21, 679–694. [Google Scholar] [CrossRef]
- Martel, F.; Kelouwani, S.; Dubé, Y.; Agbossou, K. Optimal economy-based battery degradation management dynamics for fuel-cell plug-in hybrid electric vehicles. J. Power Sources 2015, 274, 367–381. [Google Scholar] [CrossRef]
- Zhang, Y.; Ma, X.; Yin, C.; Yuan, S. Development and Simulation of a Type of Four-Shaft ECVT for a Hybrid Electric Vehicle. Energies 2016, 9, 141. [Google Scholar] [CrossRef]
- Koprubasi, K.; Westervelt, E.; Rizzoni, G. Toward the systematic design of controllers for smooth hybrid electric vehicle mode changes. In Proceedings of the American Control Conference, New York, NY, USA, 9–13 July 2007; pp. 2985–2990. [Google Scholar]
- Benford, H.; Leising, M. The Lever Analogy: A New Tool in Transmission Analysis. SAE Tech. Pap. 1981. [Google Scholar] [CrossRef]
- Ramadass, P.; Haran, B.; Gomadam, P.M.; White, R.; Popov, B.N. Development of First Principles Capacity Fade Model for Li-Ion Cells. J. Electrochem. Soc. 2004, 151, A196. [Google Scholar] [CrossRef]
- Randall, A.V.; Perkins, R.D.; Zhang, X.; Plett, G.L. Controls oriented reduced order modeling of solid-electrolyte interphase layer growth. J. Power Sources 2012, 209, 282–288. [Google Scholar] [CrossRef]
- Moura, S.J.; Stein, J.L.; Fathy, H.K. Battery-Health Conscious Power Management for Plug-In Hybrid Electric Vehicles via Stochastic Control. In Proceedings of the ASME 2010 Dynamic Systems and Control Conference, Cambridge, MA, USA, 12–15 September 2010; pp. 615–624. [Google Scholar]
- Xiaowu, Z.; Huei, P.; Jing, S. A Near-Optimal Power Management Strategy for Rapid Component Sizing of Multimode Power Split Hybrid Vehicles. IEEE Trans. Control Syst. Technol. 2015, 23, 609–618. [Google Scholar] [CrossRef]
Figure 1.
(a) Proposed configuration of the MMPS powertrain; (b) scheme of the Multi-Mode Power-Split (MMPS) powertrain.
Figure 1.
(a) Proposed configuration of the MMPS powertrain; (b) scheme of the Multi-Mode Power-Split (MMPS) powertrain.

Figure 2.
(a) Maximum output power of each mode versus vehicle speed; and (b) maximum output torque of each mode versus vehicle speed.
Figure 2.
(a) Maximum output power of each mode versus vehicle speed; and (b) maximum output torque of each mode versus vehicle speed.
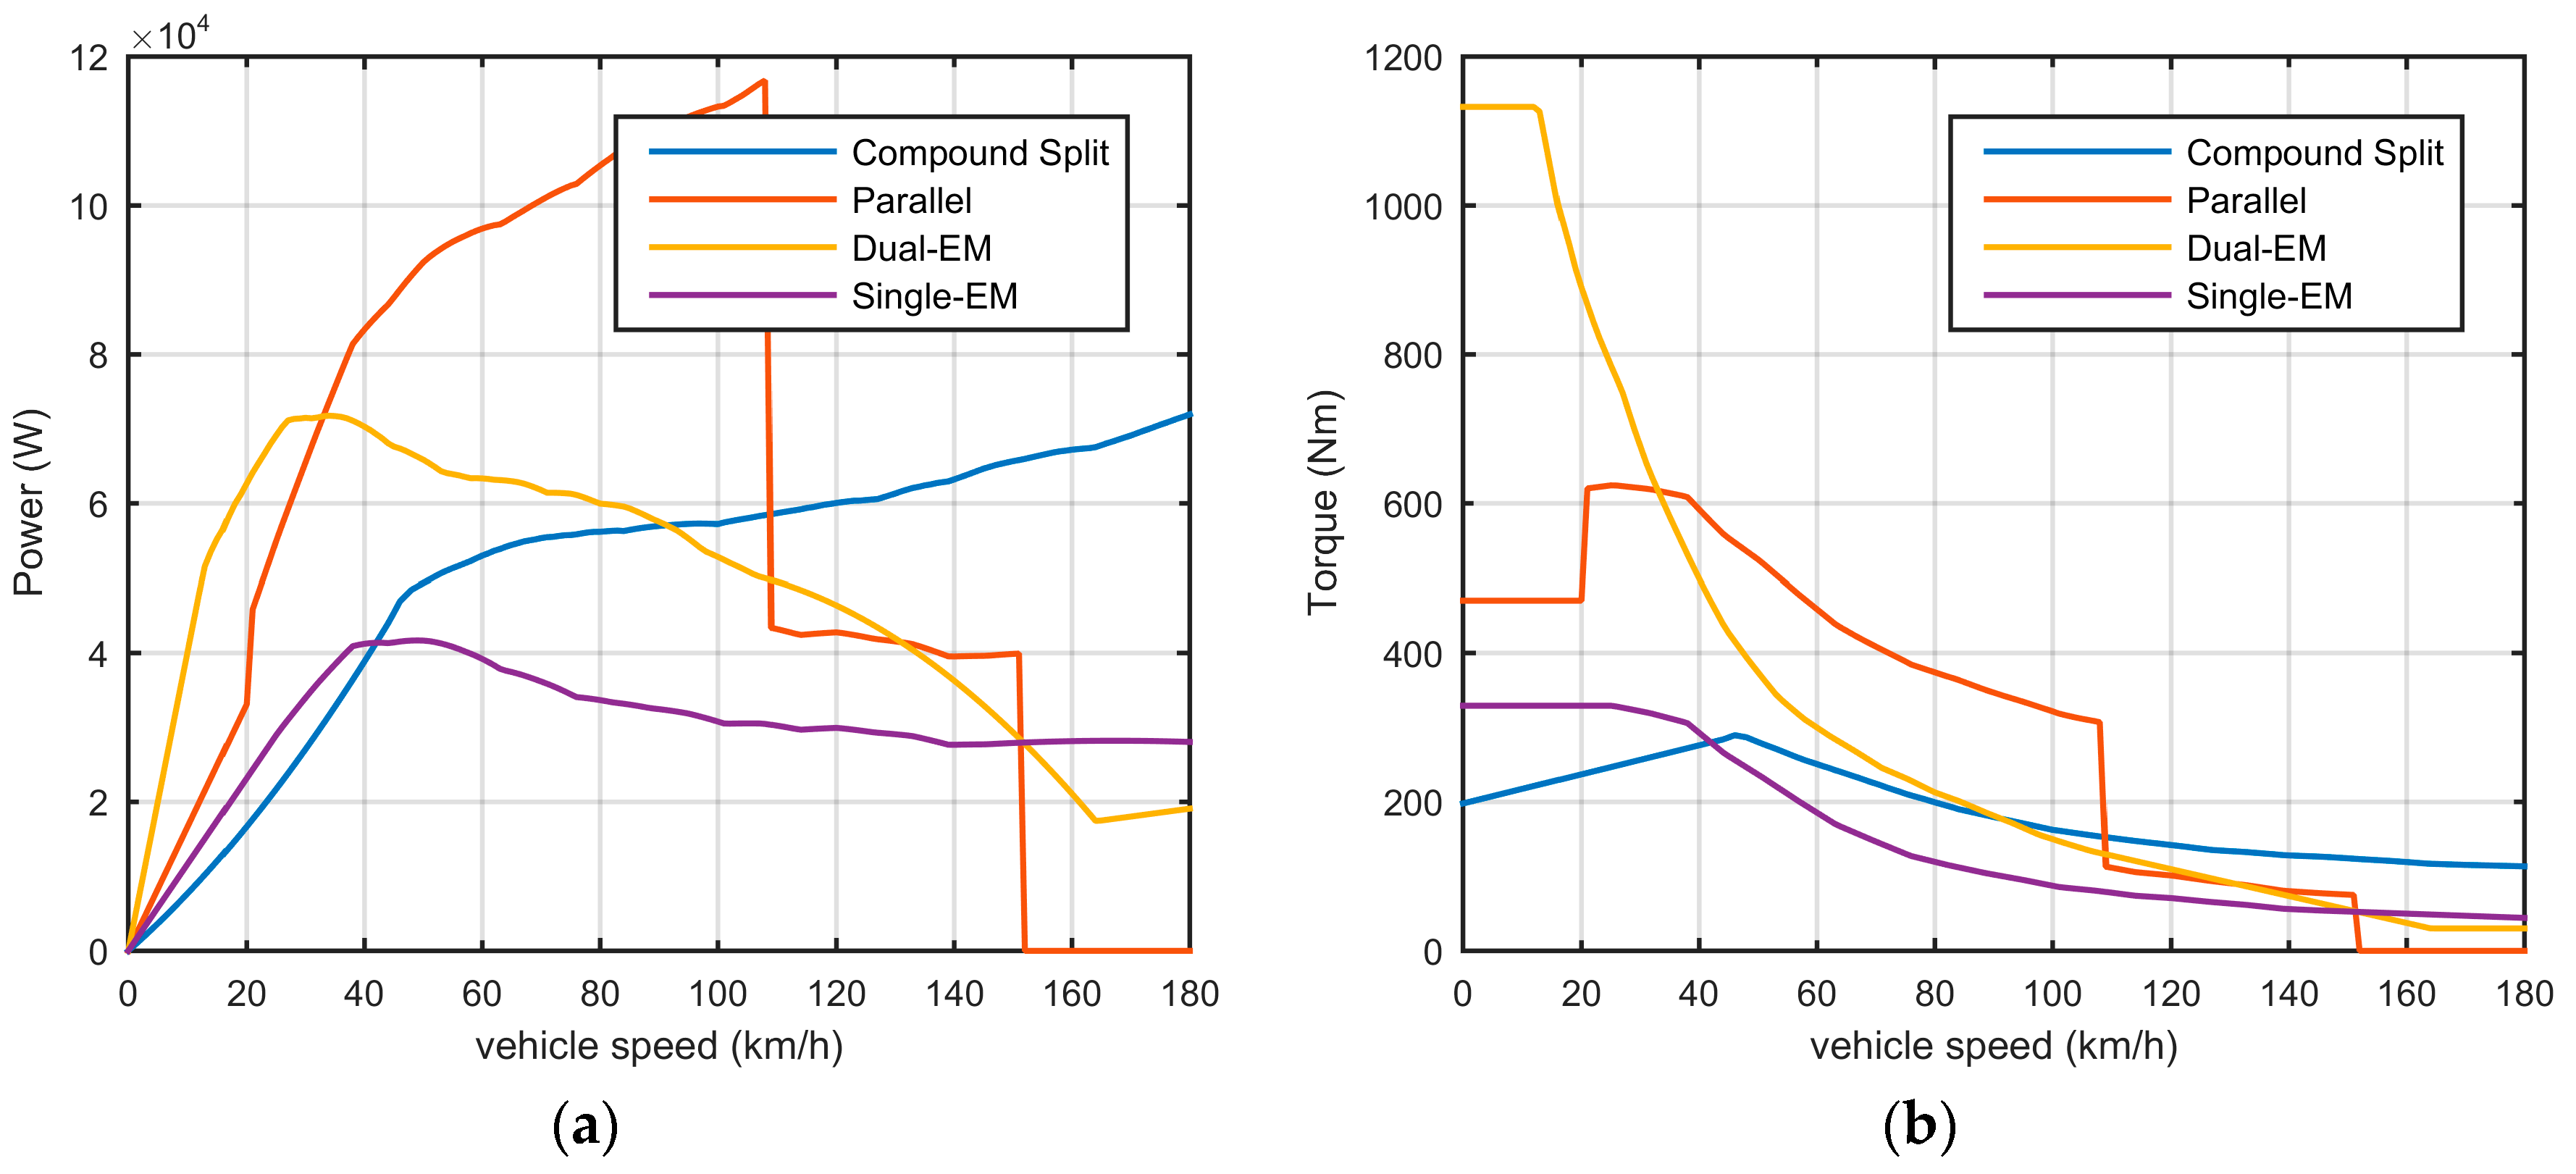
Figure 3.
Steady map of film growth rate versus current and the SOC.
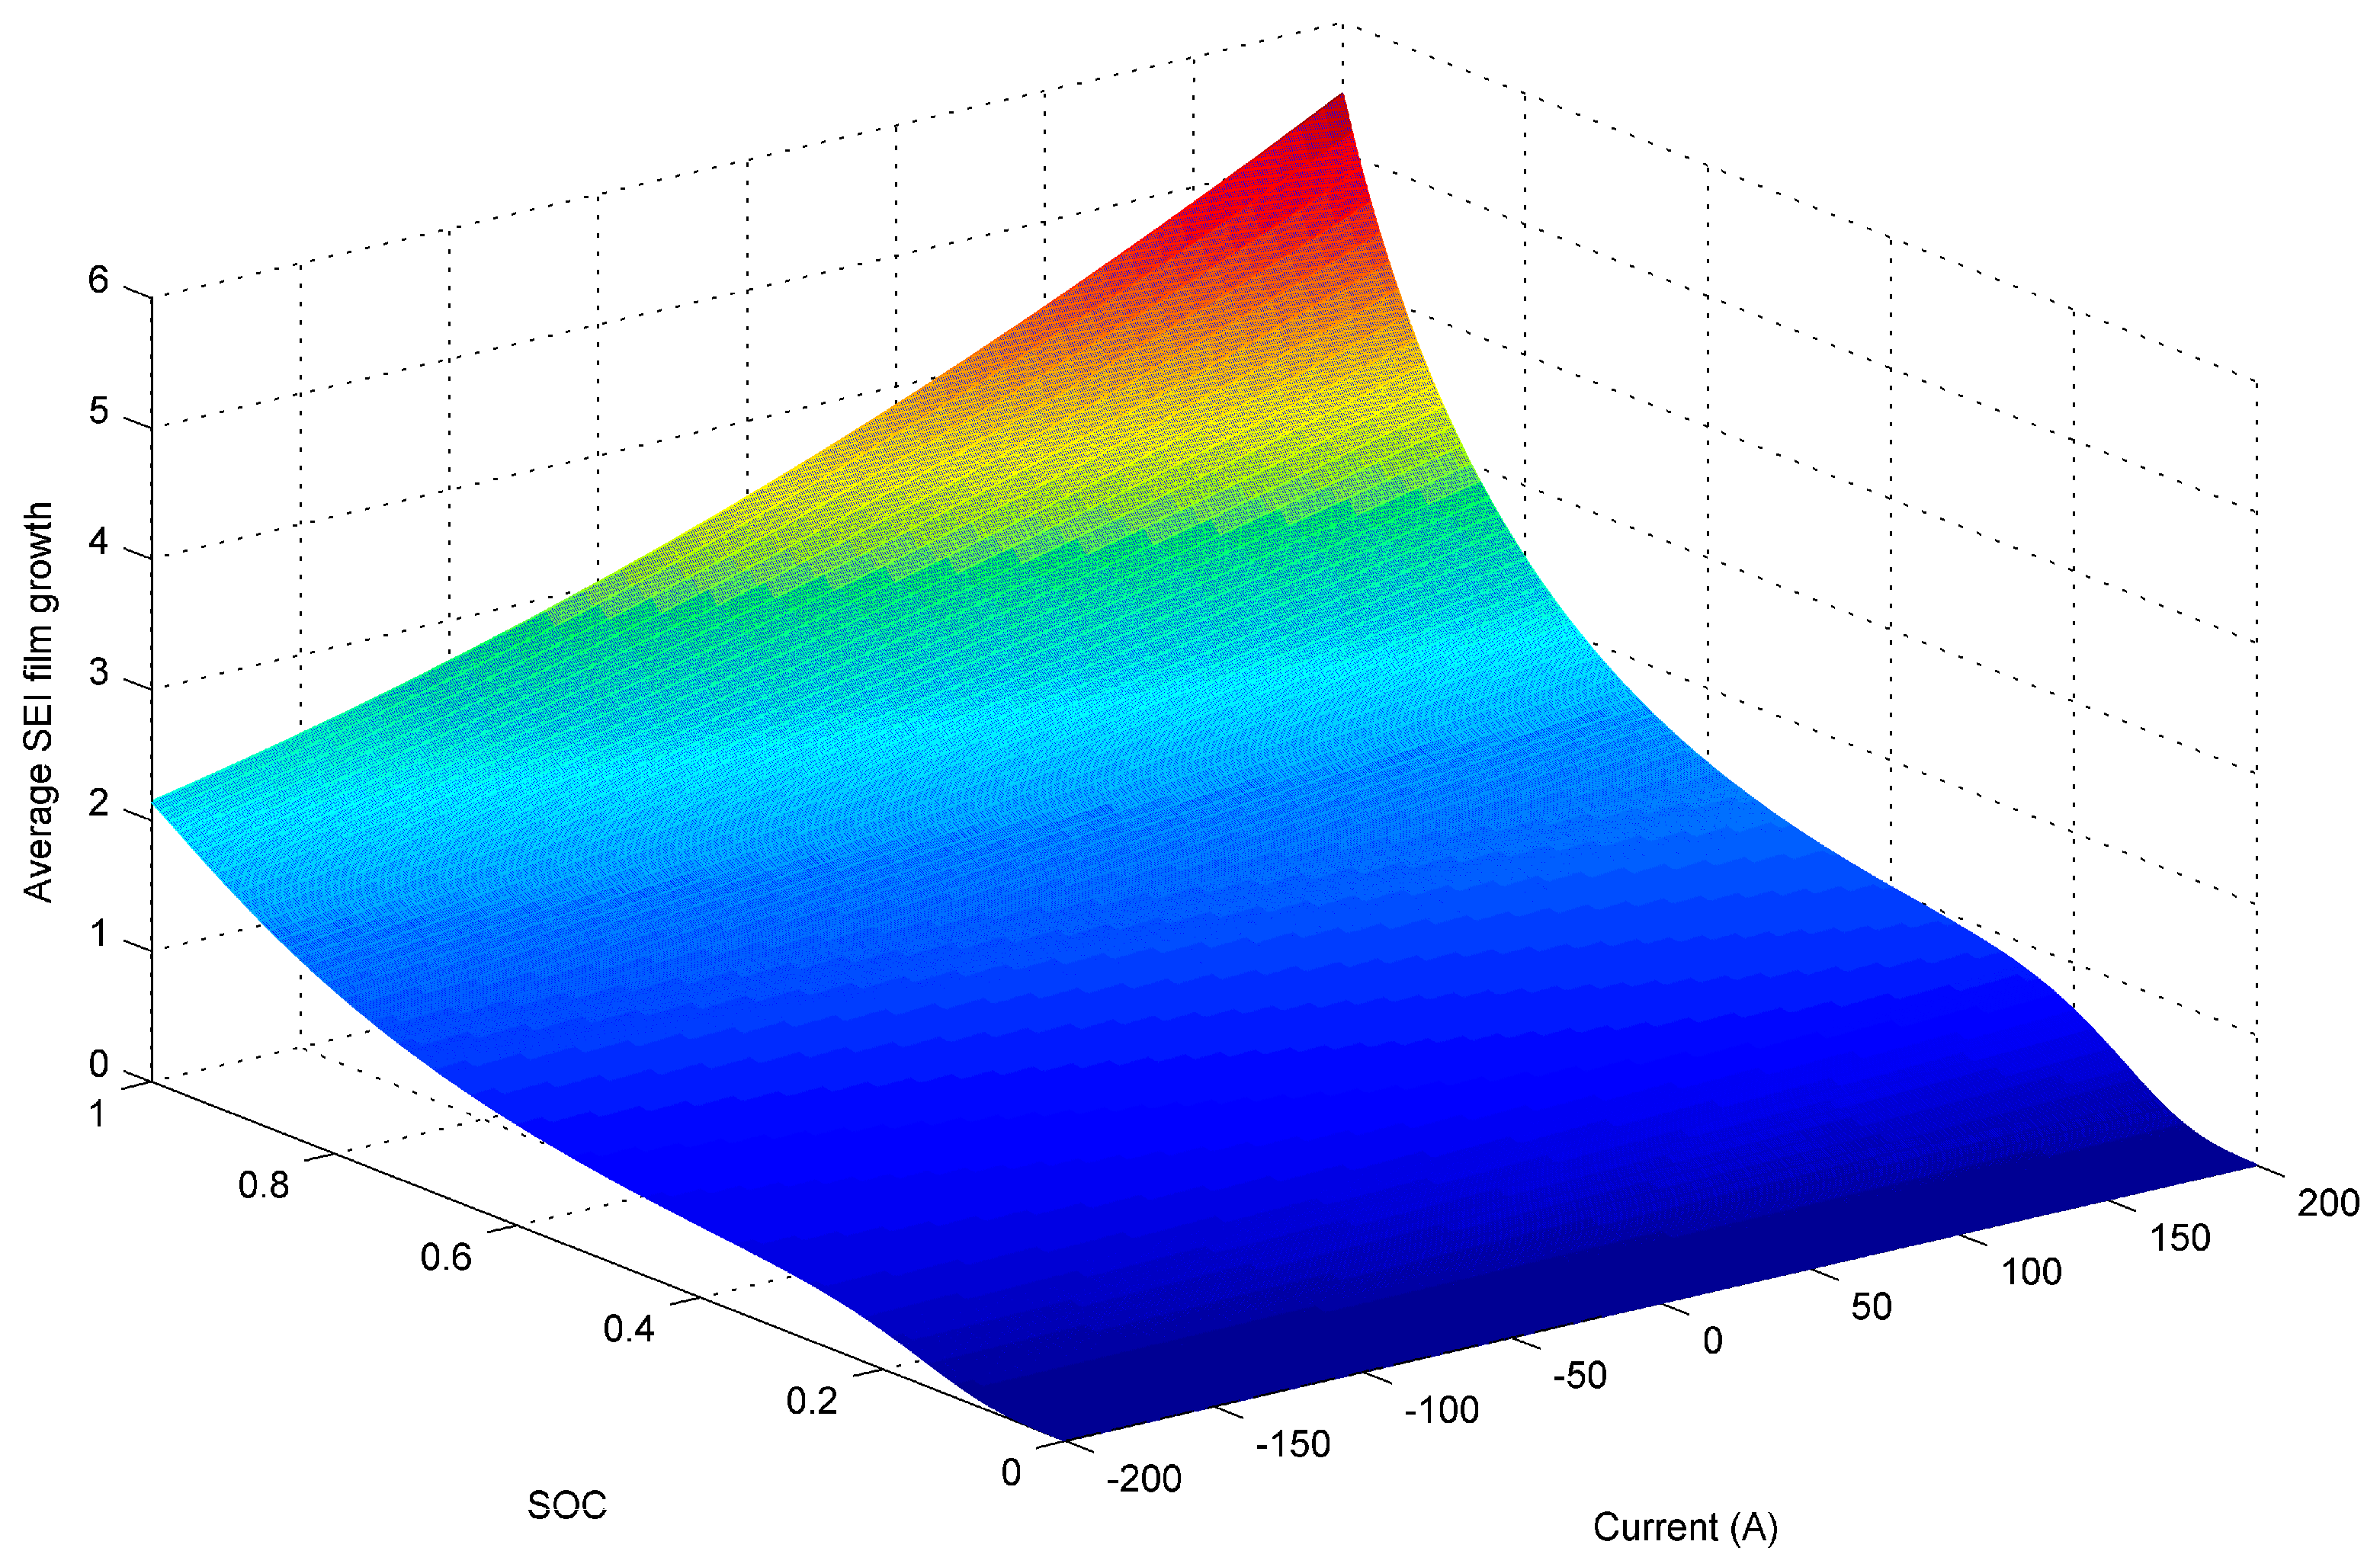
Figure 4.
Instantaneous battery health-conscious optimal control-oriented framework.

Figure 5.
(a) SOC trajectory and mode selection with α = 0; and (b) SOC trajectory and mode selection with α = 0.3.
Figure 5.
(a) SOC trajectory and mode selection with α = 0; and (b) SOC trajectory and mode selection with α = 0.3.
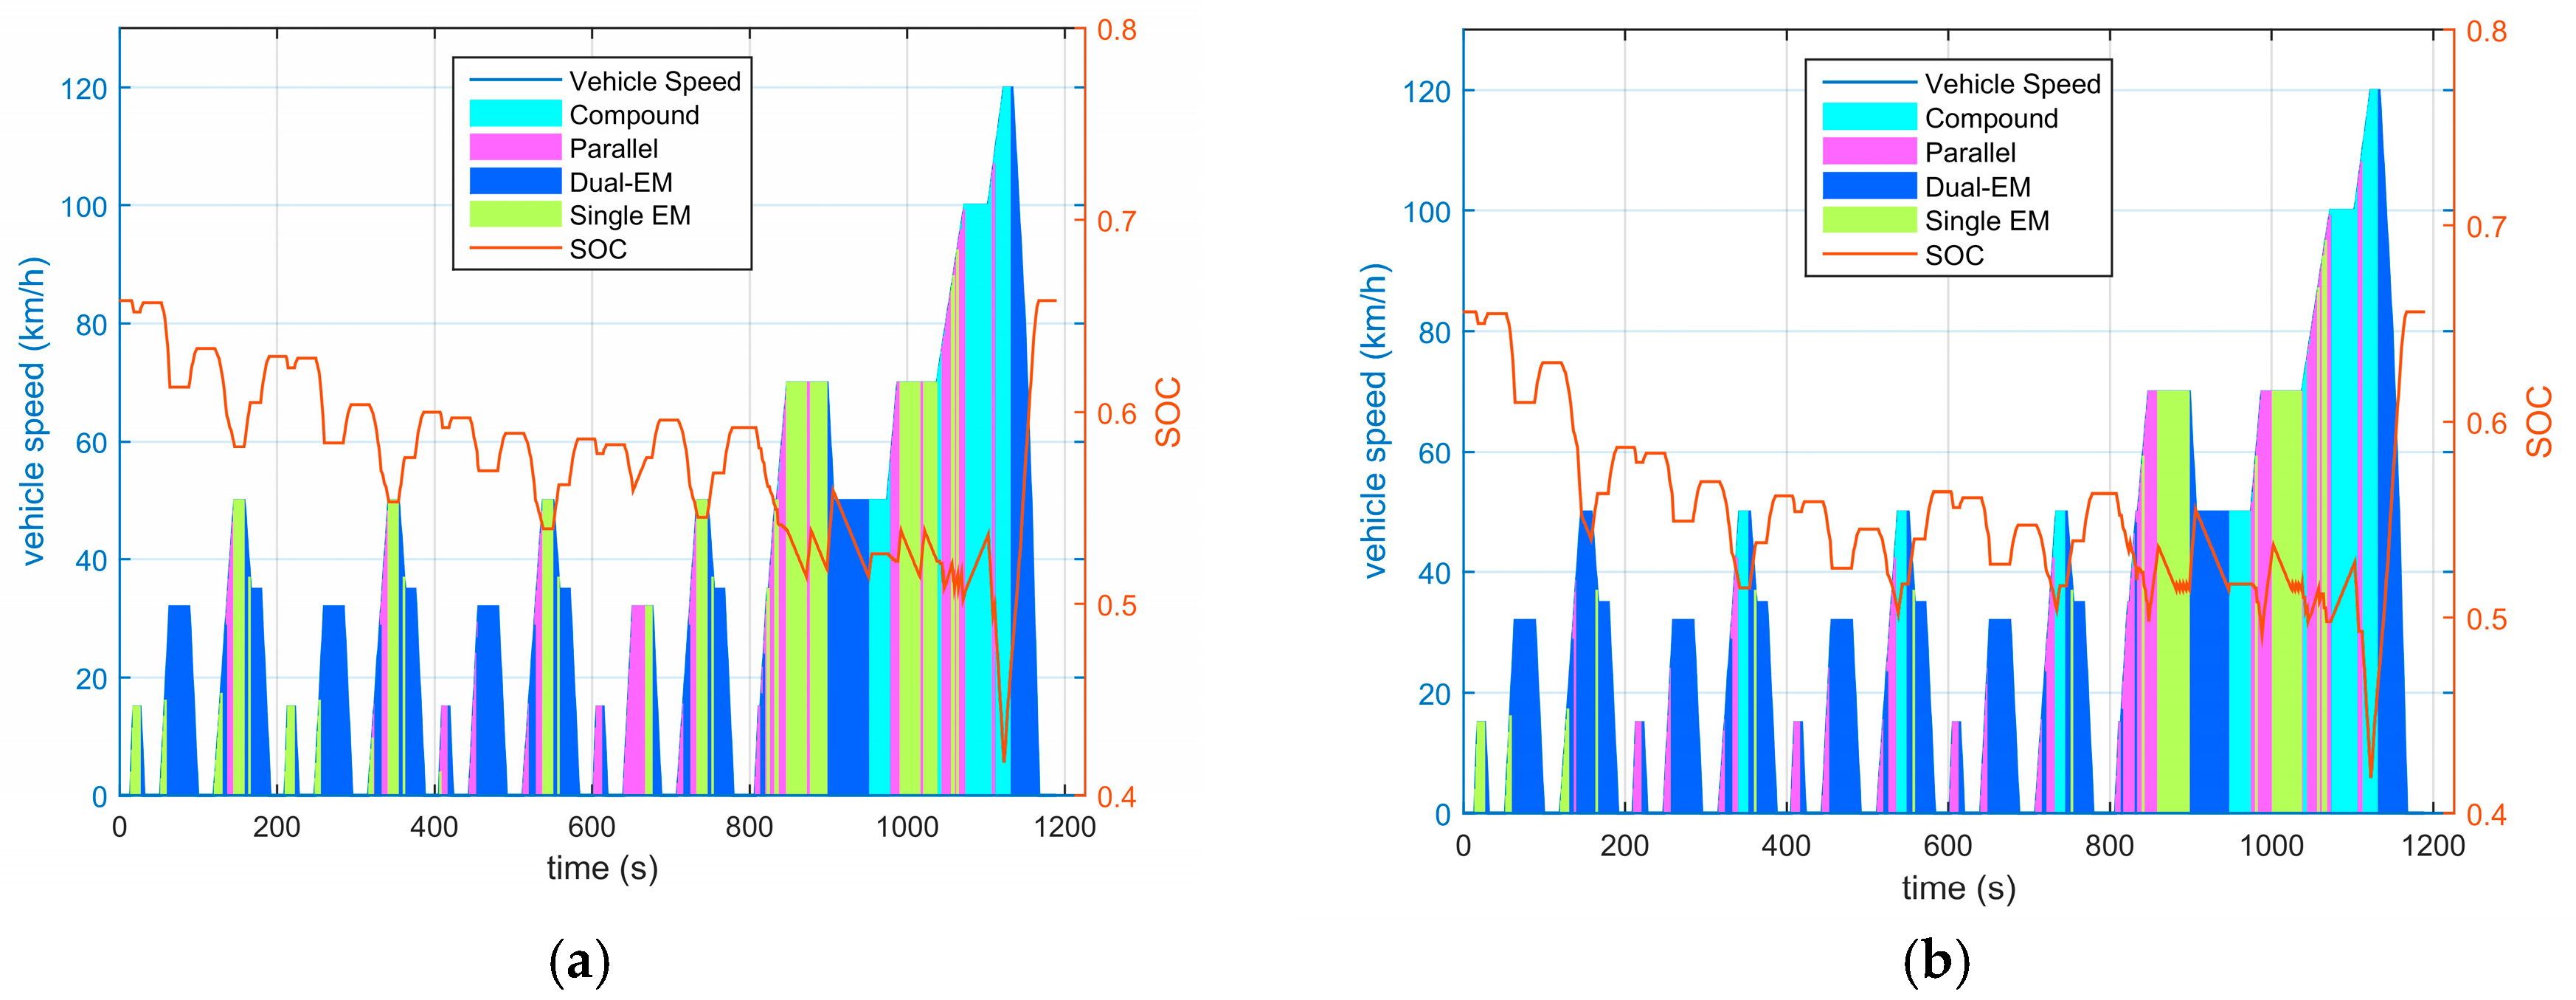
Figure 6.
(a) distribution of the anode-side SEI film growth map with α = 0; and (b) distribution of the anode-side SEI film growth map with α = 0.3.
Figure 6.
(a) distribution of the anode-side SEI film growth map with α = 0; and (b) distribution of the anode-side SEI film growth map with α = 0.3.

Figure 7.
SOC trajectory and mode selection of fuel only (α = 0) over the UDDS cycle.

Figure 8.
SOC trajectory and mode selection of fuel only (α = 0.3) over the UDDS cycle.
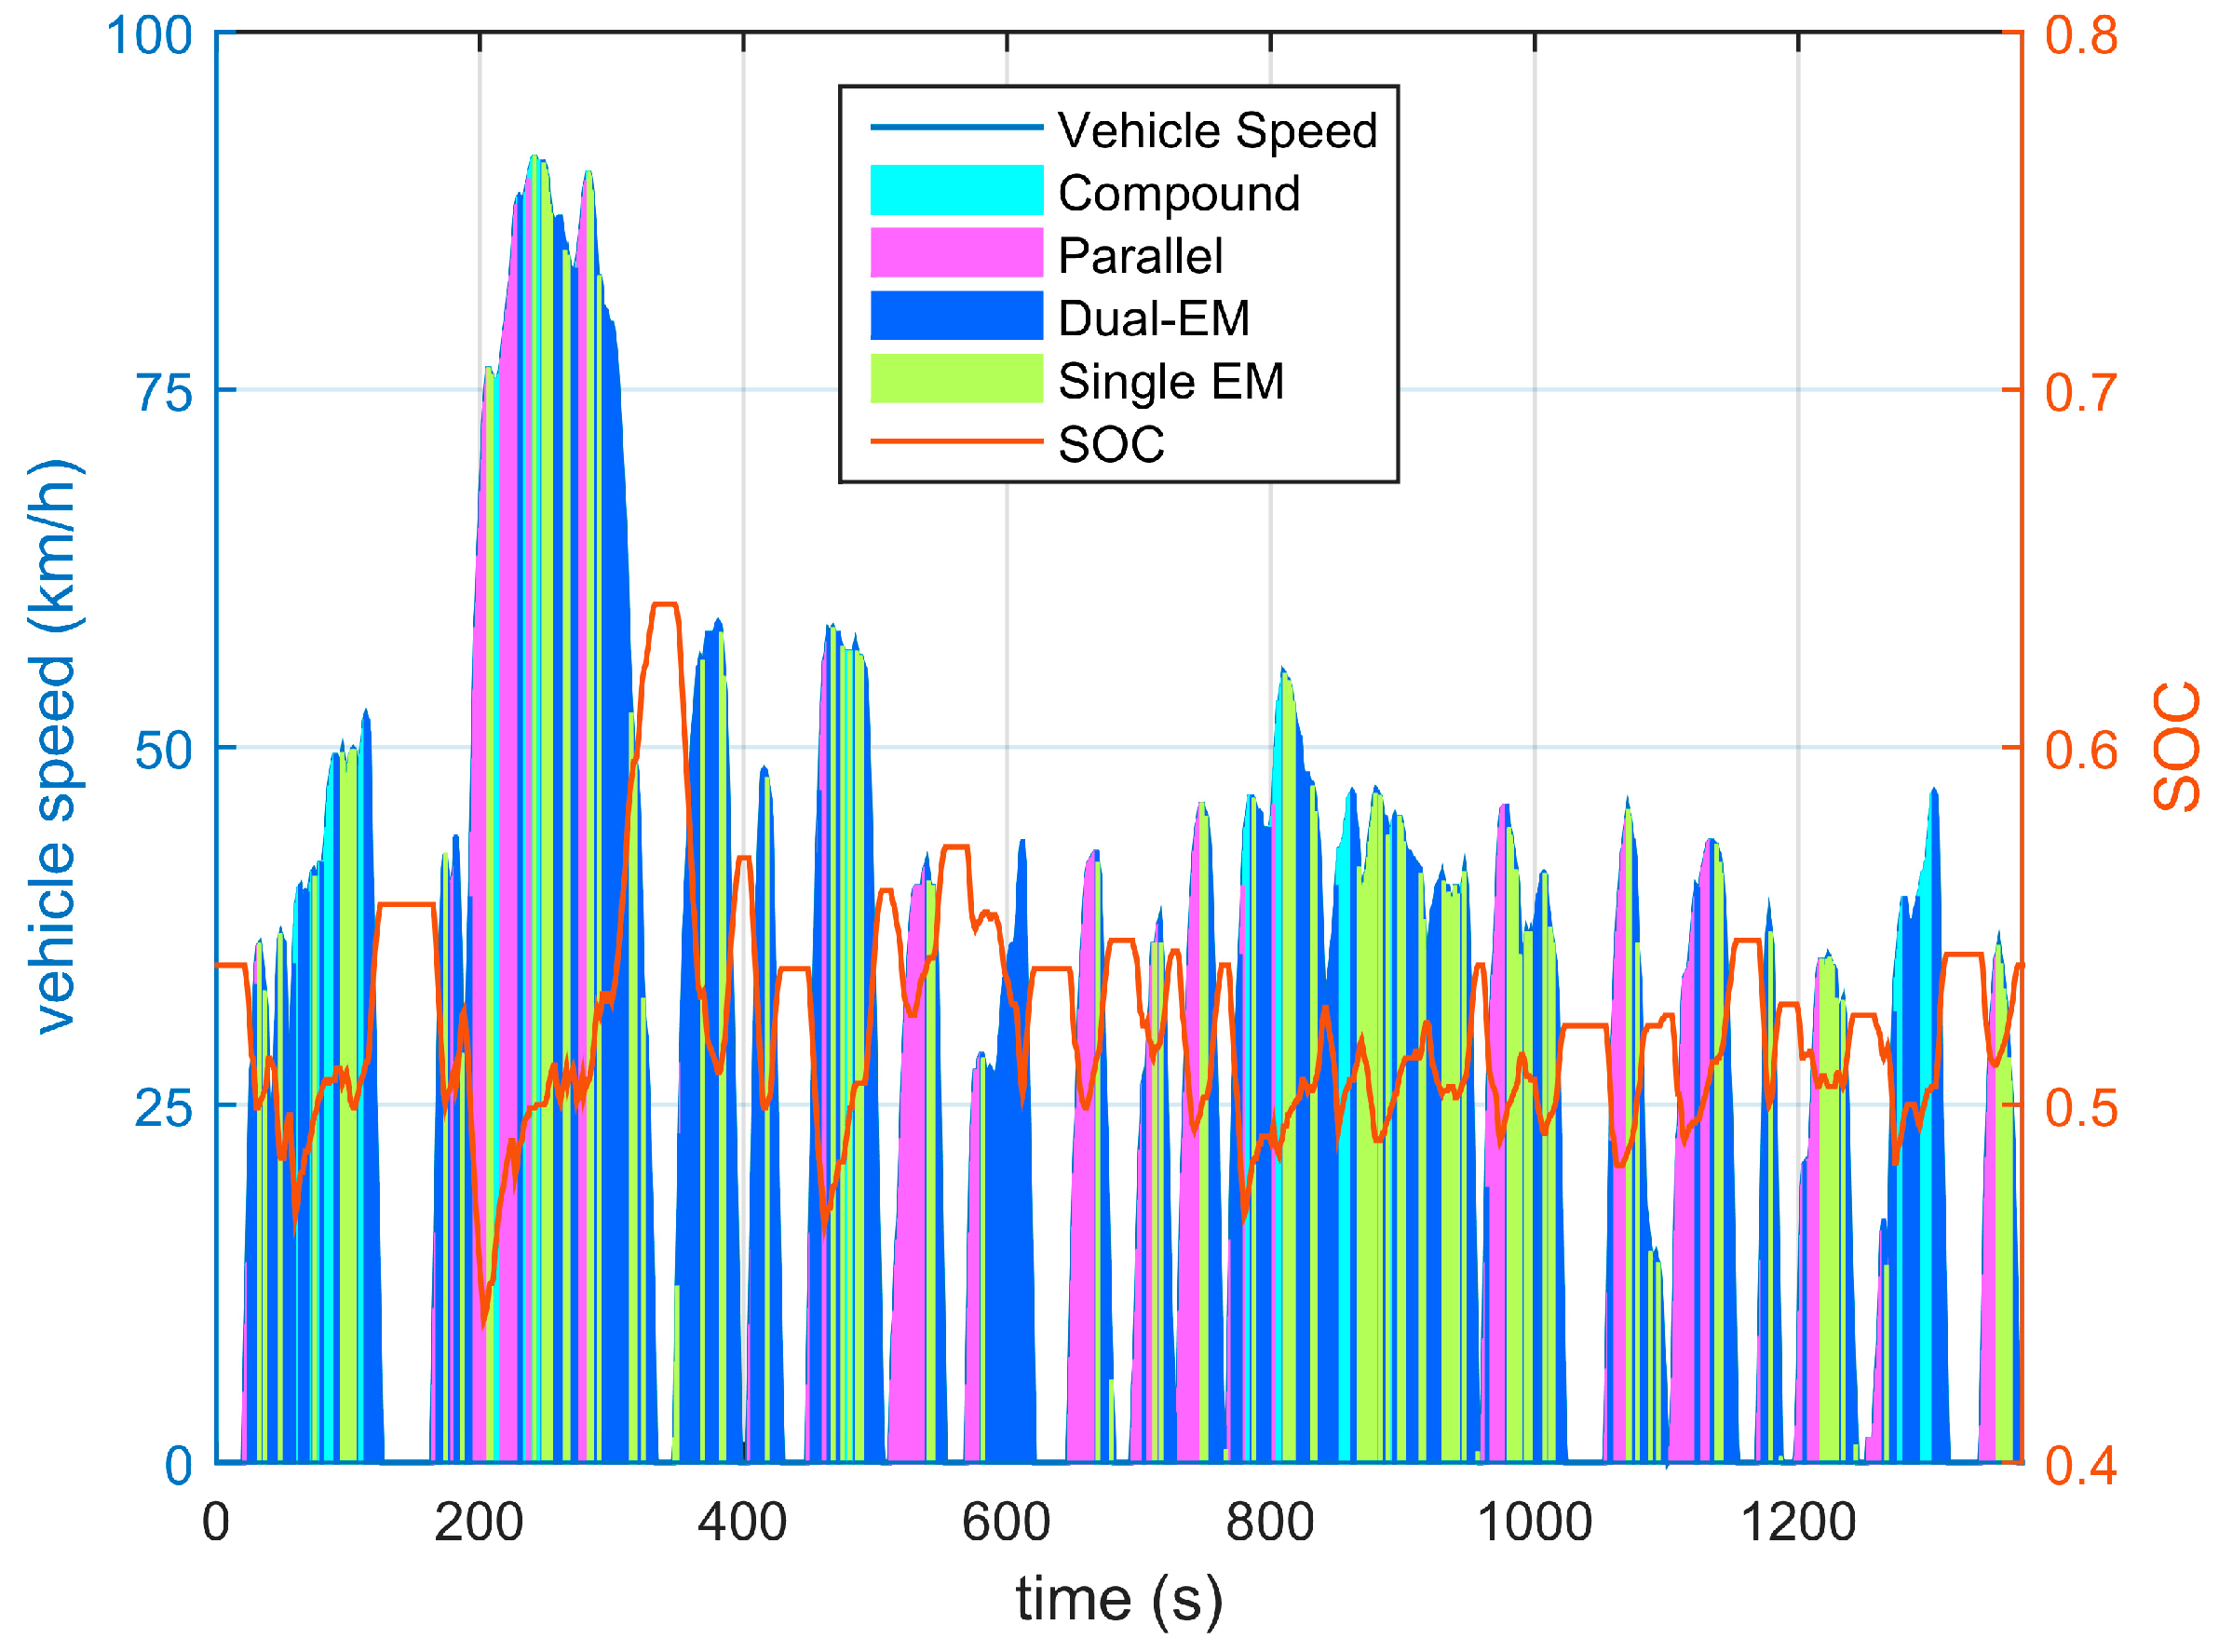
Figure 9.
(a) Active Drive mode in fuel-economy optimization (α = 0); and (b) Active Drive mode in multi-objective optimization (α = 0.3).
Figure 9.
(a) Active Drive mode in fuel-economy optimization (α = 0); and (b) Active Drive mode in multi-objective optimization (α = 0.3).

Figure 10.
(a) distribution of the anode-side SEI film growth map with α = 0 and α = 0.3; and (b) battery current over the UDDS cycle with different weighting factors of α = 0 and α = 0.3.
Figure 10.
(a) distribution of the anode-side SEI film growth map with α = 0 and α = 0.3; and (b) battery current over the UDDS cycle with different weighting factors of α = 0 and α = 0.3.

Table 1.
Operating modes of the MMPS powertrain.
| Mode | C0 | B0 | B1 |
|---|---|---|---|
| Compound split | 1 1 | 0 2 | 0 |
| Parallel | 1 | 0 | 1 |
| Dual-EM | 0 | 1 | 0 |
| Single EM | 0 | 0 | 1 |
Notes: 1 Clutch/Brake is engaged; 2 Clutch/Brake is disengaged.
Table 2.
Fuel consumption and film growth over the single NEDC cycle.
| Drive Cycle | Fuel Consumption [L/100 km] | Film Growth [mA/cm3] | ||
|---|---|---|---|---|
| α = 0.3 | α = 0 | α = 0.3 | α = 0 | |
| NEDC | 5.22 | 4.2 | 1.1442 × 10³ | 1.1958 × 10³ |
Table 3.
Fuel consumption and film growth over a single UDDS cycle.
| Drive Cycle | Fuel Consumption [L/100 km] | Film Growth [mA/cm3] | ||
|---|---|---|---|---|
| α = 0.3 | α = 0 | α = 0.3 | α = 0 | |
| UDDS | 5.23 | 4.65 | 1.2893 × 10³ | 1.3333 × 10³ |
© 2017 by the authors. Licensee MDPI, Basel, Switzerland. This article is an open access article distributed under the terms and conditions of the Creative Commons Attribution (CC BY) license (http://creativecommons.org/licenses/by/4.0/).
Share and Cite
MDPI and ACS Style
Ma, X.; Zhang, Y.; Yin, C.; Yuan, S. Multi-Objective Optimization Considering Battery Degradation for a Multi-Mode Power-Split Electric Vehicle. Energies 2017, 10, 975. https://doi.org/10.3390/en10070975
AMA Style
Ma X, Zhang Y, Yin C, Yuan S. Multi-Objective Optimization Considering Battery Degradation for a Multi-Mode Power-Split Electric Vehicle. Energies. 2017; 10(7):975. https://doi.org/10.3390/en10070975
Chicago/Turabian StyleMa, Xuerui, Yong Zhang, Chengliang Yin, and Shifei Yuan. 2017. "Multi-Objective Optimization Considering Battery Degradation for a Multi-Mode Power-Split Electric Vehicle" Energies 10, no. 7: 975. https://doi.org/10.3390/en10070975
Note that from the first issue of 2016, this journal uses article numbers instead of page numbers. See further details here.