Geothermal Resource Exploration by Stream pH Mapping in Mutsu Hiuchi Dake Volcano, Japan

1
Graduate School of Science and Technology, Hirosaki University, 3 Bunkyo-cho, Hirosaki, Aomori 036-8561, Japan
2
North Japan Research Institute for Sustainable Energy, Hirosaki University, 2-1-3 Matsubara, Aomori 030-0813, Japan
*
Author to whom correspondence should be addressed.
Energies 2017, 10(7), 1009; https://doi.org/10.3390/en10071009
Submission received: 25 May 2017
/
Revised: 6 July 2017
/
Accepted: 7 July 2017
/
Published: 16 July 2017
Abstract
:Although pH measurements of hot spring water are taken in conventional geothermal resource research, previous studies have seldom created pH distribution maps of stream and spring waters for an entire geothermal field as a technique for geothermal exploration. In this study, a pH distribution map was created by measuring stream and spring water pH at 75 sites in the Mutsu Hiuchi Dake geothermal field, Japan. Areas of abnormally high pH were detected in midstream sections of the Ohaka and Koaka rivers; these matched the location of the Mutsu Hiuchi Dake East Slope Fault, which is believed to have formed a geothermal reservoir. The abnormally high pH zone is attributed to the trapping of rising volcanic gases in a mature geothermal reservoir with neutral geothermal water. This causes the gas to dissolve and prevents it from reaching the surface. Thus, the mapping of stream water pH distribution in a geothermal field could provide a new and effective method for estimating the locations of geothermal reservoirs. As the proposed method does not require laboratory analysis, and is more temporally and economically efficient than conventional methods, it might help to promote geothermal development in inaccessible and remote regions.
1. Introduction
Globally, the installed capacity of geothermal power is increasing each year, and it had reached 12,729 MW as of 2015. In particular, recent years have seen an increasing demand to develop geothermal power in inaccessible and remote regions [1]. The installed capacity of geothermal power in Japan was 519 MW as of 2015 [1], which is still far behind its huge amounts of geothermal resource potentials, considering the numerous volcanoes mostly located in inaccessible highlands and remote islands. Consequently, there is worldwide interest in developing new, temporally and economically efficient exploration methods that might contribute to the promotion of geothermal power in such regions.
The most important issue in geothermal resource exploration is to efficiently find a geothermal reservoir that has resources suitable for power generation. Generally, the early stages of geothermal resource exploration consist of surface and well surveys, of which surface surveys are further categorized into geological surveys, geochemical surveys, and geophysical exploration [2,3,4]. Since there is presently no decisive exploration method to determine where a reservoir is located, the results of these various methods require comprehensive analysis and evaluation.
Geochemical surveys are used as an effective method for understanding the characteristics of geothermal fluids in many geothermal surveys, and there have been many studies on this method [5,6]. Conventional methods focus on hot spring water and fumaroles. In particular, the pH measurement of hot spring water provides important insights into basic chemical composition when conducting geothermal surveys. However, previous studies have seldom analyzed the pH of stream and spring waters distributed throughout an entire survey area for the purpose of geothermal reservoir exploration. For instance, a classical paper developed a conceptual model of geothermal fluid systems on high relief andesite volcanoes from low pH water at the summit fumarole area to near-neutral pH water at the foot area. However, actual stream pH maps of andesite volcanoes were not necessarily shown [7]. Some pH contour maps are confined to the production field because studies limit the acidity of production reservoirs to avoid the problem of corrosion and erosion [8]. Another pH contour map providing data on 7203 hot springs covering almost all of Japan indicates that low pH anomalies coincide exactly with Quaternary volcanoes; however, the scale of this map is too low for exploration [9]. To the best of the authors’ knowledge, pH mapping for the purpose of geothermal reservoir exploration has thus been quite rare.
Classical articles on geothermal exploration reiterate that the goal of geothermal exploration is to find high-temperature subsurface reservoirs composed of near-neutral pH alkali chloride water [7]. Such water is also called mature water because it undergoes long-lived water-rock interaction processes in deep reservoirs under chemical equilibria [10]. These processes generally result in near-neutral pH chloride water buffered by the interaction with host rocks [7]. Considering geothermal systems in high relief andesite volcanoes, high-temperature reservoirs are expected near the summits because they are close to magmatic heat sources. However, high relief andesite volcanoes result in a scarcity of mature chloride water discharges except at some distance from fumaroles near the summits [7]. This leads to a discrepancy between the high-temperature demand and neutral pH water reservoir demand. This discrepancy can be resolved only by detecting anomaly zones of near-neutral pH chloride water near the summits. One simple and rapid means of finding such anomaly zones is the pH mapping of stream and spring water.
In the present study, the pH of stream and spring water was measured at 75 sites within the Mutsu Hiuchi Dake geothermal field to create a pH distribution map. The study shows that mapping the pH distribution could provide a new and effective method for estimating the locations of geothermal reservoirs. The pH value of stream water is clearly influenced by several factors [11], but this study emphasizes the phenomenological and practical efficiency of pH mapping as an extraordinarily prompt exploration method. To establish stream pH mapping as a more reliable method, case studies in other geothermal fields are required. Some such case studies will soon be described in a separate paper that will include the methodology of stream pH mapping. This paper focuses primarily on presenting how a geologically identified fault can be geochemically elucidated as a prospective near-neutral pH reservoir by the proposed stream pH mapping method.
2. Mutsu Hiuchi Dake Geothermal Field
Since the Great East Japan Earthquake of 11 March 2011, there has been increasing momentum to expand the implementation of geothermal power generation in Japan. Japan is endowed with many geothermal resources in Hokkaido, and in the Tohoku and Kyushu regions [12], and rich geothermal resources are also expected to be found in Aomori prefecture (Tohoku). There are several Quaternary volcanoes within the area of Aomori prefecture [13]. The most prospective geothermal field is located near Mutsu Hiuchi Dake volcano [14,15]. This region is suitable for geothermal development as it lies outside the national park area and is therefore not subject to regulations on such forms of development (Figure 1).
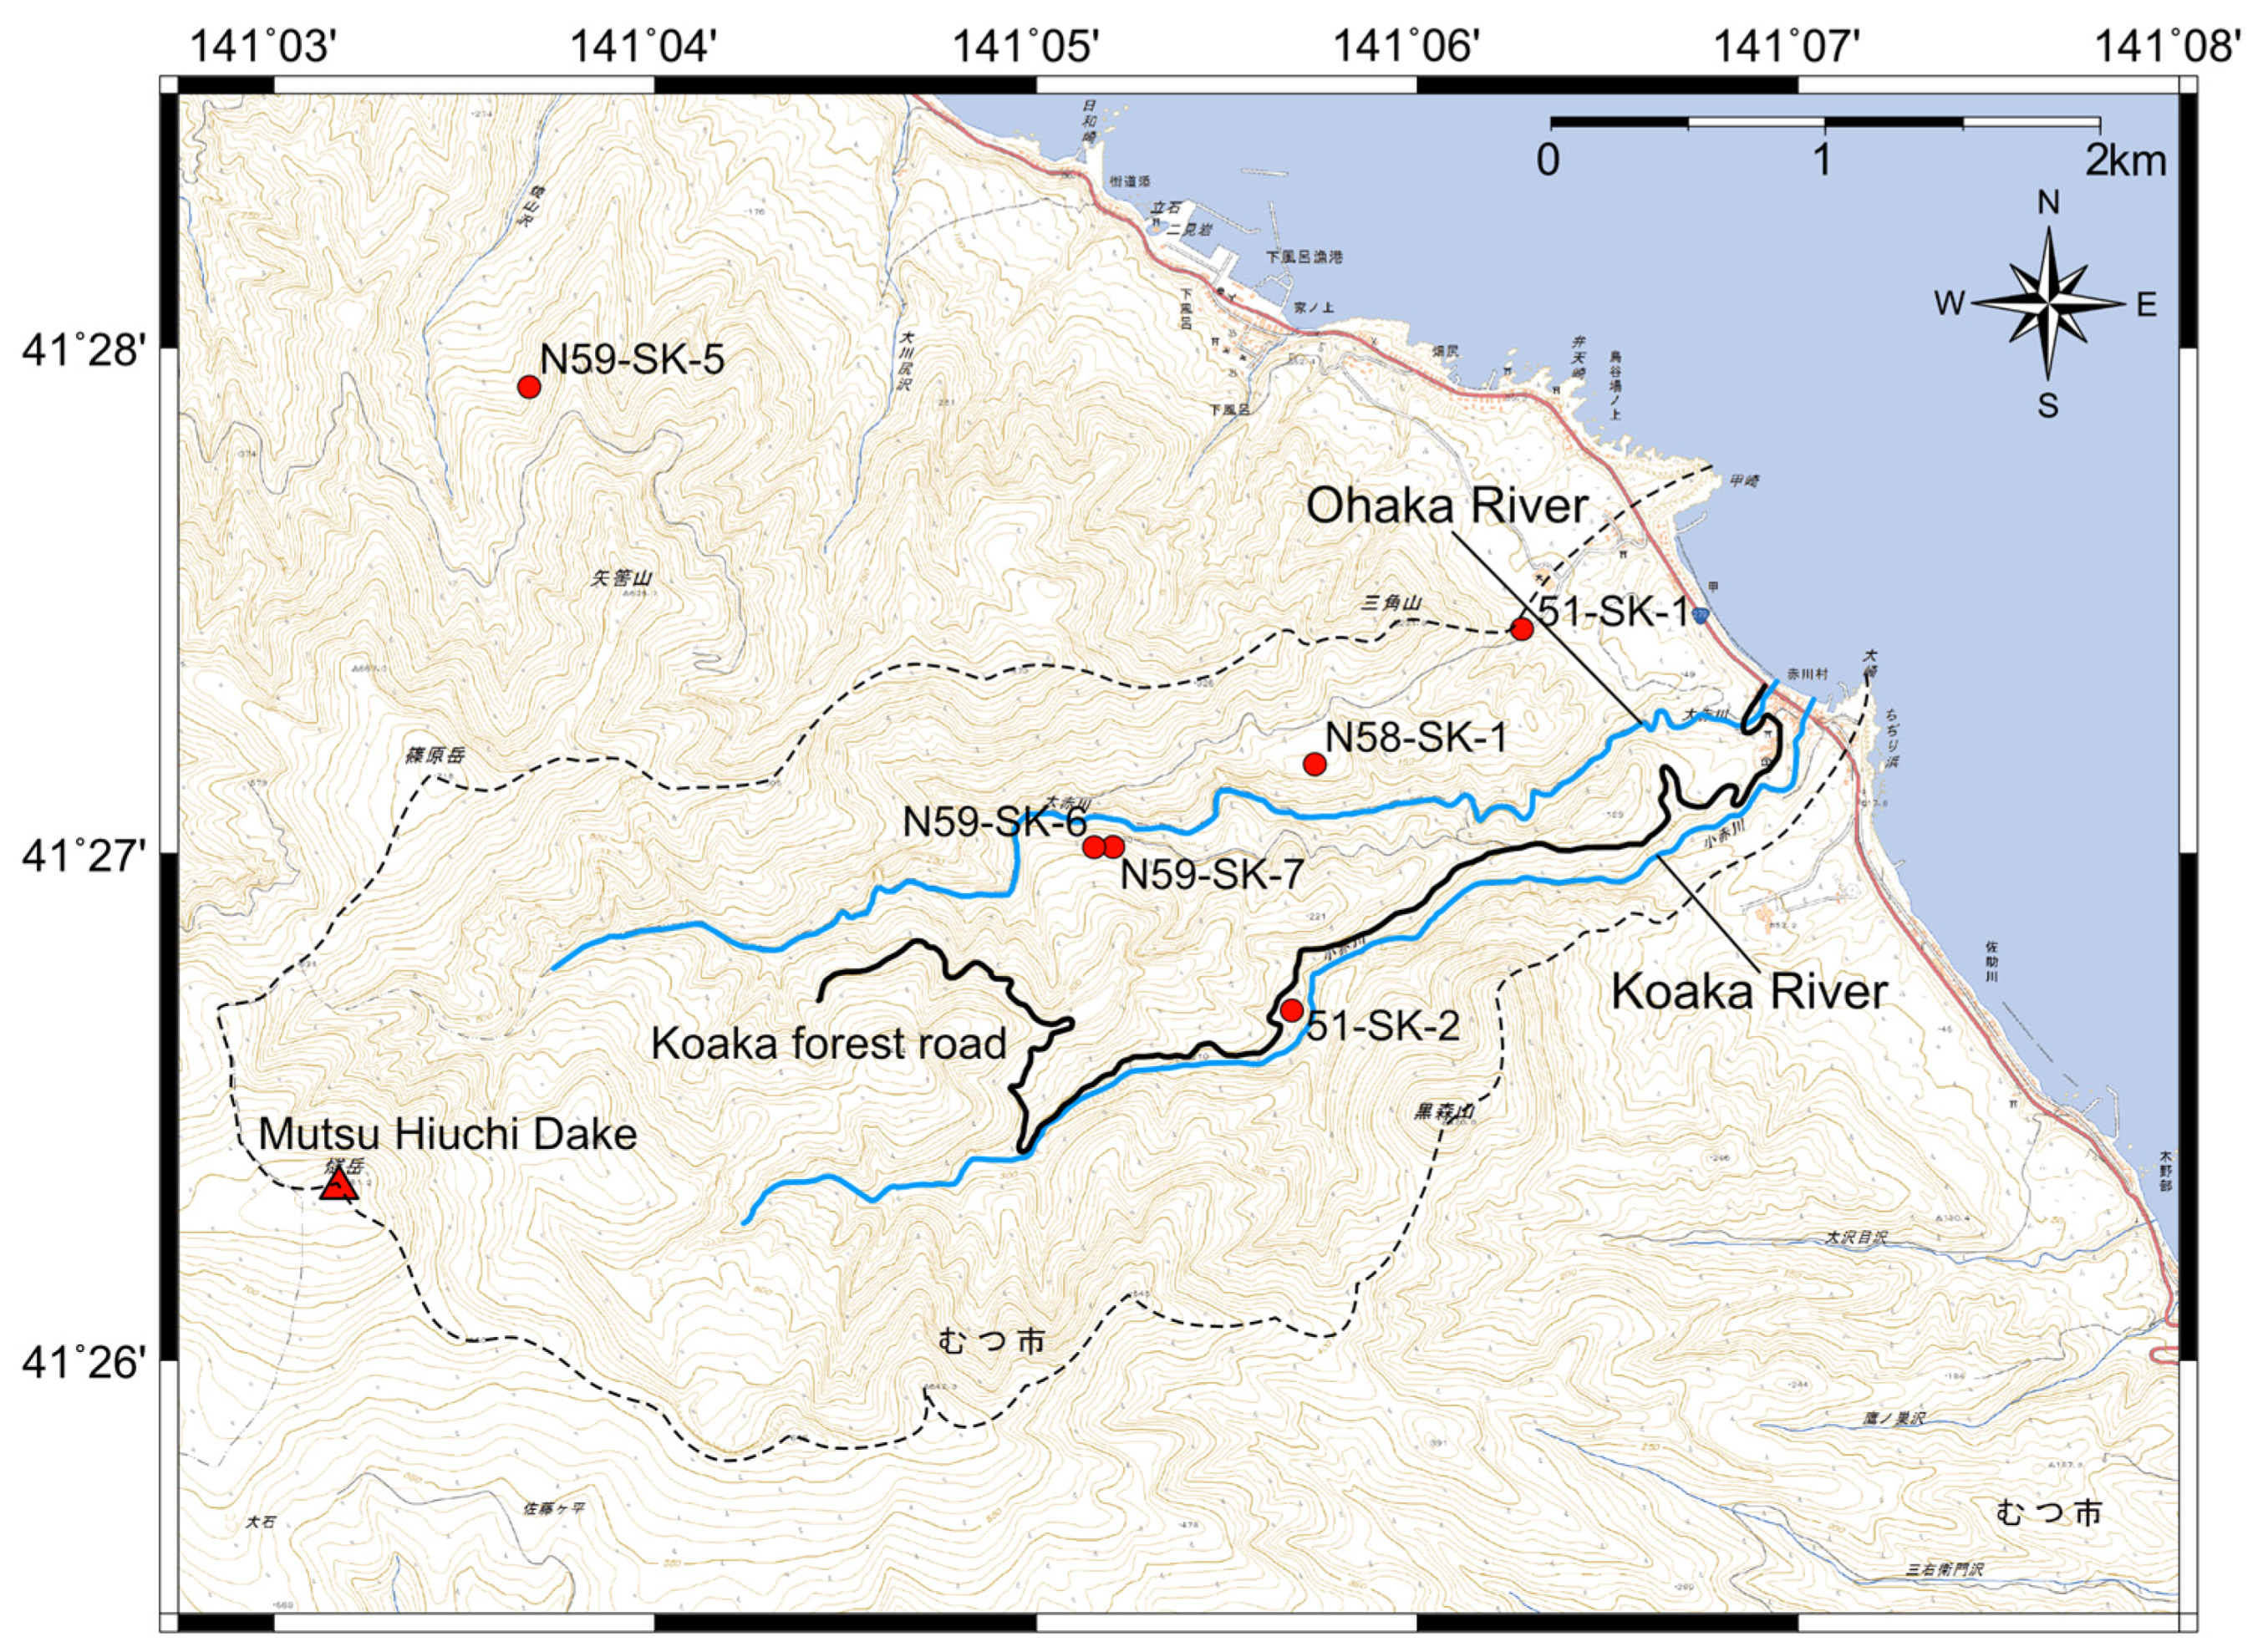
The Mutsu Hiuchi Dake volcano, which is the northernmost Quaternary volcano in Honshu, is a gently sloped stratovolcano with an elevation of 781.3 m, and the formation of the erosion caldera is likened to a horseshoe with an opening to the northeast [16]. The vicinity of Mutsu Hiuchi Dake volcano has been the subject of several surveys for geothermal development in 1975, 1976, and from 1983 to 1985, including multiple drillings for geothermal survey wells [17]. The highest recorded temperature of hot water was 228.5 °C at 1700 m depth within the well N59-SK-6 (Figure 2) [17]. The area was selected for the present study because it shows several signs of geothermal activity, such as alteration zones and fumaroles relating to hydrothermal alteration [17,18], and is therefore considered suitable for geothermal development. The area within the erosion caldera is subsequently referred to as the Mutsu Hiuchi Dake geothermal field. Water from steam condensation and hot water observed at N59-SK-6 both showed acidity, precipitation of minerals primarily consisting of sulfur and pyrite, and significant damage to the casing pipe was confirmed [17]. In order to successfully develop geothermal energy in the Mutsu Hiuchi Dake geothermal field, the most important task would be to discover a mature, neutral pH water reservoir to avoid corrosion and erosion of the well casing, pipe lines, and turbine.
3. The Discovery of Mutsu Hiuchi Dake East Slope Fault
A fault, which cuts across the Mutsu Hiuchi Dake geothermal field, was not known during the geothermal development survey conducted from 1983 to 1985, but was discovered by our surveys conducted in recent years (Figure 3) [19,20]. This fault is called the Mutsu Hiuchi Dake East Slope Fault. It is a normal fault that runs NNW–SSE and tilts to the east at a steep angle of 61° to 77°. The thickness of its foliated fault gouge reaches up to 4 m (Figure 3). Mutsu Hiuchi Dake East Slope Fault is located closer to the summit—and hence closer to the center of the heat source—than are the geothermal wells drilled during previous surveys (Figure 2 and Figure 3), which heightens the expectation that this location could be endowed with a geothermal resource of even higher temperature than those previously observed. Additionally, it is known that there are hydrothermal alteration zones relating to geothermal activities scattered across the Mutsu Hiuchi Dake geothermal field (Figure 3) [17,18]. Tomiyama et al. conducted detailed surveys of alteration zones in the Mutsu Hiuchi Dake geothermal field, and specified the distribution of silicified alteration zones (Figure 3) [18]. The sections displaying the greatest silicified alterations were located across the Koaka forest road and midstream areas of the Ohaka and Koaka rivers, coinciding with the location of the Mutsu Hiuchi Dake East Slope Fault. This finding indicates the possibility that the Mutsu Hiuchi Dake East Slope Fault had provided conduits for the rising of geothermal water. Furthermore, as the Mutsu Hiuchi Dake East Slope Fault displays the characteristics of a normal fault, it is expected to have relatively high permeability and high flow rate of geothermal water. Based on these points, there is a high chance that the Mutsu Hiuchi Dake East Slope Fault has formed a geothermal reservoir, and thus might be an important fault for geothermal development.
4. pH Distribution in Stream and Spring Water
To construct the distribution map, pH was measured at 46 points in stream water, 26 points in cold spring water, and three points in hot spring water within the Mutsu Hiuchi Dake geothermal field. Spring and stream water pH was determined at the sampling site using a temperature-compensated electronic portable pH meter (model HM-20P, DKK-TOA Co. (Tokyo, Japan); instrument accuracy ±0.02 pH). The pH electrode was calibrated with buffer solutions prepared from powder reagents of pH standard solutions with a pH accuracy of ±0.05 (Code No. 150-4 and 150-7, Horiba Ltd., Kyoto, Japan).
When measuring spring water pH, the electrode was dipped directly into the location from where the water was outflowing. Where there was insufficient water to dip the electrode directly, the pH was measured by collecting the water into a beaker, which was rinsed three times using the specific spring water present at each sampling site. When measuring stream pH, we selected spots closest to the source of the water where an actual flow could be seen, and measured by directly dipping the electrode into that water.
The pH values of the obtained samples are listed in Table 1, and the resulting pH distribution map is shown in Figure 4. The distribution map was created using GMT (Generic Mapping Tools 4.5.9), and the values were contoured by smoothing at 100-m intervals [21]. The tension factor was set to 0.3.
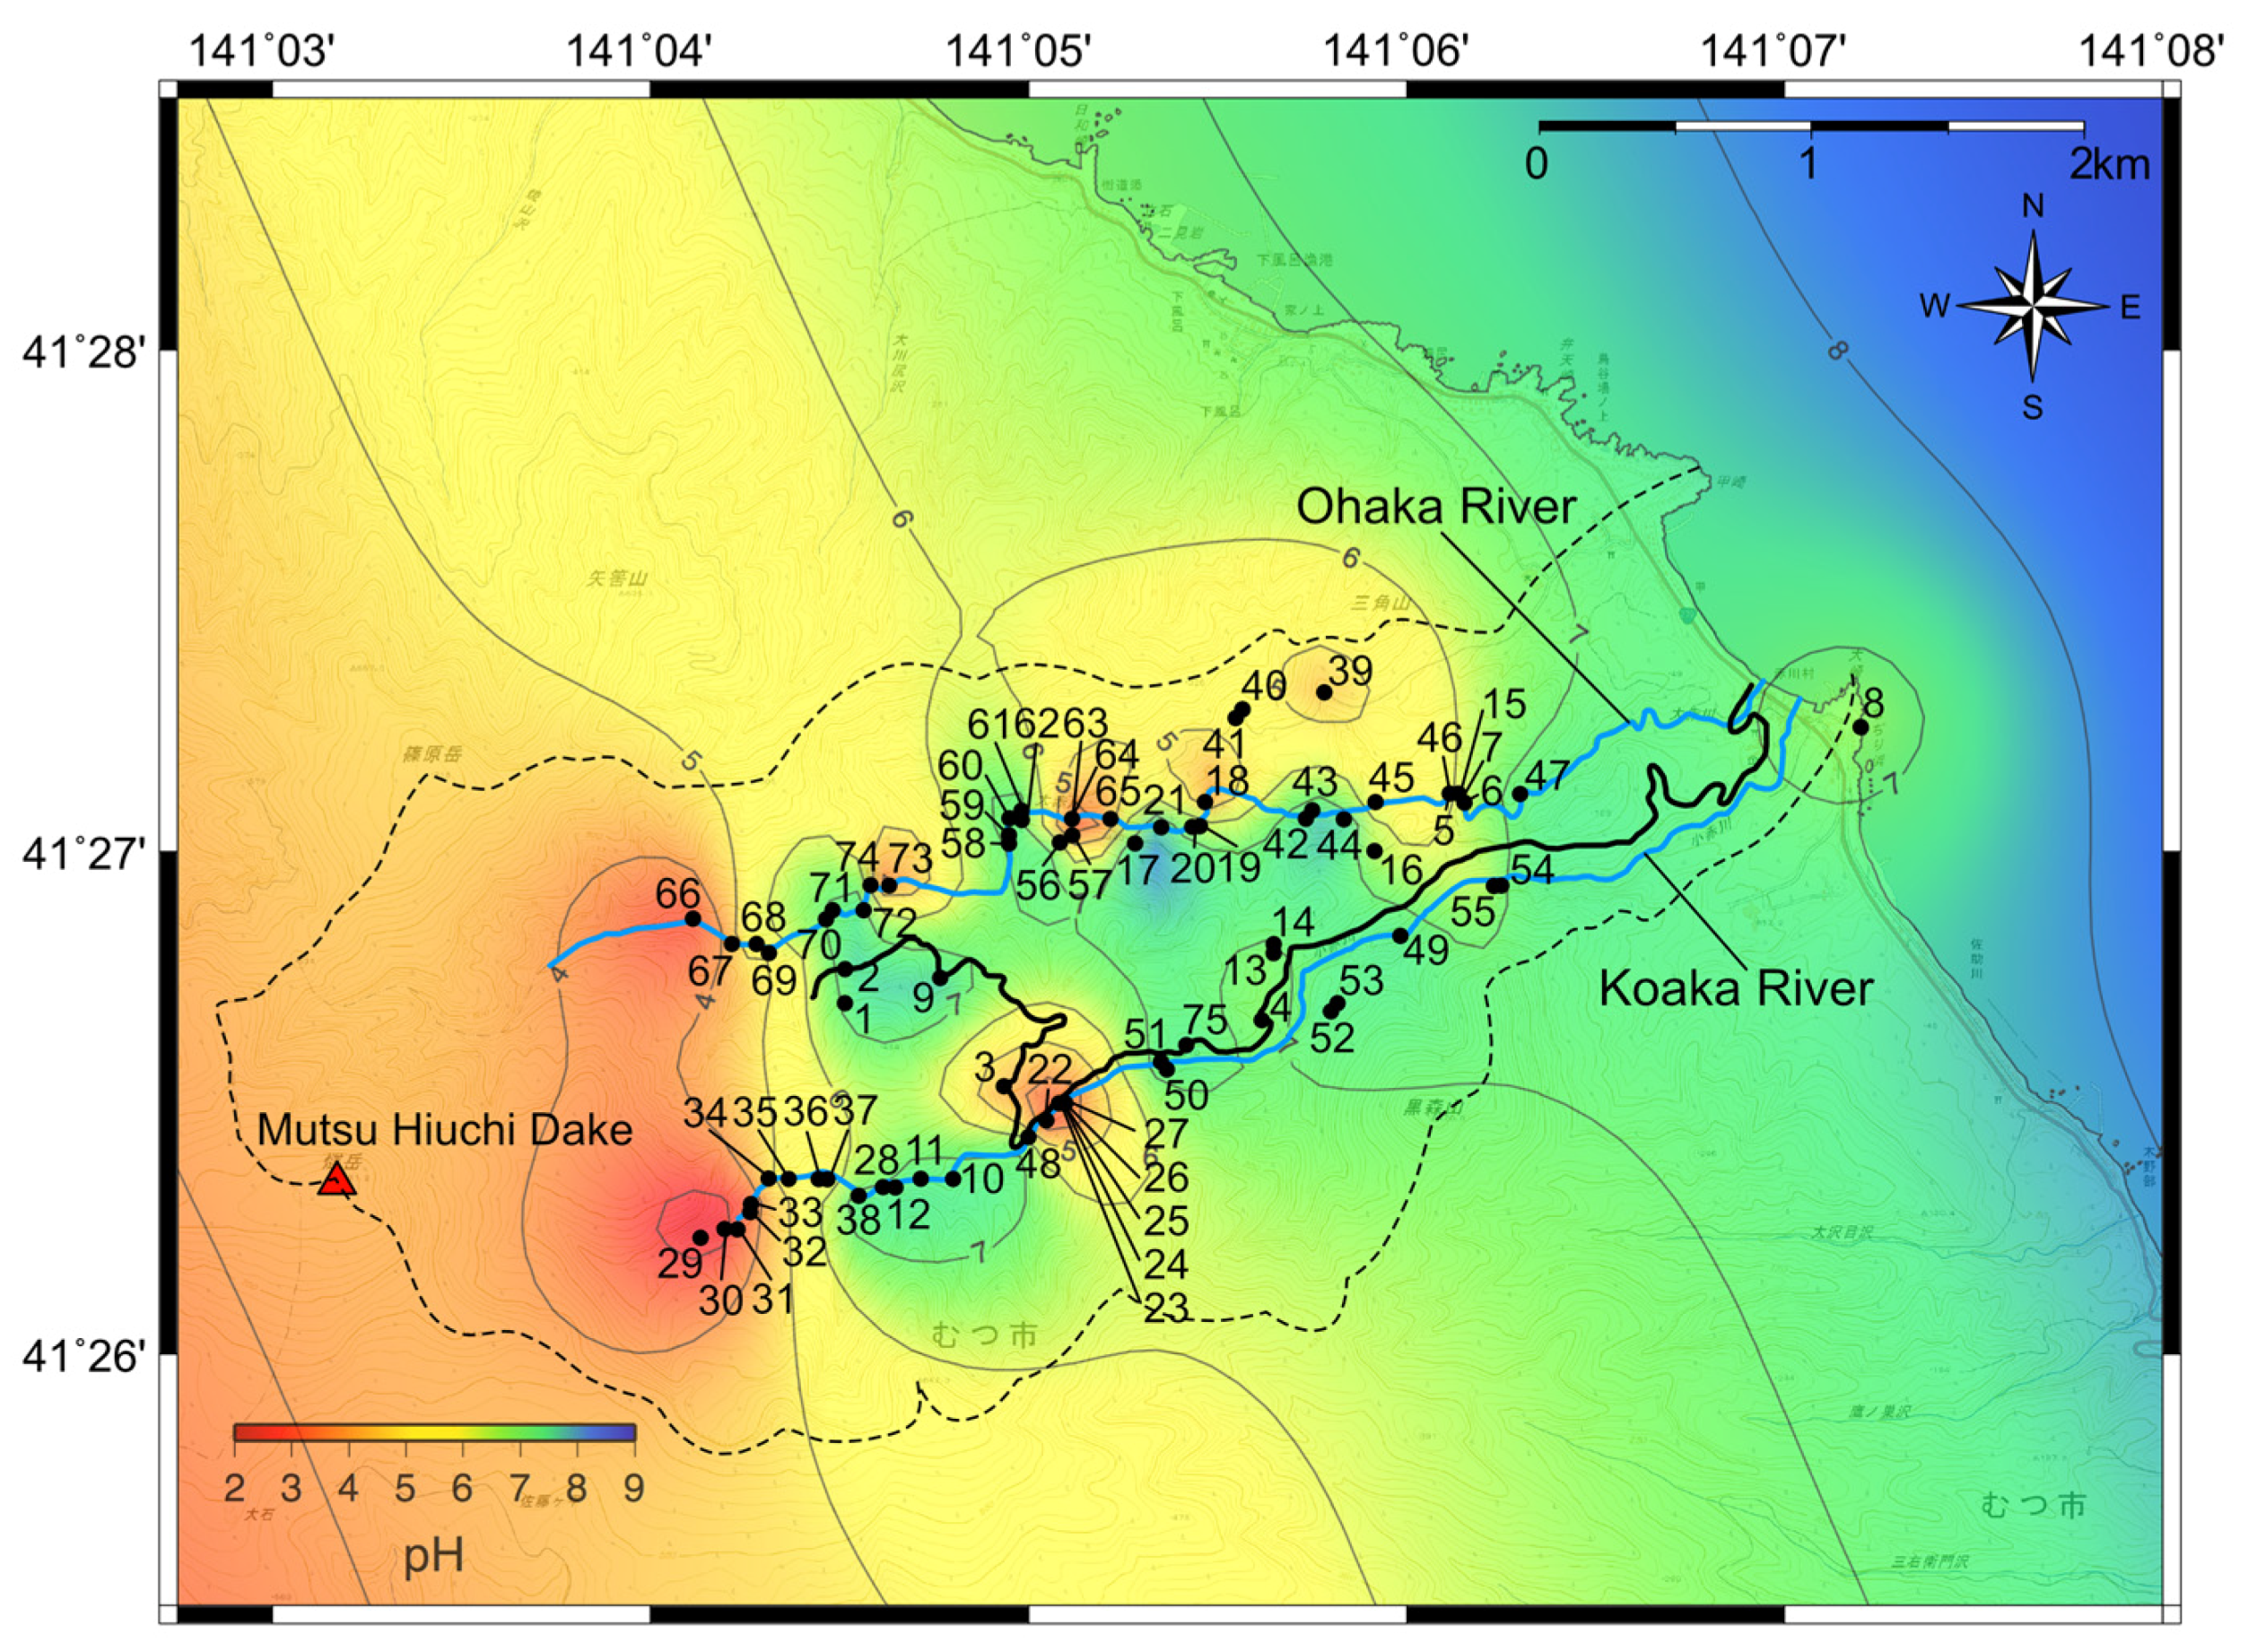
The pH ranged from 2.48 (site 62) to 7.85 (site 21). Points with low pH values were concentrated in the upstream areas of the Ohaka and Koaka rivers. In general, there was a tendency for pH levels to be lower closer to the summit of the volcano, and to increase at sites further from the summit.
5. Discussion: pH Mapping as a New Geothermal Exploration Method
The distribution map showed an overall tendency for lower pH closer to the summit, and higher pH further from the summit. In addition to the different types of fluids encountered in a high enthalpy geothermal system analyzed in Reference [22], the authors would like to propose the following interpretation to the observed surface waters pH distribution. Since volcanic gases actively rise near the summit (i.e., near the center of geothermal areas), fumaroles may appear at the ground surface, and volcanic gases dissolve into the stream water, thereby lowering the water pH. Conversely, with increasing distance from the summit, the effect of volcanic gases lessen and pH levels gradually increase. This is consistent with a widely accepted classical geothermal fluid structure model of high relief andesite volcanoes [7]. On the whole, the Mutsu Hiuchi Dake geothermal field appears to follow this general tendency in the actual pH map (Figure 4). However, the actual pH map exhibits a sporadic pattern (Figure 4), where some areas of lower pH and others of higher pH exist. All the patterns are controlled by the permeability distribution. Some permeable spots contribute to rising volcanic gases and other permeable spots contribute to hot water discharge and cold water recharge. The three-dimensional permeability distribution is extremely difficult to determine and, therefore, all pH variations could not be completely explained. However, a relatively wide neutral pH anomaly zone with pH ranging from 6.56 to 7.68 could be found near the midstream of the Ohaka and Koaka rivers, as seen in the data sampling points 1, 2, 9, 10, 11, 12, 28, 38, 70, 71, and 72, extending NNW–SSE. The locations of the neutral pH anomaly zone correspond to the Mutsu Hiuchi Dake East Slope Fault (Figure 5).
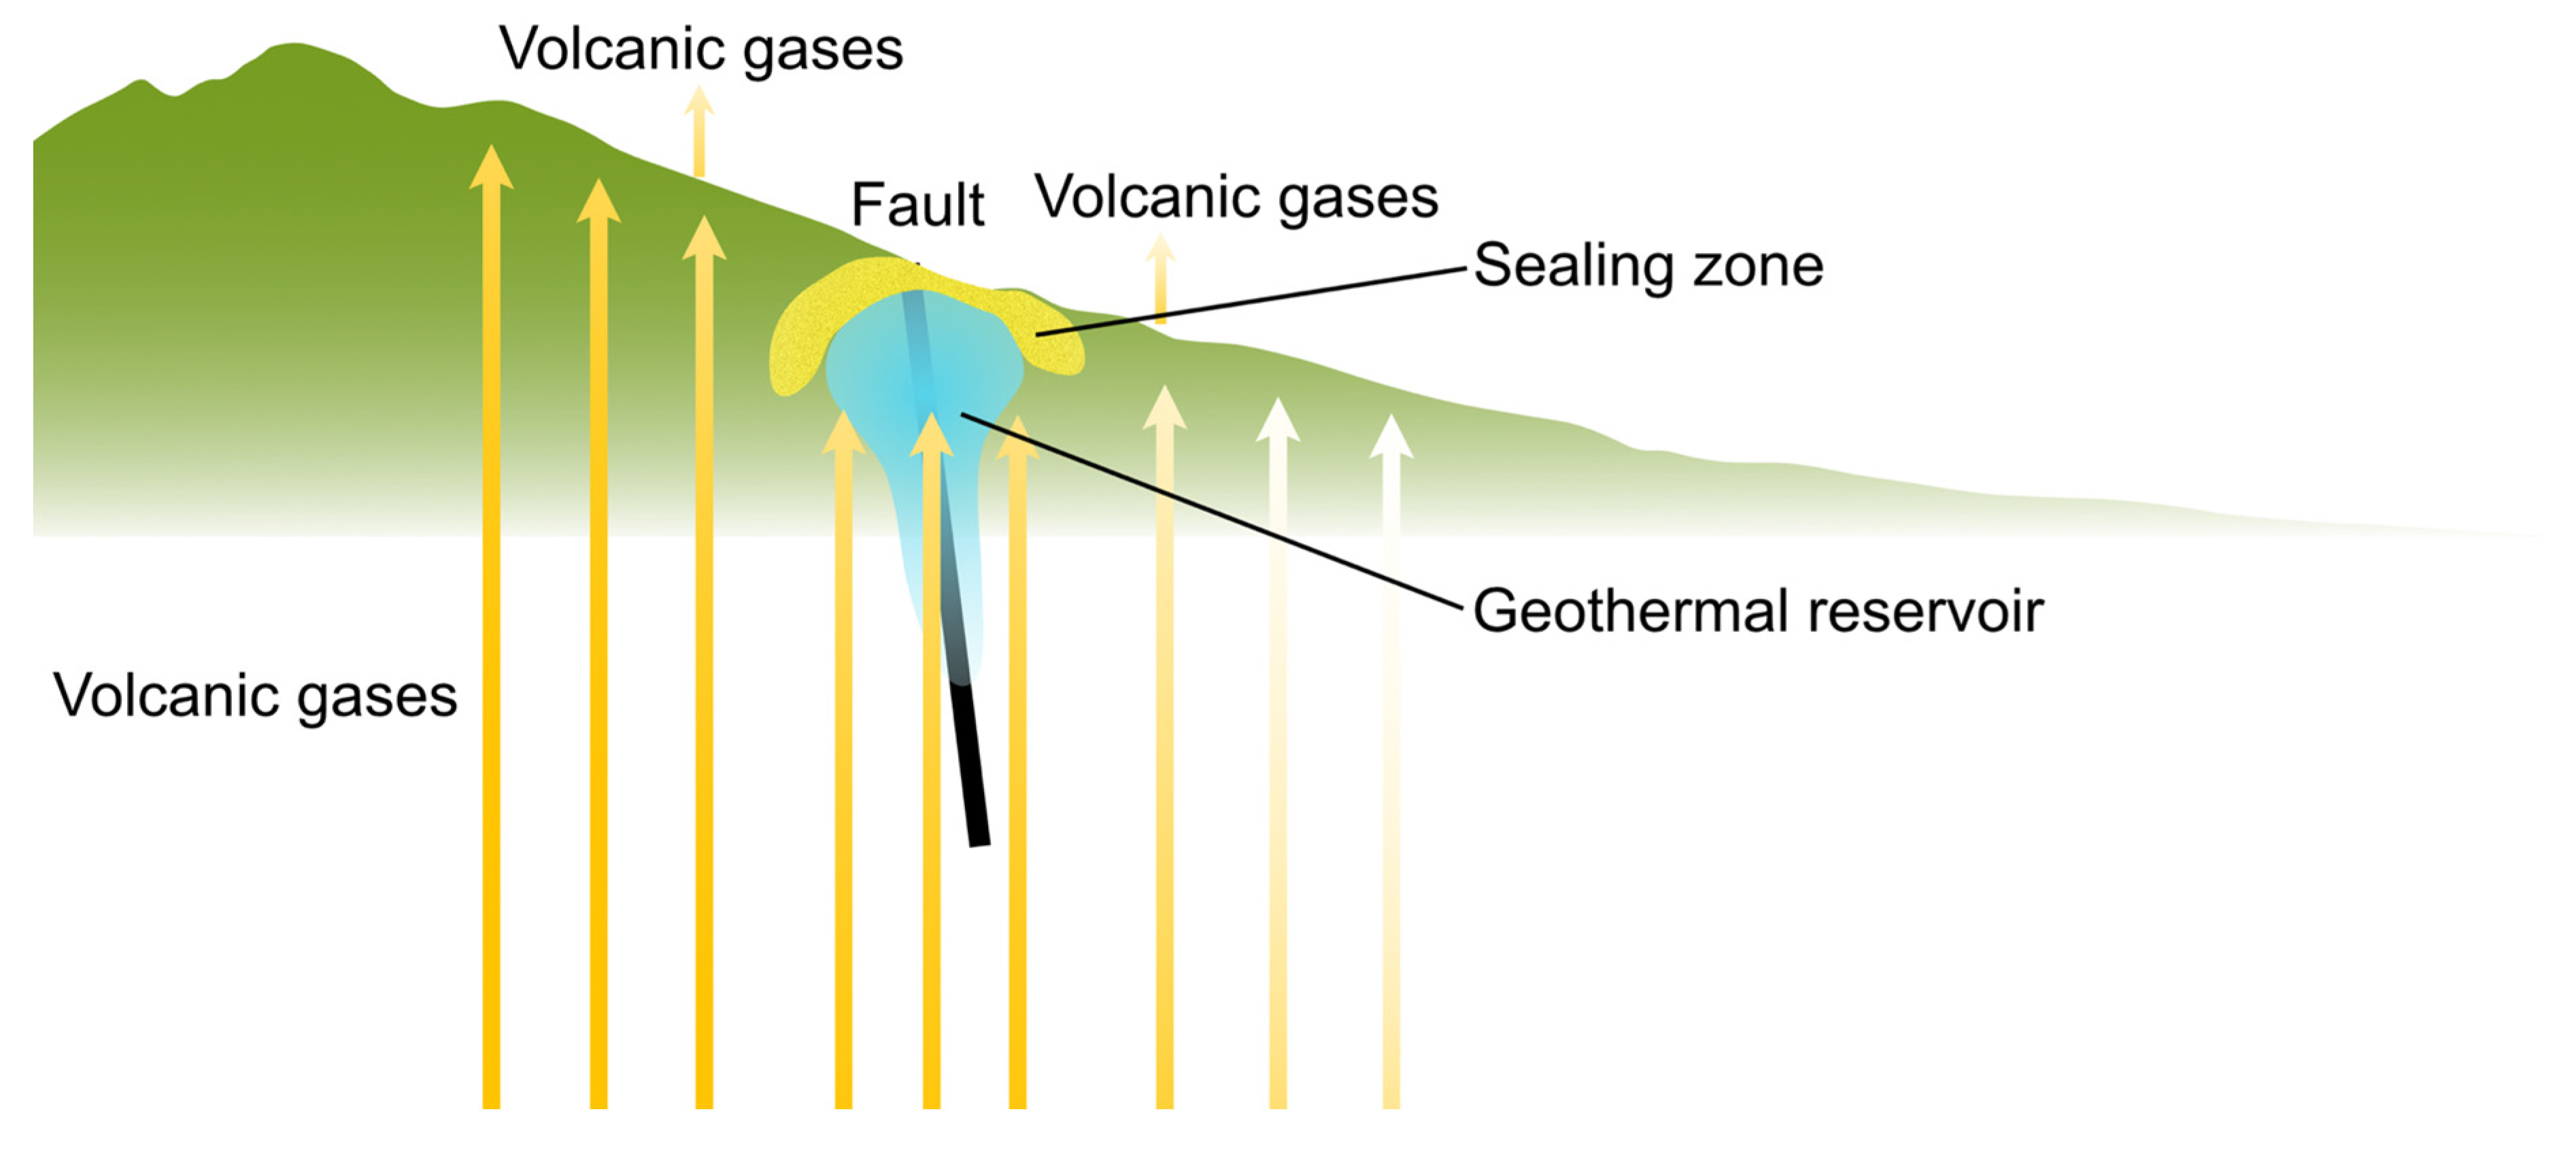
The locations of stream and spring water anomalies of higher pH coincided with the Mutsu Hiuchi Dake East Slope Fault, even near the summit of Mutsu Hiuchi Dake volcano. This can be explained by the shadow effect of rising volcanic gases due to the presence of a geothermal reservoir (Figure 6). If a geothermal reservoir exists underground, the volcanic gases rising from deep underground will not reach the surface because they will be trapped and dissolved into the geothermal water of the reservoir. Consequently, the overlying stream waters would be unaffected by the volcanic gases, and would instead retain the neutral state of surface water originating from rainwater and shallow groundwater, as it flows in from its vicinity, which appears as abnormal areas in terms of higher pH levels in contrast to the general trend observed in the area. Shimada [23] previously pointed out that, in areas where rising volcanic gases are identified, there is almost no chance of finding a geothermal reservoir deep underground because the voluminous hot water reservoir tends to feed the rising volcanic gases [23]. Therefore, the pH distribution map for stream water within the Mutsu Hiuchi Dake geothermal field might indicate the possibility that the Mutsu Hiuchi Dake East Slope Fault has formed a neutral, mature hydrothermal system underground.
In general, volcanic gases are indicators of active magmatism and therefore indicators of potential geothermal heat sources at the regional scale. However, at more detailed scales, such as those used during the reservoir exploration stage, shadow zones of volcanic gases are rather prospective indicators in terms of finding mature near-neutral pH chloride water reservoirs. In this study, a large-scale fault was fortunately found before the pH mapping was conducted. A more common exploration process might be to identify neutral pH anomalies first by pH mapping and then by determining objective permeable bodies, such as the fault identified here. Permeable bodies usually consist of faults, but columnar jointed sheets and dikes as well as fractured formations may also play a role in reservoirs.
Thus, these findings indicate that mapping the distribution of stream and spring water pH in a geothermal field could help to identify geothermal reservoirs containing neutral, high-temperature water suitable for geothermal development. In other geochemical exploration methods as represented by geothermometry, the sample collected from the sites would have to be brought back to the laboratory to be analyzed [5,6]. In contrast, the proposed method requires only a simple pH meter for on-site analysis, and is therefore temporally and economically efficient. Consequently, as a new geothermal exploration technique, the mapping of stream and spring water pH distribution would likely contribute to the promotion of geothermal development in inaccessible and remote regions.
6. Conclusions
The pH of stream and spring waters was measured at 75 sites within the Mutsu Hiuchi Dake geothermal field to create a pH distribution map. Overall, the results showed a trend toward lower pH near the summit, and higher pH further from the summit. However, in contrast to the overall trend, areas of abnormally higher pH were identified between the midstream of the Ohaka and Koaka rivers, extending in the NNE–SSW direction. These locations matched the Mutsu Hiuchi Dake East Slope Fault, which is suspected to have formed a geothermal reservoir underground. The findings indicate that mapping the pH distribution of stream and spring waters could serve as a new geothermal exploration method for estimating the locations of subsurface geothermal reservoirs. Because the proposed mapping technique is temporally and economically efficient compared to conventional methods, it might promote geothermal development, especially in regions where access is limited.
Acknowledgments
This work was supported by Grant-in-Aid for JSPS Fellows Grant No. 15J10106 and JSPS KAKENHI Grant No. 26281053. We thank Editage (www.editage.jp) for English language editing.
Author Contributions
Yota Suzuki is the principal investigator, and drafted the first manuscript and all the figures. Seiichiro Ioka advised on hydrology. Hirofumi Muraoka advised on geology. All authors carried out of field work, read and approved the final manuscript.
Conflicts of Interest
The authors declare no conflicts of interest.
References
- Bertani, R. Geothermal power generation in the world 2010–2014 update report. Geothermics 2016, 60, 31–43. [Google Scholar] [CrossRef]
- Publication Committee of Geothermal Energy Handbook of the Geothermal Research Society of Japan. Geothermal Energy Handbook; Ohmsha: Tokyo, Japan, 2014; p. 923. (In Japanese) [Google Scholar]
- Huenges, E. Geothermal Energy Systems: Exploration, Development, and Utilization; WILEY-VCH: Weinheim, Germany, 2010; p. 463. [Google Scholar]
- Glassley, W.E. Geothermal Energy: Renewable Energy and the Environment, 2nd ed.; CRC Press: Boca Raton, FL, USA, 2014; p. 381. [Google Scholar]
- Arnórsson, S. Isotopic and Chemical Techniques in Geothermal Exploration, Development and Use: Sampling Methods, Data Handling, Interpretation; International Atomic Energy Agency: Vienna, Austria, 2000; p. 351. [Google Scholar]
- Arnórsson, S. Geochemistry and geothermal resources in Iceland. In Application of Geochemistry in Geothermal Reservoir Development; UNITAR and UNDP: Rome, Italy, 1991; pp. 145–196. [Google Scholar]
- Heneley, R.W.; Ellis, A.J. Geothermal systems, ancient and modern. Earth Sci. Rev. 1983, 19, 1–50. [Google Scholar] [CrossRef]
- Rosell, J.B.; Tamboboy, R.J.T.; Sambrano, B.G.; Dacillo, D.B.; Reed, M.H. Mt. Apo fluid evolution: Exploring the role of rock buffers in the reservoir pH changes with time. In Proceedings of the World Geothermal Congress 2015, Melbourne, Australia, 19–25 April 2015; pp. 1–7. [Google Scholar]
- Muraoka, H.; Sakaguchi, K.; Tamanyu, S.; Sasaki, M.; Shigeno, H.; Mizugaki, K. Atlas of Hydrothermal Systems in Japan; Geological Survey of Japan, AIST: Tsukuba, Japan, 2007; p. 110. (In Japanese) [Google Scholar]
- Giggenbach, W.F. Geothermal solute equilibria: Derivation of Na-K-Mg-Ca geoindicators. Geochimica et Cosmochimica Acta 1988, 52, 2749–2765. [Google Scholar] [CrossRef]
- Arnórsson, S. Processes influencing the pH of geothermal waters. In Proceedings of the World Geothermal Congress 1995, Firenze, Italy, 18–31 May 1995; pp. 657–962. [Google Scholar]
- Muraoka, H. Summary of the heat source distribution investigation. In Trend and Development Technology of Geothermal Power; Science and Technology: Tokyo, Japan, 2011; pp. 125–137. (In Japanese) [Google Scholar]
- Geological Survey of Japan, AIST. Volcanoes of Japan, 3rd ed.; Geological Survey of Japan, AIST: Tsukuba, Japan, 2013. (In Japanese) [Google Scholar]
- Suzuki, Y.; Ioka, S.; Muraoka, H. Determining the maximum depth of hydrothermal circulation using geothermal mapping and seismicity to delineate the depth to brittle-plastic transition in northern Honshu, Japan. Energies 2014, 7, 3503–3511. [Google Scholar] [CrossRef]
- Suzuki, Y.; Ioka, S.; Muraoka, H. Comparative study of the subsurface thermal structure in northern Honshu, Japan, based on normalized temperature data and solute geothermometers. Energies 2016, 9, 382. [Google Scholar] [CrossRef]
- Uemura, F.; Saito, M. 1:50,000 Geological Map of Japan, Ohata with Explanatory Text; Geological Survey of Japan: Tokyo, Japan, 1957; p. 31. (In Japanese) [Google Scholar]
- New Energy Development Organization (NEDO). Report of Geothermal Development Promotion Survey No. 9, Shimokita Region; New Energy Organization (NEDO): Kawasaki, Japan, 1986; p. 688. (In Japanese) [Google Scholar]
- Tomiyama, S.; Umeda, K.; Hanamuro, T.; Takashima, I.; Hayashi, S.; Negishi, Y.; Masudome, Y. Alteration type and thermoluminescence ages of altered rocks in the Mutsu-Hiuchidake volcanic field, Shimokita peninsula, NE Japan. Rocks Miner. Sci. (Ganseki Koubutsu Kagaku) 2007, 36, 111–121. (In Japanese) [Google Scholar] [CrossRef]
- Muraoka, H.; Suzuki, Y.; Ioka, S.; Mikami, A.; Kato, K.; Matsuda, M. Finding the Hiuchidake East Slope Fault in Mutsu Hiuchidake Volcano and its significance to the future geothermal exploitation. In Proceedings of the 2014 Annual Meeting Geothermal Research Society of Japan, Hirosaki, Japan, 29–31 October 2014. (In Japanese). [Google Scholar]
- Suzuki, Y.; Matsuda, M.; Ioka, S.; Muraoka, H. Structural and geothermal geology on the Hiuchi-dake East Slope Fault in Shimokita Peninsula, Japan. In Proceedings of the 2015 Annual Meeting Geothermal Research Society of Japan, Beppu, Japan, 21–23 October 2015. (In Japanese). [Google Scholar]
- Wessel, P.; Smith, W.H.F. New, improved version of the Generic Mapping Tools released. Eos Trans. Am. Geophys. Union 1998, 79, 579. [Google Scholar] [CrossRef]
- Henley, R.W. Chemical structure of geothermal systems. In Fluid-Mineral Equilibria in Hydrothermal Systems, Reviews in Economic Geology; Robertson, J.M., Ed.; Society of Economic Geologists: Littleton, CO, USA, 1984; Volume 1, pp. 9–30. [Google Scholar]
- Shimada, K. Geochemical modeling (Geochemistry for Geothermal Development). Chinetsu 2000, 3, 36–56. (In Japanese) [Google Scholar]
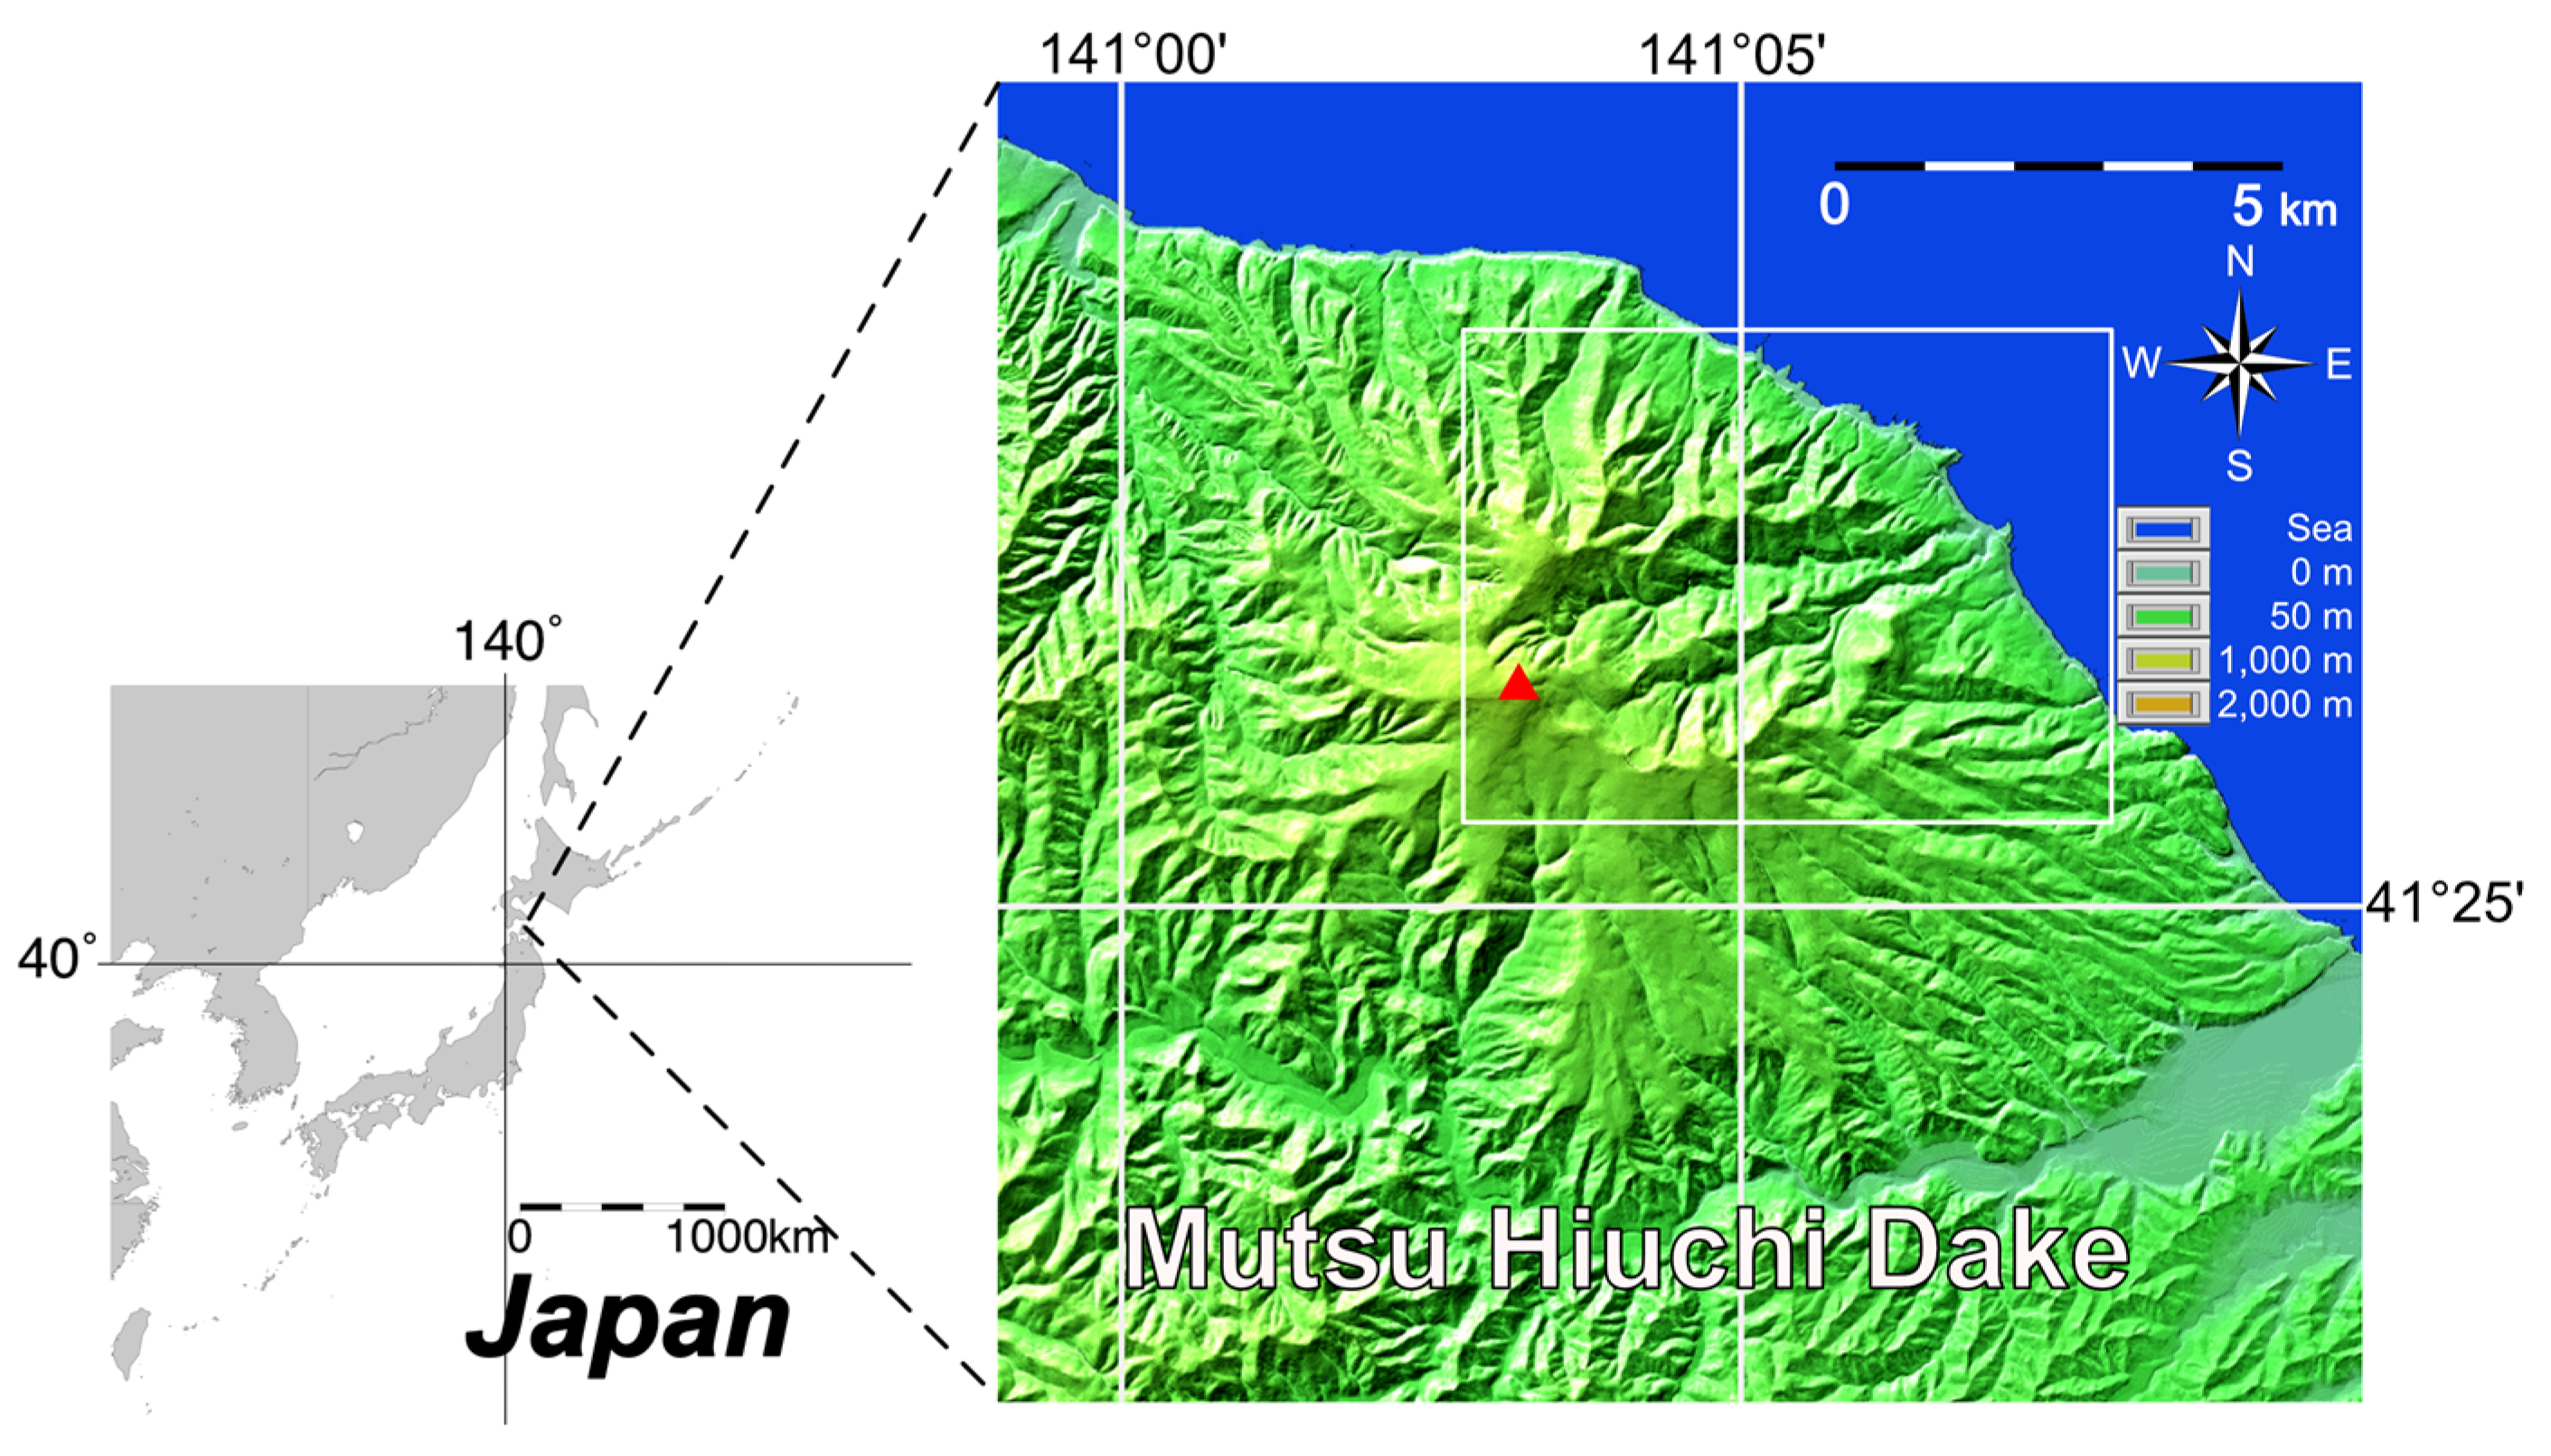
Figure 1.
The location of Mutsu Hiuchi Dake volcano in Japan, and a schematic map of the terrain; the red triangle indicates the summit of Mutsu Hiuchi Dake volcano. The white square indicates the location shown in Figure 2, Figure 3, Figure 4 and Figure 5. This map employs the Geospatial Information Authority of Japan’s base map information for numerical elevation model (10 m mesh).

Figure 2.
Topographic map of Mutsu Hiuchi Dake geothermal field: The red triangle indicates the summit of the Mutsu Hiuchi Dake volcano, and the red circles indicate geothermal wells drilled in previous surveys. The dotted lines represent the erosion caldera as mapped by Uemura and Saito [16]. In creating this map, the 1:25,000 scale map (of Shimofuro) published by the Geospatial Information Authority of Japan was used.

Figure 3.
Top: Map showing the location of the Mutsu Hiuchi Dake East Slope Fault. The yellow circle indicates the location of silicified alteration zones as indicated by Tomiyama et al. [18]. The red triangle shows the location of the summit of Mutsu Hiuchi Dake volcano. The dotted lines represent the erosion caldera as mapped by Uemura and Saito [16]. In creating this map, the 1:25,000 scale map (of Shimofuro) published by the Geospatial Information Authority of Japan was used. Bottom: Photograph of the fault outcrop, its location is marked with a yellow star in the map above. The scale of the photo is indicated by the hammer and the yellow 1 m ruler in the lower-central portion of the photo. A 4-m thick foliated fault gouge is observed between arrows.
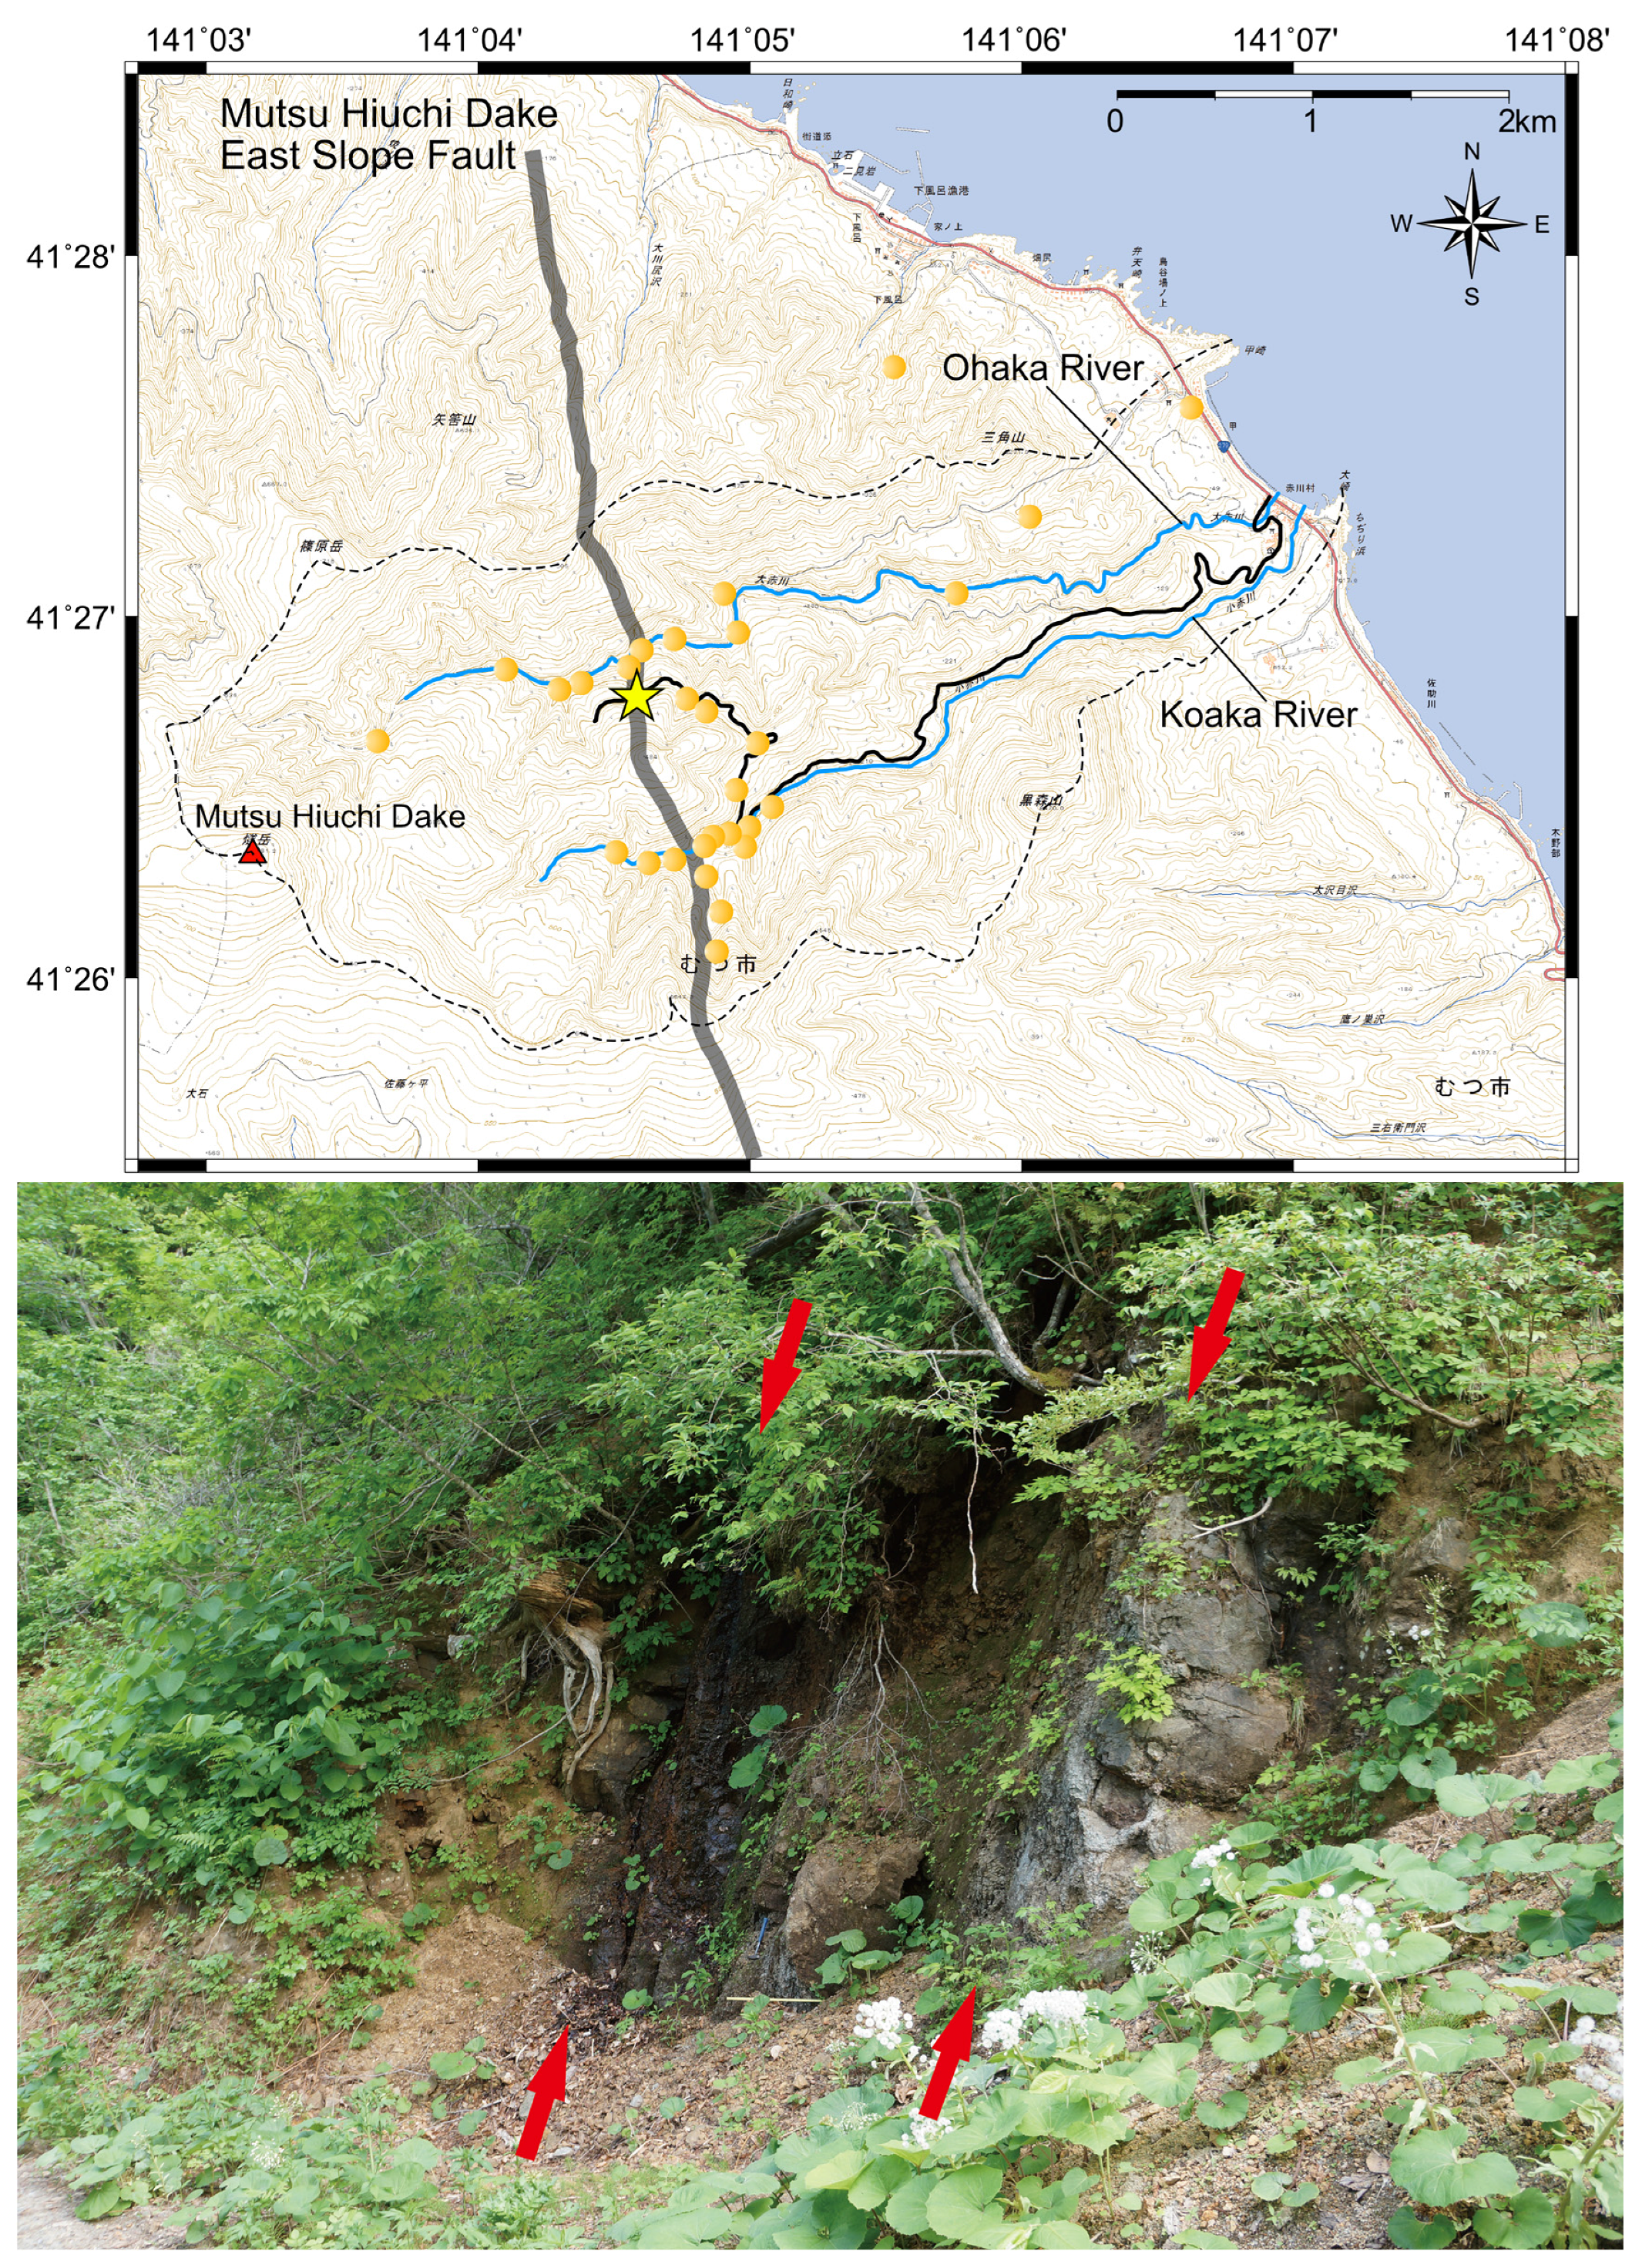
Figure 4.
Distribution map of water pH in the Mutsu Hiuchi Dake geothermal field. The red triangle indicates the summit of the Mutsu Hiuchi Dake volcano. The black circles indicate data sampling points, and their numbers correspond to those in Table 1. The dotted lines represent the erosion caldera as mapped by Uemura and Saito [16]. In creating this map, the 1:25,000 scale map (of Shimofuro) published by the Geospatial Information Authority of Japan was used.

Figure 5.
The pH distribution of stream and spring water in the Mutsu Hiuchi Dake geothermal field and the Mutsu Hiuchi Dake East Slope Fault. The red triangle indicates the summit of Mutsu Hiuchi Dake volcano. The dotted lines represent the erosion caldera as mapped by Uemura and Saito [16]. In creating this map, the 1:25,000 scale map (of Shimofuro) published by the Geospatial Information Authority of Japan was used.
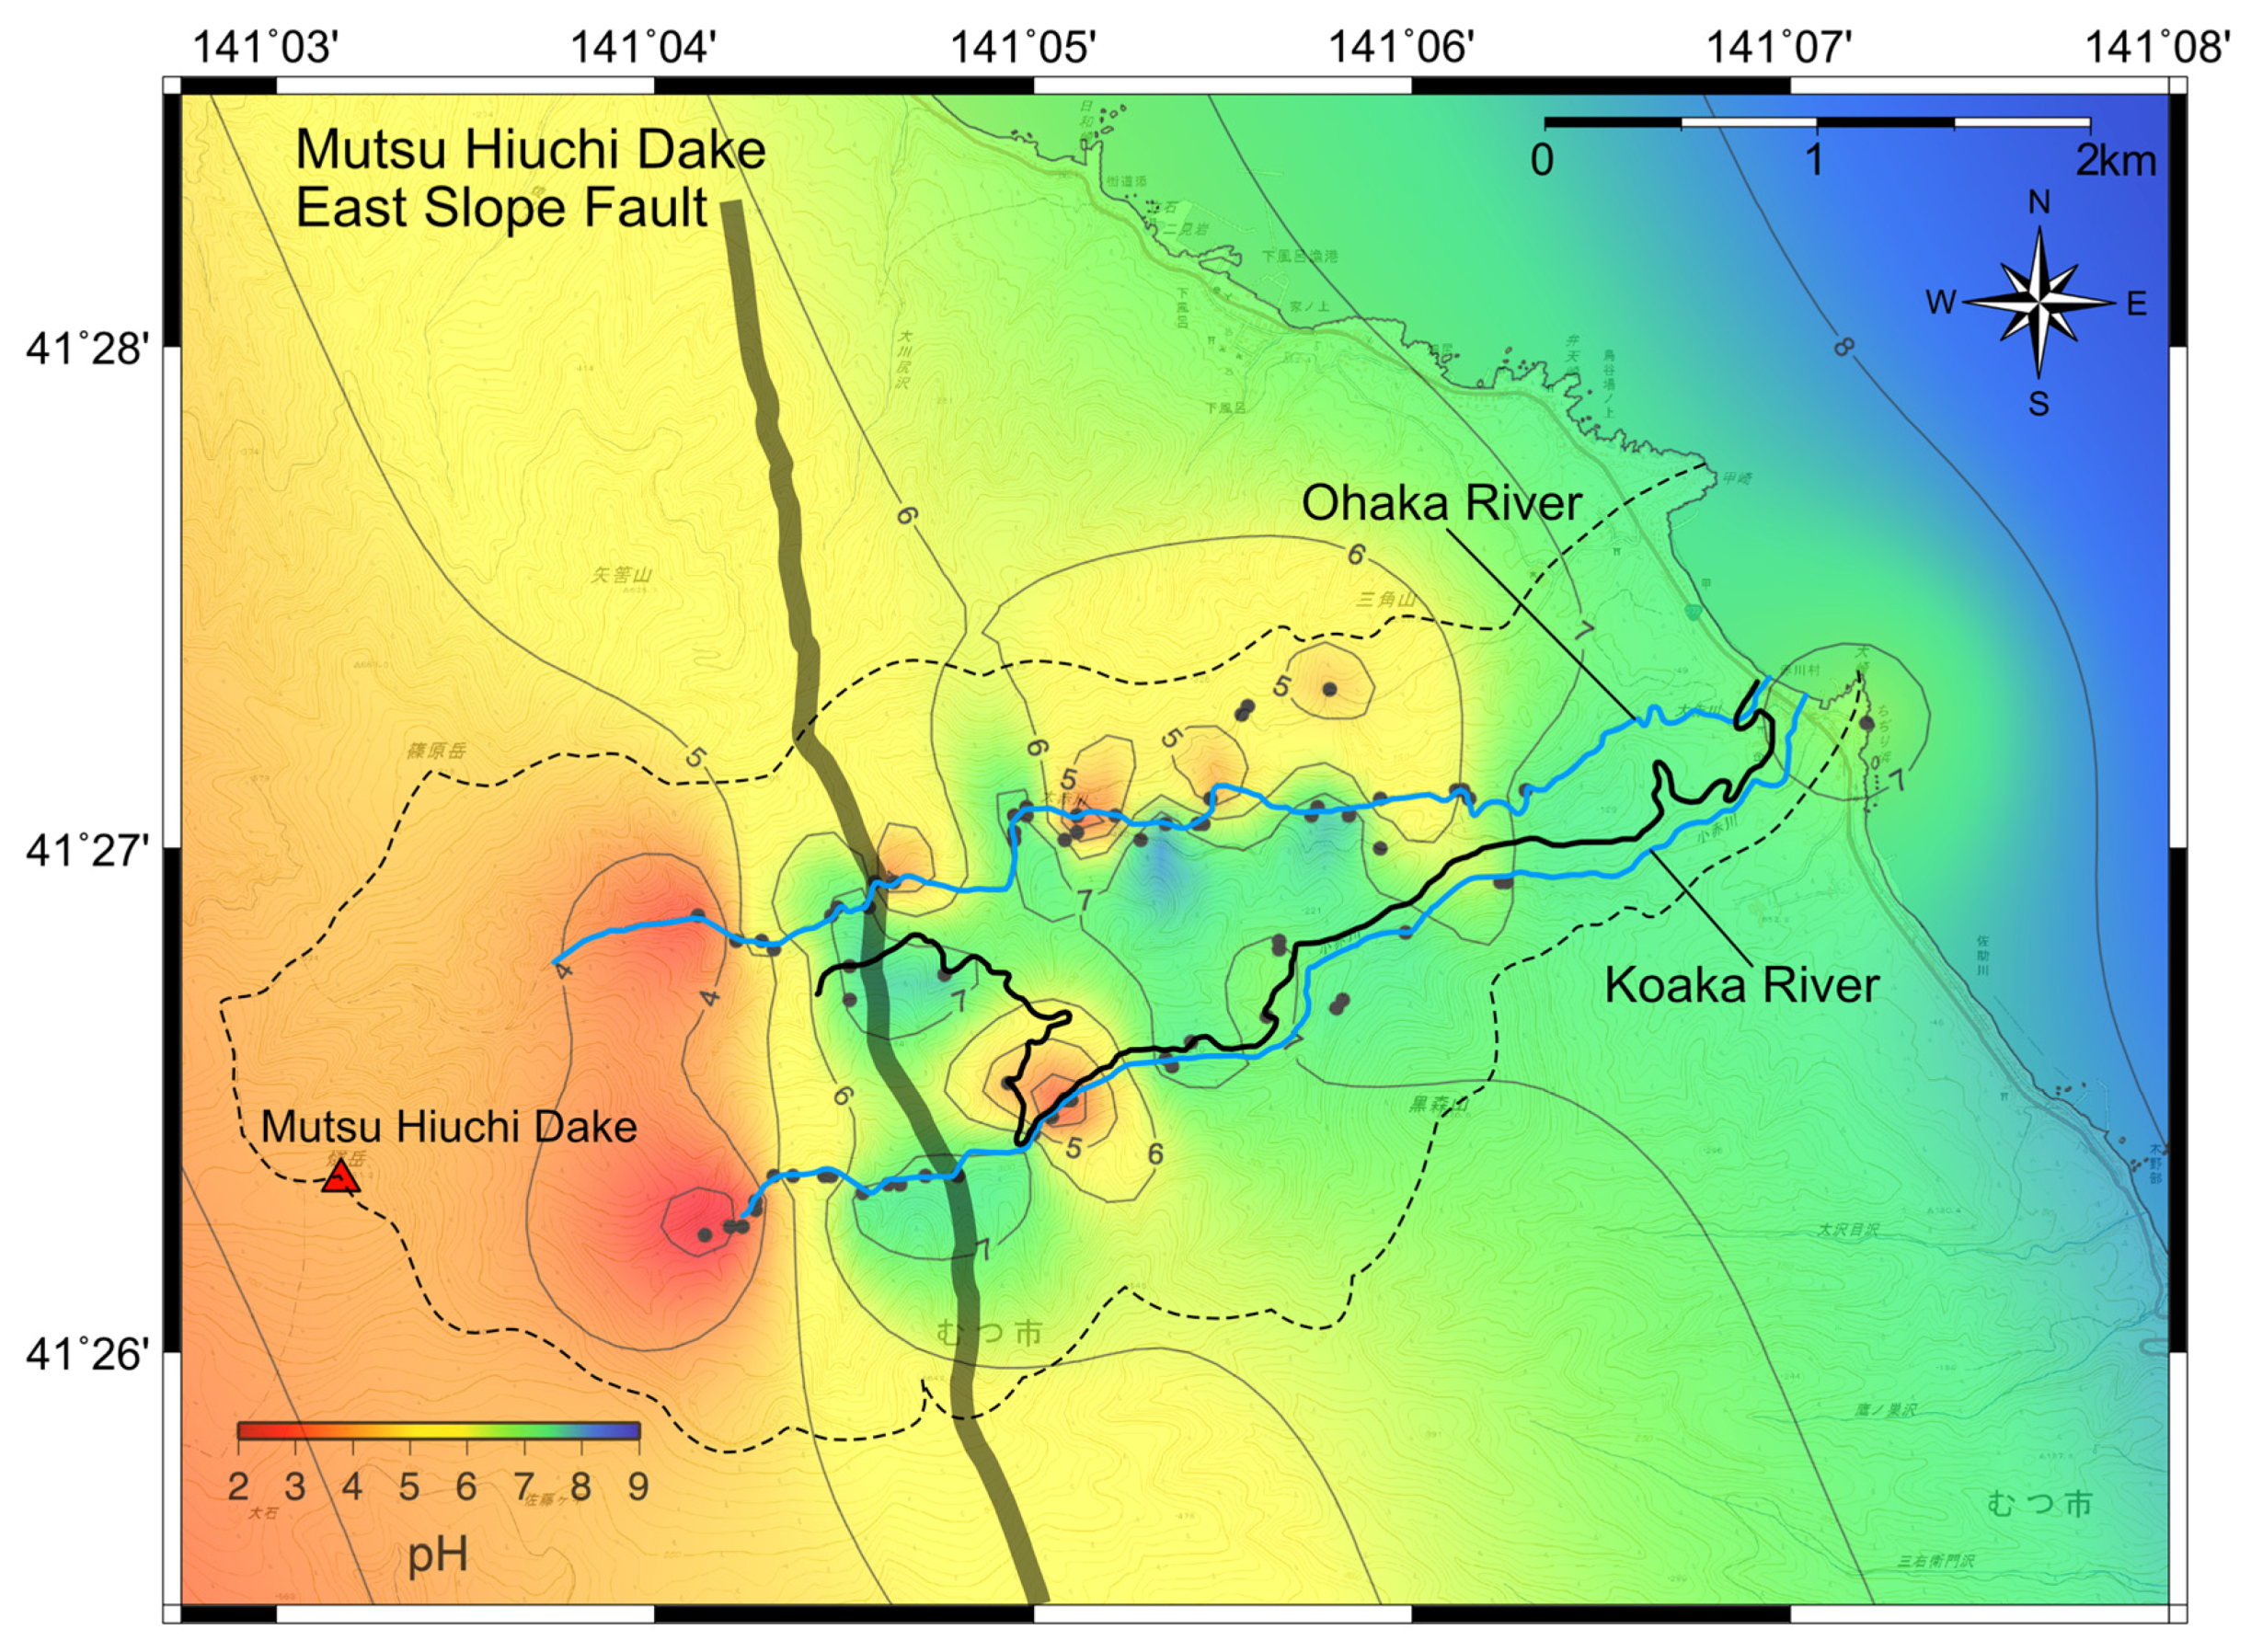
Figure 6.
Schematic diagram of the shadow effect of volcanic gases due to the geothermal reservoir.


Table 1.
Water samples obtained in the Mutsu Hiuchi Dake geothermal field: Sample number, water type, sampling date, site location, and water pH.
Table 1.
Water samples obtained in the Mutsu Hiuchi Dake geothermal field: Sample number, water type, sampling date, site location, and water pH.
| No. | Water Type | Sampling Date | Longitude | Latitude | pH |
|---|---|---|---|---|---|
| 1 | Spring water | 3 June 2014 | 141°4′31′′ E | 41°26′42′′ N | 7.39 |
| 2 | Stream water | 3 June 2014 | 141°4′31′′ E | 41°26′46′′ N | 7.49 |
| 3 | Stream water | 3 June 2014 | 141°4′56′′ E | 41°2°6′32′′ N | 3.95 |
| 4 | Stream water | 3 June 2014 | 141°5′37′′ E | 41°26′40′′ N | 6.69 |
| 5 | Hot Spring | 25 November 2015 | 141°6′8′′ E | 41°27′7′′ N | 6.03 |
| 6 | Hot Spring | 4 June 2014 | 141°6′9′′ E | 41°27′6′′ N | 6.05 |
| 7 | Hot Spring | 4 June 2014 | 141°6′9′′ E | 41°27′6′′ N | 6.08 |
| 8 | Spring water | 20 August 2014 | 141°7′12′′ E | 41°27′15′′ N | 6.44 |
| 9 | Stream water | 30 July 2015 | 141°4′46′′ E | 41°26′45′′ N | 7.68 |
| 10 | Stream water | 3 August 2015 | 141°4′48′′ E | 41°26′21′′ N | 7.34 |
| 11 | Stream water | 3 August 2015 | 141°4′43′′ E | 41°26′21′′ N | 7.40 |
| 12 | Spring water | 3 August 2015 | 141°4′39′′ E | 41°26′20′′ N | 6.56 |
| 13 | Stream water | 3 August 2015 | 141°5′39′′ E | 41°26′48′′ N | 6.78 |
| 14 | Stream water | 3 August 2015 | 141°5′39′′ E | 41°26′49′′ N | 7.02 |
| 15 | Stream water | 4 August 2015 | 141°6′8′′ E | 41°27′7′′ N | 7.56 |
| 16 | Stream water | 28 August 2015 | 141°5′55′′ E | 41°26′60′′ N | 6.36 |
| 17 | Stream water | 28 August 2015 | 141°5′17′′ E | 41°27′1′′ N | 7.70 |
| 18 | Spring water | 14 September 2015 | 141°5′28′′ E | 41°27′6′′ N | 4.13 |
| 19 | Spring water | 14 September 2015 | 141°5′27′′ E | 41°27′3′′ N | 6.75 |
| 20 | Spring water | 14 September 2015 | 141°5′26′′ E | 41°27′3′′ N | 6.43 |
| 21 | Stream water | 14 September 2015 | 141°5′21′′ E | 41°27′3′′ N | 7.85 |
| 22 | Spring water | 26 April 2016 | 141°5′3′′ E | 41°26′28′′ N | 3.27 |
| 23 | Stream water | 26 April 2016 | 141°5′6′′ E | 41°26′30′′ N | 3.09 |
| 24 | Spring water | 26 April 2016 | 141°5′5′′ E | 41°26′30′′ N | 5.69 |
| 25 | Spring water | 26 April 2016 | 141°5′5′′ E | 41°26′30′′ N | 2.97 |
| 26 | Spring water | 26 April 2016 | 141°5′5′′ E | 41°26′30′′ N | 3.42 |
| 27 | Spring water | 26 April 2016 | 141°5′6′′ E | 41°26′30′′ N | 3.67 |
| 28 | Stream water | 27 April 2016 | 141°4′37′′ E | 41°26′20′′ N | 7.40 |
| 29 | Spring water | 27 April 2016 | 141°4′8′′ E | 41°26′14′′ N | 2.63 |
| 30 | Spring water | 27 April 2016 | 141°4′12′′ E | 41°26′15′′ N | 2.73 |
| 31 | Spring water | 27 April 2016 | 141°4′14′′ E | 41°26′15′′ N | 3.35 |
| 32 | Spring water | 27 April 2016 | 141°4′16′′ E | 41°26′17′′ N | 3.05 |
| 33 | Stream water | 27 April 2016 | 141°4′16′′ E | 41°26′18′′ N | 3.59 |
| 34 | Spring water | 27 April 2016 | 141°4′19′′ E | 41°26′21′′ N | 7.02 |
| 35 | Spring water | 27 April 2016 | 141°4′22′′ E | 41°26′21′′ N | 3.38 |
| 36 | Spring water | 19 May 2016 | 141°4′27′′ E | 41°26′21′′ N | 3.44 |
| 37 | Stream water | 19 May 2016 | 141°4′28′′ E | 41°26′21′′ N | 7.02 |
| 38 | Stream water | 19 May 2016 | 141°4′33′′ E | 41°26′19′′ N | 7.48 |
| 39 | Stream water | 7 June 2016 | 141°5′47′′ E | 41°27′19′′ N | 4.48 |
| 40 | Spring water | 7 June 2016 | 141°5′34′′ E | 41°27′17′′ N | 3.49 |
| 41 | Stream water | 7 June 2016 | 141°5′33′′ E | 41°27′16′′ N | 7.26 |
| 42 | Spring water | 8 June 2016 | 141°5′44′′ E | 41°27′4′′ N | 7.59 |
| 43 | Spring water | 8 June 2016 | 141°5′45′′ E | 41°27′5′′ N | 7.57 |
| 44 | Spring water | 8 June 2016 | 141°5′50′′ E | 41°27′4′′ N | 7.72 |
| 45 | Stream water | 8 June 2016 | 141°5′55′′ E | 41°27′6′′ N | 5.24 |
| 46 | Spring water | 15 June 2016 | 141°6′7′′ E | 41°27′7′′ N | 5.66 |
| 47 | Stream water | 15 June 2016 | 141°6′18′′ E | 41°27′7′′ N | 7.36 |
| 48 | Stream water | 7 July 2016 | 141°5′0′′ E | 41°26′26′′ N | 6.88 |
| 49 | Stream water | 7 July 2016 | 141°5′59′′ E | 41°26′50′′ N | 7.45 |
| 50 | Stream water | 8 July 2016 | 141°5′22′′ E | 41°26′34′′ N | 7.44 |
| 51 | Stream water | 8 July 2016 | 141°5′21′′ E | 41°26′35′′ N | 7.42 |
| 52 | Stream water | 8 July 2016 | 141°5′48′′ E | 41°26′41′′ N | 7.49 |
| 53 | Stream water | 8 July 2016 | 141°5′49′′ E | 41°26′42′′ N | 7.25 |
| 54 | Stream water | 8 July 2016 | 141°6′15′′ E | 41°26′56′′ N | 7.10 |
| 55 | Stream water | 8 July 2016 | 141°6′14′′ E | 41°26′56′′ N | 6.24 |
| 56 | Stream water | 12 July 2016 | 141°5′5′′ E | 41°27′1′′ N | 7.04 |
| 57 | Stream water | 12 July 2016 | 141°5′7′′ E | 41°27′2′′ N | 6.94 |
| 58 | Stream water | 13 July 2016 | 141°4′57′′ E | 41°27′1′′ N | 7.03 |
| 59 | Spring water | 13 July 2016 | 141°4′57′′ E | 41°27′2′′ N | 7.76 |
| 60 | Stream water | 13 July 2016 | 141°4′57′′ E | 41°27′4′′ N | 7.50 |
| 61 | Stream water | 13 July 2016 | 141°4′59′′ E | 41°27′5′′ N | 7.31 |
| 62 | Spring water | 13 July 2016 | 141°4′59′′ E | 41°27′4′′ N | 2.48 |
| 63 | Stream water | 13 July 2016 | 141°5′7′′ E | 41°27′4′′ N | 2.98 |
| 64 | Stream water | 13 July 2016 | 141°5′7′′ E | 41°27′4′′ N | 2.88 |
| 65 | Stream water | 13 July 2016 | 141°5′13′′ E | 41°27′4′′ N | 4.02 |
| 66 | Stream water | 22 July 2016 | 141°4′7′′ E | 41°26′52′′ N | 3.17 |
| 67 | Stream water | 22 July 2016 | 141°4′13′′ E | 41°26′49′′ N | 3.85 |
| 68 | Stream water | 22 July 2016 | 141°4′17′′ E | 41°26′49′′ N | 6.90 |
| 69 | Stream water | 22 July 2016 | 141°4′19′′ E | 41°26′48′′ N | 4.79 |
| 70 | Stream water | 22 July 2016 | 141°4′28′′ E | 41°26′52′′ N | 6.72 |
| 71 | Stream water | 22 July 2016 | 141°4′29′′ E | 41°26′53′′ N | 7.25 |
| 72 | Stream water | 22 July 2016 | 141°4′34′′ E | 41°26′53′′ N | 7.55 |
| 73 | Spring water | 10 October 2016 | 141°4′38′′ E | 41°26′56′′ N | 3.18 |
| 74 | Stream water | 10 October 2016 | 141°4′35′′ E | 41°26′56′′ N | 6.92 |
| 75 | Stream water | 10 October 2016 | 141°5′25′′ E | 41°26′37′′ N | 7.35 |
© 2017 by the authors. Licensee MDPI, Basel, Switzerland. This article is an open access article distributed under the terms and conditions of the Creative Commons Attribution (CC BY) license (http://creativecommons.org/licenses/by/4.0/).
Share and Cite
MDPI and ACS Style
Suzuki, Y.; Ioka, S.; Muraoka, H. Geothermal Resource Exploration by Stream pH Mapping in Mutsu Hiuchi Dake Volcano, Japan. Energies 2017, 10, 1009. https://doi.org/10.3390/en10071009
AMA Style
Suzuki Y, Ioka S, Muraoka H. Geothermal Resource Exploration by Stream pH Mapping in Mutsu Hiuchi Dake Volcano, Japan. Energies. 2017; 10(7):1009. https://doi.org/10.3390/en10071009
Chicago/Turabian StyleSuzuki, Yota, Seiichiro Ioka, and Hirofumi Muraoka. 2017. "Geothermal Resource Exploration by Stream pH Mapping in Mutsu Hiuchi Dake Volcano, Japan" Energies 10, no. 7: 1009. https://doi.org/10.3390/en10071009
Note that from the first issue of 2016, this journal uses article numbers instead of page numbers. See further details here.