1. Introduction
The increment on the penetration of the distributed generation (DG) resources encounters the current power grid with management and reliability challenges [
1]. For overcoming these issues, the entire power network can be distributed into several small power grids, which are the sub set of the main power network. This solution is attainable via the concepts defined in smart grids, such as microgrids [
2]. The microgrid refers to a group of DG units, renewable energy resources (RERs), and the local loads that can rely upon the main distribution network [
3]. Basically, the RERs consist of photovoltaic (PV) systems and wind turbines [
4].
The real-time measurements of different nodes of a microgrid are an essential issue for managing and controlling the grid through both the centralized and distributed methods. This can be released by phasor measurement units (PMU). The PMU are synchronized time based instruments, which collects highly precise phasor data of the power system [
5]. The PMU plays a key role in the real-time monitoring of the smartgrids and microgrids that utilizes the global positioning system (GPS) to provide the concurrent measurements [
6]. Typical PMU devices are able to provide 30 samples per second [
7]. This enables the grid operator to be informed from the synchronized time based voltage and current phasor measurements in different nodes of the grid, in order to control and manage the power stability and delivery [
8].
Additionally, if the DG resources are integrated with demand response (DR) programs, the microgrid conceptions can be fully addressed. DR programs are defined as altering the electricity consumption profiles based on the incentives payment provided by the network operator due to technical reasons or economic purposes. Incentive-based and price-based are two major classifications of DR programs [
9]. In this context, virtual power players (VPPs) play a key role for aggregating the DG and DR small size resources, in order to be used in electricity markets as a large scale resource [
10].
In order to control and manage the resources available in the microgrid, two main methods can be proposed: centralized and distributed control. In the centralized control method, a powerful central controller unit is responsible to manage and control the microgrid, where communication between this unit and each single component of the network is required [
11]. However, in the distributed control method, the decisions take place locally and are based on the real-time information exchanged by the network components [
12]. Both methods have several advantages and disadvantages. For example, the centralized control requires high initial cost and needs a widespread scheming; however, it provides better efficiency. In the meantime, the centralized network can be implemented step by step from the bottom levels to the top levels [
13].
This paper presents the development and implementation of a real-time microgrid simulation platform managed by centralized and distributed controlling decision support. In this platform it is attempted to provide a realistic microgrid implementation using real and laboratorial hardware equipment. The microgrid players included in this platform consist of two renewable DG units (PV and wind turbine), and a low and a medium consumer load (laboratorial equipment), which are connected to each other as well as the main power grid through four power lines. The local demand of the microgrid can be supplied from the energy provided by the DG and the grid as well. For the centralized control method, a real-time simulator model has been employed in order to manage the system, and for the distributed control manner, a local controller is associated for each player in order to perform the decision making locally and achieve the microgrid goals.
There are several related research works, which implemented and surveyed the microgrid models based on centralized or distributed decision support. In [
13], the authors examined two implemented microgrid topologies, one centralized and one distributed model, which combine solar panels and batteries for 20 residential houses. In [
14], the authors provided an optimal solution for dispatching of the local resources in the medium voltage (MV) microgrids that temporary or permanently operate in islanded mode. In the optimization problem, they considered that all the power produced by renewable generators (PV and wind) is used, in order to minimize the microgrid operation costs as well as the pollutant emissions of the programmable generators. In [
15], a new distributed controlling method was proposed for secondary frequency and voltage control and stability in a microgrid while it is operating in islanded mode. In this method, the authors utilized localized data as well as nearest-neighbor communication to implement the secondary control operations while there is no necessity of information about the loads and microgrid methodology. In [
16], a unified controlling method is addressed for the cooperation of distributed energy resources (DERs) and the DR to support the voltage and frequency of an islanded microgrid in which it minimized the overall operation costs of the grid through an optimization problem. In the proposed algorithm, the frequency deviation was considered as a new state variable in the model. In this way, the model enables us to calculate the required set points for the DERs and the amount of power that should be curtailed by the controllable loads available in the grid. In [
17], a simulation based analysis of dynamical behavior of a residential DC microgrid laboratory setup in distributed and centralized voltage control configurations is presented. In [
18], the authors described the control algorithm of a utility connected microgrid, based on independent control of active and reactive power and operating in centralized and distributed operation mode. In addition to these works, a significant number of published works have been focused on the multi-agent based and distributed control models for the energy management of the microgrids [
19,
20,
21].
There are a lot of laboratories and test beds implemented for development and validation of the capabilities of smartgrids and microgrids by utilizing the real-time simulation facilities [
22]. Austrian Institute of Technology (AIT), Vienna, Austria, includes three configurable three-phase low-voltage grids and the real-time simulation with hardware-in-the-loop (HIL) setups in order to experiment with the real-time simulation platform for advanced power-HIL and controller-HIL analysis, and the validation of energy management systems and distribution supervisory control and data acquisition (SCADA). OFFIS—Institute for Information Technology, Oldenburg, Germany has an automation laboratory, which includes OPAL-RT simulator for executing a highly detailed and dynamic power grid. The OFFIS utilizes this laboratory for centralized and decentralized controlling methods and parallel simulation. Laboratoire de Genie Electrique de Grenoble, Grenoble, France, includes a real-time power-HIL simulation laboratory equipped with two real-time multiprocessors digital simulators. This enables them to focus on power system protection relays, testing different types of equipment, namely wind turbine emulator and hydro turbine, and testing the industrial converters for PV systems. Commissariat A L’energie Atomique et AUX Energies Alternatives, France, has a microgrid platform including several renewable and conventional generators, energy storage systems, controllable loads, and electrical vehicles. The main core of this platform is a HIL simulator, which enabled the facility to validate and examine the microgrid operation and protection, voltage and frequency control, energy storage systems management etc. Distribution Network and Protection Laboratory, Glasgow, UK, consists of a three-phase power grid including several multiple controllable voltage supplies, flexible and controllable loads. There are several real-time simulators in this laboratory, which are utilized for surveying protection concepts, automation equipment, and new solutions for distributed power system control.
The main objective of the present paper is to develop and implement a real-time microgrid simulation platform using several real and laboratorial hardware equipment. Such a platform supports real-time simulation skills and HIL means in order to address the validation of demand response and distributed generation optimization. A microgrid accommodates such resources and is managed by a VPP that aims at minimizing the operation costs, using both distributed and centralized control methods. An upstream network is modeled in MATLAB/Simulink, using mathematical and non-physical models. The use of real-time simulation and HIL scenarios brings the ability of controlling and managing the real resources from the simulation environment with non-real management scenarios, such as optimization models.
The problem statement is related to how a microgrid business model can be examined and validated in terms of management and control, before massive implementation. Implementing a completely realistic microgrid model only for testing and validating, would not be a cost-effective solution. Furthermore, it would not be available for everyone, since only a limited number of companies or research institutes could be equipped with that type of test bed. The microgrid platform designed in this paper is flexible in terms of controlling methods and is up to the operator to choose.
In this way, namely when comparing with [
23], the contribution of the present paper relies on the presented approach that integrates all the above referred aspects of the work, namely with improved aspects as the optimization of resource use.
In both centralized and distributed control methods, the different nodes of the microgrid (accommodating consumers and generators) will be measured through the several energy meters mounted on the various locations of the grid. The sampling period of these energy meters are one sample per second, which have enough accuracy for optimization problems and DR program applications, and the high precision measurement devices, such as PMUs, may not be required for these kinds of applications. This microgrid is also able to be configured in islanded or grid-connected mode. Since the energy transaction between the microgrid and the main grid is considered, the autonomous mode is out of the focus of the paper. Another topic out of the present work focus is the market congestion in the connection of the microgrid with the upstream network. It is not included on the economic model since the main focus is given to minimize microgrid operation costs. The considered VPP is selling electricity in the market and the network has enough capacity for the energy transactions.
This paper is structured as follows: after this introductory section, the development and implementation of the proposed microgrid simulation platform is described on
Section 2. Then, a case study is defined and executed with the presented model in
Section 3 and its results are described in
Section 4. Finally,
Section 5 clarifies the main conclusions of the work.
2. Real-Time Microgrid Simulation Platform
This section describes the real-time implementation of a microgrid simulation platform based on two controlling methods: centralized and distributed. This system has been implemented in GECAD laboratory [
24]. In this model, several laboratorial hardware resources have been employed in order to simulate a realistic microgrid. The present model is designed and implemented in a way that the controlling methods can be selected by the user/operator. This enables the operator to choose the centralized or distributed control method, depending on its application.
Since the proposed system employs the real-time simulator as well as several real hardware equipment, it enables the systems or platforms that include network simulation models to use the real data in their simulation models. Therefore, the present microgrid model will be used as a part of a network simulation model used by DR program simulation platform developed in [
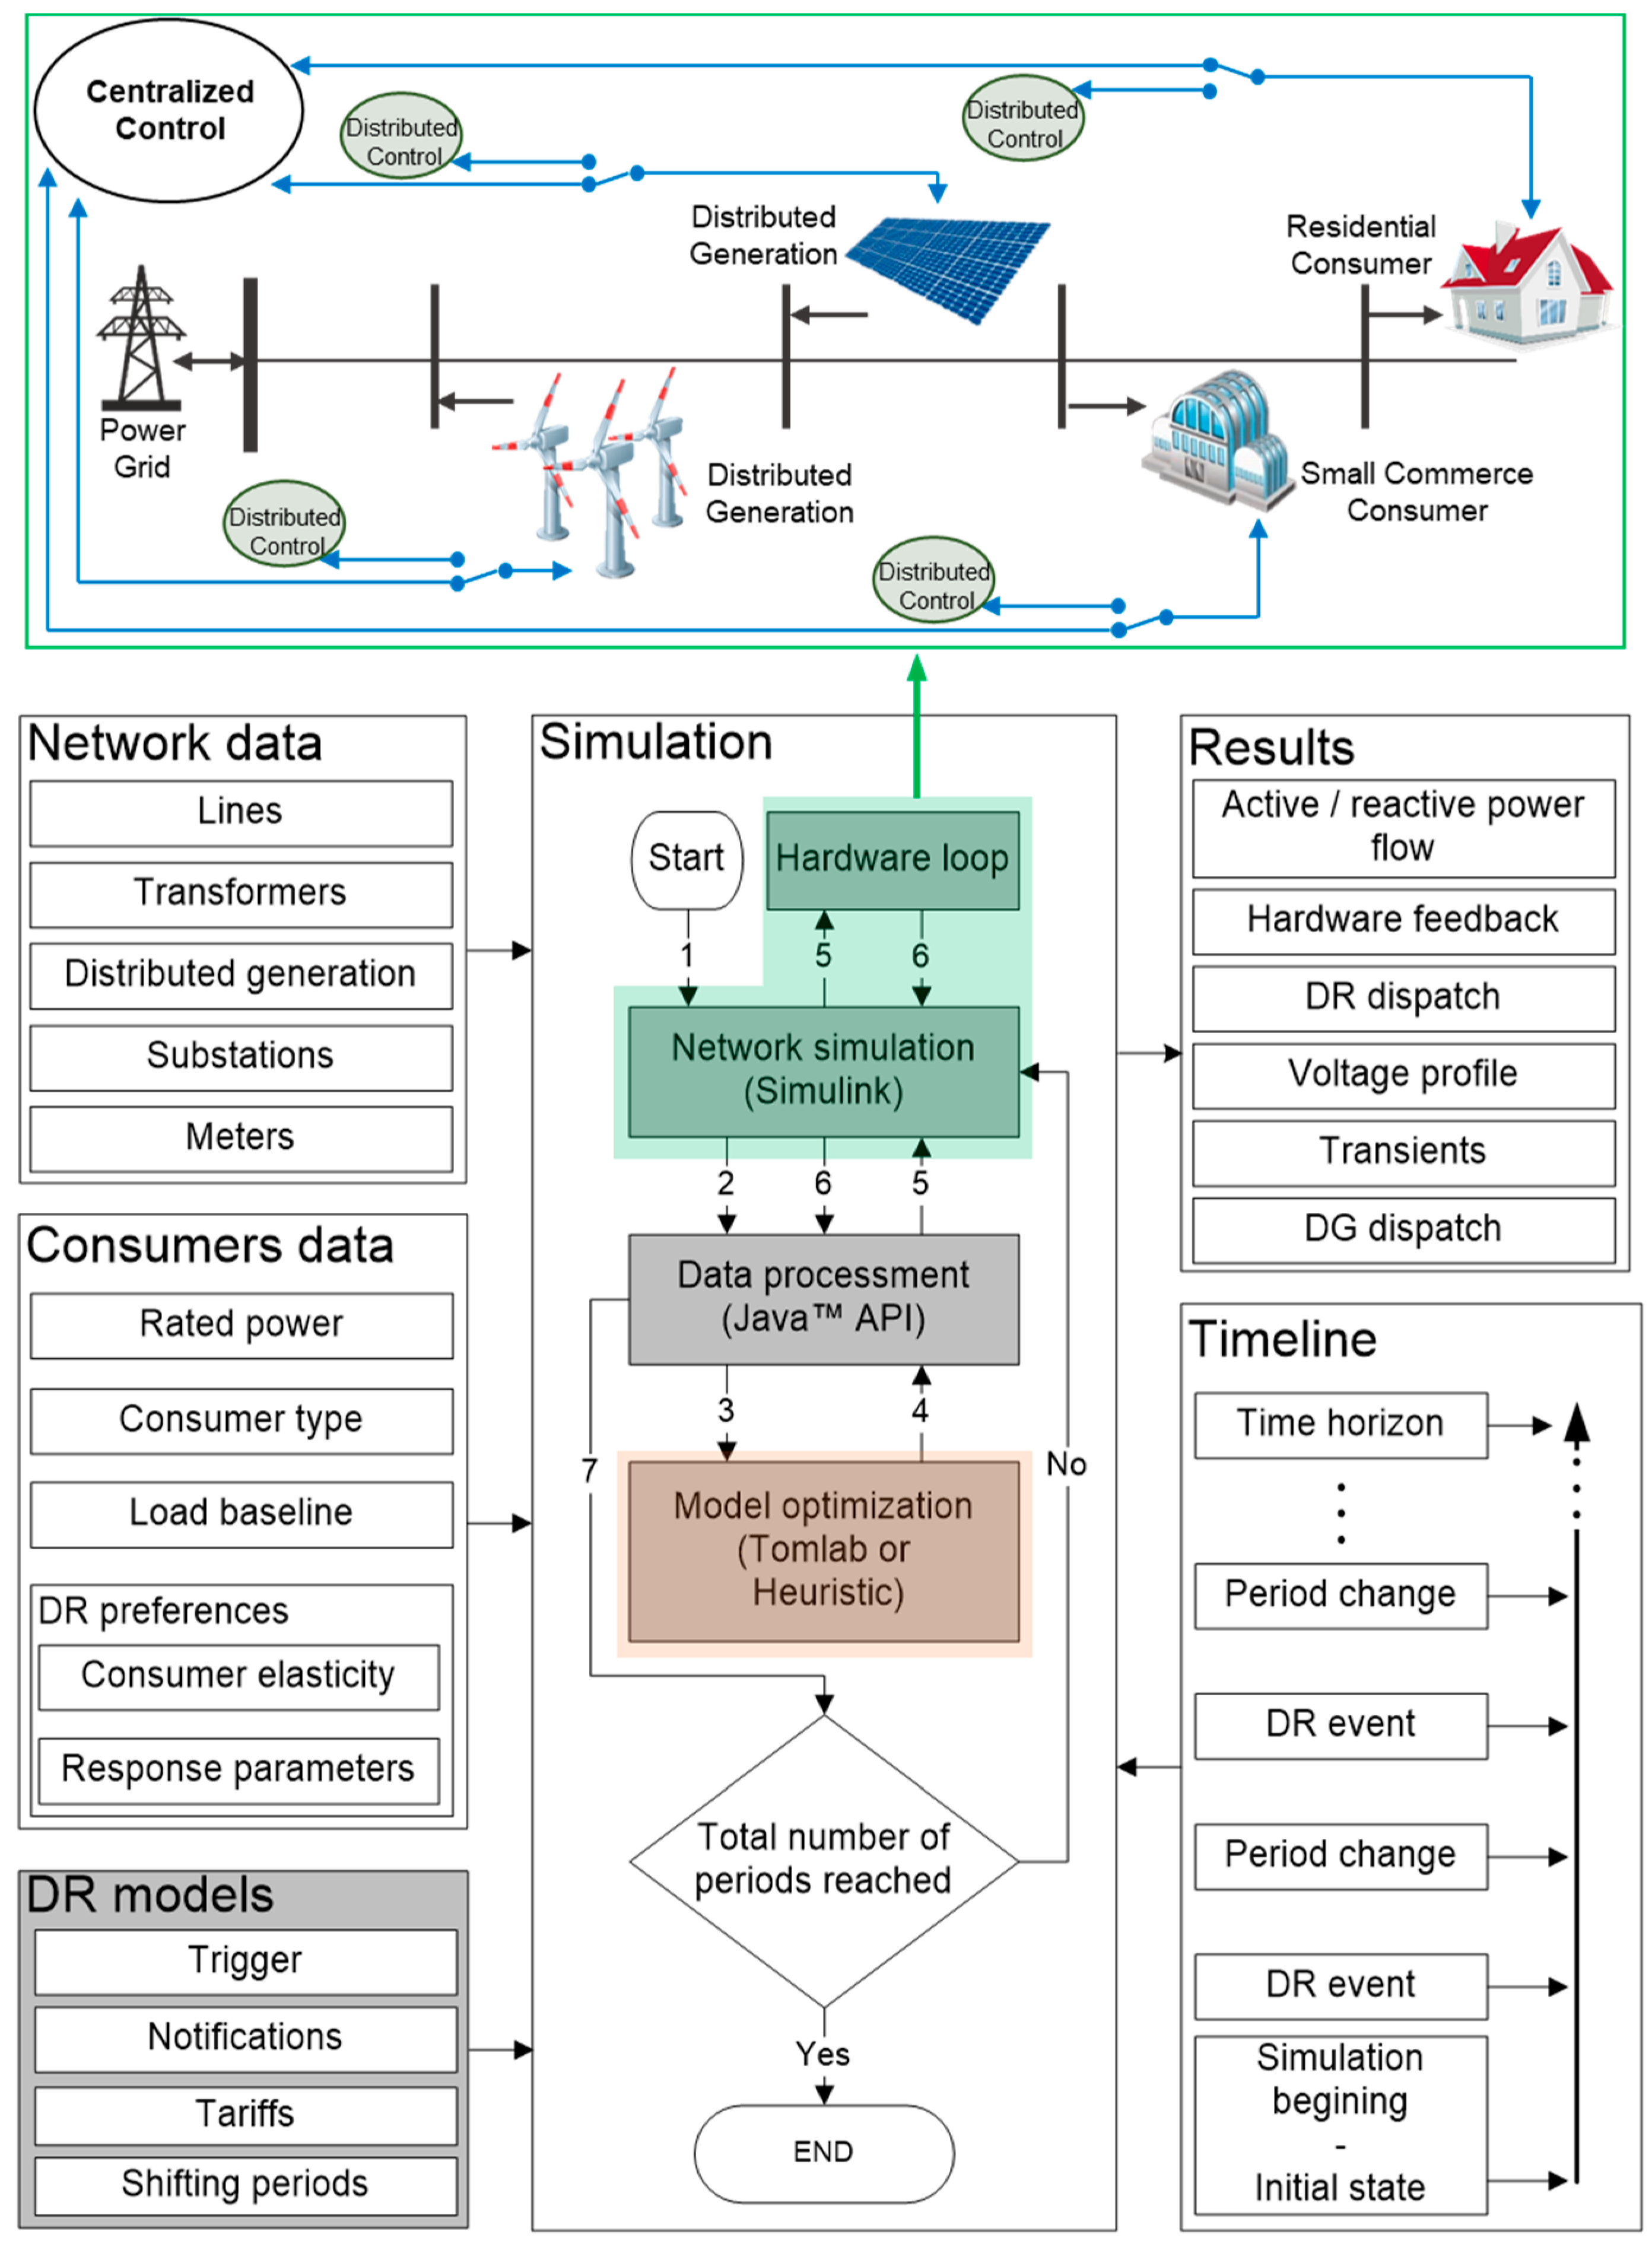
25], called SPIDER—simulation platform for the integration of demand response. This platform has been designed to widely support the decision-making for different types of network players, which are involved in the DR programs. As a general description of SPIDER, it surveys and specifies the data-mining methods, which are appropriate for the consumers who intend to participate in DR programs. Data-mining algorithms are applied in the module “model optimization” (with orange highlights in
Figure 1). In fact, this module includes several types of algorithms for DR implementation, such as the energy resource optimization, data-mining for aggregation of resources, forecasting online tools, etc. For example, if data-mining is applied, whenever a new scenario is computed in the simulation, the system automatically includes the scheduling of resource results as input to the aggregation of the resources. After the data-mining is computed, the simulation proceeds to step “4” (as can be seen in
Figure 1). A data-mining algorithm used for energy resource aggregation and remuneration can be found in [
26].
SPIDER is an essential instrument for validating and analyzing the business and economic aspects of the DR programs, and surveying their influence in the electricity network. For this purpose, SPIDER uses MATLAB/Simulink [
27] tools in order to simulate the basis platform for the grid simulation.
Figure 1 illustrates the overall view of the SPIDER simulation platform with the proposed microgrid simulation configuration using the centralized control method. In this system, several softwares have been employed in order to exchange data between different sections.
The platform starts the process from network simulation in Simulink; afterward, JAVA application programming interface (API) is used in order to transmit the information of the network simulation to the optimization block. Then, TOMLAB [
28] tool is used for the optimization in the SPIDER, and its optimization results transfer to the network simulation block using JAVA API as well. Full details about the SPIDER and its infrastructures can be found in [
25].
The microgrid model proposed in this paper has been demonstrated in the top of the
Figure 1, as depicted by green color. The model includes four nodes; two nodes dedicated for the consumers, and the other two devoted to renewable DG units. This microgrid has the capability of supplying the local loads by its own DG units, and transacts energy with the main grid in order to feed the loads in the moments that there is not enough generation from the energy resources. In addition, it can inject the excess of the produced power to the main gird.
As can be seen in the top of
Figure 1, there are four switches; one for each player, which enables the microgrid operator to select the controlling method. If the centralized controlling method is selected, the central controller unit is responsible for managing the network players and controlling the consumption and generation of the resources. For this purpose, the central controller transmits the controlling commands to each player by using independent communication channels line. However, if distributed control method is selected, the central control unit is eliminated and the local controllers manage the network by transmitting and sharing information between each other. It should be noted that the status of all switches should be equal (all centralized or all distributed). The following sub sections describe how the microgrid is controlled by the centralized and the distributed methods.
2.1. Centralized Control Model
In this section, the central controller unit, network players, and the controlling methods, will be explained. The microgrid model proposed in this section is an improved and reformed version of the model proposed in [
23]. In the previous work, there were low and medium consumer units playing the role of residential and small commerce facility consumers, and a wind turbine emulator playing the role of a home-scale wind turbine. However, in this paper, a 7.5 kW PV system and four power lines have been added to the system in order to implement a comprehensive laboratorial microgrid model.
Figure 2 presents the centralized microgrid control model proposed in this paper. As can be seen, the central controller unit is located at the top of the model and the other network players are connected to this unit. This unit is OP5600, the real-time simulator machine [
29], a powerful instrument to produce real-time simulations even with a high complexity degree while enabling HIL. OP5600 is based on the MATLAB/Simulink and indeed it runs the Simulink models in real-time. Additionally, there are several Digital/Analog I/O slots embedded on the OP5600, which enable the user to control real hardware devices from Simulink models and also receive feedback. This is how HIL integrates the real data with the Simulink models.
The other network players consist of a 4 kVA and a 30 kW load playing the role of low and medium consumer units, and a 1.2 kW wind turbine emulator and a 7.5 kW PV system as DG units in the microgrid. All of these network players were not operating automatically in their factory configuration. However, several automation projects have been implemented on them, in order to control and manage them remotely and automatically [
23,
30]. For concentrating on the innovative perspectives of the model, only the most related sections of the system are described here.
As shown in
Figure 2, the first DG unit is referred to the 1.2 kW wind turbine emulator. This emulator consists of an inductive three-phase generator coupled with a three phase asynchronous motor with variable speed. The speed controller unit allows the variation of the wind speed and consequently the speed variation of the wind turbine rotor. This emulator is controlled through the analog outputs of the OP5600 (Simulink).
The second DG unit is a 7.5 kW PV system, which is already installed on the GECAD laboratory and currently is producing energy. For acquiring and monitoring the real-time generation data in OP5600 and Simulink model, Modbus/TCP (transmission control protocol) protocol has been used.
The third node is related to the 4 kVA load, the low consumer player of the microgrid, which plays the role of a domestic consumer in the microgrid. This load includes three independent sections of resistive, inductive, and capacitive. The automation process was focused on the resistive part. In the factory setting, it had a steering connected to a gauge in the resistive section, which enables the user to increase or decrease the consumption of the load. Currently, a programmable logic controller (PLC) connected to a 12 V DC motor controls the resistive gauge. This enables the 4 kVA load to receive the desired amount of consumption from OP5600 through Modbus/TCP communication protocol, and to adjust its consumption based on the received value.
The last node is connected to the 30 kW load, the medium consumer player of the microgrid that represents the consumption of a small commerce. By default, it had an integral control panel equipped with several selector switches, which enables the user to control the consumption. However, in order to control this unit automatically, four relays have been mounted on the load and are connected to the digital output of the OP5600. Therefore, the central controller unit is able to control the consumption of this resource through the Simulink model.
The power lines is the section that is not included in the previous microgrid model, and is proposed in this paper. As can be seen in
Figure 2, there are four power lines that connects each node of the microgrid to the main power network. In each line, there is a circuit breaker and an energy meter. The circuit breakers are connected via digital output channels of the OP5600, and it enables the user to interrupt the line and disconnect the resource from the main grid through the Simulink model. Furthermore, the energy meters measure the power flow in the lines and transmit the real-time active power data to the Simulink model using Modbus/TCP protocol.
The existing platform can be improved in order to accommodate transient and stability studies which would require the use of PMUs instead of energy meters. In fact, the existing meters in the platform provide acceptable accuracy and sampling per second; however, it doesn’t allow the synchronizing of measurements by GPS.
2.2. Distributed Control Fashion
As it was shown in
Figure 1, there are four switches for the microgrid players where the user can choose how the microgrid be controlled.
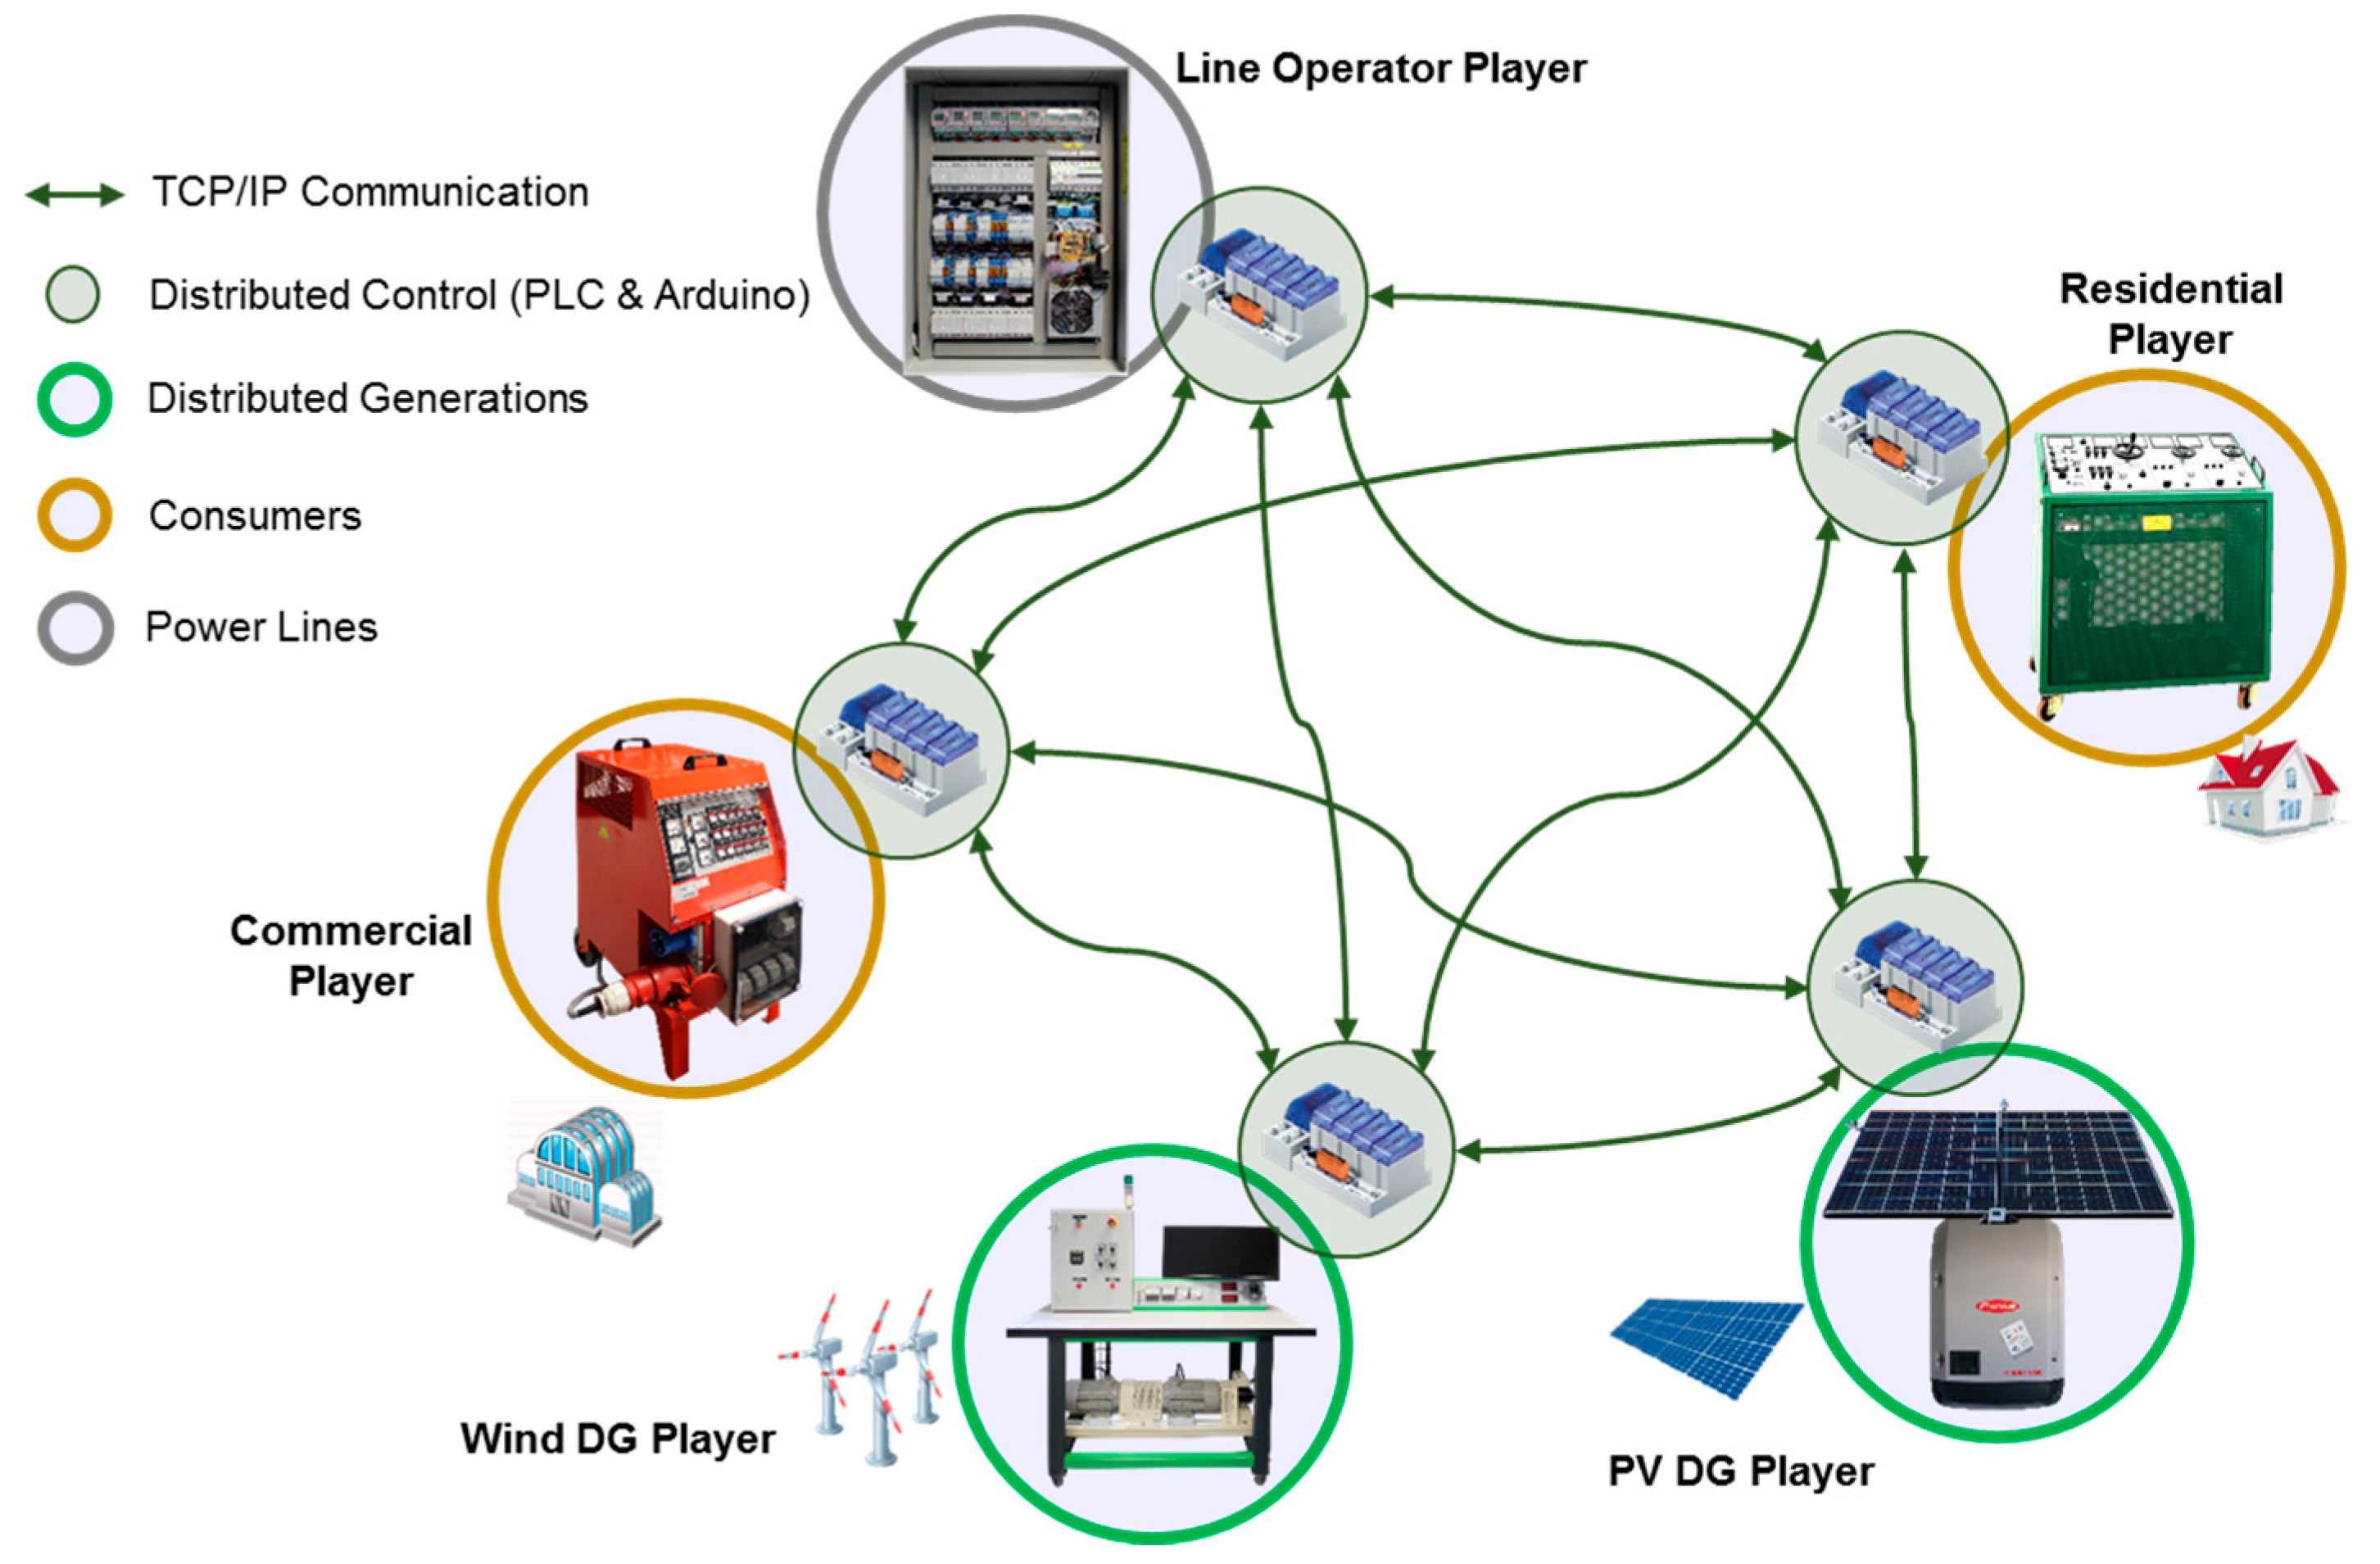
Figure 3 illustrates the microgrid distributed control method. In this condition, the central controller unit (OP5600) will be excluded from the microgrid point of view, and the local controllers manage the network.
In distributed control, there are five main players: a residential player, using a 4 kVA controllable load; a commercial player, using a 30 kW controllable load; a line operator player, that controls the power lines; a PV DG player; and wind DG player. A PLC is dedicated for each player. This enables the microgrid to accomplish decision making locally and communicate with other microgrid players, through TCP/IP (internet protocol) communication protocol, to achieve the microgrid’s goals. The players are responsible for constantly exchanging messages in order to report their latest status in the network.
The microgrid players have dedicated PLCs with several Digital/Analog I/O slots used for their control and management. Residential player uses digital output slot to control the load motor. The commercial player is equipped with digital output slot in order to control the relays, and wind DG player employs an analog output slot for controlling the speed variation of the wind turbine rotor, and finally the line operator player uses the digital output slot to control the status of the circuit breakers of the lines.
The main task of the residential and commercial players are to control and adjust their consumption based on the overall system’s goals. Furthermore, the PV DG player contains the data regarding the PV production and is accountable for informing the other agents with the latest value of the PV generation. Meanwhile, the wind DG player undertakes requesting the wind speed data from an external resource, such as a local weather station, and generates power depending on the received wind speed value. Finally, there are two main objectives for the line operator player since it contains all of the energy meters and the circuit breakers employed in the power lines. As mentioned, the first goal of the line operator player is to supervise the circuit breakers in the power lines. The second purpose is to request the real-time amount of the active power measured by the energy meter of each power line and transmit them to the other players. In this way, the other players, namely residential player, commercial player, and wind DG player, will be aware of their real-time amount of consumption or generation.
In the distributed control method, adaptability of the system is improved compared with the centralized control, since the response time to any changes is reduced. Furthermore, the distributed control method brings reconfigurability and flexibility features to the overall microgrid. Suppose that, in a simple way, the PV DG player transmits a signal to the other players saying that its instant amount of generation changed to 4500 W. The wind DG player also broadcasts a message saying that there is wind generating energy. Therefore, the line operator player responds to the wind DG player that their current output generation is supposedly 500 W. In the meantime, the residential and commercial player reply that they are consuming energy with a certain value, and the line operator player broadcasts their total amount of consumption, which is, supposedly 9500 W. Therefore, the microgrid supplies the rest of the required power from the power grid; hence, there is not enough energy production by DG units.
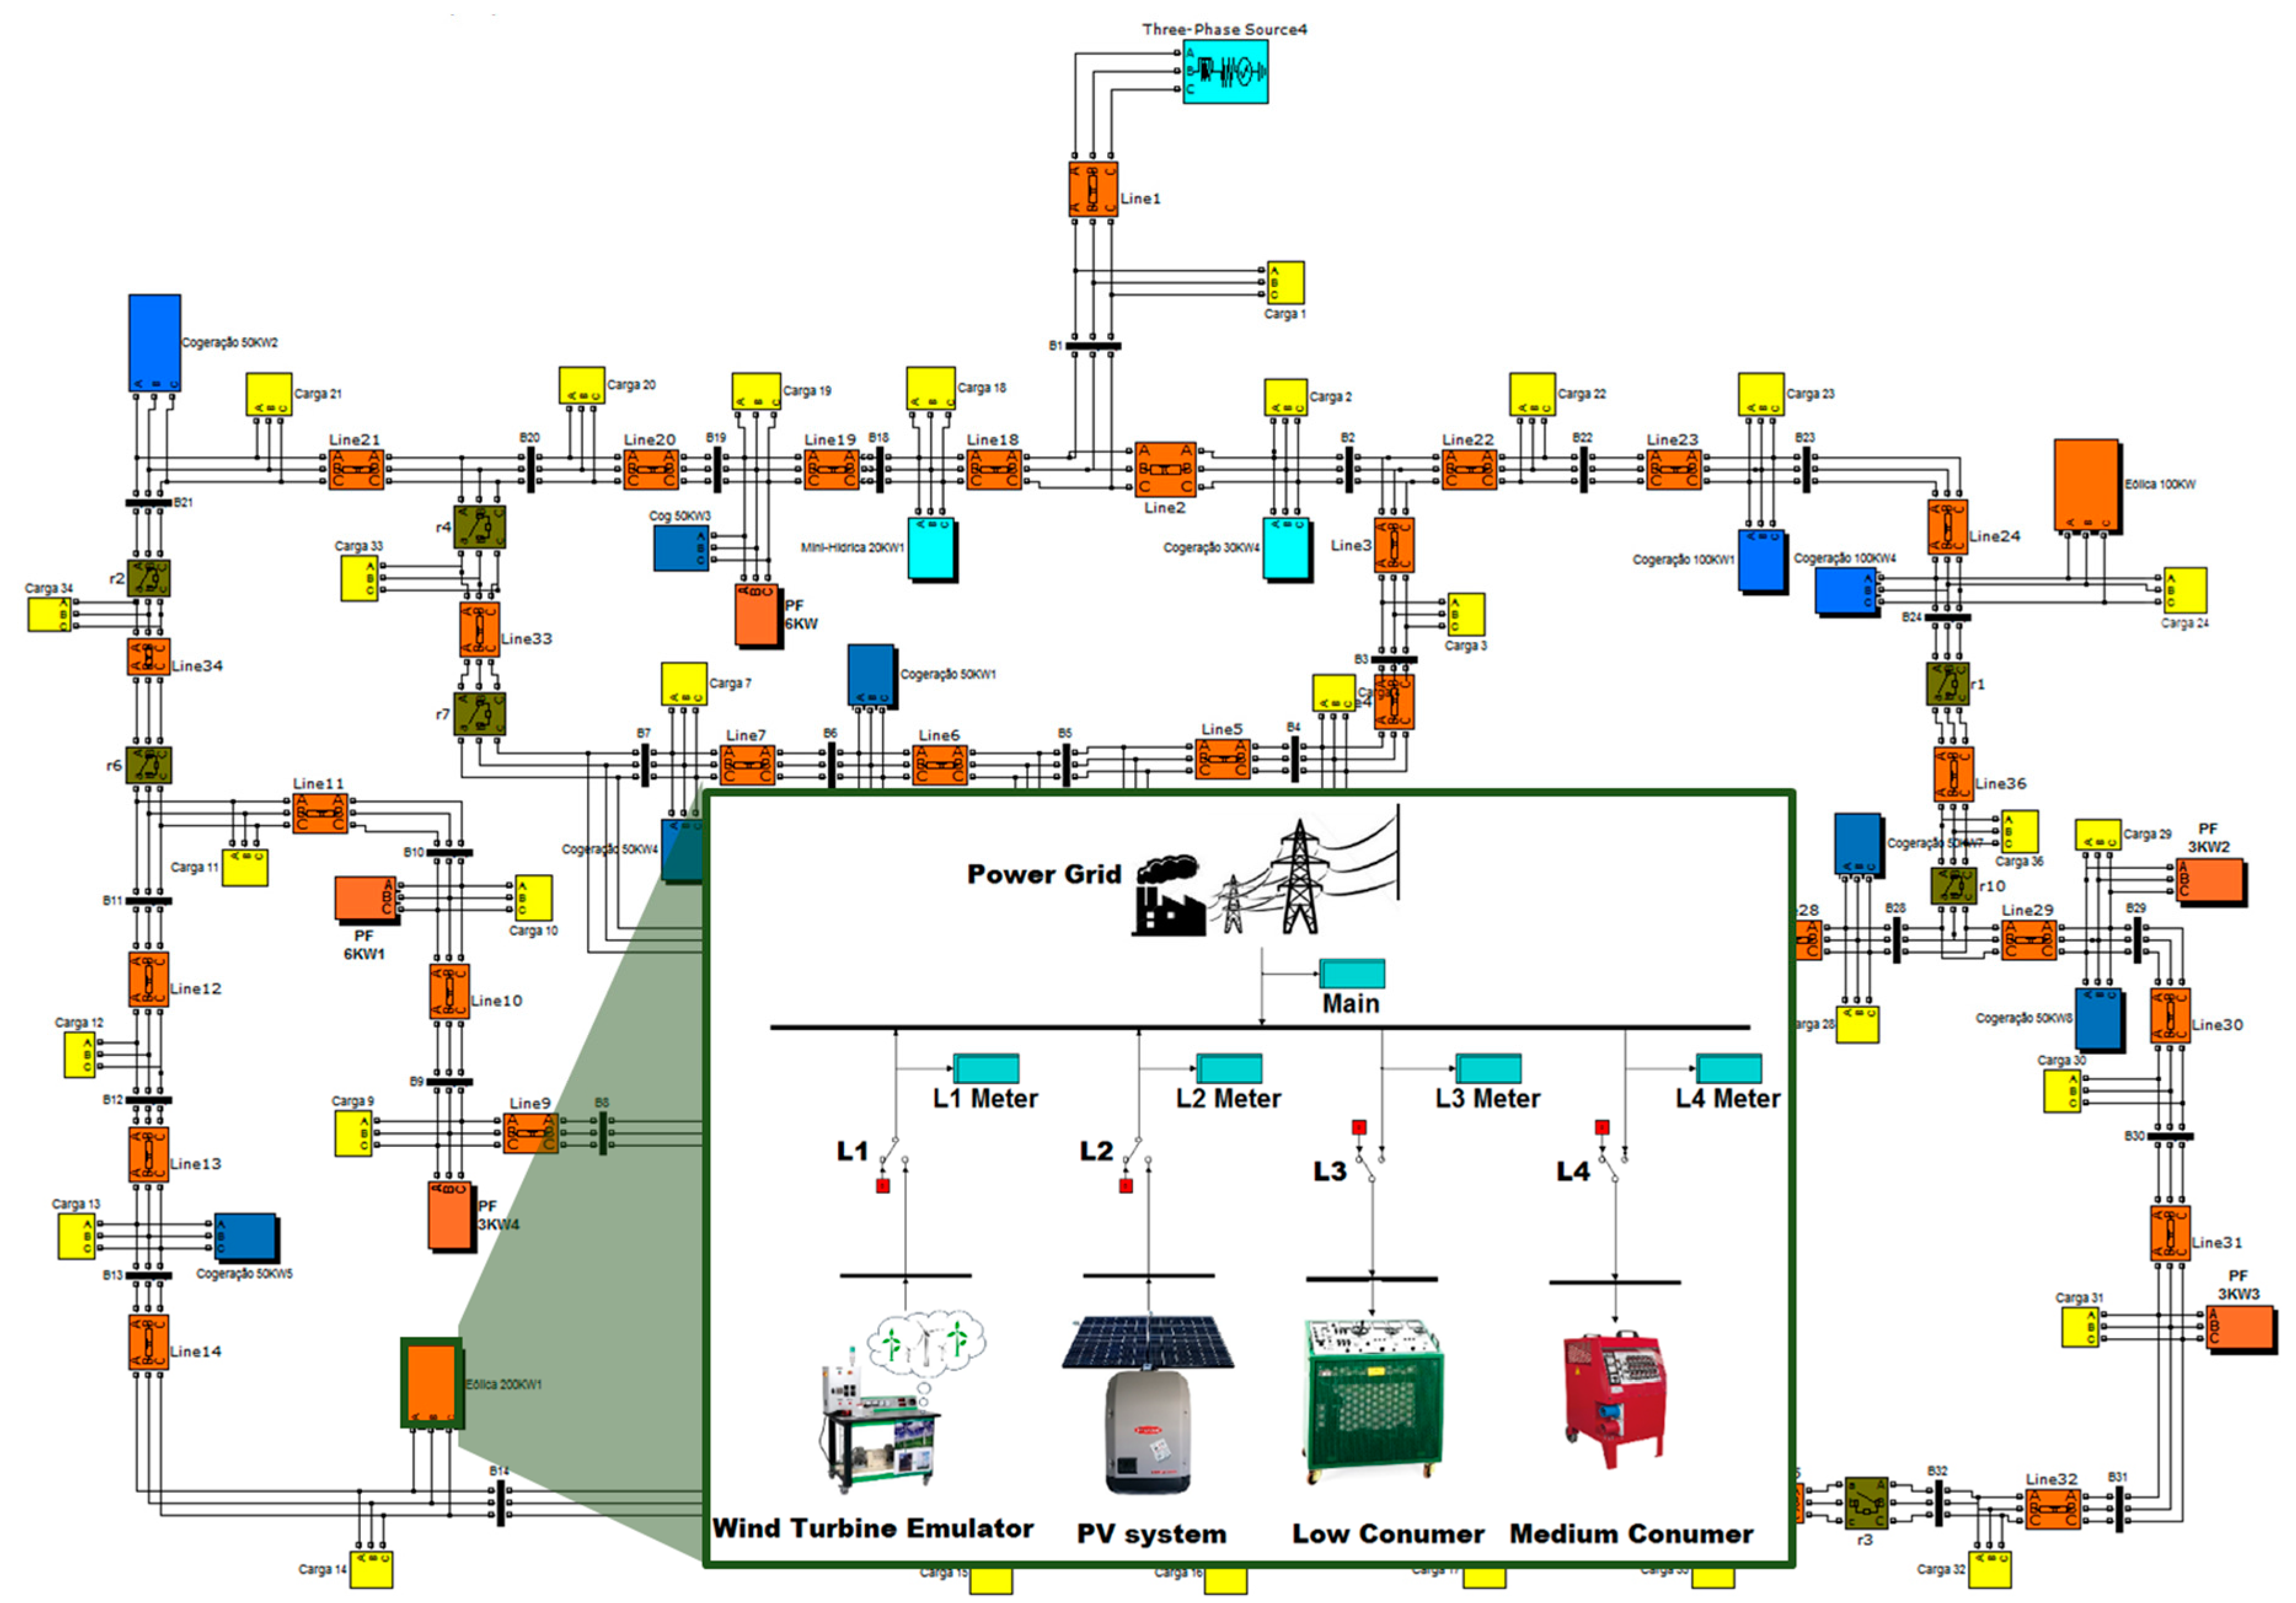
3. Case Study
In this section, a case study is presented and implemented by the microgrid model provided in this paper in order to test and validate the system capabilities. In this case study, it is considered that the user intends to use the centralized microgrid control model.
Figure 4 represents a 33 bus distribution network, including 220 consumers and 68 DG units. The distribution network was implemented MATLAB/Simulink, being compatible with OP5600. The microgrid model is a node connected to bus #10 of this network. Furthermore, the Simulink model developed in OP5600 for real-time controlling of the microgrid players is shown in
Figure 4.
In this case study, we consider that a VPP owns the microgrid and its resources containing the consumers (with or without DR programs), and the energy generators. Therefore, the VPP aggregates the DG and DR resources since in the proposed microgrid they are considered as small size resources. Additionally, the VPP is capable to transact energy to the main grid, which means it can absorb energy while it has high demand and low generation, or inject power to the grid while it has more generation than consumption. This enables the VPP to have active participation in the electricity markets.
VPP also can define several DR programs for the microgrid consumers in order to reduce or shift the consumption to one or more specific periods based on incentives and/or the prices offered to them. Technical or economic reasons can also be the motivation for the VPP to define DR programs. While the DR programs defined reduction or shifting, the VPP can use an optimization for the generation and demand resources in order to economically make a decision and execute the load shifting scenarios. The number of DR programs that VPP executed is a fundamental matter, which should be taken into account.
The shifting periods in this model are the amount of power that can be shifted from a period to other periods. Additionally, the number of periods that the shifted consumption will be entered, and also the amount of load reduction, which will not be shifted, should be considered.
The optimization problem used in this paper for the VPP has been adapted from [
31], and only the most applicable information has been mentioned in this part. The objective function of this optimization is to minimize the operation costs of the VPP, considering the generation and shifting costs in each period
t for all periods in the defined time horizon
T. Equation (1) demonstrates the objective function of the optimization problem. The constraints of the model include:
Balance equation containing the DR balance in each period of t, the energy production, and the consumption demand, which contains the shifted load from period t to period i, and the incoming consumption in period t shifted from period i. This is represented in Equation (2);
The maximum DR capacity considering the consumption reduction executed in period t, which can be shifted to period i after or before t, presented in Equation (3).
The maximum generation capacity limit in each period t, performed by Equation (4).
TOMLAB, which is based on MATLAB, are used in order to solve the proposed optimization problem. Therefore, the optimized results can be easily provided to the microgrid central controller unit (OP5600) as inputs, and consequently, it controls the real hardware equipment in real-time based on these inputs. The output of the economic energy resource scheduling optimization model is a requested amount of power for each consumer to reduce its demand in a certain period. However, the actual implementation of this demand reduction request in a real load will depend on the electrical grid conditions. This is in fact one of the advantages of using real-time simulation (in this paper OP5600) and laboratorial equipment for consumption modeling. In this way, we validate the actual demand reduction in order to be included in the simulation results, namely for remuneration purposes.
4. Results
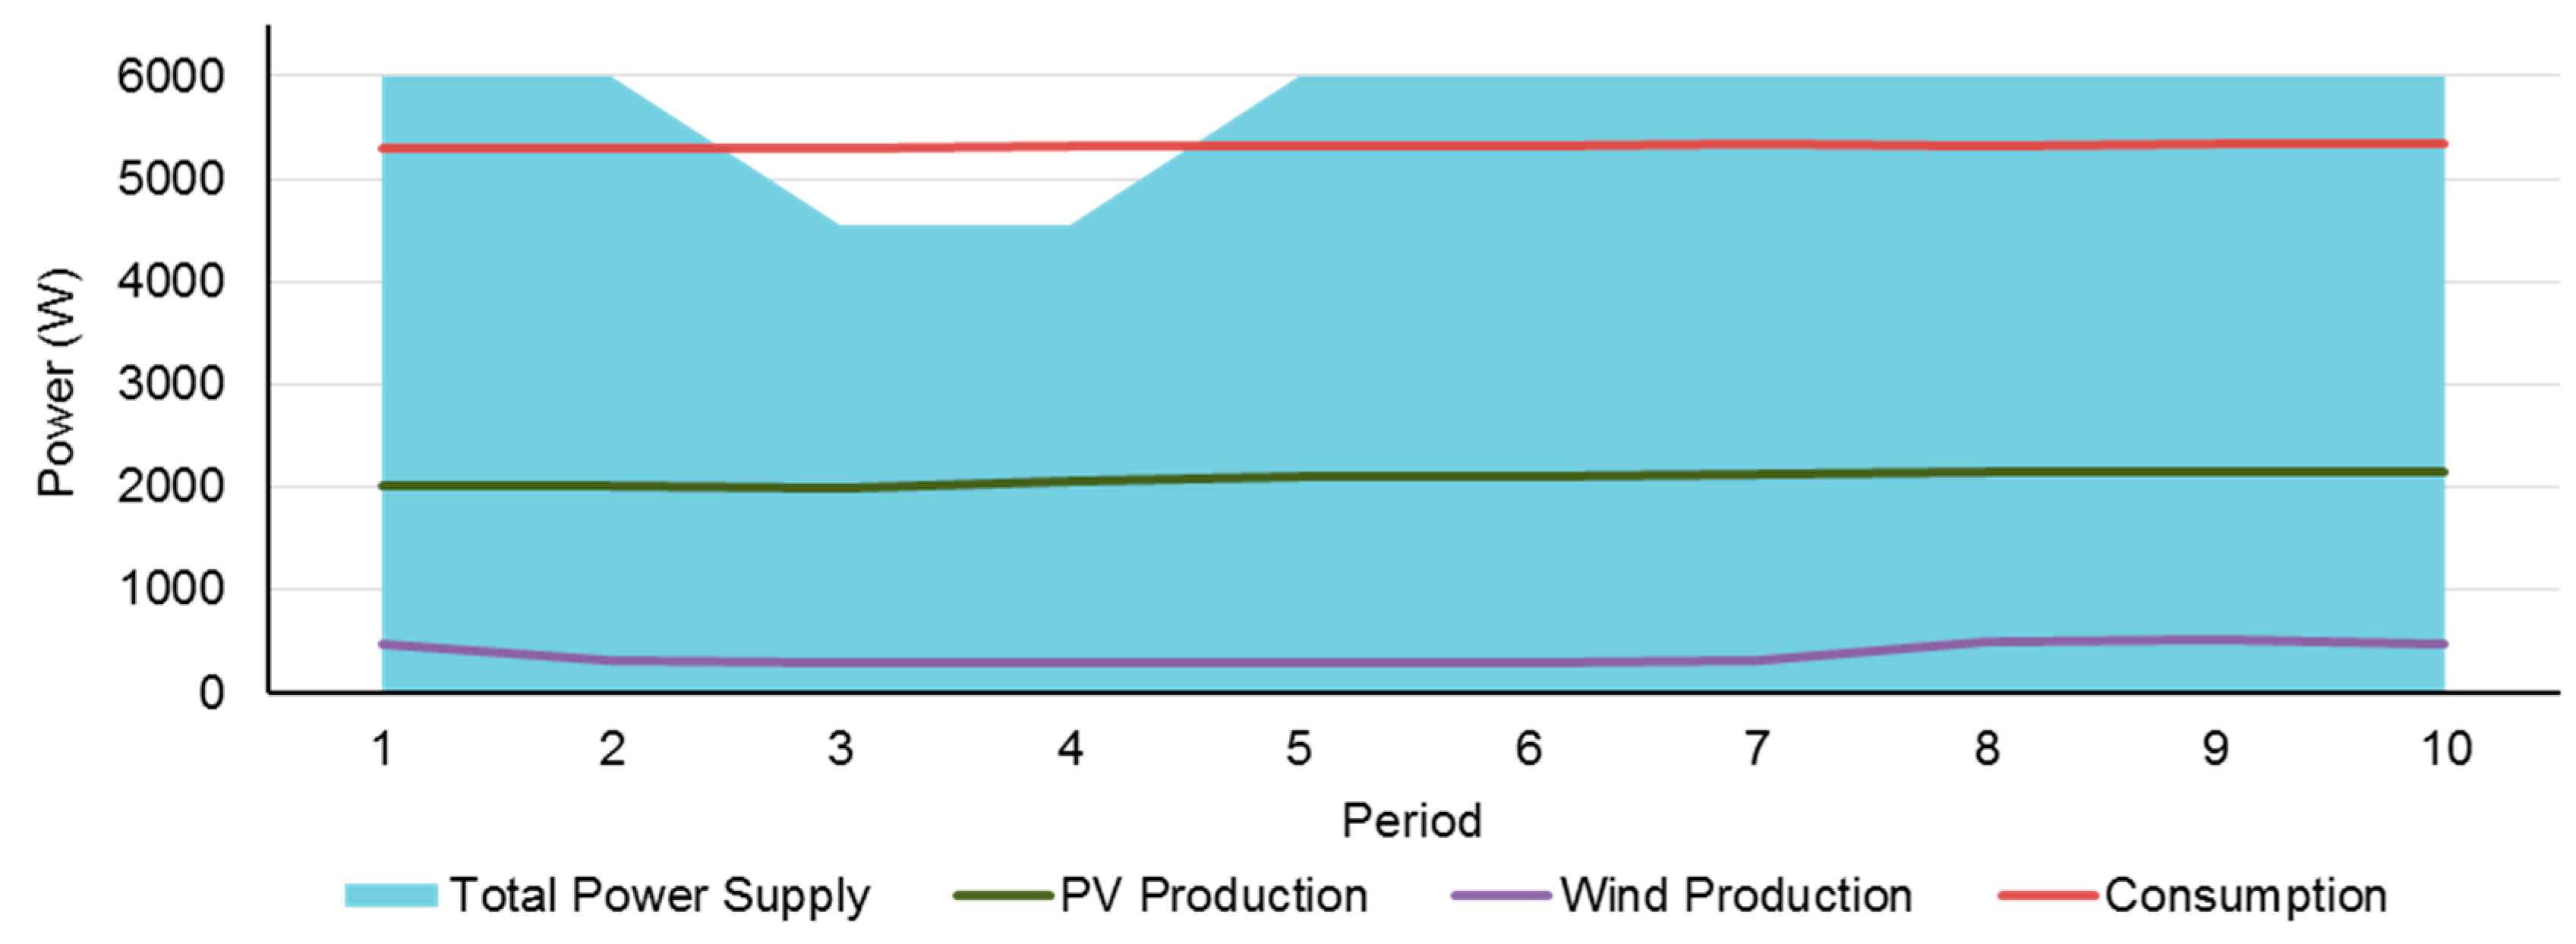
In this section, the results of the proposed methodology will be executed using the microgrid model and its results illustrated. We consider that the case study consists of 10 periods with a one minute time interval. The consumption and generation profiles of the microgrid aggregated by the VPP during this 10 min is shown in
Figure 5. As can be seen, the blue area is the total power aggregated by the VPP during the 10 periods, and the red line indicates the total consumption. The aggregated power supply includes the PV generation, wind production, and the incoming power from the main network to the microgrid.
The data used in the case study is for the day 13 January 2017 (Friday), between 11:30 AM to 11:40 AM. The PV curve is the real-time generation profile adopted from GECAD database. The wind generation is the simulated profile by the wind turbine emulator based on the real-time wind speed data, acquired from [
32], and the consumption curve is also the real-time consumption of the GECAD building, emulated by the 4 kVA and 30 kW load.
As
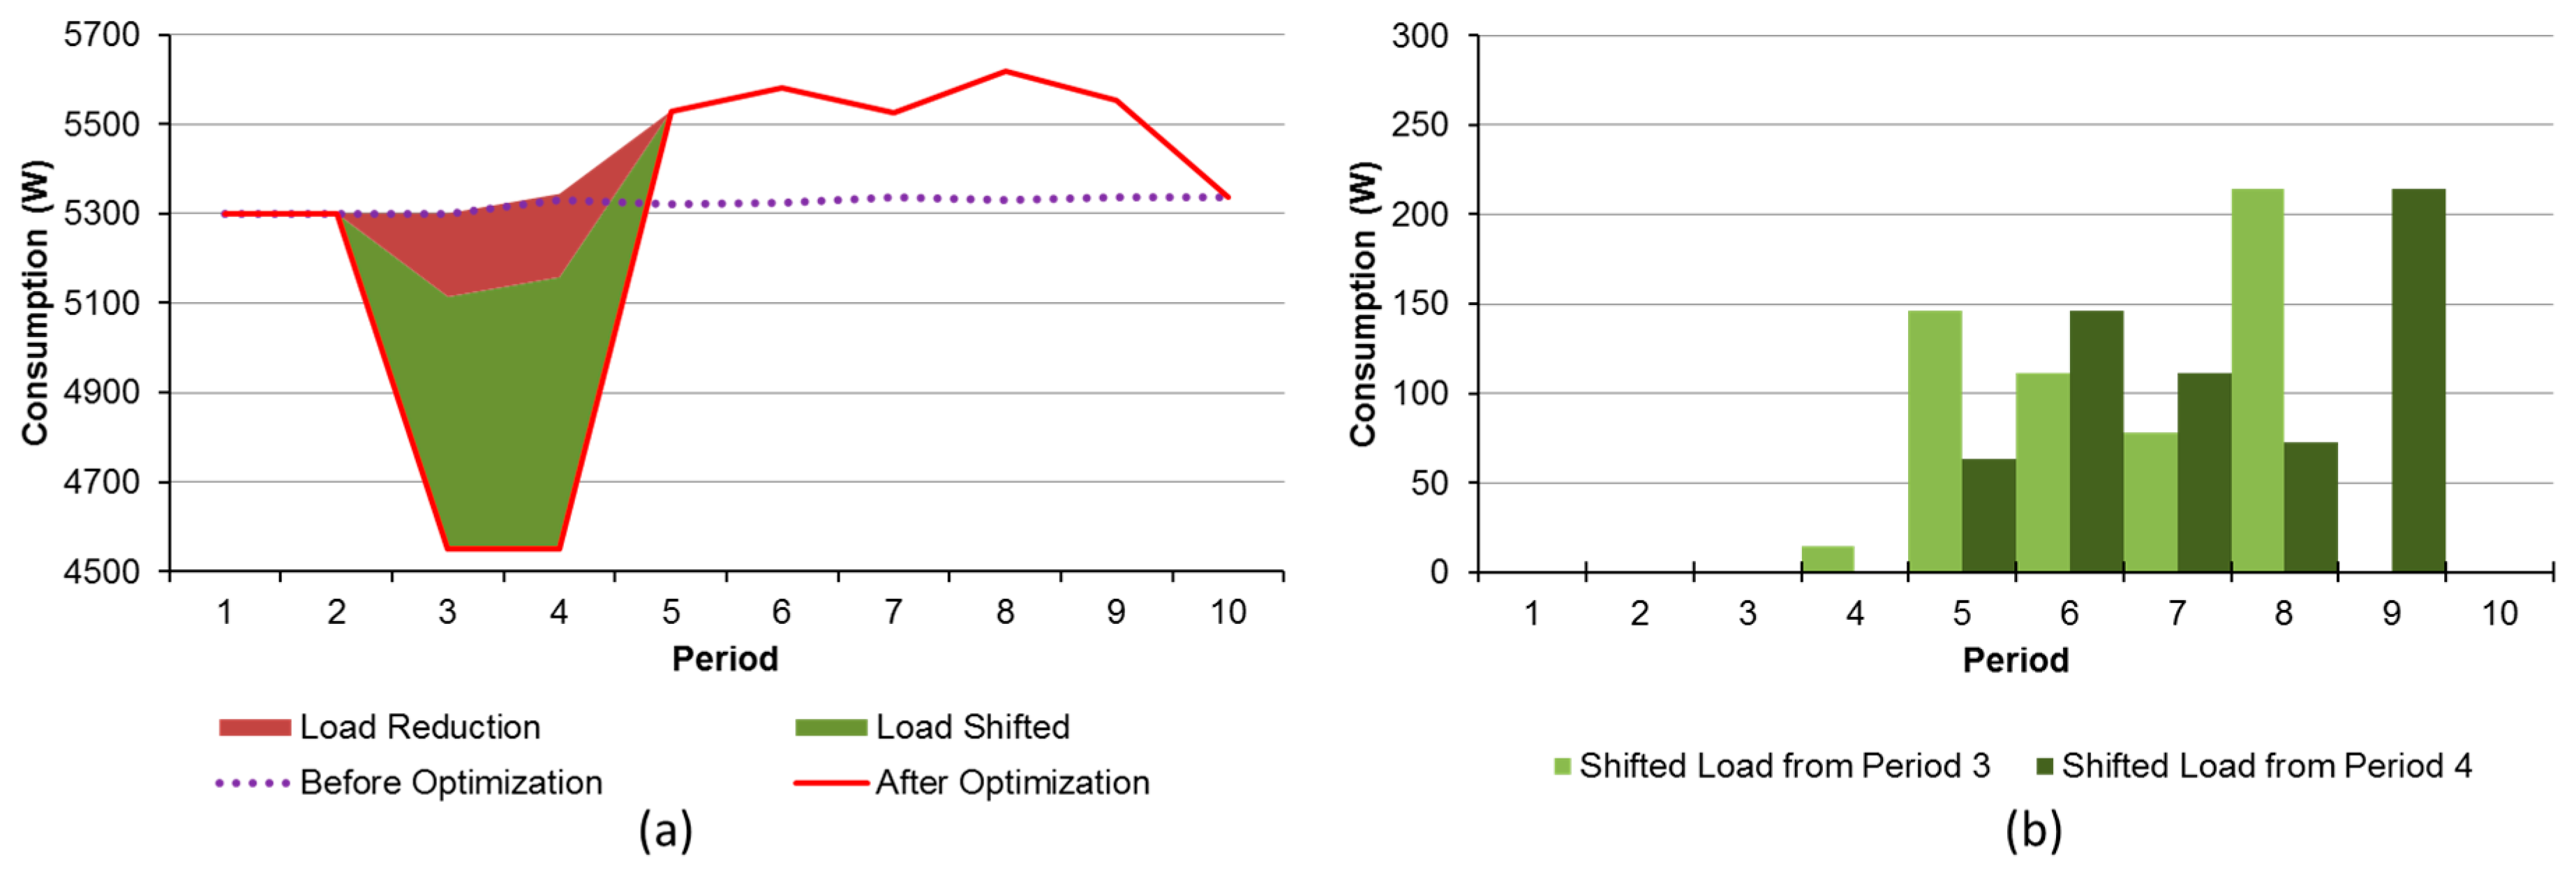
Figure 5 demonstrates, the microgrid meets a drop on generation in the periods 3 and 4. The reason for this lack of generation is considered to be a fault or any other cause in the main grid. Therefore, this is an opportunity for the VPP to start the optimization problem in order to optimally schedule the consumption shifting of the resources. The results of the optimization problem is depicted in
Figure 6. The shifted periods have been scheduled in order to minimize the operation costs of the VPP.
Figure 6a illustrates the load reduction and shifting that have occurred during the periods 3 and 4, where the VPP faced a lack of generation and shifted to the periods after period 4. The red area is the reduced consumption by the consumers, and the green area is the shifted consumption to the other periods. Also, as can be seen in
Figure 6b, the incoming consumption in the periods of 8 and 9 are much higher compared with the other periods. This can be because of the DR programs and the economic advantages.
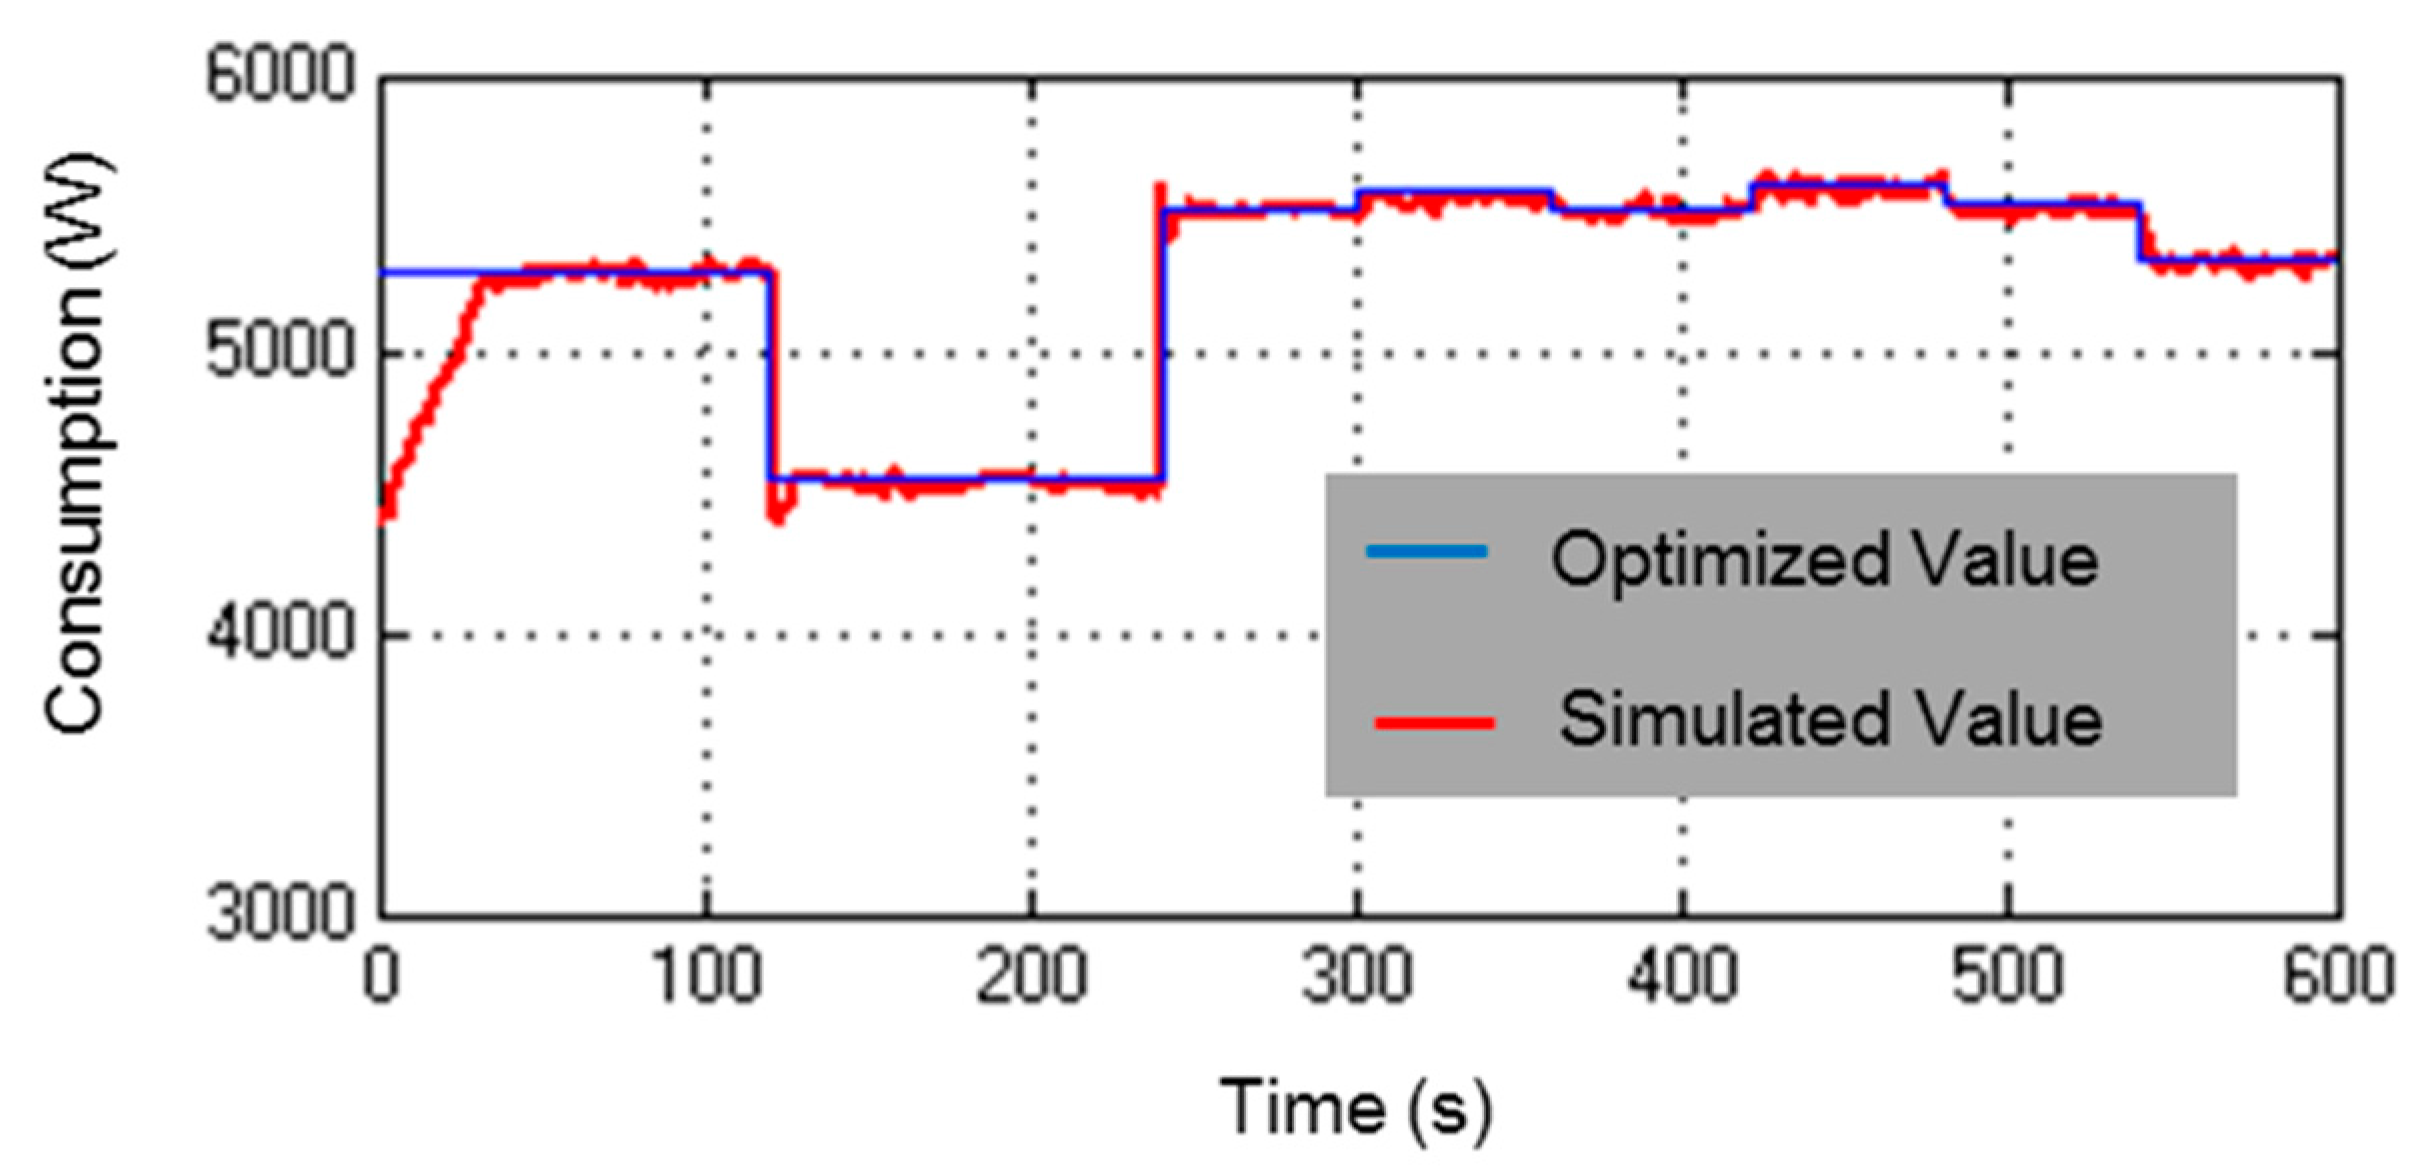
While TOMLAB outputted the results of optimization, they will be provided to the OP5600 real-time simulator as inputs. Consequently, the real-time simulator starts to control and manage the HIL equipment in order to implement the optimization results in real-time.
Figure 7,
Figure 8 and
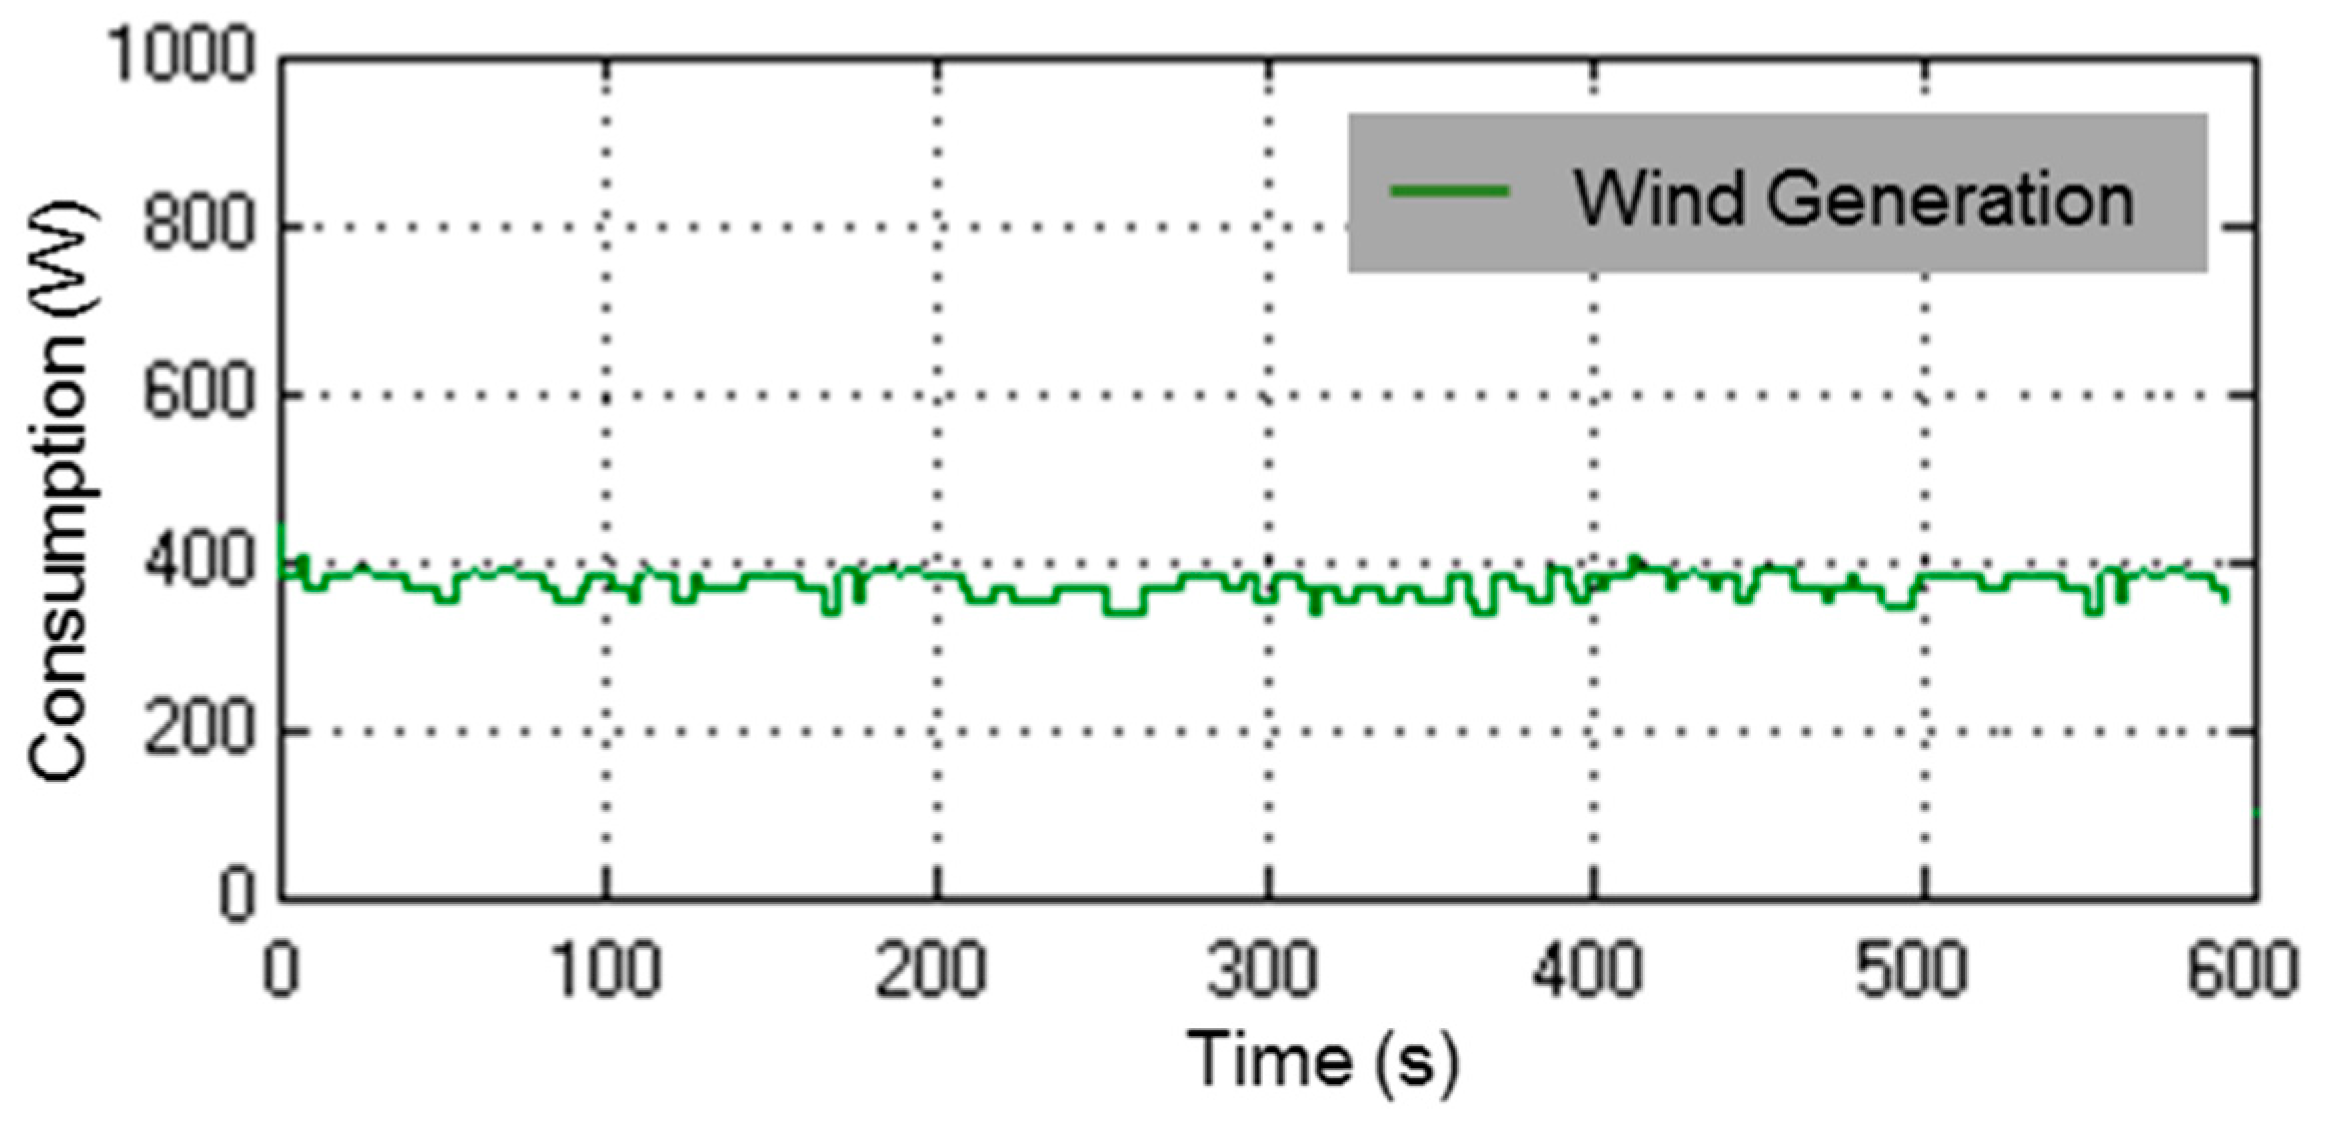
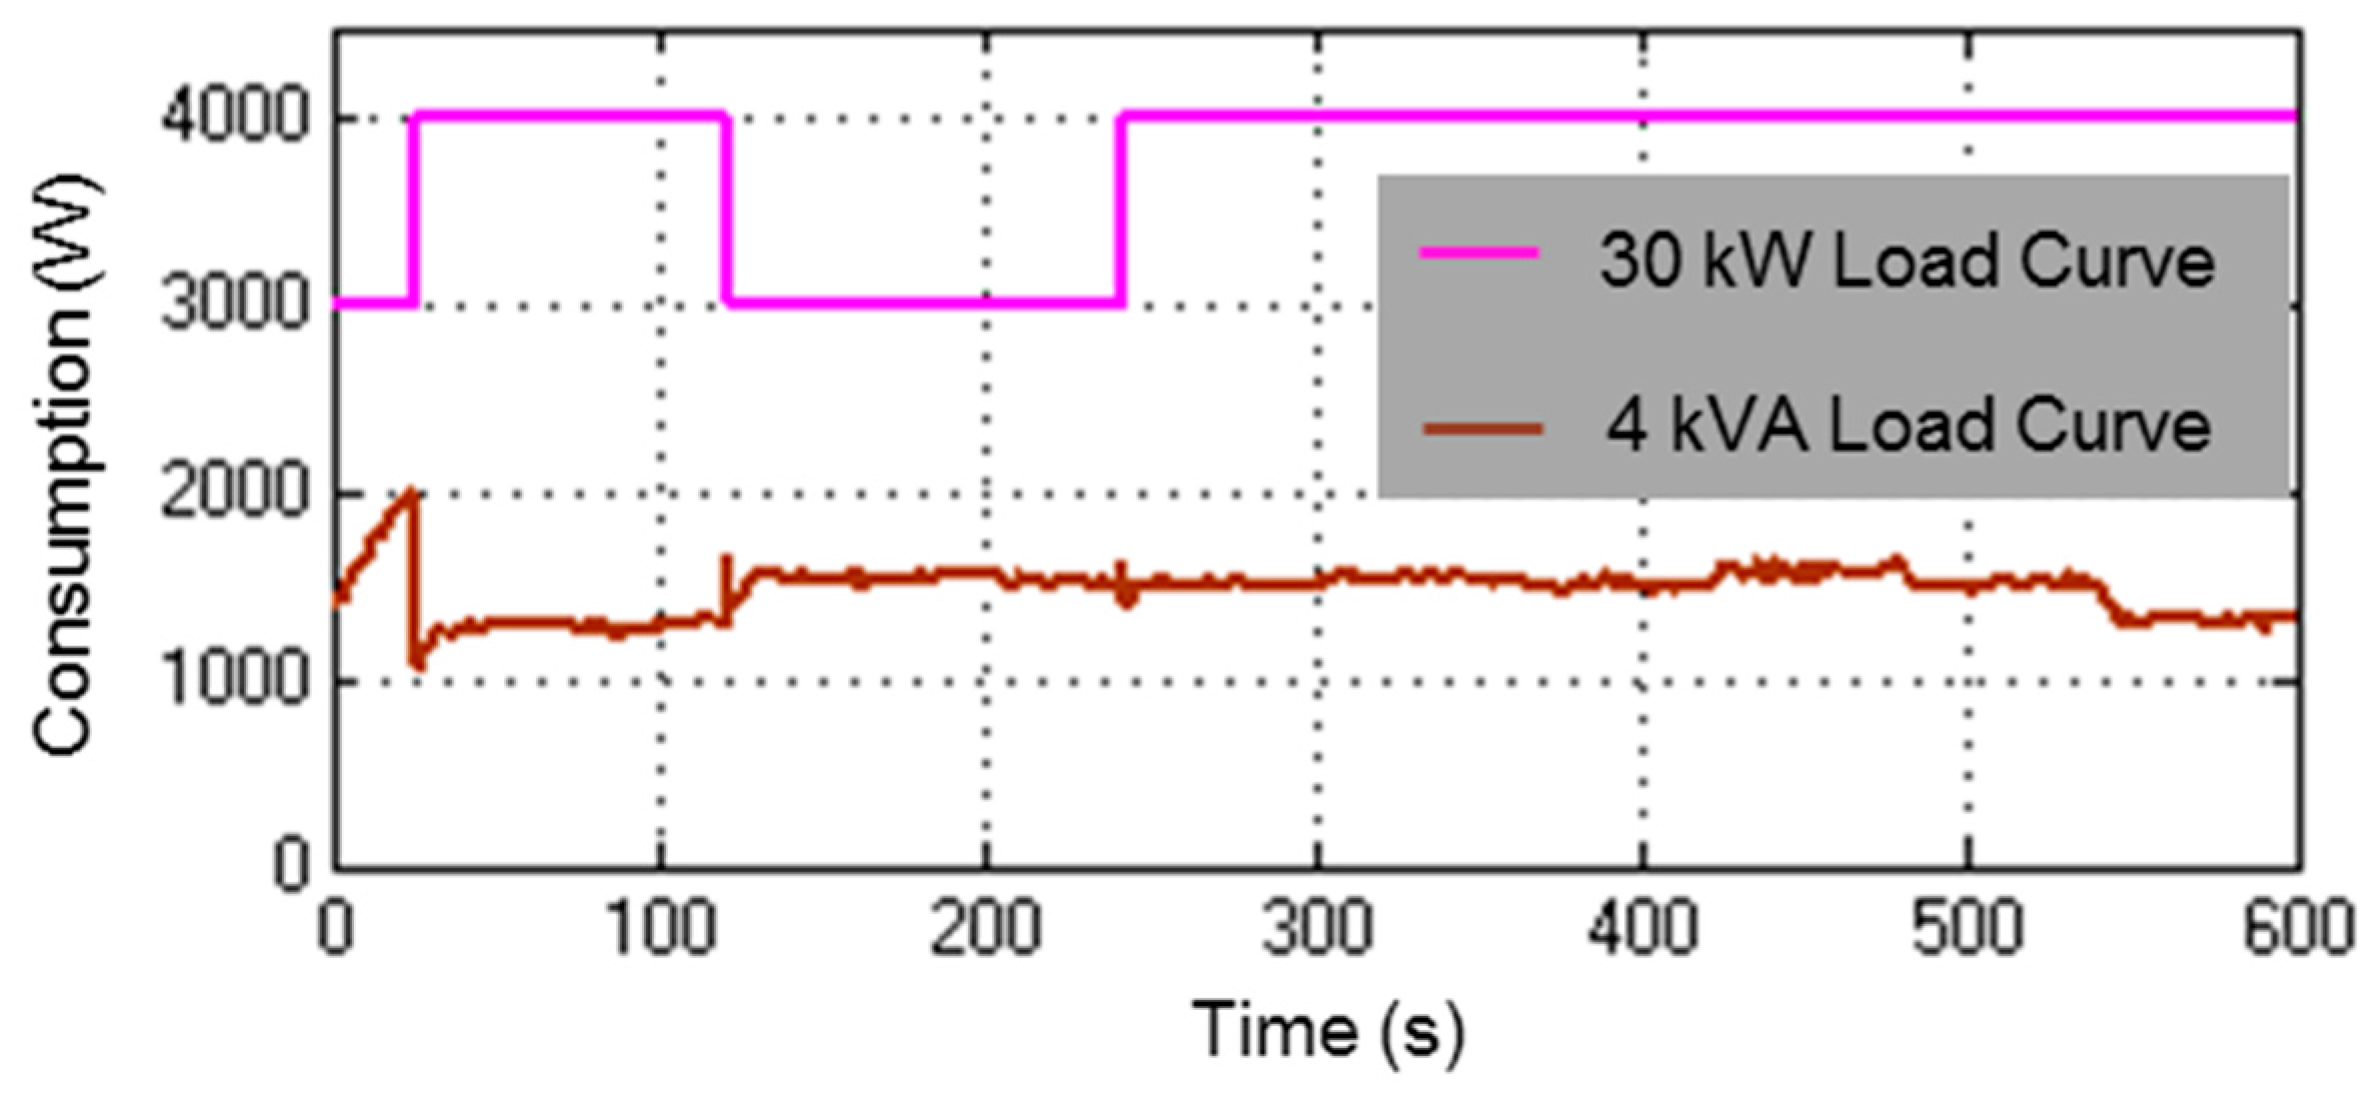
Figure 9 show the final results of the real-time simulation during 10 min. All of the results illustrated in these figures are adapted from OP5600 and MATLAB/Simulink.
As
Figure 7 illustrates, the total amount of consumption of the microgrid has been reduced and shifted to other periods based on the optimization results, which occurred between the second of 120 to 240 (periods 3 and 4). Also, the denotative consumption profiles of the microgrid have been illustrated in
Figure 8. It is obvious that the residential player shifted its consumption; however, the commercial player reduced consumption based on the data received from the OP5600 real-time simulator. Furthermore,
Figure 9 represents the wind production simulated by the wind DG player. This generation curve has been simulated based on the real-time wind speed data provided to the emulator from the OP5600 real-time simulator.


 ,
, 

