An Investigation of the Composition of the Flow in and out of a Two-Stroke Diesel Engine and Air Consumption Ratio


1
Faculty of Electrical Engineering, Mechanical Engineering and Naval Architecture, University of Split, Rudjera Boškovića 32, 21000 Split, Croatia
2
GM TURBO d.o.o., Vukovarska 58, 21000 Split, Croatia
*
Author to whom correspondence should be addressed.
Energies 2017, 10(6), 805; https://doi.org/10.3390/en10060805
Submission received: 11 March 2017
/
Revised: 24 May 2017
/
Accepted: 9 June 2017
/
Published: 13 June 2017
(This article belongs to the Section L: Energy Sources)
Abstract
:The aim of this research was to investigate the mass, substance and energy flow through two-stroke low speed Diesel engines. For this reason, a zero-dimensional model of the combustion in the engine was developed with a calculated amount and composition of exhaust gases. Due to the large amount of oxygen in the exhaust gases, a ratio of real air consumption and stoichiometric amount of air required for combustion of injected fuel was set. The calculated ratio showed that the engine consumed four times more air than needed for combustion in AFRstoich. In this work, this was called the Air Consumption Factor or Ratio, and has not previously been mentioned in scientific literature. The air consumption ratio is defined as a factor of dry or humid air. To be more comprehensive, a modified diagram of the composition of the flow in and out of a two-stroke fuel injection engine and the cylinder was made.
1. Introduction
Low speed, two-stroke, turbocharged diesel engines are the most common marine propulsion engines used today. These engines are the most efficient among others, exhibiting 50% efficiency. The remaining 50% of the energy released from combustion of fuel is lost to the atmosphere as waste heat.
At the beginning of the development of the internal combustion engine, it was recognized that its improvement would be a lengthy and expensive process. Even by the late 1930s, there were established methods to calculate a large number of physical processes in the engine. In other words, there were calculation methods developed that enabled the analysis of the influential parameters of the working processes in the engine, and also provided data for the development of new and improved engine construction methods.
The theoretical background of engine process calculations rests on the work done by List [1]. Alongside this, the development of methods for the design of the high part of the process, taking into account the increasing number of parameters, can be found in [2].
Due to the large impact of changes to the working fluid on the power and efficiency of the engine, developing calculation methods for the low-pressure part of the process are based on the laws of gas dynamics. The simplest one is called the stationary method, which takes into account the processes in the cylinder and distribution devices, ignoring the changes of the gas in front of and behind the valve (channel), based on the work of List [3] and Hasselgruber [4].
The models that are described in the papers of McAulay [5] and Woschni [6] approach the real processes in the engine. The processes in the cylinders are described by differential equations derived from the law of conservation of energy and mass, and also from the equation of the gas state. Moreover, changes in the properties of the gas due to compressibility and dissociation are taken into account.
Boy [7] described in detail the process in a propulsion Diesel engine. The model describes the processes in the engine cylinder, the process in the turbocharger, passage channels, and intake distributor, by the method of “full–empty”.
Some background information on two-stroke engines can be found in Heywood [8] and Richard Stone [9]. The gas exchange processes are comprehensively treated by Sher [10]. The composition of the inlet and outlet flows of a two-stroke engine and the cylinder are shown by Sher [10] and Van Basshuysen et al. [11]. An experimental study of the flow pattern inside a model cylinder of a uniflow scavenged two-stroke engine is presented by Sher et al. [12]. The velocity field as well as the turbulent parameters were mapped under steady-flow conditions with the aid of a hot-wire anemometry technique. Ravi and Marathe [13] in their work showed a multidimensional prediction of the scavenging characteristics of a homogeneous charge uniflow scavenged two-stroke cycle engine. An engine geometry with the same dimensions as a General Motors EMD 710 engine (General Motors, Detroit, MI, USA) was analyzed. A multidimensional program, Cyclic Analysis of Reciprocating Engines (CARE), has been developed for this purpose. The fluid flow problem is subdivided into global and local parts and the two parts are solved simultaneously. Combustion is treated as a stoichiometric heat release phenomenon. The computer program is used to study the effects of port/valve sizes and timings on the scavenging characteristics of the engine, provided that the pressures at the inlet and exhaust ports are held constant. It is observed that a larger inlet port area and early opening-late closing results in a considerable increase in the scavenge ratio, hence resulting in a higher scavenging efficiency and lower trapping efficiency. An increase in the exhaust port area results in an increase in the scavenge ratio, but a decrease in the trapping efficiency; this gives rise to an optimum exhaust area for a given inlet area at which the scavenging efficiency is maximal. Carlucci at al. [14] presented an analytical model for the estimation of the trapping efficiency according to the Oswald diagram to the molar concentration of carbon dioxide and oxygen at the tailpipe and then according to the mass flow of air and fuel.
Larsen et al. [15] investigated two-stroke diesel machinery for ships, with five varying configurations to explore the trade-off between increased NOx emissions and the reduction in fuel consumption. By implementing a waste heat recovery system through the use of an organic Rankine cycle and also a hybrid turbocharger, the fuel consumption and NOx emissions were lowered by up to 9% and 6.5% respectively. Andreadis et al. [16] used a large two-stroke marine diesel engine, operating at its full load to explore pilot injection strategies using simulations of computational fluid dynamics along with an evolutionary algorithm. Guan et al. [17] used a modular zero-dimensional engine model that was built in MatLab and the Simulink environment, to investigate the operation of a large two-stroke marine diesel engine. Engine shop trial values were compared with the derived performance parameters of the engine, which was simulated at steady state conditions. The study purpose of Varbanets et al. [18] was to record the methods by which the ship’s diesel process efficiency could be improved. Under the conditions of the fuel equipment and the normal state of the main diesel system, even load distribution between the cylinders was controlled. From previous research, the authors investigated the possibility of increasing efficiencies of a low speed two-stroke turbocharged main diesel engine operating with waste heat recovery through combined heat and power production [19,20]. Spahni et al. [21] in particular deals with new electronically controlled, two stroke, low speed marine engines. Carlucci et al. [22] compared different architectures (single turbocharger, double turbocharger, single turbocharger with an electrically-assisted turbocharger, with intercooler or aftercooler) designed to supercharge an aircraft two-stroke Diesel engine for general aviation and unmanned aerial vehicles characterized by very high altitude operation and long fuel distance. A 1D model of the purposely designed engine has been used to compare the performance of different supercharging systems in terms of power, fuel consumption, and their effect on trapping and scavenging efficiency at different altitudes. In [23], Carlucci et al. provided several guidelines about the definition of design and operation parameters for a two-stroke two banks uniflow diesel engine, turbocharged with two sequential turbochargers and an aftercooler per bank, with the goal of either increasing the engine braking power at take-off, or decreasing the engine fuel consumption at cruise conditions. The engine has been modelled with a 0D/1D modelling approach. Wang et al. [24] evaluated scavenge port designs for a boosted uniflow scavenge direct injection gasoline engine by 3D computational fluid dynamics (CFD) simulations. In order to fulfil the potential of the boosted uniflow scavenged direct injection gasoline (BUSDIG) engine, various scavenge ports were designed with different scavenge port numbers, axis inclination angles and swirl orientation angles, and their effects were evaluated by 3D CFD under different intake pressures and engine speeds. The scavenging process was analysed by its delivery ratio, trapping efficiency, scavenging efficiency and charging efficiency.
This investigation focused on how to improve efficiency of the diesel engine plant using waste energy contained in exhaust gases and scavenged air. For this purpose we needed information about the quantity of mass, substance and energy flow through the engine, and a 0D model of the combustion and exchange process in the engine was developed. Our 0D program was directly coupled with the NIST-REFPROP Version 9.0 Standard Reference Database [25] so that all physical, chemical and thermodynamic data for all used fluids could be used in our calculations. The calculated amount and composition of the exhaust gases showed a good correlation with the measured results of Maschinenfabrik Augsburg Nürnberg (MAN) Diesel & Turbo. Since our results showed that the amount of air that passed through the engine was several times greater than required by stoichiometric combustion, it was decided to establish a new term: the Air Consumption Ratio. At the end of this paper, the parameters of substantive changes in two-stroke engines with fuel injection are strictly defined. Instead of using the displacement volume as a reference volume which is common in literature, we used Vmax as a reference volume, which is more appropriate for two-stroke engines. For the purpose of connecting the air consumption ratio with two-stroke gas performance parameters, we proposed an improved version of the figure—the composition of the flows in and out a two-stroke engine and its cylinder. We also found that air consumption ratio depended on ratio of the excess air in the cylinder, and the trapping efficiency.
2. Engine Model Description
The propulsion engine model with the main input and output variables is presented in Figure 1. The fluid flow through the engine is steady, while the observer position is stationary with the respect to the control volume surrounding the ship’s engine. Engine inlet consists of fuel and air, and additionally of cylinder oil. Engine outlet consists of combustion products and small amount of emissions. is shaft power transmitted to the propeller while and are heats removed from the engine at temperatures T1 and T2 [26].
The unused heat is rejected at the environment temperature T0 and in this case the environment is the atmosphere and sea water. The heat from the cylinder liner, cylinder cover, lubricating oil and scavenged air is removed by cooling water. The reference state of the environment is standard state; 25.0 °C and 1.00 bar. At steady state conditions the continuity equation is .
The first law of thermodynamics can be written as:
where is total heat output, is shaft power and and are the mass flow rates and enthalpies. The shaft power in Equation (1) is actually technical work. Now, Equation (1) can be rewritten as:
As a result of heat transfer to the environment , its entropy increases for . Therefore and .
Now, the first law of flow processes is:
If the working fluids, control volume and environment are considered to be united as a single isolated system, then according to the Clausius inequality (second law for all processes), the total amount of the change in entropy is:
If all processes are reversible, the maximum output power is:
In the Equation (4) a change in enthalpy shows how much more work would be obtained, when there are no heat exchanges with the environment. Rearranging Equation (4):
or per unit mass flow:
where , is known as the exergy function ζ, and ex is the exergy expended per kilogram of input or output substance.
In the case of the internal combustion engine or a fuel cell, as shown in Figure 1, if the air and fuel enter at atmospheric temperature and pressure, maximum work from the fuel is obtained if the process is in equilibrium and the combustion products leave the system at atmospheric temperature and pressure. If so, the defined state of equilibrium combustion products with the environment, from the Equation (5) per kilogram of reactants, are as follows:
Per kilogram of fuel is:
where:
is the enthalpy of reaction of combustion or the fuel caloric value. The suffix * means a quantity corresponding to one kilogram of fuel, and without suffix * is an amount per kilogram of products. would be a lower caloric value if H2O in the combustion products was in the vapour state, and the higher caloric value if the H2O in the combustion products was in the liquid state.
When the liquid hydrocarbon fuel burns with air and forms carbon dioxide and water, under their full balance with the atmosphere, it is considered as their states with the ambient temperature T0 and the pressures equal to their partial pressures in the atmosphere. In that case, with is equal to fuel a higher caloric value. It follows that for these fuels, . For pure carbon, lower and higher caloric values are the same; for hydrogen, . For gaseous hydrocarbons, is slightly lower in percentage than . But since in practice, the full amount of is very difficult to achieve, the exergy efficiency calculated as ηex=w*tehn/Hd will be used for the purpose of comparison.
2.1. Data MAN B&W CEAS_ERD (Engine Room Dimensioning)
For Newbuilding 447 “Donat” Tankerska plovidba d.d. Zadar, in the shipyard and diesel engine factory SPLIT, a propulsion engine 6S70MC-C7 (Shipyard Split—Division Diesel Engines, Split, Croatia) was chosen with the following characteristics:
| Bore = 700 mm | Stroke = 2800 mm | s/d=4.0 | cm = 8.5 m/s |
| SMCR L1: | n = 91 min−1 | pme=19.0 bar | NMCR = 18,660 kW |
Using MAN B&W CEAS_ERD (Engine Room Dimensioning) [27] with selection of the specified operating point i.e., Specified Maximum Continuous Rating (SMCR) is 100% Nominal Maximum Continuous Rating (NMCR) at 91 min−1 and marked by point L1 on Figure 2.
The optimising point was 85% SMCR and marked with a light blue point on the propeller curve, since normal continuous rating (NCR), which is also service rating (SCR), was 80% SMCR.
Lines L1–L3 and L2–L4 are isobars and referred to the respective mean effective pressure pme, and lines L1–L2 & L3–L4 are isotachs and related to the constant speed n, of the engine. The blue curve that passes through the point L1 is the heavy propeller curve, and it is expected that the voyage of the ship will mainly reflect the actual conditions of navigation as hull fouling (covered by shells and algae), and environmental conditions (waves, wind, ocean currents, etc.).
The optimized power is 15,861 kW at 86.2 min−1, and Service Power or NCR is taken to be 80% SMCR, which is 14,928 kW at 84.5 min−1.
2.2. The Flow of Substances through the Engine
Data for International Organization for Standardization (ISO) ambient condition according to [27] are shown in Table 1 and Table 2 for engine loads from 50% to 100%. Specific cylinder oil consumption be,c.o. is 0.60 g/kWh at all engine loads. From Table 2 is obvious that scavenged air cooler heat had great potential, especially at higher engine loads.
Scavenged air amounts, pressure and temperature were very important for the modelling of mass, substance and energy flow during breathing phase of the two stroke marine diesel engine. Scavenged air cooler heat, jacket water cooler heat and data from Table 1 were necessary for the calculation of waste energy which could be used in waste heat recovery (WHR) processes.
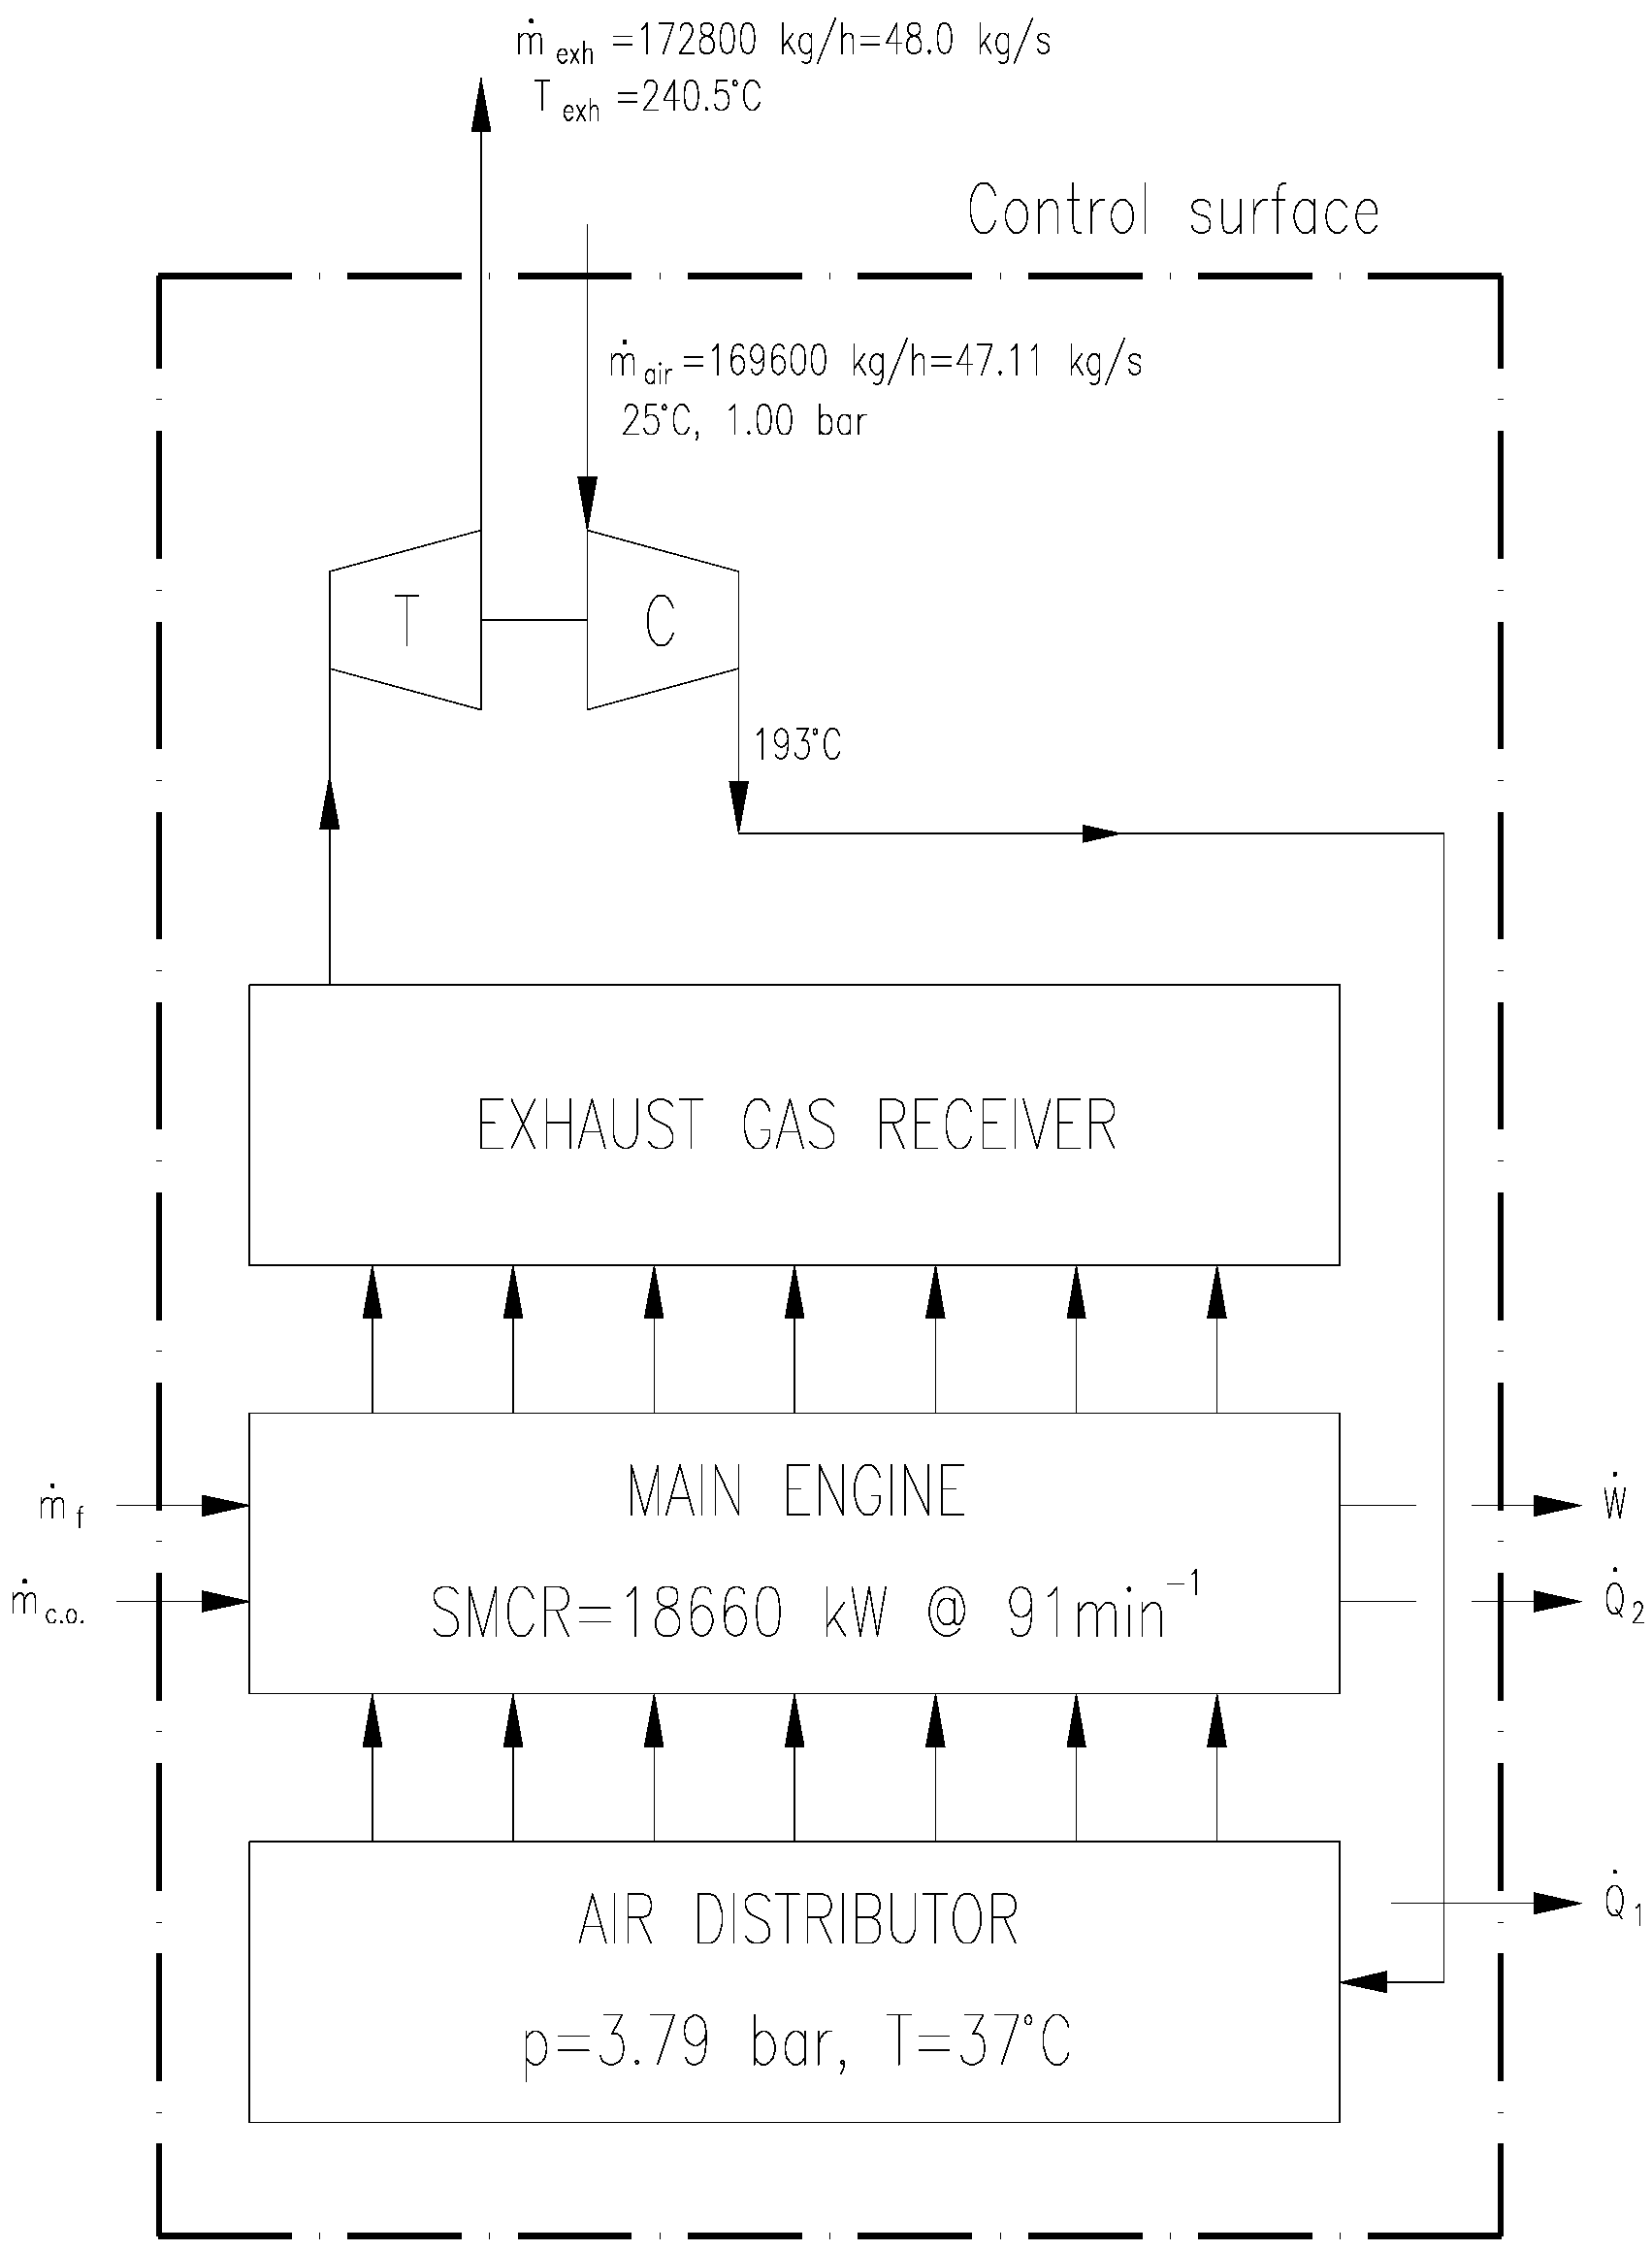
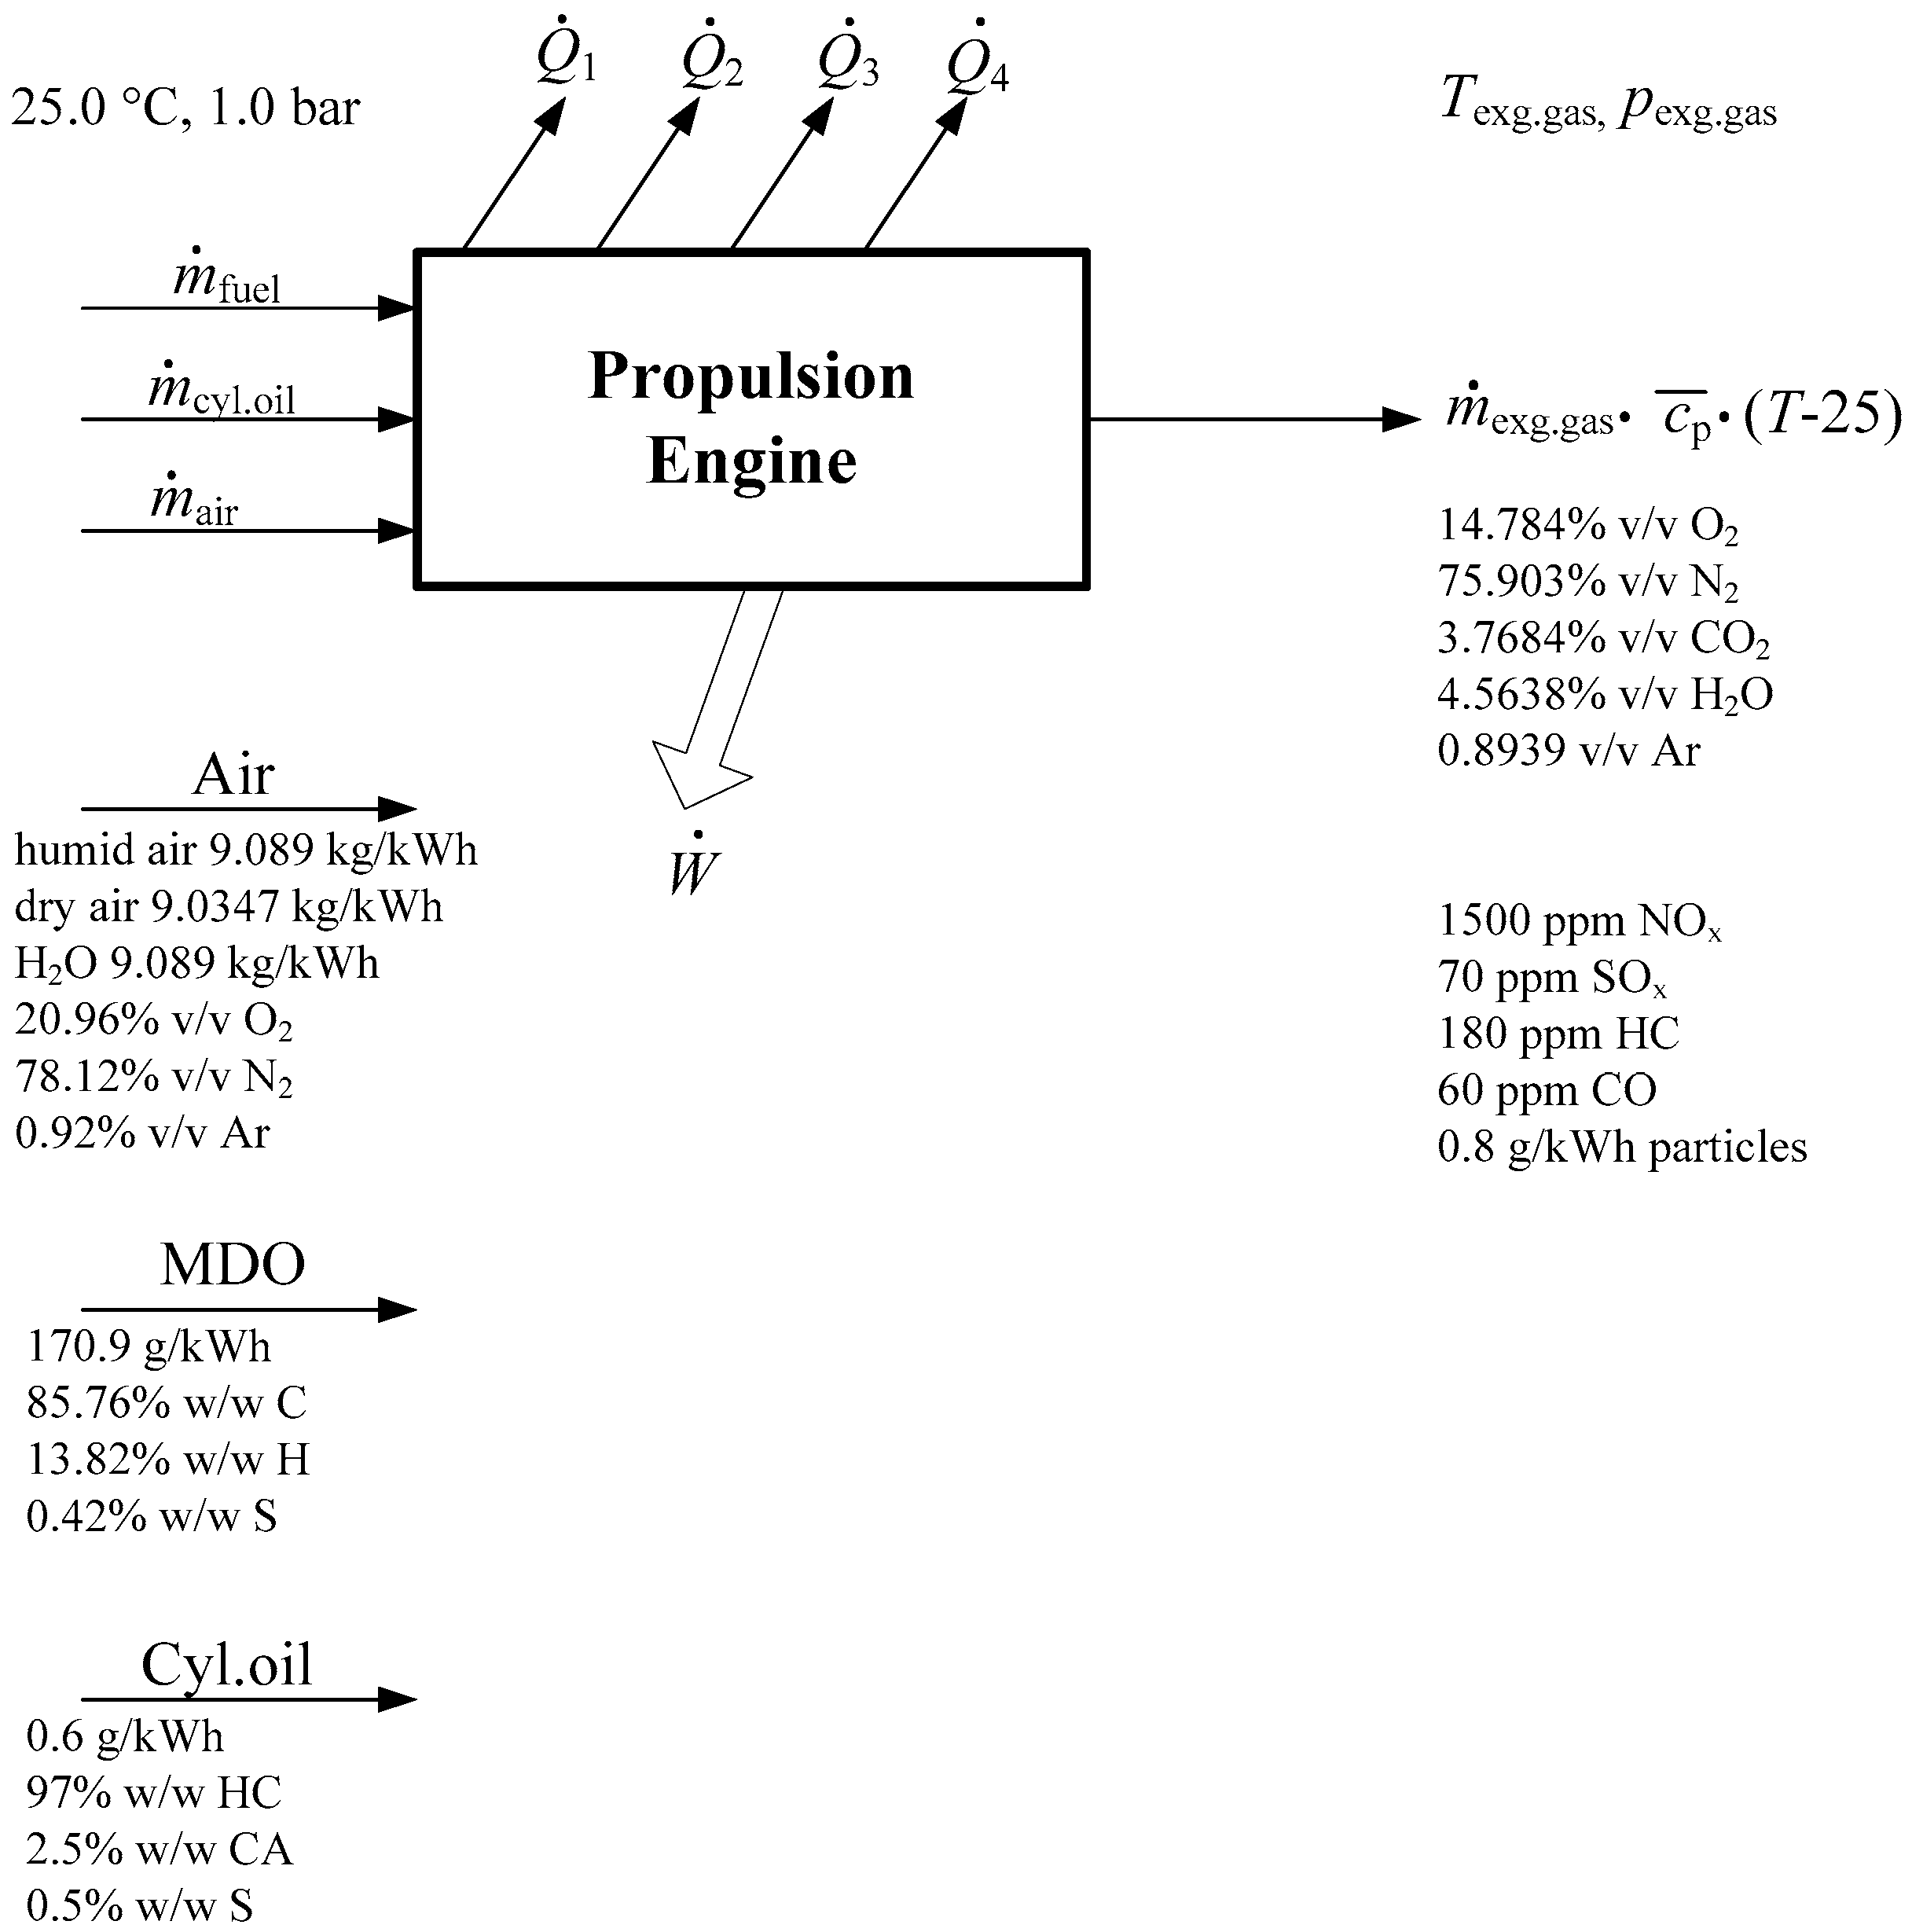
Basic data with mass, substances and energy flow through the engine has been shown on Figure 3 showing mass, energy, shaft work and heat flow through the control surface. In this open circuit heat engine, reactants (fuel and air) cross the control surface at inlet and products of combustion (exhaust gases) leave it at exit, while only work, but no heat crosses the control surface. Note, that the exhaust gases, though hot, convey energy but no heat. and represent heat losses to the environment through cooling water. Cylinder oil was added at engine inlet since most of this oil burns in the cylinder. Air pressure after the turbocharger is 250 mm of the water column and higher than in the air distributor.
At the engine intake, at 100% SMCR and ISO standard conditions (25 °C air temperature at the turbocharger inlet and fresh water cooling temperature, with ambient air pressure 1 bar and relative air humidity Φ=30%).
where x = vapor quality, pws = water saturation pressure [Pa], p=humid air pressure [Pa], and pp = partial vapor pressure [Pa].
2.3. Calculation of Combustion Based on Fuel, Cylinder Oil and Air Consumption
Although the scavenged air consumption was taken from [27] at ISO standard conditions, the composition of the air was calculated by NIST [25] using our initial values. The fuel composition for MDO and cylinder oil composition were also taken into account. The heat input from the fuel was expressed in terms of its lower calorific value, while the fuel and air mass flow rates must meet the following relation:
Specific mass flow through the engine:
where subscript a denotes air, f fuel and c.o. cylinder oil.
AIR
Oxygen content at the inlet of the cylinder:
where N denotes the specific molar flow rate [kmol/kWh], M is molar mass [kg/kmol], and r is the molar and volume fraction.
FUEL
Fuel energy is: .
The amount of carbon, hydrogen and sulfur from fuel at the inlet of the cylinder:
where g is the mass fraction.
CYLINDER OIL
The amount of carbon and hydrogen from cylinder oil at the inlet of the cylinder:
Sulfur content at the inlet was ignored as the size of a lower order.
Calculation of the amount of unburnt fuel and cylinder oil in exhaust gases
The mass of hydrocarbons entering the cylinder:
The hydrocarbon (HC) share in the total mixture of the reactants is .
Emissions and unburnt fuel in the exhaust gases
According to MAN data for measured emissions of MC/ME low speed diesel engine are:
- 1500 vppm NOx (90% ÷ 95% NO and 5% ÷ 10% NO2)
- 70 ppm SOx
- 60 ppm CO
- 180 ppm HCN + O → NO
- The stoichiometric amount of oxygen required for combustion:C + O2 → CO2H2 +1/2 O2 → H2OS + O2 → SO2
2.4. Air Consumption Ratio/Factor
Now, the air consumption ratio/factor is:
which is a ratio of oxygen entering the engine to oxygen necessary for stoichiometric combustion of fuel.
The stoichiometric (dry air) air-fuel ratio is:
The mole fraction of the fuel is difficult to calculate because the exact composition of the fuel is unknown. Therefore, the calculation is done by mass fraction.
Since the stoichiometric combustion of 0.1709 kg fuel/kWh required 0.01808288 kmol O2/kWh, this will be a set ratio with the amount of O2 in dry air.
Now, the amount of O2 and other components in air (N2 and Ar) in kg/kWh necessary for ideal stoichiometric combustion of 0.1709 kg/kWh fuel can be calculated.
The AFRstoich for fuel combustion (without cylinder oil):
The minimum amount of air required for combustion of fuel:
And air consumption ratio can be defined as:
2.5. Calculation of Exhaust Gas Composition Using NIST Refprop09
The pressure drop through the exhaust system (spark arrestor, exhaust gas silencer, exhaust gas boiler and piping was given by Aabo [28].
The total quantity kmol/kWh in the exhaust gases:
The share of components in the exhaust gases:
where “i” is the index of chemical ingredients in the mixture of exhaust gases.
2.6. The Composition of the Flow in and out of a Two-Stroke Engine and the Cylinder
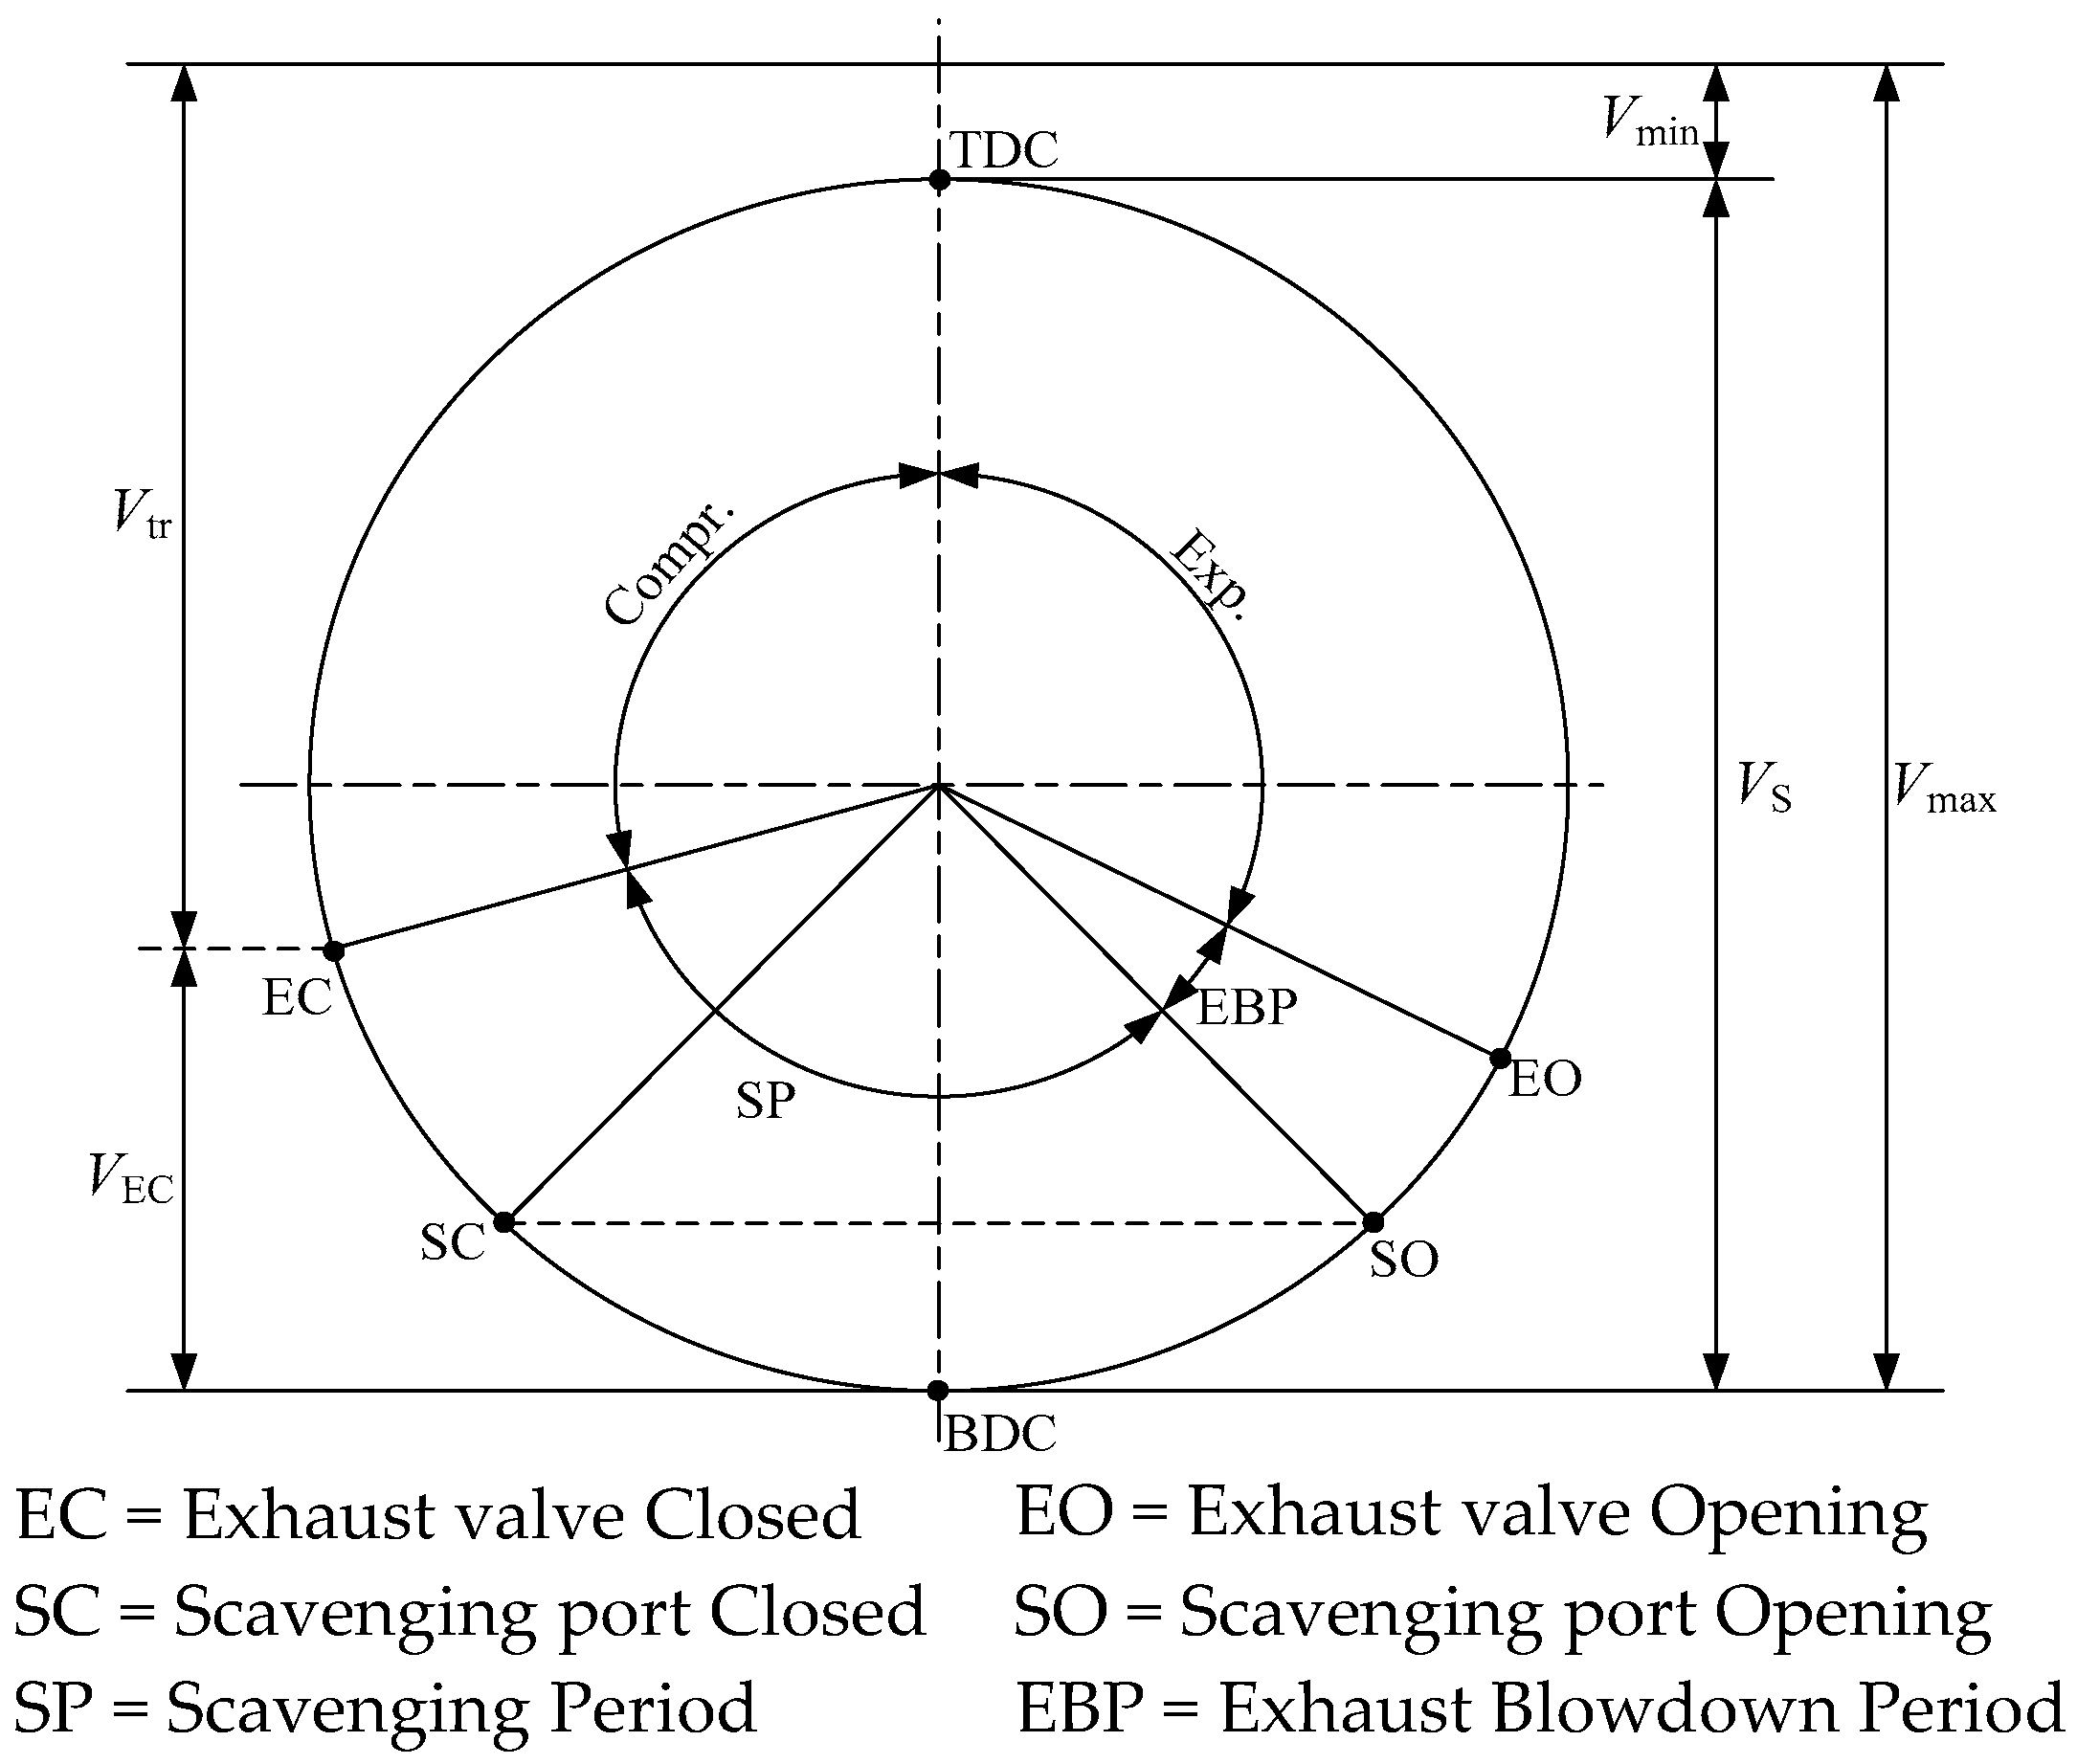
The absence of separate induction and exhaust strokes in two-stroke engines is fundamentally different from four-stroke engines. In the two-stroke engine, after a short blowdown exhaust at the end of expansion, the gas exchange process has induction and exhaust processes occurring simultaneously when the piston is near bottom dead centre (BDC). The most efficient scavenging process is the one whereby the products of combustion are completely replaced by a fresh charge, at the charge pressure and charge temperature. In fact, the fresh charge does not replace the products of combustion by a perfect displacement mechanism, and charging efficiency will be always smaller than unity. Another very important feature of the two-stroke exchange gas process is the unavoidable need for supercharging or turbocharging, which is not necessary in four-stroke engines. In Figure 4, the timing diagram for a two-stroke engine is shown.
When defining the parameters of substance changes in the two-stroke engine with fuel injection, the following symbols will be used:
- psc = scavenge air pressure at the entrance of scavenging ports
- Tsc = scavenge air temperature at the entrance of scavenging ports
- Ts = gas temperature in cylinder at the end of scavenge process
- msc,h = mass of humid air delivered to the cylinder/cycle at pressure psc and temperature Tsc
- msc,d = mass of dry air delivered to the cylinder/cycle at pressure psc and temperature Tsc
- ma,H2O = mass of water delivered with humid air to the cylinder/cycle at pressure psc and temperature Tsc
- mar = mass of fresh air retained in the cylinder/cycle
- mar,t = total air mass in the cylinder/cycle after scavenging port closed (SC) and exhaust valve closed (EC)
- mr = residual mass of gases in the cylinder/cycle
- mrp = residual (recirculated) mass of products in the cylinder/cycle
- mtr = mar + mr = mass of trapped charge (fresh air and residual gas in the cylinder/cycle) after SC and EC
- m′ = mass of air that could be caught in the cylinder/cycle at a pressure psc and a temperature Tsc
- ma.d. stoich = mass of dry air required for stoichiometric combustion in the cylinder/cycle
- ma.h. stoich = mass of humid air required for stoichiometric combustion in the cylinder/cycle
- ma,excess = excess air in the cylinder/cycle
- ma.d.,s–c = mass of dry air, direct blowout from cylinder/cycle
- mf = the mass of fuel injected into the cylinder/cycle
- mco = the mass of cylinder oil injected into the cylinder/cycle
- ma.d. out = the total mass of the dry air at the outlet of the cylinder/cycle
- mp = mass products of combustion at the exit from the cylinder/cycle (including moisture from the air and emissions)
- mexh = the total mass of the exhaust gas at the outlet of the cylinder/cycle
- mp = mreact = ma,d. stoich + ma,H2O + mf + mco
- mexh = msc,h + mf + mco = mp + ma.d.out
Figure 5 is very important and it enables proper definition of the parameters of working fluid exchange in the two stroke engines. Such a figure was first suggested by Sher [10] and gradually modified and improved. Figure 5 is significantly improved compared to the same figures presented in [8,9,10,11]. In this figure, fuel was introduced as one of the important constituents which passes through the cylinder. Also, humid air intake, which takes part in combustion, is shown as dry air and water.
The parameters of working fluid exchange can be now defined according to Figure 5:
- (a)
- Delivery ratio (Scavenge ratio) Λd:
This compares the actual mass of air for scavenging the engine to the one required by the ideal turbocharging process. The reference mass is defined as the product of the cylinder maximum volume and the density of the ambient air or with a high supercharging engine as the product of the cylinder maximum volume and density of air in the air distributor.
- (b)
- Charging efficiency ηch:This shows how successfully the cylinder volume is filled with fresh air.
- (c)
- Scavenging efficiency ηsc:
This indicates to what extent the residual (recirculation) gases in the cylinder mr are replaced by a fresh charge mar.
The total mass of charge (trapped cylinder charge) is the sum of the mass of fresh air mar,t, the mass of burnt gas, and the mass of unburnt fuel from previous cycle mrp.
- (d)
- Retaining Efficiency ηrt:This shows how much air comes directly to the exhaust.The charging efficiency can be defined in terms of the delivery ratio and retaining efficiency:
At the closing of the scavenging ports and exhaust valve, the retaining efficiency becomes the trapping efficiency.
- (e)
- Trapping efficiency ηtr
- (f)
- Relative charge (Volumetric efficiency) Λtr:
The factor of relative charge is an indication of the degree of charging, and it is the ratio of charging efficiency and the scavenging efficiency:
When the reference mass in the definition of the delivery ratio is the air and gas mass trapped in the cylinder mtr (or a close approximation of it), then:
- (g)
- Air-fuel ratio (AFR) for stoichiometric fuel combustion:
The minimal quantity of air necessary for stoichiometric burning of injected fuel: refers to the dry air. Now:
- (h)
- The excess air in the cylinder, and the relative ratio Λexcess is:where Φ is equivalence ratio.
- (i)
- The air Consumption Factor/Ratio :
In the steady state flow, or .
3. Results and Discussion
Results of our calculations are:
% unburnt fuel = 0.9625%
% unburnt fuel and cylinder oil = 1.2986%
Thus, the total amount of unburnt hydrocarbons from fuel and cylinder oil is 1.3% over the adjusted values.
From the point of view of energy balance, emissions do not play a significant role. Depending on the design of the engine, the amount of unburnt fuel can reach more than 3%. However, due to environmental pollution, today much attention is paid to reducing emissions and reducing the CO2 content in the exhaust gases. As of 14 March 2011, from MAN Diesel & Turbo data, modern 6SME-C diesel engines have emissions of only 0.3 g/kWh CO and 0.4 g/kWh HC. In the engine reported on here, total unburnt hydrocarbons from fuel and cylinder oil in SMCR was 2.227 g/kWh (HC, CO, soot), of which the fuel was only 1.645 g/kWh. Results of our calculations are presented in Table 3, Table 4, Table 5, Table 6, Table 7 and Table 8.
The minimum amount of air required for combustion of fuel:
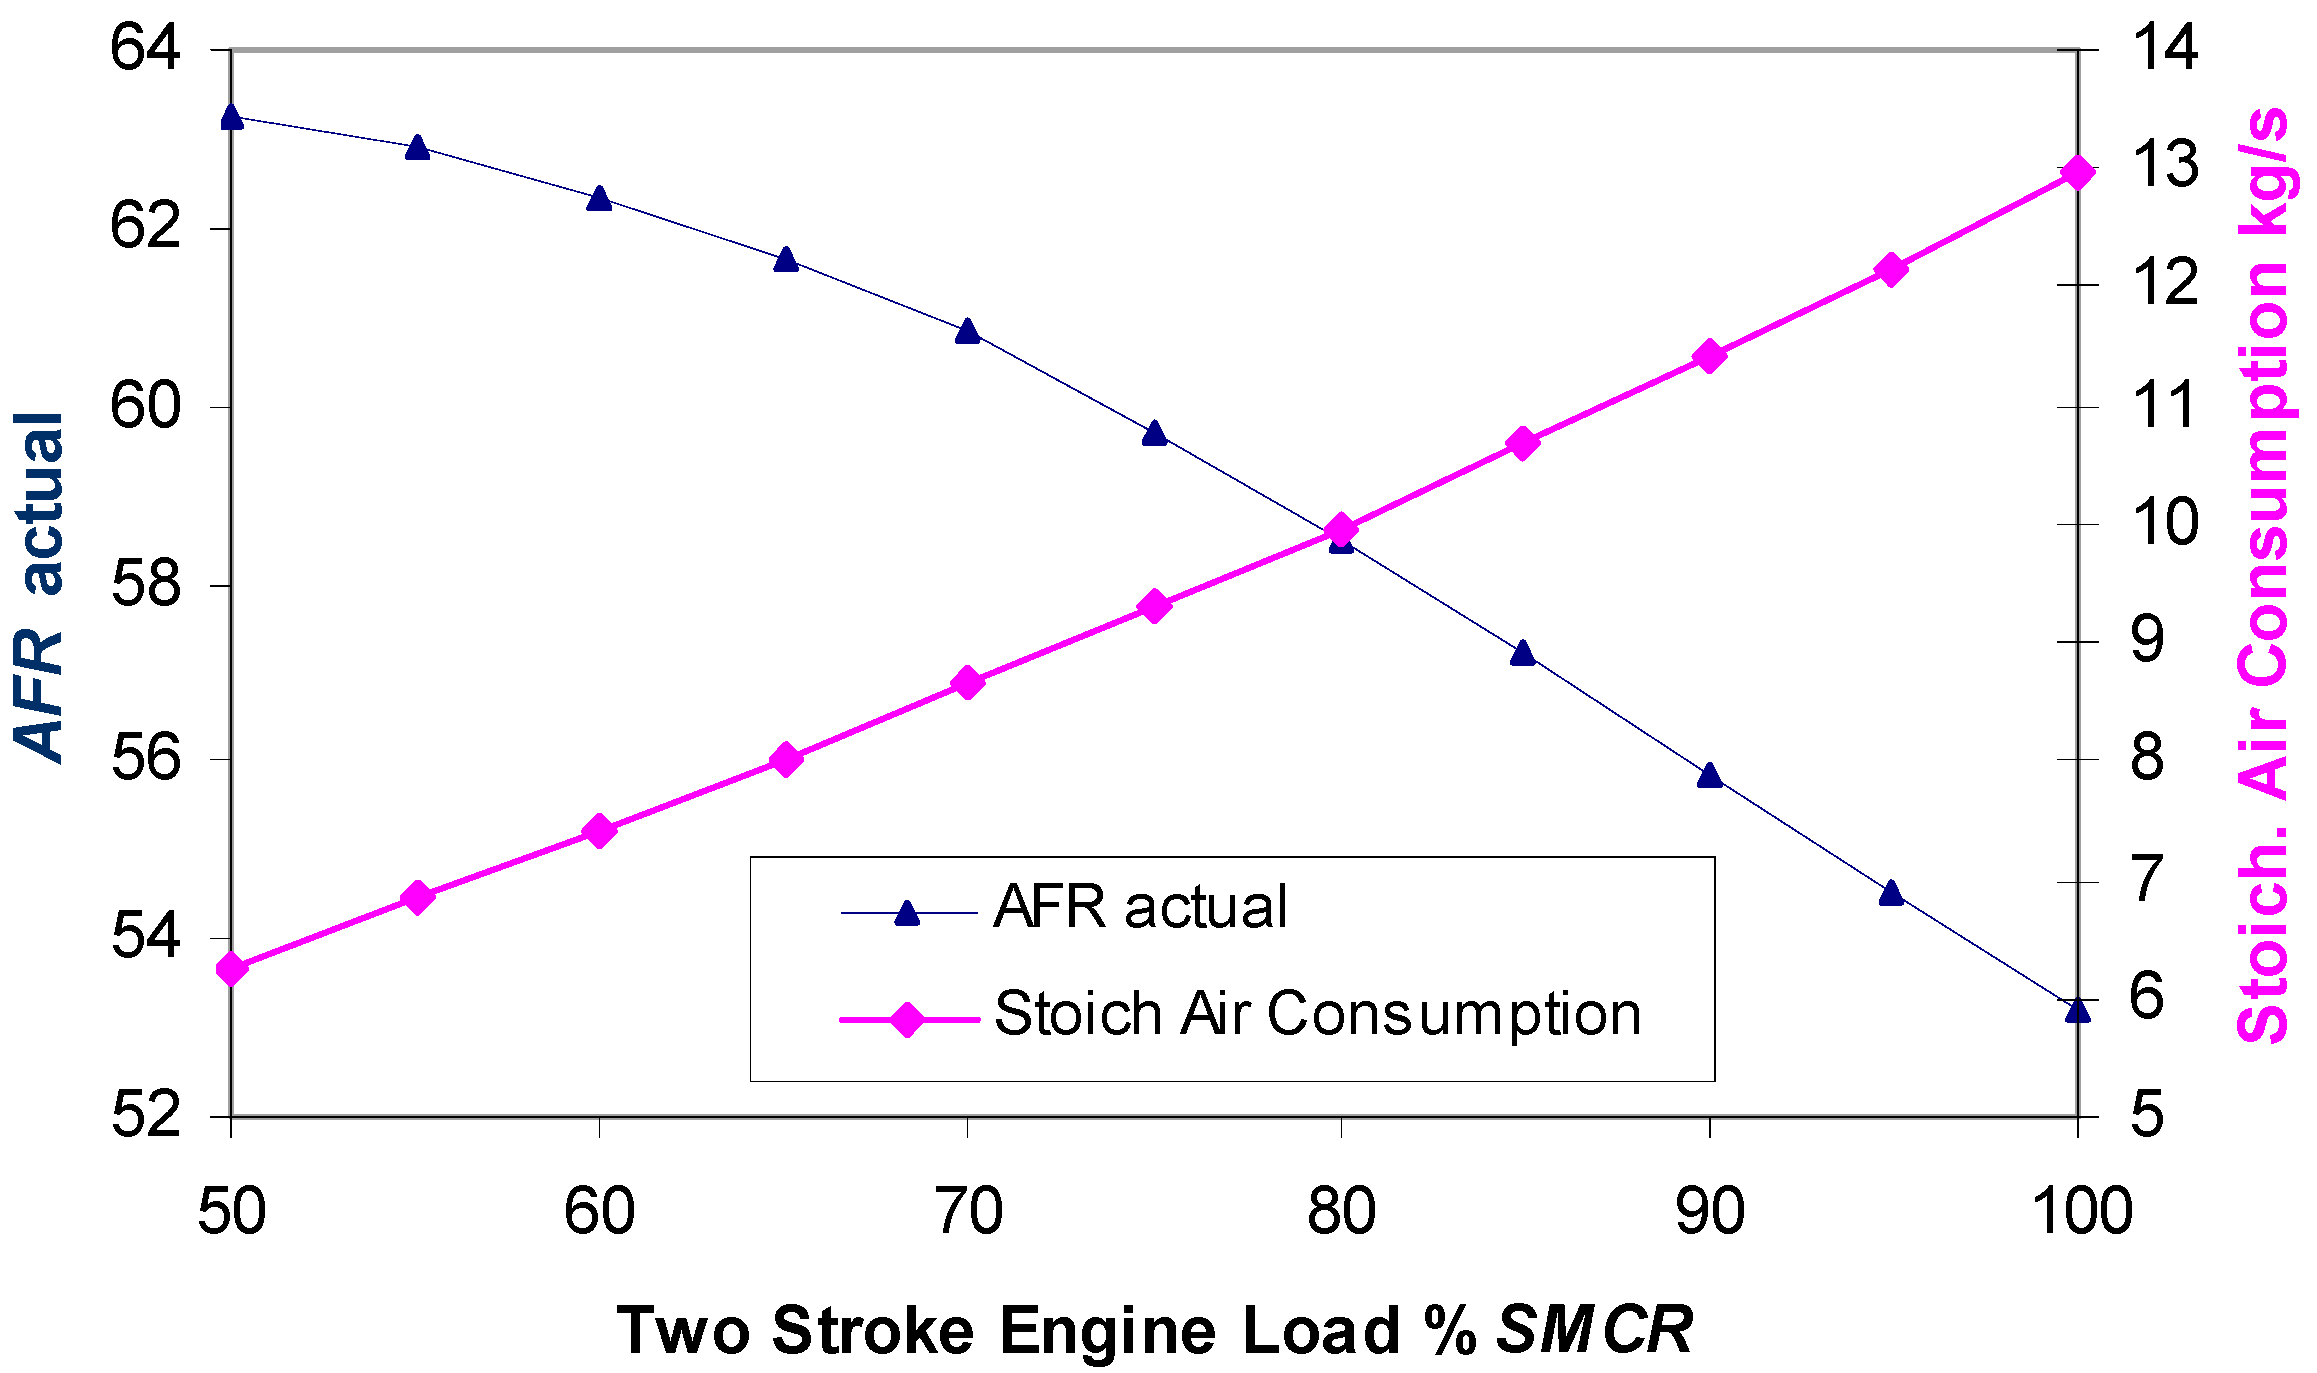
Figure 6 shows AFRactual and stoichiometric air consumption change with main engine loads. Actual (total) AFR was very close to the results presented in the work of Guan et al. [29] for the main engine load from 50 to 100% SMCR.
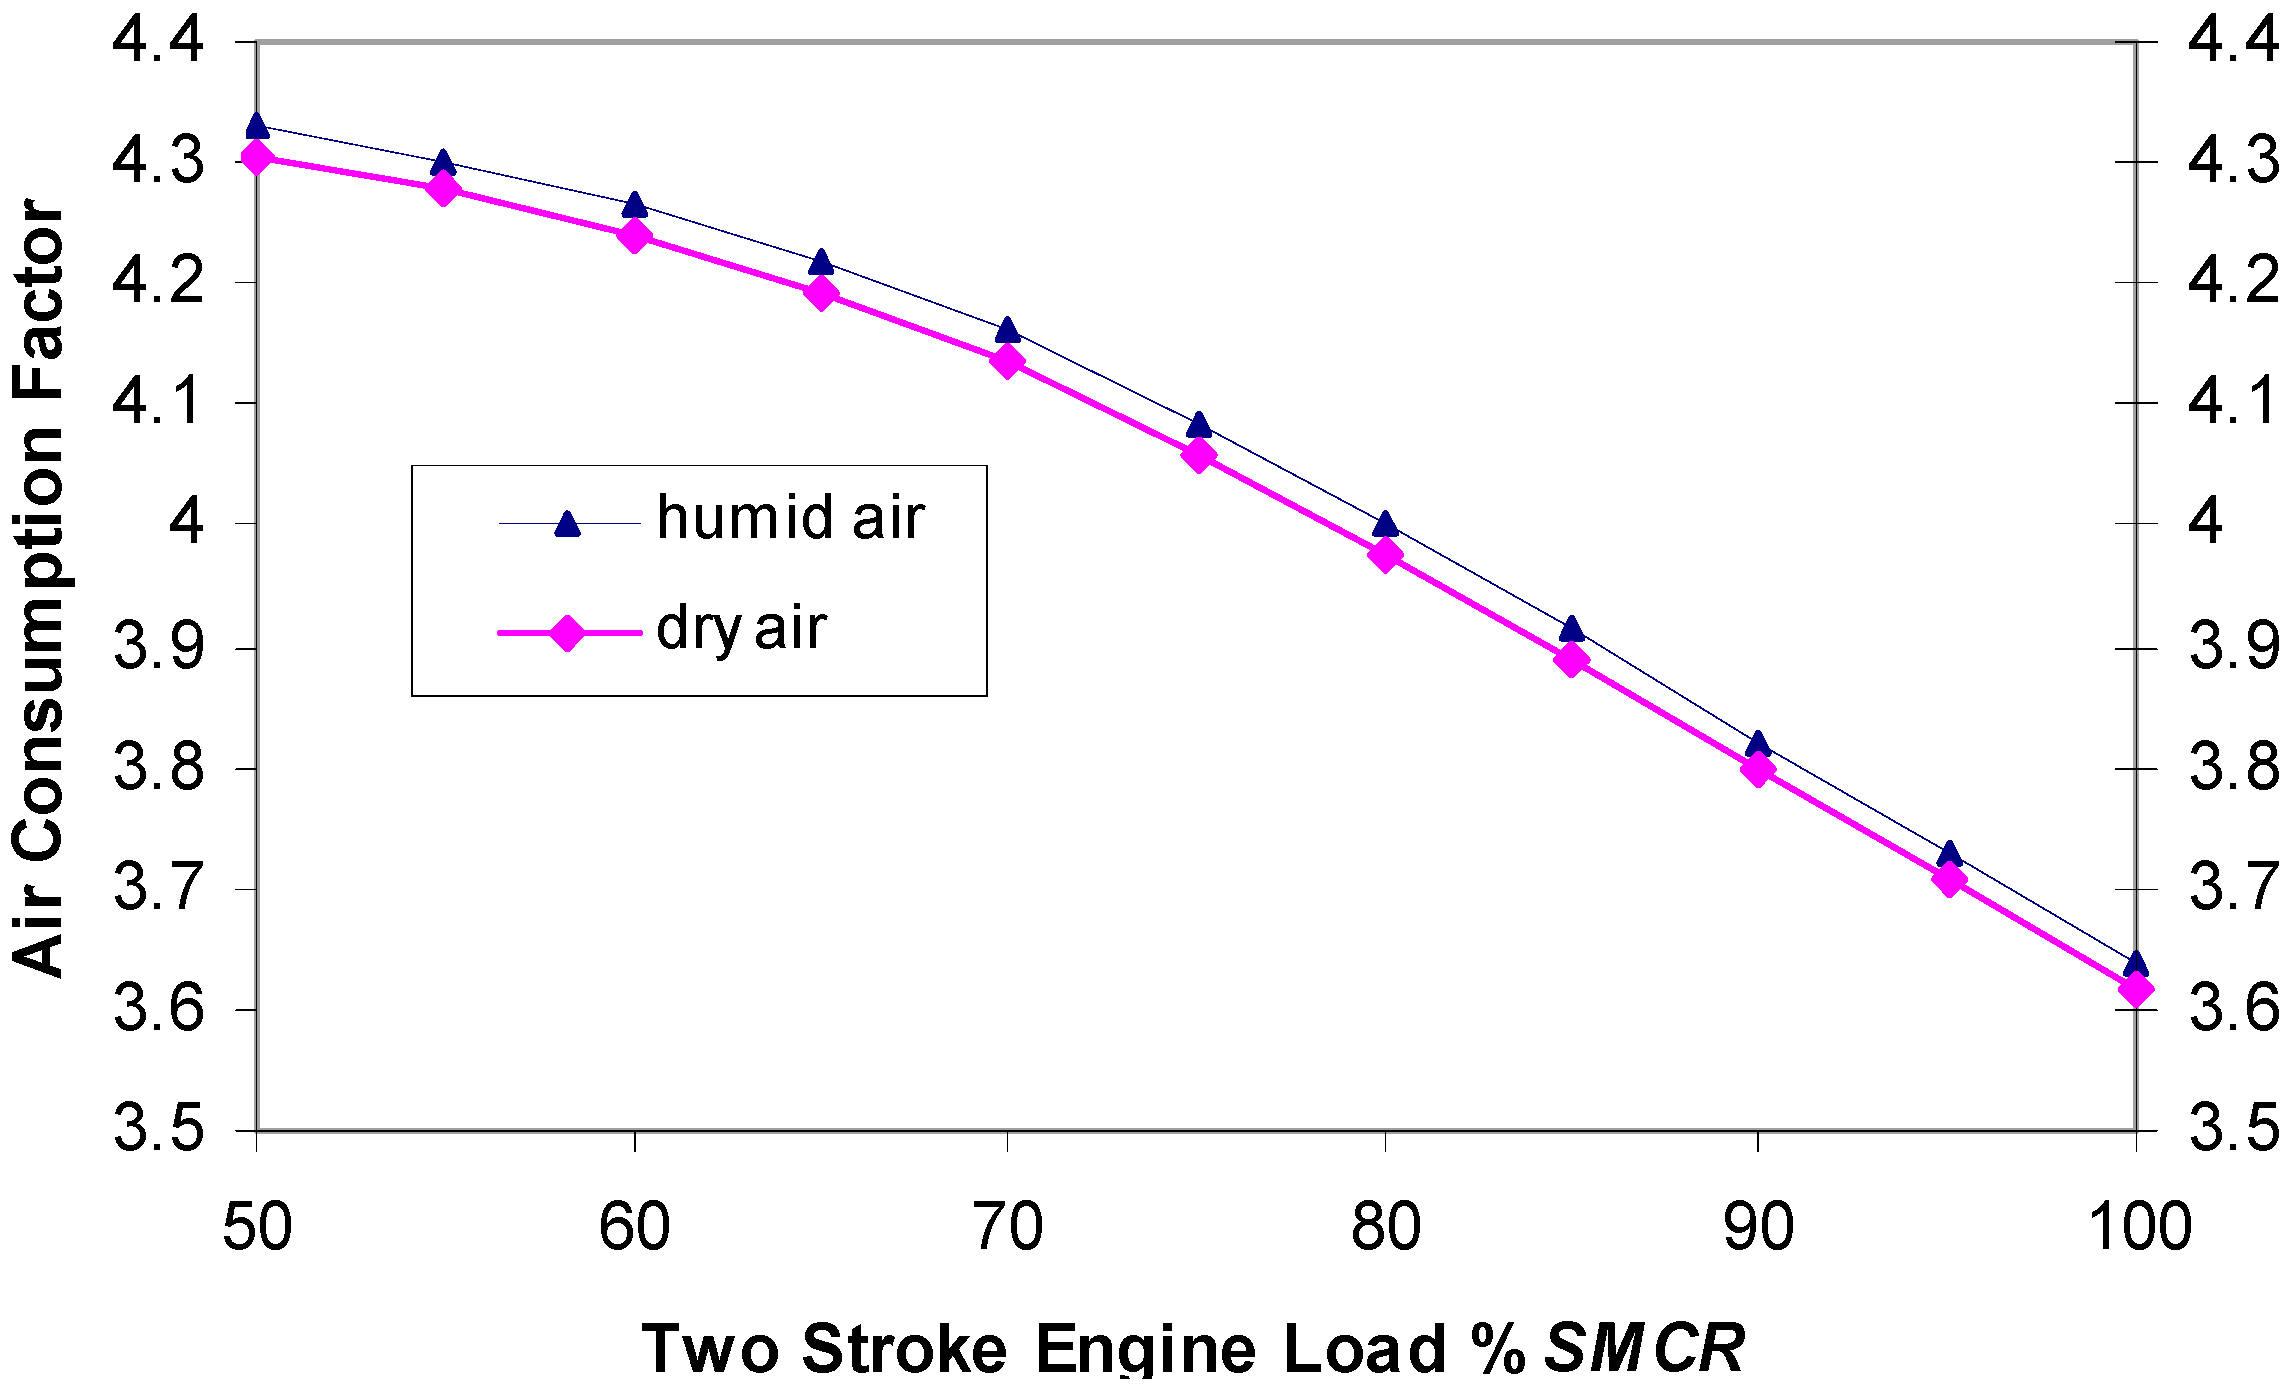
In this work, a new term was defined, the air consumption ratio/factor. This factor can be applied for two-stroke engines, especially for two-stroke fuel injection spark ignition engines, and for two-stroke diesel engines. Since the engine runs humid air, is the definition which should be used, although is a more useful definition. Figure 7 shows changes of the air consumption ratio in the function of the main engine load for humid air and calculated dry air. At service power which is usually 80% of SMCR, air consumption was four times larger than necessary for stoichiometric combustion.
In Figure 8, cylinder oil and emissions data were from the MAN source [27]. The inlet amount of air was from MAN data, but the composition was calculated using NIST program. The MDO data were data from the diesel factory—the shipyard SPLIT. Exhaust gas composition was calculated by our 0D program in combination with the NIST program. Although emission data was oriented, it was assumed that the figures relating to the emissions of NOx, CO, HC and particles when using HFO were very close to the actual values of the MDO fuel, for which our calculation was made. This assumes that all the cylinder lubricating oil entered and burned in the combustion chamber, and the small percentage that was scraped by the piston rings and remained below the piston was negligible.
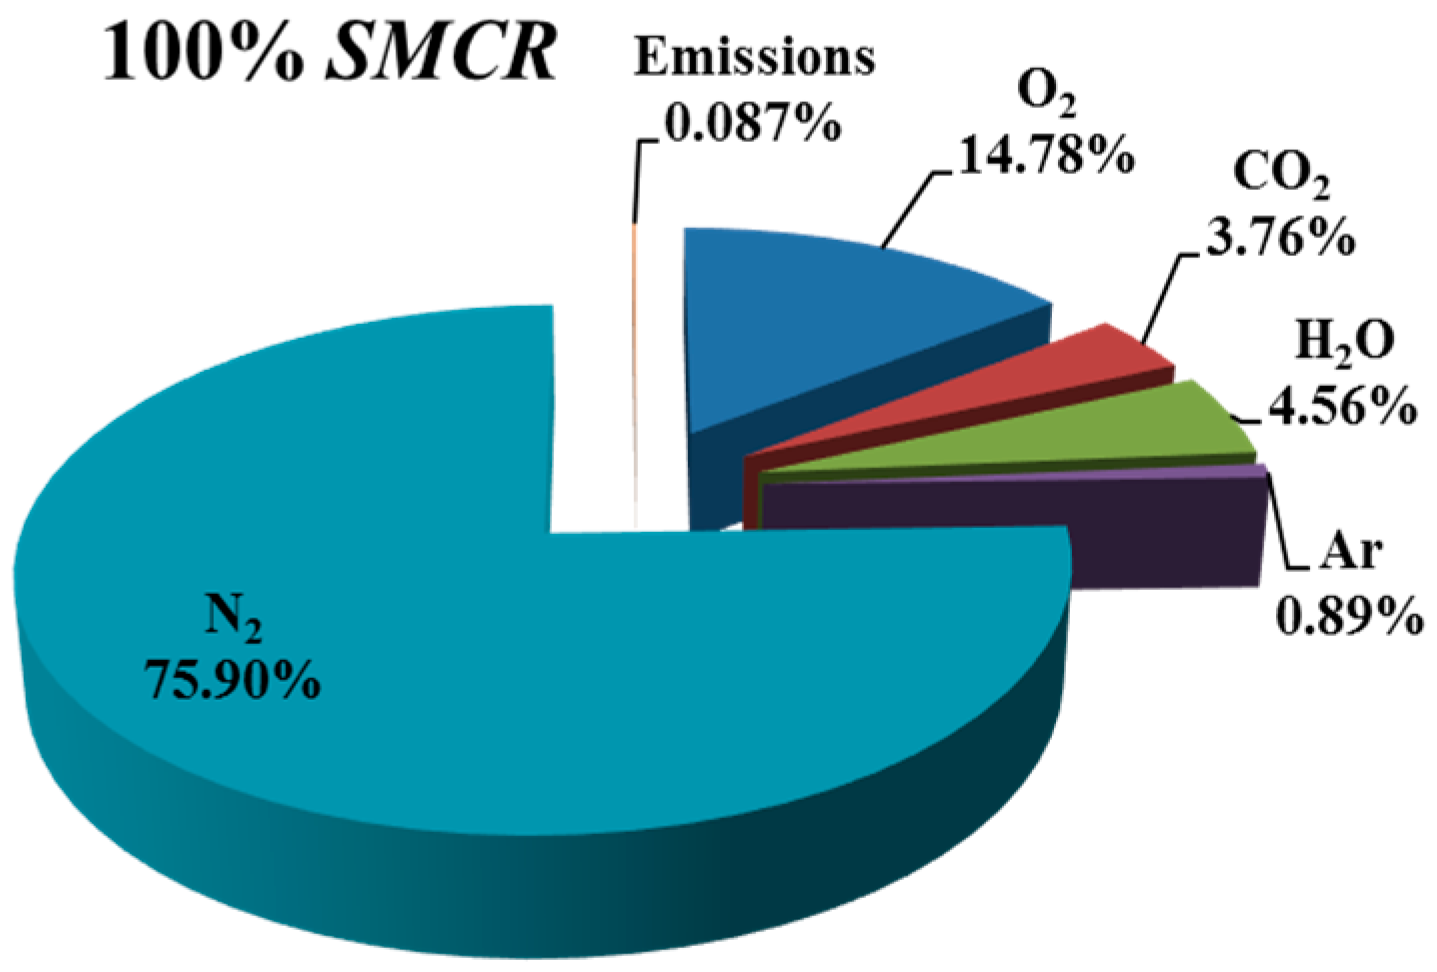
The size of the lower order NOx and SOx in the exhaust gases was ignored, while unburnt HC and soot (C) in the calculation was taken over hexane whose calorific value approximately corresponded to the calorific value of MDO. In order to simplify the exhaust gas calculation, SO2 was included in CO2. Results of our calculation for volume/molar composition are shown in Figure 9 for 100% SMCR engine load. Table 9 shows the exhaust gas composition over 50% to 100% of main engine load.
Table 9 shows that there was no drastic change in the composition of the exhaust gas in the main engine load ranging from 50 to 100 SMCR. The biggest change was in the composition of CO2 and H2O as expected. The oxygen proportion in the exhaust gas was high and ranged from 15.73% (50% SMCR) to 14.78% (100% SMCR). The main reason was a short circuiting of air during the gas exchange process. The high consumption of air helps to clean exhaust gases in the cylinders, but also lowers the temperature of the exhaust gases, whose energy could be used in the WHR system. It also requires a higher capacity turbocharger. At the service power (80% SMCR), the engine consumed four times more air than is required for stoichiometric fuel combustion.
Thanks to Dr Fredrik H. Andersen from MAN we obtained the results of performance measurements, exhaust measurements and fuel specification and consumption conducted by MDT for an undisclosed 6S70MC-C7 engine. The data we obtained from Dr Andersen were for validating the model, and not for publication since the data are confidential. Even though used MDO was not the same as the fuel used in our calculation, and the tested engine probably had different piston geometry, atomizer and engine lay-out, there were very good correlation between our results and factory test measurements performed.
4. Conclusions
This work developed a 0D model of combustion in a diesel engine. It was applied on a 6S70MC-C7 low speed engine, and by using the NIST program, thermodynamic parameters of air and fuel at the inlet of the engine and parameters of the exhaust gases were obtained. Our results were in very good correlation with MAN Performance measurements and exhaust measurements conducted on the same engine type.
The obtained data show that the composition of exhaust gases did not change significantly in the range of 50 to 100% SMCR. Also, it is observed that the quantity of oxygen in exhaust gases in the complete observed range was high at a value ca. 15% (v/v). Dividing the total quantity of air which enters the engine with the air quantity required for the stoichiometric combustion, the air consumption ratio/factor was obtained and is shown in Figure 7; this parameter has not been previously used in scientific literature. In the main engine service rating, this factor value was at about four, which means that at this engine load it consumed four times more air than was required by stoichiometric combustion. The reason for this is that a great quantity of air flows directly from the air distributor to the exhaust during the exchange of working fluid. This achieves better blowout of cylinders and less residual exhaust gas in the cylinders, but decreases the exhaust gas temperature, therefore it lower efficiency of the WHR process. Further, for such a high quantity of fresh air, a turbo charger at higher capacity was required, which additionally decreases the energy of exhaust gases available for WHR process. Better swirling flow within the cylinder and bigger diameter of exhaust valve could probably decrease the air consumption ratio.
The new term is defined as and . Since, humid air passes through the engine, should be used, although would be more useful. Although displacement volume Vs is used as a reference volume in literature, we used Vmax for two stroke engines, which is much more appropriate.
Analysis of scavenge parameters of two stroke engines shows: . This shows that air consumption ratio depended on the relative ratio and trapping efficiency. It is necessary to keep high the relative ratio to about 2, which means controlled/lower peak temperature, which is the main parameter governing NOx formation. Better trapping efficiency can be achieved by decreasing the mass of air in the direct blowout cylinder. By measuring and calculating the air consumption ratio and relative ratio, trapping efficiency can be calculated.
Figure 5 shows the flow of working substances in a cylinder and from the cylinder according to the [10,11]. Figure 5 is a modified and significantly improved version of the figures shown in the literature [11], particularly in relation to [8,9,10]. Two-stroke gas flow performance parameters can be easily defined using the improved diagram in Figure 5.
Acknowledgments
The authors would like to thanks Fredrik H. Andersen, Development Engineer of MAN Diesel & Turbo, Performance and Emission (LDF2), Marine Low Speed Research & Development, Copenhagen SV—Denmark for his valuable and helpful technical information. This work was supported by the Ministry of Science, Education and Sports of the Republic of Croatia.
Author Contributions
Original idea for this manuscript was suggested by Mirko Grljušić who also performed calculations and done most of the drawings. Ivan Tolj repeated complete calculations and proof the results of Mirko Grljušić calculations. Ivan Tolj also made part of the figures. Discussion and results analysis was done by Mirko Grljušić, Ivan Tolj and Gojmir Radica. All authors read and approved the final version.
Conflicts of Interest
The authors declare no conflict of interest.
References
- List, H. Thermodynamik der Verbrennungskraftmaschine; Serija List—Verbrennungskraft Maschine, Band 2; Springer Verlag: Wien, Austria, 1939. (In German) [Google Scholar]
- Vibe, I.I. Novoe o Rabočem Cikle Dvigatelei; Mašgiz: Moskva-Sverdlovsk, Soviet Union, 1962. (In Russian) [Google Scholar]
- List, H. Der Ladungswechsel der Verbrennungskraftmaschine; Der Zweitakt, Serija: List- Verbrennungskraftmaschine, Band 4, Teil 2; Springer Verlag: Wien, Austria, 1950. (In German) [Google Scholar]
- Hasselgruber, H. Verallgemeinerte Berechnung des Stationären Ladungswechsel von Verbrennungskraftmaschinen. Forsch. Ing. Wes. Nr. 1961, 5, 129–142. (In German) [Google Scholar] [CrossRef]
- McAulay, K.J.; Wu, T.; Chen, S.K.; Borman, G.L.L.; Myers, P.S.; Uyehara, O.A. Development and Evaluation of the Simulation of the Compression—Ignition Engine; SAE Paper 650451; SAE: Warrendale, PA, USA, 1965. [Google Scholar]
- Woschni, G. Elektronische Berechnung von Verbrennungsmotor-Kreisprozessen. MTZ 1965, 26, 439–446. (In German) [Google Scholar]
- Boy, P. Beitrag zur Berechnung des instationären Betriebsverhaltens von mittelschnellaufenden Schiffsdieselmotoren. Ph.D. Thesis, Universität Hannover, Hannover, Germany, 1980. (In German). [Google Scholar]
- Heywood, J.B. Internal Combustion Engine Fundamentals; McGraw-Hill Book Company: New York, NY, USA, 1988. [Google Scholar]
- Stone, R. Introduction to Internal Combustion Engines, 3rd ed.; Palgrave: New York, NY, USA, 1999. [Google Scholar]
- Sher, E. Scavenging the two-stroke engine. Prog. Energy Combust. Sci. 1990, 16, 95–124. [Google Scholar] [CrossRef]
- Van Basshuysen, R.; Schäfer, F. Handbuch Verbennungsmotor, Grundlagen, Komponenten, Systeme, Perspektiven, 5th ed.; MTZ, IAV GmbH; GWV Fachverlage GmbH: Wiesbaden, Germany, 2010. (In German) [Google Scholar]
- Sher, C.; Hossian, I.; Zhang, Q.; Winterbone, D.E. Calculation and Measurement in the Cylinder of a Two-Stroke Uniflow-Scavenged Engine Under Steady Flow Conditions. Exp. Therm. Fluid Sci. 1991, 4, 418–431. [Google Scholar] [CrossRef]
- Ravi, M.; Marathe, A. Effect of Port Sizes and Timings on the Scavenging Characteristics of a Uniflow Scavenged Engine; SAE Technical Paper 920782; SAE: Warrendale, PA, USA, 1992. [Google Scholar] [CrossRef]
- Carlucci, A.P.; Ficarella, A.; Laforgia, D.; Longo, M. An easy and inexpensive way to estimate the trapping efficiency of a two-stroke engine, ATI 2015—70th Conference of the ATI Engineering Association. Energy Procedia 2015, 82, 17–22. [Google Scholar] [CrossRef]
- Larsen, U.; Pierobona, L.; Baldib, F.; Haglinda, F.; Ivarsson, A. Development of a Model for the Prediction of the Fuel Consumption and Nitrogen Oxides Emission Trade-off for Large Ships. Energy 2015, 80, 545–555. [Google Scholar] [CrossRef]
- Andreadis, P.; Chryssakis, C.; Kaiktsis, L. Optimization of Injection Characteristics in a Large Marine Diesel Engine Using Evolutionary Algorithms; SAE Technical Paper 2009-01-1448; SAE: Warrendale, PA, USA, 2009. [Google Scholar]
- Guan, C.; Theotokatos, G.; Chen, H. Analysis of Two Stroke Marine Diesel Engine Operation Including Turbocharger Cut-Out by Using a Zero-Dimensional Model. Energies 2015, 8, 5738–5764. [Google Scholar] [CrossRef]
- Varbanets, R.A.; Karianskiy, S.A. Analyse of Marine Diesel Engine Performance. J. Pol. CIMAC 2012, 7, 269–275. [Google Scholar]
- Grljušić, M.; Medica, V.; Račić, N. Thermodynamic Analysis of a Ship Power Plant Operating with Waste Heat Recovery through Combined Heat and Power Production. Energies 2014, 7, 7368–7394. [Google Scholar] [CrossRef]
- Grljušić, M.; Medica, V.; Radica, G. Calculation of Efficiencies of a Ship Power Plant Operating with Waste Heat Recovery through Combined Heat and Power Production. Energies 2015, 8, 4273–4299. [Google Scholar] [CrossRef]
- Spahni, M.; Schumacher, B.; Karamitsos, A. Concepts, Testing and First Service Experience with the Generation X-Engines. In Proceedings of the WinGD Low-speed Engines Licensees Conference, Interlaken, Switzerland, 8 September 2015. [Google Scholar]
- Carlucci, A.P.; Ficarella, A.; Laforgia, D.; Renna, A. Supercharging system behavior for high altitude operation of an aircraft 2-stroke Diesel engine. Energy Convers. Manag. 2015, 101, 470–480. [Google Scholar] [CrossRef]
- Carlucci, A.P.; Ficarella, A.; Trullo, G. Performance optimization of a Two-Stroke supercharged diesel engine for aircraft propulsion. Energy Convers. Manag. 2016, 122, 279–289. [Google Scholar] [CrossRef]
- Wang, X.; Ma, J.; Zhai, H. Evaluations of Scavenge Port Designs for a Boosted Uniflow Scavenged Direct Injection Gasoline (BUSDIG) Engine by 3D CFD Simulations; SAE Technical Paper 2016-01-1049; SAE: Warrendale, PA, USA, 2016. [Google Scholar] [CrossRef]
- NIST Standard Reference Database 23: Reference Fluid Thermodynamic and Transport Properties-REFPROP, Version 9.0; National Institute of Standards and Technology: Gaithersburg, MD, USA, 2010.
- Grljušić, M. Thermodynamic Analysis and Optimisation of Marine Low Speed Propulsion Diesel Engine Operating with Waste Heat Recovery. Ph.D. Thesis, University of Rijeka, Rijeka, Croatia, 10 September 2012. [Google Scholar]
- MAN Diesel and Turbo, Marine/Low Speed/CEAS-ERD Engine Room Dimensioning, Main Engine Room Data, 6S70MC-C7.1-TI. Available online: http://apps.mandieselturbo.com/ceas/client/erd.aspx (accessed on 9 November 2014).
- Aabo, K. Large Marine Diesels in Challenging Times, CIMAC Circle, Marimtec 2009; MAN B&W: Copenhagen, Denmark, 2009. [Google Scholar]
- Guan, C.; Theotokatos, G.; Zhou, P.; Chen, H. Computational investigation of a large containership propulsion engine operating at slow steaming conditions. Appl. Energy 2014, 130, 370–383. [Google Scholar] [CrossRef]
Figure 1.
The propulsion engine model depicting main input and output substances and energy flows.
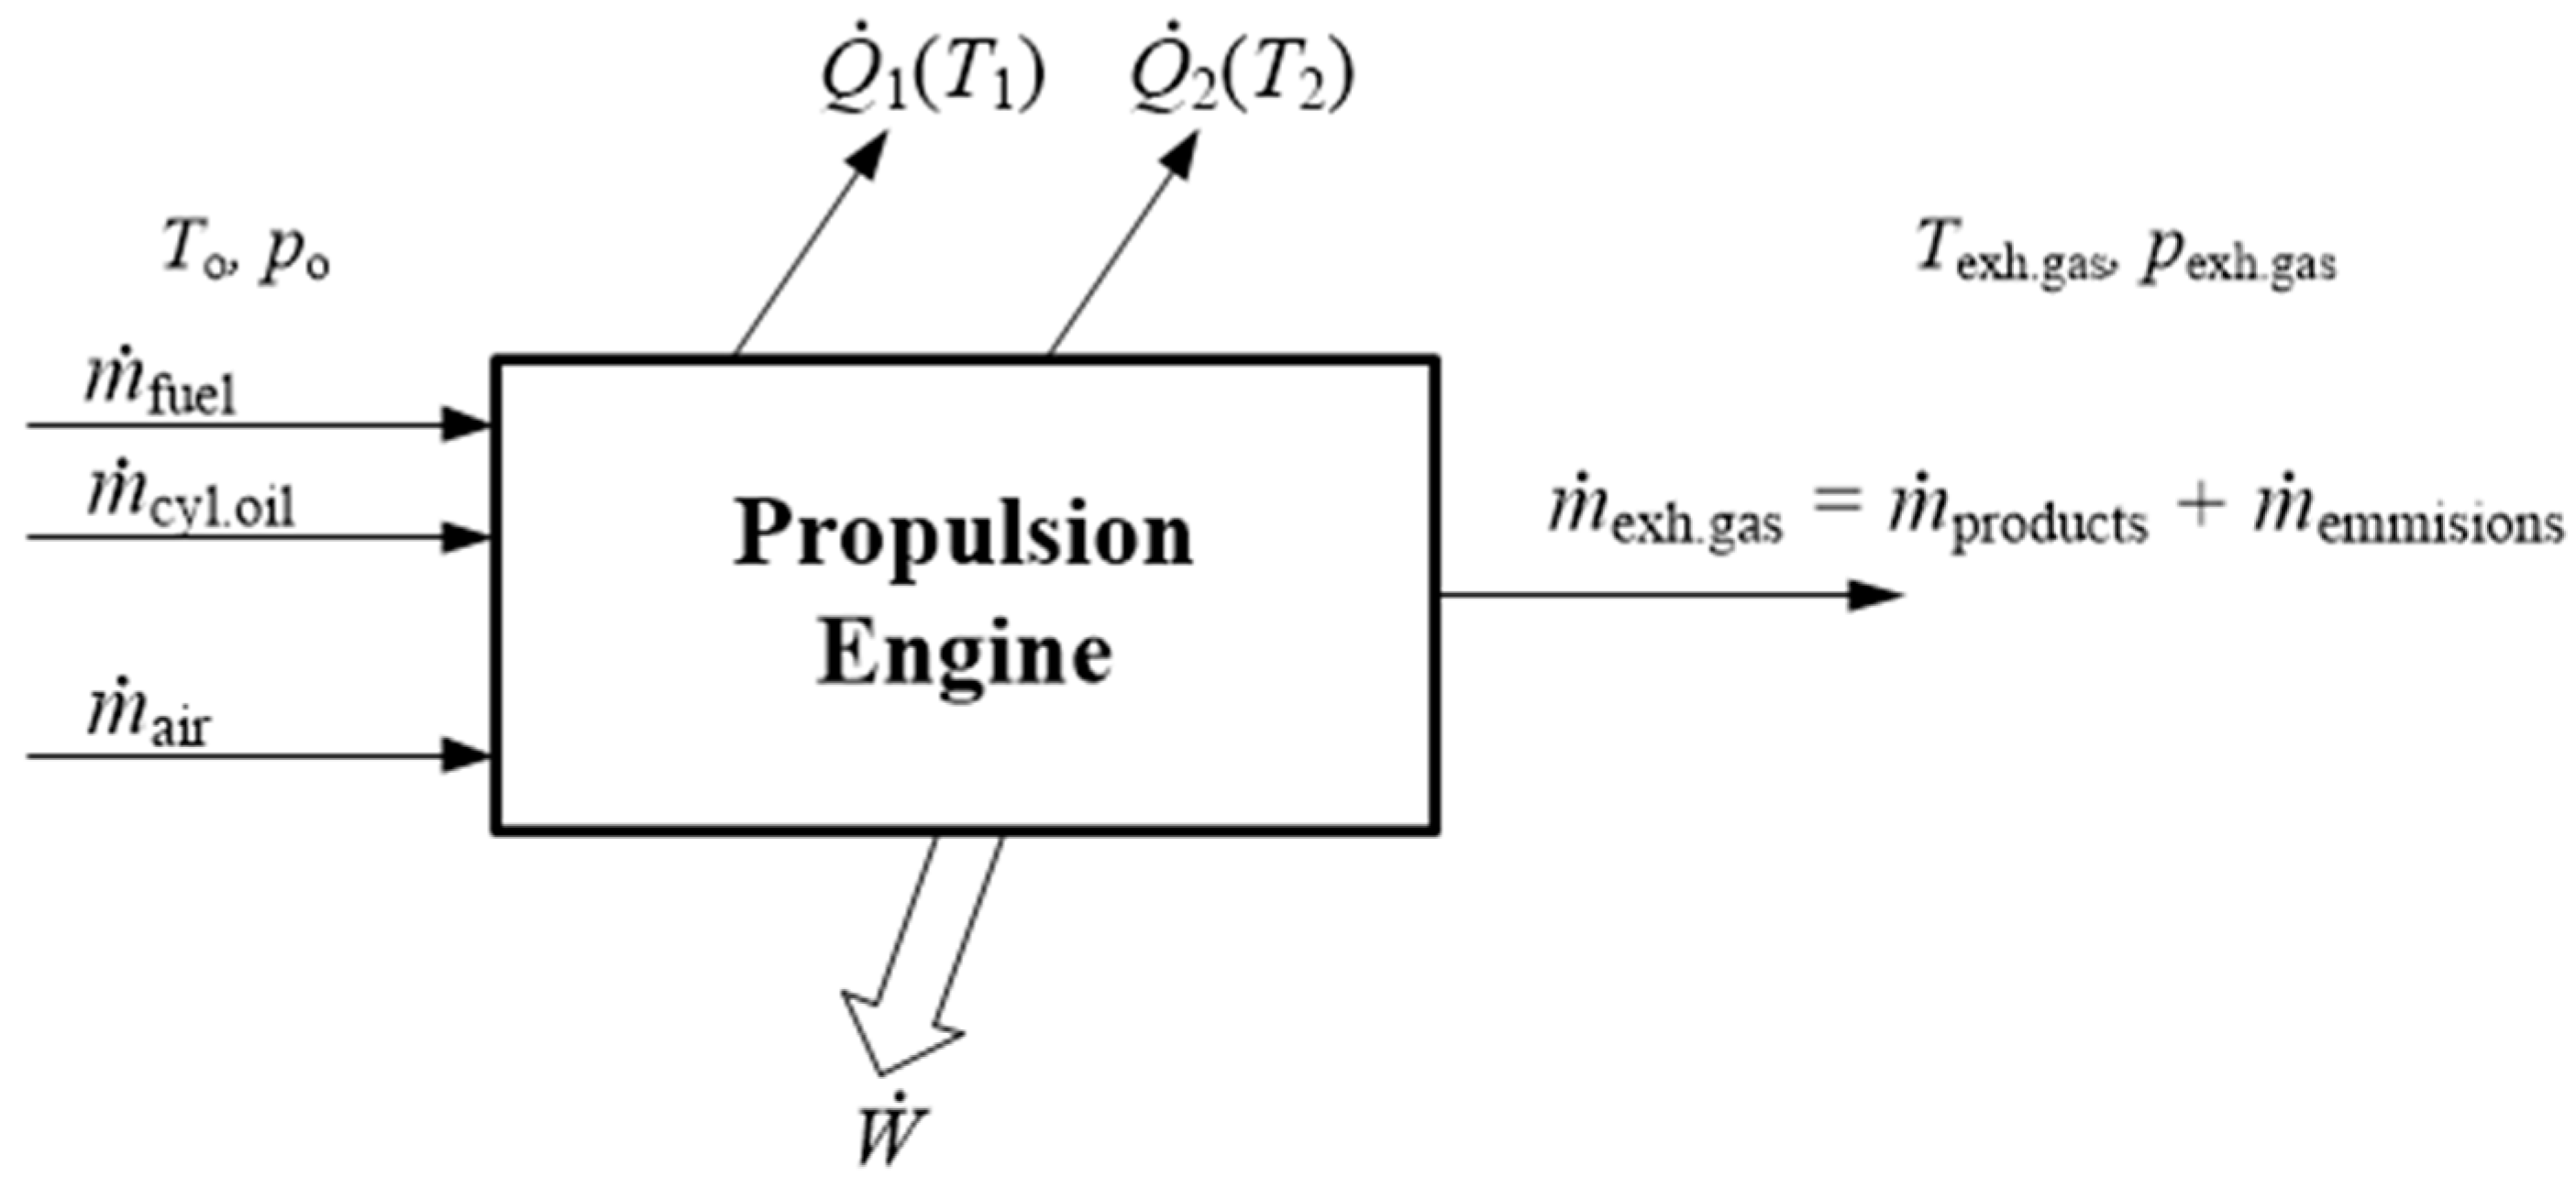
Figure 2.
The quad of mean effective pressure and engine speed with chosen nominal continuous rating (NCR) [27].
Figure 2.
The quad of mean effective pressure and engine speed with chosen nominal continuous rating (NCR) [27].
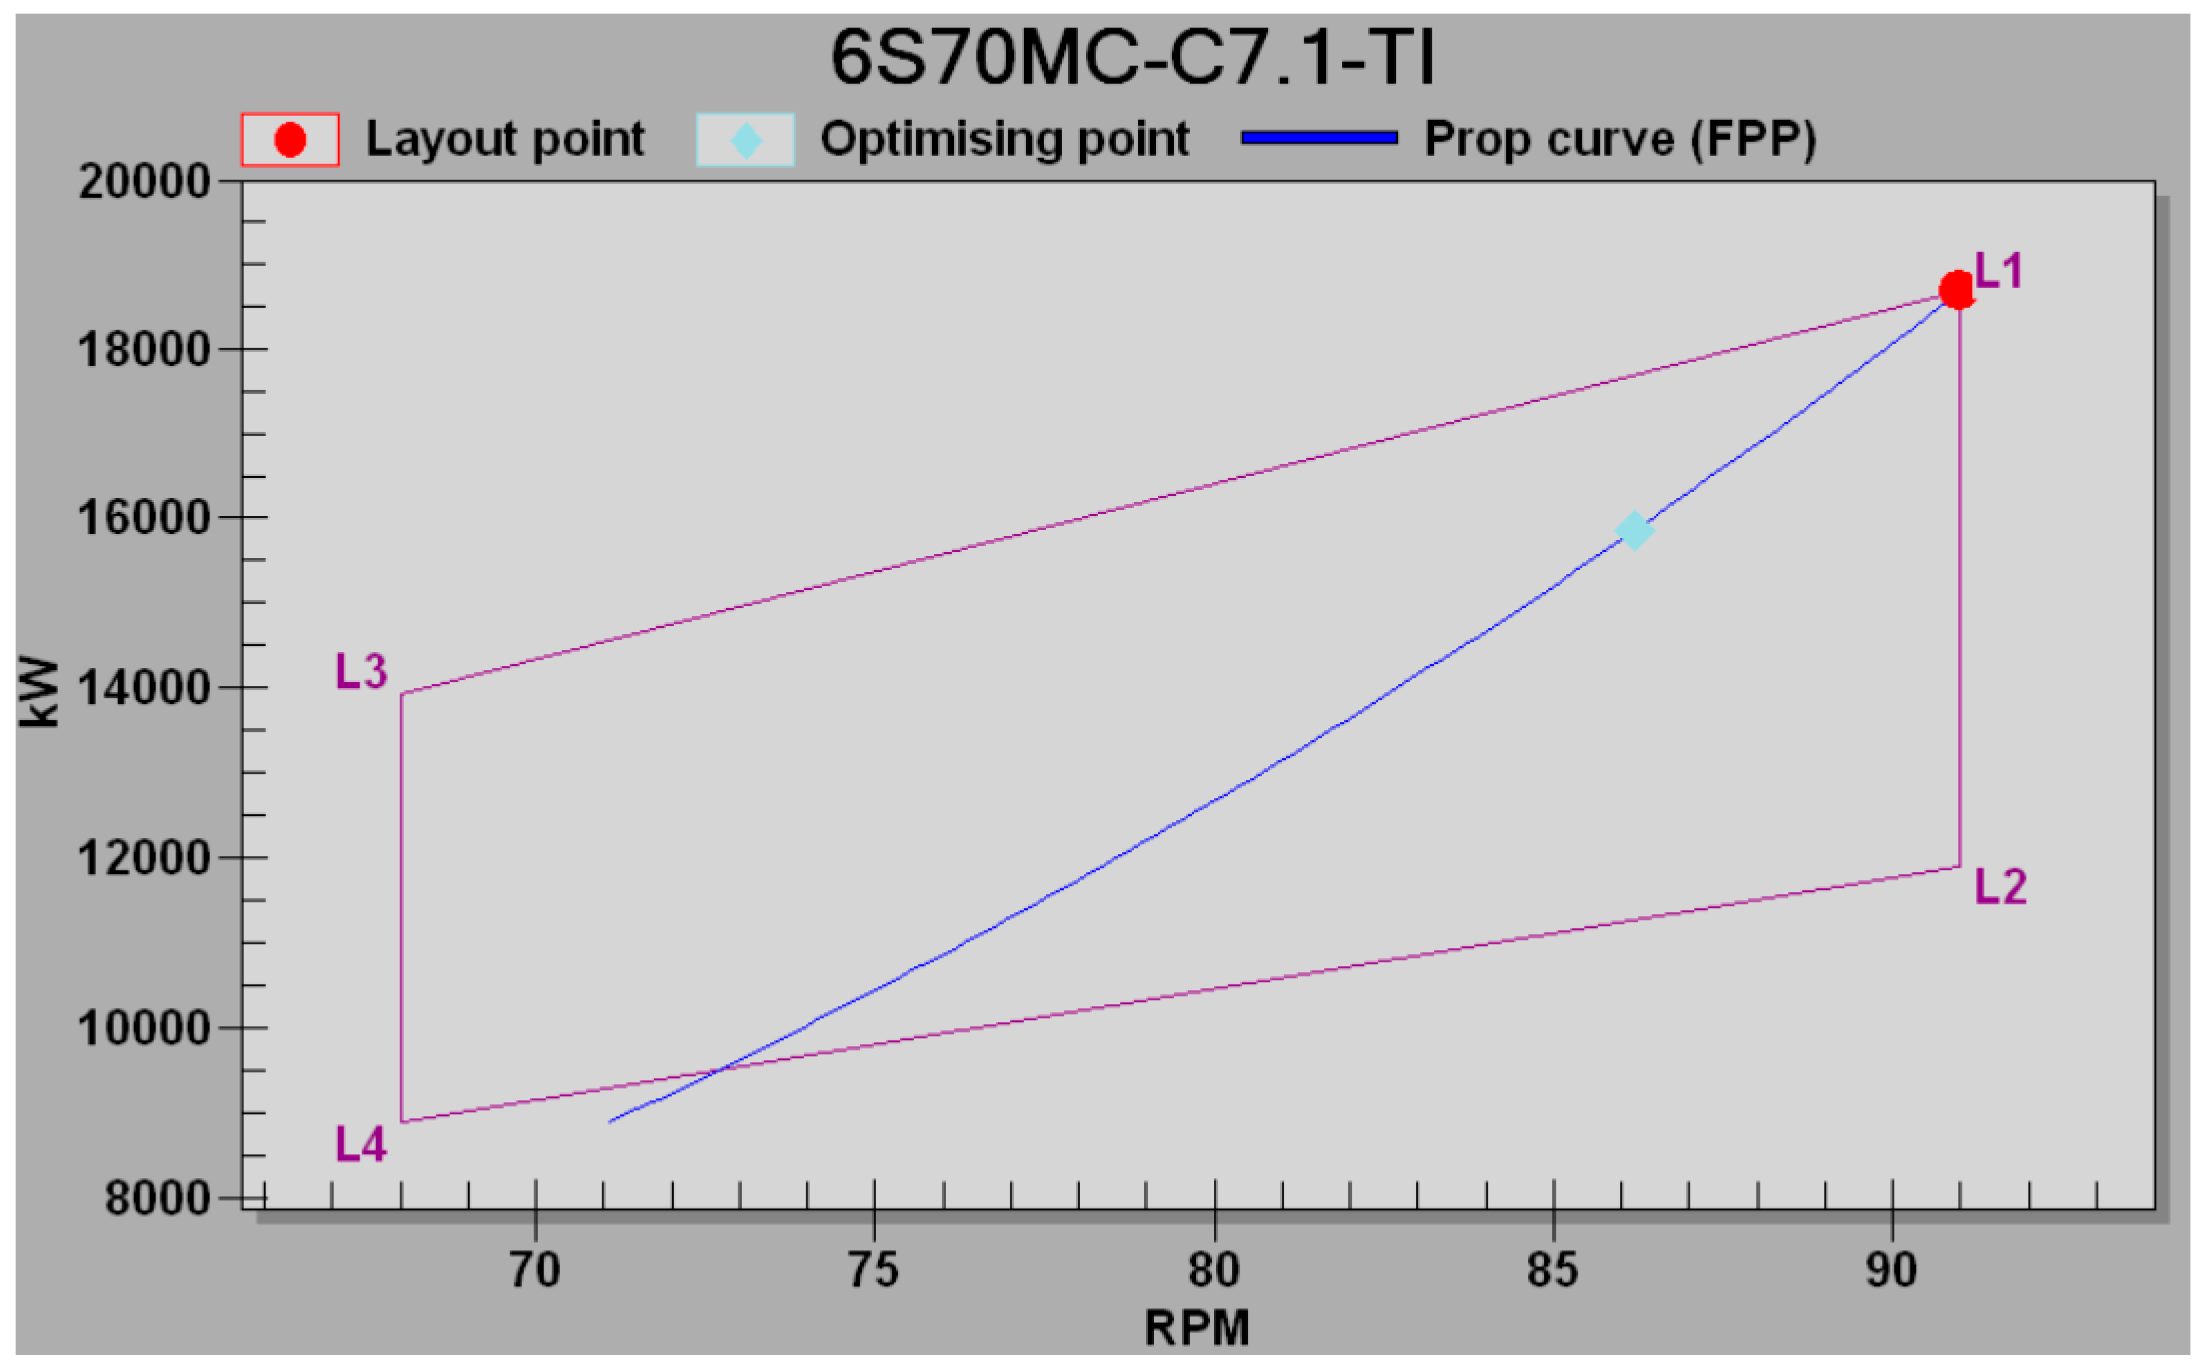
Figure 3.
Schematic diagram of the conventional main engine 6S70MC-C7 for ISO conditions and 100% specified maximum continuous rating (SMCR).
Figure 3.
Schematic diagram of the conventional main engine 6S70MC-C7 for ISO conditions and 100% specified maximum continuous rating (SMCR).

Figure 4.
The timing diagram for a two-stroke diesel engine.

Figure 5.
The composition of the flow in and out of a two-stroke fuel injection engine and the cylinder after [10,11].
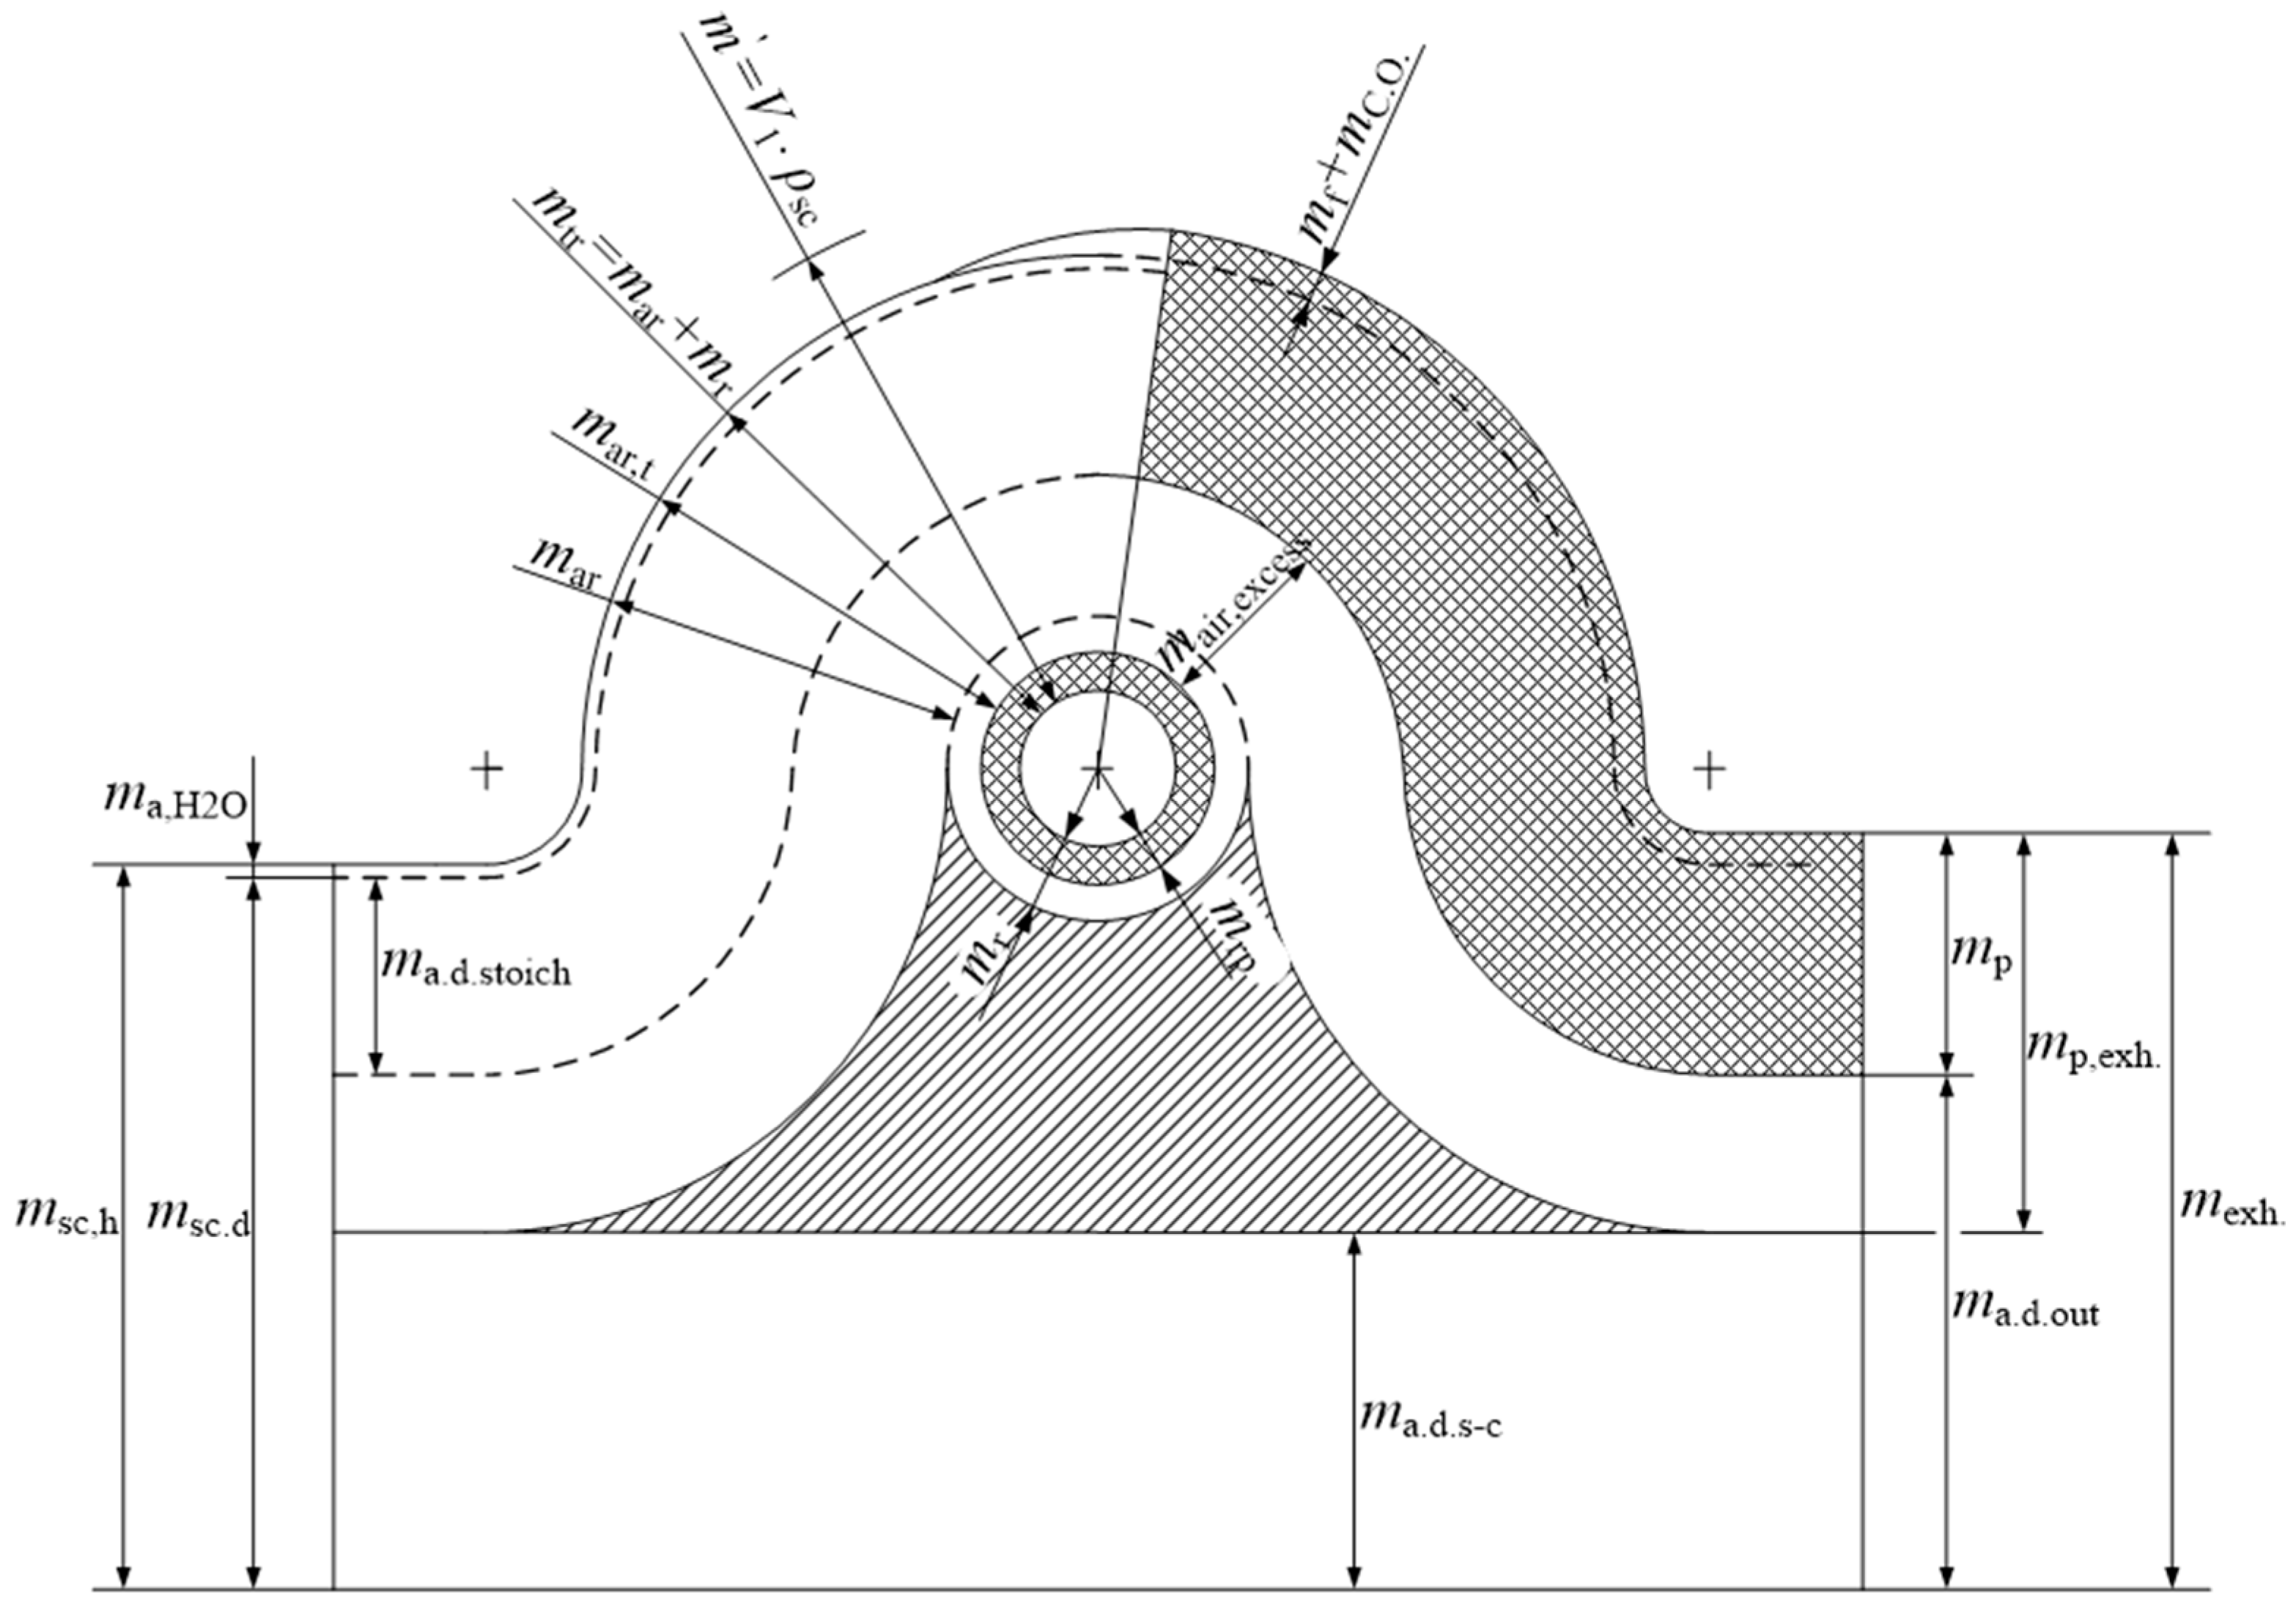
Figure 6.
AFRactual and stoichiometric air consumption in the function of main engine load.

Figure 7.
Air consumption ratio in the function of main engine load.

Figure 8.
The calculated substance flow through the two-stroke low speed engine at 100% SMCR.

Figure 9.
Exhaust gas composition of the 6S70MC MAN B&W low speed two stroke engine.


Table 1.
SFOC and exhaust gases data, ISO conditions [27]. SFOC: specific fuel oil consumption; ISO: International Organization for Standardization; temp.: Temperature.
Table 1.
SFOC and exhaust gases data, ISO conditions [27]. SFOC: specific fuel oil consumption; ISO: International Organization for Standardization; temp.: Temperature.
| Load % SMCR | Power (kW) | Speed (min−1) | SFOC (g/kWh) | Exhaust Gas Amount (kg/h) | Exhaust Gas Temp. (°C) |
|---|---|---|---|---|---|
| 100 | 18,660 | 91.0 | 170.9 | 172,800 | 240.5 |
| 95 | 17,727 | 89.5 | 168.8 | 166,200 | 235.6 |
| 90 | 16,794 | 87.9 | 167.1 | 159,600 | 232.0 |
| 85 | 15,861 | 86.2 | 165.6 | 152,900 | 229.7 |
| 80 | 14,928 | 84.5 | 164.4 | 146,000 | 228.8 |
| 75 | 13,995 | 82.7 | 163.5 | 138,900 | 229.1 |
| 70 | 13,062 | 80.8 | 162.9 | 131,500 | 230.8 |
| 65 | 12,129 | 78.8 | 162.9 | 123,800 | 233.7 |
| 60 | 11,196 | 76.8 | 163.3 | 115,800 | 238.0 |
| 55 | 10,263 | 74.6 | 163.9 | 107,500 | 243.6 |
| 50 | 9330 | 72.2 | 164.8 | 98,800 | 250.5 |
Notes: Ambient Air Suction Temperature: 25.0 °C; Cooling Water Temperature: 25.0 °C.
Table 2.
Heat exchanger power at various engine loads, ISO conditions [27].
Table 2.
Heat exchanger power at various engine loads, ISO conditions [27].
| 1 Engine Load (% SMCR) | 2 Engine Power (kW) | 3 Engine Speed (r/min) | 4 Scavenge Air Amount +/−5% (kg/h) | 5 Scavenge Air Pressure (bar abs) | 6 Scavenge air Temperature before Air Cooler (°C) | 7 Scavenge Air Temperature after Air Cooler (°C) | 8 Scavenge Air Cooler Heat (kW) | 9 Jacket Water Cooler Heat −15/+0% (kW) | 10 Main Lubrication Oil Heat (kW) |
|---|---|---|---|---|---|---|---|---|---|
| ISO Ambient Conditions Air Suction Temperature: 25.0 °C; Cooling Water Temperature: 25.0 °C | |||||||||
| 1 % | 2 kW | 3 r/min | 4 kg/h | 5 bar(abs) | 6 °C | 7 °C | 8 kW | 9 kW | 10 kW |
| 100 | 18,660 | 91.0 | 169,600 | 3.79 | 193.0 | 37.0 | 7420 | 2390 | 1260 |
| 95 | 17,727 | 89.5 | 163,200 | 3.62 | 186.0 | 36.0 | 6890 | 2290 | 1240 |
| 90 | 16,794 | 87.9 | 156,800 | 3.45 | 179.0 | 34.0 | 6360 | 2200 | 1220 |
| 85 | 15,861 | 86.2 | 150,300 | 3.28 | 172.0 | 33.0 | 5840 | 2100 | 1200 |
| 80 | 14,928 | 84.5 | 143,500 | 3.11 | 164.0 | 32.0 | 5310 | 2010 | 1180 |
| 75 | 13,995 | 82.7 | 136,600 | 2.94 | 156.0 | 31.0 | 4790 | 1920 | 1160 |
| 70 | 13,062 | 80.8 | 129,400 | 2.77 | 148.0 | 30.0 | 4270 | 1830 | 1130 |
| 65 | 12,129 | 78.8 | 121,800 | 2.60 | 139.0 | 29.0 | 3750 | 1730 | 1100 |
| 60 | 11,196 | 76.8 | 114,000 | 2.43 | 130.0 | 29.0 | 3250 | 1640 | 1070 |
| 55 | 10,263 | 74.6 | 105,800 | 2.26 | 121.0 | 28.0 | 2750 | 1550 | 1040 |
| 50 | 9330 | 72.2 | 97,300 | 2.09 | 111.0 | 27.0 | 2270 | 1460 | 1000 |
Table 3.
Fuel and cylinder oil consumption and mass composition at 100% SMCR, ISO conditions.
| Substance | (kg/s) | be (kg/kWh) | gc (%) | gh (%) | gs (%) | gCA (%) |
|---|---|---|---|---|---|---|
| Fuel | 0.8858317 | 0.1709 | 85.76 | 13.82 | 0.42 | - |
| Cyl. oil | 0.00311 | 0.0006 | 83.60 | 13.40 | 0.50 | 2.5 |
| Cyl. Oil HC | 0.0030167 | 0.000582 | 86.18 | 13.82 | - | - |
Table 4.
Air consumption and mass composition at 100% SMCR, ISO conditions.
| Substance | (kg/s) | smf (kg/kWh) | gN2 (%) | gO2 (%) | gAr (%) | gH2O (%) |
|---|---|---|---|---|---|---|
| Humid air | 47.1111 | 9.08896 | 75.1187 | 23.02169 | 1.2615 | 0.597175 |
| Dry air | 46.829775 | 9.03468332 | 75.57 | 23.16 | 1.2691 | - |
| H2O in air | 0.281336 | 0.054277 | - | - | - | - |
Table 5.
Fuel composition and stoichiometric oxygen consumption for fuel and cylinder oil combustion at 100% SMCR, ISO standard conditions.
Table 5.
Fuel composition and stoichiometric oxygen consumption for fuel and cylinder oil combustion at 100% SMCR, ISO standard conditions.
| Molar Composition (kmol/kWh) | C | H2 | S | Σ |
|---|---|---|---|---|
| Proportion of components in the fuel, N kmol/kWh | 0.012202468 | 0.011716047 | 0.0000223886 | 0.023940904 |
| The oxygen consumption for the fuel combustion, N kmol O2/kWh | 0.012202468 | 0.005858024 | 0.0000223886 | 0.01808288 |
| The oxygen consumption for the complete combustion of fuel and cyl. oil, N kmol O2/kWh | 0.012244227 | 0.005877973 | 0.0000223886 | 0.018144589 |
| The oxygen consumption for 98.7% fuel and cylinder oil combustion, N kmol O2/kWh | 0.012078002 | 0.005820837 | - | - |
| Products after complete combustion, N kmol/kWh | 0.012244227 | 0.011755946 | 0.0000223886 | 0.024022562 |
| Products after 98.7% combustion, N kmol/kWh | 0.012078002 | 0.011641673 | - | - |
Table 6.
Stoichiometric Air Consumption and Composition.
| Substance | Unit | O2 | N2 | Ar | Σ |
|---|---|---|---|---|---|
| Dry Air stoich | kg/kWh | 0.5786341 | 1.88798344 | 0.0317073 | 2.49832481 |
| G | % | 23.16 | 75.57 | 1.2691 | 100 |
| R | % | 20.96 | 78.12 | 0.92 | 100 |
Table 7.
The share of the components involved in the combustion.
| Fraction in Exhaust Gas | C unburnt | H unburnt | C in CO2 | H in H2O | S in SO2 | O2 burnt |
|---|---|---|---|---|---|---|
| Fraction in exh. Gas kmol/kWh | 0.000166 | 0.000114 | 0.012080 | 0.011640 | 0.000022 | 0.017920 |
Table 8.
The exhaust gas composition at 100% SMCR, ISO conditions.
| Molar Composition | O2 | CO2 (+SO2) | H2O | Ar | N2 | H6C14 |
|---|---|---|---|---|---|---|
| r | 0.147839424 | 0.037683715 | 0.045638029 | 0.008938867 | 0.759026424 | 0.000873541 |
| 4.730713744 | 1.658460303 | 0.822169089 | 0.357089869 | 21.26260721 | 0.07527737 |
Table 9.
Exhaust gas composition at various main engine loads.
| % SMCR | 50 | 60 | 70 | 80 | 90 | 100 |
|---|---|---|---|---|---|---|
| rO2 % | 15.72927012 | 15.65486 | 15.52668 | 15.31897 | 15.06865 | 14.78394245 |
| rCO2 % | 3.170466448 | 3.217451 | 3.298467 | 3.42984 | 3.588208 | 3.768371514 |
| rH2O % | 3.991802162 | 4.036903 | 4.11451 | 4.240189 | 4.391613 | 4.563802879 |
| rAr % | 0.896522031 | 0.896313 | 0.895954 | 0.895375 | 0.894678 | 0.893886725 |
| rN2 % | 76.12641422 | 76.10865 | 76.0782 | 76.02904 | 75.96987 | 75.90264236 |
| remissions % | 0.085525019 | 0.085829 | 0.086186 | 0.086585 | 0.086981 | 0.08735407 |
© 2017 by the authors. Licensee MDPI, Basel, Switzerland. This article is an open access article distributed under the terms and conditions of the Creative Commons Attribution (CC BY) license (http://creativecommons.org/licenses/by/4.0/).
Share and Cite
MDPI and ACS Style
Grljušić, M.; Tolj, I.; Radica, G. An Investigation of the Composition of the Flow in and out of a Two-Stroke Diesel Engine and Air Consumption Ratio. Energies 2017, 10, 805. https://doi.org/10.3390/en10060805
AMA Style
Grljušić M, Tolj I, Radica G. An Investigation of the Composition of the Flow in and out of a Two-Stroke Diesel Engine and Air Consumption Ratio. Energies. 2017; 10(6):805. https://doi.org/10.3390/en10060805
Chicago/Turabian StyleGrljušić, Mirko, Ivan Tolj, and Gojmir Radica. 2017. "An Investigation of the Composition of the Flow in and out of a Two-Stroke Diesel Engine and Air Consumption Ratio" Energies 10, no. 6: 805. https://doi.org/10.3390/en10060805
Note that from the first issue of 2016, this journal uses article numbers instead of page numbers. See further details here.