
Characterization and Effects of the Shock Losses in a Parallel Fan Station in the Underground Mine


School of Resources and Safety Engineering, Central South University, Changsha 410083, China
*
Author to whom correspondence should be addressed.
Energies 2017, 10(6), 785; https://doi.org/10.3390/en10060785
Submission received: 7 May 2017
/
Revised: 4 June 2017
/
Accepted: 5 June 2017
/
Published: 7 June 2017
Abstract
:Deep underground mines are highly energy consuming due to the need to overcome the growing airflow resistance. The multi-fan station ventilation system (MFSVS), formed by several parallel fans at different locations in an underground mine generally, has greatly reduced energy costs by using high-quantity and low-pressure energy-saving fans. However, experimental data still indicates that 30–70% of the fan pressure is used to overcome the severe shock losses in a parallel fan station (PFS), in spite of more than 80% operating efficiency, and the shock losses greatly weaken the superiority and the service capacity of PFS. Based on the investigation and measured data of several PFSs in a MFSVS in an underground mine, a three-dimensional PFS model was developed by computational fluid dynamics (CFD) to demonstrate airflow performance and variation characteristics of velocity, pressure and turbulence. First, the fan characteristic in the PFS was discussed and compared with the fan operating performance under standard conditions; the shock losses were then presented from both sides of the inlet shock losses and the outlet shock losses in the PFS; meanwhile, the effects of blade angle variation and airflow mutual interference were conducted to determine whether they exert a significant influence on the shock losses. The results show that the shock losses are primarily generated in the range of 0 to 3.0 m from the fans’ exits, due to the intensely change in air velocity in the PFS. The study also provides several directions and references for recovering air pressure and reducing energy consumption in the parallel fans’ structure.
1. Introduction
Given the growing concerns about global energy consumption and environmental pollution [1], it is of great significance to achieve energy savings in mines. As a life supporting system, the ventilation system is one of the highest energy-consuming systems in underground mines [2]. A ventilation system consumes approximately 25–40% of the total energy costs of a mine operation [3], and depending on the type of mine, up to 30–40% of the electricity used in underground mining [4,5]. As the depth and production capacity of mining continue to grow, ventilation power consumption becomes increasingly remarkable, and energy price variations in recent years have spurred mining companies to seek more energy-efficient technologies [6,7]. Therefore, many studies have been carried out on the application and new technology of the multi-fan station ventilation system (MFSVS) [8,9,10], and some research has also noted the tough problem of shock losses in a parallel fan station (PFS) [11], in which fans are connected in parallel.
PFS is a general arrangement in MFSVS in underground mines, and experimental data indicated that 30–70% of the fan total pressure (TP) generated must be used to overcome the severe shock losses [12]. It indicates that at least a third of the supplied power is consumed in MFSVS, which means about 10–30% of the mine productive electricity is wasted on useless work. Thus, it can be seen that the issue of shock losses has been one of the largest obstacles to restrict MFSVS in becoming efficient and energy saving, and it is of great importance to reduce the energy loss in PFS, especially the electricity consumption, while maintaining the required airflow and pressure.
Shock losses are caused by abrupt changes on the velocity of air movement, the air condition, the tunnel area, obstructions and regulator [13]. For the PFS shown in Figure 1, the shock losses are airflow energy losses between 1-1 section and 2-2 section, resulting from sudden changes in cross-section at fans’ entries or exits [14], split-flow at fans’ entries, airflow confluence and mutual interference at fans’ exits, as well as airflow resistance. According to the position of fans, the shock losses can be divided into two types: the inlet shock losses and the outlet shock losses [15]. The shock losses cause the airflow effective pressure to be much lower than the fan offered. Therefore, the efficiency of ventilation and PFS is still low even though the fans are working efficiently.
There has been limited research on the shock losses in PFS, and most of them are based on experimental data and empirical analysis. Don Z.M. [12] showed that the ratio of shock losses to fan TP was relatively small in traditional main fans, because of the fans’ feature of high-pressure and low-flow-rate. However, the ratio of shock losses became remarkable in the MFSVS, which generally uses low-pressure, large-flow-rate fans. Pan Y.J. [16] suggested that the shock losses mainly occurred in the 10 m area in front of and behind the fans, and the shock losses in the 10–20 m area can be ignored; thus, he proposed that the effective pressure in a PFS can be measured by the pressure difference at the positions of 10 m in front of and behind the fan. Cheng et al. [17] deduced the shock loss calculation formula under the condition of abrupt changes in tunnel cross-section. They tested nine types of fan arrangements in a multi-fan station and obtained the formula and the coefficient change rule of the shock losses, and they also pointed out that further study should focus on the velocity pressure (VP) in the return airway and air pressure recovery. Li et al. [18] indicated that the shock losses were mainly generated in the return airway based on experimental data in a small fan station model, and the data showed that the shock losses increased as the fan operation point moved left along the characteristic curve [19]. However, these studies analyzed the shock losses in a PFS roughly in the macroscopic perspective, not from the microscopic and theory aspects; and they rarely referred to the causes, evolution laws and influence factors of the shock losses. Overall, many results are achieved just from the measured data without understanding the real flow phenomenon, and the subject research is still in the stage of cognition on the shock losses in a PFS.
It is well known that airflow performance and shock losses are interpreted incompetently by utilizing the conventional one or two-dimensional flow theory in a PFS, owing to complicated air movement in the airways and multiple loads on the airflow, including its own gravity, pressure, air viscosity and mutual interference. The three-dimensional flow theory can take numerous factors into account, but it is a challenge to solve the 3D and complicated velocity field mathematically [20]; thus, it is unrealistic to launch this study only through the theoretical method at present.
With the rapid development of computational mathematics and widespread application of computers, computational fluid dynamics (CFD) provides a powerful tool and simulation method for understanding the real flow phenomenon and its performance [21]. Numerous CFD studies have been conducted in the mine ventilation domain [22,23], since researchers [24] applied it to investigate airflow performance for the first time in underground tunnels. The characteristics of parallel fans are examined under different operating conditions by using three methods, including the standard approach, VnetPC and CFD [25]; and the results indicated that CFD was the foremost approach to simulate and understand the airflow performance because it could consider all losses generated within the system, as well as provide the best interpretation of the airflow characteristics near the boundary walls. Four different damage scenarios were discussed in mine ventilation, including a stopping door open or closed and a booster fan turned on or off, by the onsite tracer gas experiments and a CFD model [26], and it was concluded that the CFD produced the best results and avoided a trial-and-error procession. A CFD model of an axial fan was also built by Li et al. [27] with an abnormal angle blade, and the angle effect of the abnormal blade was launched from the aspects of pressure, efficiency, sound, vibration and energy consumption. Several turbulent models were evaluated and compared between CFD result and experimental data by Agus P. Sasmito [23]. He also examined four different flow stopping designs and six distinctive ventilation scenarios in the cross-cut region, to determine a proper design and achieve a best approach of air pressure control in “room and pillar” underground mining. Although there are numerous studies on mine ventilation, little work has been done on the subject of the shock losses, especially the shock losses in a PFS.
Therefore, this study investigates the performance of PFSs in Gaofeng Mine ventilation in Southwest China. A CFD approach is utilized to unearth the airflow behavior and the characteristics of shock losses in a typical PFS, which includes the inlet shock losses and the outlet shock losses. Meanwhile, parametric studies are conducted to evaluate the effects of several factors, which impact the shock losses in a PFS.
2. Model Development
2.1. Field Measurement
Gaofeng Mine is an underground mine, which started production from 1985, and it consists of two main ore bodies named 100# and 105#. Considering that the ore contains high-sulfur content, the principal exploitation method was selected as the upward horizontal slicing and filling method, which has the advantage of reducing the exposed area and duration of the mined out area. In Gaofeng mine ventilation, the technology of MFSVS was applied to construct the ventilation network, due to the mine depth being more than 1000 m, from the deepest level of −300 m to ground surface level of 720 m; and most of the work areas are focused on every production level below the level of −60 m. The polluted air discharged from these working faces converges into 50 m station, and the return air is exhausted up to the ground through 250 m station and 450 m station successively.
Field measurements and investigations of three PFSs were launched to test airflow parameters, airway size parameters, motor power and fan efficiency in every PFS; therein airflow parameters consist of airflow velocity, air static and total pressure, air dry and wet bulb temperature, and air density. The protocols have been listed in more detail in [28], including detailed procedures, measuring locations and simple analysis of measurement data.
In the light of three PFSs in Gaofeng underground mine ventilation, which is shown in Table 1, the measured data states clearly that pressure loss rates of fan stations are scattered in the range of 25% to 45%, which prevent the aerodynamic force from meeting the expected design requirements. Thus, the ventilation is incapable of clearing out noxious gases and heat, a comfortable working environment for working areas cannot be guaranteed; and we found that the temperature of several working faces reached 45 °C during the investigation.
2.2. Physical Model
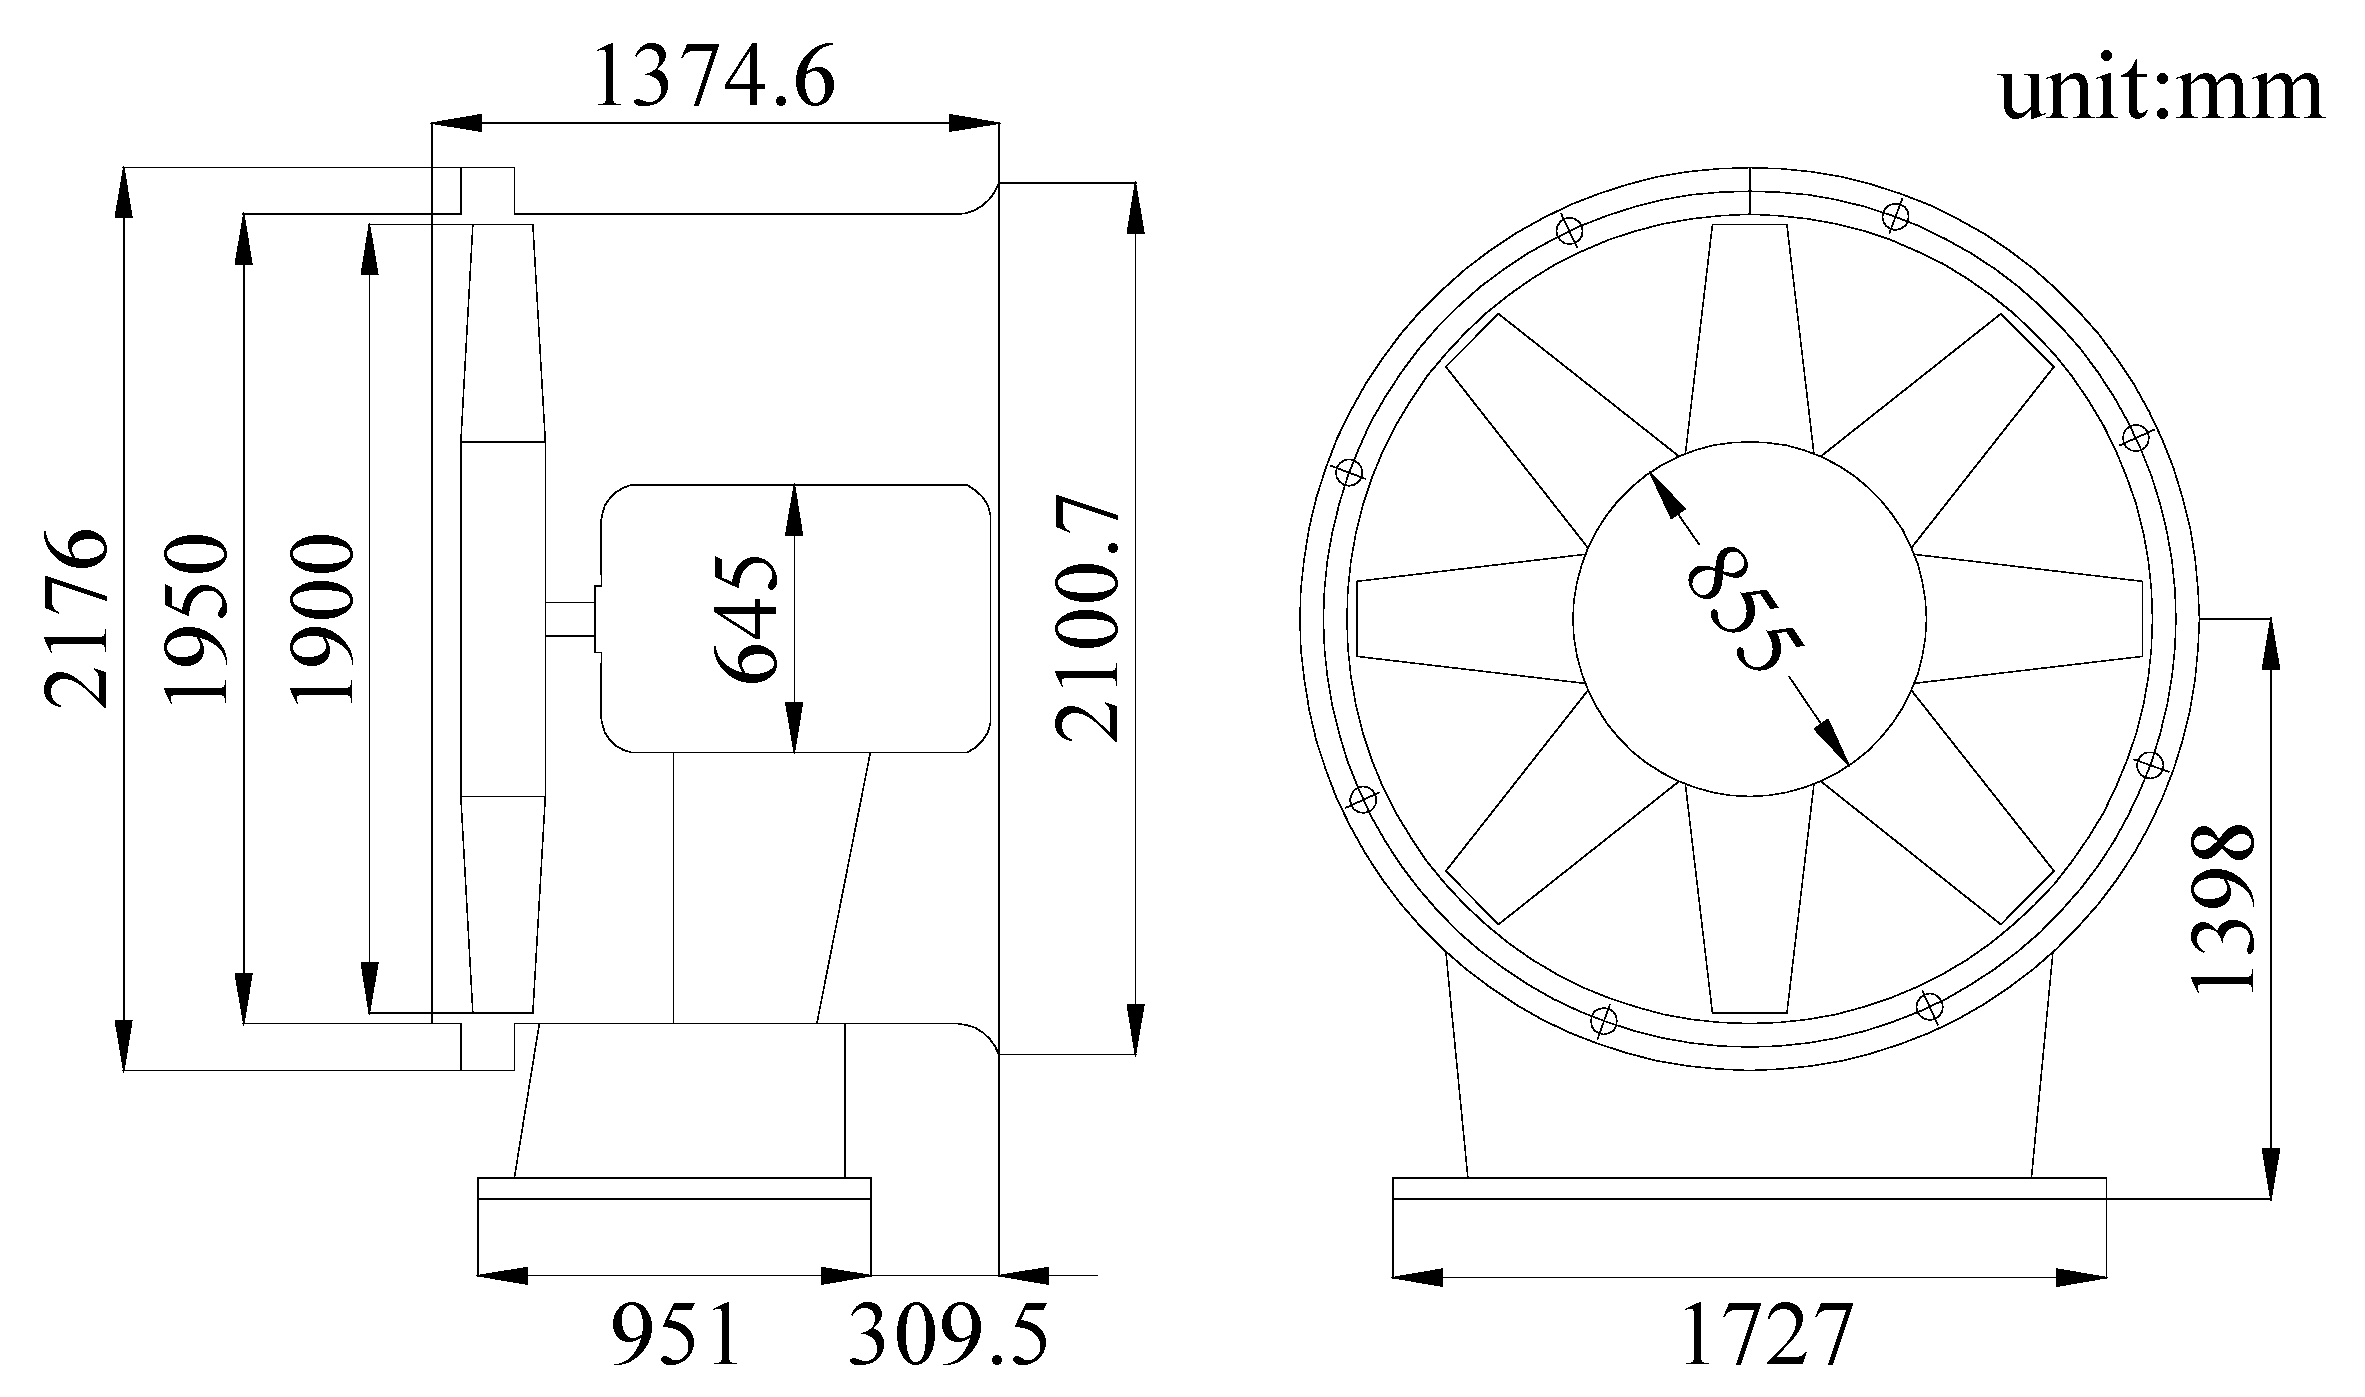
From the description of Section 2.1, we can find that 50 m station played a key role in the ventilation system, which is selected as the physical model. The station consists of two axial flow fans in parallel, and the fan model is K40(B)-19. The fan structure diagram is shown in Figure 2, and its main parameters are provided by the manufacturer as follows: (1) rotating speed of 980 rpm; (2) rated air quantity range from 35 m3/s to 85 m3/s; (3) rated pressure range from 290 Pa to 1300 Pa.
The field investigation found that 50 m station was located in the horizontal return airway in 50 m production level, the tunnels before and after the station are straight within a certain distance, and the lengths of the straight sections before and after the PFS are 48.8 m and 24.3 m. Double air-doors were set up before the PFS with the distance about 50 m, where a short return air shaft is linked with multiple production levels, and it makes the air-doors facilitate the maintenance of equipment near the air shaft; the arrangement also eliminated the effect of air leakage near the PFS.
Considering that Pan J.Y. [16] presents the impact scope of the shock losses respectively at about 10 m airway before and after fans, the model determines to build a 15 m tunnel before fans, as well as a 15 m tunnel after fans, in order to comprehensively analyze the inlet and outlet shock losses in the fan station. The tunnel cross-section size is 4.92 m × 3.03 m with area of 13.2 m2 according to the measured data, and there is a certain expanded tunnel near the position of parallel fans, with the tunnel length and maximum size of 5.0 m and 6.052 m × 3.026 m. In addition, owing to the short tunnel distance of 15 m and the shotcrete support technology applied to protect the tunnel wall, the friction loss is not significant in the segment of the intake and return airways; therefore, the effects of friction loss and wall roughness on the intake and return airways are negligible in the model.
The fan station is located at the position with the widest tunnel size, and the thickness of the stopping construction with fans is 1.3 m, which is basically the same as the length of the fan housing; and the tightness of the stopping is really good, according to the in-site investigation. Double air-doors were set into the stopping with the width of 0.8 m and the height of 1.4 m, and there is only a little or no air across the bulkhead, so it can be negligible to take account of the pressure leakage and effect caused by the bulkhead. The distance between two fans housing is 0.3 m in PFS, the model is established and shown in Figure 3, and the airflow in the PFS has following features: (1) the atmospheric pressure value is 101.26 kPa; (2) the dry and wet bulb temperatures are 30.2 °C and 30.1 °C, respectively; (3) the air density is 1.16 kg/m3; (4) the air quantity and velocity of the inlet are 110.56 m3/s and 8.4 m/s.
2.3. Governing Equations
The mathematical model comprises conservation equations, including mass, momentum (N-S) and energy, are shown in Equations (1)–(3).
where is the density, is time, is the velocity vector, is the fluid pressure, is the kinetic viscosity, is the dynamic tensor, is the gravity vector, is the external physical strength, is the temperature, is the specific heat capacity, is the coefficient of heat transfer in fluid, and is the viscous dissipation energy.
Supplementary turbulent transport equations are also indispensable based on the fluid characterization, to make the control equations closed. Previous studies evidenced that the Realizable turbulence model provides the best performance for solving complex flows, such as swirling flow, boundary layer separation, highly adverse pressure gradients, separated flows and secondary flow [27,29,30]. Thus, the Realizable turbulence model is selected to close the control equations, and the modeled transport equations for and are shown in Equations (4)–(5). Besides, the airflow is treated as an incompressible fluid during the calculation process.
where is the turbulent kinetic energy, is the turbulent dissipation rate, is the eddy viscosity and , is a constant, represents the generation of due to the mean velocity gradients, is the generation of due to buoyancy, , , , and are constants, and are the turbulent Prandtl numbers for and . , , , .
2.4. Computational Method and Boundary Conditions
The calculation is carried out by solving the 3D steady RANS (Reynolds-Averaged Navier-Stokes) equations, due to the research focus on the regular fluid characteristics in a PFS. Standard wall functions are used in the near-wall region. The semi-implicit pressure-linked equation (SIMPLE) algorithm is utilized to solve the coupling of the pressure-velocity fields [31]. Second-order upwind spatial discretization is set for the convective terms, diffusive terms and turbulent viscosity coefficient, to improve the accuracy of calculations [27,32]. The gravity of calculating condition is defined as 9.8 N/kg, and the air density is set as the measured value.
The multiple reference frame (MRF) model is applied to couple the rotating blades and the stationary zone, which is widely employed in fluid machinery and turbo-machinery applications [33]. Interfaces are well defined to deliver fluid information between the rotating zone (parallel fans) and the stationary zone (the intake and return airways).
The inlet and the outlet are defined as the mass flow inlet and the pressure outlet. The mass flow at the inlet is prescribed as 110.56 m3/s (within the rated air quantity range of 70 to 170 m3/s under the parallel operating condition), and the relative pressure at the outlet is 0. The simulation is considered converged as the parameters’ residuals are less than the default criteria of Fluent, and the final deviation of air quantity is just 2 × 10⁻⁵ between the inlet and the outlet [27].
2.5. Mesh Generation
The model is created in AutoCAD 2014 and ANSYS workbench; ANSYS ICEM CFD is used for meshing and assembling. The fluid domain is divided into two parts: the fan internal domain, which is meshed by unstructured tetrahedral grids with a flexible and strong geometric adaptability for the complicated airfoil blade shape, and the tunnel fluid domain, which is meshed by structured meshes. Considering that the airflow changes drastically around the thin blades, a sectional mesh refinement technique is adopted along the blade surface to achieve a more accurate solution [34], as shown in Figure 4. It should be noted that the procedure not only ensures the mesh quality but can also save computational cost.
The calculation accuracy is confirmed by the mesh number. Six groups of different mesh numbers are tested on the model, and it shows that when the mesh number exceeds 6.12 million, the variations of TP and fan efficiency can be negligible [27]; and when the mesh number reaches 6.63 million, the relative pressure difference is less than 10−5. To be more specific, the mesh elements of a single fan and tunnel number are 3.14 million and 0.67 million, respectively, and the mesh average quality reaches 0.814. As an index of the computational cost, the model takes approximately 4 h of computing time on a workstation with two quad-core processors (2.57 GHz) and 16 GB of RAM (Random-Access Memory).
3. Results and Discussion
3.1. Validation
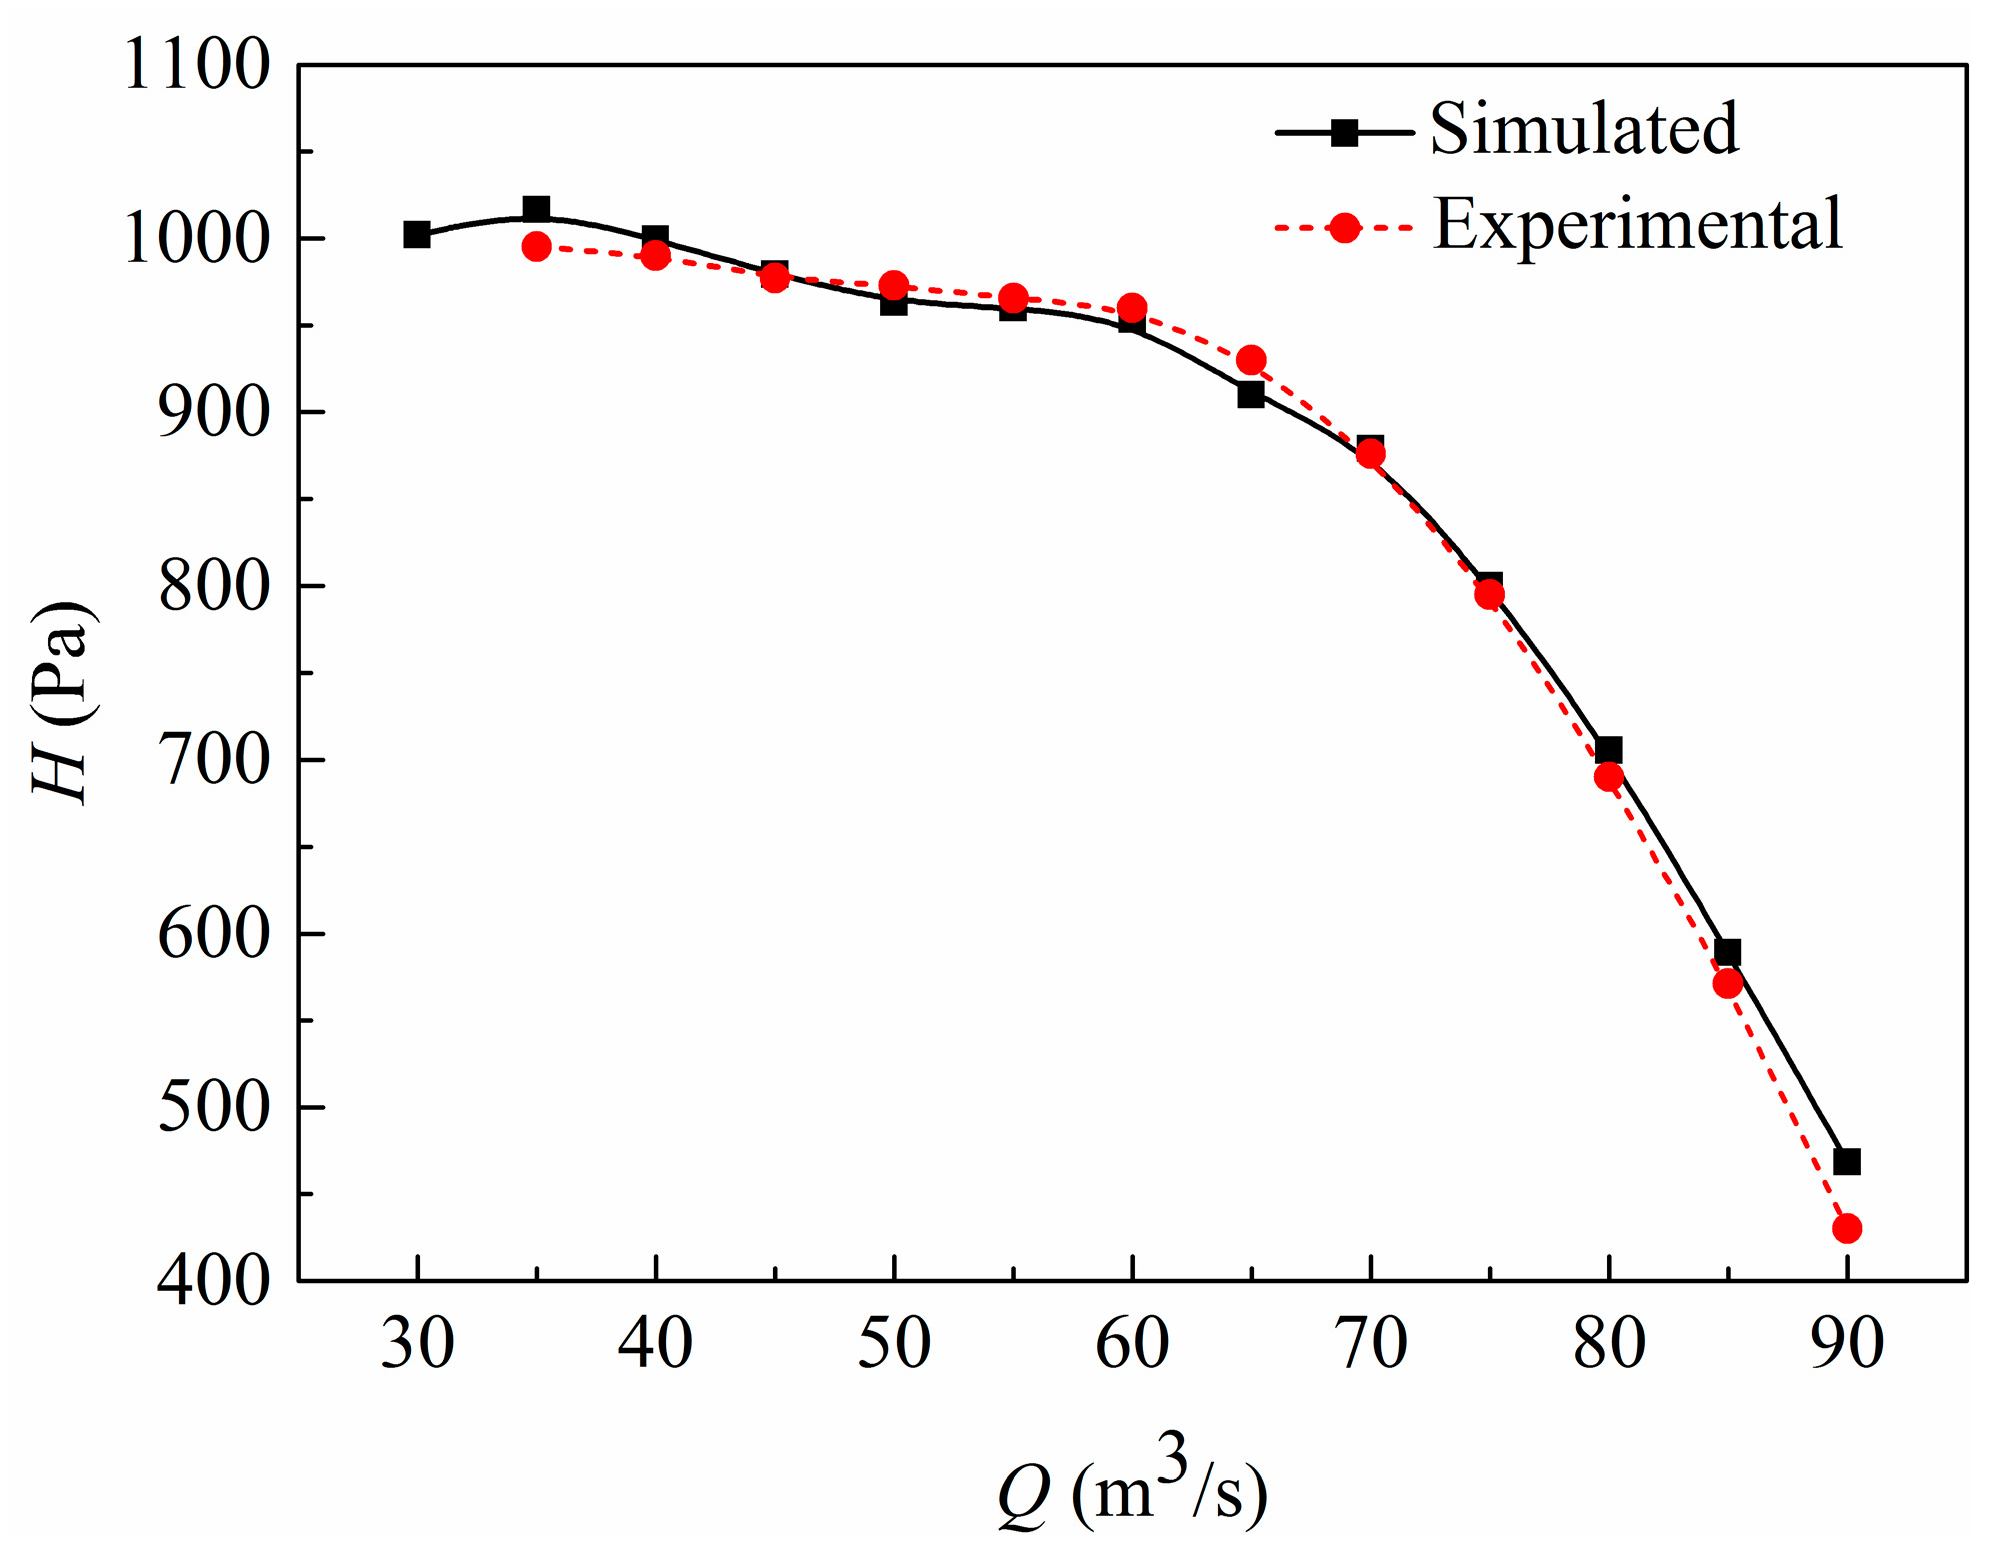
The simulation model is validated by comparing the fan performance with experimental data. It is well known that a certain difference with fan performance existed between single fan and parallel fans operating points, and it was also found that all fan operating points were changing at all times during the in-site experiment, due to the airflow variation of all working faces and the air piston effect in underground mines, especially in the air shaft. For the sake of validating the calculating model, it is determined to compare the fan performance between single fan for the standard condition and the fan curve data in standard fan test, which was given by the fan manufacturer [35]. Considering that the standard fan test is the C type industrial fan performance testing system [36], a certain distance pipeline model with 90° arc entry is established to connect the fan inlet, and the schematic can be referenced from [37], and computational method and boundary conditions are the same as thedescription in Section 2.3. A fan characteristic curve with 13 points is achieved by viewing simulation results, and compared with the experimental characteristic curve under standard conditions, as shown in Figure 5.
Figure 5 indicates that the numerical curve coincides with the experimental curve, and the maximum relative deviation of TP is only 3.15% within the rated air quantity range of 35–85 m3/s. Therefore, the numerical result is acceptable and reliable. It also illustrates that the hump effect is eliminated basically by the stabilizing ring device on this kind of axile fan product, and a superficial low-lying area existed on the simulated curve compared with the smooth experimental curve. It is expected that the model ignores several internal structures, which might act as regulations or obstacles for eliminating the hump effect.
3.2. Airflow Characteristic in PFS
It is set that the air quantity at the inlet varied from 60 to 160 m3/s with 10 m3/s increments [38]. Figure 6 shows the characteristic curves of parallel fans and each fan therein. It states clearly that the curve of parallel fans coincides with the combined curve of two standard parallel fans, when Q ≥ 90 m3/s; whereas Q < 90 m3/s, the pressure of parallel fans is higher than the standard ones. With the decrease of air quantity, the deviations are increasing between two combined curves (combined Fan_1 and Fan_2), and the maximum deviation value reaches 147.78 Pa within the rated flow range. Thus, the characteristic curve of two fans working in parallel is not a simple superposition of two standard fan characteristic curves.
A further comparison of characteristic curves among Fan_1, Fan_2 and standard fan was also shown in Figure 6. The operating points in Fan_1 and Fan_2 are slightly higher or lower than the corresponding standard points, when Q ≥ 45 m3/s; whereas both curves of Fan_1 and Fan_2 are much higher than the standard one when Q < 45 m3/s, and the maximum pressure deviation value is 150.03 Pa within the rated flow range. The deviation is caused by the phenomenon that both fans boost the pressure to grab air to achieve a better operating point at low-flow rates. The curve of Fan_1 also does not coincide with the curve of Fan_2, due to the distance between the position of Fan_1 and tunnel wall being much closer, which makes Fan_1 have a greater pressure increase. The maximum relative deviation of TP between Fan_1 and Fan_2 reaches 8.43%. It suggests that the difference of the fans’ locations in the tunnel exert a non-negligible impact on fan performance, which will be explored deeply in future work.
The TP values of multiple probes or surfaces in the PFS were monitored, and the data are listed in Table 2. It must be noted that the walls of airways’ model are set as smooth walls; therefore, the inlet and outlet shock losses in PFS are equal to the pressure loss of the intake and return airways, respectively.
Furthermore, a comparison of the air pressure results and Table 1 shows that the measured TP values of PFS are 619 Pa and 620 Pa in the 50 m station, where the probes before and after the fans’ entries of 50 m station are 2.0 m and 1.5 m, in order to ensure the safety of in-situ experimental equipment and measured personnel; and the simulated average value of TP is 620.35 Pa, due to the data in the same probes being −424.38 Pa and 195.97 Pa under the same air quantity condition. Thus, the simulated TP coincides with the experimental values. For the 250 m station, the measured TP values are 520 Pa and 525 Pa as the air quantity is 103.5 m3/s, where the probes before and after the fans’ entries are 2.0 m and 5.0 m; considering that the simulated data at the same probes are −441.7 Pa and −102.31 Pa when the air quantity is 100 m3/s, and −424.38 Pa and 115.10 Pa when the air quantity is 110.56 m3/s, so the simulated TP is within the range of 539.48 Pa to 544.01 Pa. It indicates that there is a certain deviation of TP between simulated and experimental results, which is caused by the different layout of both PFS, including the tunnel cross-section and the position of fans. In addition, we cannot carry on a comparison between the 450 m station and the simulated results, due to their fan models being different.
3.3. Inlet Shock Losses in PFS
The data in Table 2 shows that the inlet shock losses decrease as the air quantity increases, and the distribution is −43.58 to 52.01 Pa, which is less than the value of outlet shock losses. It may be strongly explained why the guide vane exerts little or no effect on an axial flow fan.
The airflow velocity streamlines are shown in Figure 7 by investigating the airflow in the intake airway. We can see that the velocity is distributed evenly under the assumption of the uniform flow structure at the inlet, and the velocity is increased near the fans’ entries due to the fluid sudden shrinkage. Therefore, the inlet shock losses are primarily caused by sudden shrinkage or expansion of the airway, and the flow characteristic can be interpreted by the one-dimensional flow theory; so the inlet shock losses can be written as [39].
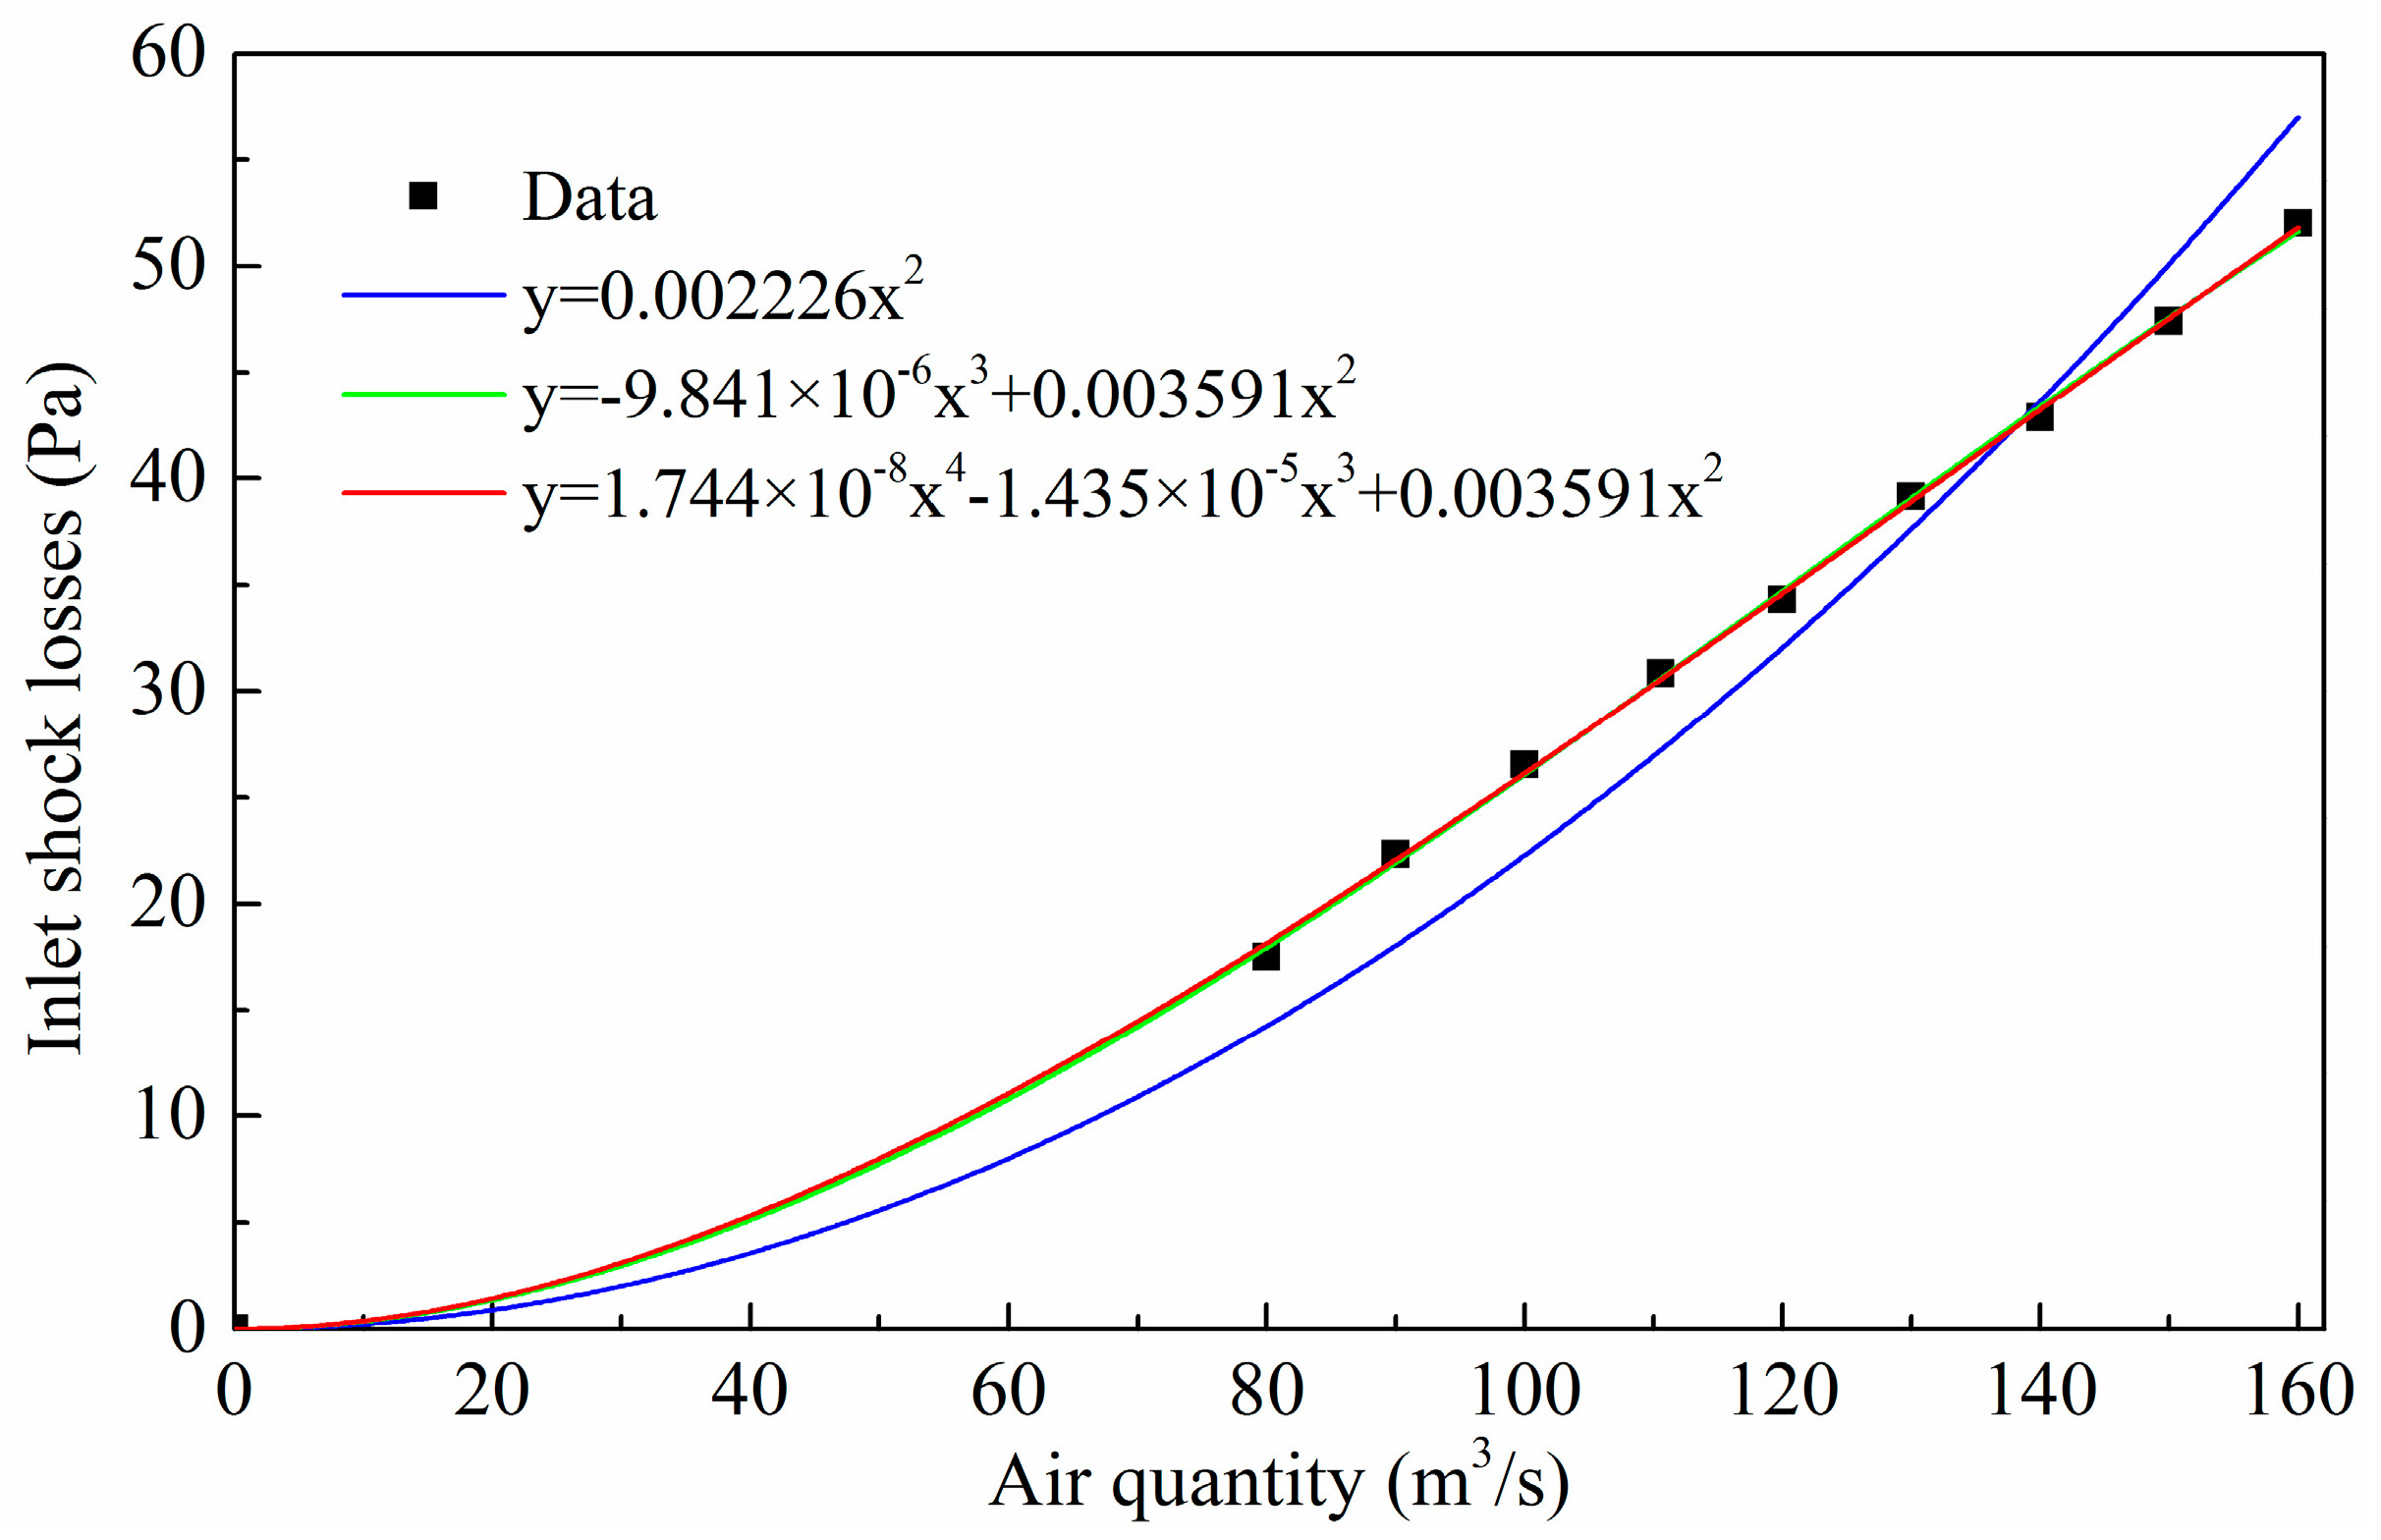
where is the inlet shock loss, is the Atkinson’s resistance converted by the inlet shock loss factor; and ; therein , , are the inlet shock loss factor, air density and tunnel cross-sectional area, respectively. The curve of “” and polynomial fitting curves are depicted in Figure 8, to determine when the air quantity is 110.56 m3/s in the PFS.
It can be observed in Figure 8 that the quadratic fitting curve is bad, whereas the good fitting performance is presented with quite a small residual error, as the fitting degree starts from the third time. Therefore, the cubic function is selected as the inlet shock loss calculation formula, and can be expressed as:
It means that . According to the measured data, it can be known = 1.16 kg/m3 and = 13.2 m2, thus, we can get the expression of , and it presents that and with Q has a linear functional relationship.
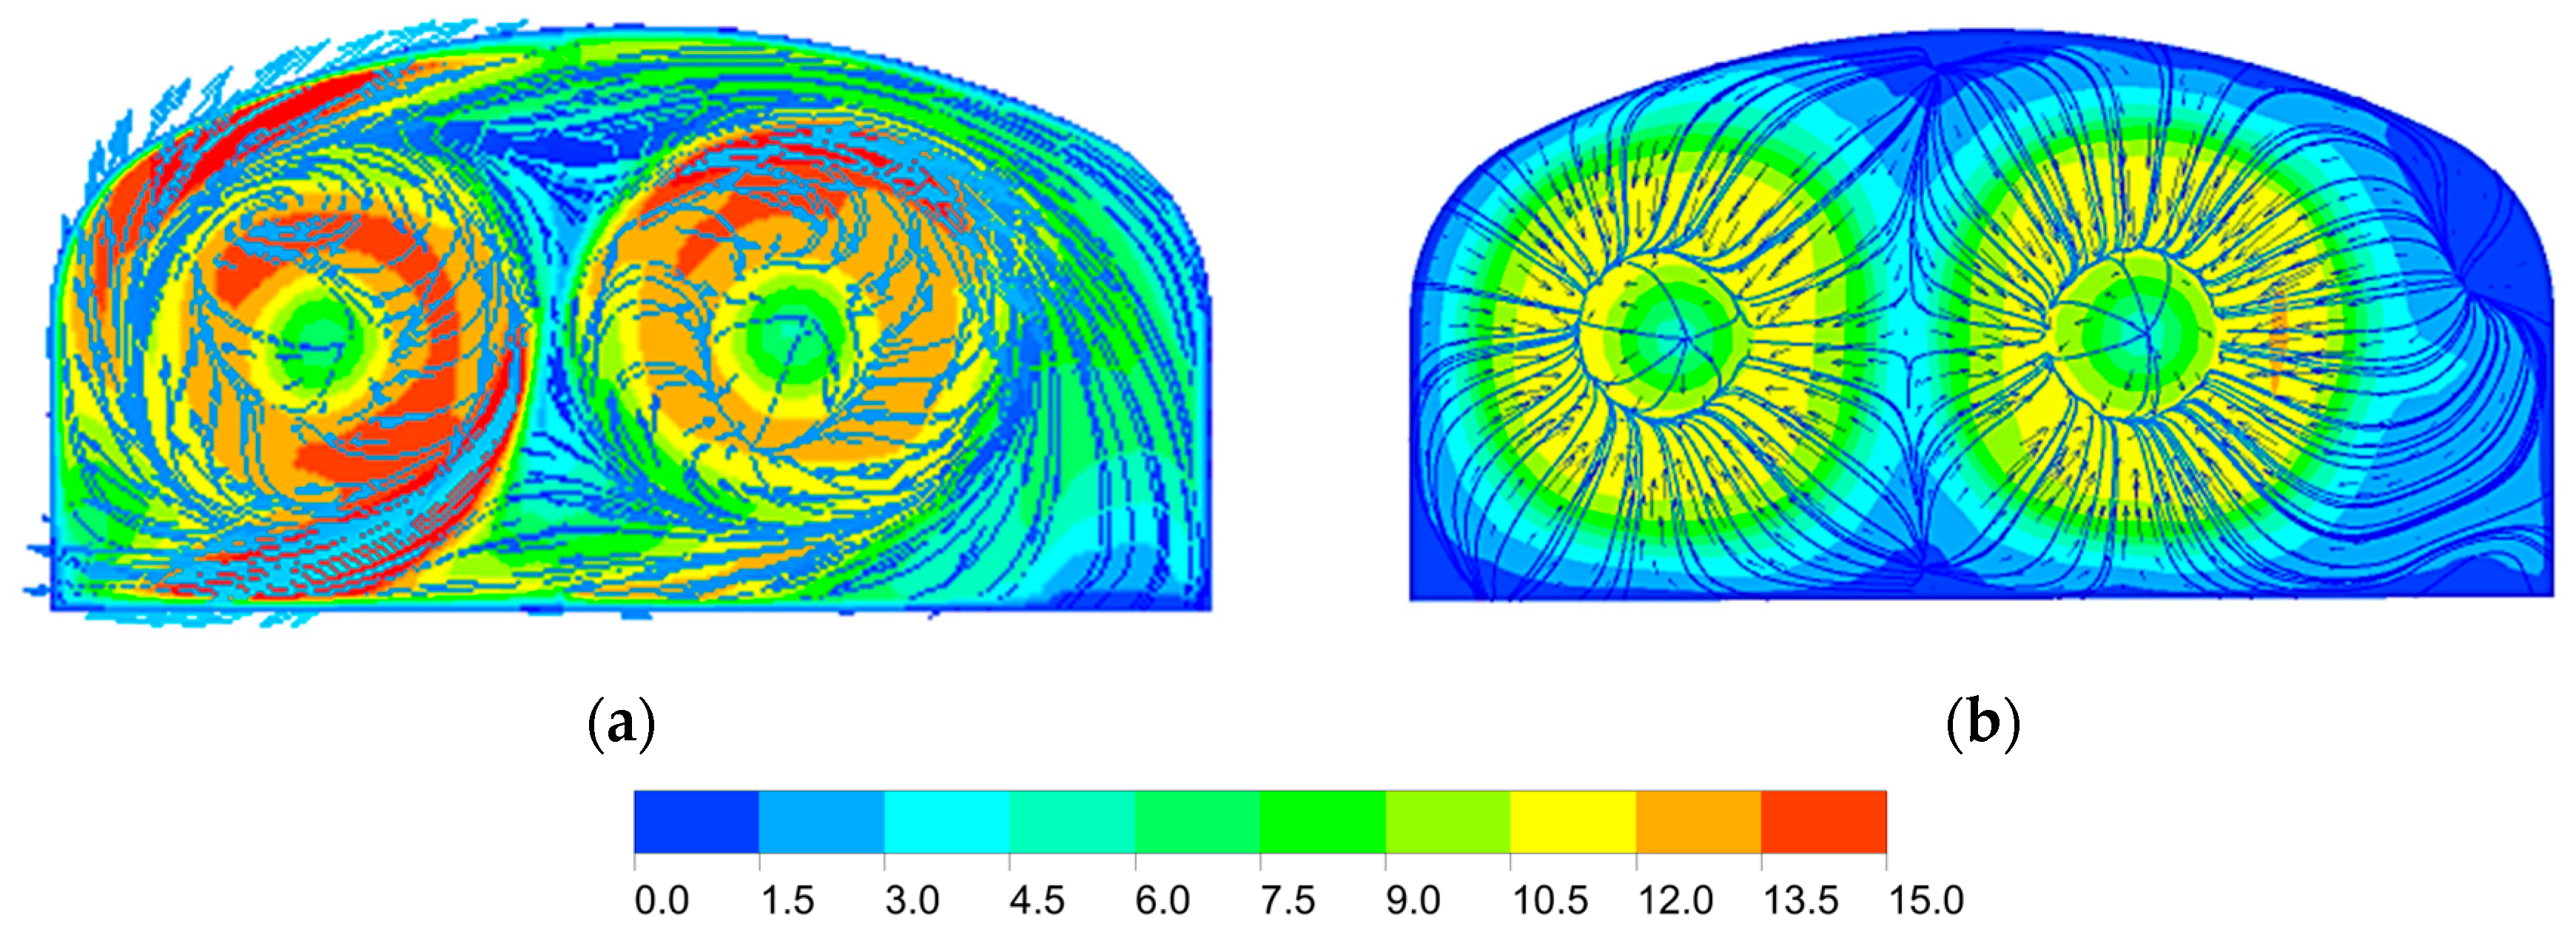
The data in Table 2 also shows that the TP difference value between the inlet and the fans’ entries is negative when Q < 70 m3/s. To make a contrast clearly, the velocity distributions at the positions of fans’ entries are plotted in Figure 9, under the condition of Q = 60 m3/s and Q = 80 m3/s. It can be found that the rotating flow phenomenon occurs with uneven velocity distribution when Q = 60 m3/s, whereas airflow converges into both fans without a revolving tendency when Q = 80 m3/s. It indicates that the airflow will be forced into the state of swirling with an unstable operating point when Q is less than the minimum rated air quantity, and the rotating flow phenomenon brings about the increase of air pressure near the fans’ entries compared with the pressure at the inlet, so the TP difference value between the inlet and the fans’ entries becomes negative. Moreover, the increase of pressure may raise the stress on fan blades, which easily triggers several adverse effects, such as shell vibration and fan overload, so it is necessary to avoid the low flow-rate operating point.
3.4. Outlet Shock Losses in PFS
The data in Table 2 shows that the outlet shock losses are more significant within the range of 385.03 to 435.69 Pa, and the relationship is not clear between shock losses and air quantity. The outlet shock losses raise the outlet pressure loss rate from 35% to 60% as the air quantity increases. Thus, we can see that at least 1/3rd of energy consumption is needed to overcome the outlet shock losses in an MFSVS with PFS applied.
Considering that pressure directly determines the variation of the shock losses in a PFS, several cross-section average values of static pressure (SP), VP and TP in the return airway were monitored, as shown in Figure 10. It can be observed that the absolute values of SP, VP and TP reach their maximum at the position of fans’ exits (position = 0); and these parameters are changing remarkably within the position from 0 to 3.0 m, and changing gently with the position from 3.0 to 15.0 m, even remaining basically unchanged. Three curves are close to zero with the position increasing. At the outlet, the average value of SP rises to 1.51 Pa, and the average values of VP and TP sharply decrease to 73.93 Pa and 76.93 Pa. It indicates that a part of air VP is transformed into SP along the return airway, and another part of air VP becomes pressure loss due to the TP also decreasing. The pressure loss occurs during the process of air moving and pressure conversion, in order to overcome all resistance in the PFS. Therefore, the VP consumption is the essential cause of outlet shock losses in a PFS.
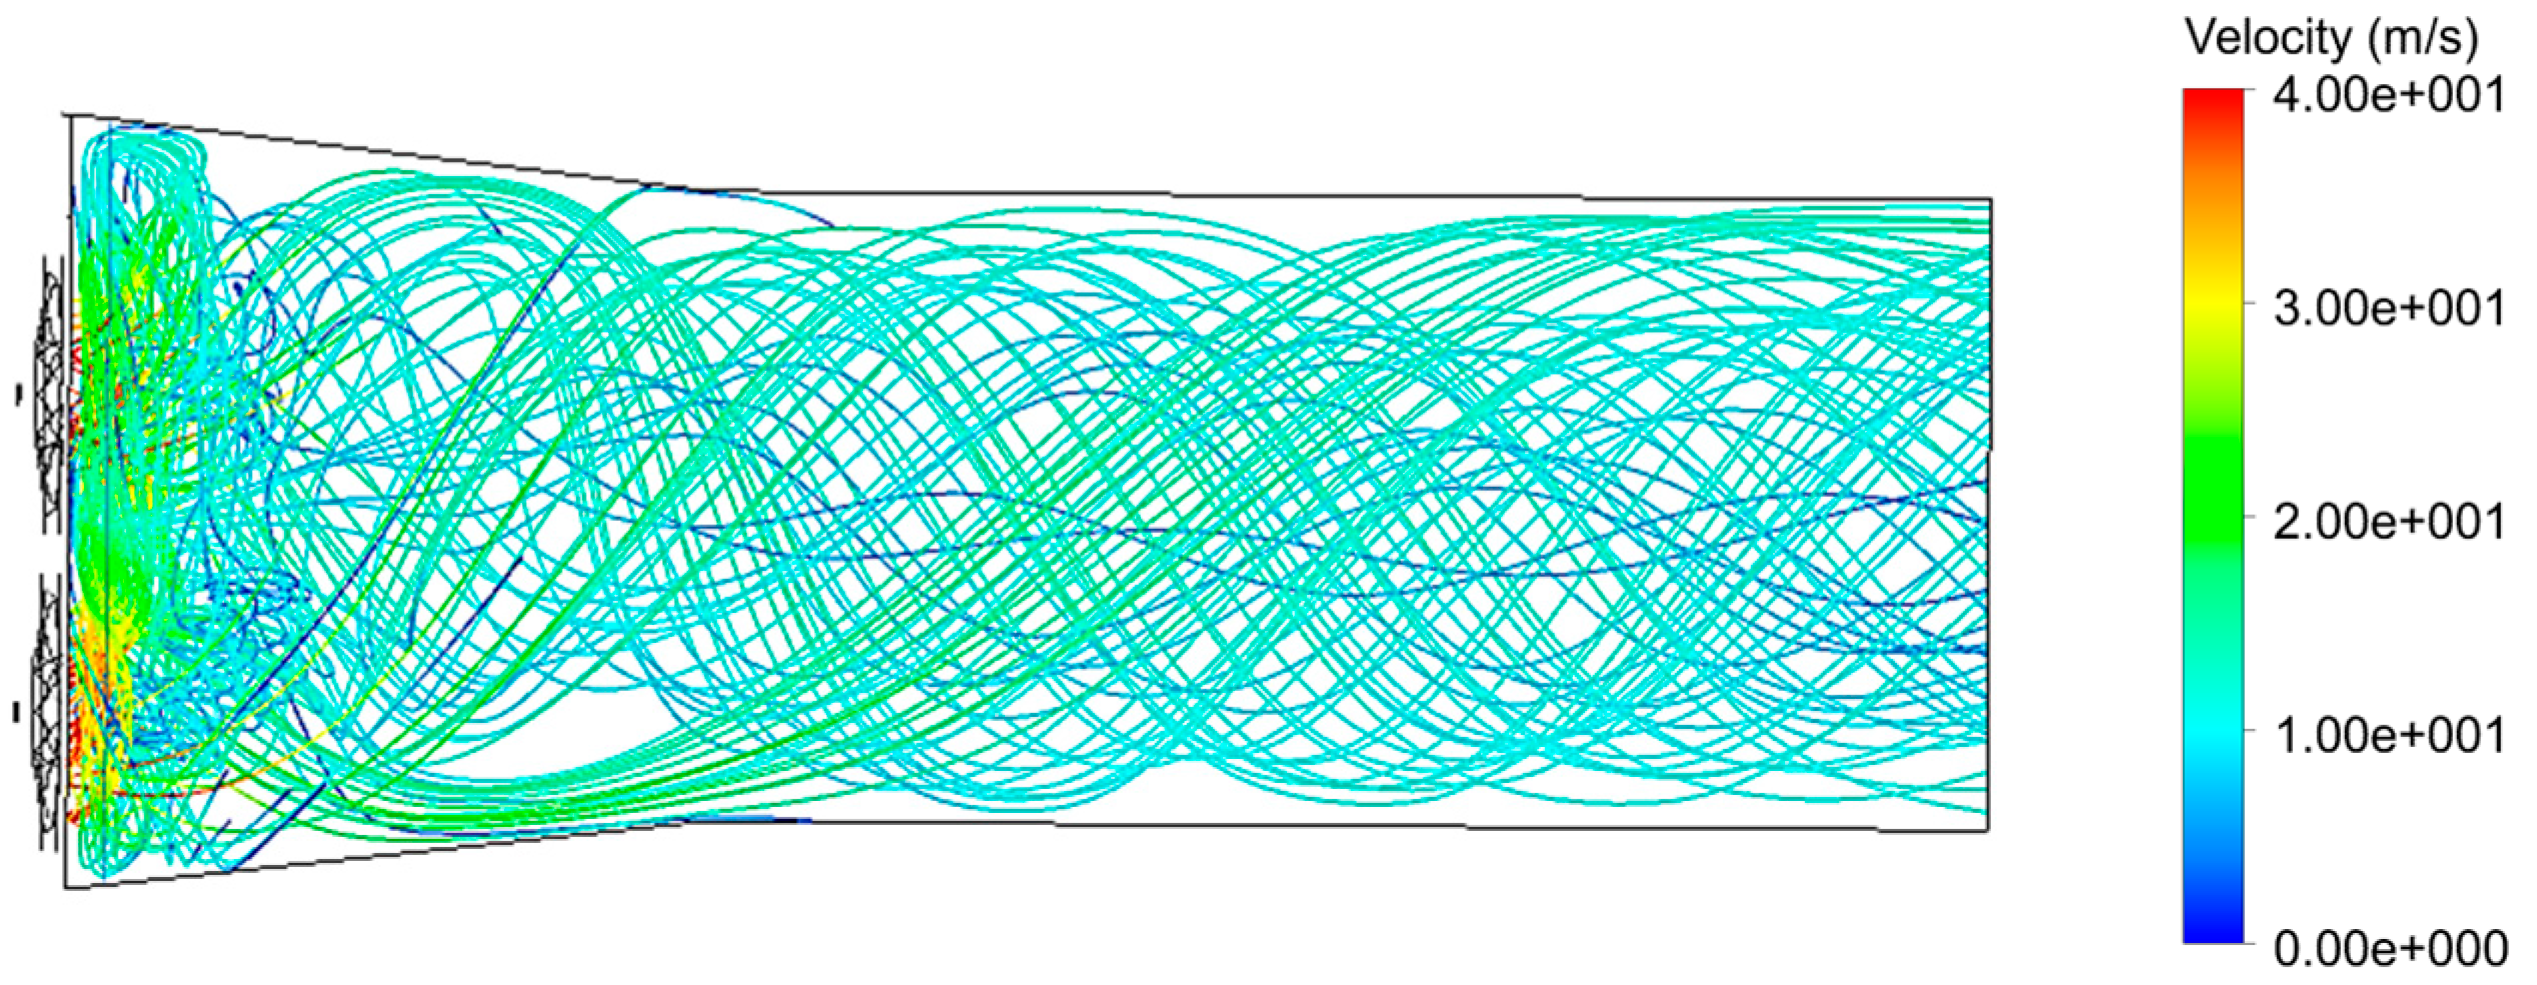
Since the relationship between VP and velocity can be expressed as , where , , is the VP, air density and airflow velocity, the velocity exerts a fundamental influence on the variation of VP. The airflow streamlines of velocity provide a visual expression of movement information in the return airway, as shown in Figure 11. Two parts of airflow out of fans converge, and present spiral lines with circumferential velocity because of the fan rotating blade angle. Complex and intensive streamlines are presented within a certain distance from the fans’ exits, due to the limitation of the tunnel wall and fluid viscous damping effect; and the trend of airflow streamlines vary mildly along the rest of the return airway.
Furthermore, the velocity magnitude and velocity angle distribution in the airways are monitored, as shown in Figure 12. At the position of fans’ exits, the velocity has the widest distribution domain with the range of 0 to 63.8 m3/s, and the velocity angle distribution reaches the maximum symmetrically with the interval of (−178.3°, 187.9°); which indicates that the circumferential velocity determined by the blade angle dominates the airflow direction. In the return airway, the velocity and velocity angle are also altering dramatically in the range of 0 to 3.0 m, and continue to change gently along the rest of return airway; which coincides with the previous analysis. At the outlet, the velocity and velocity angle distribution become (2.4, 15.3) and (−46°, 28°), respectively.
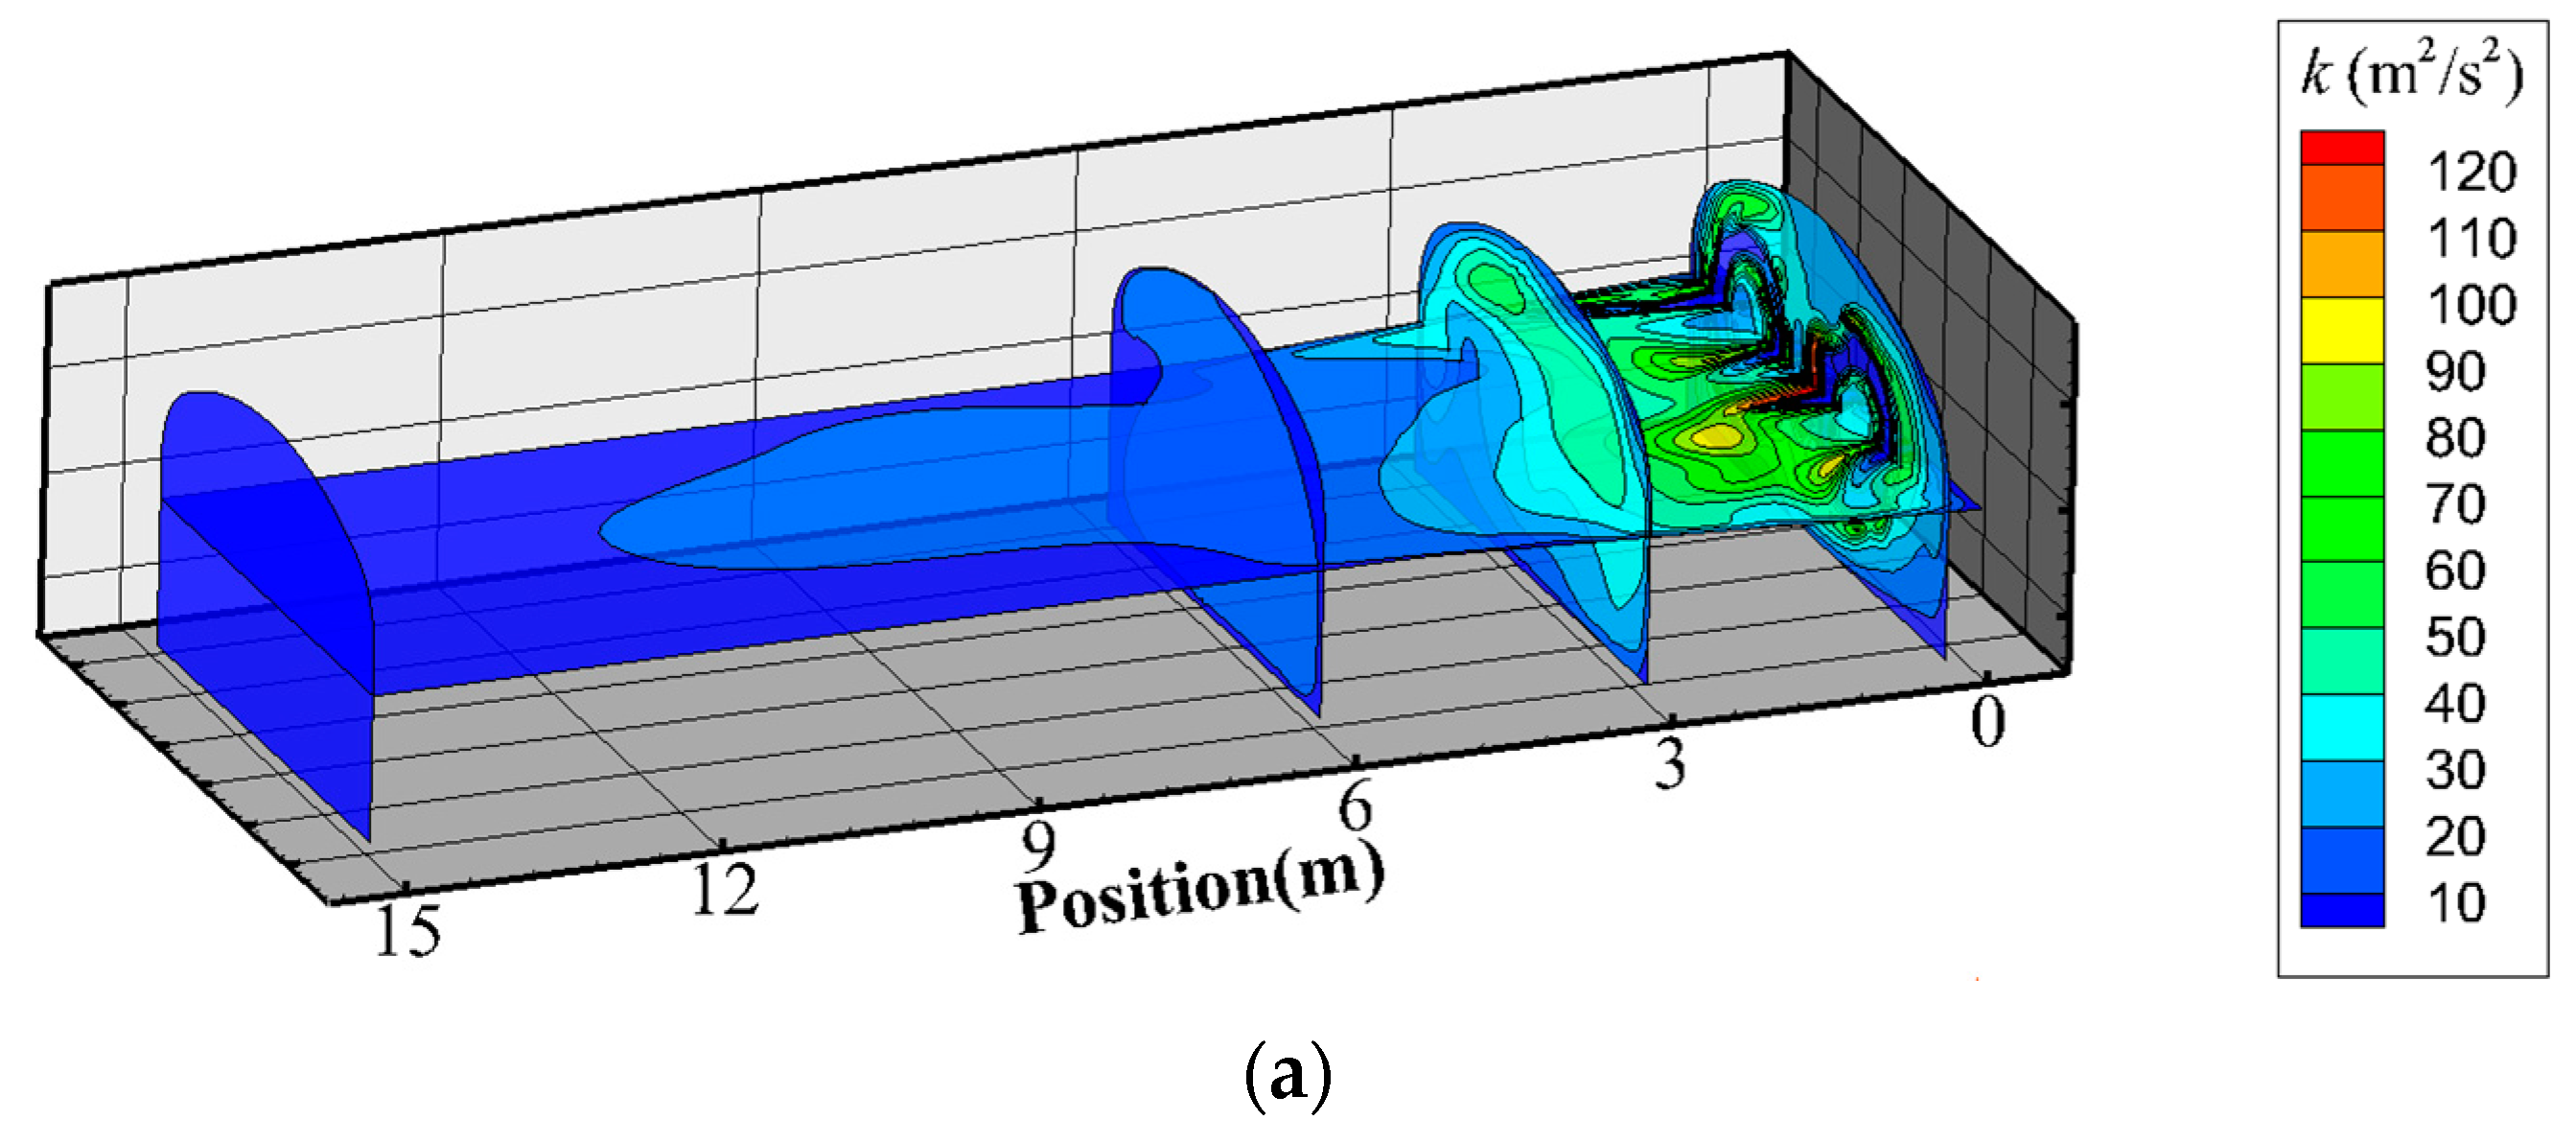
It can be found that the airflow forms a vortex movement due to circumferential velocity in the return airway, which always raises a turbulent phenomenon with a strong momentum transfer rate, and the contours of and is shown in Figure 13. The data indicates that the average value reaches the maximum of 49.60 m2/s2 at the position of 1.50 m, which means the top point of turbulent development. In the range of position >3.0 m, begins to vary slowly after a significant decline. Figure 13 also shows that exerts the greatest effect near the fans’ exits, which means the transition rate from kinetic energy to internal energy in viscous fluid reaches a top point; and the value is gradually reduced as the air flows along the rest of the return airway. Similarly, begins to change slowly or maintain a stable state in the range of position >3.0 m. Therefore, the energy loss, due to the turbulent phenomenon, mainly occurs within the range from 0 to 3 m in the return airway.
In summary, the outlet shock losses are primarily caused by the installation angle of fan blades, which raises the circumferential velocity, and the velocity brings about the turbulent phenomenon and pressure loss. Therefore, the rear guide vane, which can convert the turbulence to the SP, is indispensable for an axial fan to increase its efficiency; however, the majority of engineers and administrators do not always choose to purchase such matching devices at present, because they think that the rear guide vane maybe exert little effect on a high-quantity and low-pressure fan, which has brought significant performance in terms of energy saving. The analysis also indicates that the outlet shock losses occur within the range of 0 to 3 m in the return airway, and a small part loss occurs within the range of 3 to 15 m. It can be certified by the loss of TP within the range of 0 to 3.0 m, which is 350.83 Pa, accounting for 83.81% of the outlet shock losses and 78.06% of the total shock losses in a PFS. Compared with the previously proposed conclusion that the shock losses in a PFS are mainly generated between 10 m in front of the fans’ entries and 10 m behind the fans’ exits [16], the work is more detailed and specific.
In addition, a reverse flow circulation phenomenon appears near the fans’ exits. From the velocity contour of the fans’ exits in Figure 14, we can see that the air velocity presents radiation downward as the center of fan hub, except the velocity in the hub area is close to zero. It indicates that the airflow centrifugal movement makes the area behind the hub become a none or weak airflow region; that is to say, the area is a low air pressure zone, so the recirculation phenomenon is generated owing to air flows from a high pressure place to a low pressure place. Therefore, several improvements and additional auxiliary devices, such as optimizing the shape of hub and using a conical diffuser, may be necessary for an axial fan to eliminate airflow recirculation, and the study will be developed in our further work.
3.5. Effect of Factors
3.5.1. Effect of Blade Installation Angle
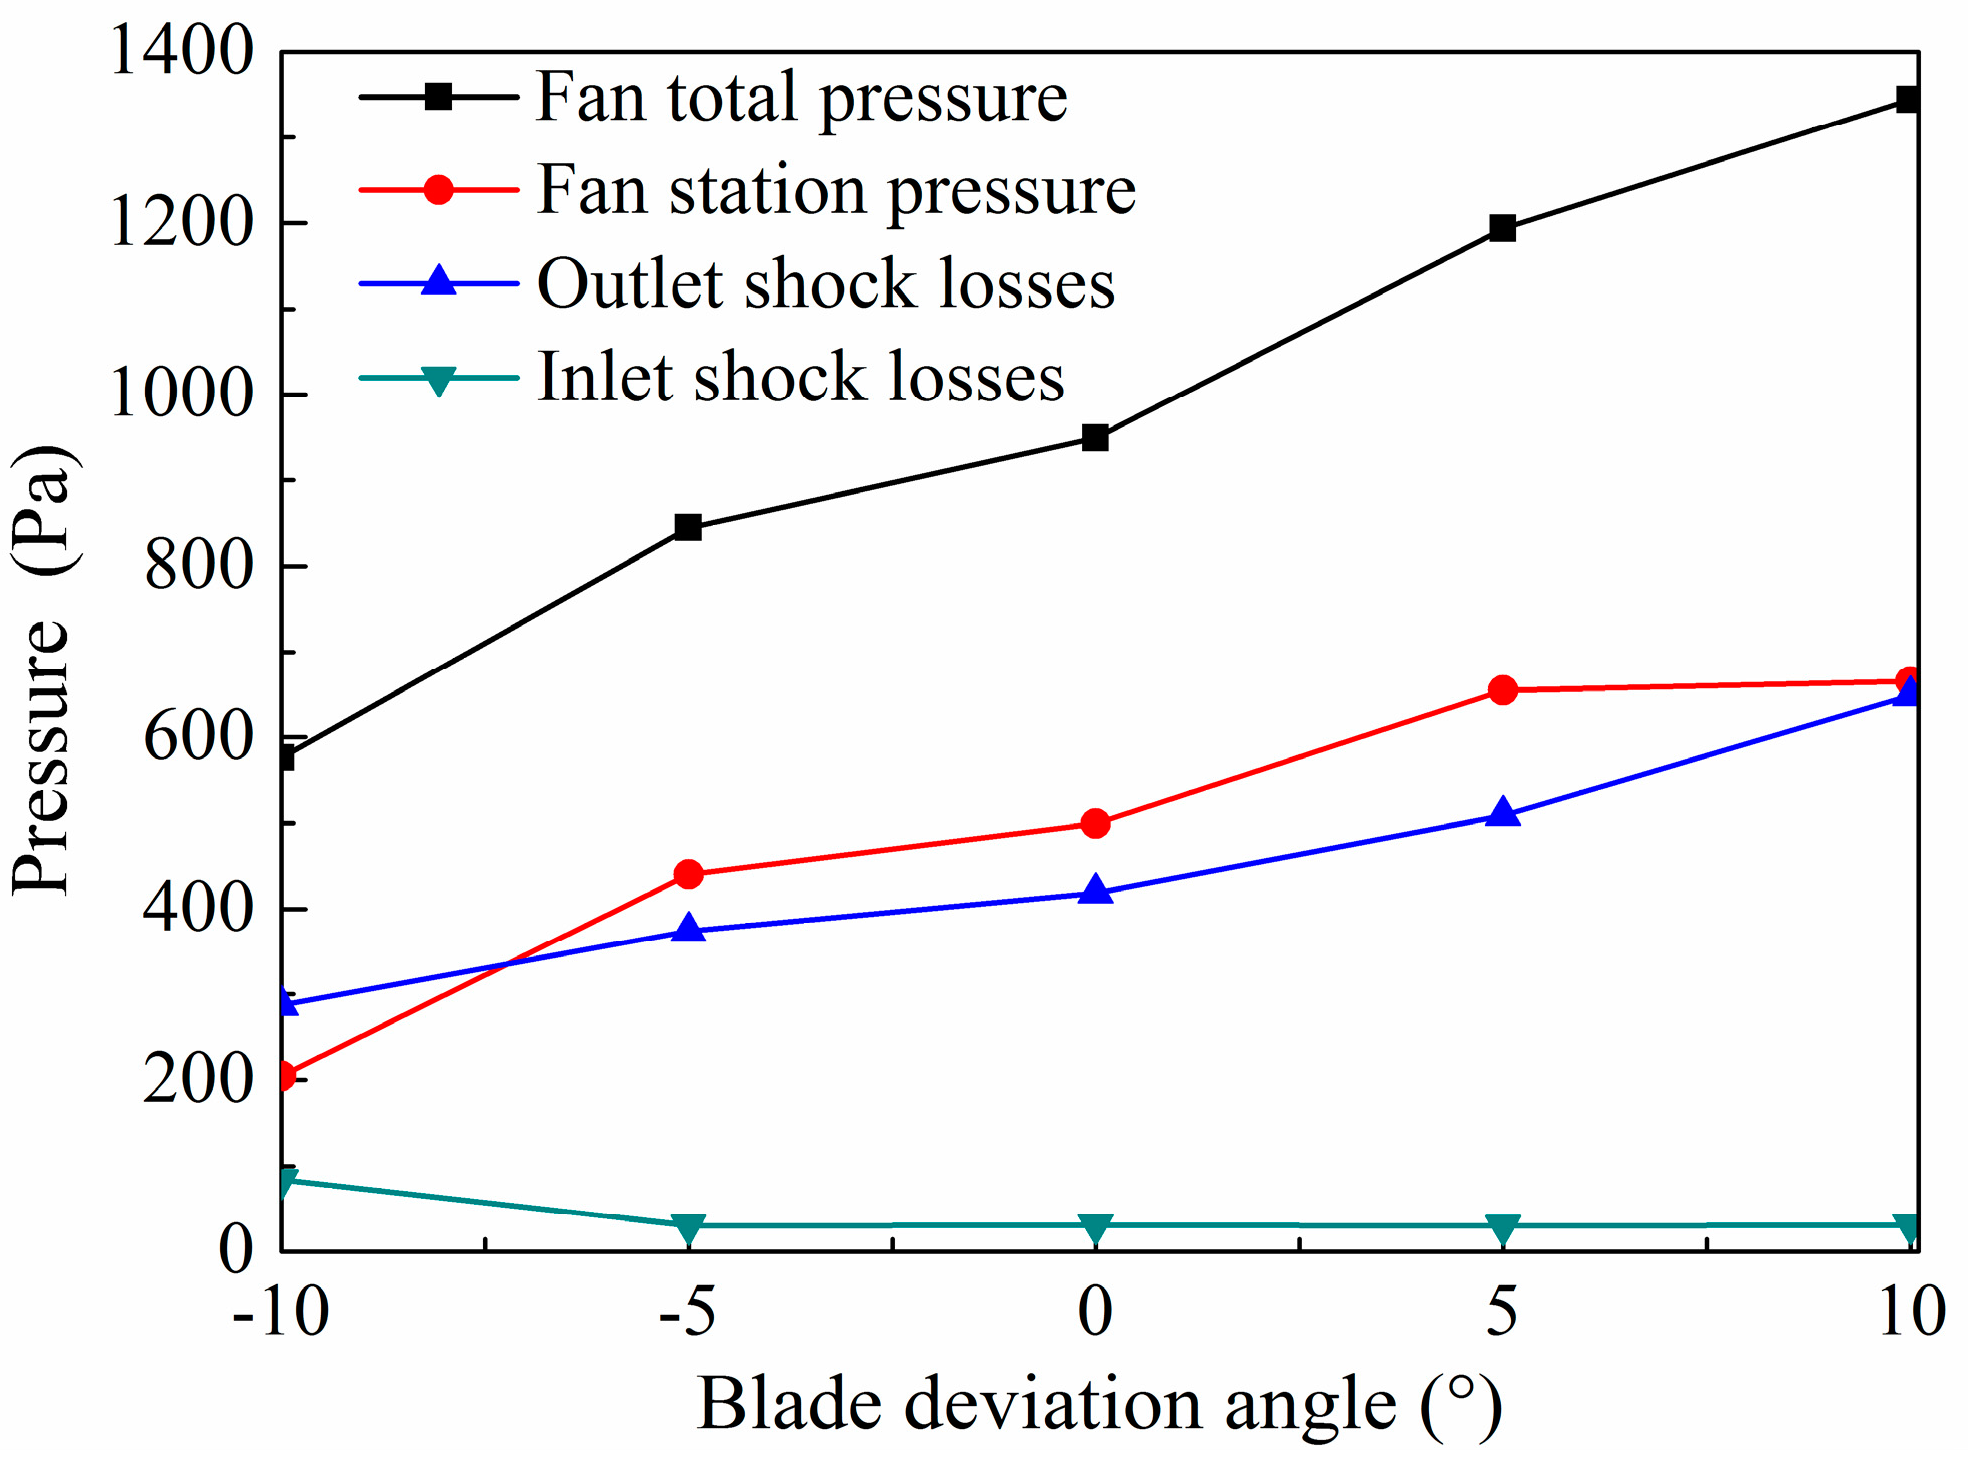
This study, as reported in previous sections, shows the shock losses lead to serious air pressure loss in a PFS; however, the fan blade installation angle can be adjusted in practical application, according to the dynamic demand of mine ventilation. In order to clearly interpret the effect of the blade installation angle on the inlet and outlet shock losses, four supplementary simulations with different blade deviation angles (Δθ) are conducted, based on the original model and blade angle under the condition of air quantity of 110.56 m3/s in the PFS, and Figure 15 shows the TP data obtained from the simulated results. It indicates that the TP value of fan and PFS are reduced as the blade angle decreases, and vice versa.
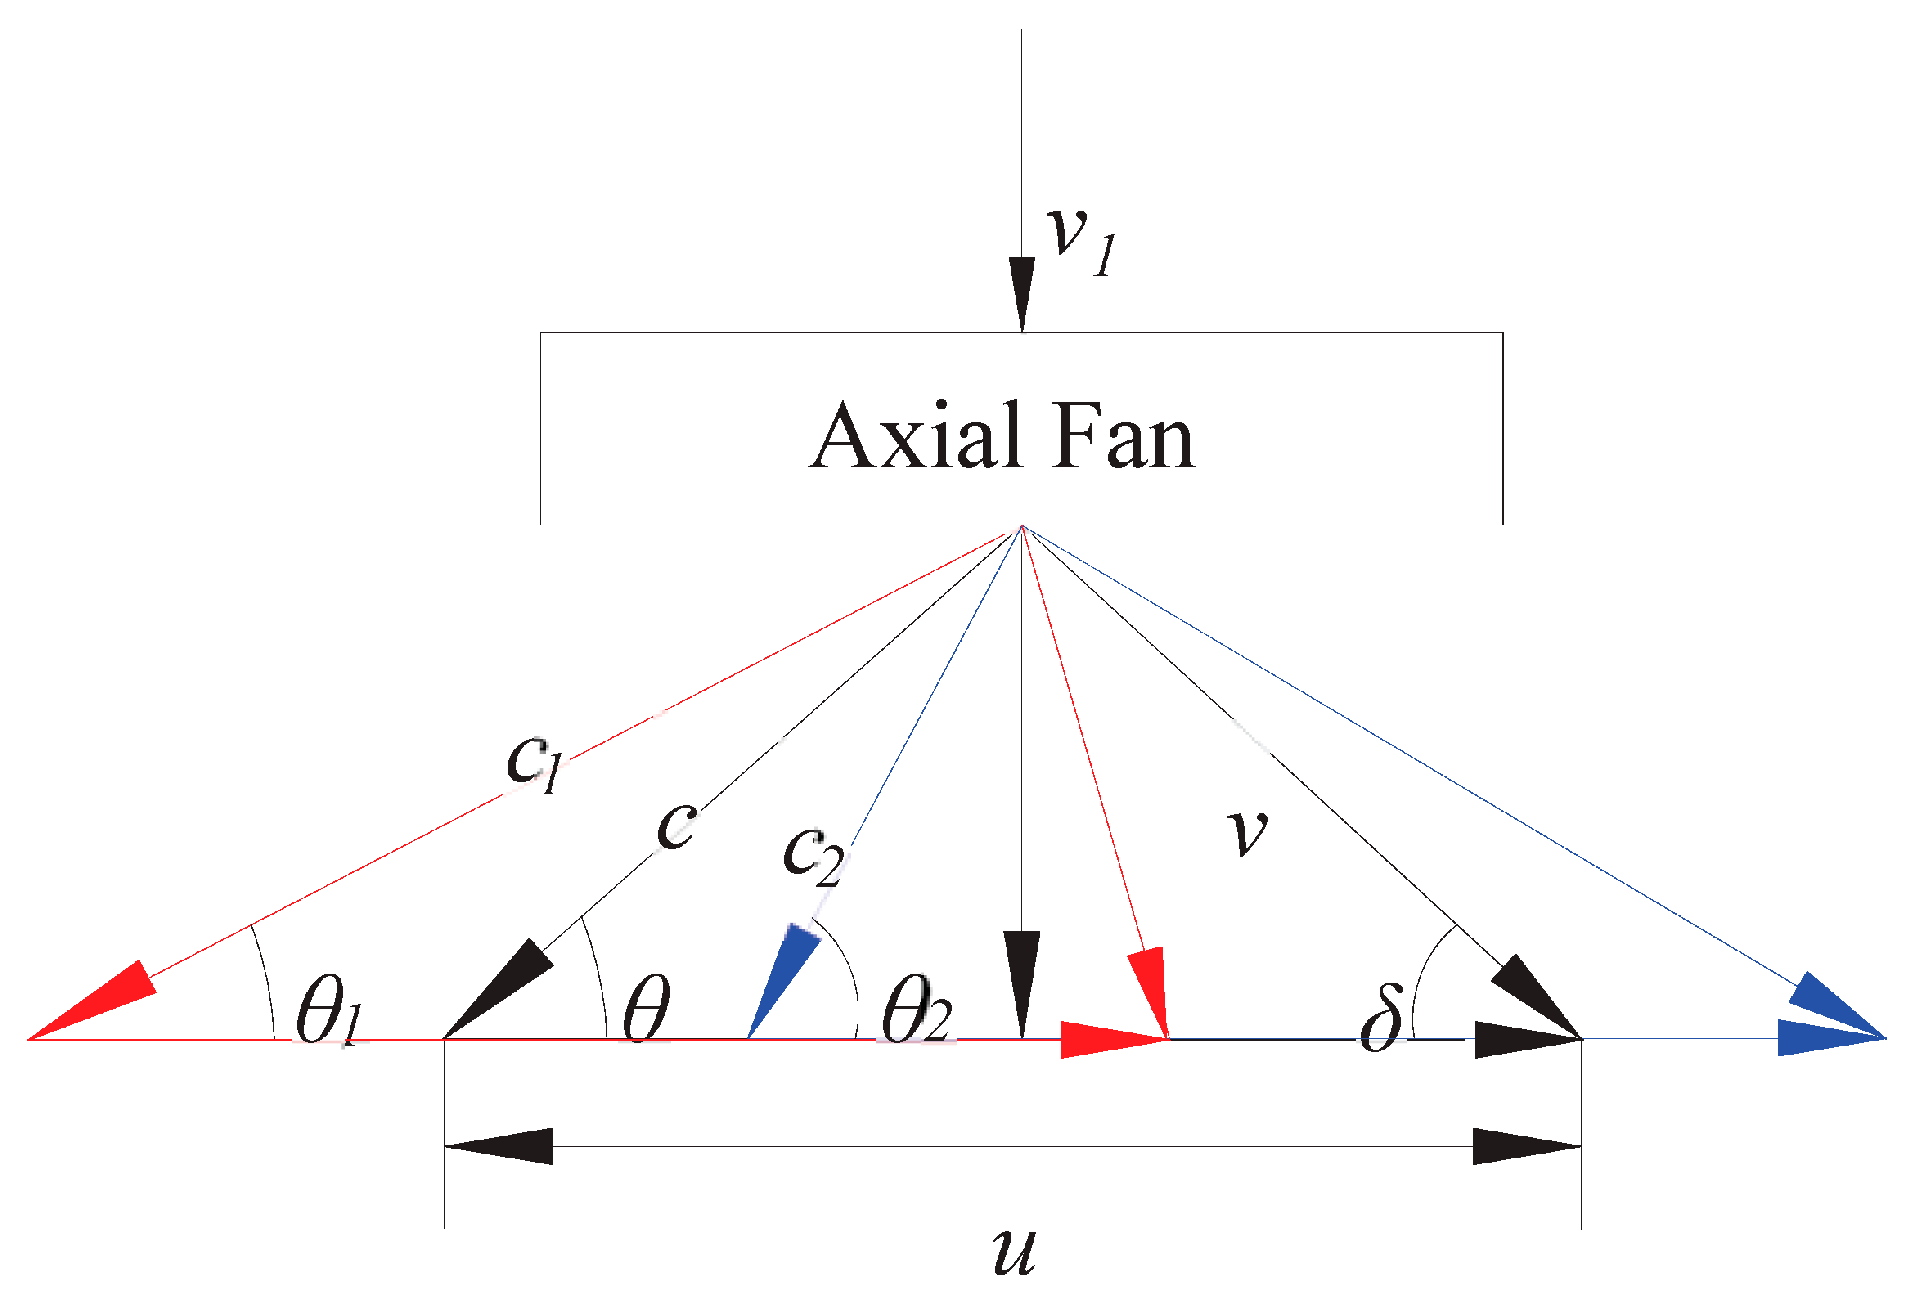
In terms of the inlet shock losses, the resistance varies slightly between 30.12 Pa and 30.95 Pa except for Δθ = −10°, and the resistance rises up to 84.16 Pa when Δθ = −10°. It indicates that the blade angle is relatively small to let the air quantity pass through parallel fans smoothly. In terms of the outlet shock losses, combined with the air velocity triangle in Figure 16, we can find that the remains constant because the fan speed is constant; as the blade angle reduces from to (such as Δθ = −5° and Δθ = −10° in Figure 15), the inclines to the axis direction, and the increases, and the outlet shock losses drop down with circumferential velocity component decreases. Conversely, the outlet shock losses and the circumferential velocity component are developed as the angle increases from to (such as Δθ = 5° and Δθ = 10° in Figure 15).
In addition, the data shows that the fan station pressure drops by 235.28 Pa as changes from −5° to −10°, but it rises by 10.32 Pa as changes from 5° to 10°. It suggests that an improper blade angle will increase air pressure loss greatly, which also severely degrades the fan efficiency. Therefore, an unsuitable installation blade angle should be avoided under the condition of specific air quantity.
3.5.2. Effect of Airflow Mutual Interference
Some researchers have speculated that the shock losses will increase under the condition of N fans in parallel operation, due to the effect of split-flow at the position of fans’ entries, as well as the mutual interference in airflow mixing process at the position of fans’ exits [10]. It suggested that two fans should be installed in different airways to form a disconnected parallel structure. Other studies held that the shock losses dropped greatly with enlarging the airway cross-section area, as the number of parallel fans increases [17]. Consequently, there is a substantial divergence in the pros and cons of airflow mutual interference; thus, it is necessary to have a further insight on this issue.
Considering that the airflow presents a uniform linear flow structure in the intake airway under certain hypothesies, and the air flows into the fans based on the principle of proximity, the split-flow exerts little influence on the shock losses in the PFS; thus, the inlet shock losses will remain unchanged when the airflow is divided into two separate parts. Therefore, an isolation wall is added into the return airway in the PFS model, as shown in Figure 17, in order to illustrate the effect of airflow mutual interference.
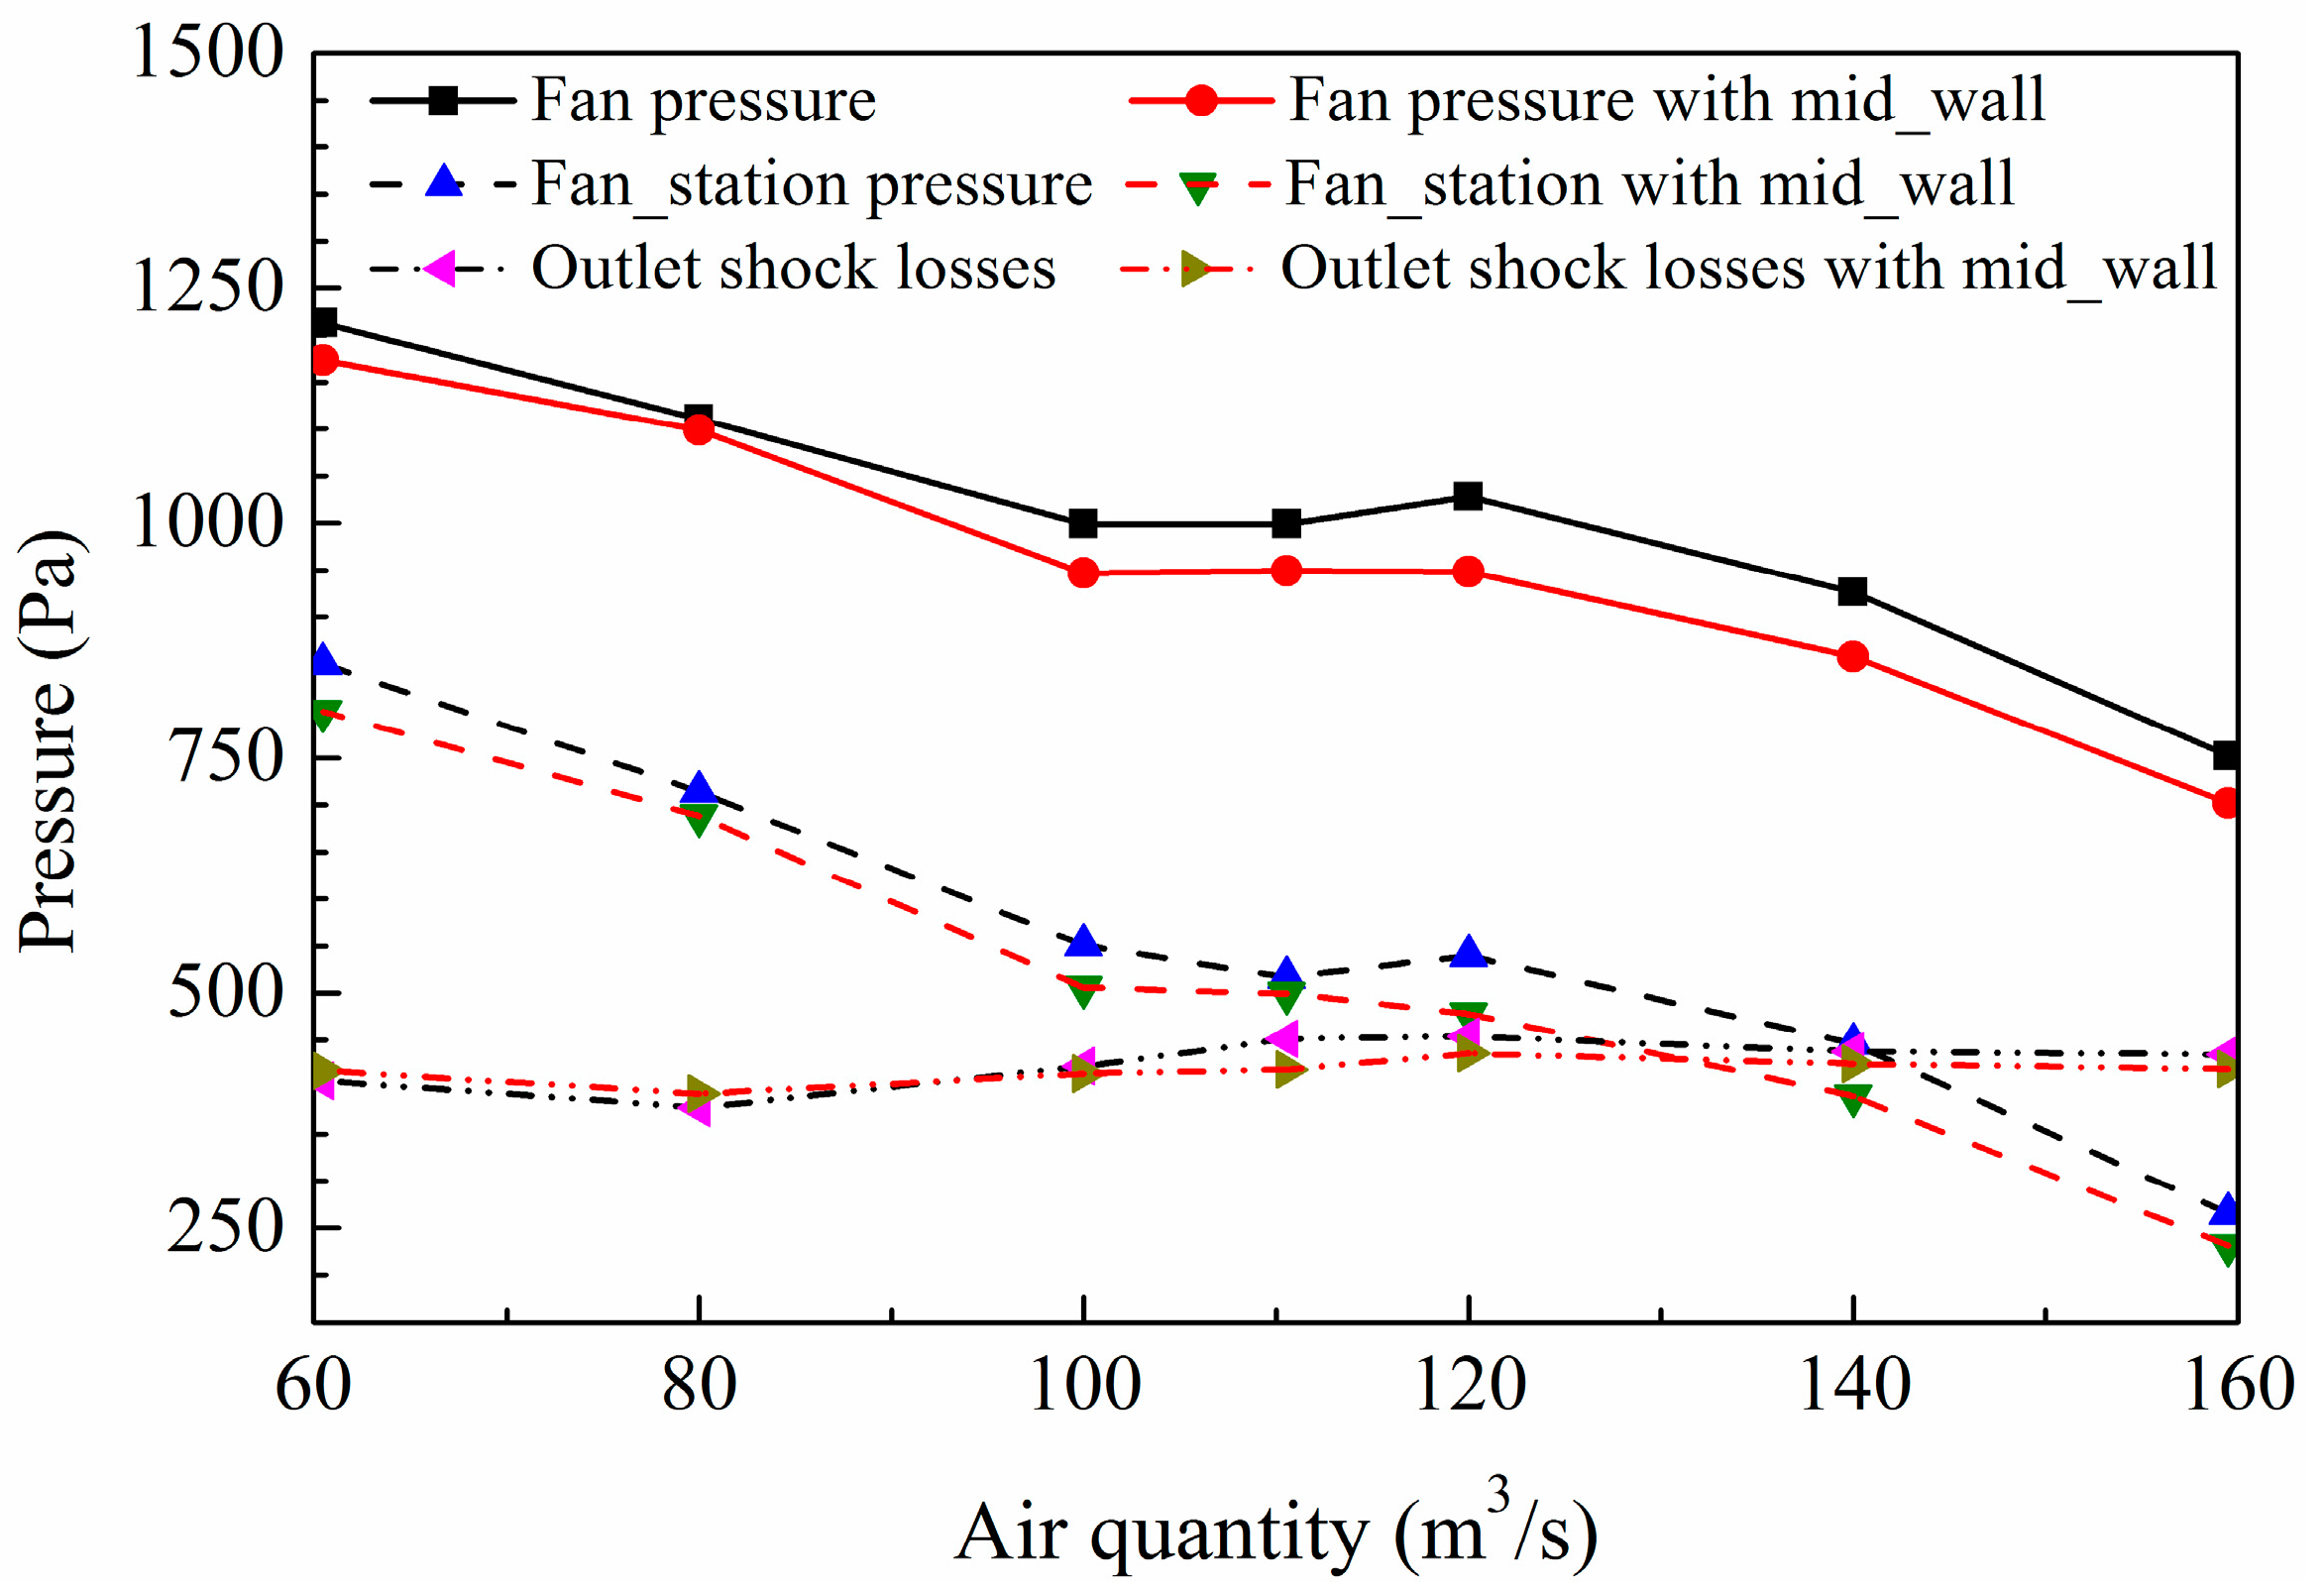
Figure 18 shows the results under different air quantity conditions; it indicates that the average pressures fall slightly in both fans and PFS when the airflow is divided into two parts, and the drop ranges are (11.9, 79.9) and (17.5, 61.8), respectively. However, there is a tiny change between two curves of the outlet shock losses, and the deviation interval is (−32.9, 15.0). Therefore, the mutual interference exerts little effect on the shock losses in the PFS. It also suggests that the approach is useless to form a parallel structure by letting two fans install in different airways, to avoid the airflow interference and reduce the shock losses in PFS.
4. Conclusions
A series of PFS models in MFSVS were established to study the characterization and effects of the shock losses. Conclusions are as follows:
The fan in parallel structure shows distinct performance and operating characteristics, compared with the standard fan. The inlet shock losses in a PFS, due to a sudden change of airflow surface area, can be interpreted by one-dimensional flow theory and a fitting function, and a linear relationship is unearthed between the inlet shock losses and air quantity. The outlet shock losses, due to the circumferential velocity and turbulence, exert a significant effect on pressure loss and energy consumption, and the outlet shock losses are primarily generated within the range of 0 to 3.0 m behind the fans’ exits; hence, a conical diffuser with rear guide vane is put forward to recover air pressure in PFS. Further discussions also evidence that the outlet shock losses are greatly affected by the fan blade installation angle, whereas the inlet shock losses are hardly affected. The airflow mutual interference exerts little effect on the shock losses in PFS, to achieve the goal of consumption reduction and energy saving.
In our future work, a series of studies will focus on many factors and effective measures for energy conservation, as well as the relationship between the shock losses’ coefficient, air quantity and tunnel cross-section.
Acknowledgments
This work is partially supported by the National 12th Five-Year Science and Technology Supporting Plan (2013BAB02B05) of China, the Shenghua Lieying Program of Central South University (Principle Investigator: Jian Zhou), the Innovation Driven Plan of Central South University (Grant No. 2017zzts182) of China.
Author Contributions
Yonggang Gou and Xiuzhi Shi conceived and designed the experiments; Yonggang Gou and Xin Chen performed the experiments; Yonggang Gou analyzed the data and wrote the paper under the guidance of Jian Zhou and Xianyang Qiu.
Conflicts of Interest
The authors declare no conflict of interest.
References
- Chatterjee, A.; Zhang, L.; Xia, X. Optimization of mine ventilation fan speeds according to ventilation on demand and time of use tariff. Appl. Energy 2015, 146, 65–73. [Google Scholar] [CrossRef]
- Panigrahi, D.C.; Mishra, D.P. CFD simulations for the selection of an appropriate blade profile for improving energy efficiency in axial flow mine ventilation fans. J. Sustain. Min. 2014, 13, 15–21. [Google Scholar] [CrossRef]
- De Souza, E. Improving the energy efficiency of mine fan assemblages. Appl. Therm. Eng. 2015, 90, 1092–1097. [Google Scholar] [CrossRef]
- Karacan, C.Ö. Development and application of reservoir models and artificial neural networks for optimizing ventilation air requirements in development mining of coal seams. Int. J. Coal Geol. 2007, 72, 221–239. [Google Scholar] [CrossRef]
- Abdelaziz, E.A.; Saidur, R.; Mekhilef, S. A review on energy saving strategies in industrial sector. Renew. Sustain. Energy Rev. 2011, 15, 150–168. [Google Scholar] [CrossRef]
- Ghoreishi-Madiseh, S.A.; Sasmito, A.P.; Hassani, F.P.; Amiri, L. Performance evaluation of large scale rock-pit seasonal thermal energy storage for application in underground mine ventilation. Appl. Energy 2017, 185, 1940–1947. [Google Scholar] [CrossRef]
- Cheng, J.W.; Zhou, F.B.; Qin, Y.; Li, J.L. System dynamic based simulation experiments for evaluating performances of mine ventilation system—A case study. Disaster Adv. 2013, 6, 358–374. [Google Scholar]
- Wang, T.J.; Xie, X.P.; Li, J.G.; Tan, X.Y.; Yin, X.Y.; Su, M.W.; Luo, W.G.; Cui, C. Optimization of monitoring points’ layout for the multi-fan and multi-station ventilation system. Polit. Relig. 2014, 614, 590–612. [Google Scholar] [CrossRef]
- Liu, J.; Xie, X. Principle of energy saving of multi-fan and multistage fan station ventilation system. Nonferrous Met. 2010, 62, 71–74. [Google Scholar]
- Chen, Y. Research on optimization design method for mine multi-stage fan station ventilation system. Met. Min. 2008, 379, 121–124. [Google Scholar]
- Hu, P.H.; Li, X.J. Analysis of radon reduction and ventilation systems in uranium mines in china. J. Radiol. Prot. 2012, 32, 289–300. [Google Scholar] [CrossRef] [PubMed]
- Don, Z.M. Discussion on the problems on ventilation technology of multistage fan stations. Express Inf. Min. Ind. 2001, 366, 1–4. [Google Scholar]
- Haghighat, A. Analysis of A Ventilation Network in A Multiple Fans Limestone Mine. Master’s Thesis, Massouri University of Science and Technology, Rolla, MO, USA, 2014. [Google Scholar]
- Hurtado, J.P.; Díaz, N.; Acuña, E.I.; Fernández, J. Shock losses characterization of ventilation circuits for block caving production levels. Tunn. Undergr. Space Technol. 2014, 41, 88–94. [Google Scholar] [CrossRef]
- Wu, C. Mine Ventilation and Air Conditioning; Central South University Press: Changsha, China, 2008. [Google Scholar]
- Pan, J. Study on the local ventilation resistance of multistage fan station. Met. Min. 2001, 9, 49–51. [Google Scholar]
- Cheng, L.S.; Li, G.Q.; Shen, Y.W. Study on the resistance of multi fan station in underground. Ind. Saf. Environ. Protect. 1987, 2, 13–18. [Google Scholar]
- Li, Y.L.; Cheng, L.S.; Li, G.Q. Study on reducing the local resistance and the reasonable structure of the machine station. In Proceedings of the National Symposium on Mine Ventilation and Safety, Ma’anshan, China, 15 July 1987. [Google Scholar]
- Liang, Y.; Li, J.; Tian, H. Study on flow fields and losses of the stationary components in an axial flow fan. J. Xian Jiaotong Univ. 2008, 3, 269–272. [Google Scholar]
- Basara, B.; Alajbegovic, A.; Beader, D. Simulation of single- and two-phase flows on sliding unstructured meshes using finite volume method. Int. J. Numer. Methods Fluids 2004, 45, 1137–1159. [Google Scholar] [CrossRef]
- Diego, I.; Torno, S.; Toraño, J.; Menéndez, M.; Gent, M. A practical use of CFD for ventilation of underground works. Tunn. Undergr. Space Technol. 2011, 26, 189–200. [Google Scholar] [CrossRef]
- Kurnia, J.C.; Sasmito, A.P.; Mujumdar, A.S. Simulation of a novel intermittent ventilation system for underground mines. Tunn. Undergr. Space Technol. 2014, 42, 206–215. [Google Scholar] [CrossRef]
- Sasmito, A.P.; Birgersson, E.; Ly, H.C.; Mujumdar, A.S. Some approaches to improve ventilation system in underground coal mines environment—A computational fluid dynamic study. Tunn. Undergr. Space Technol. 2013, 34, 82–95. [Google Scholar] [CrossRef]
- Heerden, J.; Sullivan, P. The application of CFD for evaluation of dust suppression and auxiliary ventilating systems used with continuous miners. In Proceedings of the 6th US Mine Ventialtion Symposium, Littleton, CO, USA; 1993; pp. 293–297. [Google Scholar]
- Hurtado, J.P.; Acuña, E.I. CFD analysis of 58 adit main fans parallel installation for the 2015–2019 underground developments of the new level mine project. Appl. Therm. Eng. 2015, 90, 1109–1118. [Google Scholar] [CrossRef]
- Xu, G.; Jong, E.C.; Luxbacher, K.D.; Ragab, S.A.; Karmis, M.E. Remote characterization of ventilation systems using tracer gas and CFD in an underground mine. Saf. Sci. 2015, 74, 140–149. [Google Scholar] [CrossRef]
- Li, C.; Lin, Q.; Ding, X.; Ye, X. Performance, aeroacoustics and feature extraction of an axial flow fan with abnormal blade angle. Energy 2016, 103, 322–339. [Google Scholar] [CrossRef]
- Gou, Y.G. Efficiency Improvement and Consumption Reduction Studies of Complex Multi-Stage Fan Station Ventilation System in Deep Mine. Master’s Thesis, Central South University, Changsha, China, 2016. [Google Scholar]
- Ye, X.; Li, P.; Li, C.; Ding, X. Numerical investigation of blade tip grooving effect on performance and dynamics of an axial flow fan. Energy 2015, 82, 556–569. [Google Scholar] [CrossRef]
- Li, C.; Li, X.; Li, P.; Ye, X. Numerical investigation of impeller trimming effect on performance of an axial flow fan. Energy 2014, 75, 534–548. [Google Scholar] [CrossRef]
- Chen, X.; Shi, X.; Zhou, J.; Chen, Q.; Yang, C. Feasibility of recycling ultrafine leaching residue by backfill: Experimental and CFD approaches. Minerals 2017, 7, 54. [Google Scholar] [CrossRef]
- Kurnia, J.C.; Sasmito, A.P.; Hassani, F.P.; Mujumdar, A.S. Introduction and evaluation of a novel hybrid brattice for improved dust control in underground mining faces: A computational study. Int. J. Min. Sci. Technol. 2015, 25, 537–543. [Google Scholar] [CrossRef]
- ANSYS. Ansys Fluent 15.0 Users Guide Manual; ANSYS Inc.: Canonsburg, PA, USA, 2014. [Google Scholar]
- ANSYS. Ansys Icem CFD 14.5 Tutorial Manual; ANSYS Inc.: Canonsburg, PA, USA, 2014. [Google Scholar]
- SIWEI. Axial Flow Fan Comprehensive Parameters Instruction Manual; Nanchang SIWEI Ventilation Mashion Factory: Nanchang, China, 2013. [Google Scholar]
- GB/T1236-2000. Industrial Fans Performance Testing Using Standardized Airways; State Bureau of Quality and Technical Supervision: Shanghai, China, 2000. [Google Scholar]
- Wang, C.; Ye, J.H. Fan performance test system design and research. In Proceedings of the International Conference on Electric Information & Control Engineering, Lushan, China, 6–8 April 2012; pp. 714–716. [Google Scholar]
- Sasmito, A.P.; Kurnia, J.C.; Birgersson, E.; Mujumdar, A.S. Computational evaluation of thermal management strategies in an underground mine. Appl. Therm. Eng. 2015, 90, 1144–1150. [Google Scholar] [CrossRef]
- McPherson, M.J. Subsurface Ventilation and Environmental Engineering; Springer Science & Business Media: Berlin, Germany, 2012. [Google Scholar]
Figure 1.
Description of parallel fan station (PFS).
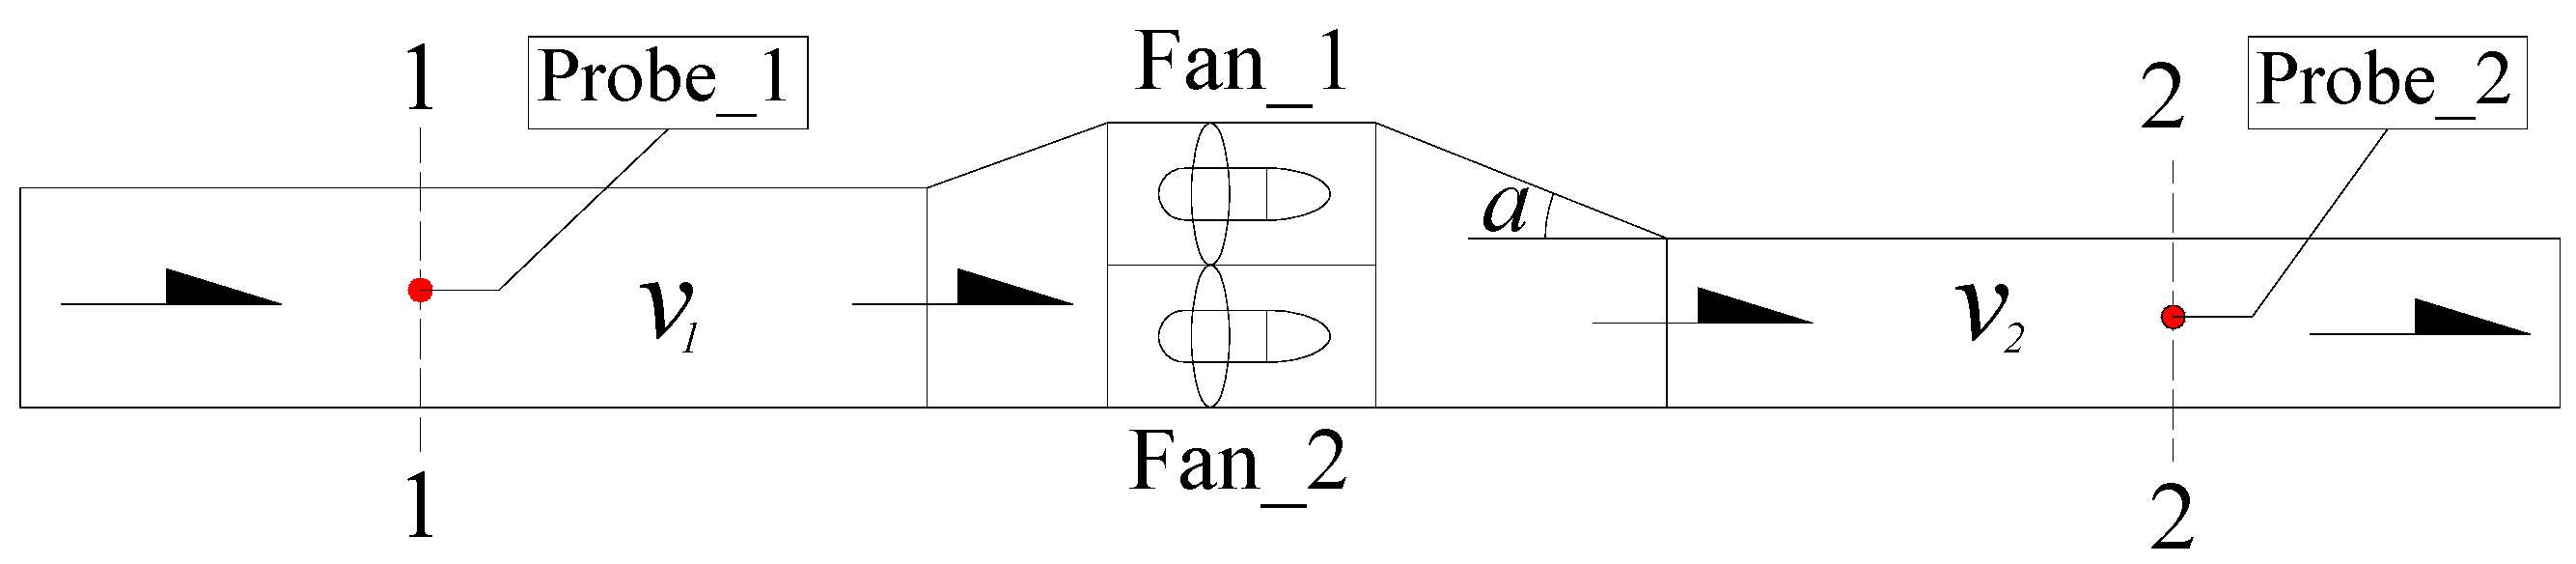
Figure 2.
Structure diagram of K40(B)-19 type fan.

Figure 3.
Arrangement diagram of the 50 m station.
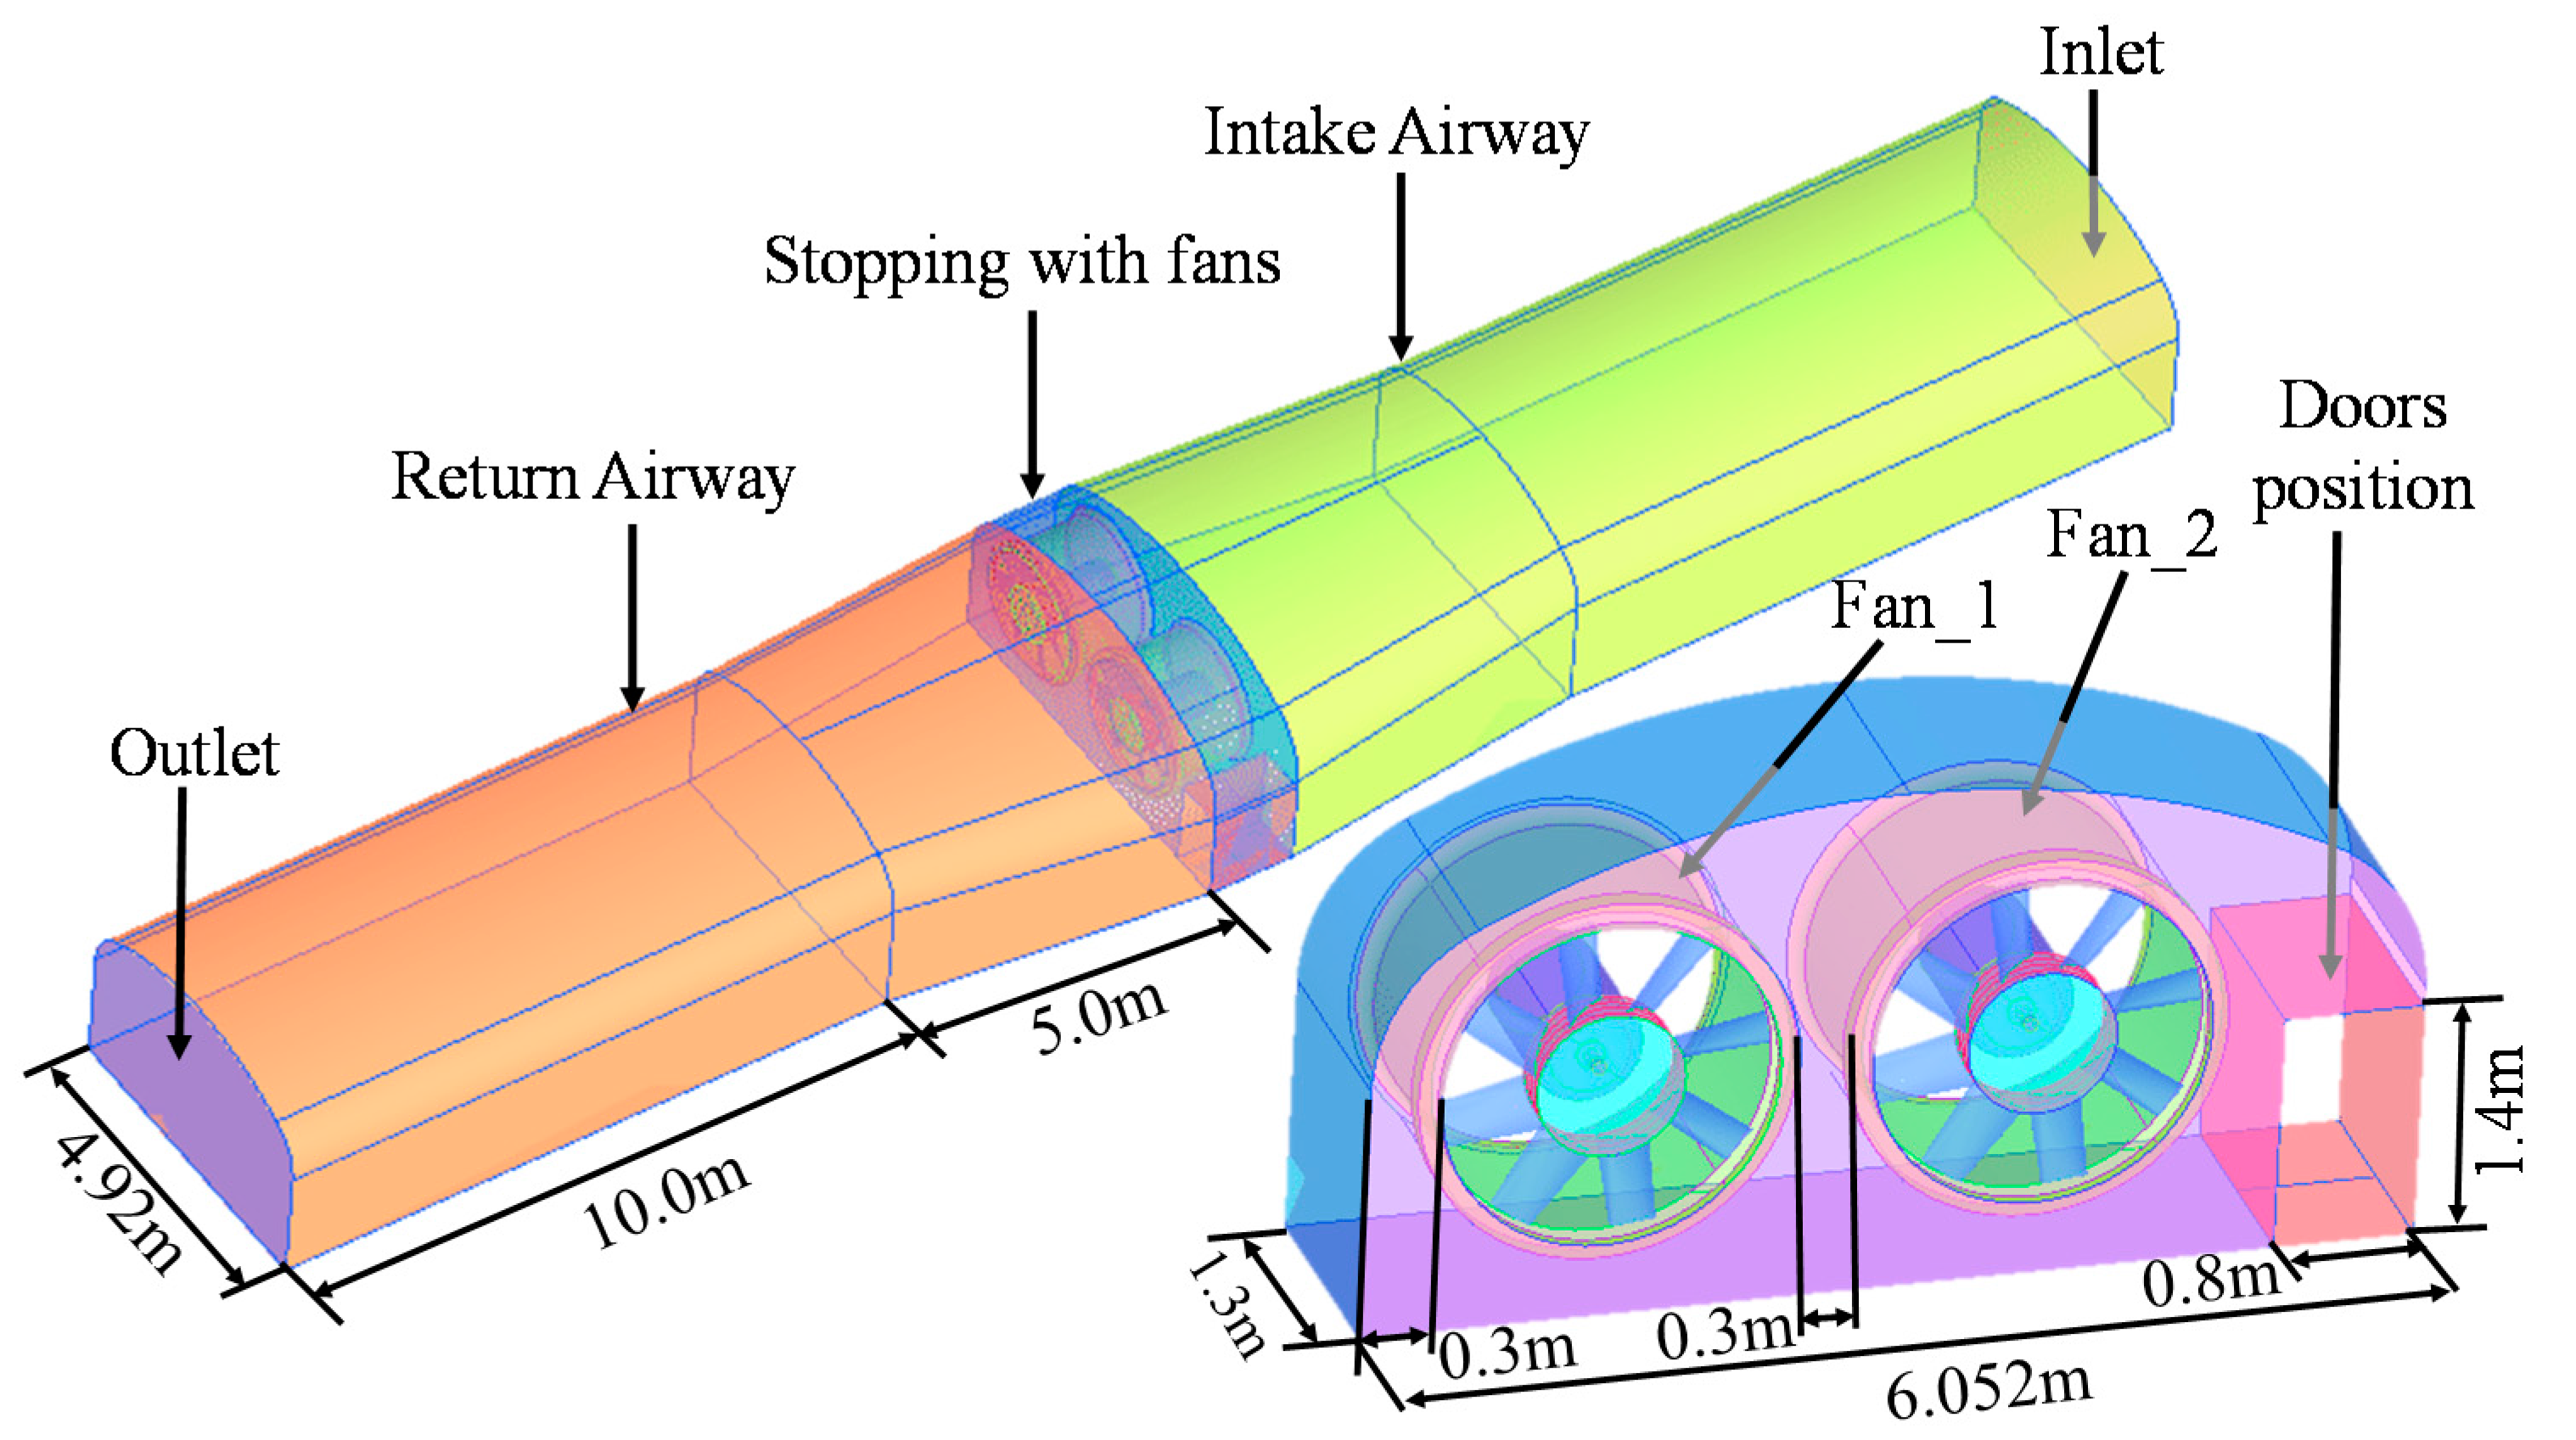
Figure 4.
Mesh generated in model and local mesh refinement.
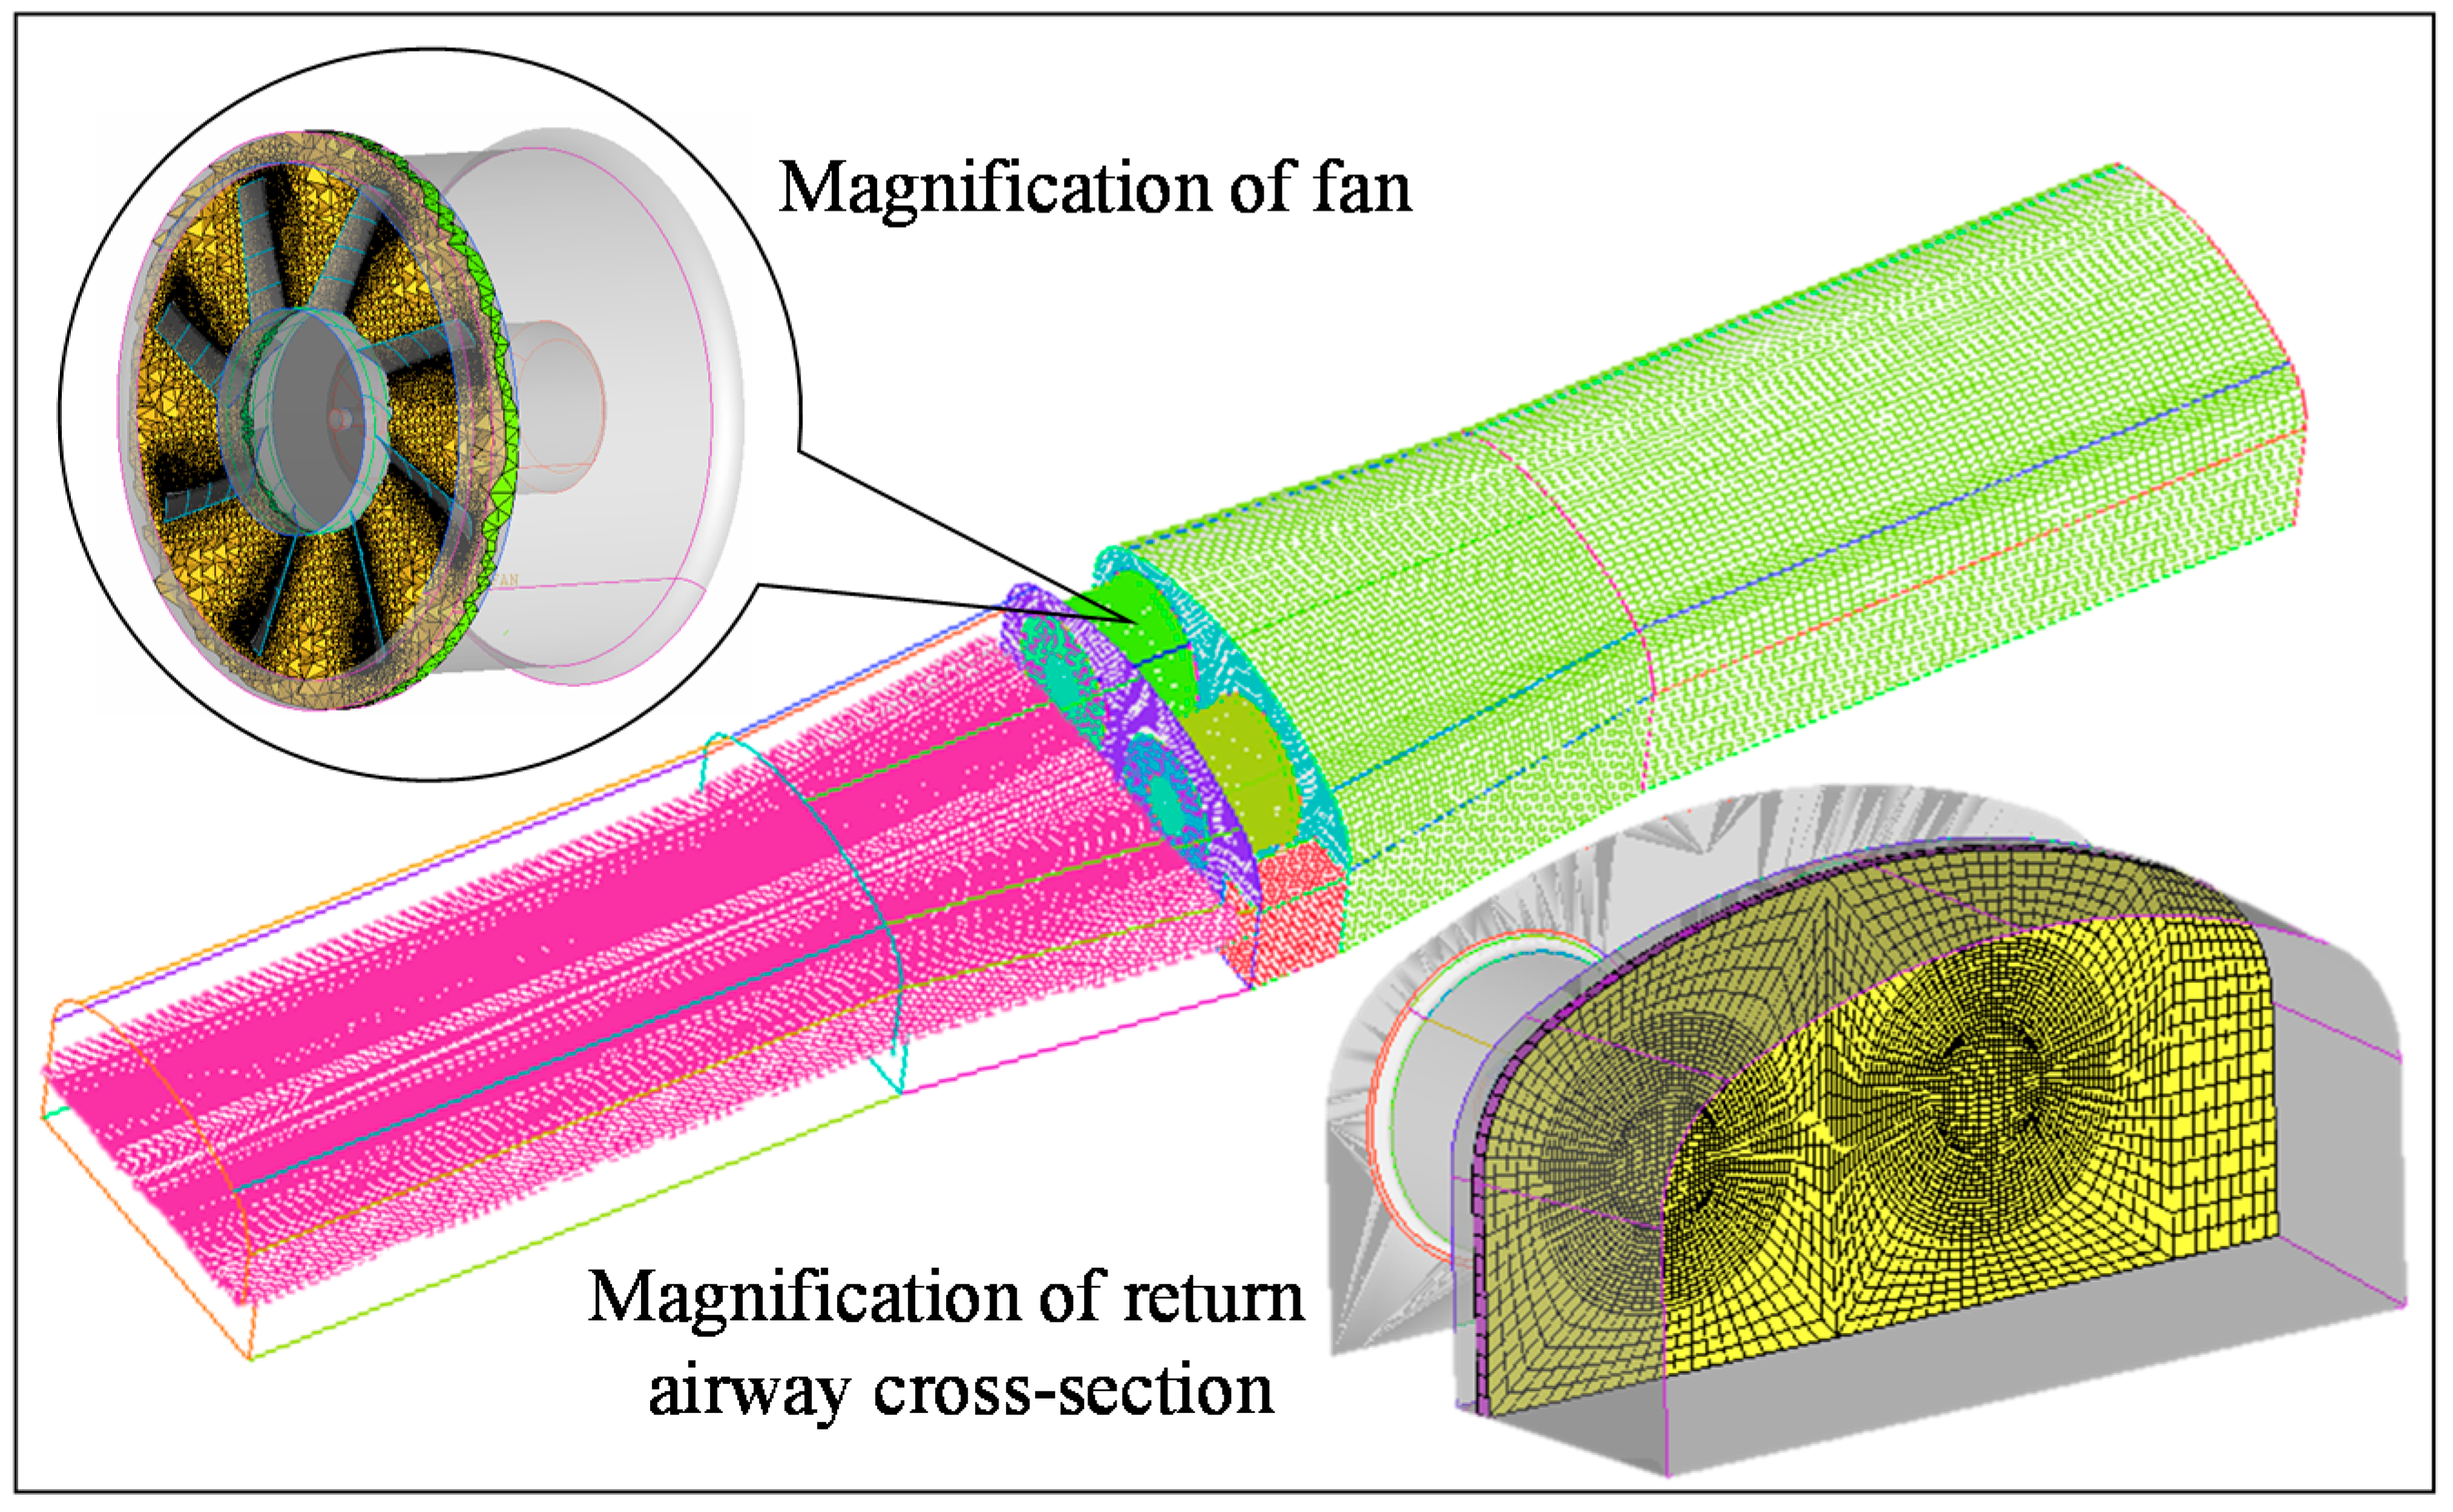
Figure 5.
Comparison of experimental and numerical performance curves.

Figure 6.
Characteristic curves of each fan and parallel fans.
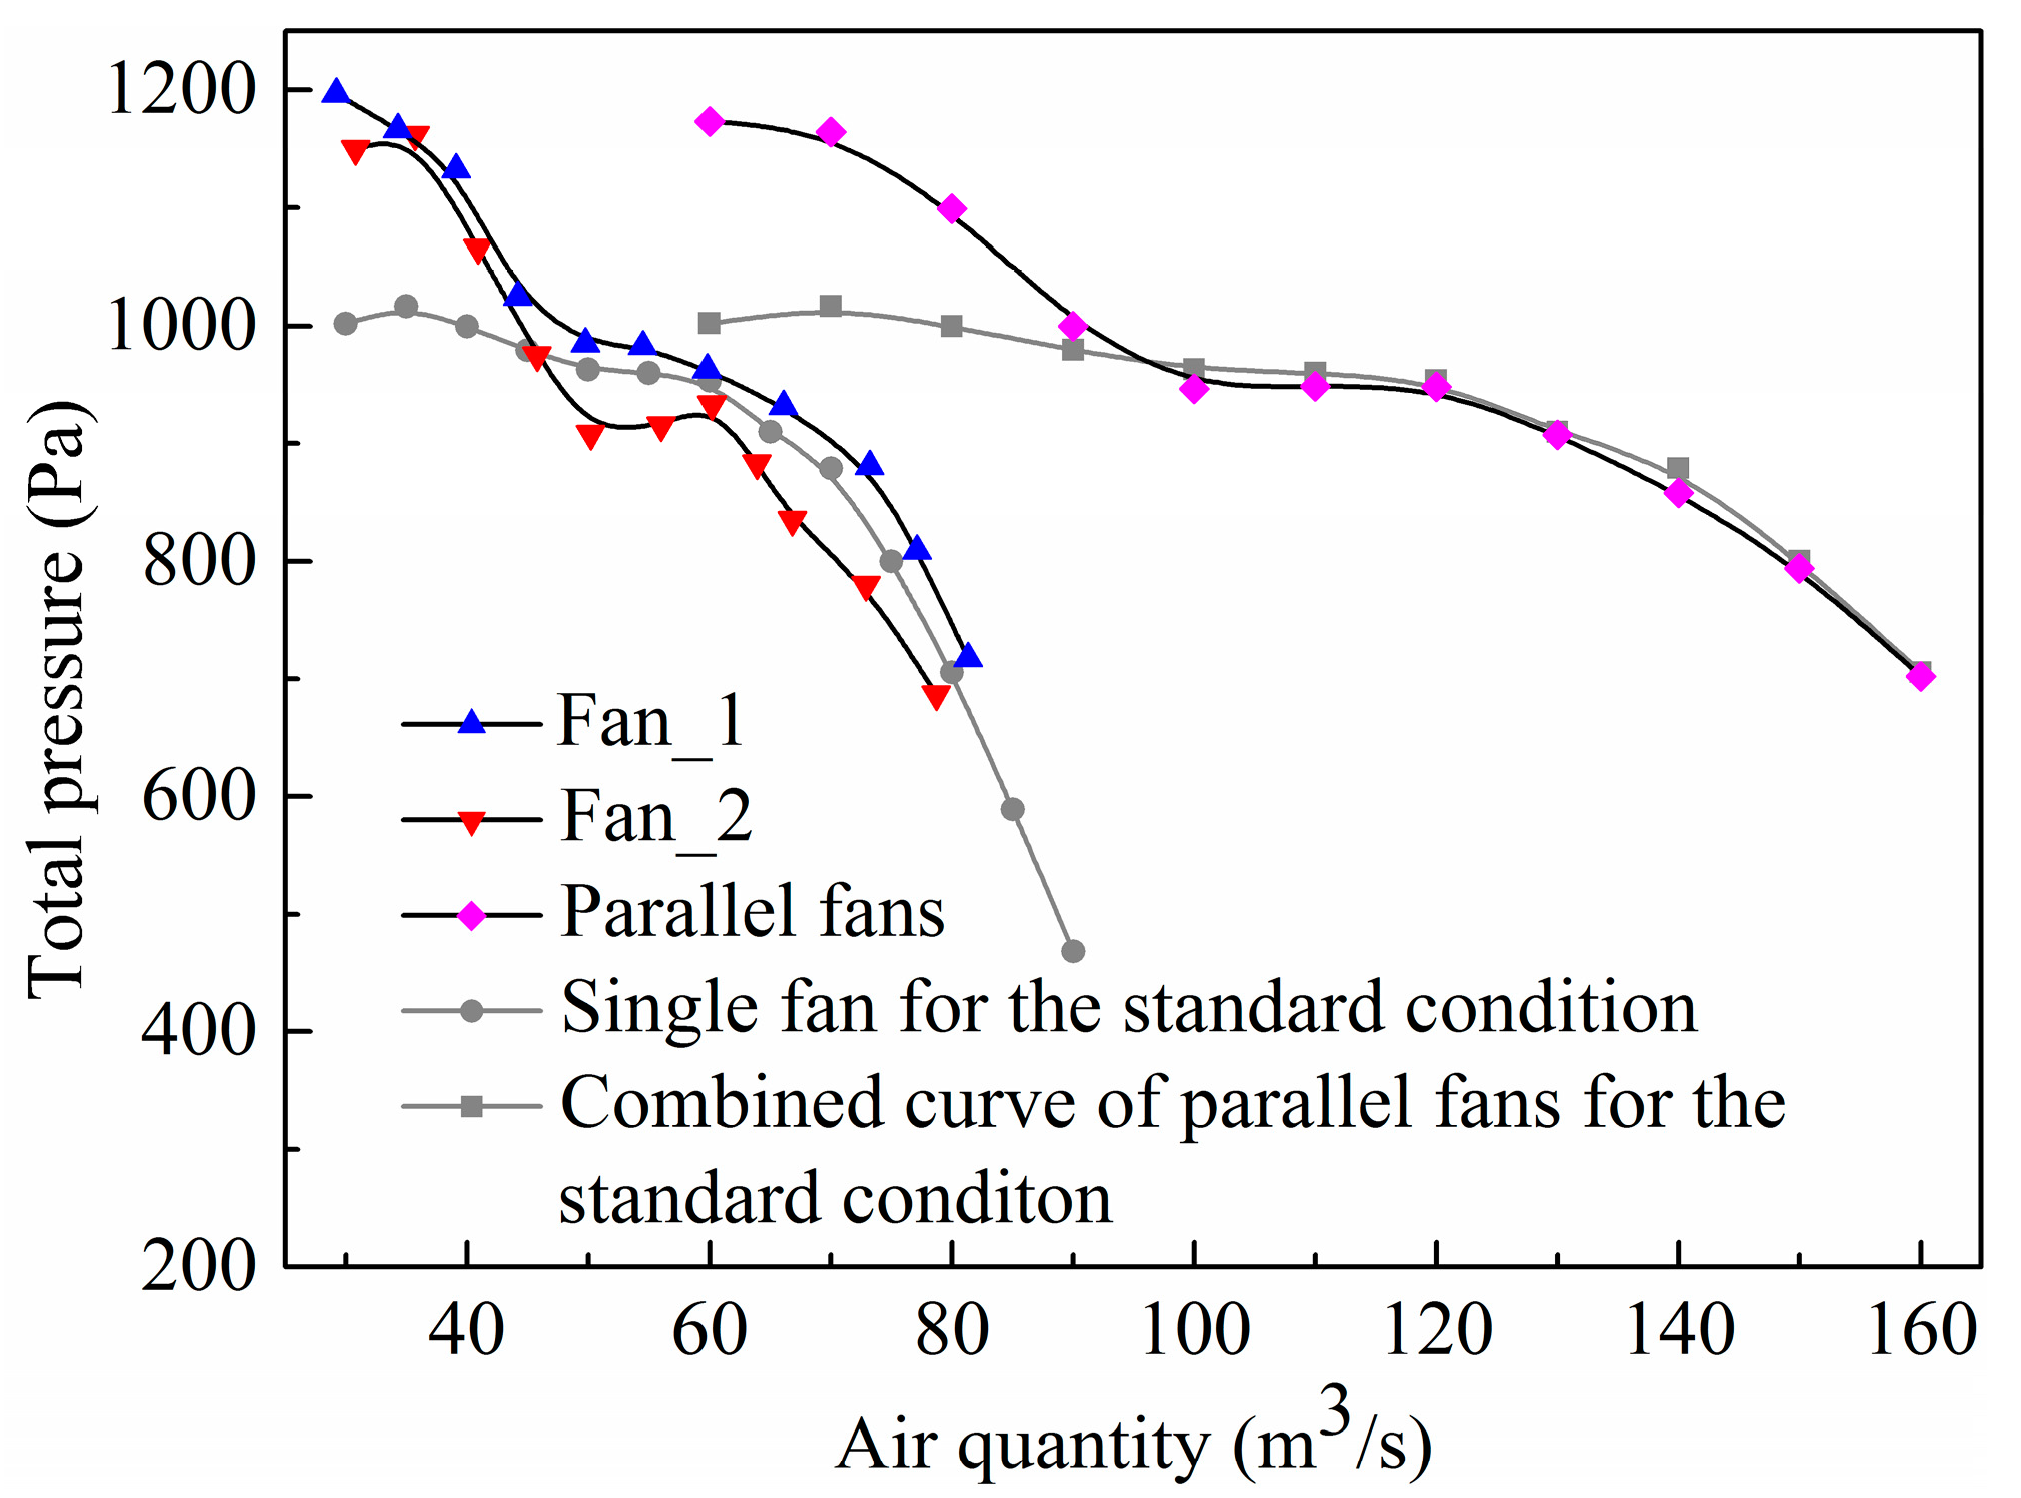
Figure 7.
Airflow streamlines in the intake airway.
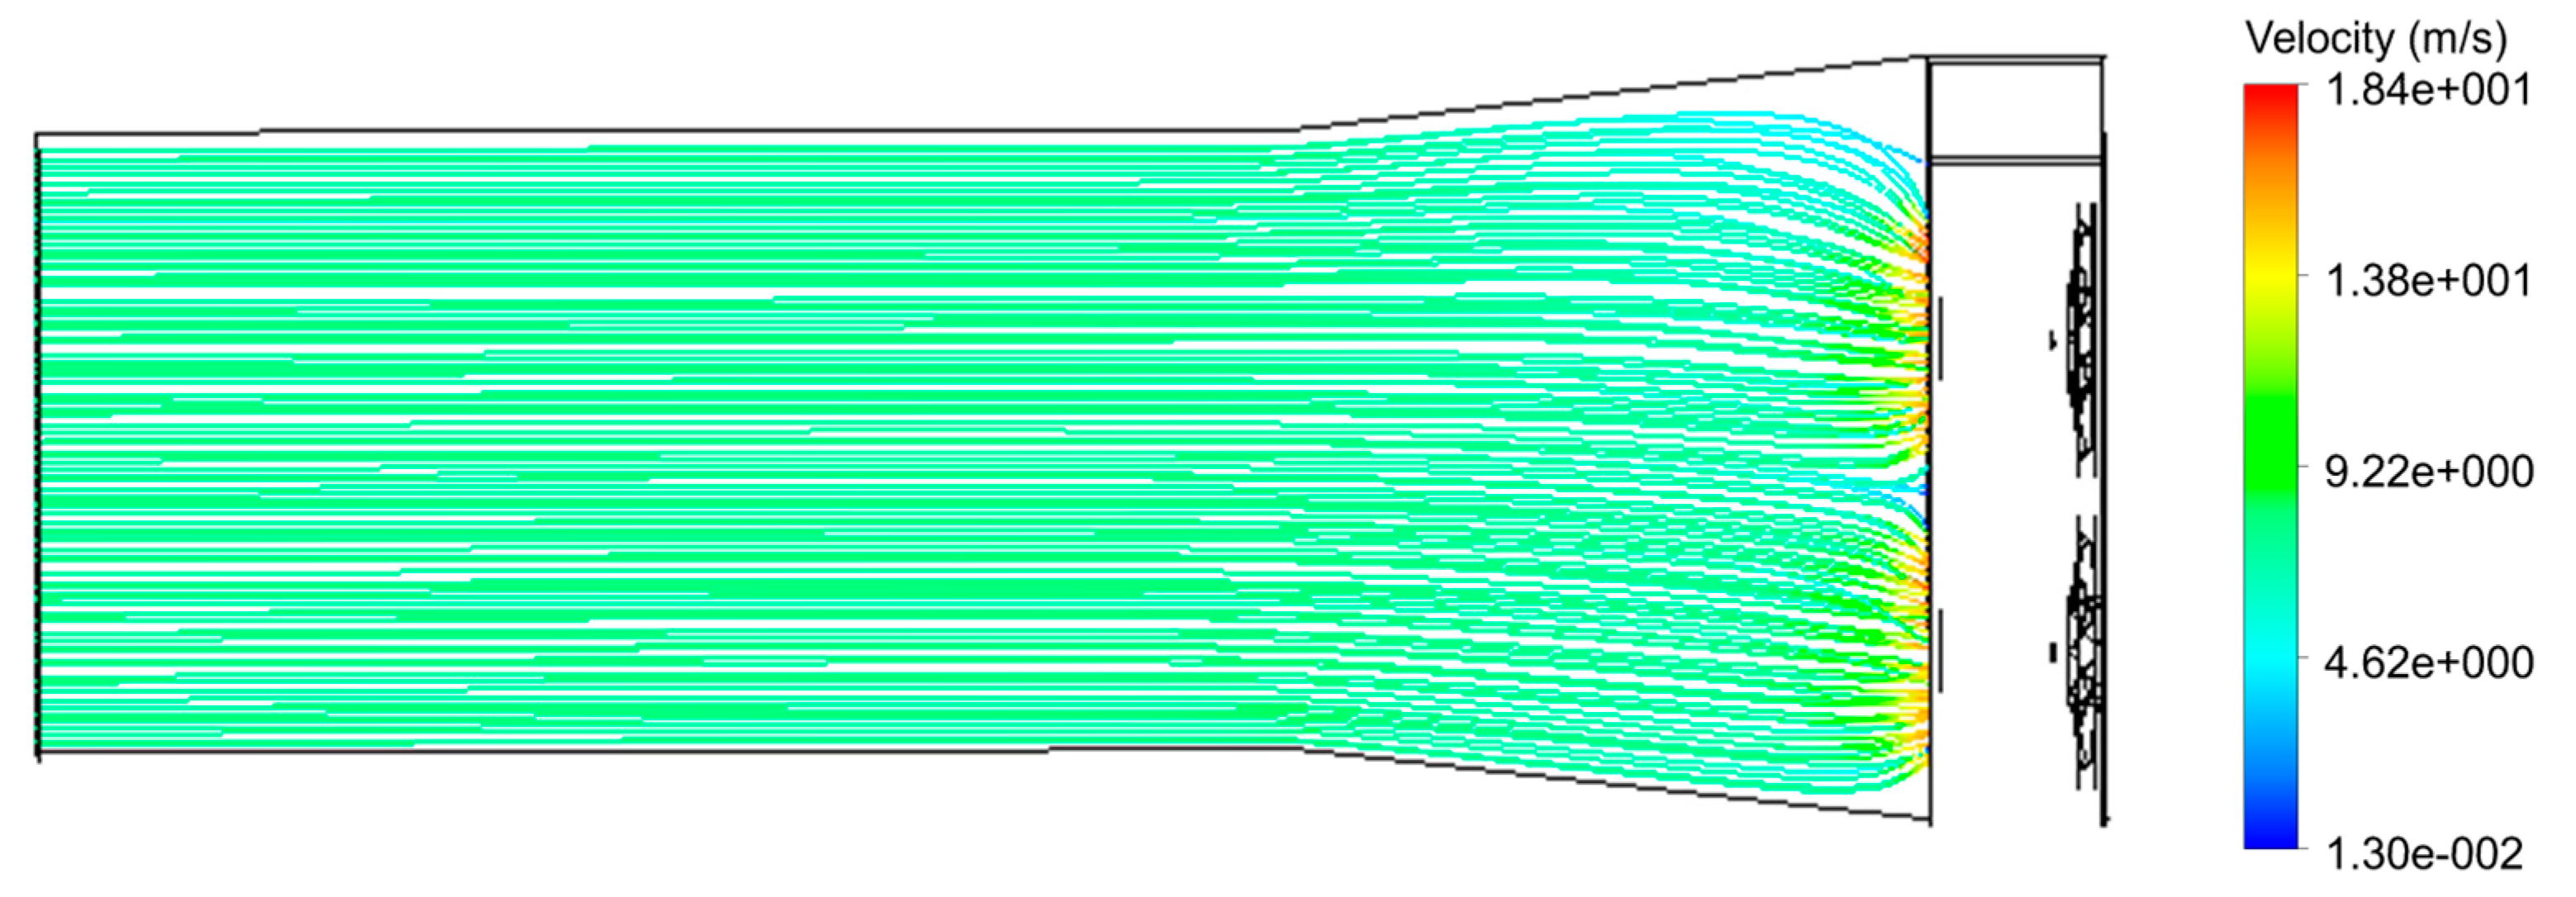
Figure 8.
The inlet shock losses and polynomial fitting curves.

Figure 9.
Velocity contours at the position of fans entries. (a) Q = 60 m3/s; (b) Q = 80 m3/s.

Figure 10.
Velocity streamlines’ pressure parameters monitored in the return airway.
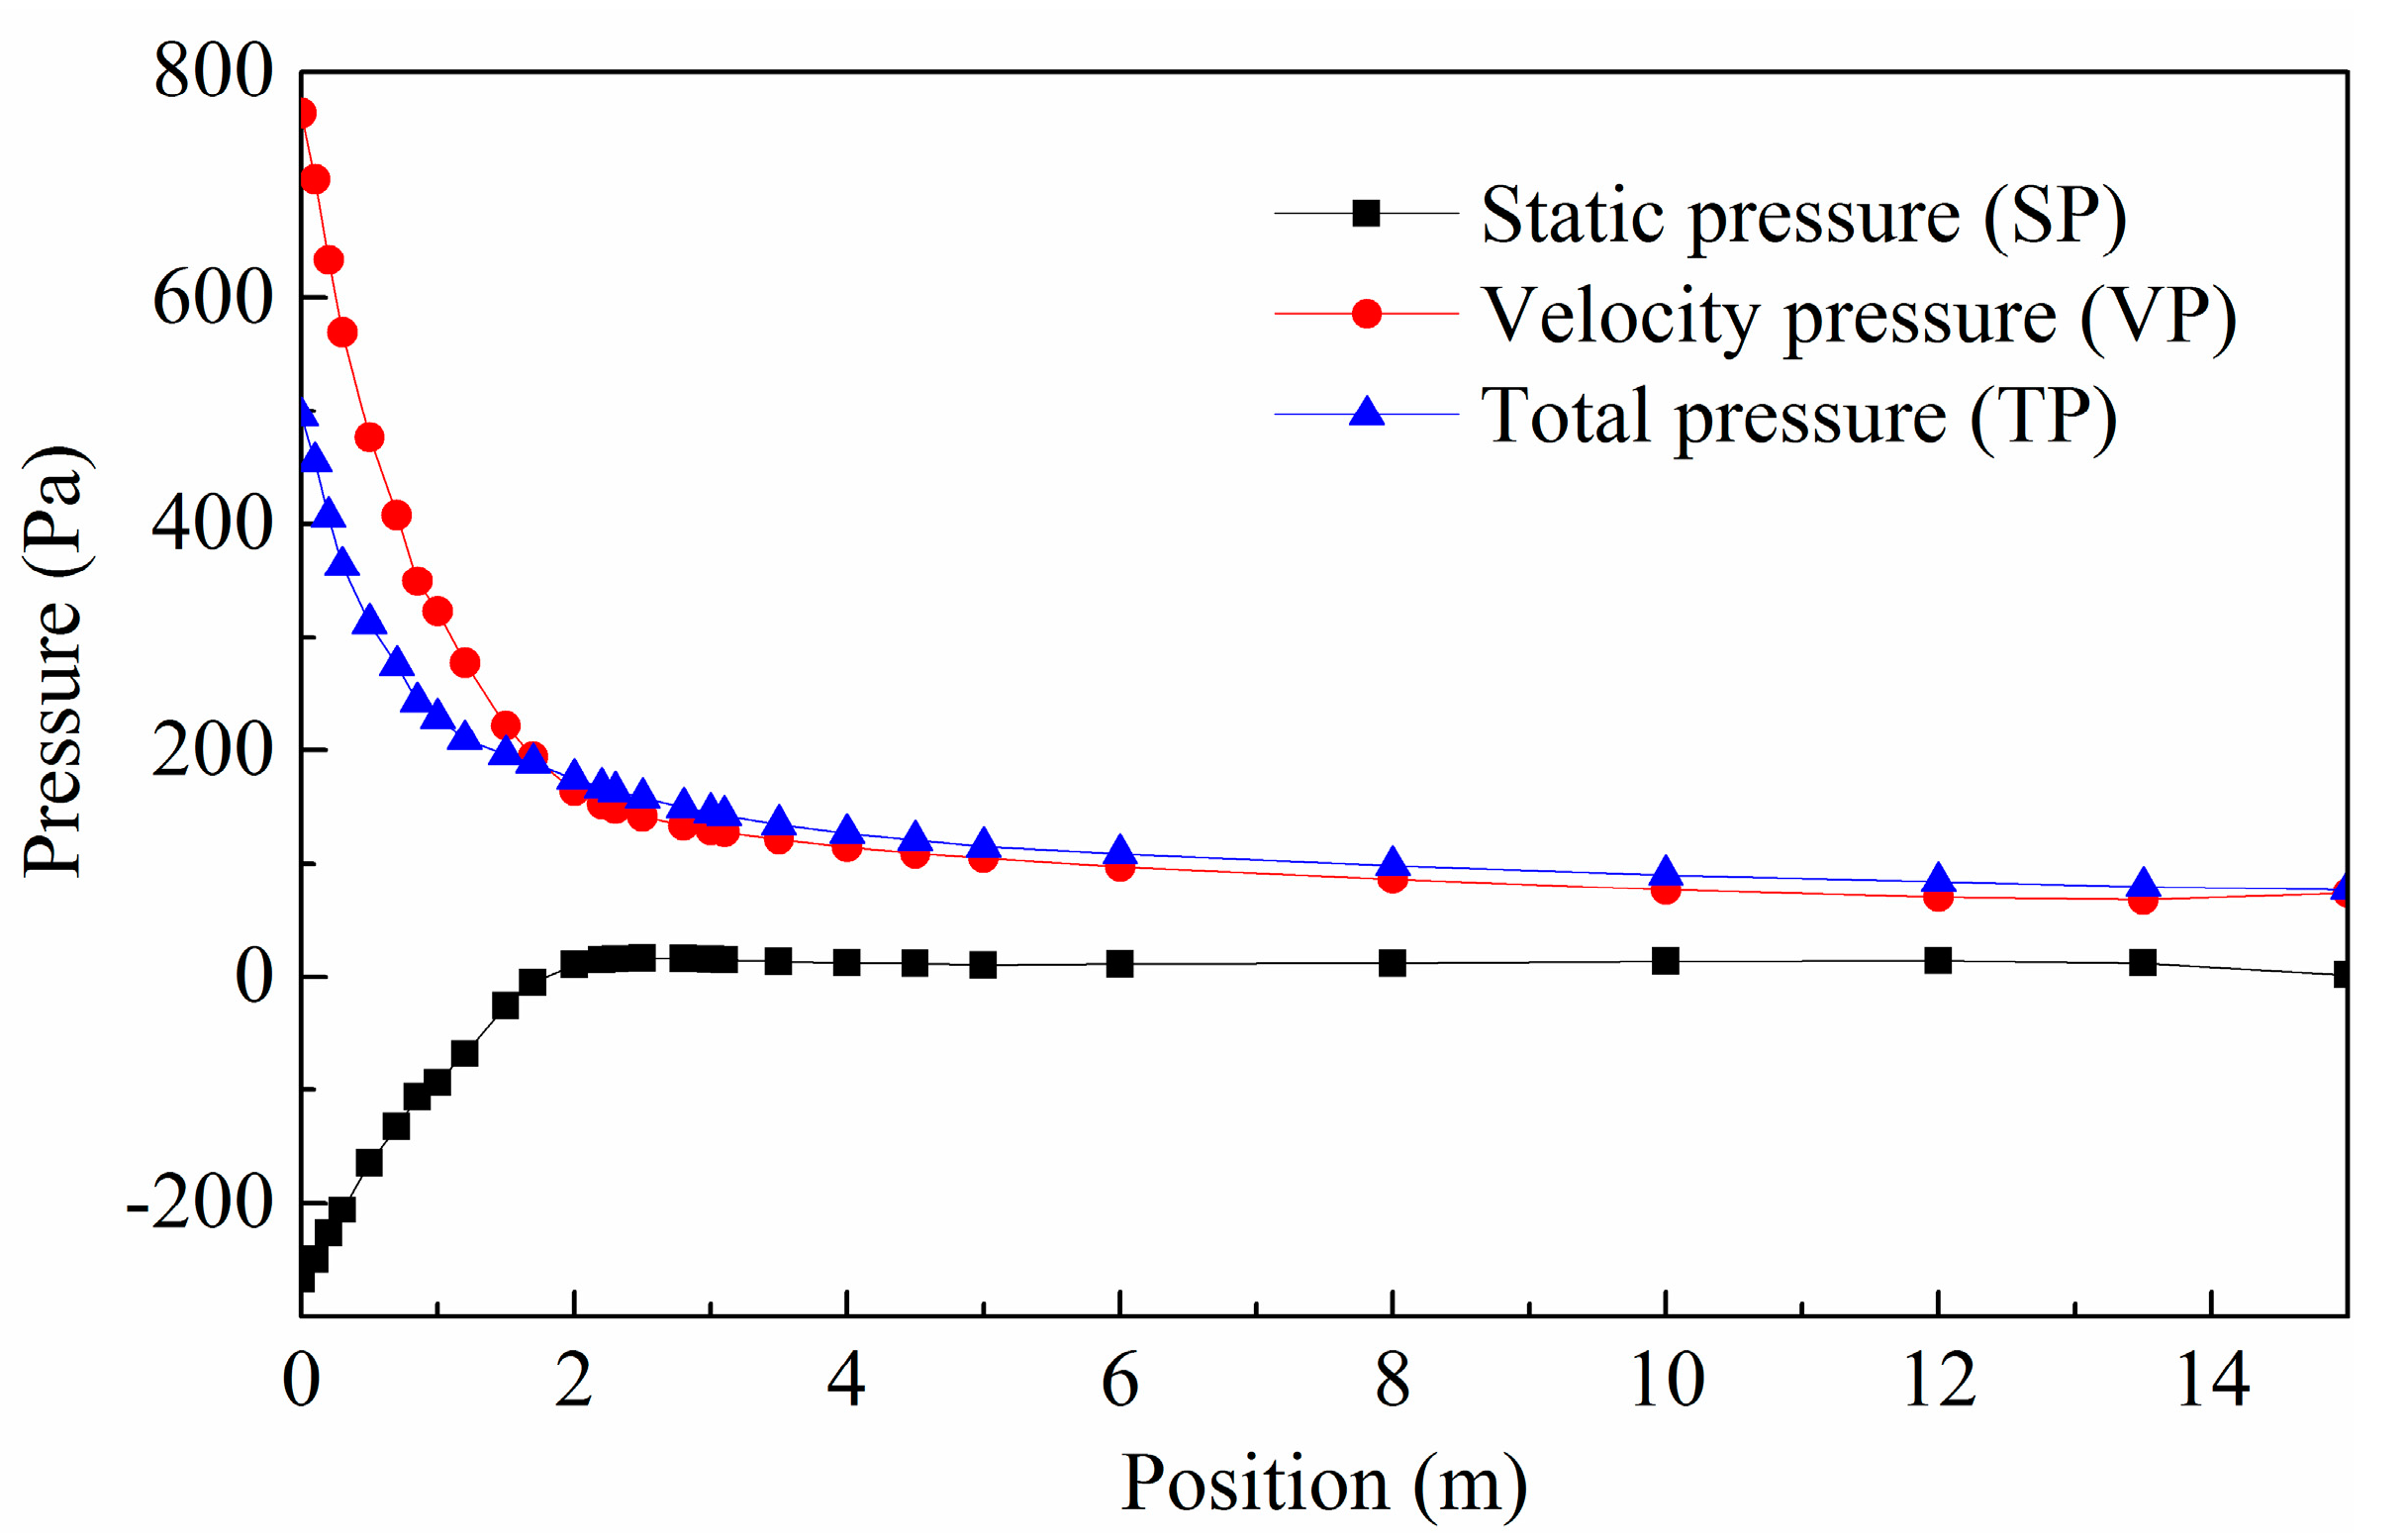
Figure 11.
Airflow streamlines in the return airway.

Figure 12.
Velocity magnitude and velocity angle in the intake and return airways. (a) Velocity magnitude in the intake and return airways; (b) Velocity angle in the intake and return airways.
Figure 12.
Velocity magnitude and velocity angle in the intake and return airways. (a) Velocity magnitude in the intake and return airways; (b) Velocity angle in the intake and return airways.
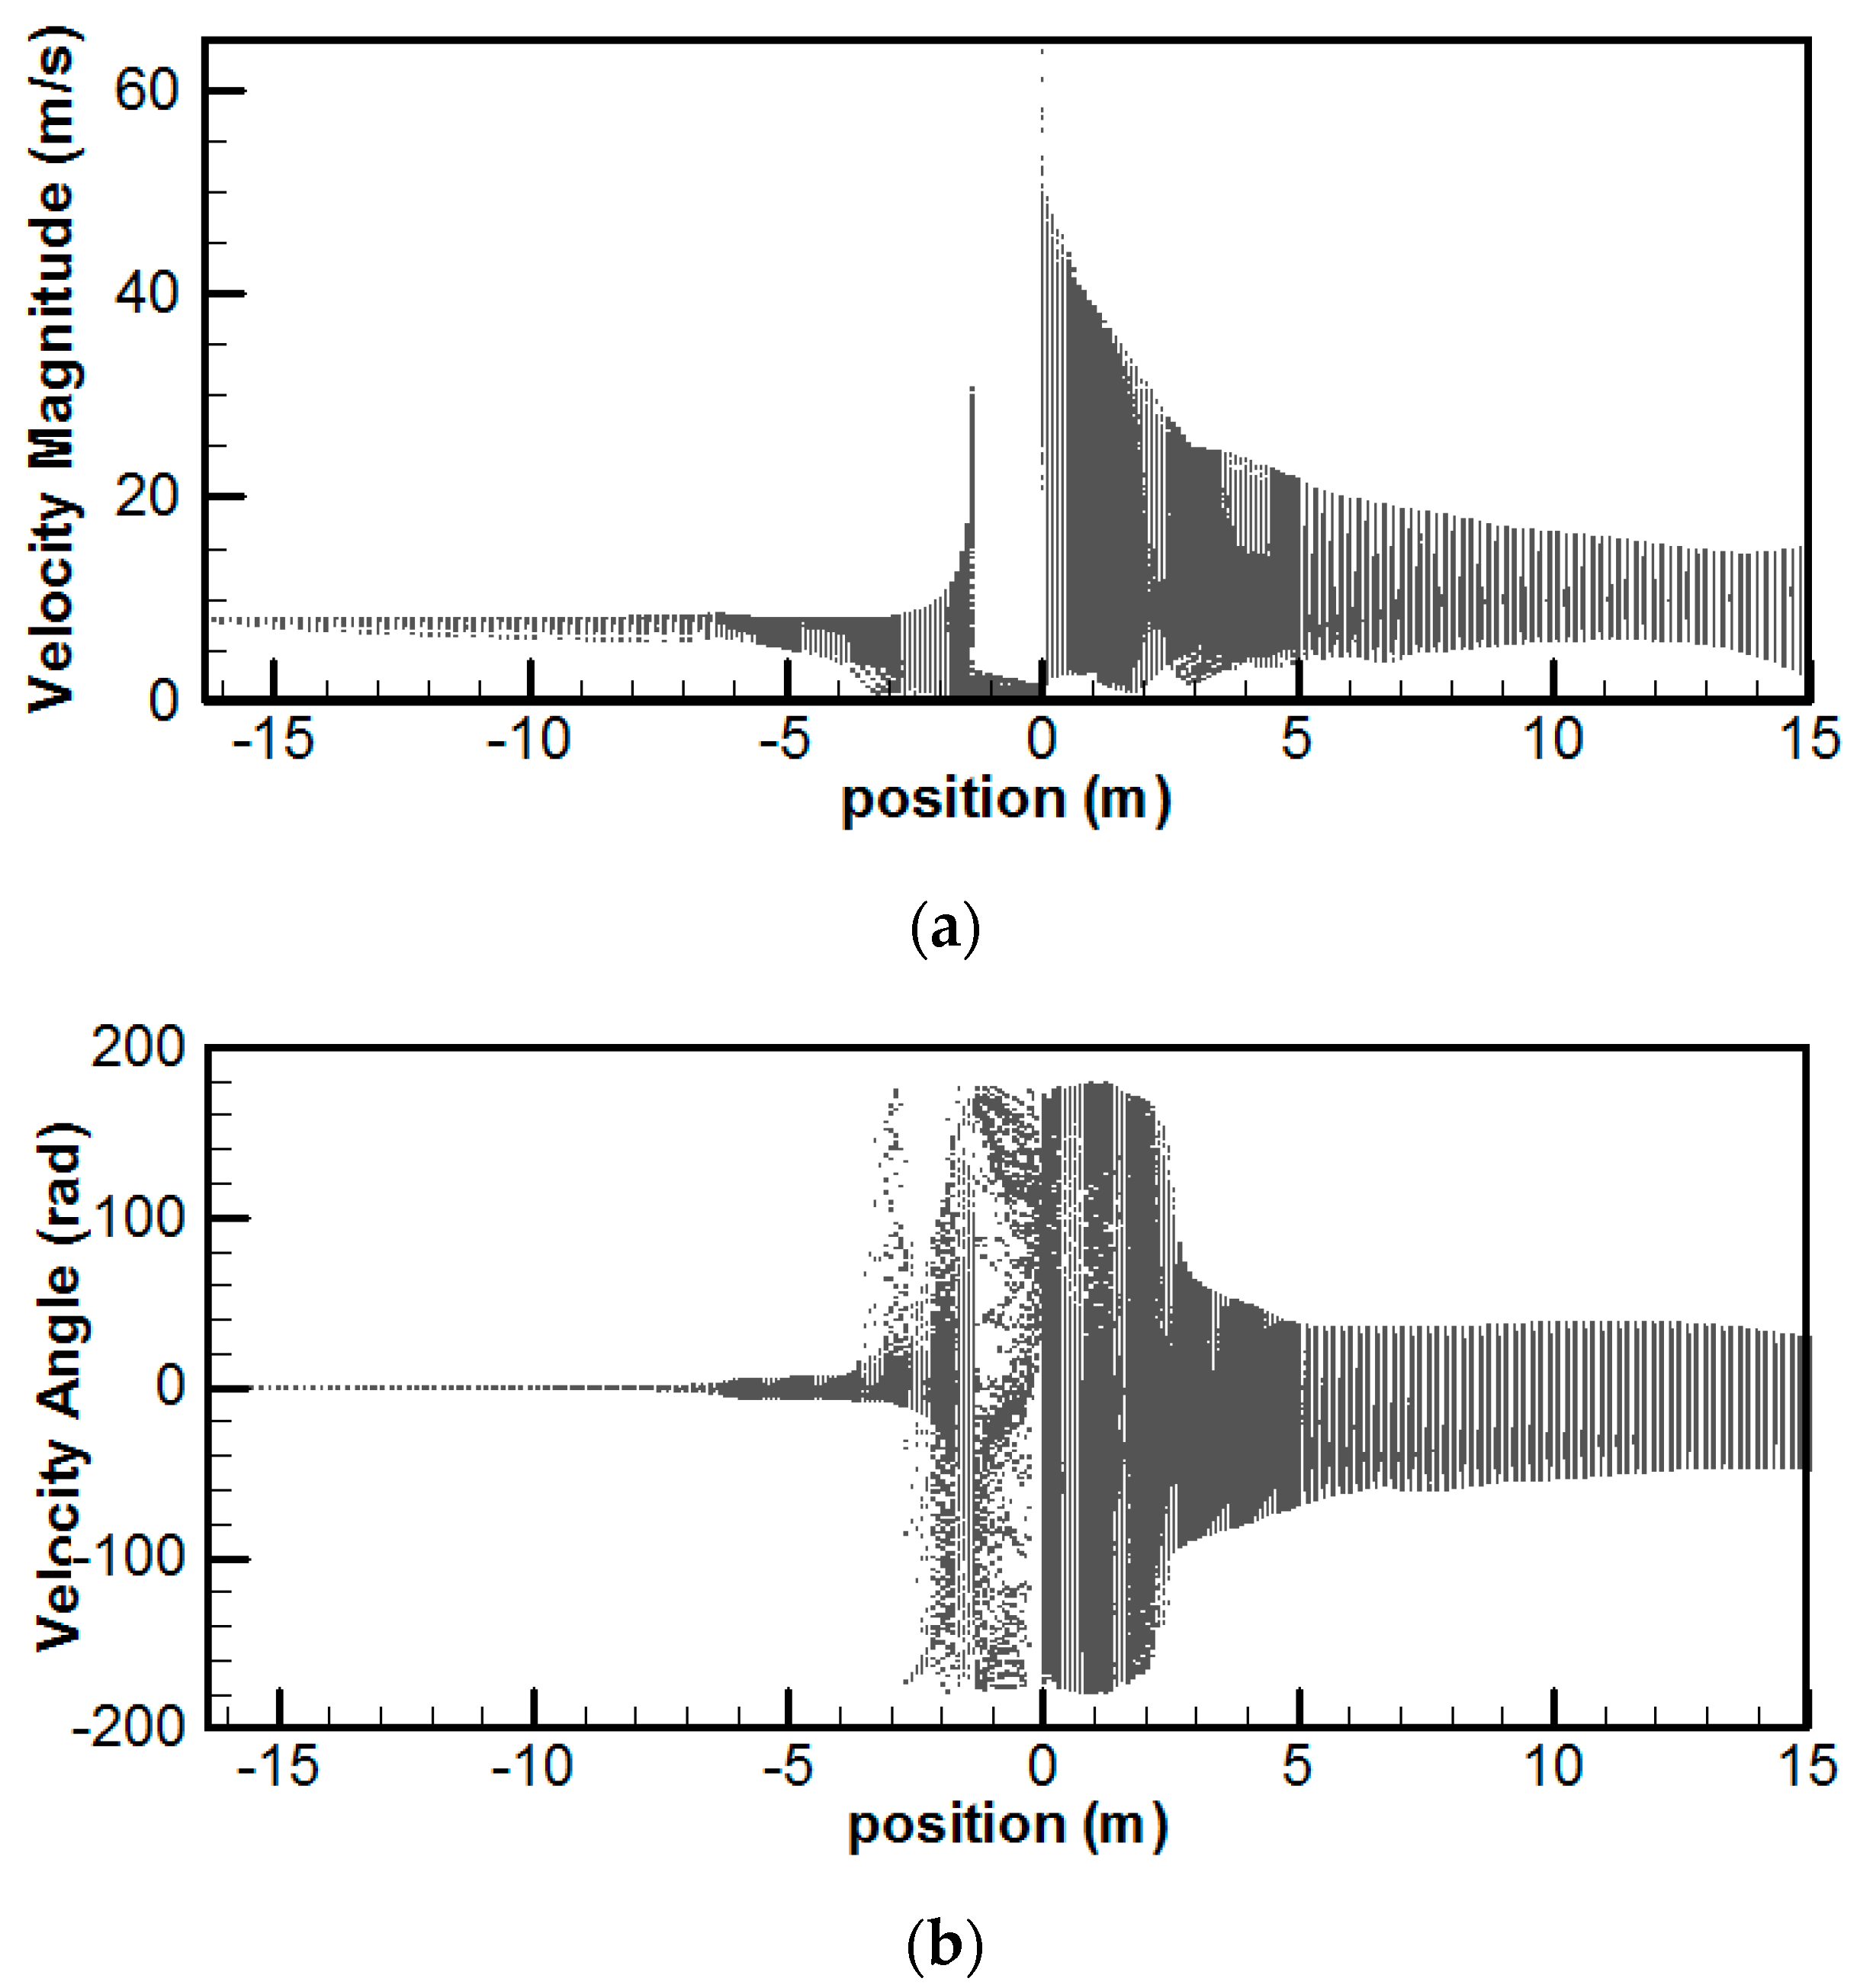
Figure 13.
Contours of turbulence parameters. (a) contour of ; (b) contour of .

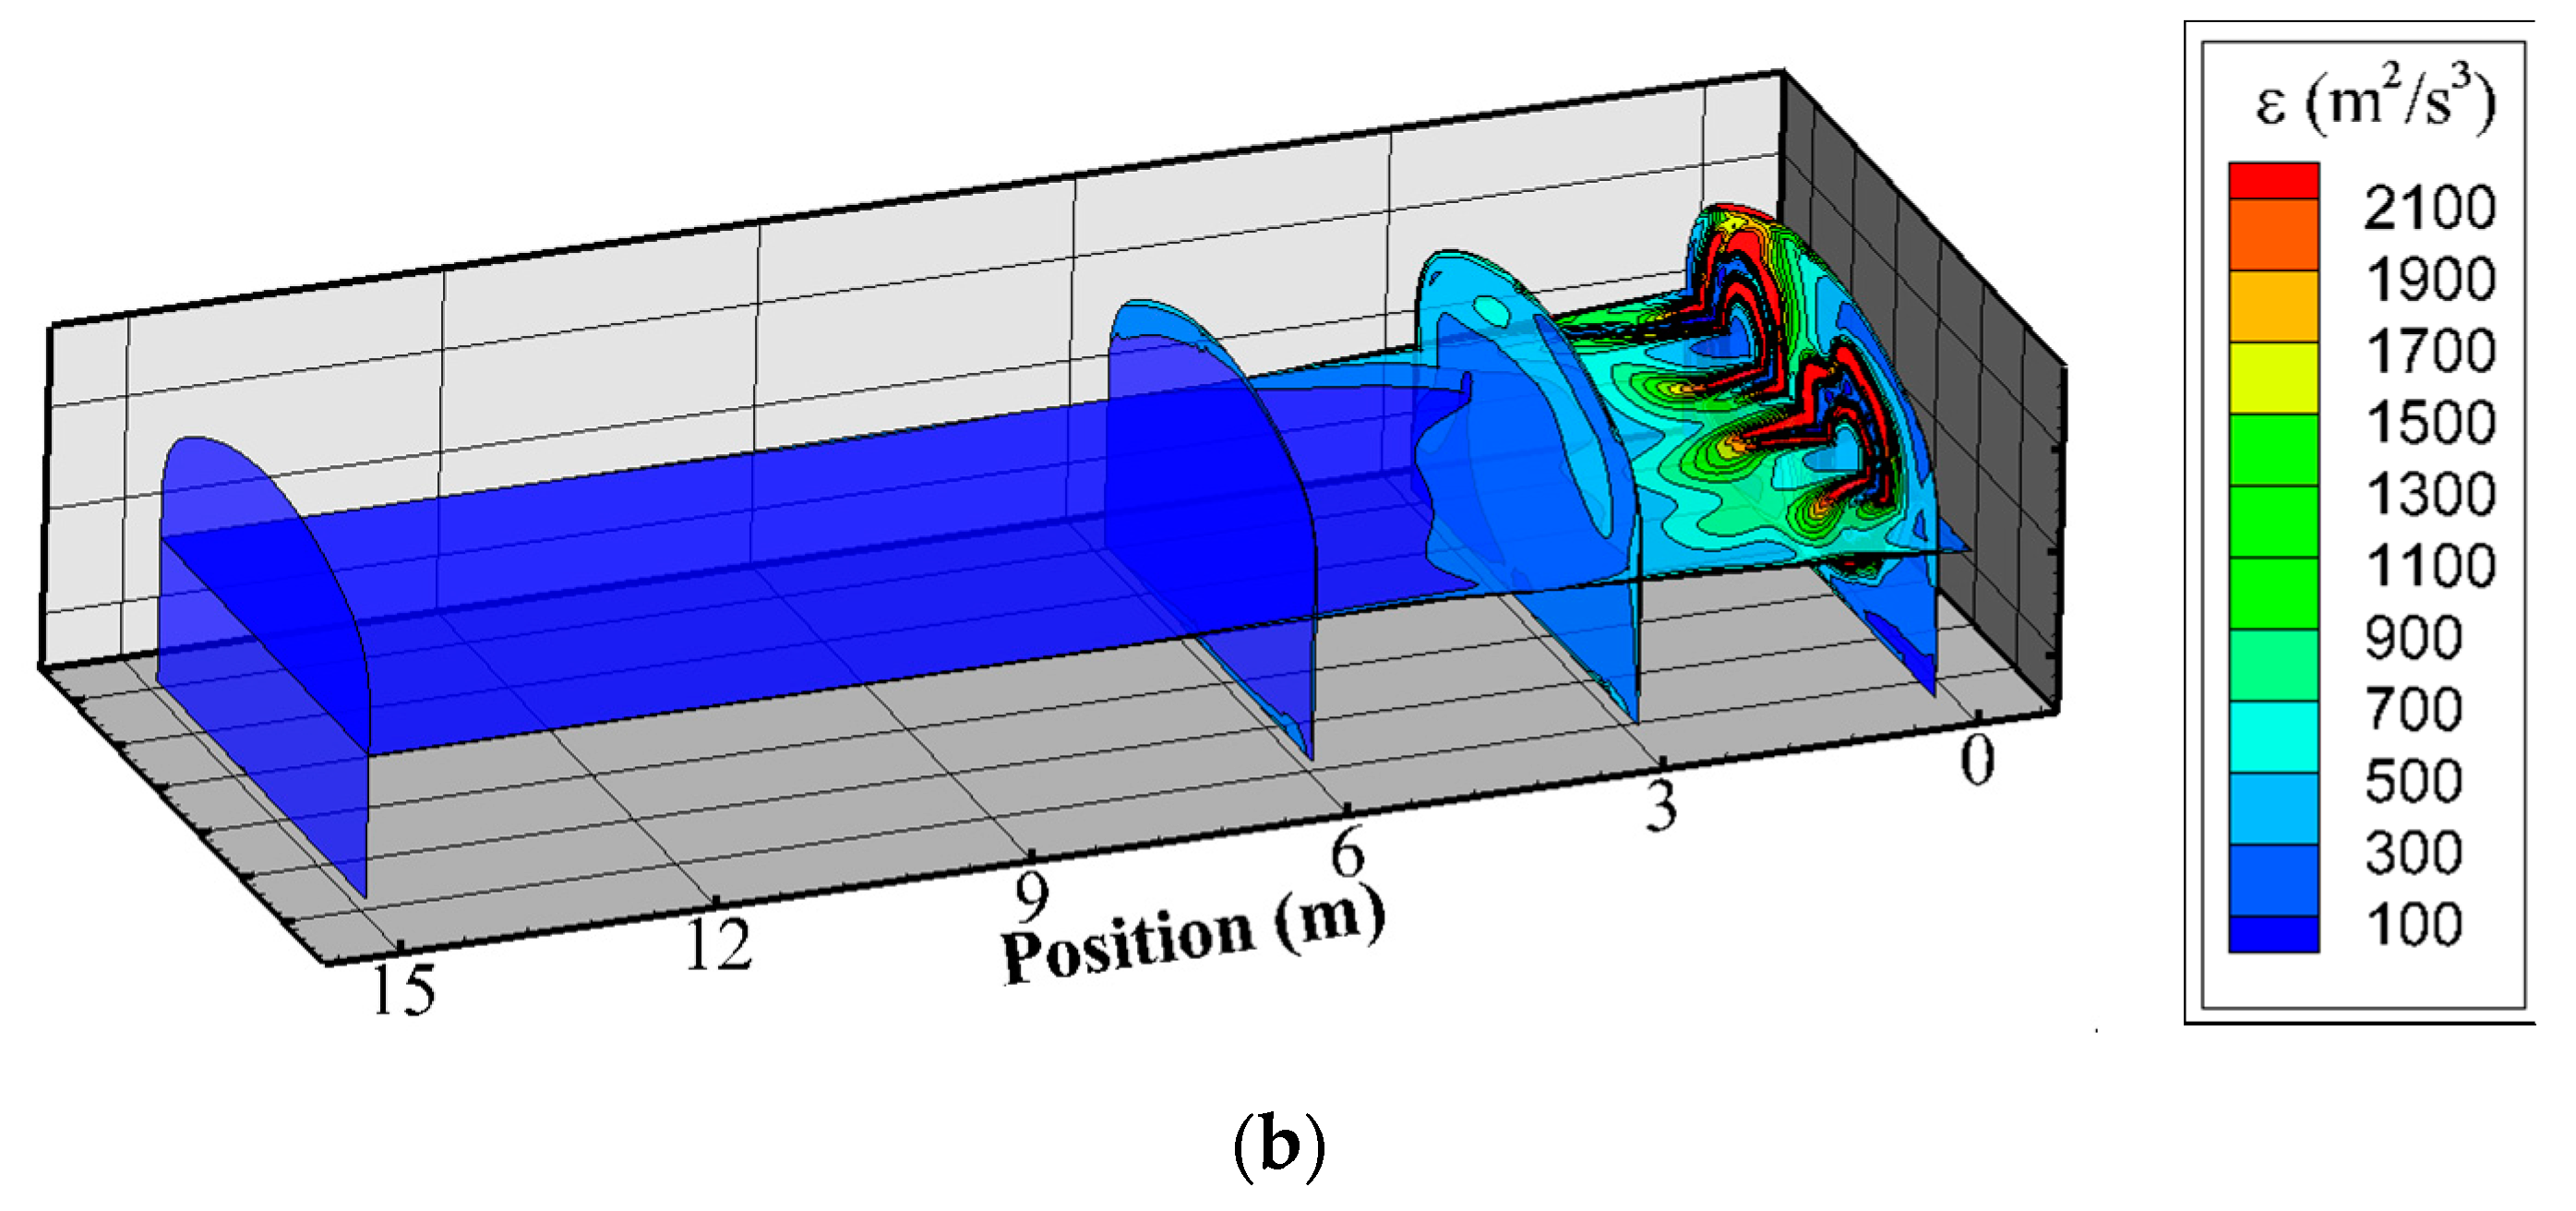
Figure 14.
Velocity contour at the position of fans’ exits.
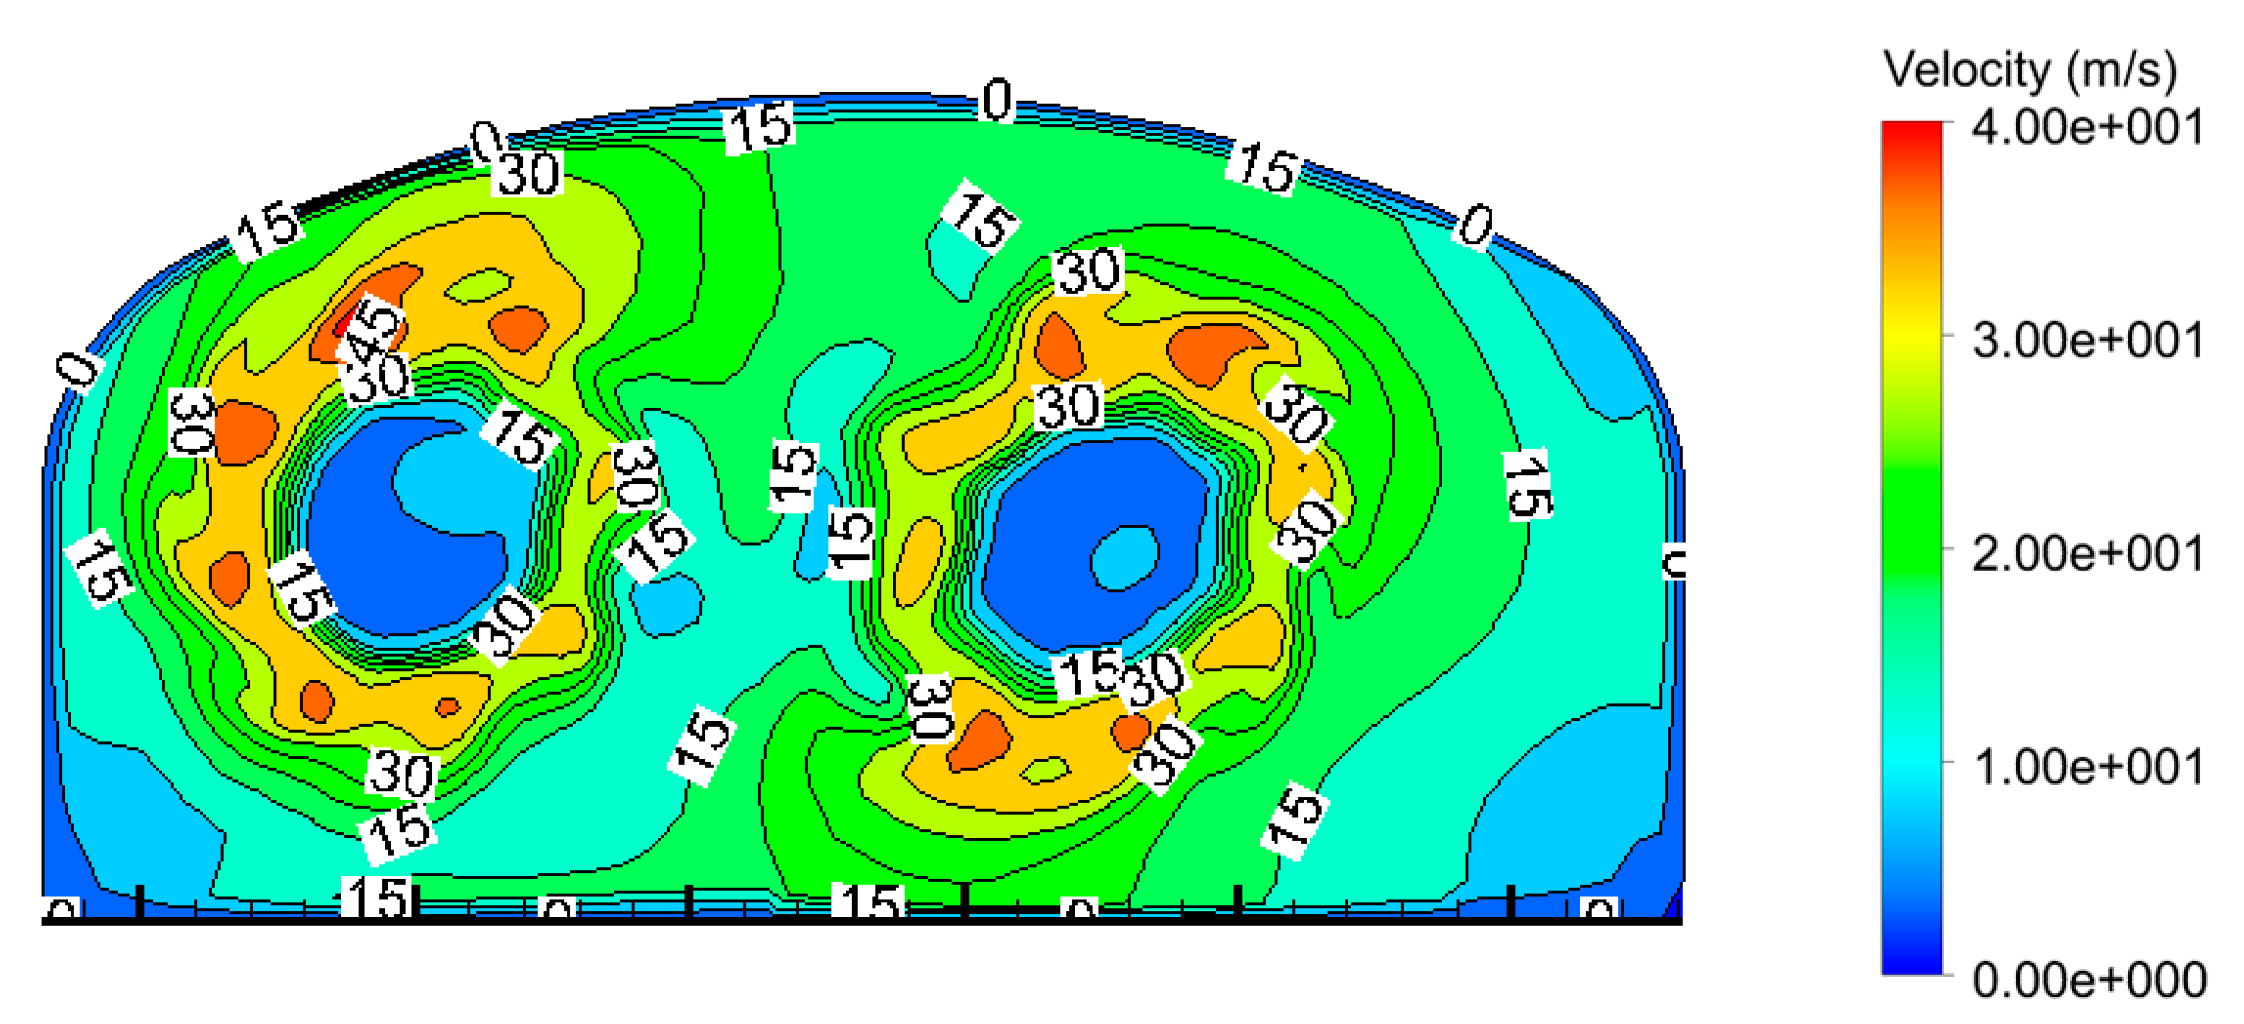
Figure 15.
Pressure under different fan blade installation angle conditions.

Figure 16.
The airflow velocity triangle.

Figure 17.
The isolation wall added in the return airway.
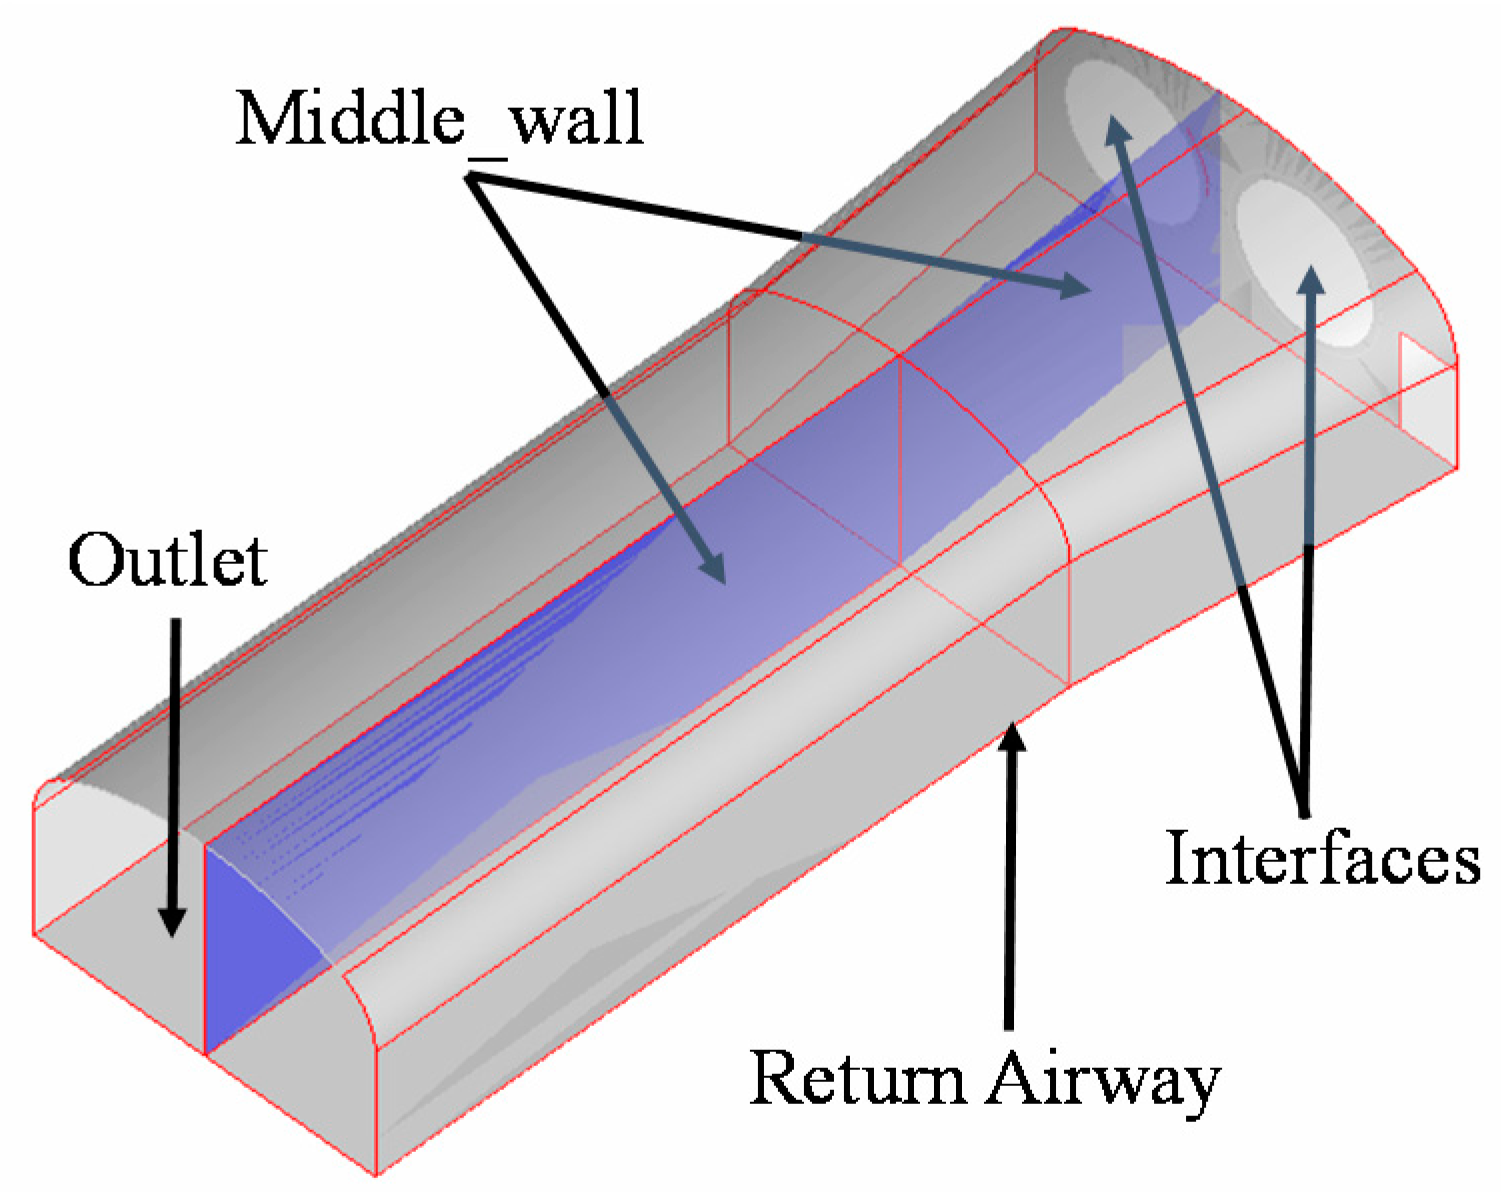
Figure 18.
Comparison of pressure between mid_wall and without mid_wall in PFS.

Table 1.
Investigation and measurement of PFS in Gaofeng underground mine ventilation.
| Station Site | Fan Name | Fan Model | Rated Power (kW) | Measured Air Quantity (m3/s) | TP (Pa) | Measured Input Power (kW) | Measured Efficiency (%) | Measured Pressure Loss Rate (%) | |
|---|---|---|---|---|---|---|---|---|---|
| Rated | Measured | ||||||||
| 450 m station | 450A | K40(C)-22 | 110 | 80.67 | 900 | 610 | 79.4 | 34.8 | 32.22 |
| 450B | 671 | 77.5 | 39.2 | 25.44 | |||||
| 250 m station | 250A | K40(B)-19 | 110 | 103.5 | 929 | 520 | 72.4 | 41.8 | 44.02 |
| 250B | 525 | 83.3 | 36.3 | 43.48 | |||||
| 50 m station | 50A | K40(B)-19 | 110 | 110.56 | 963 | 619 | 107.8 | 35.7 | 35.7 |
| 50B | 620 | 101.0 | 38.1 | 35.6 | |||||
Note: The probes before the fans’ entries of 450 m station, 250 m station and 50 m station are 2.0 m, respectively; the probes after the fans’ exits of 450 m station, 250 m station and 50 m station are 3.0 m, 5.0 m (roof caving instability near the fan) and 1.5 m, respectively.
Table 2.
Statistical data of air pressure in PFS.
| Air Quantity (m3/s) | Total Fan Pressure (Pa) | Fan Station Pressure (Pa) | Shock Losses (Pa) | Outlet Pressure Loss Rate (%) | |||||||
|---|---|---|---|---|---|---|---|---|---|---|---|
| Inlet | Outlet | Difference | Inlet | Outlet | Difference | Inlet | Outlet | ||||
| 60.00 | −703.22 | 470.11 | 1173.33 | 746.80 | 52.90 | 799.70 | −43.58 | 417.21 | 35.56 | ||
| 70.00 | −702.35 | 461.99 | 1164.34 | 706.58 | 65.96 | 772.54 | −4.23 | 396.03 | 34.01 | ||
| 80.00 | −631.05 | 468.18 | 1099.23 | 613.54 | 74.99 | 688.53 | 17.51 | 393.19 | 35.77 | ||
| 90.00 | −528.73 | 471.11 | 999.84 | 506.41 | 86.08 | 592.49 | 22.32 | 385.03 | 38.51 | ||
| 100.00 | −467.27 | 479.49 | 946.76 | 440.76 | 65.56 | 506.32 | 26.51 | 413.93 | 43.72 | ||
| 110.56 | −453.39 | 495.53 | 948.92 | 422.55 | 76.93 | 499.48 | 30.84 | 418.60 | 44.11 | ||
| 120.00 | −427.92 | 520.26 | 948.18 | 393.61 | 84.57 | 478.18 | 34.31 | 435.69 | 45.95 | ||
| 130.00 | −396.51 | 511.05 | 907.55 | 357.36 | 87.88 | 445.24 | 39.15 | 423.17 | 46.63 | ||
| 140.00 | −348.96 | 509.00 | 857.96 | 306.08 | 84.44 | 390.52 | 42.88 | 424.56 | 49.48 | ||
| 150.00 | −278.64 | 515.64 | 794.28 | 231.22 | 97.35 | 328.57 | 47.42 | 418.29 | 52.66 | ||
| 160.00 | −158.45 | 543.66 | 702.10 | 106.44 | 124.61 | 231.05 | 52.01 | 419.05 | 59.68 | ||
© 2017 by the authors. Licensee MDPI, Basel, Switzerland. This article is an open access article distributed under the terms and conditions of the Creative Commons Attribution (CC BY) license (http://creativecommons.org/licenses/by/4.0/).
Share and Cite
MDPI and ACS Style
Gou, Y.; Shi, X.; Zhou, J.; Qiu, X.; Chen, X. Characterization and Effects of the Shock Losses in a Parallel Fan Station in the Underground Mine. Energies 2017, 10, 785. https://doi.org/10.3390/en10060785
AMA Style
Gou Y, Shi X, Zhou J, Qiu X, Chen X. Characterization and Effects of the Shock Losses in a Parallel Fan Station in the Underground Mine. Energies. 2017; 10(6):785. https://doi.org/10.3390/en10060785
Chicago/Turabian StyleGou, Yonggang, Xiuzhi Shi, Jian Zhou, Xianyang Qiu, and Xin Chen. 2017. "Characterization and Effects of the Shock Losses in a Parallel Fan Station in the Underground Mine" Energies 10, no. 6: 785. https://doi.org/10.3390/en10060785
Note that from the first issue of 2016, this journal uses article numbers instead of page numbers. See further details here.