Project Report

Electric Propulsion Concepts for an Inverted Joined Wing Airplane Demonstrator

1
Instytut Lotnictwa, 02-256 Warszawa, Poland
2
Instytut Techniczny Wojsk Lotniczych, 01-494 Warszawa, Poland
*
Author to whom correspondence should be addressed.
Energies 2017, 10(6), 762; https://doi.org/10.3390/en10060762
Submission received: 6 February 2017 / Revised: 19 May 2017 / Accepted: 22 May 2017 / Published: 31 May 2017

Abstract

:
One of the airplane design concepts that potentially allows for significantly increased efficiency, but has not yet been investigated thoroughly, is the inverted joined wing configuration, where the upper wing is positioned in front of the lower one. We performed wind tunnel and flight testing of a demonstrator of this concept, first by applying electrical propulsion to simplify wind tunnel testing, and then the same electrical-propulsion demonstrator performed several flights. As the chosen propulsion method proved to be too cumbersome for an intensive flight campaign and significant loss of battery performance was also observed, the electrical propulsion was then replaced by internal combustion propulsion in the second phase, involving longer-duration flight testing. Next we identified and analyzed two potentially beneficial modifications to the design tested: one involved shifting the center of gravity towards the aft, the other involved modifying the thrust vector position, both with the assumption that electric motors can be applied for propulsion. On this basis, the paper finishes with some conclusions concerning a new concept of electrical propulsion for an inverted joined wing design, combining two ideas: hybridization and distribution along the aft wing leading edge.

Graphical Abstract

1. Introduction

The joined wing configuration is an unconventional airplane configuration consisting of two lifting surfaces similar in terms of area and span. Usually, one of the wings is located at the top or above the fuselage, with the other at the bottom. Moreover, one of the lifting surfaces is attached in the front of the airplane’s centre of gravity (CG), with the other significantly behind it. Both lifting surfaces join each other either directly or through the application of wing tip plates, creating a box wing. Such a configuration represents a promising scheme for future airplane design due to several potential advantages resulting from the reduction of mass and induced drag.
The first significant theoretical work on the theory of induced drag estimation is attributed to Munk [1], who provided some valuable insights into the properties of three-dimensional lifting surfaces. Among these, the most important in the case of the joined wing configuration is the fact that from a theoretical point of view, the induced drag does not depend on the longitudinal positions of the lifting elements. The foundations for further work on closed wing systems were laid by Prandtl [2]. He focused on several non-planar lifting configurations, such as the biplane, triplane, and boxplane, comparing these in terms of minimum induced drag. While giving an approximate formula for minimum induced drag, he concluded that the box wing was superior, calling it “the best wing system”. In [3], the authors studied the box wing with significant stagger to ensure stability without a tail design to be applied to transonic transport airplanes. They uncovered some problems with flutter instabilities far below the predicted flutter speed. They managed to partially deal with aero elasticity issues, but the final conclusions were that the joined wing configuration might be advantageous at lower Mach numbers only and no significant weight reduction compared to conventional airplane could be achieved. The concept was further developed by Wolkovitch [4], who proposed a joined wing configuration with direct connection between the front and aft wings. Many other researchers have also explored this concept. The authors of [5,6] explored the advantages of the joined wing in terms of aerodynamic efficiency and performance and gave examples of possible applications for this innovative configuration. Valuable theoretical research on induced drag has recently been reported in [7,8]. In the first of these studies, the authors demonstrate the applicability of Munk’s theorem [1] to closed wing systems and show that optimal circulation distribution on the wings can be modified by constant circulation with no adverse influence on the induced drag. This property is essentially important in terms of longitudinal stability adjustment. The latter study, in turn, also draws upon Prandtl’s work [2] and shows that for a box wing, the minimum induced drag for an infinite vertical aspect ratio equals zero. This is admittedly inconsistent with Prandtl’s original formula, which would predict it to be 16% of reference wing drag, but Prandtl did not seek to evaluate such theoretical cases.
In recent years, significant work in the topic of joined wings has been done by researchers from Pisa, working on the light amphibious project called IDINTOS. In [9], the authors involved in the project showed that propulsion generates a pitching up moment due to modified airflow above the front wing and below the aft wing, whereas the directional and lateral aerodynamic characteristics are slightly or even insignificantly affected. Surprisingly, ground proximity produces a decrease in the longitudinal moment (a pitching down effect), which is explained by the authors as caused by downwash effects. The aerodynamic characteristics of the airplane retrieved from wind tunnel tests and compared with the computer fluid dynamics (CFD) results are presented in [10], showing the smooth stall characteristics of the airplane. However, the design proved to have poor directional stability, although this adverse feature was eventually improved by the application of fences on the rear wing, close to the vertical stabilizer. Reference [11] gives an overview of the project results and describes the design of a full-scale airplane.
Other interesting work can be found in [12,13]: these are examples of industrial projects finished with flight testing, conducted in the US and Germany.

2. Inverted Joined Wing Concept

Researchers in Poland became interested in joined wing configurations in the early 1980s. Some results were presented in [14,15], where the author focused on the concept of a firefighting airplane, arguing that it had the potential to provide a 10% better climb rate, 50% higher payload, and 10% wider range between minimum and maximum airspeed. Some flights were also performed with a scaled model of an ultralight airplane in the joined wing configuration that revealed good longitudinal static and dynamic stability, but was very sensitive to center of gravity position change. Some other publications [16,17] concluded that the front wing of the joined wing airplane should be designed in a high wing configuration and the aft wing in a low wing configuration, which is opposite to the most frequently considered case. This is because, as one of conclusions in [7,8] states, the gliding ratio of the joined wing airplane increases together with the vertical aspect ratio. Figure 1 shows that in the case of a conventional joined wing airplane, the vertical distance between the wings decreases with the angle of attack, whereas the same dimension increases with the angle of attack in the case of such an inverted joined wing airplane. In general, the induced drag increases quadratically with the lift coefficient, so it is insignificant when CL is small. At low CL the other drag components are larger than the induced drag, so induced drag reduction attained at the expense of increased friction and/or interference drag does not pay off. However, at large angles of attack, when the lift coefficient is large, on the other hand, the induced drag becomes dominant and so any induced drag reduction that can be attained is valuable. That is exactly the case for the inverted joined wing configuration.
Moreover, the authors of this paper have concluded that the inverted joined wing shows superiority over the conventional one because of the adverse interference effects at high angles of attack. When the conventional joined wing configuration flies at very high angles of attack, the aft wing is nearly at the same level as the forward wing and thus, it is possible that flow separation on the latter can affect airflow on the former. As a consequence, this can upset the longitudinal trim and is especially possible close to the stall point. Figure 11 in Reference [11] shows significant CL and CM nonlinearity at α = 14°, which in the author’s opinion could be the case.
Lastly, we propose that the application of an inverted joined wing configuration could also help in solving the problem of global buckling of the joined wing airplanes reported by several researchers [18,19,20]. The direction of critical load (lift + drag in point A of the load envelope) points upwards and forwards. The smallest moment of inertia of a conventional joined wing airplane goes in this direction, so in this case global buckling is a problem. The much larger moment of inertia of an inverted joined wing airplane goes in this direction, meaning that the problem should be avoided. In other words, in this configuration the aft wing is under tension and not under compression, and consequently it cannot be buckled at high angles of attack. Nevertheless, this hypothesis has not yet been confirmed.
In any event, the joined wing configuration is generally a difficult design to implement, due to the strong aerodynamic coupling [21] and static indeterminacy. We undertook a dedicated research programme to explore its properties [22,23,24], utilizing previous experiences in optimization [25,26,27,28,29,30] and unmanned aerial vehicle (UAV) flight testing [31,32,33,34]. Poland’s Institute of Aviation was chosen to lead this effort because of its specialization and previous experience in general aviation [35,36].
At the beginning of the project, an unmanned demonstrator (Figure 2) was designed and aerodynamically optimized. Then its flight characteristics were thoroughly investigated [37,38] with the application of data from both CFD analysis and wind tunnel measurements [39,40]. Simultaneously, further multicriterial aerodynamic optimization was performed to explore the limits of the configuration’s performance potential [41]. Finally, software for multidisciplinary optimization was developed and applied so as to take structural analysis into consideration as well [42,43]. The overall conclusion was that the applied airplane configuration does allow for the construction of an airplane with better performance, although, as the results presented in [44] show, its advantage against conventional airplanes is nevertheless marginal.

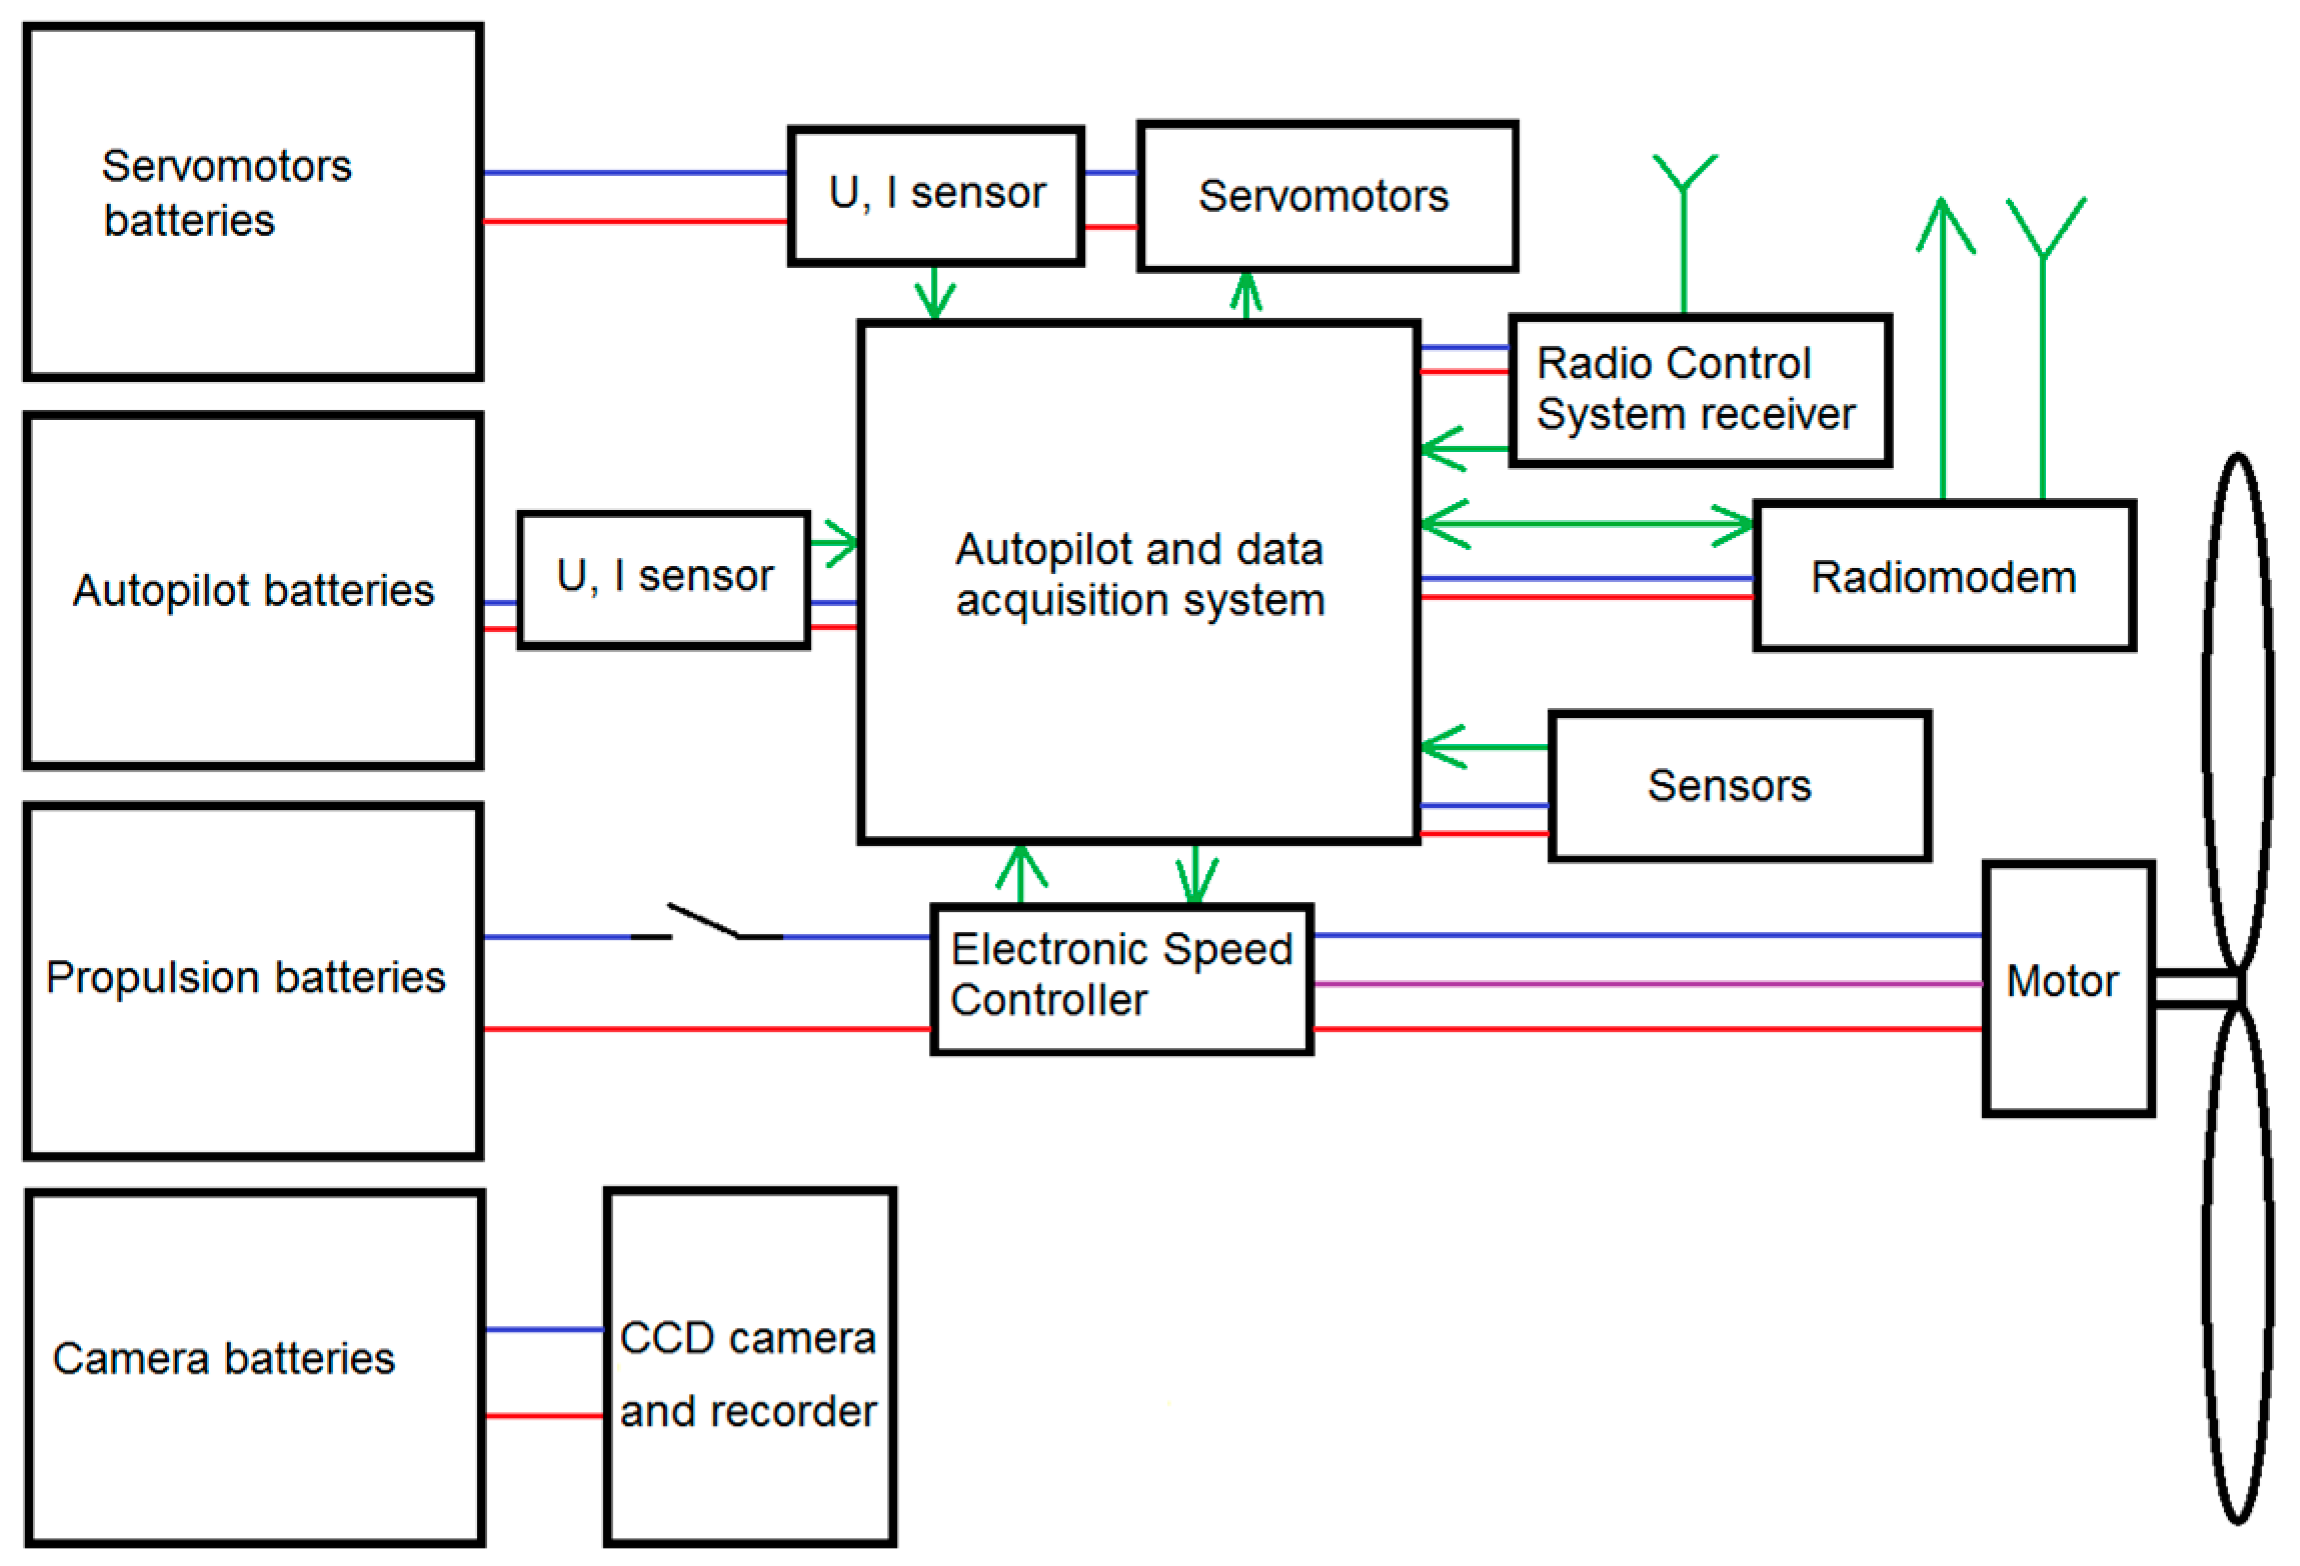
3. Electrical System Architecture in the Current Demonstrator

The demonstrator was designed as a scaled model of a personal airplane accommodating a pilot and three passengers, therefore the propulsion configuration was determined both by the issue of “visibility from the pilot’s seat” and by the application of the inverted joined wing configuration. Joined wing airplanes usually have their CG position located significantly behind 50% of the mean aerodynamic chord (MAC) of the front wing (Figure 2). The pilot should sit behind the front wing to obtain this CG position if a tractor propeller were to be applied, but as a result the front wing would constrain the pilot’s visibility quite significantly. In the case of conventional airplanes, this issue does not create any problem because their CG is located close to 1/4 of MAC, so the pilot sits below the wing and his forward visibility is not constrained by the wing. A pushing propeller configuration allows the pilot to sit in front of the front wing, since significant mass of the propulsion system is located in the aft part of the airplane. In view of the above, we applied a pushing propulsion in our demonstrator. However, the large diameter of the conventional propeller in the pushing configuration usually creates the threat of collision with the runway during takeoff rotation and during touchdown. Because ducted fans usually allow for the same efficiency as a conventional propeller but with a smaller diameter, we considered, designed, and tested a ducted fan design [45,46,47,48,49,50]. At that time, however, it became possible to buy a motor with high optimal revolutions per minute (RPMs) allowing for application of a market propeller with slightly better efficiency than the designed ducted fan and with only slightly greater diameter. At the same time it was significantly lighter. As a result, the ducted fan propulsion was tested only in the wind tunnel, whereas the propeller was tested both in the wind tunnel and in flight. However, the ducted fan was not ultimately abandoned for reasons specified in Section 4 below.
The demonstrator was built as a dual purpose research device, both for wind tunnel testing and for flight testing. This is a common approach taken in scaled airplane model methodology studies in Poland. It allows considerable time savings because only one research device has to be manufactured instead of two: one dedicated for wind tunnel testing, the other for flight testing. However, the application of a single research device creates a quite significant challenge resulting from the low mass requirement for flight testing combined with the higher strength requirements for wind tunnel testing. Fortunately, the application of modern composite materials reinforced with carbon fiber allowed both of these two contradictory requirements to be satisfied. As a result, the total mass of the demonstrator ready to fly was equal to 24.5 kg, which allowed flight tests to be performed without registration with the aviation authorities (in Poland, any UAV with a mass greater than 25 kg had to be registered at the time when this project was conducted).
An electrical propulsion was initially applied, despite it usually having twice the mass of an internal combustion system. The most obvious reason for the greater mass of electrical systems is the lower density of energy stored in batteries than in chemical fuels. However, the demonstrator in this project was tested first in the wind tunnel, where it is important to have propulsion which is easy to control and generates small vibration. In particular, the starting of the propulsion is critical since vibrations of large amplitude (typical for starting an internal combusting engine) may impair the aerodynamic balance applied for the precise measurements of aerodynamic forces. Moreover an electrical propulsion is cleaner, which is particularly important in the closed circuit wind tunnel, since an internal combustion engine would be forced to breathe its own exhaust gases instead of clean air. Exhaust gases could be led out of the tunnel, but even the flexible piping necessary to do this would interfere with the measurement of aerodynamic forces. Application of the same propulsion both in the wind tunnel and in flight was perceived as a good way to save time in transferring the demonstrator from the wind tunnel to flight testing. However, the characteristics of electrical propulsion generated another significant challenge in the case of flight testing. According to previous experiences, a climb rate of 3 m/s is necessary to perform a safe flight of the research model. In the case of internal combustion engines, this is an initial climb rate achievable immediately after takeoff. The climb rate rises over the flight time due to the fuel consumption and resulting mass reduction. Therefore, the final climb rate is usually greater than the initial one allowing for safe abort landings if necessary. An electrical airplane, by contrast, has a constant mass over the whole flight, yet its batteries’ voltage is decreasing (more than 10%), therefore the power available for flight is also decreasing (more than 20%). As a result, a climb rate of 3 m/s should be available just before touch down (with an almost fully discharged main battery) should an abort landing be necessary. It was assumed that an electric propulsion providing an initial climb rate greater than 5 m/s would allow for a final climb rate of 3 m/s. This means that the electrical propulsion had to be more powerful than an internally combusting one, thus further increasing its mass.
Properties of the electric propulsion system applied for both wind tunnel tests and initial flight tests are summarized in Table 1. Demonstrator characteristics were retrieved from wind tunnel tests, presented in Figure 3, and also the resulting airplane performance in Figure 4. As can be seen from these figures, the maximum climb rate achievable close to the ground was greater than 5 m/s and the maximum flight endurance was greater than 20 min. These values were evaluated as acceptable for flight testing.
The propulsion system was not the only electric device onboard the demonstrator. It was also equipped with a radio control system (RCS), autopilot and data acquisition system (ADAS), Radiomodem, and charge-coupled device (CCD) Camera. The whole electric/electronic system architecture is presented in Figure 5. Each of the vital systems of the demonstrator was supplied from a separate power source because previous experience shows that a supply from separate sources is important for the safety and accuracy of recorded measurements.
Application of an autopilot allowed for autonomous flights, but this was used only as an emergency option in the case of loss of radio contact. If radio contact was lost, the autopilot would guide the airplane around the airfield until radio contact was recovered. Direct radio control was applied as the main mode of control because the demonstrator was tested to evaluate its handling properties, so the “pilot’s impression” was an important source of information, together with data from various sensors installed onboard. Usually these data are used by the autopilot to calculate signals for servomotors and the propulsion speed controller. In this project, the autopilot only stored them for further analysis and sent some data to the ground control station (GCS) to be displayed for those supervising each test. A CCD camera was also installed onboard since the view from the airplane is quite helpful in flight data analysis. However, it was not transmitted to GCS in real time since the airplane was flying close to the pilot, so control according to the visual line of sight (VLOS) rules was applied (Figure 6).

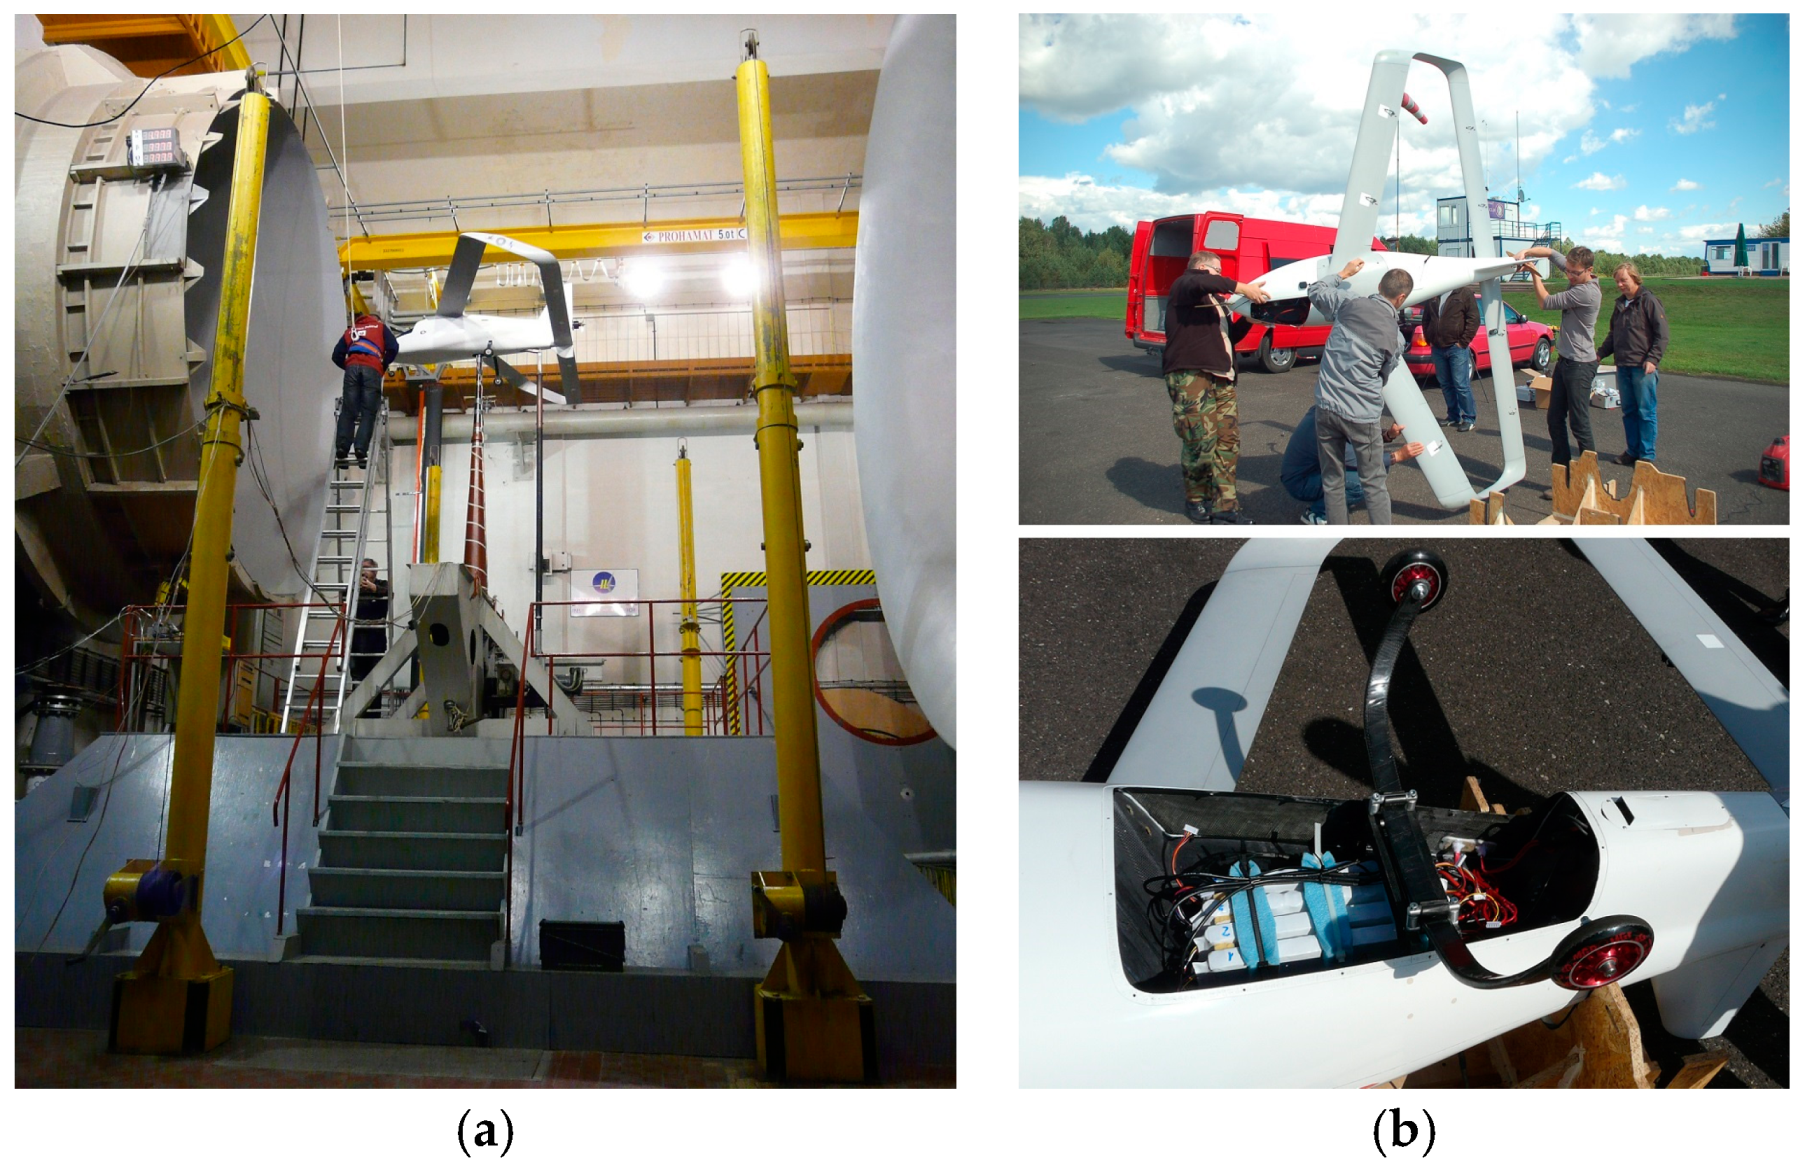
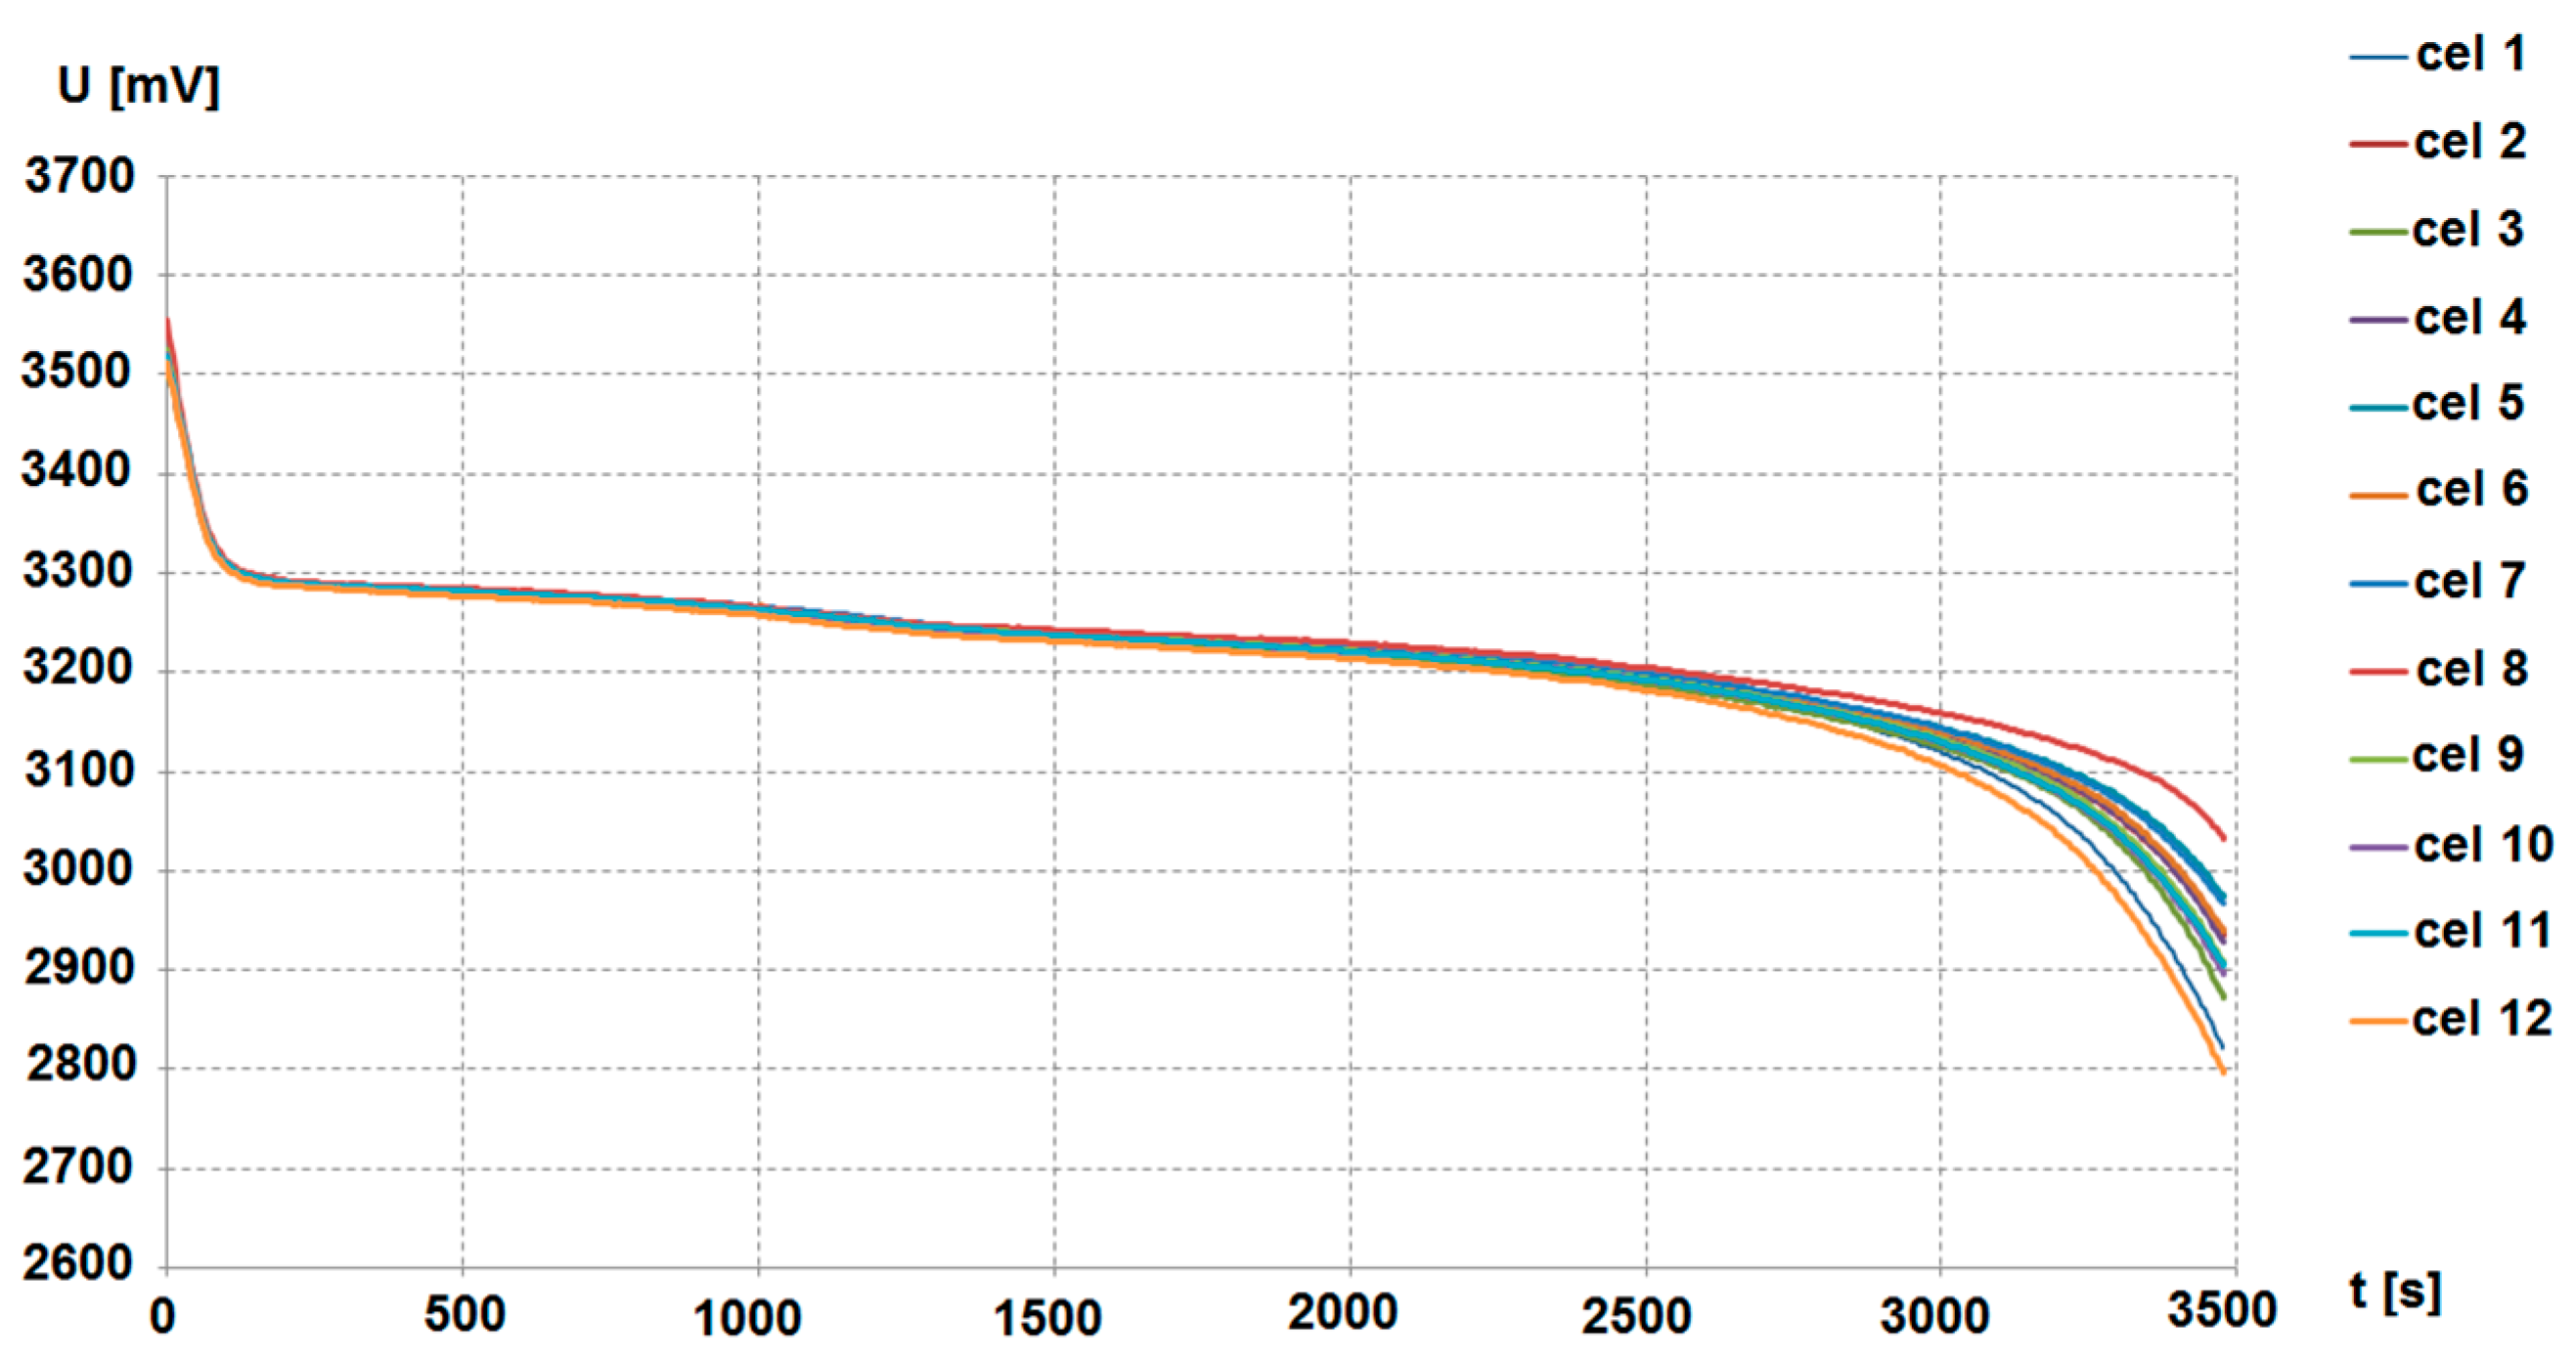
4. Project Implementation and Results

Two sessions of wind tunnel tests were performed before the flight test campaign began. Both of them took place in the early months of 2014. The first was dedicated to propulsion testing, and the second to the whole demonstrator testing. The first flight was performed in September 2014 and then the flight test campaign was continued in the summer of 2015. An additional wind tunnel test session dedicated for propulsion testing was performed in the spring of 2015. Electrical propulsion appeared particularly convenient during wind tunnel testing, but charging of the whole set of batteries before each wind tunnel test or flight test proved to be quite time-consuming. Therefore several sets of batteries were charged before each test/flight day and were then only replaced when necessary, although this was also cumbersome to some extent (Figure 7). The same batteries were used during the whole project. In mid-2015, they started to exhibit worse and worse performance and so they were tested on a ground test bench. Each cell in each battery turned out to have different discharge characteristics (see Figure 8), which had not been the case at the beginning of the project.
Different discharge characteristics are usually a symptom of battery aging; therefore, it was necessary to decide whether a new set of batteries should be acquired. Market analysis indicated that a suitable piston engine would be lighter and cheaper. Moreover, the maintenance advantage of an electrical propulsion system during a flight test campaign is questionable. Refueling takes significantly less time than exchanging batteries so more flights a day can be performed with internally combusting propulsion. Therefore it was decided to replace electrical propulsion with a piston engine. It was then used until the end of the flight test campaign. The electrical propulsion system was used again during the final wind tunnel test session in 2016. A summary of the electric propulsion system application in this project is presented in Figure 9.
The most challenging tests for the batteries are marked red in this figure. These tests were so challenging because a high discharge current was used for extended periods of time in these cases. In the case of complete airplane investigation in the wind tunnel, a much smaller current was used since cruising conditions were simulated. In these conditions, the airplane needs the smallest power to fly. During flight testing, on the other hand, full power is used only during takeoff, so in this case a high discharge current was used neither frequently nor for an extended period of time. Finally, the test stand (Figure 10) used for propulsion testing could accommodate only a 12S2P battery configuration instead of the 12S4P configuration applied for complete airplane testing. As a result the current drained from the batteries during propulsion testing with full power was usually twice that as during complete airplane testing. This means that either five months of extensive use exhausted the useful life of the batteries, or they were aging also during storage periods (despite proper storage conditions). In any event, this result was quite disappointing since Li-Fe batteries were selected in view of their greater expected durability than Li-poly batteries (another reason being safety). The conclusion to be drawn from this experience is that electrical propulsion is quite useful in aeronautical research programs, albeit only in their early stages. However, when long lasting extensive flight testing begins, an internal combusting propulsion is still more reliable and easy to use.
Two other lessons were learned from this project, concerning potential modifications to the general configuration of the airplane. During the flight test campaign, the craft was discovered to exhibit correct longitudinal stability but relatively low directional stability (acceptable but not comfortable for the pilot). Because of this, it was decided to move the CG in the forward direction to improve directional stability, so that the airplane was eventually flying with the CG located in front of its planned position. As a result, the aft wing provided too little lift to maintain an optimal lift distribution. Therefore, it was not possible to attain the expected performance advantage. However, this could be improved in the future, for instance through the application of ducted fan propulsion, because the duct would provide an additional stabilizing surface behind the tail of the airplane. This would improve both the directional and longitudinal stability of the airplane and allow for a more aft CG position. As a result, the aft wing would deliver greater lift. However, this solution may not be optimal since the thrust axis of the ducted fan is still quite high above the ground and over CG. Eccentricity between the CG position and thrust axis generates a significant pitching moment which has to be balanced by the elevator deflection, again decreasing the lift from the aft wing. It would seem that the application of propulsion distributed along the leading edge of the aft wing would solve both problems. Without an engine and propeller/fan at the end, the fuselage could be longer so that the distance between the CG and the vertical stabilizer could be greater, providing sufficient stability with the optimal CG position. Moreover, small motors applicable in the case of distributed propulsion would require small propellers. This would allow for the thrust axis to be located below the CG, so that increased lift from the aft wing would be necessary to obtain the equilibrium. These considerations were initially verified with the application of simple CFD methods showing an advantage of distributed propulsion [54]. In Section 4 of this paper, we show with the application of wind tunnel data that this result is plausible. Assuming an airplane configuration like the one presented in Figure 11, however, leads us back again to an electric propulsion system, since small electric motors are much more reliable and easier to operate than internally combusting ones. The simultaneous starting and regulation of many small internally combusting engines is almost impossible. Moreover it would be dangerous in the case of crosswind landings because one wing is much closer to the ground in these cases, thus creating a threat of collision between the runway and an external propeller. Fortunately only idle power is used during approach, so the more external electric motors could be switched off completely and restarted if an aborted landing maneuver was necessary. They should be equipped with foldable propellers to avoid collision with the runway, so their nacelles should be at least as long as the propeller radius to allow for unhampered folding and unfolding propellers. On the other hand, the immediate restart of a small internal combusting engine during an aborted landing maneuver is again impossible.
Another issue connected with these considerations is their practical application in a large scale airplane. In this case, all-electric propulsion would not be reasonable. The energy density of an all-electrical propulsion system is still approximately eight times lower than the energy density of an internally combusting propulsion system, even if the best Li-ion batteries are used [55], so in a large scale utility airplane, liquid fuel should be used for energy storage. On the other hand, the issue of crosswind landings is still important, so electrical motors should be applied to deliver the thrust necessary to fly. This leads to the conclusion that hybrid distributed propulsion may be optimal for large scale airplanes in the proposed configuration.

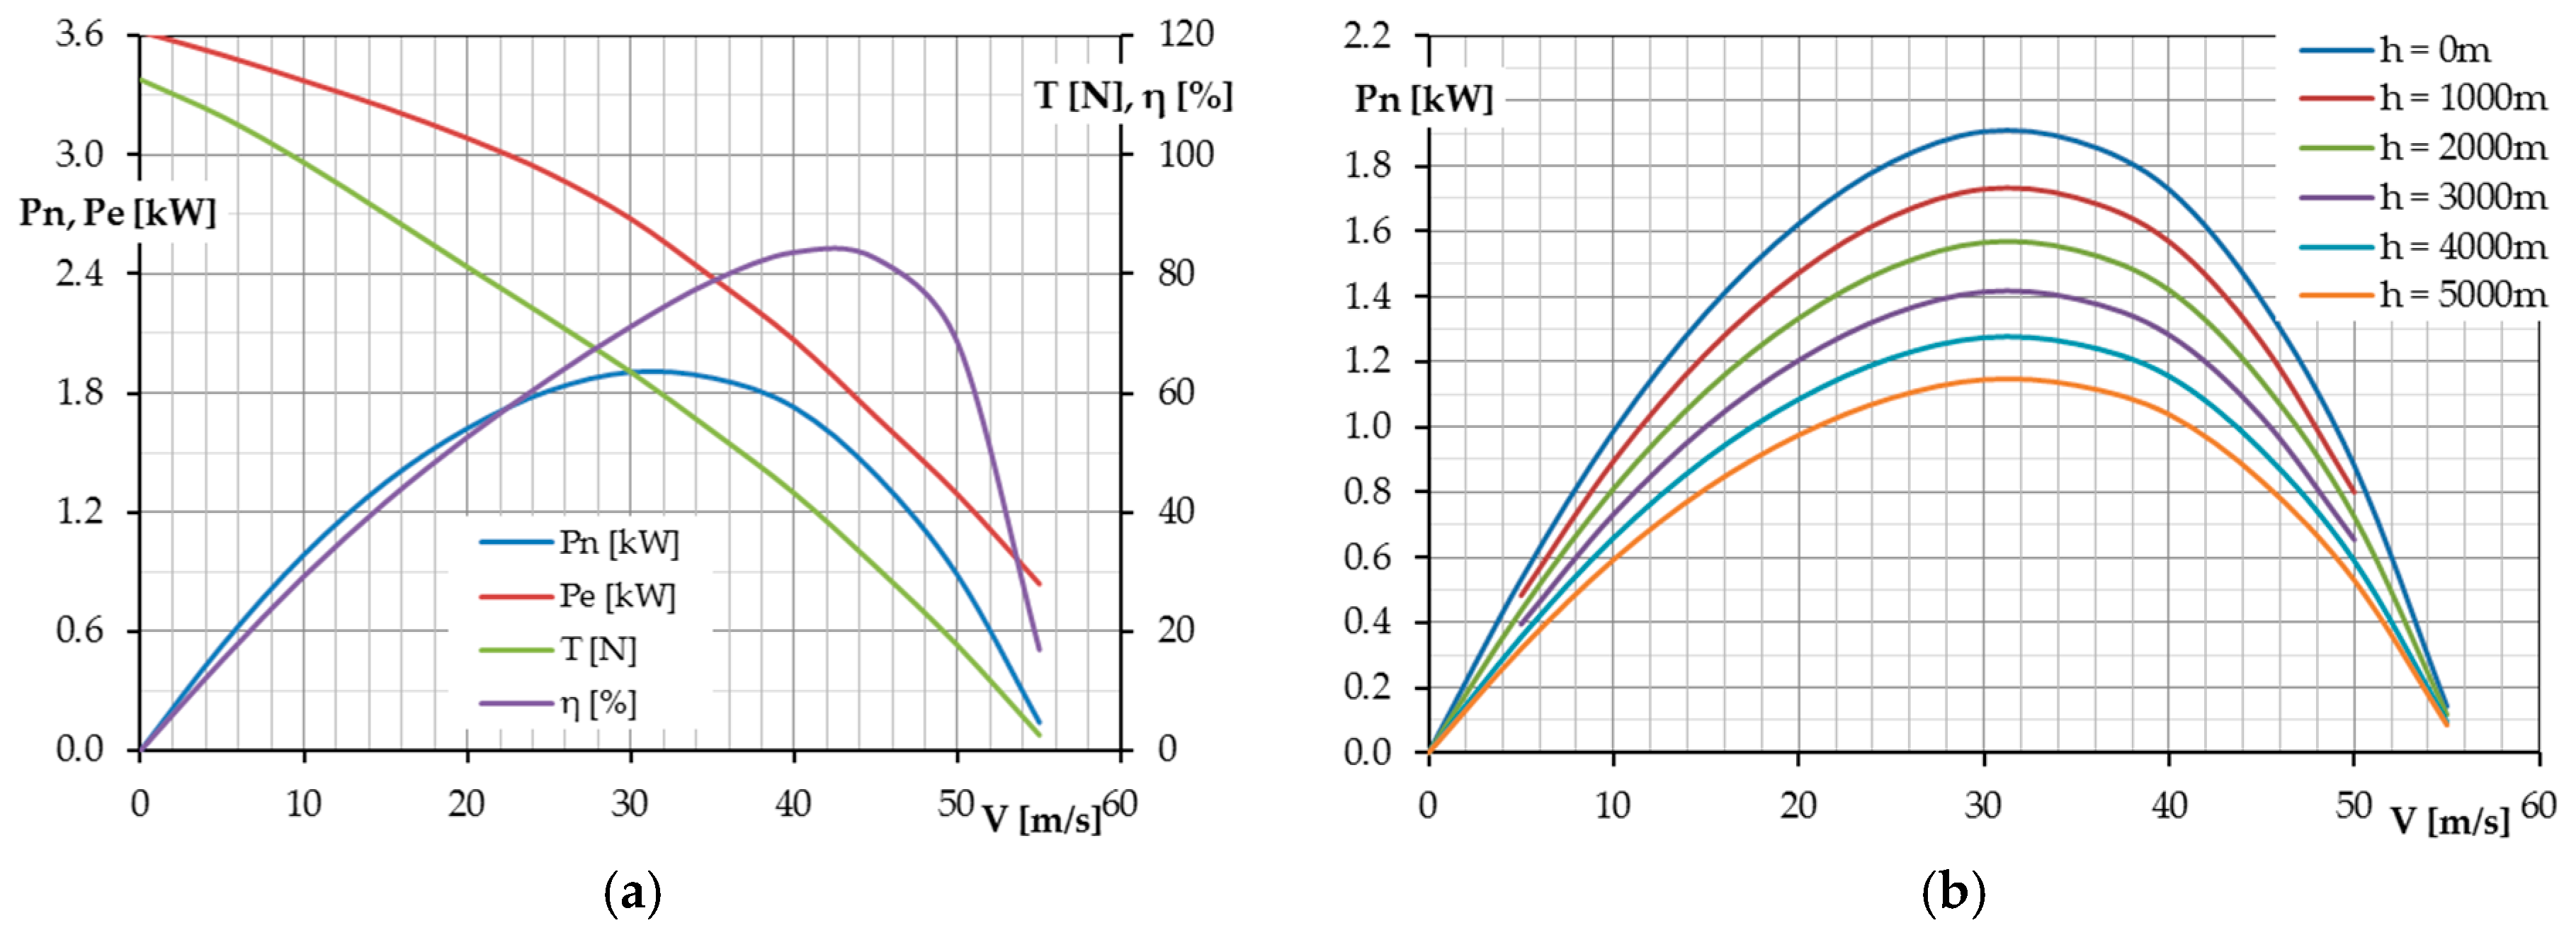
5. Performance Improvement Analysis

Above we have considered several possible modifications to improve the performance of the joined wing demonstrator which we actually tested. However, any and every change needs to be made with special care to keep the airplane’s stability and handling properties at a suitable level. Figure 12 explains the convention of the axis system used to define the CG position, neutral point of stability (CN) position, and thrust vector (T) position used in this paper. It is worth mentioning that positive elevator deflection δH is down deflection and corresponds to the nose pitching down effect.
As Figure 12 shows, the CG is located unusually far aft from the front wing as compared to a conventional airplane. However, this is typical for a joined wing configuration because of the specific lift distribution between the front and aft wings. Analyses presented below are based on a set of extensive wind tunnel tests performed in 2014 and 2016 which included different aircraft configurations including: plain configuration, with controls deflected, asymmetric flight configurations, with propeller and ducted fan propulsion.

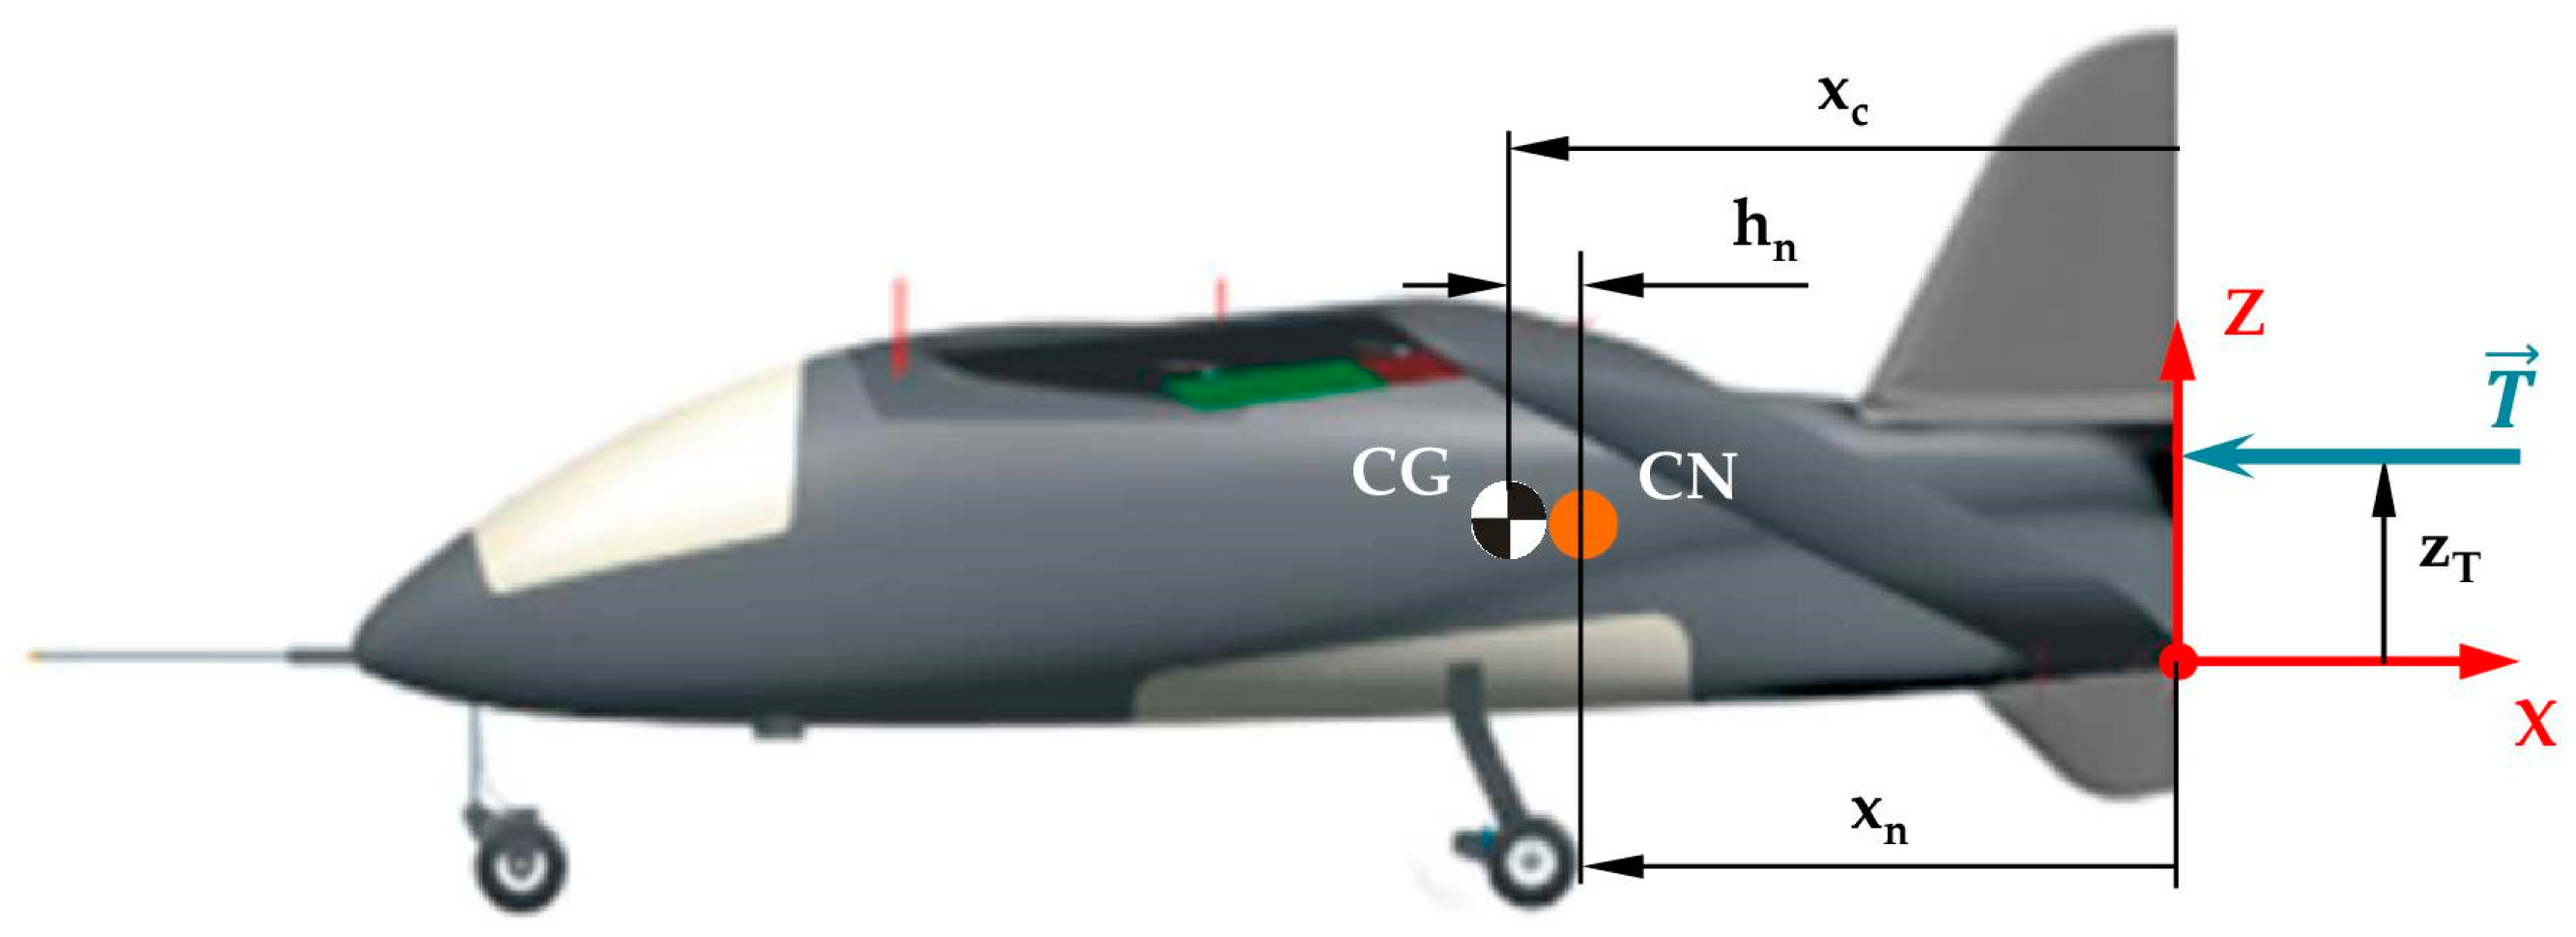
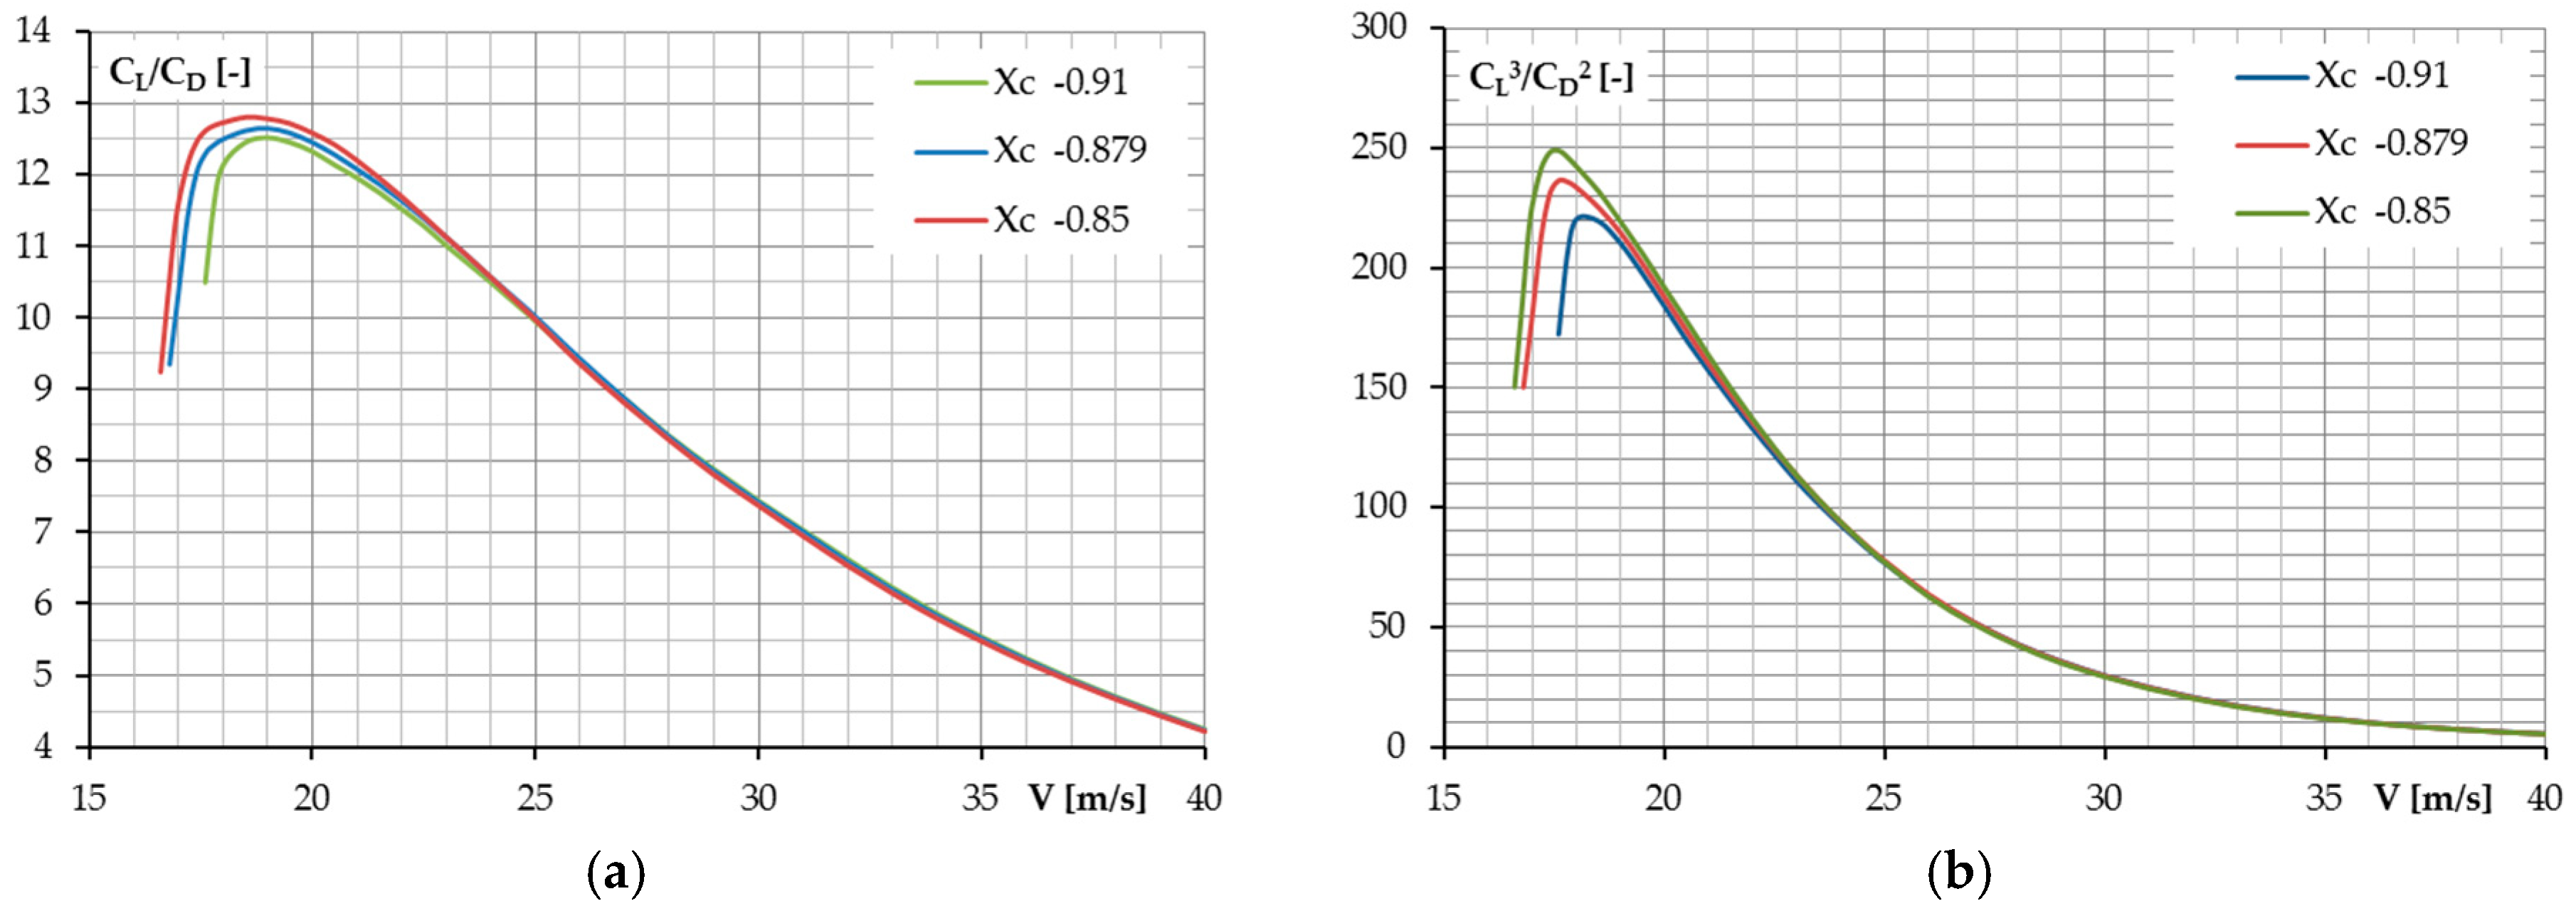
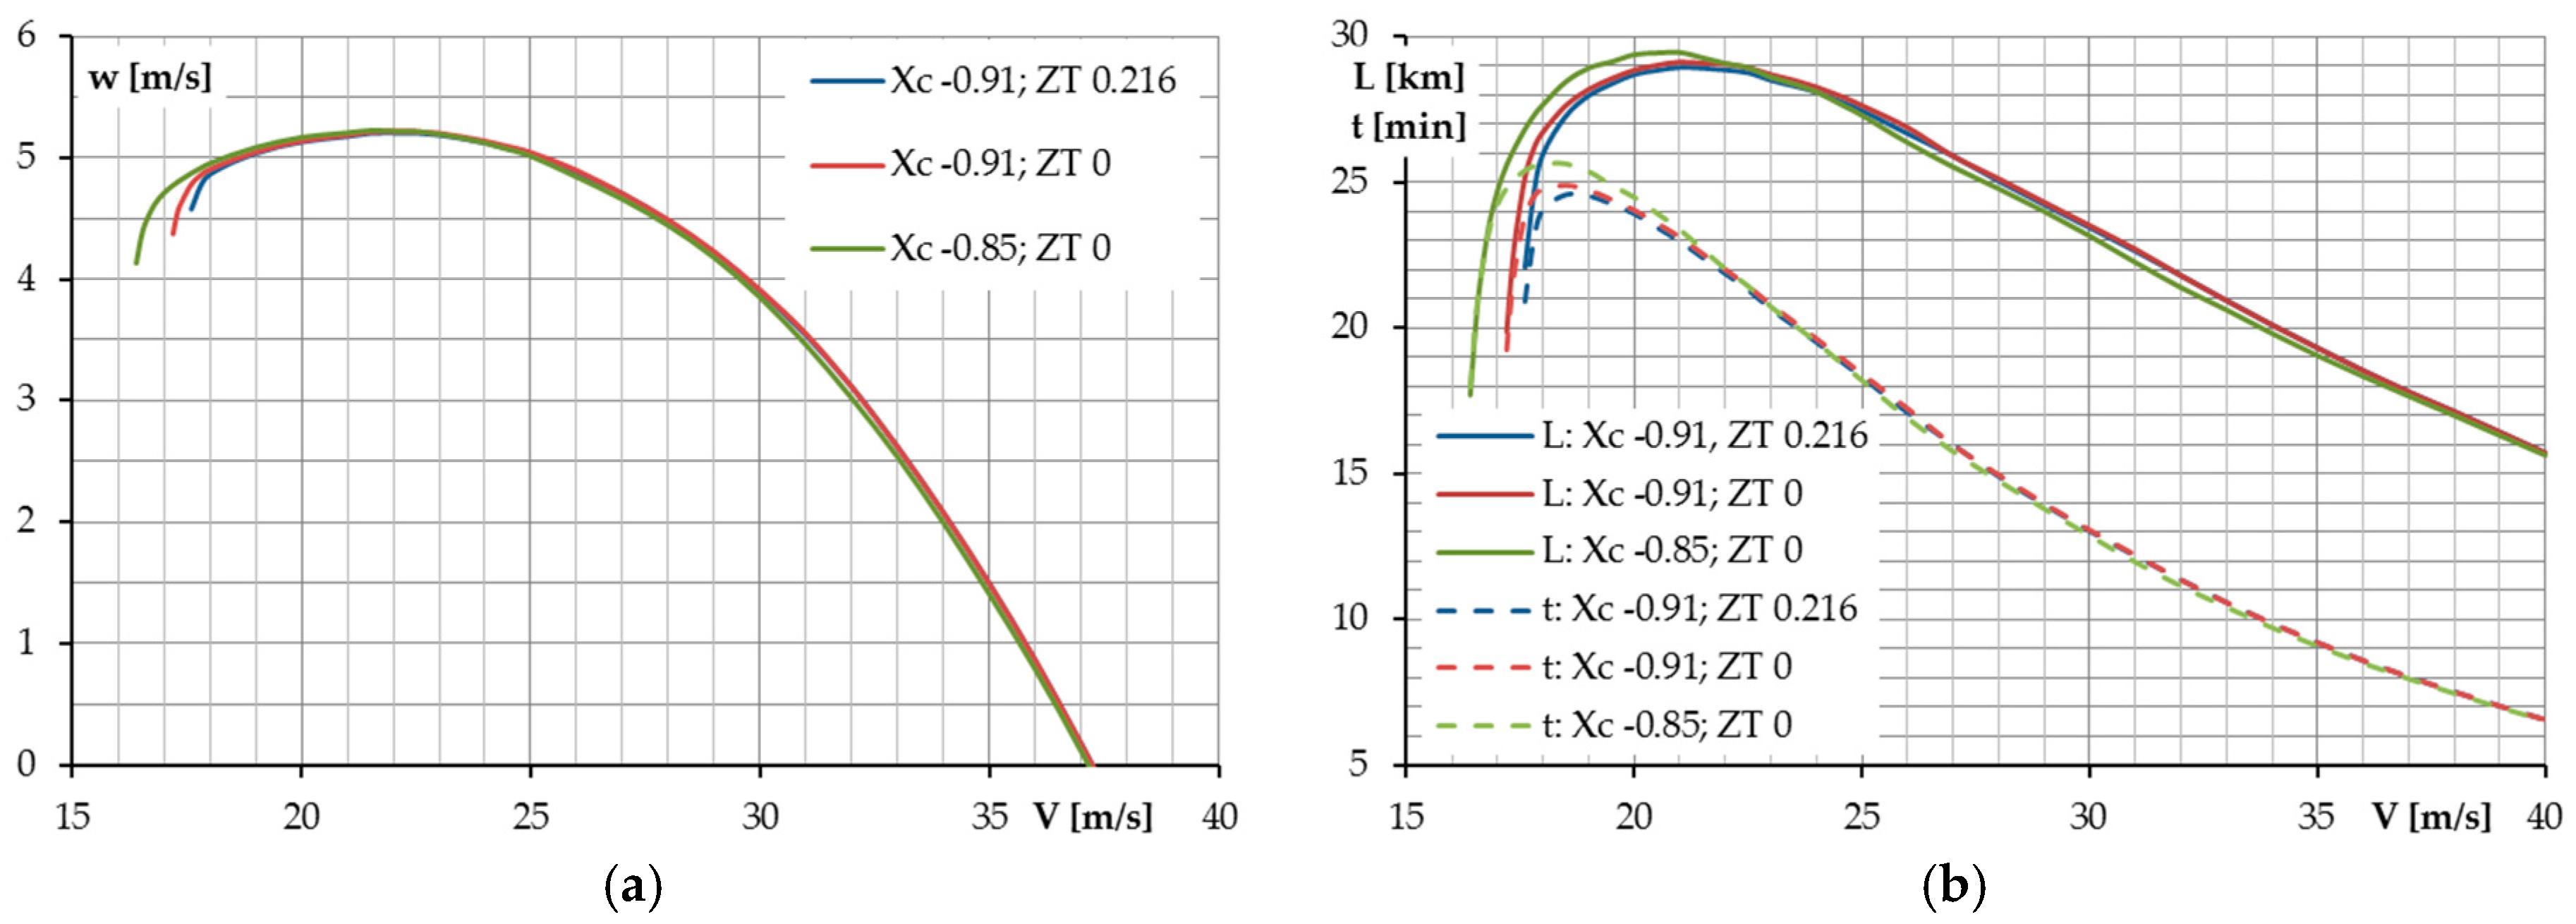
5.1. Center of Gravity Position Impact on the Airplane Performance

The CG position for every airplane is defined by several factors: the required stability margin, controllability, and performance. The first one describes the most aft position relative to the CN position, with some reserve factor called the stability margin h n ¯ , that satisfies static stability requirements. The second one defines the most forward position in view of the controllability, and depends mostly on the elevator effectiveness. The forward location of the CG is also driven by aerodynamic performance constraints. That is because the more forward the center of gravity position is, the more elevator deflection is required to balance and control the airplane, and thus the total drag is increased.
In the case of the airplane being analyzed herein, the CG position was ultimately defined according to the first flight tests that revealed an acceptable but small directional stability. That is why the location of the CG was shifted from an initial xc = −0.879 m to xc = −0.91 m, which increased the distance between the vertical stabilizer aerodynamic center and the CG and therefore improved directional stability, but on the other hand affected the performance. In order to quantify the impact of CG position on performance, we performed the evaluations shown below. First of all, plots of elevator deflection to trim the airplane in steady level powered flight versus the airspeed and angle of attack were defined using the SDSA software developed by Warsaw University of Technology, Poland [56,57] as shown in Figure 13a,b, respectively.
Calculations were made for the baseline propulsion configuration (see Figure 2) and five different CG positions were staggered by 10% of MAC. The first one (xc = −0.91 m ) indicates that the modified CG position does not really match the assumed cruise airspeed of 25 m/s since an elevator deflection of about −1.9° is required to maintain steady level flight. This negative elevator deflection induces a negative lift increment resulting in lower total lift. The former, being plotted in the domain of the angle of attack, gives a brief insight into the airplane’s static longitudinal stability level with respect to the angle of attack in the range of −6° < α < 6°. Because of the fact that the negative slope of δ(δH)/δα indicates positive stability, the airplane is statically stable for the full achievable range of angles of attack for almost every CG position considered, except for the most aft case (xc = −0.802 m), where the slope becomes positive for angles of attack below α = −4°. After that, the location of the neutral point xn was defined in a similar manner and is shown in Figure 14. According to the figure below, the most forward position for α = −6° equals xn = −0.836 m. Therefore, while assuming a minimum stability margin h n ¯ = 0.05MAC (0.0135 m), the most aft CG position should be set to xc = −0.85 m.
In order to assess the CG position’s impact on the airplane’s performance, additional analyses were performed for two additional CG cases. These were the most aft position that satisfies the assumed stability margin ( h n ¯ ) and equals xc = −0.85 m and the most forward position used during the last flight session: xc = −0.91 m. A comparison of the results with the baseline characteristics presented before in Figure 4 is shown in Figure 15 and Figure 16.
Results show a small improvement in performance. The climb rate remained more or less the same within the full airspeed range and varies only for very low airspeeds close to the stall point, which in reality does not give any benefits. It is a bit different for the range and duration characteristics, which reveal some advantage in shifting the CG backwards. The maximum range extension is possible for an airspeed of about 21.5 m/s and equals 2% as compared to the range for xc = −0.91 m. Improvement of flight endurance is also possible. Nevertheless, it is achievable for a lower airspeed and equals 2% for an airspeed of 19 m/s. In every case, performance improvement diminishes for airspeeds over the assumed cruise airspeed of 25 m/s. The reason for the low increase in performance in general is the fact that the longitudinal equilibrium is significantly affected when the center of gravity is shifted. As a result, this requires proper elevator deflection to maintain the balance and consequently generates an additional drag increment. A more effective way to recover the balance is by making an appropriate change to the rear wing incidence angle; however, this was not possible in this case, given that a basic assumption was that the analysis was based on the wind tunnel results.
Another issue that may be affected by the CG travel is the longitudinal and directional stability of the airplane, both static and dynamic. It has been already shown that the longitudinal static stability is satisfied, but additional work is required to assess the dynamic stability. Because the airplane revealed insufficient directional stability, which was initially the reason for moving the CG forward, after moving the CG backwards to xc = −0.85 m, there is a need to shift the vertical stabilizer backwards by about 0.06 m to keep approximately the same distance between the CG and stabilizer aerodynamic center. Based on this, the numeric model as shown in Figure 17 was created to assess the airplane aerodynamic characteristics in sideslip cases using the PANUKL software developed by Warsaw University of Technology, Poland [58].
Using results from PANUKL, input data for the analysis was updated and the stability computation was performed in SDSA [56,57,58] for geometry with a new vertical stabilizer position and most aft CG position. The basic results are presented in Figure 18 and compared with the properties of the airplane with the initial geometry and most forward CG position.
According to Figure 18a, the time to halve the amplitude in phugoid motion is higher for low airspeeds below 21 m/s, which means weaker damping close to the minimum airspeed. However, the motion becomes highly damped compared to the basic configuration for airspeed range above 21 m/s, which confirms the improvement in longitudinal stability after CG and tail modification. It should be pointed out that the irregular shape of the curve is caused by limitations of the software that solves linearized equations of motion and thus, discontinuities of the final output are possible. Nevertheless, it is enough to quantify the design impact on the overall airplane qualities. Because a joined wing configuration seems to inherently have good longitudinal dynamic stability properties as shown in [59,60], there is no risk of phugoid or short period oscillation instability with CG location change until static stability requirements are satisfied. It is a bit different in terms of lateral-directional stability because a combination of dihedral and wing sweep angles together with side connecting plates and usually a relatively small area of vertical stabilizer makes it difficult to predict airplane qualities. That is why the results presented in [59] revealed spiral instability and a satisfactory level of Dutch roll stability. Dutch roll damping was also crucial in the case of our airplane. Both spiral and Dutch roll were stable with the original CG location, but any spiral motion was always accompanied by Dutch roll oscillations, which was not convenient for the pilot, in particular in gusty weather. This was a reason for the CG shift forward during the flight test campaign. Therefore, the increase of Dutch roll damping was perceived as advantageous and is analyzed in this paper. As shown in Figure 18b, after the proposed modification, damping was significantly increased in the full airspeed range. It is because of the vertical stabilizer shift that the adverse effect due to the CG location change was overcome. Therefore, since the directional stability was generally improved, it can be said that there is no risk of stability loss if only the appropriate stabilizer position and area are maintained.

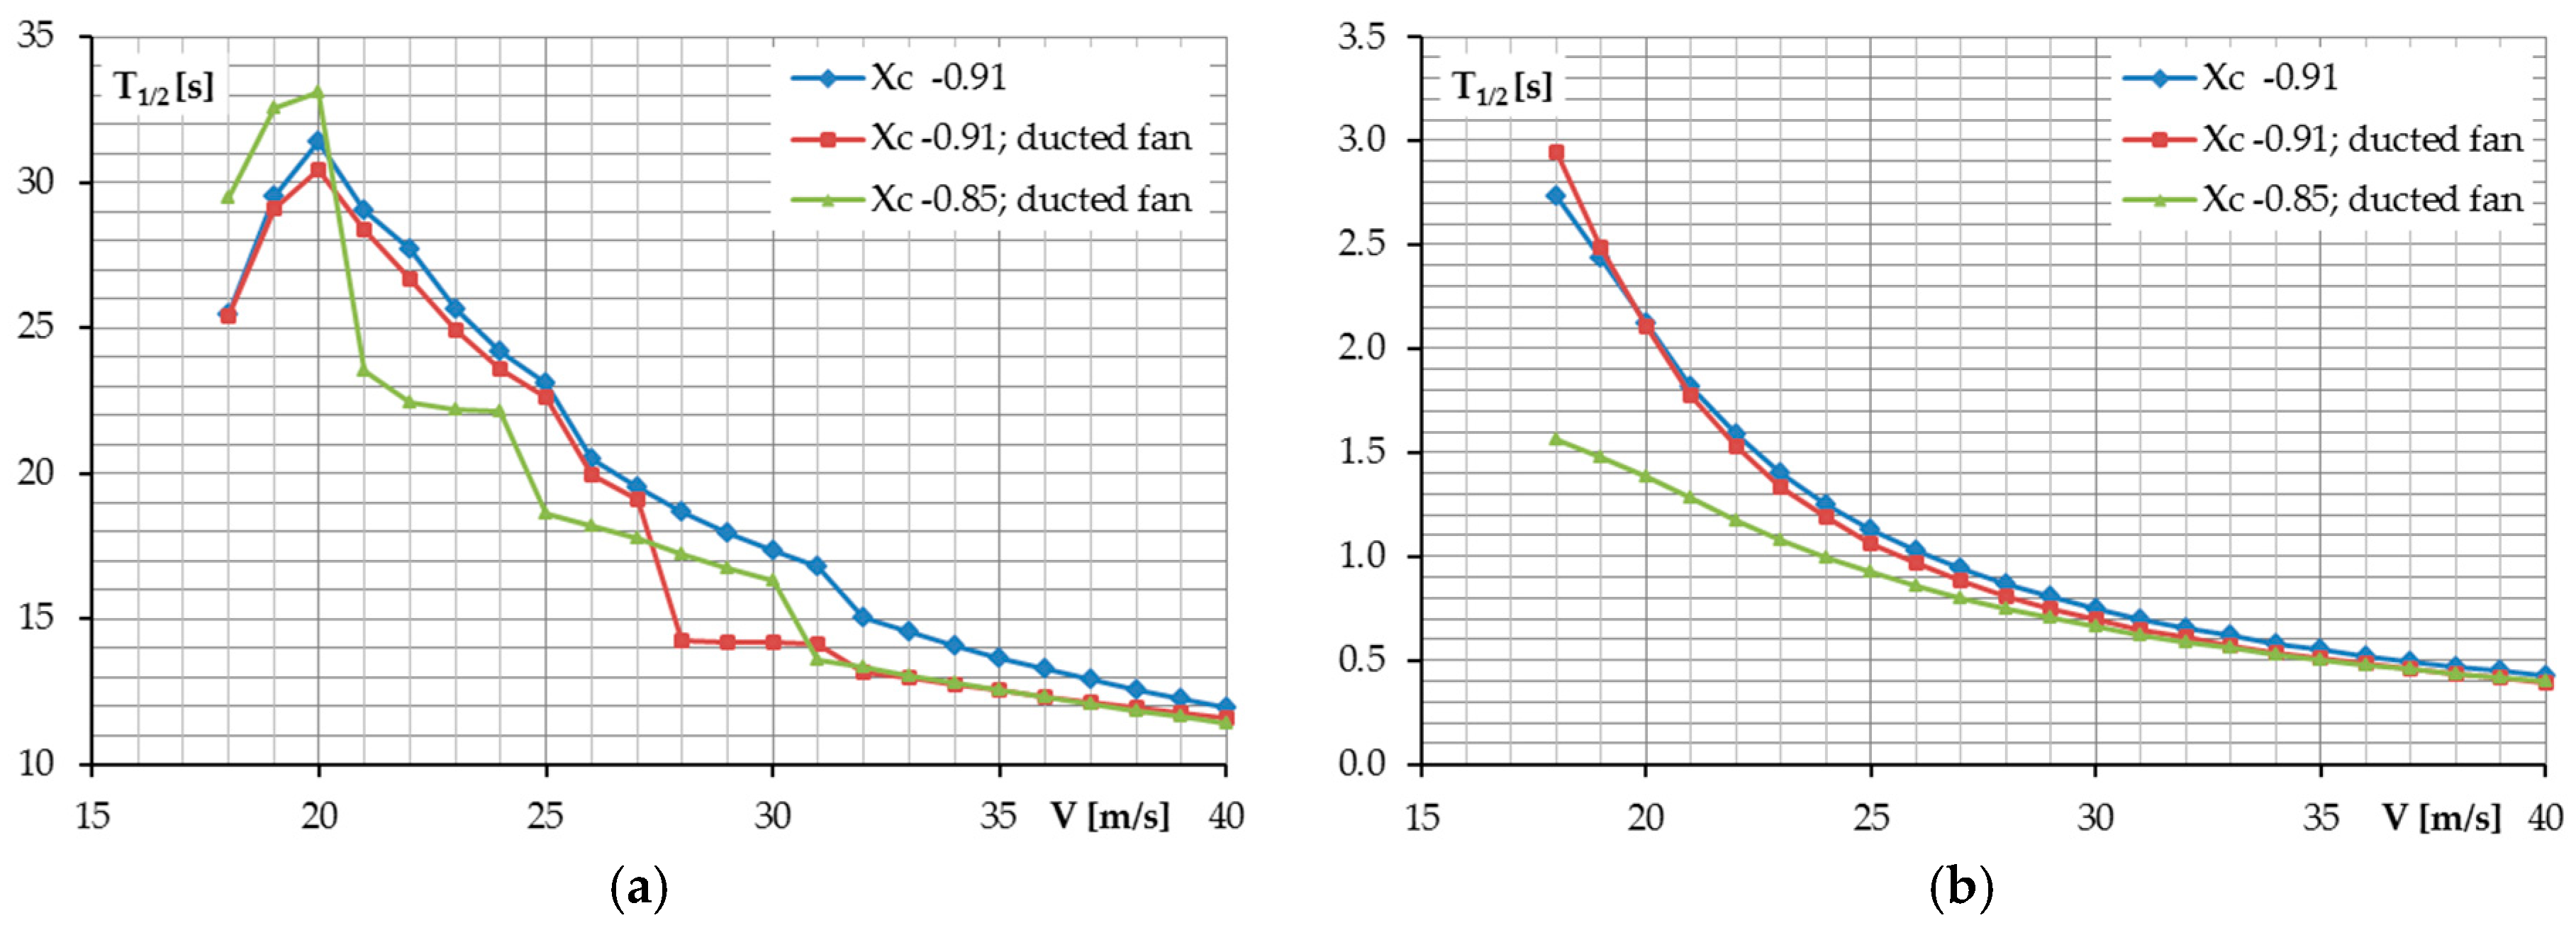
5.2. Thrust Vector Position Impact on the Airplane Performance

For the reasons discussed in Section 2, the thrust vector is located high above the CG position, so that it generates a pitching down (negative) moment and greatly affects the longitudinal trim and thus performance in general. Possible solutions as to how to modify the propulsion unit to minimize this adverse effect were highlighted above and thus some calculations are needed to evaluate the possible benefits from this concept. Two different positions were considered: nominal zT = 0.216 m and a lower position located approximately in plane of the aft wing zT = 0 m (refer to Figure 12). The latter was combined with two different CG positions, so that three different cases were analyzed. The final results are presented in Figure 19 and Figure 20. This time of the total extension of the range was approximately 3%, whereas the total extension of flight endurance proved to be 4%. Performance improvement is visible only for low airspeed values. However, it is worth pointing out that the minimum airspeed was reduced due to the positive pitching moment increase generated by the thrust, which allowed for increased lift. Any benefits diminish with increasing airspeed. Similar to the previous findings, this is caused by an inappropriate aft wing incidence angle not adjusted to the new concept. This should be changed to trim the airplane with a new thrust vector position for the assumed cruise airspeed. We propose that after the incidence angle is changed so that it compensates for the change in pitching moment due to the thrust effect, the performance would be improved within the full range of airspeed.

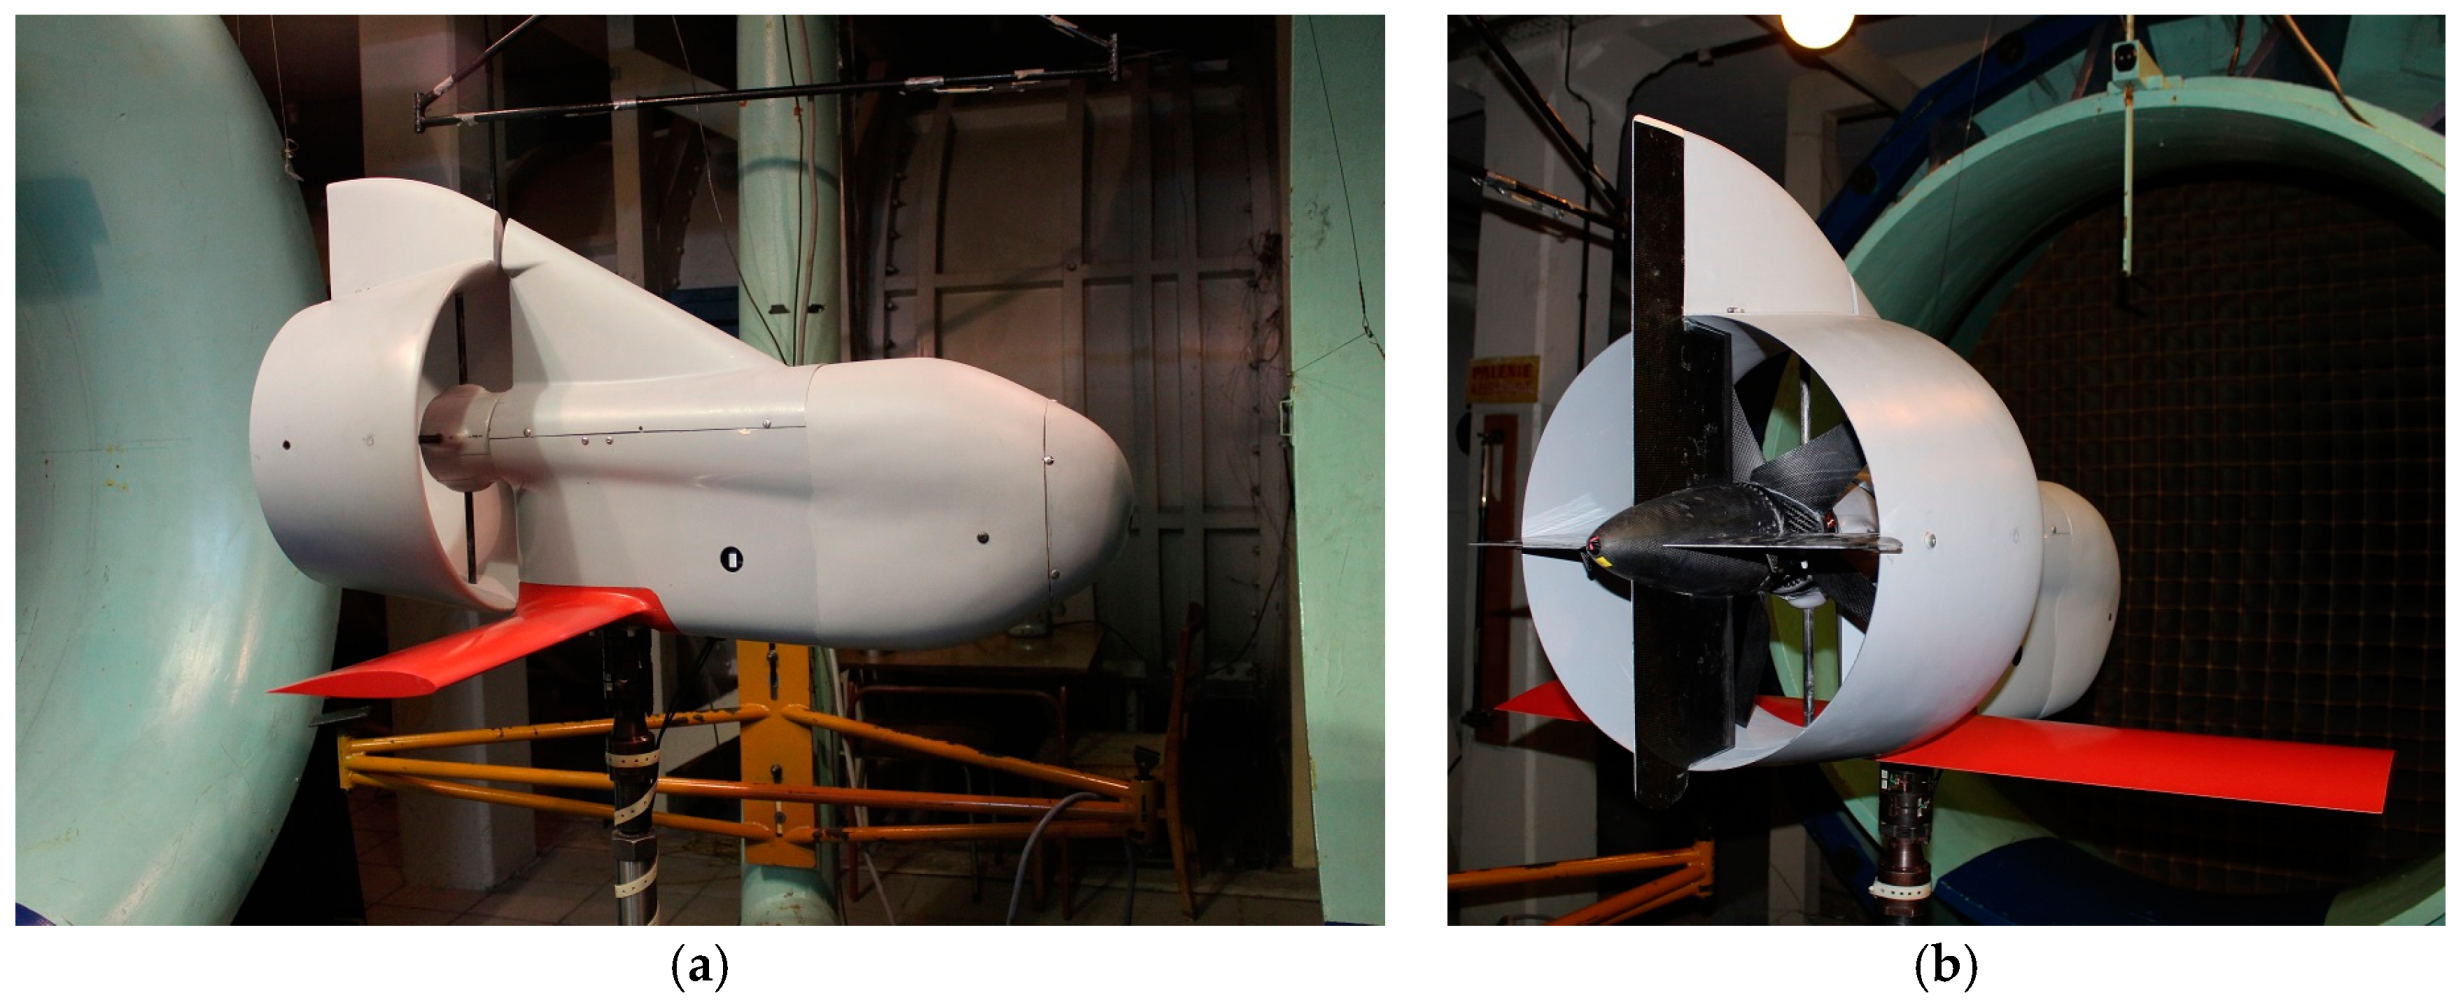
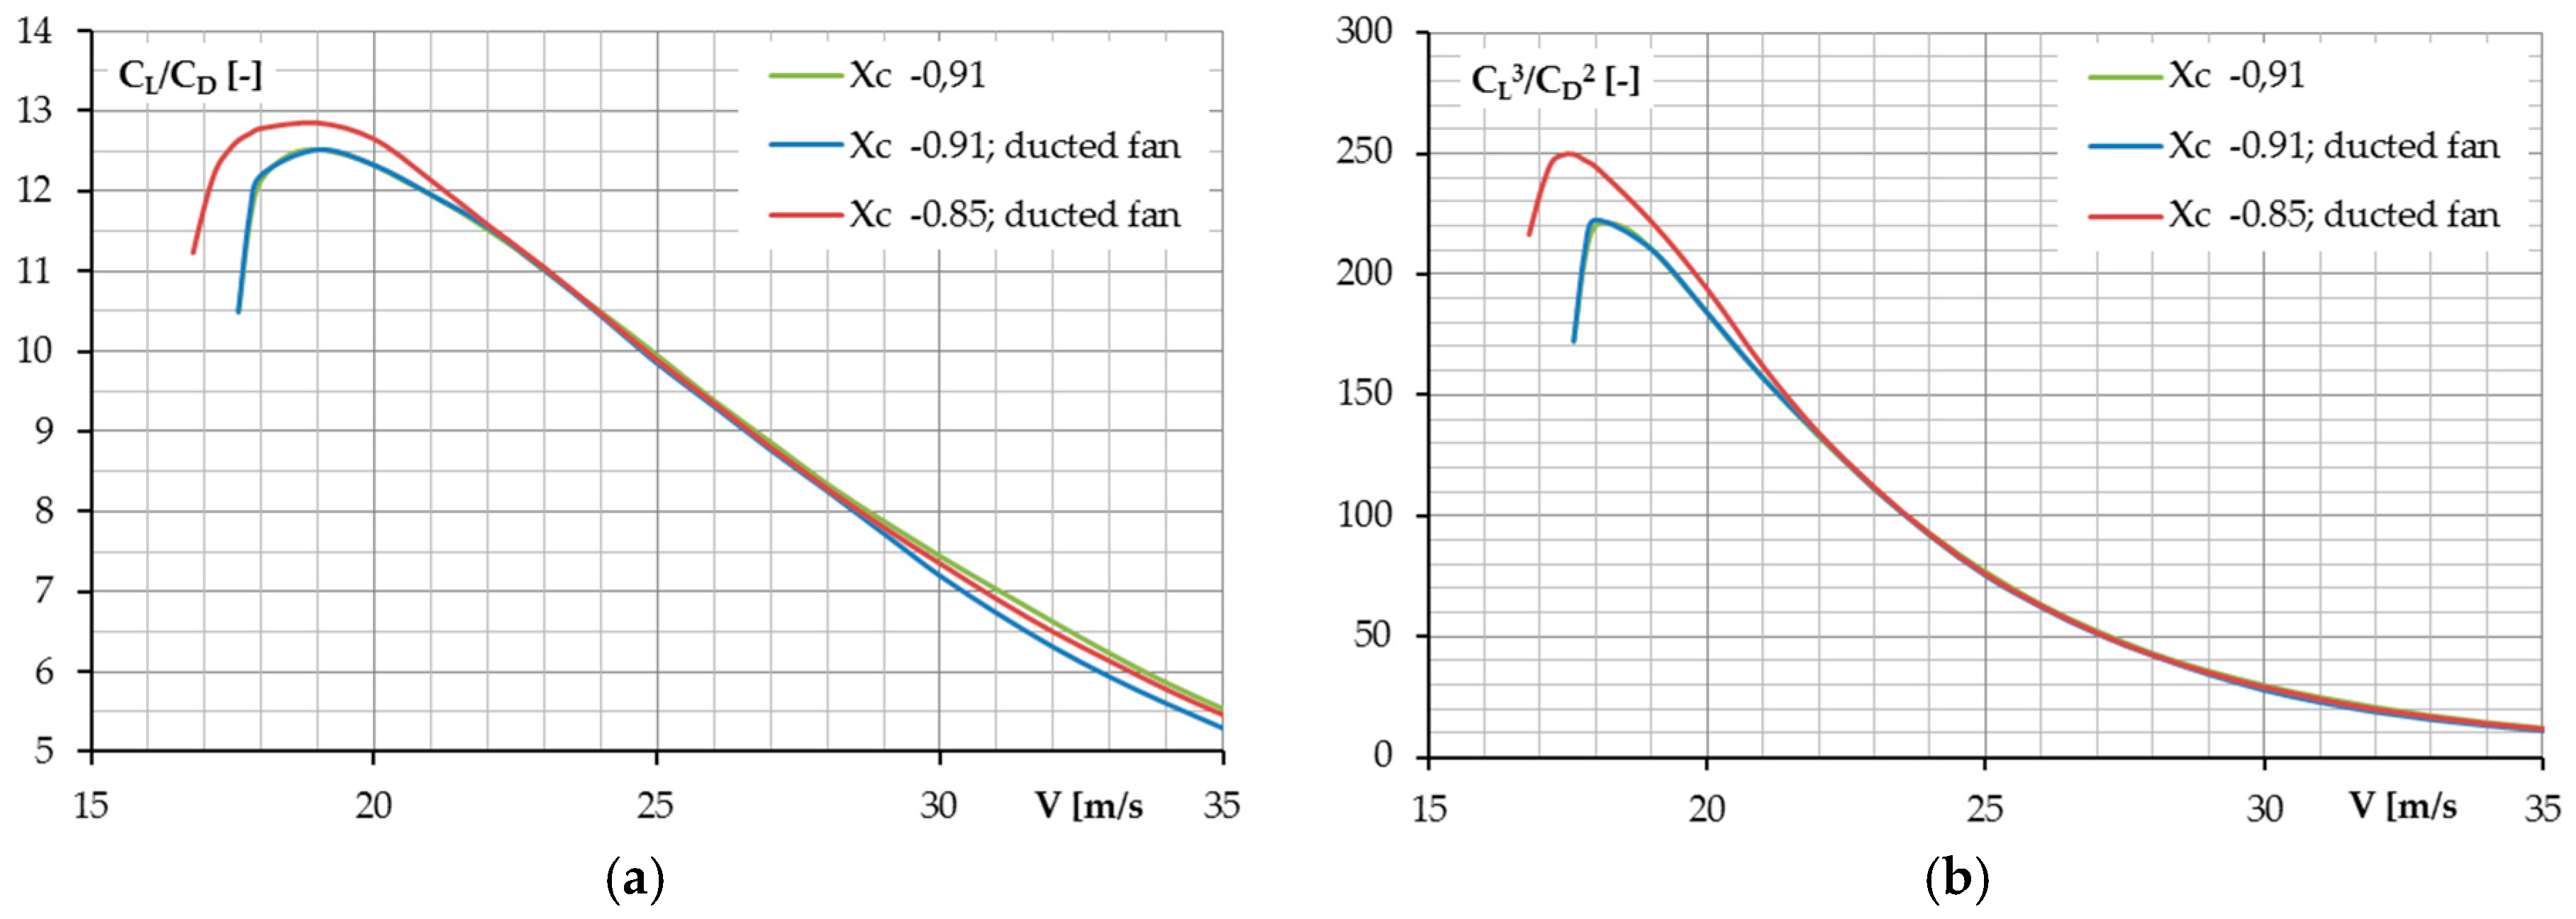
5.3. The Airplane Performance with the Ducted Fan Propulsion

Another concept discussed above is propulsion with a ducted fan, as shown in Figure 21. Wind tunnel tests were performed for the airplane with this new propulsion, and additionally for the propulsion unit separately to check its performance without the airframe.
Based on the aerodynamic characteristics of the airframe and propulsion unit characteristics, both retrieved from the wind tunnel tests (Figure 22), the airplane’s performance was calculated in a similar way as described previously and the results are presented in Figure 23 and Figure 24. The first picture shows that there is very minor influence of the ducted fan on the airplane’s overall aerodynamic characteristics. Comparison with the airplane in the baseline configuration reveals only a small difference in CL/CD for the high airspeed range above 29 m/s. Similar to the baseline configuration, the CG shift in the aft direction gives a significant CL/CD and CL3/CD2 ratio increase near the minimum airspeed. The graphs presented in Figure 24 do not confirm that the airplane with the ducted fan is superior over one with conventional propulsion. That is because the propulsion unit being tested and used in the analyses has smaller thrust and efficiency than a conventional propeller used in the flight test program (with greater diameter than the ducted fan). Therefore, it is visible that both the maximum climb rate and range/endurance are worse than in the case with baseline propulsion.
Together with performance analysis, we also evaluated basic stability, as shown in Figure 25. We expected that additional surface of the duct would improve both the longitudinal and directional stability, yet the calculations indicated that the duct’s contribution to the stability does not seem to be as great as was thought. This is because of the specific airflow conditions inside and over the duct. First of all, when the throttle is narrowly opened or even closed, it is possible that the fan significantly reduces the airflow inside the duct [48], so that it cannot act as a lifting surface nor give a stabilizing effect in the case of non-axial airflow. On the other hand, when the throttle is significantly opened, increased velocity inside and around the duct does not allow the airflow to be asymmetric in close proximity of the duct, and thus it does not give any restoring moment.

6. Conclusions

In the project reported herein, we constructed an airplane with the inverted joined wing configuration and performed wind tunnel and flight testing of a demonstrator of this concept.
In the first part of this paper, we focused on the issue of the pros and cons involved in selecting the propulsion system for such a demonstrator. Initially we used an electrical propulsion in the demonstrator to simplify wind tunnel testing, then the same electrical-propulsion model performed several flights. Given the cumbersomeness and significant loss of battery performance we observed during these test flights, however, the electrical propulsion was next replaced by internal combustion propulsion for further flight testing. From this experience and related considerations, we concluded that electric propulsion is quite useful in aeronautical research programs involving such scaled demonstrators, but only in their early stages (wind tunnel testing and first flights). We found that electric propulsion used in such a research airplane is both powerful enough to provide the required climb rate and also a flight duration of over 20 min, which seems appropriate in the flight testing stage. Nevertheless, once a longer lasting, extensive flight test program begins, internal combusting propulsion proves to be more reliable and easy to use.
In the next part of this paper, we considered two major potential modifications of the existing airplane in search of better aerodynamic characteristics and performance. The first one was a shift in the center of gravity towards the aft, which we found allows for better performance due to the increased lift on the aft wing. We showed that performance can be improved even when the longitudinal trim is maintained only by appropriate elevator deflection. We also proposed that when incidence angles on the forward and aft wings are optimized for the new CG position and best lift distribution, further benefits would be gained. However, it is very important to keep in mind the stability requirements, both longitudinal and directional. In Section 5.1, we conclude that this should not be difficult if propulsion is taken away from the fuselage rear and the vertical stabilizer is moved aft.
The second idea was to evaluate the influence of thrust vector position on the airplane design’s performance. Our results did not show significant improvement, but some benefits appear to be attainable in this way. Similarly, a general modification of the lifting surfaces could be required to obtain satisfactory results. This would be even more advantageous if a number of smaller propulsion units were to be allocated on the aft wing’s leading edge, since this may contribute to the improvement of airflow around the aft wing and thus increase its effectiveness. Moreover, this would be beneficial in terms of safety during landing and takeoff, since the tips of smaller propellers can be kept away from the runway.
All this led us to the conclusion that propulsion distributed along the leading edge of the aft wing seems to be optimal for an inverted joined wing airplane, and this in turn takes us back to the advantages of using electric motors in such a case. As a result, we envision that all-electric distributed propulsion could be used in a scaled demonstrator of such a design, whereas a hybrid distributed propulsion should be used in a full scale utility airplane in the proposed configuration.

Acknowledgments

This work was supported by Poland’s National Centre for Research and Development under Grant No. PBS1/A6/14/2012. Special thanks to all members of the team from the Institute of Aviation, Warsaw University of Technology, Air Force Institute of Technology, and MSP Company who contributed to this program. The authors are grateful to Daniel J. Sax (of Sax Translations) for assistance in preparing this paper for publication.

Author Contributions

This particular paper was written by Cezary Galiński, Mateusz Lis, and Jarosław Hajduk. Cezary Galiński was the leader of the whole project and wrote the first four paragraphs of this paper. Mateusz Lis was responsible for the stability and performance simulations, wrote Section 5 and finally reviewed and improved it. Jarosław Hajduk was the test pilot who was also responsible for a large part of the demonstrator’s transfer from the wind tunnel to flight testing. He formulated the most important lessons learned in this paper and finally reviewed and improved it before submission.

Conflicts of Interest

The authors declare no conflict of interest.

References

  1. Munk, M. The Minimum Induced Drag of Aerofoils; NACA-TR-121; National Aeronautics and Space Administration (NASA): Washington, DC, USA, 1923.
  2. Prandtl, L. Induced Drag of Multiplanes; NACA-TN-182; National Aeronautics and Space Administration (NASA): Washington, DC, USA, 1924.
  3. Lange, R.H.; Cahill, J.F.; Bradley, E.S.; Eudaily, R.R.; Jenness, C.M.; MacWilkinson, D.G. Feasibility Study of the Transonic Biplane Concept for Transport Aircraft Application; NASA-CR-132462; Lockheed-Georgia Company: Marietta, GA, USA, 1974. [Google Scholar]
  4. Wolkovitch, J. The joined wing—An overview. J. Aircr. 1986, 23, 161–178. [Google Scholar] [CrossRef]
  5. Frediani, A.; Cipolla, V.; Rizzo, E. The PrandtlPlane Configuration: Overview on Possible Applications to Civil Aviation, Variational Analysis and Aerospace Engineering: Mathematical Challenges for Aerospace Design; Springer: New York, NY, USA, 2012; Volume 66, pp. 179–210. [Google Scholar]
  6. Cavallaro, R.; Demasi, L. Challenges, ideas, and innovations of joined-wing configurations: A concept from the past, an opportunity for the future. Prog. Aerosp. Sci. 2016, 87, 1–93. [Google Scholar] [CrossRef]
  7. Demasi, L.; Monegato, G.; Dipace, A.; Cavallaro, R. Minimum induced drag theorems for joined wings, closed systems, and generic biwings: Theory. J. Optim. Theory Appl. 2016, 169, 200–235. [Google Scholar] [CrossRef]
  8. Demasi, L.; Monegato, G.; Rizzo, E.; Cavallaro, R.; Dipace, A. Minimum induced drag theorems for joined wings, closed systems, and generic biwings: Applications. J. Optim. Theory Appl. 2016, 169, 236–261. [Google Scholar] [CrossRef]
  9. Cavallaro, R.; Nardini, M.; Demasi, L. Amphibious PrandtlPlane: Preliminary Design Aspects Including Propellers Integration and Ground Effect. In Proceedings of the 56th AIAA/ASCE/AHS/ASC Structures, Structural Dynamics, and Materials Conference, Kissimmee, FL, USA, 5–9 January 2015. [Google Scholar] [CrossRef]
  10. Cipolla, V.; Frediani, A.; Lonigro, E. Aerodynamic design of a light amphibious PrandtlPlane: Wind tunnel tests and CFD validation. Aerotec. Missili Spazi. 2016, 94, 113–123. [Google Scholar] [CrossRef]
  11. Cipolla, V.; Frediani, A.; Oliviero, F.; Rossi, R.; Rizzo, E.; Pinucci, M. Ultralight amphibious PrandtlPlane: The final design. Aerotec. Missili Spazi. 2016, 95, 125–135. [Google Scholar] [CrossRef]
  12. Ligetti-Stratos.com. Available online: http://ligeti-stratos.com/ (accessed on 1 December 2017).
  13. The History of the SUNNY-Boxwing. Available online: http://www.sunny-boxwing.de/ (accessed on 1 December 2017).
  14. Danilecki, S. Zamknięte Skrzydło—Zalety i Wady (I); Technika Lotnicza i Astronautyczna, No. 9; Oficyna Wydawnicza SIMP Simpress: Warszawa, Poland, 1988; pp. 4–6. (In Polish) [Google Scholar]
  15. Danilecki, S. Zamknięte Skrzydło—Zalety i Wady (II); Technika Lotnicza i Astronautyczna, No. 10; Oficyna Wydawnicza SIMP Simpress: Warszawa, Poland, 1988; pp. 8–10. (In Polish) [Google Scholar]
  16. Galinski, C. Results of Testing of Models of Joined-Wing Utility Class Aircraft; SAE Paper No. 921013; SAE International: Warrendale, PA, USA, 1992. [Google Scholar]
  17. Mamla, P.; Galinski, C. Basic induced drag study of the joined-wing aircraft. J. Aircr. 2009, 46, 1438–1440. [Google Scholar] [CrossRef]
  18. Livne, E.; Weisshaar, T.A. Aeroelasticity of nonconventional airplane configurations—Past and future. J. Aircr. 2003, 40, 1047–1065. [Google Scholar] [CrossRef]
  19. Rasmussen, C.C.; Canfield, R.A.; Blair, M. Joined-wing sensor-craft configuration design. J. Aircr. 2006, 43, 1470–1478. [Google Scholar] [CrossRef]
  20. Cavalaro, R.; Demasi, L.; Passariello, A. Nonlinear analysis of PrandtlPlane joined wings: Effects of anisotropy. AIAA J. 2014, 52, 964–980. [Google Scholar] [CrossRef]
  21. Goraj, Z.; Kulicki, P.; Lasek, M. Aircraft stability analysis for strongly coupled aerodynamic configuration. J. Theor. Appl. Mech. 1997, 35, 137–158. [Google Scholar]
  22. Galiński, C.; Hajduk, J. Assumptions of the joined wing flying model programme. Trans. Inst. Aviat. 2015, 238, 7–21. [Google Scholar] [CrossRef]
  23. Galinski, C.; Hajduk, J.; Kalinowski, M.; Seneńko, K. The concept of the joined wing scaled demonstrator programme. In Proceedings of the CEAS ’2013 Conference, Linkoping, Sweden, 16–18 September 2013; pp. 244–253. [Google Scholar]
  24. Galiński, C.; Stalewski, W.; Lis, M.; Hajduk, J. Overview of the Inverted Joined Wing Scaled Demonstrator Programme. In Proceedings of the ICAS ’2016 Conference, Daejeon, Korea, 25–30 September 2016. [Google Scholar]
  25. Stalewski, W. Parametric modelling of aerodynamic objects—The key to successful design and optimisation. Aerotec. Missili Spazi. 2012, 91, 23–31. [Google Scholar]
  26. Stalewski, W.; Żółtak, J. The preliminary design of the air-intake system and the nacelle in the small aircraft-engine integration process. Aircr. Eng. Aerosp. Technol. 2014, 86, 250–258. [Google Scholar]
  27. Stalewski, W.; Żółtak, J. Design of a turbulent wing for small aircraft using multidisciplinary optimization. Arch. Mech. 2014, 66, 185–201. [Google Scholar]
  28. Goetzendorf-Grabowski, T.; Mieloszyk, J.; Mieszalski, D. MADO—Software Package for High Order Multidyscyplinary Aircraft Design and Optimisation. In Proceedings of the ICAS 2012, Brisbane, Australia, 23–28 September 2012. [Google Scholar]
  29. Mieloszyk, J. Handling Optimization Problems on an Example of Micro UAV. In Proceedings of the 3rd CEAS Air & Space Conference, Venice, Italy, 24–28 October 2011. [Google Scholar]
  30. Kalinowski, M. Structural optimization of box wing aircraft. Arch. Mech. Eng. 2015, LXII, 45–60. [Google Scholar] [CrossRef]
  31. Galiński, C.; Bartkiewicz, P.; Hajduk, J.; Lamers, P. Results of the J-5 Marco Dynamic Similar Model Flight Tests Program; SAE Paper No. 975551; SAE International: Warrendale, PA, USA, 1997. [Google Scholar]
  32. Goraj, Z.; Szender, M. Badania modelu samolotu w locie na dużych kątach natarcia. In Proceedings of the VI Konferencja “Metody i Technika Badań Statków Powietrznych w Locie”, Mrągowo, Poland, 15–18 June 2004; pp. 143–153. (In Polish). [Google Scholar]
  33. Goraj, Z.; Szender, M. Techniques and critical technologies applied for small and mini UAVs—State of the art and development perspectives. Trans. Inst. Aviat. 2005, 183, 41–49. [Google Scholar]
  34. Goraj, Z.; Kittmann, K.; Voit-Nitschmann, R.; Szender, M. Design and Integration of Flexi-Bird—A Low Cost Sub-Scale Research Aircraft for Safety and Environmental Issues. In Proceedings of the ICAS Congress 2012, Brisbane, Australia, 23–28 September 2012. [Google Scholar]
  35. Piwek, K.; Wiśniowski, W. Small air transport aircraft entry requirements evoked by FlightPath 2050. Aircr. Eng. Aerosp. Technol. 2016, 88, 341–347. [Google Scholar] [CrossRef]
  36. Iwaniuk, A.; Wiśniowski, W.; Żółtak, J. Multi-Disciplinary Optimisation Approach for a Light Turboprop Aircraft-Engine Integration and Improvement. Aircr. Eng. Aerosp. Technol. 2016, 88, 348–355. [Google Scholar] [CrossRef]
  37. Lis, M.; Galinski, C. Predicted performance of the inverted joined wing scaled demonstrator. Aviation 2015, 19, 123–132. [Google Scholar] [CrossRef]
  38. Lis, M.; Dziubiński, A.; Galinski, C.; Krysztofiak, G.; Ruchała, P.; Surmacz, K. Predicted Flight Characteristics of the Inverted Joined Wing Scaled Demonstrator. In Proceedings of the ICAS ’2014 Conference, St. Petersburg, Russia, 7–12 September 2014. [Google Scholar]
  39. Dziubiński, A.; Kuprianowicz, S.; Surmacz, K.; Galinski, C.; Żółtak, J. The Joined Wing Scaled Demonstrator Results of CFD. In Proceedings of the ICAS ’2014 Conference, St. Petersburg, Russia, 7–12 September 2014. [Google Scholar]
  40. Galinski, C.; Krysztofiak, G.; Miller, M.; Ruchala, P.; Kalski, M.; Lis, M.; Dziubinski, A.; Bogdanski, K.; Stefanek, Ł.; Hajduk, J. Wind tunnel test results of the inverted joined wing airplane flying model. Aircr. Eng. Aerosp. Technol. 2016, in press. [Google Scholar]
  41. Stalewski, W. Aerodynamic Optimisation of Joined-Wing Aeroplane. In Proceedings of the 6th International Conference on 6th Experiments/Process/SystemModelling/Simulation/Optimization, Athens, Greece, 8–11 July 2015. [Google Scholar]
  42. Kalinowski, M. Automatic Design and Sizing of Inverted Joined-Wing Aircraft. In Proceedings of the 58th AIAA/ASCE/AHS/ASC Structures, Structural Dynamics, and Materials Conference, Grapevine, TX, USA, 9–13 January 2017. [Google Scholar]
  43. Mieloszyk, J. Practical problems of numerical optimization in aerospace sciences. Aircr. Eng. Aerosp. Technol. 2017, 89. [Google Scholar] [CrossRef]
  44. Sieradzki, A.; Dziubinski, A.; Galinski, C. Performance comparison of the optimized inverted joined wing airplane concept and classical configuration airplanes. Arch. Mech. Eng. 2016, 63, 455–470. [Google Scholar]
  45. Bogdański, K.; Krusz, W.; Rodzewicz, M.; Rutkowski, M. Design and Optimization of Low Speed Ducted Fan for a New Generation of Joined Wing Aircraft. In Proceedings of the 29th Congress of the International Council of the Aeronautical Sciences (ICAS), St. Petersburg, Russia, 7–12 September 2014. [Google Scholar]
  46. Rodzewicz, M.; Bogdański, K.; Ruchała, P.; Miller, M. Koncepcja i Realizacja Badań Zespołu Napędowego W Tunelu Aerodynamicznym. In Proceedings of the XVI Konferencji Mechanika w Lotnictwie, Kazimierz Dolny, Poland, 26–29 May 2014. (In Polish). [Google Scholar]
  47. Głowacki, D. Rodzewicz, Badania Dynamiczne Wirnika Napędu Otunelowanego Samolotu MOSUPS. In Proceedings of the XVI Konferencji Mechanika w Lotnictwie, Kazimierz Dolny, Poland, 26–29 May 2014. (In Polish). [Google Scholar]
  48. Bogdański, K.; Głowacki, D.; Rodzewicz, M. Research on the rotor of a ducted fan propulsion system of MOSUPS aircraft taking into account self balance during operation. Solid State Phenom. 2016, 240, 191–197. [Google Scholar]
  49. Bogdański, K.; Rodzewicz, M.; Ruchała, P. Characteristics of Locked and Free Wheeling Ducted Fan Based on Wind Tunnel Tests and CFD Analyses. In Proceedings of the 5th CEAS Air & Space Conference Challenges in European Aerospace, Delft, The Netherlands, 7–11 September 2015. [Google Scholar]
  50. Ruchala, P. Wind tunnel tests of the pusher propeller—An assessment of accuracy. J. KONES Powertrain Transp. 2016, 23, 309–315. [Google Scholar] [CrossRef]
  51. Turnigy RotoMax 1.60 Brushless Outrunner Motor. Available online: https://hobbyking.com/en_us/turnigy-rotomax-1-60-brushless-outrunner-motor.html (accessed on 29 May 2017).
  52. HobbyKing YEP 120A HV (4~14S) Brushless Speed Controller (OPTO). Available online: https://hobbyking.com/en_us/hobbyking-yep-120a-hv-4-14s-brushless-speed-controller-opto.html (accessed on 29 May 2017).
  53. Fiala. Available online: http://vrtule-fiala.cz/en/ (accessed on 29 May 2017).
  54. Galinski, C.; Sieradzki, A.; Kalinowski, M. Propulsion configuration effect on performance of an inverted joined wing airplane. J. KONES Powertrain Transp. 2016, 23, 136–141. [Google Scholar]
  55. Burtton, K. The buzz over batteries. Aerosp. Am. 2016, 54, 16–22. [Google Scholar]
  56. SDSA. Dynamic Stability Analyser. Available online: https://www.meil.pw.edu.pl/add/ADD/Teaching/Software/SDSA (accessed on 29 May 2017).
  57. Goetzendorf-Grabowski, T.; Mieszalski, D.; Marcinkiewicz, E. Stability analysis using SDSA tool. Prog. Aerosp. Sci. 2011, 47, 636–646. [Google Scholar] [CrossRef]
  58. PANUKL. Package to Compute the Aerodynamic Characteristics of an Aircraft Using Low Order Panel Method. Available online: https://www.meil.pw.edu.pl/add/ADD/Teaching/Software/PANUKL (accessed on 29 May 2017).
  59. Blair, M.; Robinson, J.; McClelland, W.A.; Bowmann, J.C. A Joined Wing Flight Experiment; AFRL-RB-WP-TR-2008-3101; Air Force Research Laboratory: Dayton, OH, USA, 2008.
  60. Oliviero, F.; Zanetti, D.; Cipolla, V. Flight dynamics model for preliminary design of PrandtlPlane wing configuration with sizing of the control surfaces. Aerotec. Missili Spazi. 2016, 95, 201–210. [Google Scholar] [CrossRef]
Figure 1. Distance between wings in conventional and inverted joined wings. Variation with angle of attack.
Energies 10 00762 g001
Figure 2. (a) Three views of the inverted joined wing demonstrator; and (b) demonstrator in the wind tunnel.
Energies 10 00762 g002
Figure 3. (a) Propulsion unit characteristics: Pe—motor electric power, PN—effective power, η—total efficiency, T—thrust; and (b) power available versus airspeed for several flight altitudes.
Energies 10 00762 g003
Figure 4. (a) Maximum climb rate versus airspeed for several flight altitudes; and (b) maximum range and endurance versus airspeed for simple cruise mission.
Energies 10 00762 g004
Figure 5. Electric/electronic system architecture of the demonstrator. CCD: charge-coupled device.
Energies 10 00762 g005
Figure 6. Picture taken from the demonstrator during the approach for landing after the first flight. Distance between the pilot and the airplane was at this point close to the furthest distance that occurred during the whole flight test program.
Energies 10 00762 g006
Figure 7. (a) Replacement of the batteries in the wind tunnel; and (b) replacement of the batteries during flight testing—compartment previously used for the aerodynamic balance was now used for the battery installation (photos took by Adam Dziubiński).
Energies 10 00762 g007
Figure 8. Example of discharge characteristics of the propulsion battery after 1.5 years of use. Discharge current: 2.3 A.
Energies 10 00762 g008
Figure 9. Schedule of batteries’ application in the research project.
Energies 10 00762 g009
Figure 10. Test stand for propulsion testing. (a) Side view; and (b) aft view.
Energies 10 00762 g010
Figure 11. Concept of the inverted joined wing airplane with distributed propulsion.
Energies 10 00762 g011
Figure 12. Center of gravity, neutral point position, and local axis system convention (Łukasz Stefanek).
Energies 10 00762 g012
Figure 13. Elevator deflection required to trim the airplane in steady level powered flight: (a) with respect to the angle of attack; and (b) with respect to the airspeed.
Energies 10 00762 g013
Figure 14. Neutral point position variation with the angle of attack (note that reference system begins at the “engine frame”, see Figure 12).
Energies 10 00762 g014
Figure 15. The airplane’s aerodynamic characteristics’ variation with the centre of gravity (CG) position: (a) CL/CD ratio; and (b) power coefficient CL3/CD2 with respect to the airspeed.
Energies 10 00762 g015
Figure 16. Variation in the airplane’s performance with the CG position: (a) maximum climb rate; and (b) range and flight duration with respect to the airspeed.
Energies 10 00762 g016
Figure 17. The airplane geometry mesh used for aerodynamic calculations: (a) baseline geometry; and (b) vertical stabilizer moved 0.06 m aft.
Energies 10 00762 g017
Figure 18. Dynamic stability characteristics of the airplane with the most aft CG and vertical stabilizer location. Time to halve the amplitude of the oscillations: (a) phugoid motion; and (b) Dutch roll motion.
Energies 10 00762 g018
Figure 19. Variation in the airplane’s aerodynamic characteristics with the CG position: (a) CL/CD ratio; and (b) power coefficient CL3/CD2 with respect to the airspeed.
Energies 10 00762 g019
Figure 20. Variation in the airplane’s performance with the thrust vector position: (a) maximum climb rate; and (b) range and flight duration with respect to the airspeed.
Energies 10 00762 g020
Figure 21. The airplane with ducted fan propulsion (photo took by Krzysztof Bogdański).
Energies 10 00762 g021
Figure 22. The ducted fan propulsion performance: PN—effective power, Pe—motor electric power, η—total efficiency, T—thrust.
Energies 10 00762 g022
Figure 23. Variation in the airplane’s aerodynamic characteristics with CG position for the configuration with a ducted fan: (a) CL/CD ratio; and (b) power coefficient CL3/CD2 with respect to the airspeed.
Energies 10 00762 g023
Figure 24. Variation in the airplane’s performance with the thrust vector position: (a) maximum climb rate; (b) range and flight duration with respect to the airspeed.
Energies 10 00762 g024
Figure 25. Dynamic stability characteristics of the airplane with ducted fan propulsion. Time to halve the amplitude of oscillations: (a) phugoid motion; and (b) Dutch roll motion.
Energies 10 00762 g025
Table 1. Electric propulsion system applied in the joined wing demonstrator.
Motor: Turnigy RotoMax 1.60 [51]Voltage (V)37
Maximum current (A)80
Mass (g)849
Nominal power/RPM2960/8550
Electronic Speed Controller: YEP 120 [52]Maximum Continuous Current (A)120
Mass (g)100
Battery: Li-Fe 4p12s (48 Cell)Nominal Voltage (V)39.6
Capacity (Ah)9.6
Maximum Continuous Current (A)200
Mass (g)4100
Propeller: Fiala 20 × 10 E [53]

