
Measuring Energy Efficiency in China’s Transport Sector

State Key Laboratory of Automotive Safety and Energy, Tsinghua University, Beijing 100084, China
*
Author to whom correspondence should be addressed.
Energies 2017, 10(5), 660; https://doi.org/10.3390/en10050660
Submission received: 10 December 2016
/
Revised: 18 April 2017
/
Accepted: 20 April 2017
/
Published: 9 May 2017
Abstract
:Energy efficiency is one of the key factors affecting energy consumption and greenhouse gas (GHG) emissions. By focusing on China’s transport sector, this study comprehensively reviews and compares the energy efficiency performance of passenger vehicles, light-duty commercial vehicles, commercial road transport, commercial water transport, aviation transport and railway transport, and identifies the opportunities for further energy efficiency improvements. It is found that railway transport exhibited the greatest improvement in energy efficiency during the past decade, which was mainly driven by progress in its electrification. Passenger vehicles have also experienced considerable energy efficiency improvements, which can be mainly attributed to the establishment of mandatory fuel consumption standards. In contrast, commercial road transport has shown the least improvement, due to insufficient policy implementations. Based on the analysis, it is recommended that, as China’s present policy framework to improve energy efficiency in the transport sector is generally effective, it should be consistently maintained and successively improved. Electrification represents a major opportunity for improvement of energy efficiency in the transport sector. Such potential should be fully tapped for all transport modes. Greater effort should be put into improving the energy efficiency of commercial road transport. The policy instruments utilized to improve the energy efficiency of heavy-duty vehicles should be as intensive and effective as the policy instruments for passenger vehicles.
1. Introduction
Transport is the movement of passengers or freight from one location to another, which is normally driven by economic purposes. Global transport activities experienced rapid growth during the past century. One representative example is the growth of global car sales, which increased from 29 million in 1980 to over 65 million in 2014 [1]. Accordingly, transport has become a major sector of energy consumption and greenhouse gas (GHG) emissions [2,3]. As reported by the IPCC in 2014, the transport sector was responsible for around half of global petroleum consumption [4]. IEA (International Energy Agency) estimated that CO2 emissions from the transport sector accounted for 23% of global energy-related CO2 emissions in 2013 [5].
Driven by rapid economic growth and the urbanization process, China’s transport volume experienced rapid growth in recent years. Total passenger transport volume increased from 1.226 trillion pkm (passenger-kilometers) in 2000 to 3.010 trillion pkm in 2014, and total freight transport volume increased from 4.432 trillion tkm (ton-kilometer) in 2000 to 18.584 trillion tkm in 2014, implying annual growth rates of 6.6% and 10.8%, respectively [6]. Driven by the prevalence of household cars, China’s domestic vehicle sales increased dramatically from 1.2 million in 2000 to 21.1 million in 2015, with an annual growth rate of 21.1% [7]. Accordingly, energy consumption and GHG emissions from China’s transport sector increased significantly [8]. In 2013, China’s transport sector was responsible for 10.2% of global transport sector CO2 emissions [5]. This share is expected to increase further in the coming decades [9]. On the other hand, China is facing great challenges in energy security and climate change mitigation. As specified in the ‘U.S.-China Joint Announcement on Climate Change’, China has promised to peak its total CO2 emissions before 2030 [10]. Under such a circumstance, China has an urgent need to reduce energy consumption and GHG emissions from the transport sector.
To cope with these challenges, multiple measures have been taken [11,12], including transport demand management [13], energy efficiency improvement [14] and fuel carbon intensity reduction [15,16]. Among these measures, improvement of energy efficiency plays an essential role [17,18,19]. By using a Logarithmic Mean Divisia Index (LMDI) approach, Guo et al. demonstrated that improvement of energy efficiency was the major factor in alleviating the growth of CO2 emissions in China’s transport sector during the past decade [20]. China has established a quite mature policy framework to promote energy efficiency improvements. Representative policy instruments include the mandatory fuel consumption standards for passenger vehicles [21], financial incentives for energy-efficient technologies [22,23], decomposition of energy efficiency targets through administrative orders, and others. Under the impact of these policies, energy efficiency in China’s transport sector has experienced significant changes in recent years.
Existing studies have intensively examined the energy efficiency performance of China’s transport sector. Most studies focused on energy efficiency of a single transport mode, such as railway transport [24], aviation transport [25], road transport [26], etc. There have also been studies comparing energy efficiency across different transport modes. Mao et al. compared the energy and emissions factors across different transport modes, finding that railway transport has the highest energy efficiency, followed by water transport and road transport [27]. However, due to data availability, the time-series of energy efficiency employed in the analysis were only from 2002 to 2007, limiting the observation from a larger temporal scale. Existing studies have provided a solid basis for energy efficiency analysis in China’s transport sector. However, as the methods to measure energy efficiency in existing studies are quite diversified, the comparability among these studies is low. Furthermore, due to the lack of comparison across different transport modes, the policy implications from existing studies are generally quite limited.
With the aim of filling such a gap, this study defines two basic methods to measure energy efficiency in the transport sector. Based on these methods, the energy efficiency performance of passenger vehicles, light-duty commercial vehicles, commercial road transport, commercial water transport, aviation transport and railway transport in China’s transport sector is comprehensively reviewed and compared. Based on the analysis, this study aims to identify the major opportunities for further improvement of energy efficiency in China’s transport sector. Theoretically, this study contributes to establishing the methodological framework for energy efficiency measurement in the transport sector; empirically, this study contributes to comprehensively summarizing and comparing the energy efficiency performance of China’s different transport modes, which provides the basis for shaping energy efficiency policies for the whole transport sector. The whole paper is organized as follows. The next section defines the two basic methods for measuring energy efficiency in the transport sector. Following that, the energy efficiency in China’s transport sector is reviewed. The subsequent section compares energy efficiency across different transport modes and proposes policy recommendations. The final section concludes the whole study.
2. Energy Efficiency Measurement
Broadly, energy efficiency is defined as the useful output of a process based on a unit of energy input into the process [28]. For the transport sector, the definition of energy efficiency can be interpreted as the transport volume output based on a unit of energy consumption. Additionally, multiple other indicators related to energy efficiency are also frequently used as alternatives, such as energy intensity (energy consumption required for a unit of transport volume), fuel consumption rate (FCR, fuel consumption per unit of transport volume), CO2 emissions rate (CER, CO2 emissions per unit of transport volume), etc. [29,30]. The units used to measure transport volume and energy consumption are also quite diversified. Units frequently used to measure transport volume include ton or passenger-kilometer (tkm, pkm), ton-nautical mile (tnm), vehicle-kilometer (vkm), etc.; units frequently used to measure energy consumption include gram of coal equivalent (gce), kilogram of coal equivalent (kgce), ton of coal equivalent (tce), megaJoule (MJ) per liter or per kg, etc. In this study, the indicators and units used for each transport mode are generally based on the common terminology. For example, for passenger vehicles, the indicator of FCR with the unit of L/100 km is used to describe energy efficiency, which is consistent with the indicators and units used in the national standards.
Energy efficiency in the transport sector can be measured by using two basic methods, which in this study are defined as the ‘statistical method’ and the ‘test cycle method’. The basic rationale of these two methods is presented in Figure 1. A detailed comparison of the two methods is provided in Table 1. To some extent, the statistical method means the top-down method, and the test cycle method means the bottom-up method. Van Wee et al. [31] analyzed the advantages and disadvantages of both methods. The top-down method is easy to calculate, due to the few indicators. However, it neglects the differences in characteristics of individual vehicles. The bottom-up method explicates the difference, but is time-consuming. Besides, this method requires a large amount of data to support the results. It is difficult to take all factors into consideration. These advantages and disadvantages also exist in the statistical method and test cycle method in this paper. As a result, this study uses as detailed and comprehensive data as possible to offset the weakness of the methods.
2.1. Statistical Method
Under the statistical method, energy efficiency is calculated by using macro-level statistical data. A typical calculation is to divide total energy consumption by transport volume of a certain vehicle fleet, as Equation (1) shows. The energy efficiency derived through the statistical method reflects the real-world, average energy efficiency of the target vehicle fleet. The precondition for using the statistical method is that both energy consumption and transport volume are available in the statistics. This is the case for transport modes like water transport, aviation transport, and railway transport, where macro-level indicators are under the supervision of competent authorities. However, for the transport modes dominated by private and distributed activities, such as passenger vehicles, the transport volume cannot be fully grasped by the authorities. Therefore, the statistical method is rarely applied for such transport modes. As energy efficiency measured by the statistical method reflects the macro-level performance, it is commonly used as the essential indicator in shaping energy efficiency policy targets:
where, is the energy efficiency of vehicle fleet p in year i (energy consumption per unit of transport volume); is the energy consumption of vehicle fleet p in year i (gce, MJ, L, kg, etc.); is the transport volume of vehicle fleet p in year i (km, tkm, pkm, vkm, etc.).
2.2. Test Cycle Method
Under the test cycle method, energy efficiency is derived through standard test procedures, normally with specified vehicle loads, driving conditions and engine outputs. The physical implication behind the energy efficiency derived through test cycle method is the nominal (as comparison to real-world) energy efficiency of the tested vehicle model (as comparison to the target vehicle fleet). Different from the statistical method, the test cycle method focuses only on a single vehicle model rather than the whole vehicle fleet. Theoretically and in reality, the test cycle method is applicable for all transport modes. As the test cycle method is technology orientated and focused, it is commonly used as the basis for setting technical standards.
Currently, based on the statistical method and test cycle method, the energy efficiency of most transport modes have been recorded by China’s major government agencies, including the Ministry of Transport (MOT), Ministry of Industry and Information Technology (MIIT), Civil Aviation Administration of China (CAAC), National Railway Administration (NRA), National Development and Reform Commission (NDRC) and the China Machinery Industry Federation (CMIF), as summarized in Table 2.
3. Energy Efficiency Performances
3.1. Passenger Vehicles
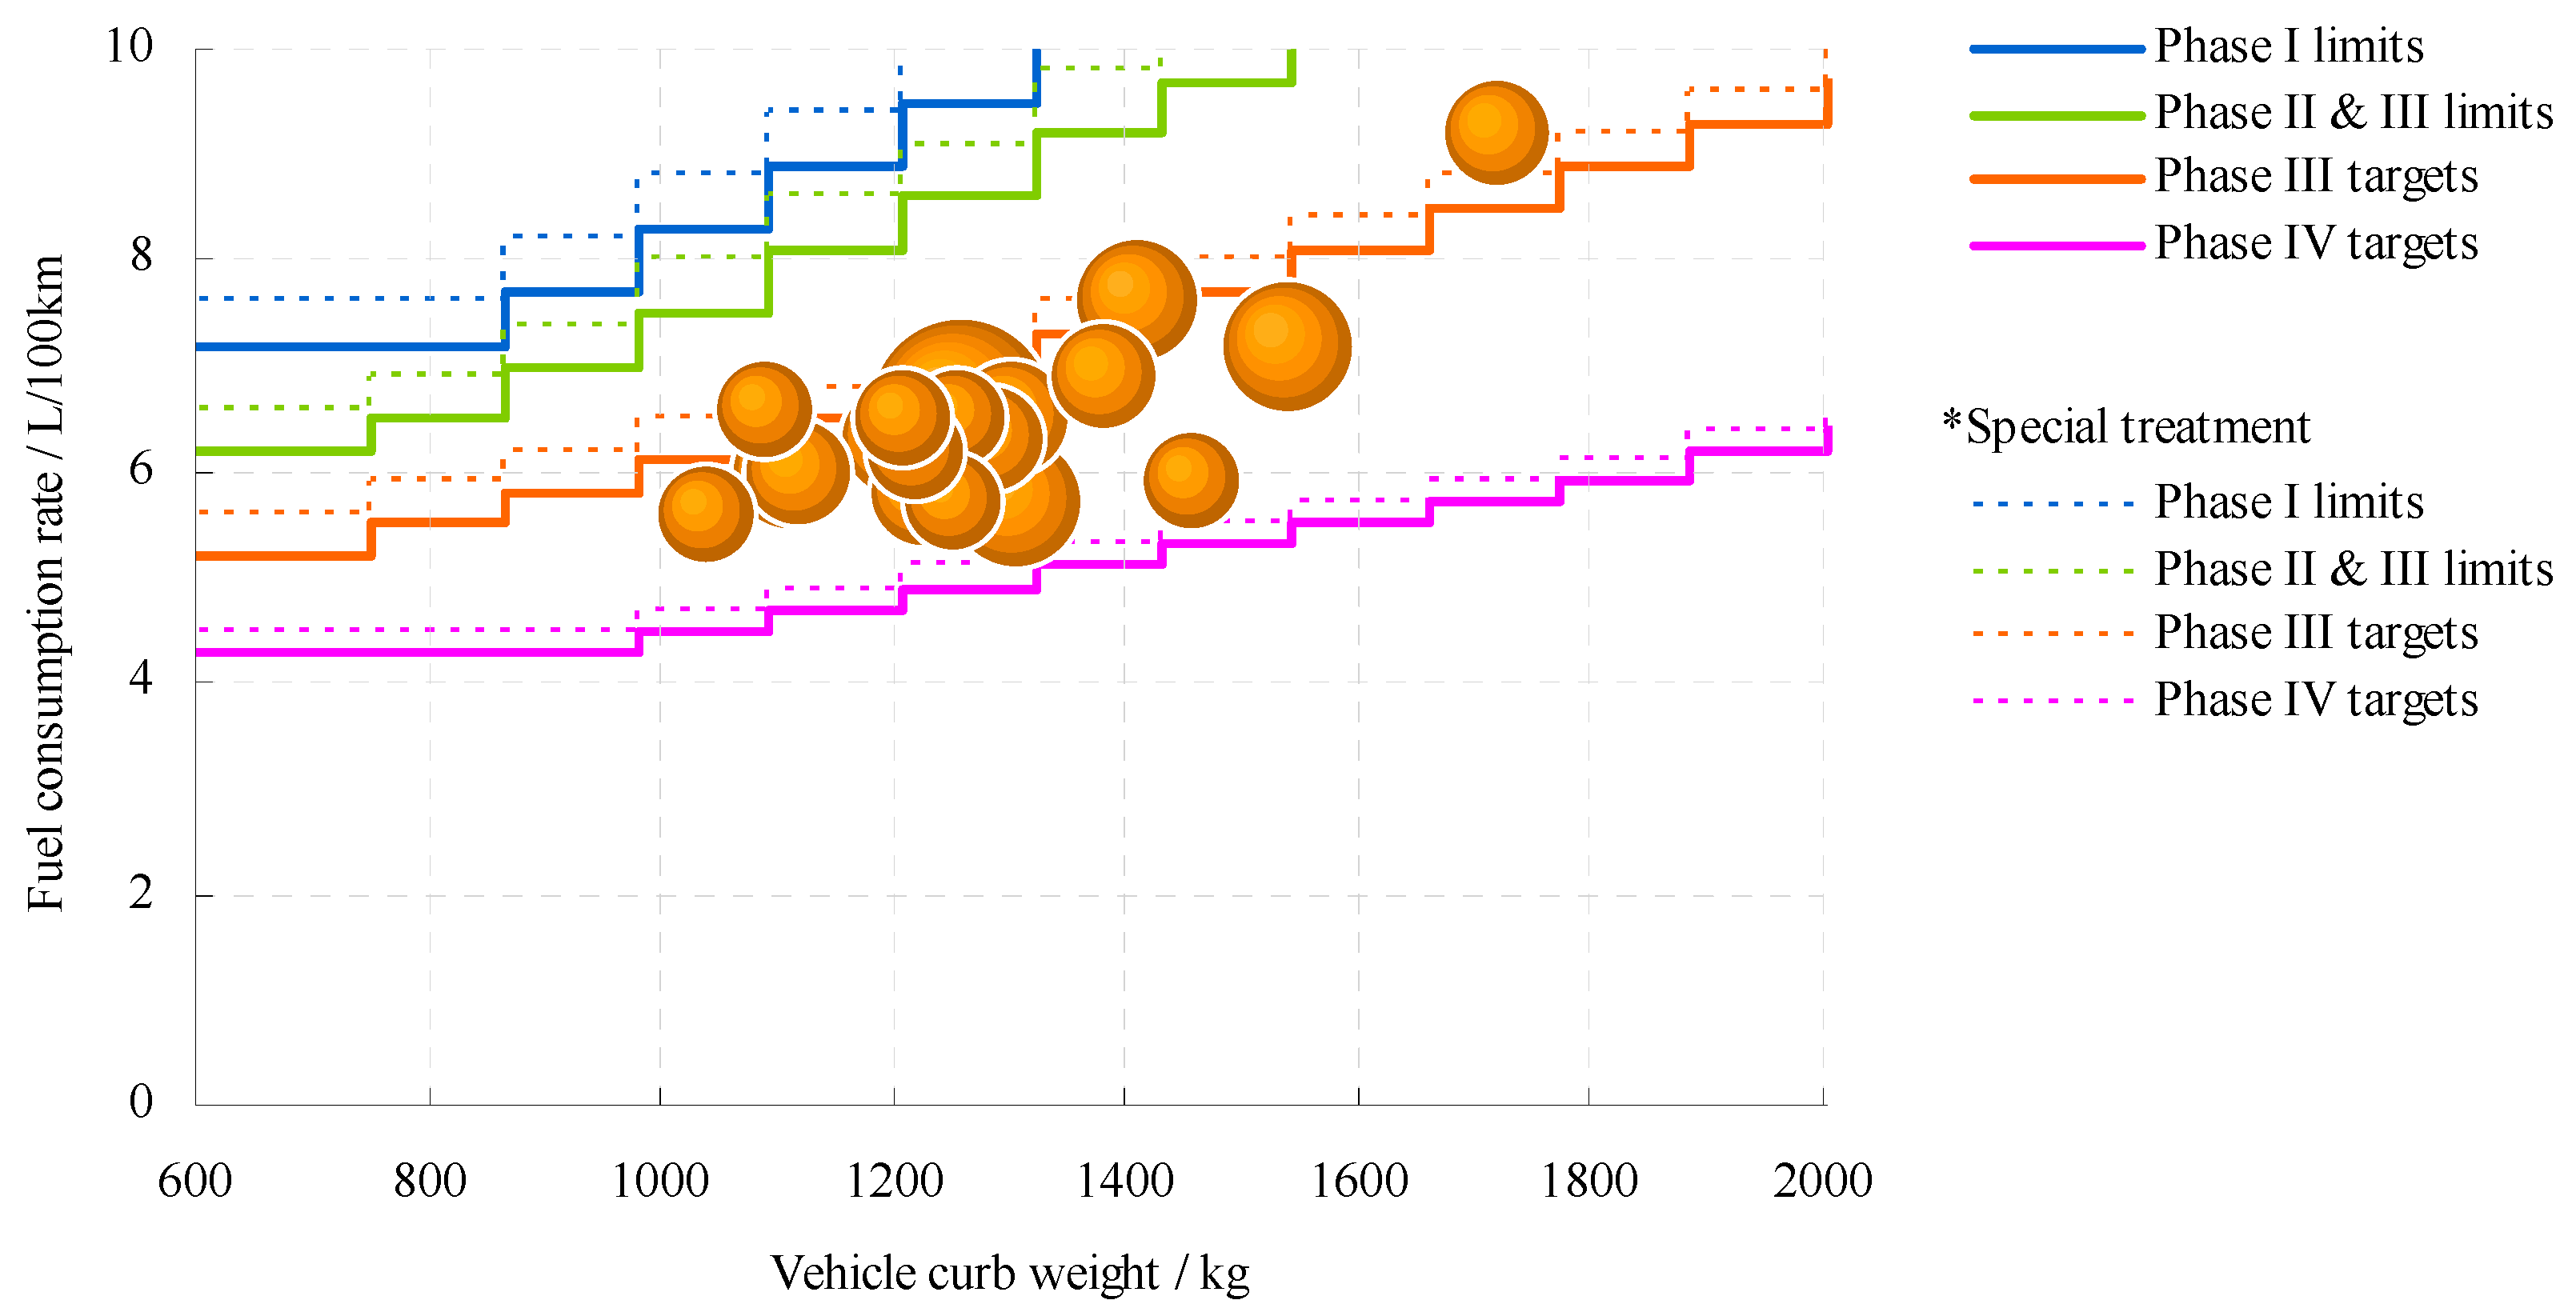
The passenger vehicles in this article include sedans, SUVs and MPVs. As mentioned above, the energy efficiency of passenger vehicles is mainly measured by using the test cycle method. Under the administration of the MIIT, all passenger vehicle models are required to undergo FCR testing to obtain market access qualification. The FCR test records are publicized through the MIIT’s official online database [32]. As specified by the SAC (Standardization Administration of China), the New European Driving Cycle (NEDC) is used as the test cycle [33]. The vehicle curb weight is normally used as the basis for comparing FCRs of different vehicle models. Figure 2 presents the FCRs and curb weights of the most popular passenger vehicle models in China, with the sizes of the bubbles representing their domestic sales in 2015. The FCR targets specified in China’s mandatory fuel consumption standards for passenger vehicles are also illustrated as a comparison [34,35,36,37,38]. It can be found that the FCRs of most popular vehicle models are between phase III and phase IV targets.
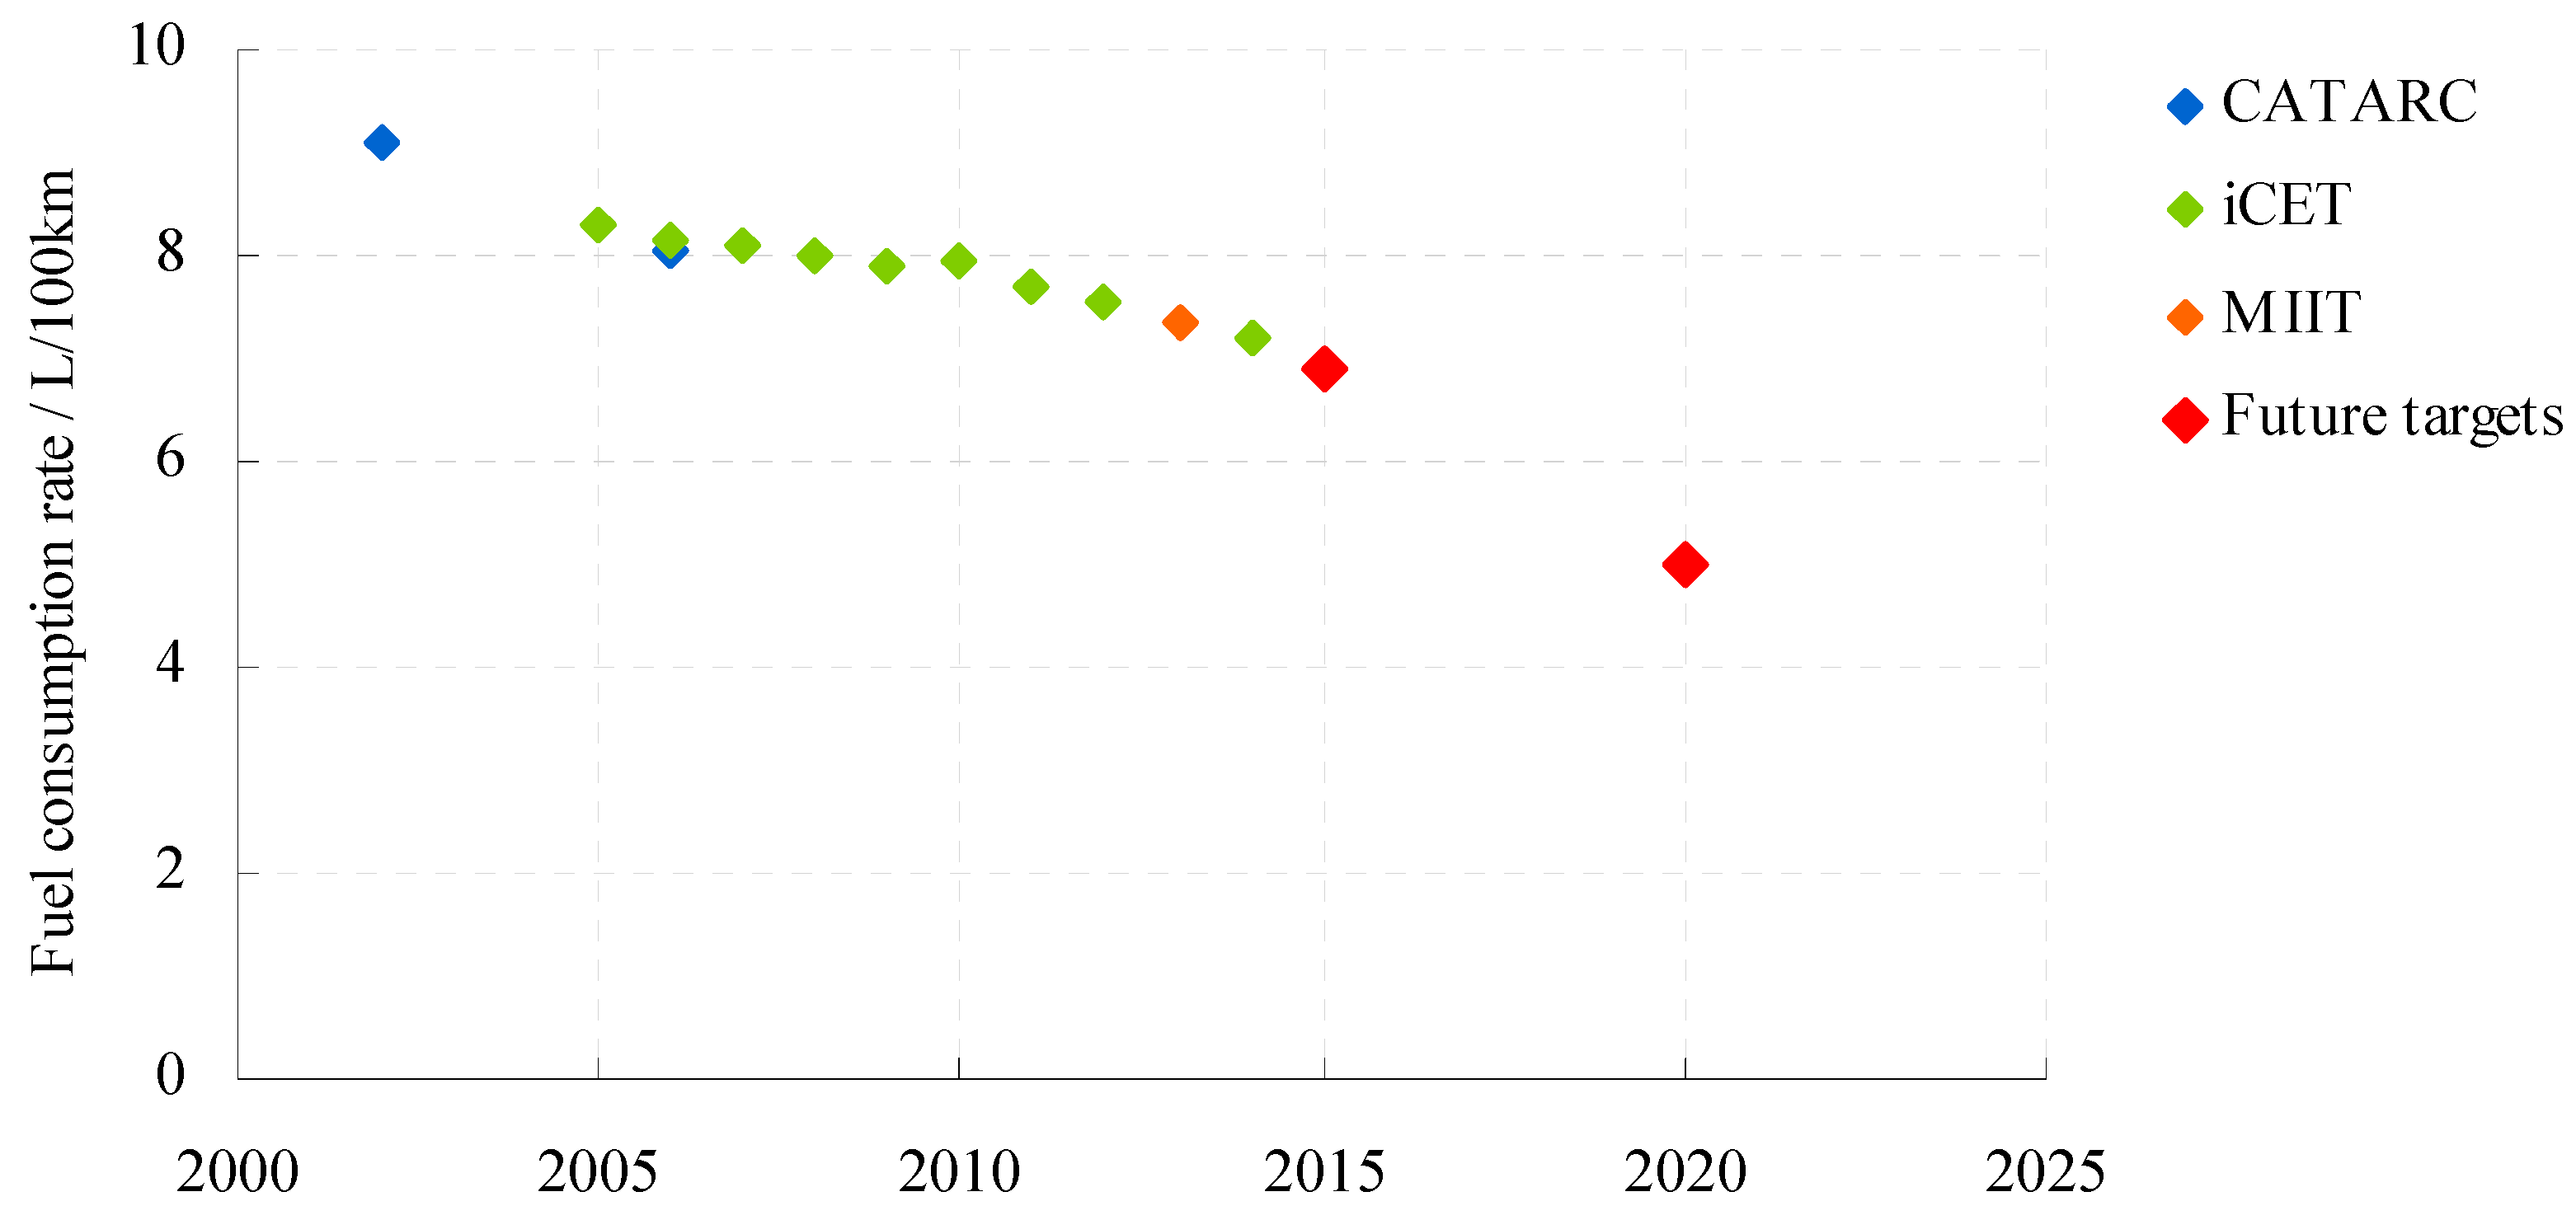
By combining the FCR data with passenger vehicle sales data [7], the sales-weighted average FCR of new passenger vehicles can be calculated, as Equation (2) shows. By using this method, three agencies, the China Automotive Technology and Research Center (CATARC), Innovation Center for Energy and Transportation (iCET) and the MIIT, have calculated the fleet-wide average FCR of new passenger vehicles. CATARC estimated that the FCR decreased from 9.11 L/100 km in 2002 to 8.06 L/100 km in 2006 [39]. iCET provided the most complete time series of FCR estimations, showing a decrease from 8.16 L/100 km in 2006 to 7.22 L/100 km in 2014 [40]. In 2012, the MIIT started to publish its own version of estimation [41].
As Figure 3 shows, the estimations from these three agencies are quite close, all demonstrating a solid decrease of FCR in recent years. By establishing the phase III and phase IV fuel consumption standards for passenger vehicles [34,35,36,37], the MIIT intended to further decrease the fleet average FCR of new passenger vehicles to 6.9 L/100 km in 2015 and 5.0 L/100 km in 2020
Despite the significant improvement, the FCR of passenger vehicles in China is still lagging behind some developed regions and countries. For example, the fleet average FCR of new passenger vehicles in the EU was 27% lower than in China in 2014.
where, is the fleet average fuel consumption rate of passenger vehicles sold in year i (L/100 km); is the fuel consumption rate of model p passenger vehicle sold in year i (L/100 km); is the sales of model p passenger vehicle in year i.
3.2. Light-Duty Commercial Vehicles
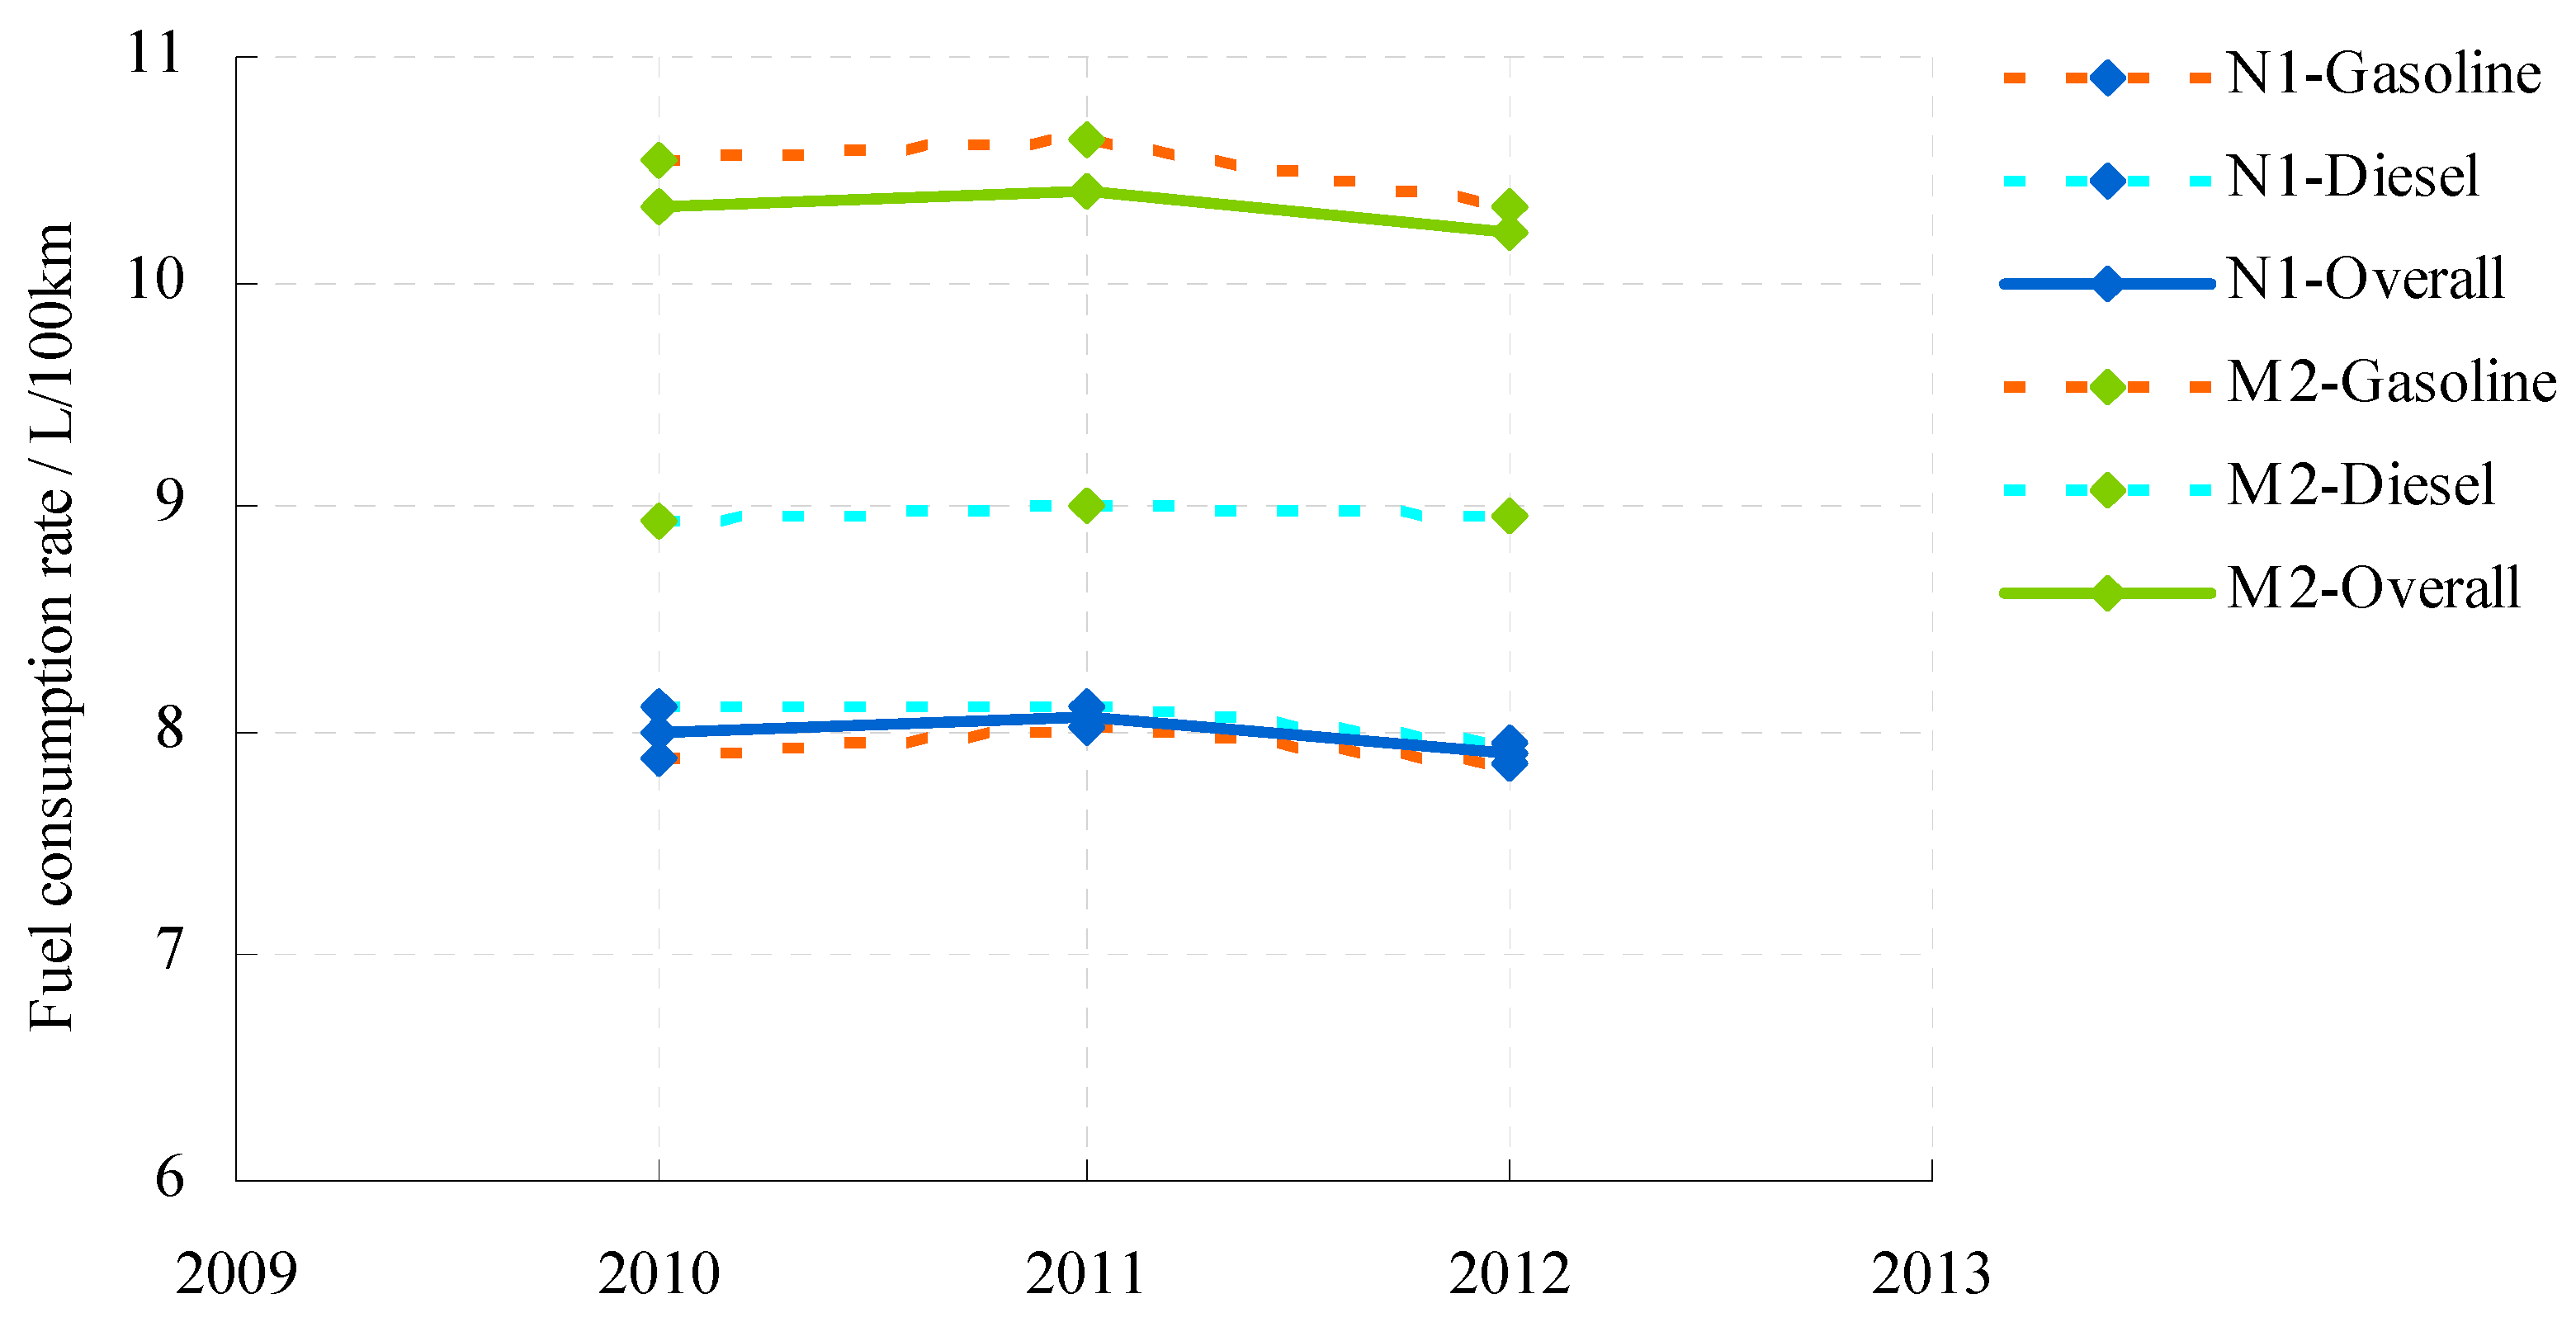
As with passenger vehicles, the FCRs of all light-duty commercial vehicle models also must be tested to obtain market access qualification [42,43]. The test procedure for light-duty commercial vehicles is the same as that for passenger vehicles. The fleet average FCR of new light-duty commercial vehicles from 2010 to 2012 is illustrated in Figure 4 [44]. It can be seen that the average FCR did not change significantly in these three years. The current FCR level is still much higher than the levels in the EU and Japan [44]. This can be attributed to the fact that the stringency of China’s fuel consumption standards for light-duty commercial vehicles is far lower than the world-leading level.
3.3. Commercial Road Transport
Commercial road transport is mainly long-distance, heavy-duty passenger and freight transport, which is typically undertaken by heavy-duty vehicles. The energy efficiency of commercial road transport can be measured both by using the statistical method and the test cycle method. Regarding the statistical method, three major datasets have been used to estimate the energy intensity. The most frequently used estimation is the overall energy intensity, which is calculated by using the sector-wide energy consumption and transport volume of commercial road transport. According to the MOT, this energy intensity decreased from 8.3 kgce/100 tkm in 2005 to 7.9 kgce/100 tkm in 2010 [45]. The overall energy intensity is normally used as the major indicator to set policy targets. As specified in ‘The Twelfth Five-year Plan for Energy Conservation and Emissions Reduction’, this energy intensity was required to decrease further to 7.5 kgce/100 tkm in 2015 [46]. It should be noted that when calculating the total transport volume, passenger transport volume is converted to freight transport volume equivalent by using a conversion factor. The second estimation is based on the fuel consumptions and transport volumes of selected transport enterprises, which have been monitored by the MOT since 2011. The estimated energy intensities were annually reported in the ‘Bulletin of Transport Statistics’ [45], as Table 3 shows. The third estimation is based on the nation-wide transport survey, which is conducted by the MOT every few years [47]. Table 4 compares the estimations based on the 2008 and 2013 surveys. All existing estimations indicate that the energy intensities of heavy-duty vehicles did not change significantly from 2011 to 2014 [45,46]. This reflects the fact that the pace of energy efficiency improvement of heavy-duty vehicles is lagging behind light-duty vehicles. In addition, it should be noted that although all the estimations are based on the statistical method, the units employed to measure energy intensity are quite diversified.
Regarding the test cycle method, both the MIIT and MOT have established their own FCR test procedures for heavy-duty vehicles. The MIIT FCR test procedure is mandatory for all heavy-duty vehicle models, while the MOT FCR test procedure is only mandatory for commercial heavy-duty vehicles. The test cycles employed by the MIIT and MOT test procedures are different. The MIIT FCR test procedure is based on a modified version of the World Transient Vehicle Cycle (WTVC) [48,49]. The MOT FCR test procedure is based on a combination of several constant-speed driving conditions [50,51]. The tested FCRs are used to compare with the specified FCR limits. Although both the MIIT and MOT conduct FCR tests for heavy-duty vehicles, the FCR test records are not available to the public. According to the MIIT, the FCR test records are expected to be revealed to the public in the near future.
3.4. Other Road Vehicles
Besides the road transport modes mentioned above, low-speed trucks and motorcycles are also significant contributors to energy consumption and GHG emissions. As the uses of these two types of road vehicles are mostly private and distributed, their fleet characteristics are difficult to capture. Thus, the statistical method for energy efficiency measurement is not applicable for them. Regarding the test cycle method, the FCR test procedures have been established for both low-speed trucks [52,53] and motorcycles [54,55], which are under the supervisions of the CMIF and NDRC, respectively. Currently, the FCR test records are not available to the public.
3.5. Commercial Water Transport
Both the statistical method and the test cycle method have been applied in measuring energy efficiency of commercial water transport. Regarding the statistical method, as both commercial road and commercial water transport are under the administration of the MOT, the data sources used to estimate energy intensity of commercial water transport are identical with the data sources for commercial road transport. As reported by the MOT, the overall energy intensity of commercial water transport decreased from 7.5 kgce/1000 tkm in 2005 to 7.0 kgce/1000 tkm in 2010 [45], and was projected to decrease further to 6.3 kgce/1000 tkm in 2015 [46]. The energy intensity estimations based on the monitored transport enterprises and nation-wide transport survey can be found in Table 3 and Table 4. It can also be found that the energy intensity improvement during the past decade was quite limited.
Regarding the test cycle method, both the MIIT and MOT have established their own energy efficiency test procedures. The MOT test procedure is mandatory for all commercial vessels [56,57]. Under the MOT test procedure, energy efficiency is described in the forms of FCR, measured in g fuel/tnm, and CER, measured in g CO2/tnm. The FCR and CER are calculated by using Equations (3) and (4), respectively. The physical implication behind the calculations is the FCR/CER of vessels operating under the conditions of maximum draft, 75% maximum continuous output of the main engines, and smooth water status. The MIIT test procedure is voluntary [58,59,60,61,62]. It uses similar test and calculation methods to the MOT test procedure. Currently, the energy efficiency records are not publicly accessible:
where, is the fuel consumption rate index (g fuel/tnm); is the number of main engines; is 75% of the difference between maximum continuous output of the main engine i and shaft generator power (kW); is the FCR of main engine i under 75% maximum continuous output (g fuel/kWh); is the reference oil conversion factor for the fuel used in the main engine i; is 50% of the maximum continuous output of the auxiliary engine (kW); is the FCR of the auxiliary engine at 50% maximum continuous output (g fuel/kWh); is the conversion factor for the fuel used in the auxiliary engine; is the deadweight tonnage of the vessel; is the vessel speed under designed draft, 75% maximum continuous output of main engines, and smooth water status; is the CO2 emissions rate index (g CO2/tnm); is the CO2 emissions conversion factor for the fuel used in the main engine i; is the CO2 emissions conversion factor for the fuel used in the auxiliary engine; is the number of energy-efficient technologies employed on the vessel; is the availability coefficient of energy-efficient technology i; is the main engine power reduction through employing energy-efficient technology i (kW); is the auxiliary engine power reduction through employing energy-efficient technology i (kW).
3.6. Aviation Transport
Currently, the energy efficiency of China’s aviation transport is mainly measured by using the statistical method, although the test cycle method has already been applied in international aviation. CAAC monitors the fuel consumption and transport volume of the affiliated airlines. Based on these data, CAAC annually estimates the energy intensity of aviation transport.
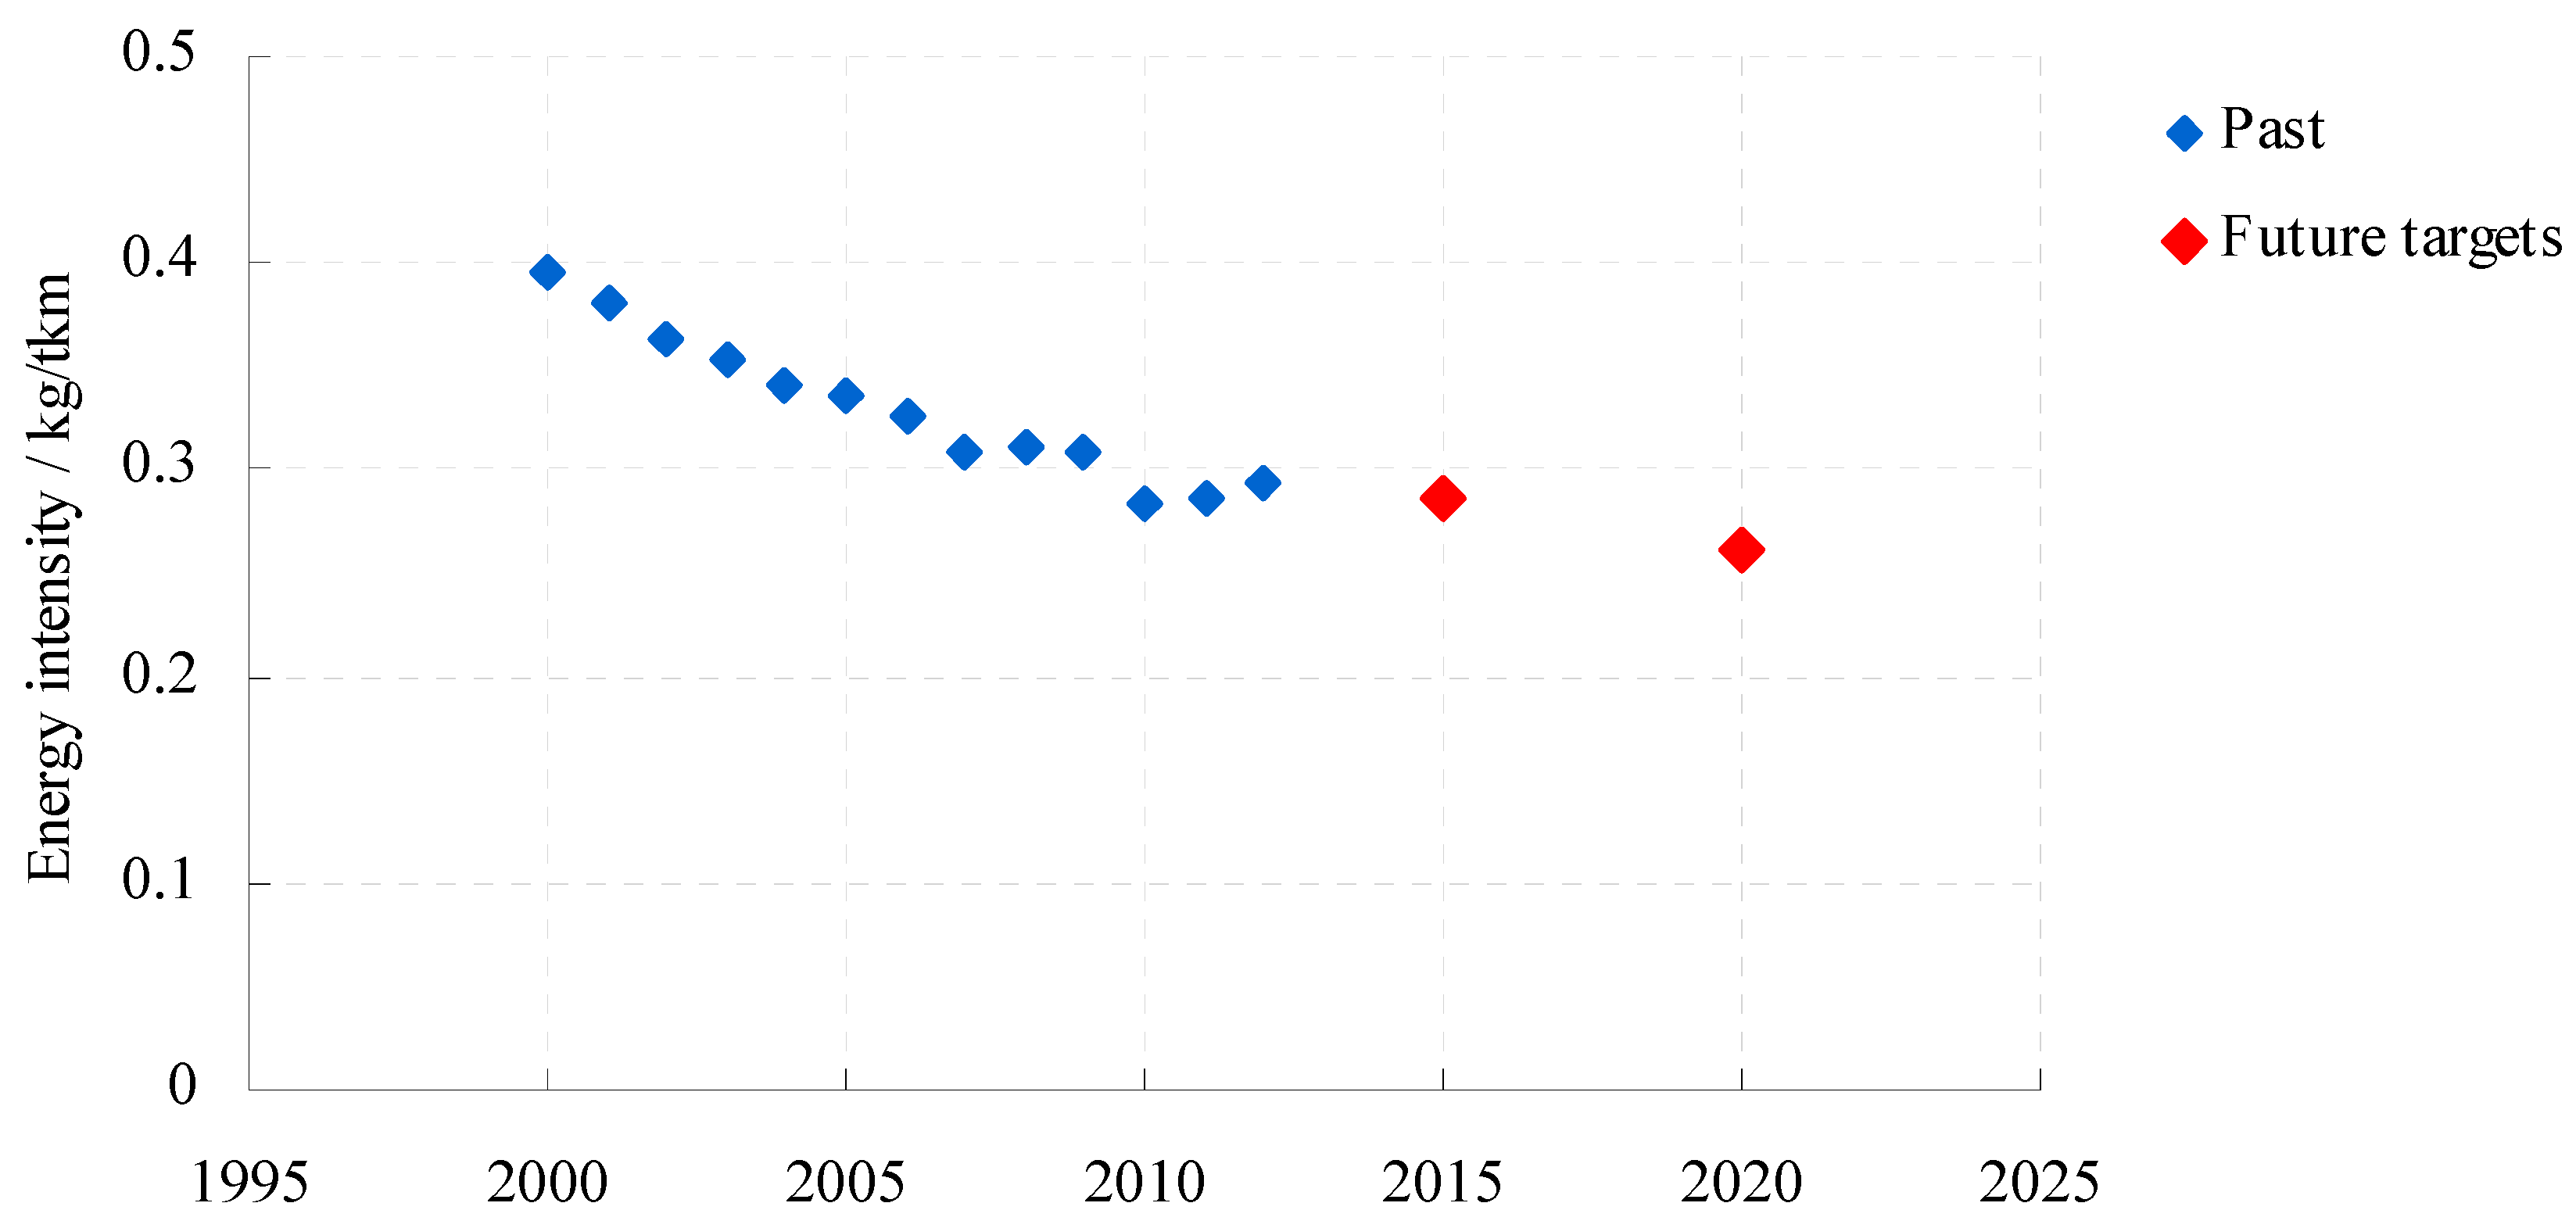
As reported in the ‘Yearbook of China Transportation and Communications’, the energy intensity of China’s aviation transport decreased from 0.396 kg/tkm in 2000 to 0.293 kg/tkm in 2012 [63], which implies a better energy efficiency performance than the global average [64]. This can be attributed to the fact that many of China’s civil aircraft are the latest models, which are equipped with up-to-date energy-efficient technologies. Additionally, as many aircraft only entered service in recent years, the fleet operates in relatively good condition. As specified in the ‘Instructions on Accelerating Energy Conservation and Emissions Reduction’, the energy intensity is projected to decrease by 11%, 15% and 22% in 2012, 2015, and 2020, compared with the 2005 level [65], as Figure 5 shows.
3.7. Railway Transport
In theory, both the test cycle method and the statistical method are applicable for railway transport. Regarding the test cycle method, the former Ministry of Railways (MOR), as the competent authority of China’s railway transport before its restructuring, considered the possibility of establishing standard procedures to test the energy efficiency of locomotives. This idea was supported by the MOR-funded study ‘Research on Energy Consumption Standards for Locomotives’, which established the framework for energy efficiency measurement and regulation [66]. Although such a procedure has not been established yet, it is quite possible that it will be ready in the near future.
Regarding the statistical method, NRA monitors the energy consumption and transport volume of the affiliated railway enterprises. By using these data, NRA established two major energy intensity indicators, the comprehensive energy intensity [67] and the locomotive energy intensity [6], as Equations (5) and (6) show:
where, is the comprehensive energy intensity of railway transport in year i (tce/tkm); is the locomotive energy intensity in year i (kg or kWh/tkm); is the comprehensive energy consumption of railway transport in year i (tce); is the energy consumption by locomotives in year i (kg or kWh); is the converted freight transport volume of railway transport in year i (tkm); is the converted locomotive production volume in year i (tkm).
The definitions, scopes, and implications of these two indicators are quite different. The comprehensive energy intensity reflects the energy efficiency of the whole railway transport sector. It uses comprehensive energy consumption as the numerator, which covers not only energy consumption by locomotives, but also energy consumption by the infrastructure [68]. Converted freight transport volume is used as the denominator, under which both passenger and freight transport volumes are accounted by using conversion factors. The locomotive energy intensity, on the other hand, focuses on the energy efficiency performance of the locomotives. It uses the energy consumption by locomotives, rather than comprehensive energy consumption, as the numerator, and converted locomotive production volume as the denominator. The locomotive production volume refers to the total weight transported by the locomotives, including not only the weight of the passenger/freight, but also the weight of the locomotives themselves. Locomotive energy intensity is estimated for steam, Internal Combustion Engine (ICE) and electric locomotives separately.
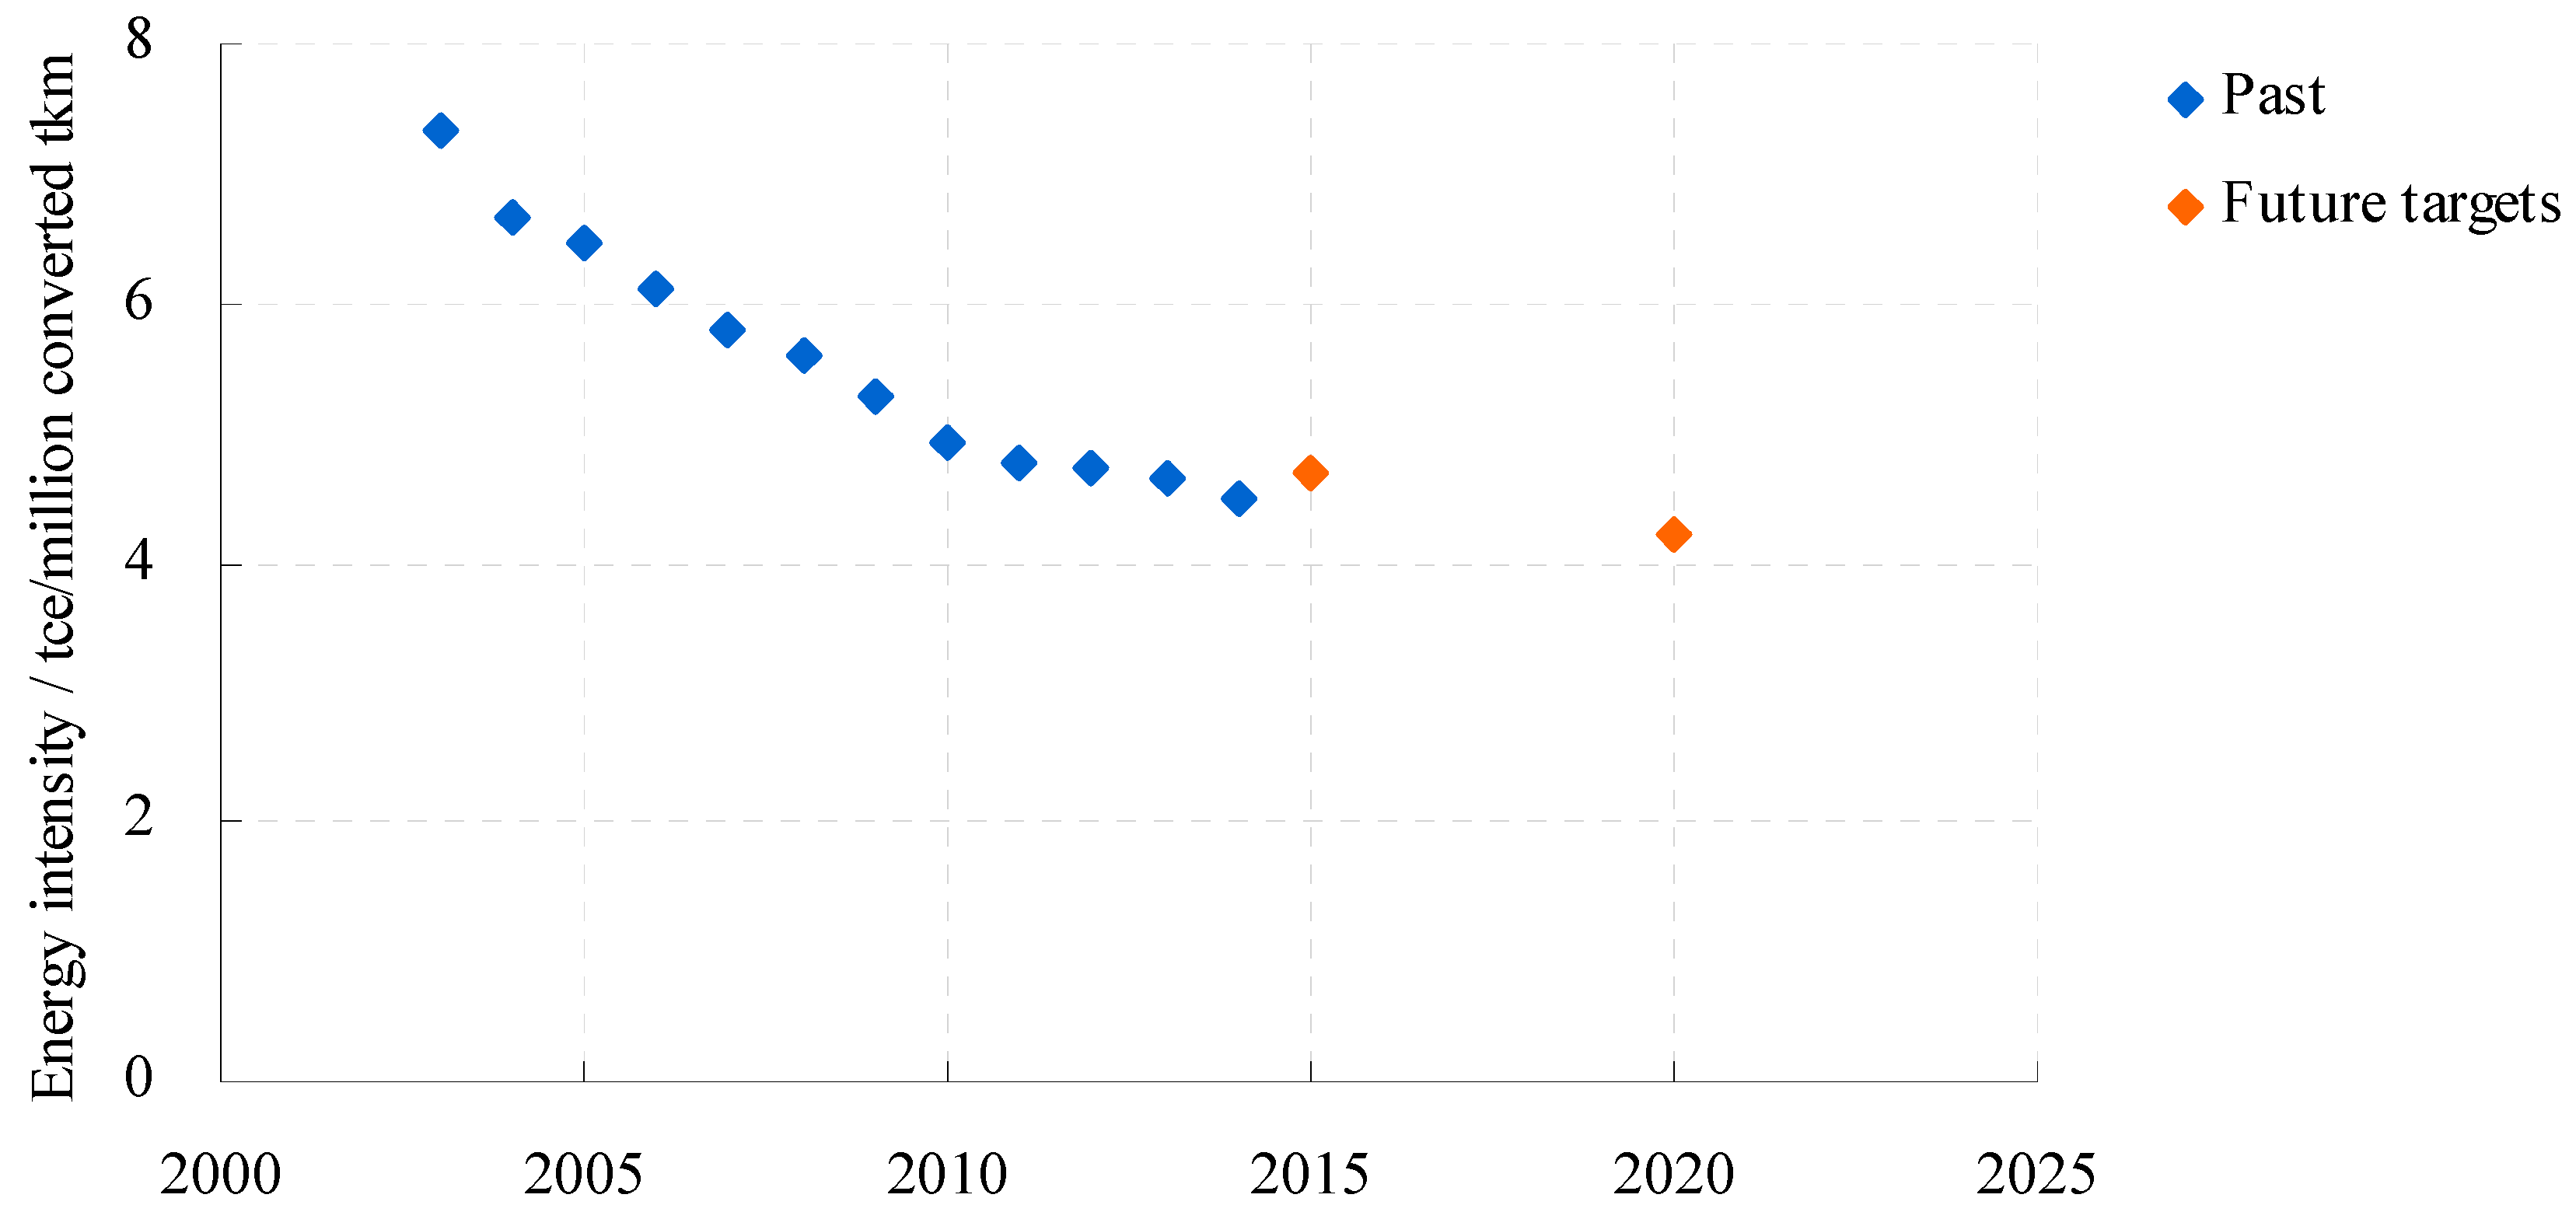
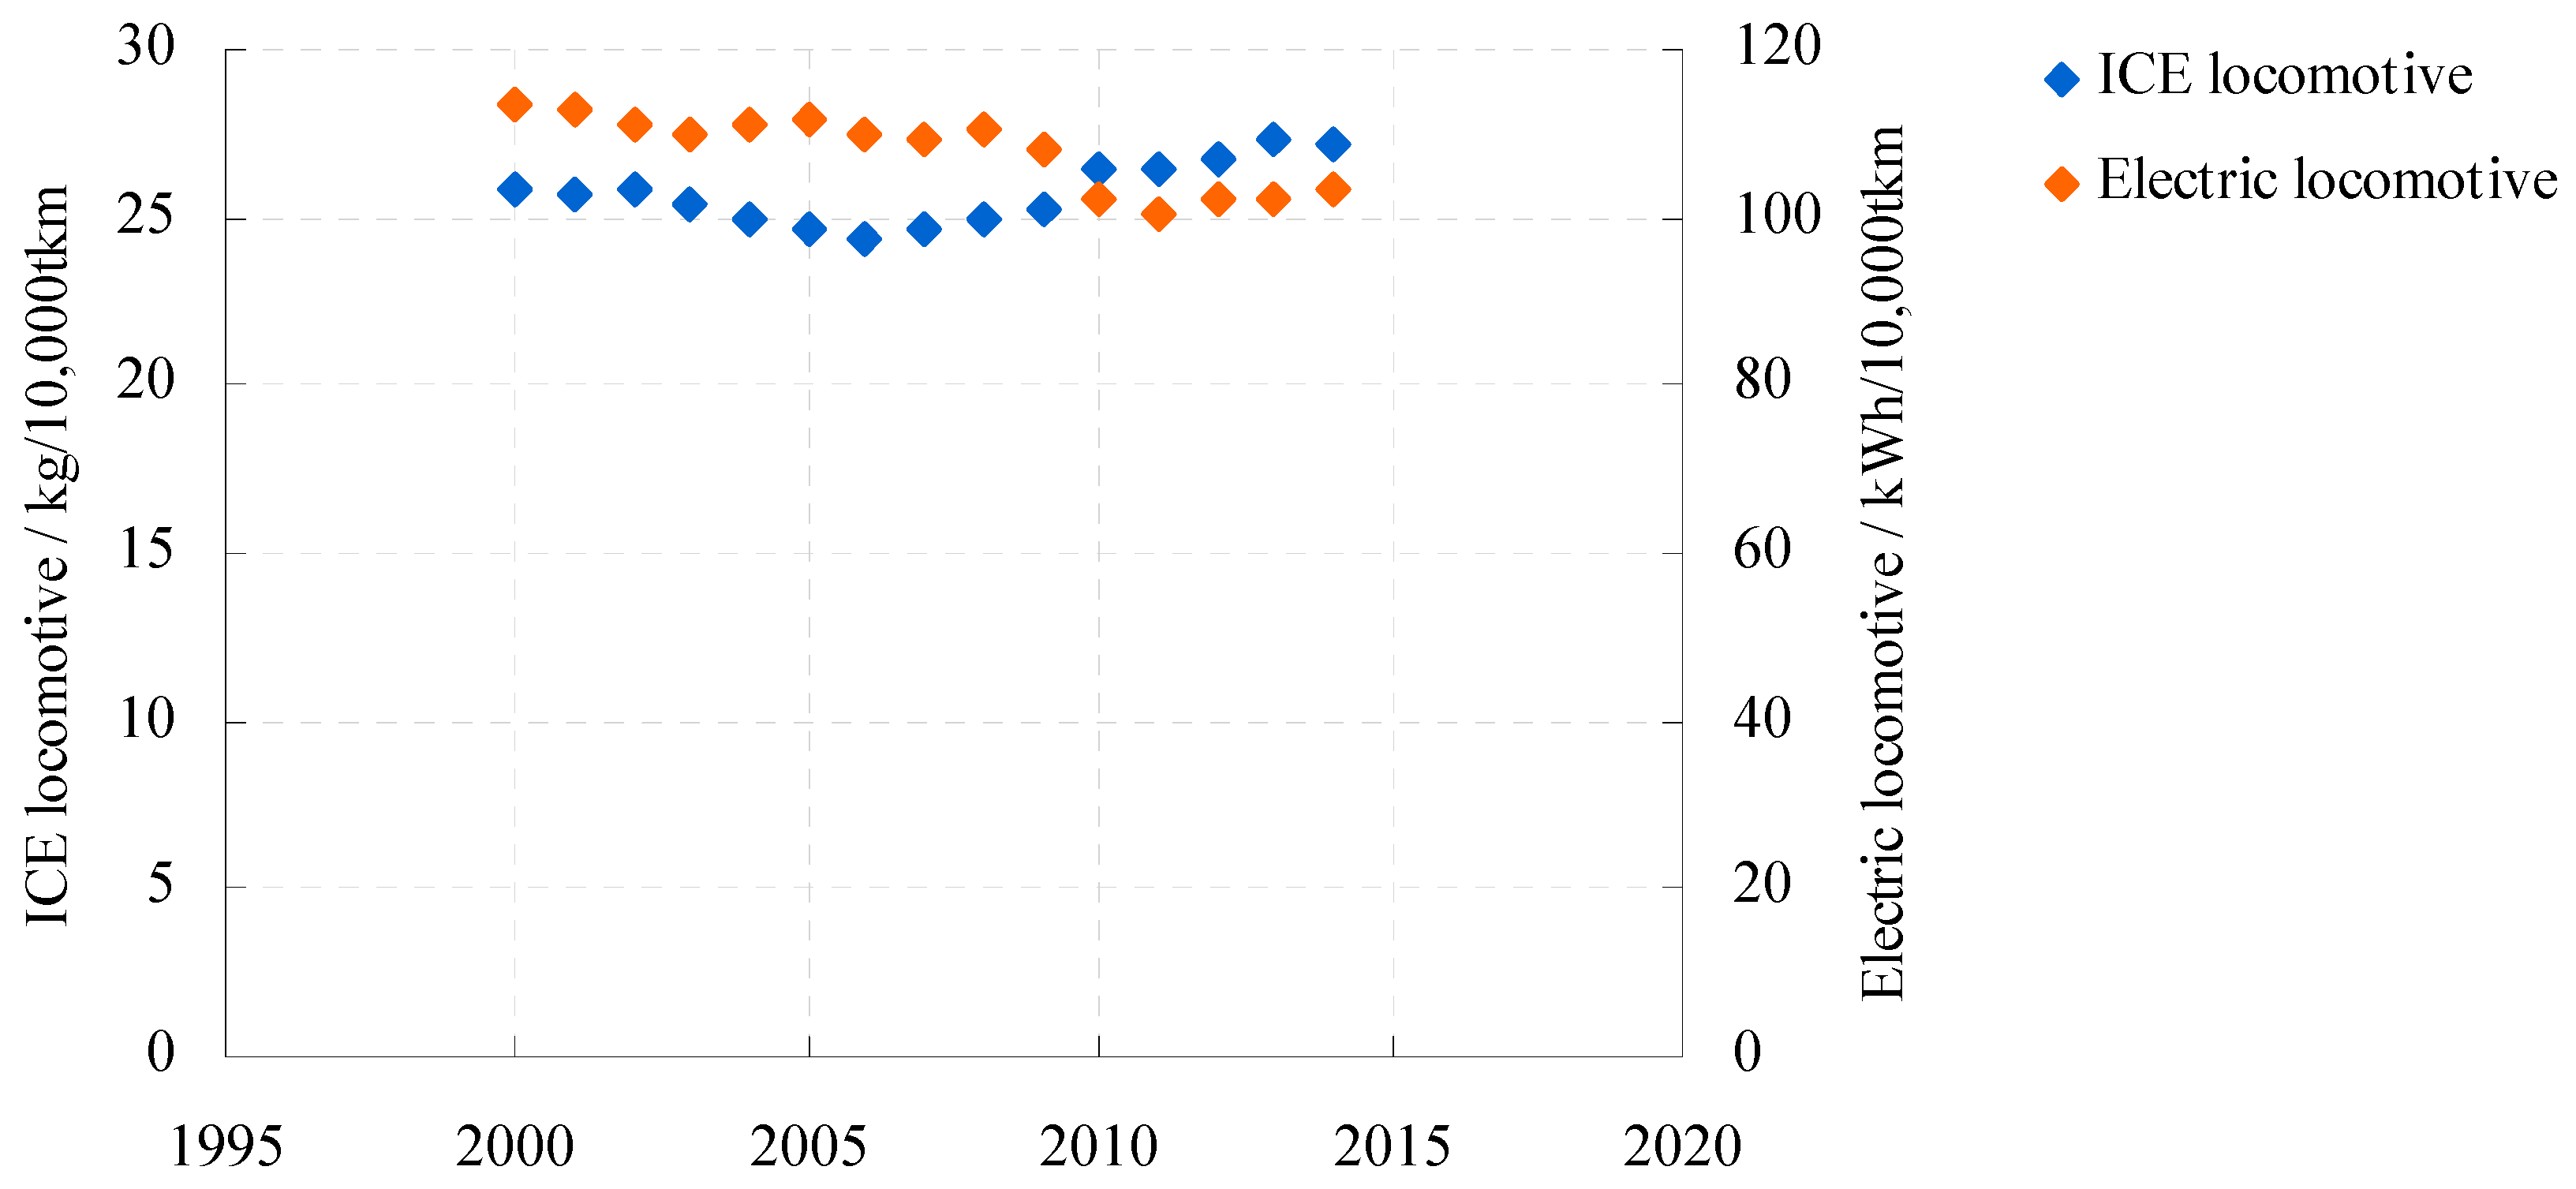
The historical comprehensive energy intensity and locomotive energy intensity are presented in Figure 6 and Figure 7. It can be seen that the energy intensities of ICE and electric locomotives did not change significantly in recent years. However, due to the fact that the electric locomotives have much higher energy efficiency than ICE locomotives, the share of electric locomotives increased significantly since 2000. In 2000, the freight transport volume share of electric locomotives was around 25%, in 2007, this proportion increased to 40%, and in 2012, to around 60%. The comprehensive energy intensity of railway transport showed aggressive reduction. As specified in ‘The Twelfth Five-year Plan for the Energy Conservation of Railway Transport’, the comprehensive energy intensity was required to decline by 5% from 2010 to 2015 [69].
4. Discussions and Policy Implications
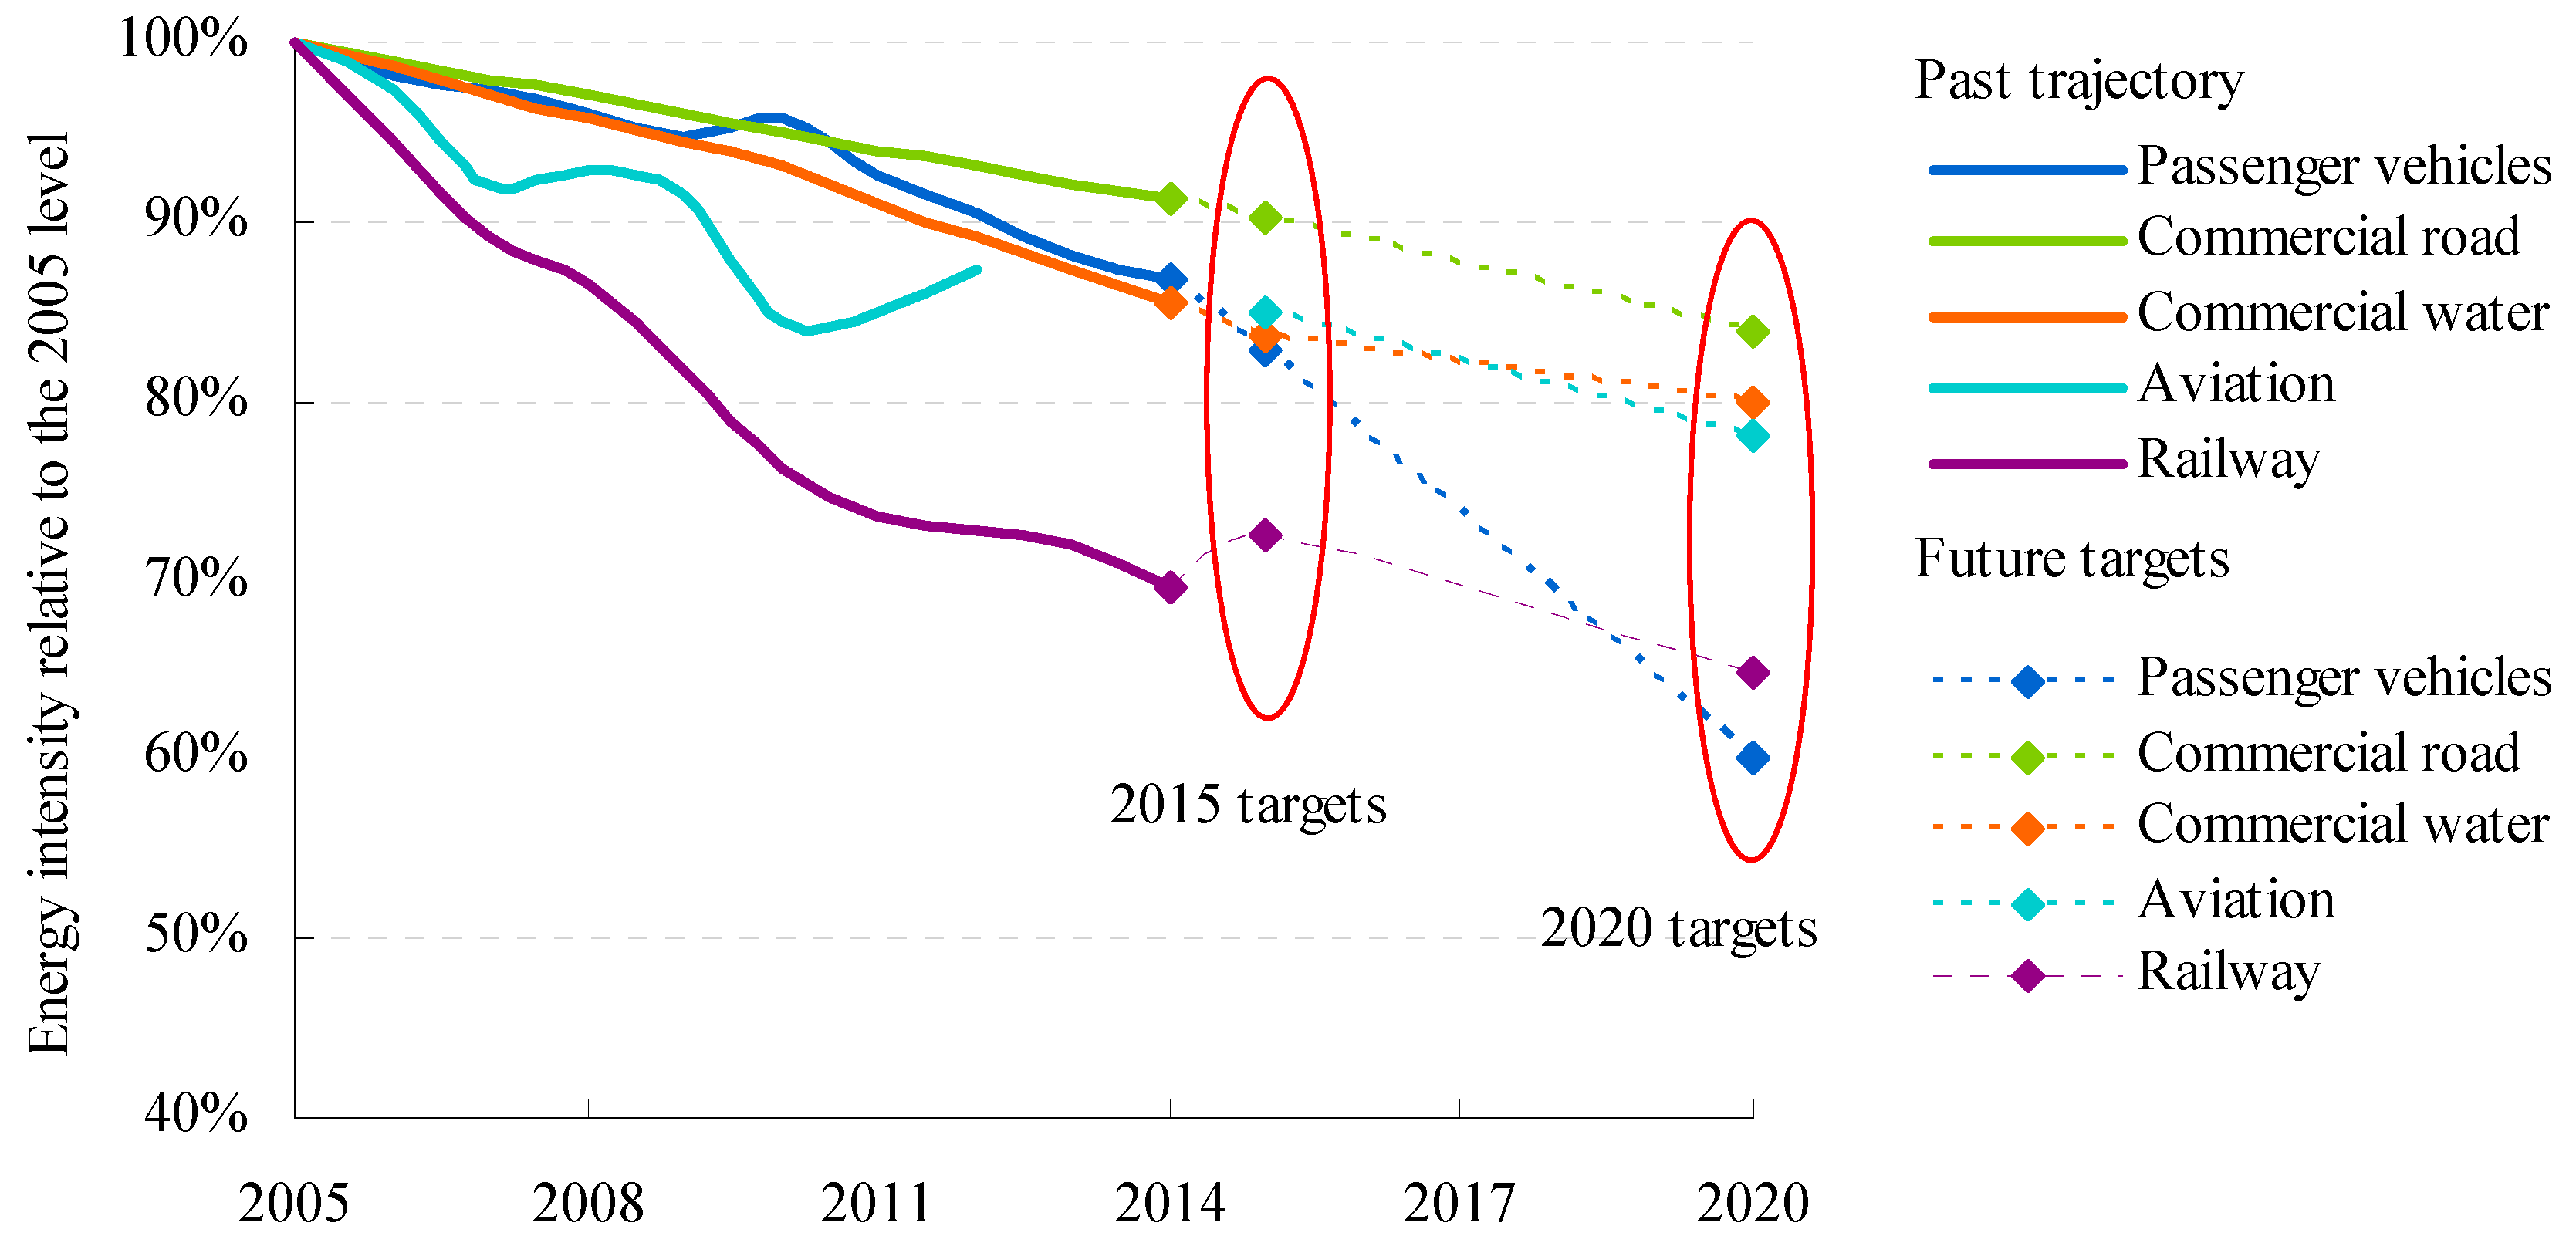
To improve the understanding of energy efficiency in China’s transport sector, the energy efficiencies of different transport modes need to be normalized and compared. China’s energy efficiency improvement scheme was mainly initiated during its eleventh five-year planning period (2006–2010). Thus, the 2005 energy efficiency level is often used as the basis for estimating energy efficiency improvement in the subsequent years. Many of China’s energy efficiency targets are also set by using the 2005 level as the base point. Based on these considerations, the time series of energy intensities of each transport mode are normalized by being divided by the energy intensity level in 2005. The 2015 and 2020 energy intensity targets are also included in the comparison, as Figure 8 shows.
It should be noted that the energy intensity estimations employed in the comparison are not based on the same measurement method. The FCR of passenger vehicles is based on the test cycle method, while other transport modes are based on the statistical method. Additionally, the scopes of the estimations are not completely equivalent. The energy intensity estimation of railway transport covers not only vehicles but also infrastructure, while other transport modes cover only vehicles. Thus, strictly speaking, these energy intensities cannot be directly compared. However, limited by data availability, this is the most feasible way of comparing energy efficiencies across different transport modes. In addition, due to the lack of data, the results of commercial road and commercial water transport are calculated in several years, not every year, and the resulting dots are connected with straight lines as the trend. Despite the lack of precision, this comparison can reflect the general trends and relationships of energy efficiencies of different transport modes.
It can be found that the energy efficiency performance of all transport modes improved during the past decade, although significant disparities existed. Railway transport showed the greatest energy efficiency improvement. The energy intensity level in 2014 was around 30% lower than the 2005 level. The most important driver behind this improvement is the penetration of electric locomotives, which have far higher energy efficiency than conventional ICE locomotives. The energy efficiency of passenger vehicles also improved significantly in recent years, which was mostly driven by the implementation of the mandatory fuel consumption standards [70]. Specifically, the 2020 FCR target for passenger vehicles represents the most aggressive energy efficiency improvement among all transport modes, with 40% FCR reduction compared with the 2005 level. However, the energy intensity of passenger vehicles can vary significantly from driving test cycle to real world, and the NEDC test cycle in particular may not be totally in accord with China’s conditions. The curb weight of the vehicles, the driving habits, the congestion, and the condition of the roads all can have an impact on the results. Generally, the real-world fuel consumption rate is 15–20% higher than the fuel consumption rate tested under the NEDC test cycle [16]. In this paper, it is difficult to take all factors into consideration. The result is a rough and macro-level statistical picture to provide guidance to policy making. A detailed study, discussing passenger vehicle energy intensity in detail, can be completed in the future.
As a contrast, commercial road transport is experiencing the least improvement in energy efficiency. Only less than 10% energy intensity reduction was achieved from 2005 to 2014. The 2020 energy intensity target for commercial road transport also implies a slower energy efficiency improvement than other transport modes. This reflects the fact that the management of energy efficiency of heavy-duty vehicles, especially heavy-duty trucks, is far from sufficient. The energy efficiency improvement of commercial water transport was a bit better than commercial road transport, although it is also lagging behind railway transport and passenger vehicles. For aviation transport, the energy intensity experienced significant fluctuations. The overall trend is similar to commercial water transport.
Based on the analysis above, it can be concluded that the energy efficiency of all transport modes has generally been effectively improved. One possibility is that this can be attributed to the policy framework the government has established to stimulate energy efficiency improvements, including energy efficiency standards, financial incentives, administrative orders, and other aspects. This policy framework should be consistently maintained and successively improved to further tap the energy efficiency potentials. Regarding the disparities across different transport modes, the experience from the leading transport modes should be fully recognized. For example, experience from railway transport demonstrates the substantial impact of electrification on energy efficiency improvement. Similar potential should be fully tapped for other transport modes [71]. Experience from passenger vehicles demonstrates the effectiveness of stringent fuel consumption standards. On the other hand, the energy efficiency of lagging transport modes should be further stimulated. Especially, the energy efficiency of commercial road transport should be improved with greater effort, considering the fact that its energy consumption and GHG emissions account for nearly half of the total from road transport, almost equivalent to passenger vehicles. The policy instruments utilized to improve the energy efficiency of heavy-duty vehicles should be as intensive and effective as the policy instruments for passenger vehicles.
Besides, as mentioned before, China has made a commitment to future GHG emissions, and the transport sector plays an essential role in emissions. While the policy framework mostly concentrates on energy efficiency in China’s transport sector, many other factors can also lead to the reduction of GHG emissions. For example, the use of clean coal or clean technology, demographic changes and the role that electricity plays can all have an impact on GHG emissions [72,73,74]. In the future, to cope with climate change, the reduction in energy intensity will be one solution, and the reduction in GHG emissions intensity may be another one. In the ensuing research, GHG emissions in the transport sector can also be one of the focuses.
The data used in this paper is mostly collected from publications or regulations published by ministries of China. The authority of the data can be guaranteed. Many other researchers also use this approach to obtain their data [75]. Many other methods are also used, like travel surveys [76]. Some of the data in this article, like commercial road transport data, is also obtained from surveys by authorities. Compared with the test cycle method, travel survey data may be closer to real-world data and more representative, but it will take a long time to make a comprehensive investigation in all sub-sectors. In the future, the travel survey method can be combined in the research to make the data more precise. The methods used in this paper are mainly based on the availability of the data. Both the statistical method and the test cycle method are popular and reliable in related fields. In the following study, if more data is available, these two methods can be mutually calibrated to each other to validate the reliability of the methods.
5. Conclusions
In this study, the two basic methods to measure energy efficiency, the statistical method and the test cycle method, are defined. The energy efficiency performance of different transport modes, including passenger vehicles, commercial road, commercial water, aviation and railway, are comprehensively reviewed and compared. It can be observed that, due to the strict policies in the transport sector in China, the energy intensities of all transport vehicles have decreased to varying degrees. The railway subsector experienced the greatest decline, around 30%. The energy intensity of commercial road transport decreased the least. Based on the comparison, several policy recommendations are raised with the aim of further improving energy efficiency in China’s transport sector. In the future, the development of transport in China will mostly be policy-orientated. The results can be a reference for future policy making. The scope of this study is currently limited to the transport sector. Although significant energy efficiency disparities have been observed, the policy implications are limited within the transport sector. One possible further step is to extend the comparison of energy efficiency to a larger scope. For example, to compare the energy efficiency across the sectors of transport, building, industry [77], etc. This will contribute to identifying energy efficiency improvement opportunities from a larger scope.
Acknowledgments
This study is sponsored by the National Natural Science Foundation of China (71403142, 71690241, 71572093), State Key Laboratory of Automotive Safety and Energy (ZZ2016-024). The authors would like to thank the anonymous reviewers for their reviews and comments.
Author Contributions
Han Hao, Zongwei Liu and Fuquan Zhao designed the whole study; Han Hao and Feiqi Liu conducted data collection, modeling, and results analysis; Han Hao and Feiqi Liu wrote the paper.
Conflicts of Interest
The authors declare no conflict of interest. The founding sponsors had no role in the design of the study; in the collection, analyses, or interpretation of data; in the writing of the manuscript, and in the decision to publish the results
Abbreviations
| AT | Automatic Transmission |
| CAAC | Civil Aviation Administration of China |
| CATARC | China Automotive Technology and Research Center |
| CER | CO2 Emissions Rate |
| CMIF | China Machinery Industry Federation |
| FCR | Fuel Consumption Rate |
| gce | gram of coal equivalent |
| GHG | Greenhouse Gas |
| ICE | Internal Combustion Engine |
| iCET | Innovation Center for Energy and Transportation |
| IEA | International Energy Agency |
| IPCC | Intergovernmental Panel on Climate Change |
| kgce | kilogram of coal equivalent |
| LMDI | Logarithmic Mean Divisia Index |
| MIIT | Ministry of Industry and Information Technology |
| MOR | Ministry of Railways |
| MOT | Ministry of Transport |
| NBS | National Bureau of Statistics |
| NDRC | National Development and Reform Commission |
| NEDC | New European Driving Cycle |
| NRA | National Railway Administration |
| pkm | passenger-kilometer |
| SAC | Standardization Administration of China |
| tce | ton of coal equivalent |
| tkm | ton-kilometer |
| tnm | ton-nautical mile |
| vkm | vehicle-kilometer |
| WTVC | World Transient Vehicle Cycle |
References
- Organisation Internationale des Constructeurs d’Automobiles (OICA). World Motor Vehicle Sales; Organisation Internationale des Constructeurs d’Automobiles: Paris, France, 2015. [Google Scholar]
- International Energy Agency (IEA). Transport, Energy and CO2; International Energy Agency: Paris, France, 2009. [Google Scholar]
- Hao, H.; Geng, Y.; Sarkis, J. Carbon footprint of global passenger cars: Scenarios through 2050. Energy 2016, 101, 121–131. [Google Scholar] [CrossRef]
- Intergovernmental Panel on Climate Change (IPCC). Climate Change 2014: Mitigation of Climate Change Chapter 8: Transport; Intergovernmental Panel on Climate Change: Genève, Switzerland, 2014. [Google Scholar]
- International Energy Agency (IEA). CO2 Emissions from Fuel Combustion; International Energy Agency: Paris, France, 2015. [Google Scholar]
- National Bureau of Statistics (NBS). China Statistical Yearbook 2000–2015; National Bureau of Statistics: Beijing, China, 2015.
- China Association of Automobile Manufacturers (CAAM). China Automotive Industry Yearbook 2000–2015; China Association of Automobile Manufacturers: Beijing, China, 2015. [Google Scholar]
- British Petroleum (BP). BP Statistical Review of World Energy 2015; British Petroleum: London, UK, 2015. [Google Scholar]
- Hao, H.; Wang, H.; Yi, R. Hybrid modeling of China’s vehicle ownership and projection through 2050. Energy 2011, 36, 1351–1361. [Google Scholar] [CrossRef]
- State Council. U.S.-China Joint Announcement on Climate Change; State Council: Beijing, China, 2014.
- Geng, Y.; Ma, Z.; Xue, B.; Ren, W.; Liu, Z.; Fujita, T. Co-benefit evaluation for urban public transportation sector—A case of Shenyang, China. J. Clean. Prod. 2013, 58, 82–91. [Google Scholar] [CrossRef]
- Hao, H.; Geng, Y.; Wang, H.; Ouyang, M. Regional disparity of urban passenger transport associated GHG (greenhouse gas) emissions in China: A review. Energy 2014, 68, 783–793. [Google Scholar] [CrossRef]
- Hao, H.; Wang, H.; Ouyang, M. Comparison of policies on vehicle ownership and use between Beijing and Shanghai and their impacts on fuel consumption by passenger vehicles. Energy Policy 2011, 39, 1016–1021. [Google Scholar] [CrossRef]
- Hao, H.; Wang, H.; Ouyang, M. Fuel conservation and GHG (Greenhouse gas) emissions mitigation scenarios for China’s passenger vehicle fleet. Energy 2011, 36, 6520–6528. [Google Scholar] [CrossRef]
- Hao, H.; Geng, Y.; Li, W.; Guo, B. Energy consumption and GHG emissions from China’s freight transport sector: Scenarios through 2050. Energy Policy 2015, 85, 94–101. [Google Scholar] [CrossRef]
- Hao, H.; Liu, Z.; Zhao, F.; Li, W.; Hang, W. Scenario analysis of energy consumption and greenhouse gas emissions from China’s passenger vehicles. Energy 2015, 91, 151–159. [Google Scholar] [CrossRef]
- Kobayashi, S. Energy efficiency technologies for road vehicles. Energy Effic. 2009, 2, 125–137. [Google Scholar] [CrossRef]
- Raux, C.; Lee-Gosselin, M. Transport, energy and greenhouse gases: Perspectives on demand limitation. Energy Effic. 2010, 3, 111–113. [Google Scholar] [CrossRef]
- Solís, J.; Sheinbaum, C. Energy consumption and greenhouse gas emission trends in Mexican road transport. Energy Sustain. Dev. 2013, 17, 280–287. [Google Scholar] [CrossRef]
- Guo, B.; Geng, Y.; Franke, B.; Hao, H.; Liu, Y.; Chiu, A. Uncovering China’s transport CO2 emission patterns at the regional level. Energy Policy 2014, 74, 134–146. [Google Scholar] [CrossRef]
- Hao, H.; Wang, S.; Liu, Z.; Zhao, F. The impact of stepped fuel economy targets on automaker’s light-weighting strategy: The China case. Energy 2016, 94, 755–765. [Google Scholar] [CrossRef]
- Hao, H.; Ou, X.; Du, J.; Wang, H.; Ouyang, M. China’s electric vehicle subsidy scheme: Rationale and impacts. Energy Policy 2014, 73, 722–732. [Google Scholar] [CrossRef]
- Hao, H.; Wang, M.; Zhou, Y.; Wang, H.; Ouyang, M. Levelized costs of conventional and battery electric vehicles in china: Beijing experiences. Mitig. Adapt. Strateg. Glob. Chang. 2015, 20, 1229–1246. [Google Scholar] [CrossRef]
- Mao, B.; Jia, S.; Feng, X. Energy efficiency and technology policy of railway transport in China. China Transp. Rev. 2011, 2011, 12–17. [Google Scholar]
- He, J. Energy Consumption of Aircrafts in China’s Civil Aviation During 1960–2009. J. Transp. Syst. Eng. Inf. Technol. 2011, 11, 12–16. [Google Scholar]
- Wu, W. Comparison of energy consumption and emissions from the transport sector between China and other representative countries. Energy China 2007, 29, 19–22. [Google Scholar]
- Mao, B.; Jia, S.; Sun, Q.; Jia, Y. Energy Consumption, Emissions and their Comparison among Different Transport Modes Integrated Transport Research Center of China; Beijing Jiaotong University: Beijing, China, 2009. [Google Scholar]
- Patterson, M.G. What is energy efficiency?: Concepts, indicators and methodological issues. Energy Policy 1996, 24, 377–390. [Google Scholar] [CrossRef]
- Okafor, I.; Unachukwu, G.; Odukwe, A. Measuring energy efficiency of the public passenger road transport vehicles in Nigeria. Transp. Policy 2014, 35, 319–325. [Google Scholar] [CrossRef]
- Liimatainen, H.; Pöllänen, M. The impact of sectoral economic development on the energy efficiency and CO2 emissions of road freight transport. Transp. Policy 2013, 27, 150–157. [Google Scholar] [CrossRef]
- Wee, B.V.; Janse, P.; Brink, R.V.D. Comparing energy use and environmental performance of land transport modes. Transp. Rev. 2004, 25, 3–24. [Google Scholar] [CrossRef]
- MIIT. Fuel consumption database for light-duty vehicles in China. Ministry of Industry and Information Technology. 2016. Available online: http://chinaafc.miit.gov.cn/ (accessed on 1 March 2016).
- Standardization Administration of China (SAC). Measurement Methods of Fuel Consumption for Light-Duty Vehicles (GB/T 19233–2008); Standardization Administration of China: Beijing, China, 2008.
- Standardization Administration of China (SAC). Limits of Fuel Consumption for Passenger Cars (GB 19578–2004); Standardization Administration of China: Beijing, China, 2004.
- Standardization Administration of China (SAC). Fuel Consumption Evaluation Methods and Targets for Passenger Cars (GB 27999–2011); Standardization Administration of China: Beijing, China, 2011.
- Standardization Administration of China (SAC). Fuel Consumption Evaluation Methods and Targets for Passenger Cars (GB 27999–2014); Standardization Administration of China: Beijing, China, 2014.
- Standardization Administration of China (SAC). Fuel Consumption Limits for Passenger Cars (GB 19578–2014); Standardization Administration of China: Beijing, China, 2014.
- Zhao, F.; Hao, H.; Liu, Z. Trchnology strategy to meet China’s 5 L/100 km fuel consumption target for passenger vehicles in 2020. Clean Technol. Environ. Policy 2016, 18, 7–15. [Google Scholar] [CrossRef]
- Wang, Z.; Jin, Y. Fuel consumption analysis of passenger vehicles in China. Energy Conserv. Environ. Prot. 2008, 17–20. [Google Scholar]
- Innovation Center for Energy and Transportation (ICET). China Passenger Vehicle Fuel Consumption Development Annual Report 2015; Innovation Center for Energy and Transportation: Beijing, China, 2015. [Google Scholar]
- Ministry of Industry and Information Technology (MIIT). Publicity of Corporate Average Fuel CONSUMPTION of Passenger Vehicles in 2014; Ministry of Industry and Information Technology: Beijing, China, 2015.
- Ministry of Industry and Information Technology (MIIT). Market Access Management Rules for Commercial Vehicle OEMs and Products; Ministry of Industry and Information Technology: Beijing, China, 2010.
- Standardization Administration of China (SAC). Limits of Fuel Consumption for Light-Duty Commercial Vehicles (GB 20997–2007); Standardization Administration of China: Beijing, China, 2007.
- Standardization Administration of China (SAC). Notes on Establishing the Limits of Fuel Consumption for Light-Duty Commercial Vehicles; Standardization Administration of China: Beijing, China, 2015.
- Ministry of Transport (MOT). Bulletin of Transport Statistics 2000–2014; Ministry of Transport: Beijing, China, 2015.
- State Council. The Twelfth Five-Year Plan for Energy Conservation and Emissions Reduction; State Council: Beijing, China, 2012.
- Ministry of Transport (MOT). Special Survey on China’s Road and Water Transport; Ministry of Transport: Beijing, China, 2010.
- Standardization Administration of China (SAC). Fuel Consumption Test Methods for Heavy-Duty Commercial Vehicles (QC/T 27840–2011); Standardization Administration of China: Beijing, China, 2011.
- Standardization Administration of China (SAC). Fuel Consumption Limits for Heavy-Duty Commercial Vehicles (GB 30510–2014); Standardization Administration of China: Beijing, China, 2014.
- Ministry of Transport (MOT). Limits and Measurement Methods of Fuel Consumption for Commercial Vehicle for Cargos Transportation (JT 719–2008); Ministry of Transport: Beijing, China, 2008.
- Ministry of Transport (MOT). Limits and Measurement Methods of Fuel Consumption for Commercial Vehicle for Passenger Transportation (JT 711–2008); Ministry of Transport: Beijing, China, 2008.
- Standardization Administration of China (SAC). Low-Speed Goods Vehicles—Limits and Measurement Methods for Fuel Consumption (GB 21378–2015); Standardization Administration of China: Beijing, China, 2015.
- Standardization Administration of China (SAC). Tri-Wheel Vehicles—Limits and Measurement Methods for Fuel Consumption (GB 21377–2015); Standardization Administration of China: Beijing, China, 2015.
- Standardization Administration of China (SAC). The Limits and Measurement Methods of Fuel Consumption for Mopeds (GB/T 16486–2008); Standardization Administration of China: Beijing, China, 2008.
- Standardization Administration of China (SAC). The Limits and Measurement Methods of Fuel Consumption for Motorcycles (GB/T 15744–2008); Standardization Administration of China: Beijing, China, 2008.
- Ministry of Transport (MOT). Limits and Verification Methods of CO2 Emissions for Commercial Ships (JT/T 827–2012); Ministry of Transport: Beijing, China, 2012.
- Ministry of Transport (MOT). Limits and Verification Methods of Fuel Consumption for Commercial Ships (JT/T 826–2012); Ministry of Transport: Beijing, China, 2012.
- Standardization Administration of China (SAC). Calculation Method for Energy Efficiency Design Index of Ships (GB/T 30009–2013); Standardization Administration of China: Beijing, China, 2013.
- Standardization Administration of China (SAC). Measure Method for New Energy Using Rate on Ship—The Ship with Gas/Oil Mixed Fuel Engine (GB/T 30011–2013); Standardization Administration of China: Beijing, China, 2013.
- Standardization Administration of China (SAC). Method for the Verification of Energy Efficiency Design Index of Ships (GB/T 30010–2013); Standardization Administration of China: Beijing, China, 2013.
- Standardization Administration of China (SAC). Reference Line Value for Energy Efficiency Design Index of Energy-Saving Ships (GB/T 30008–2013); Standardization Administration of China: Beijing, China, 2013.
- Standardization Administration of China (SAC). Ships and Marine Technology. Guidelines for HTE Assessment of Speed and Power Performance by Analysis of Speed Trial Data (GB/T 30007–2013); Standardization Administration of China: Beijing, China, 2013.
- China Communications and Transportation Association (CCTA). Yearbook of China Transportation and Communications 2000–2014; China Communications and Transportation Association: Beijing, China, 2015. [Google Scholar]
- China Communications and Transportation Association (CCTA). Bulletin of Civil Aviation Statistics 2014; Civil Aviation Administration of China: Beijing, China, 2015.
- China Communications and Transportation Association (CCTA). Instructions on Accelerating Energy Conservation and Emissions Reduction; Civil Aviation Administration of China: Beijing, China, 2011.
- Ministry of Railways (MOR). Study on the Energy Efficiency Standards for Locomotives; Ministry of Railways: Beijing, China, 2008.
- National Railway Administration (NRA). Bulletin of Railway Statistics 2014; National Railway Administration: Beijing, China, 2015.
- Standardization Administration of China (SAC). Comprehensive Energy Consumption Coefficient of Units of Railway Transport Enterprises (TB/T 1749–1993); Standardization Administration of China: Beijing, China, 1993.
- Ministry of Railways (MOR). The Twelfth Five-Year Plan for the Energy Conservation in the Railway Transport Sector; Ministry of Railways: Beijing, China, 2012.
- Ajanovic, A.; Haas, R.; Wirl, F. Reducing CO2 emissions of cars in the EU: Analyzing the underlying mechanisms of standards, registration taxes and fuel taxes. Energy Effic. 2016, 9, 925–937. [Google Scholar] [CrossRef]
- Shakya, S.; Shrestha, R. Transport sector electrification in a hydropower resource rich developing country: Energy security, environmental and climate change co-benefits. Energy Sustain. Dev. 2011, 15, 147–159. [Google Scholar] [CrossRef]
- Franzitta, V.; Curto, D.; Milone, D.; Rao, D. Assessment of Renewable Sources for the Energy Consumption in Malta in the Mediterranean Sea. Energies 2016, 9, 1034. [Google Scholar] [CrossRef]
- Lugauer, S.; Jensen, R.; Sadler, C. An Estimate of the Age Distribution’s Effect on Carbon Dioxide Emissions. Econ. Inq. 2014, 52, 914–929. [Google Scholar] [CrossRef]
- Williams, J.H.; DeBenedictis, A.; Ghanadan, R.; Mahone, A.; Moore, J.; Morrow, W.R.; Price, S.; Torn, M.S. The Technology Path to Deep Greenhouse Gas Emissions Cuts by 2050: The Pivotal Role of Electricity. Science 2012, 335, 53–59. [Google Scholar] [CrossRef] [PubMed]
- Adam, M.; Lee, S. Are we reaching peak travel? Trends in passenger transport in eight industrialized countries. Transp. Rev. 2011, 31, 357–378. [Google Scholar]
- Chester, M.V.; Horvath, A.; Madanat, S. Comparison of life-cycle energy and emissions footprints of passenger transportation in metropolitan regions. Atmos. Environ. 2010, 44, 1071–1079. [Google Scholar] [CrossRef]
- Hao, H.; Geng, Y.; Hang, W. GHG emissions from primary aluminum production in China: Regional disparity and policy implications. Appl. Energy 2016, 166, 264–272. [Google Scholar] [CrossRef]
Figure 1.
Rationale of the two basic methods for measuring energy efficiency in the transport sector.
Figure 1.
Rationale of the two basic methods for measuring energy efficiency in the transport sector.
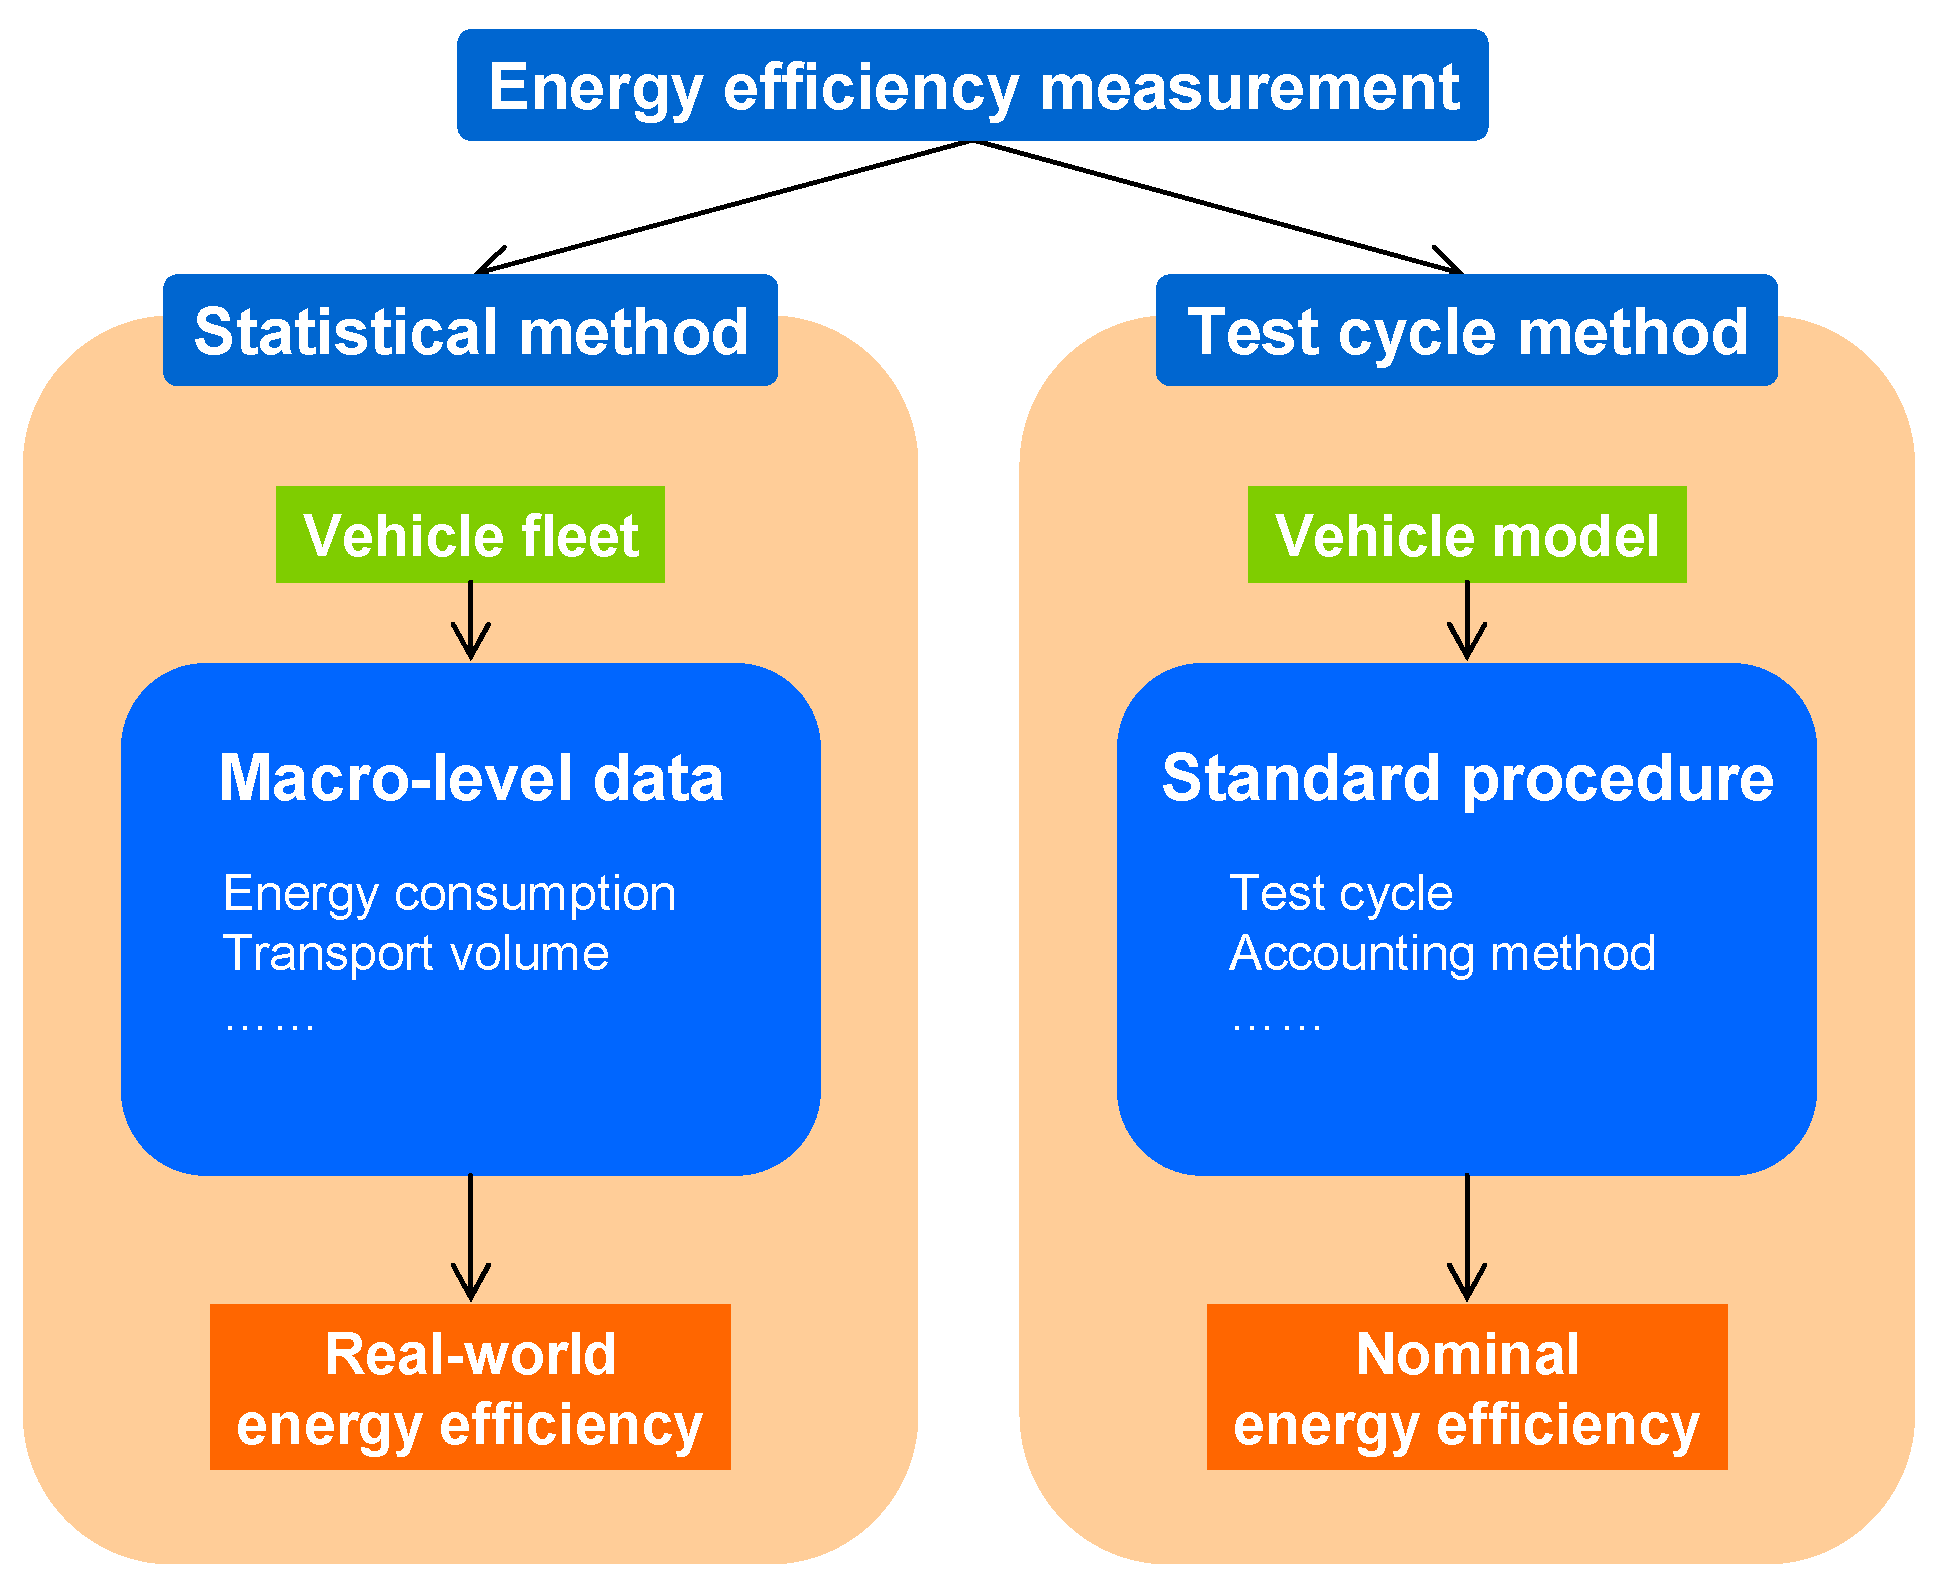
Figure 2.
FCRs and curb weights of the most popular passenger vehicle models in China. Notes: (1) The sizes of the bubbles represent the domestic sales of the passenger vehicle models in 2015; (2) Special treatment is for vehicles with AT (Automatic Transmission), three or more rows of seats under phase I, II and III standards; three or more rows of seats under phase IV standards; (3) Phase IV limits are the same with phase III targets.

Figure 3.
Fleet average FCR of new passenger vehicles in China.

Figure 4.
Fleet average FCR of new light-duty commercial vehicles in China. Notes: N1 vehicles refer to freight-carrying light-duty commercial vehicles; M2 vehicles refer to passenger-carrying light-duty commercial vehicles.
Figure 4.
Fleet average FCR of new light-duty commercial vehicles in China. Notes: N1 vehicles refer to freight-carrying light-duty commercial vehicles; M2 vehicles refer to passenger-carrying light-duty commercial vehicles.

Figure 5.
Energy intensity of China’s aviation transport.

Figure 6.
Comprehensive energy intensity of China’s railway transport.

Figure 7.
Energy intensities of ICE and electric locomotives in China.

Figure 8.
Energy intensity trends of different transport modes. Notes: (1) The energy intensity trajectories of different transport modes are determined based on the following indicators: passenger vehicles based on the fleet average FCR of new passenger vehicles estimated by iCET; commercial road transport and commercial water transport based on the overall energy intensities estimated by the MOT; railway transport based on the comprehensive energy intensity estimated by the NRA; aviation transport based on the overall energy intensity estimated by the CAAC; (2) The 2015 targets for most transport modes are based on the targets specified in ‘The Twelfth Five-year Plan for Energy Conservation and Emissions Reduction’; The 2020 targets are based on transport mode-specific sources; (3) For railway transport, the 2014 energy intensity has already exceeded the 2015 target. Thus, the trajectory shows a reverse trend between 2014 and 2015.

Table 1.
Comparison of the statistical method and the test cycle method in measuring energy efficiency.
Table 1.
Comparison of the statistical method and the test cycle method in measuring energy efficiency.
| Comparison | Statistical Method | Test Cycle Method |
|---|---|---|
| Basis | Macro-level data | Standard test procedures |
| Physical implication | The real-world, average energy efficiency of the target vehicle fleet | The nominal energy efficiency of the tested vehicle model |
| Applicable modes | Transport modes with macro-level statistical data available | All transport modes |
| Typical application | Shaping policy targets | Setting technical standards |
Table 2.
The measurement of energy efficiency in China’s transport sector.
| Category | Measurement Method | Measurement Basis | Competent Authority | Coverage | Unit |
|---|---|---|---|---|---|
| Passenger vehicles | Test cycle method | NEDC test cycle-based test procedure | MIIT | All passenger vehicle models | L/100 km |
| Light-duty commercial vehicles | Test cycle method | NEDC test cycle-based test procedure | MIIT | All light-duty commercial vehicle models | L/100 km |
| Commercial Road transport | Statistical method | Sector-wide energy consumption and converted freight transport volume | MOT | The whole sector | tce/tkm |
| Statistical method | Energy consumption and transport volume of the monitored enterprises | MOT | Monitored enterprises | tce/pkm tce/tkm tce/vkm | |
| Statistical method | Energy consumption and transport volume of the monitored enterprises | MOT | Enterprises covered in the national survey | L/100 km | |
| Test cycle method | WTVC test cycle-based test procedure | MIIT | All heavy-duty vehicle models | L/100 km | |
| Test cycle method | Multi-constant-speed driving conditions-based test procedure | MOT | Commercial heavy-duty vehicle models | L/100 km | |
| Low-speed trucks | Test cycle method | Multi-mode test cycle-based test procedure | CMIF | All low-speed truck models | L/100 km |
| Motorcycles | Test cycle method | Multi-mode test cycle and constant-speed test cycle -based test procedure | NDRC | All motorcycle models | L/100 km |
| Commercial water transport | Statistical method | Sector-wide energy consumption and converted freight transport volume | MOT | The whole sector | tce/tkm |
| Statistical method | Energy consumption and transport volume of the monitored enterprises | MOT | Monitored enterprises | tce/tnm | |
| Statistical method | Energy consumption and transport volume of the monitored enterprises | MOT | Enterprises covered in the national survey | tce/100 km | |
| Test cycle method | Maximum draft, 75% maximum continuous output of the main engines, and smooth water status-based test procedure | MOT | Commercial vessels | g fuel/tnm g CO2/tnm | |
| Test cycle method | Maximum draft, 75% maximum continuous output of the main engines, and smooth water status-based test procedure | MIIT | Voluntary | g fuel/tnm g CO2/tnm | |
| Aviation transport | Statistical method | Sector-wide energy consumption and converted freight transport volume | CAAC | The whole sector | kg/tkm |
| Railway transport | Statistical method | Comprehensive energy consumption and converted freight transport volume | NRA | The whole sector | tce/tkm |
| Statistical method | Locomotive energy consumption and converted locomotive production volume | NRA | All locomotives | kg/tkm kWh/tkm |
Table 3.
Energy intensities of commercial road and water transport derived from the monitored transport enterprises
Table 3.
Energy intensities of commercial road and water transport derived from the monitored transport enterprises
| Category | Unit | 2011 | 2012 | 2013 | 2014 |
|---|---|---|---|---|---|
| Transit buses | tce/10,000 passengers | 1.4 | 1.4 | 1.5 | 1.4 |
| kgce/100 vkm | 48.8 | 46.3 | 47.6 | 48.1 | |
| Commercial passenger transport | kgce/1000 pkm | 11.3 | 11.7 | 11.6 | 12.1 |
| kgce/100 vkm | - | - | - | 29.3 | |
| Commercial freight transport | kgce/100 tkm | 2.2 | 1.7 | 1.9 | 2.0 |
| Coastal and ocean water transport | kgce/1000 tnm | 7.0 | 6.2 | 5.9 | 5.1 |
| Port | tce/10,000 t | 3.2 | 3.0 | 2.9 | 2.7 |
Table 4.
Energy intensities of commercial road and water transport derived from the nation-wide transport survey
Table 4.
Energy intensities of commercial road and water transport derived from the nation-wide transport survey
| Vehicle Type | Fuel | Category | Unit | 2008 | 2013 | Change% |
|---|---|---|---|---|---|---|
| Buses | Gasoline | 15 seats or lower | L/100 km | - | 10.2 | |
| 16–30 seats | L/100 km | - | 17.6 | |||
| More than 30 seats | L/100 km | - | 25.4 | |||
| Diesel | 15 seats or lower | L/100 km | - | 12.5 | ||
| 16–30 seats | L/100 km | 18.4 | 18.1 | −1.6 | ||
| More than 30 seats | L/100 km | 25.5 | 25.4 | −0.4 | ||
| Trucks | Gasoline | GVW of 2 t or lower | L/100 km | 13.0 | 12.2 | −6.2 |
| GVW of higher than 2 t | L/100 km | 25.1 | 26.5 | 5.6 | ||
| Diesel | GVW of 2 t or lower | L/100 km | 15.1 | 15.3 | 1.3 | |
| GVW of 2–4 t | L/100 km | 20.2 | 18.8 | −6.9 | ||
| GVW of 4–8 t | L/100 km | 25.1 | 23.1 | −8.0 | ||
| GVW of 8–20 t | L/100 km | 30.7 | 30.5 | −0.7 | ||
| GVW of higher than 20 t | L/100 km | 35.0 | 34.5 | −1.4 | ||
| Passenger vessels | Inland waterway | tce/100 km | 0.2 | 0.2 | 15.0 | |
| Coastal | tce/100 km | 0.7 | 1.1 | 57.1 | ||
| Ocean | tce/100 km | 1.6 | 1.3 | −17.5 | ||
| Freight vessels | Inland waterway | tce/100 km | 0.6 | 0.4 | −26.7 | |
| Coastal | tce/100 km | 2.4 | 3.3 | 39.6 | ||
| Ocean | tce/100 km | 7.7 | 10.2 | 31.9 |
© 2017 by the authors. Licensee MDPI, Basel, Switzerland. This article is an open access article distributed under the terms and conditions of the Creative Commons Attribution (CC BY) license (http://creativecommons.org/licenses/by/4.0/).
Share and Cite
MDPI and ACS Style
Hao, H.; Liu, F.; Liu, Z.; Zhao, F. Measuring Energy Efficiency in China’s Transport Sector. Energies 2017, 10, 660. https://doi.org/10.3390/en10050660
AMA Style
Hao H, Liu F, Liu Z, Zhao F. Measuring Energy Efficiency in China’s Transport Sector. Energies. 2017; 10(5):660. https://doi.org/10.3390/en10050660
Chicago/Turabian StyleHao, Han, Feiqi Liu, Zongwei Liu, and Fuquan Zhao. 2017. "Measuring Energy Efficiency in China’s Transport Sector" Energies 10, no. 5: 660. https://doi.org/10.3390/en10050660
Note that from the first issue of 2016, this journal uses article numbers instead of page numbers. See further details here.