Article

A Data-Driven Learning-Based Continuous-Time Estimation and Simulation Method for Energy Efficiency and Coulombic Efficiency of Lithium Ion Batteries

1
National Active Distribution Network Technology Research Center, Beijing Jiaotong University, Beijing 100044, China
2
Collaborative Innovation Center of Electric Vehicles in Beijing, Beijing Jiaotong University, Beijing 100044, China
3
Department of Civil and Environmental Engineering, University of Washington, Seattle, WA 98195-2700, USA
*
Author to whom correspondence should be addressed.
Energies 2017, 10(5), 597; https://doi.org/10.3390/en10050597
Submission received: 17 March 2017 / Revised: 21 April 2017 / Accepted: 25 April 2017 / Published: 29 April 2017

Abstract

:
Lithium ion (Li-ion) batteries work as the basic energy storage components in modern railway systems, hence estimating and improving battery efficiency is a critical issue in optimizing the energy usage strategy. However, it is difficult to estimate the efficiency of lithium ion batteries accurately since it varies continuously under working conditions and is unmeasurable via experiments. This paper offers a learning-based simulation method that employs experimental data to estimate the continuous-time energy efficiency and coulombic efficiency of lithium ion batteries, taking lithium titanate batteries as an example. The state of charge (SOC) regions and discharge current rates are considered as the main variables that may affect the efficiencies. Over eight million empirical datasets are collected during a series of experiments performed to investigate the efficiency variation. A back propagation (BP) neural network efficiency estimation and simulation model is proposed to estimate the continuous-time energy efficiency and coulombic efficiency. The empirical data collected in the experiments are used to train the BP network model, which reveals a test error of 10−4. With the input of continuous SOC regions and discharge currents, continuous-time efficiency can be estimated by the trained BP network model. The estimated and simulated result is proven to be consistent with the experimental results.

1. Introduction

Lithium ion (Li-ion) batteries exhibit better performance with regard to energy density [1,2], power density [3], life cycle [4], operating temperature range [5], and safety [6,7] when compared with other types of rechargeable batteries, such as lead-acid batteries [8], nickel-cadmium batteries [1,9], and nickel-metal hydride (Ni-MH) batteries [2]. Due to these advantages, lithium ion batteries are widely used as basic energy storage components in transportation applications [10,11,12]. Furthermore, in modern railway applications, safety, high power density, and high efficiency are commonly required [13,14,15,16,17] characteristics of energy storage components. Traditional lithium ion batteries with graphite anodes can be damaged, or even explode, due to thermal runaway caused by high internal temperatures or short circuit [18]. However, the lithium titanate battery, a novel lithium-ion battery that uses an alternative anode material (Li4Ti5O12 instead of graphite) [19], is proposed to be highly safe, since its internal resistance rises sharply during thermal runaway, thus preventing explosion. Lithium titanate batteries also present more significant advantages, including higher power density and longer life cycles, compared with traditional graphite anode lithium batteries [10,20,21,22]. Due to these advantages, lithium titanate batteries are appropriate to serve as the basic energy storage components in modern railway systems.
In modern railway applications, energy efficiency is also an important aspect used to estimate the performance of lithium ion batteries in recent studies [23,24,25,26], since higher efficiency means more energy savings and reduced costs. Determining how to optimize the battery usage strategy by improving the energy efficiency during the working process is the key issue for managing energy usage in modern railway applications. However, the efficiency varies in real-time according to various working conditions and the continuous-time efficiency is unmeasurable via experiment. Hence, how to estimate the continuous-time efficiency becomes a critical question in order to evaluate and improve the battery’s performance during different working conditions.
Several existing studies have focused on battery efficiency. Energy efficiency is defined as the ratio between discharged electrical energy and charged electrical energy, which is used to evaluate the energy loss. Coulombic efficiency is defined as the ratio between discharge and charge capacity, which is a critical parameter to evaluate the battery performance. An improved method to calculate energy efficiency for rechargeable batteries was proposed in [25]. Liu et al. [27] used a theoretical calculation method to provide a calculation result on energy conversion efficiency of lithium titanate batteries with different discharge current rates. In practical applications, the energy efficiency of a battery may vary compared to the theoretical assumptions because the energy efficiency of the battery is also affected by its working conditions. Some scientists also studied the relationship between the state of charge (SOC) and the battery efficiency. The function of SOC and charge efficiency was studied in [28] and the correlation between SOC and coulombic efficiency was studied in [29]. Kang et al. [30] established the quantitative relationship between open circuit voltage (OCV) and SOC of batteries in order to calculate the energy efficiency of Ni-MH and Li-ion batteries, which provided effective guidance for building basic testing procedures in the energy efficiency study of lithium ion batteries.
The former studies have defined the energy efficiency and coulombic efficiency, as well as established the relationship between the SOC and efficiency. However, continuous-time energy efficiency estimation of the batteries during their working processes has not been studied, and this issue is important and useful for monitoring the real-time performance of the batteries.
This research aims at building a simulation model to estimate continuous-time energy efficiency and coulombic efficiency. An artificial neural network (ANN), a learning-based prediction model that imitates the structure and function of human brain cells, is employed as the basic model. In previous research, artificial neural networks have been widely used to estimate, evaluate, and predict results based on input data [31]. In battery research, this method has been employed to estimate battery SOC [32,33,34,35,36,37,38], state of health [39], and surface temperature [40].
In this paper, the effect of SOC regions and discharge current rates of lithium titanate batteries on energy efficiency and coulombic efficiency are studied. Normally, charge current, discharge current, and the SOC region are the basic variables that may be considered to affect efficiency, while in actual applications in the field, the batteries are charged under standard mode (without considering the energy recycle during working process). Thus, in this research, we consider the charge current as a fixed variable; meanwhile, discharge current and the SOC region are the main variables that may be considered to affect the efficiency. Ultimately, a data-driven, learning-based estimation and simulation method is proposed to estimate continuous-time energy efficiency and coulombic efficiency of lithium titanate batteries. The estimation and simulation model is developed by learning from experimental data, which can also be analogously used in applications involving other types of lithium ion batteries and help to manage the batteries’ performance under high-efficiency conditions.
This paper is organized as follows: Section 2 presents the theoretical calculation method for the energy efficiency and coulombic efficiency of lithium ion batteries; Section 3 offers basic information about the experiments and lists the properties of the lithium titanate batteries used in this research; Section 4 shows the experimental results of efficiency variation based on different SOC regions and discharge current rates when batteries are fully charged and not fully discharged; in Section 5, the experimental results of efficiency variation when the batteries are fully discharged and not fully charged are presented; Section 6 shows the BP network continuous-time efficiency estimation model and, in the final part of this section, the estimated efficiency is proven to be consistent with the experimental results.

2. Efficiency of Lithium Titanate Battery

2.1. Energy Efficiency

Energy efficiency is an important parameter used to evaluate the performance of various batteries [12]. In general, the definition of energy efficiency is the ratio between discharged electrical energy and charged electrical energy, which can be expressed with the following equation [8]:
η E = ( U I ) d i s c h a r g e d t ( U I ) c h a r g e d t
where U and I refer to the battery voltage and current during discharge and charge, respectively. Equation (1) expresses the efficiency of the whole process while, in order to distinguish the charge efficiency and the discharge efficiency, a new method to calculate the energy efficiency of the two distinct processes is proposed in [25]. In their research, SOC is utilized to calculate the energy. The charge energy and discharge energy can be expressed, respectively, as follows:
Q c h a r g e = S O C ( t 0 ) S O C ( t 1 ) U c h a r g e C n d S O C
Q d i s c h a r g e = S O C ( t 0 ) S O C ( t 1 ) U d i s c h a r g e C n d S O C
Equations (2) and (3) refer to the charge and discharge energy, where Ucharge and Udischarge are the voltage of the battery during charge and discharge; SOC(t0) and SOC(t1) are the initial and terminal SOC of the battery, respectively. Cn is the nominal capacity of the battery which is distinguished between battery cells. In this research, Cn is the recorded charge capacity when a fully discharged battery cell is charged at 1C current rate following the constant voltage of 2.8 V until the charge current rate is less than 0.1C. The definition of SOC [41] is presented in Appendix A.
In order to distinguish the charge efficiency and the discharge efficiency, net energy is introduced into the calculation, which is defined as the energy accumulated inside the battery [25]. To avoid the effect of polarization resulting from the charging/discharging process, in the definition of net energy, Ucharge/Udischarge is replaced by the open circuit voltage (UOCV):
Δ Q n = S O C ( t 0 ) S O C ( t 1 ) U O C V C n d S O C
In Equation (4), ΔQn refers to the net energy; UOCV refers to the open circuit voltage. The definition of charge efficiency and discharge efficiency are presented in Appendix A. In this paper, the method proposed by [25] is introduced to calculate the energy efficiency with the following equations:
η b a t t e r y = η c h a r g e × η d i s c h a r g e = Q d i s c h a r g e Q c h a r g e
Equation (5) shows that the battery efficiency is the ratio of the discharge energy and the charge energy, where ηcharge and ηdischarge are the charge and discharge energy efficiency, respectively, which are presented in Appendix B.

2.2. Coulombic Efficiency

High coulombic efficiency results in a highly available capacity, long cycle life, and high energy efficiency of the battery [3,4]. The most common definition of the coulombic efficiency is the ratio between the number of electrons when discharged and charged for a particular cycle [5], which is presented in the following form [6,7]:
η c o u l o m b i c = C d i s c h a r g e C c h a r g e
where Cdischarge and Ccharge represent the discharge and charge capacity, respectively.
During a charge-discharge cycle, the capacity can be expressed as the integral the of discharge/charge current curve when a specific charge and discharge current are applied. Thus, the coulombic efficiency can be calculated as follows:
η c o u l o m b i c = I d i s c h a r g e d t I c h a r g e d t

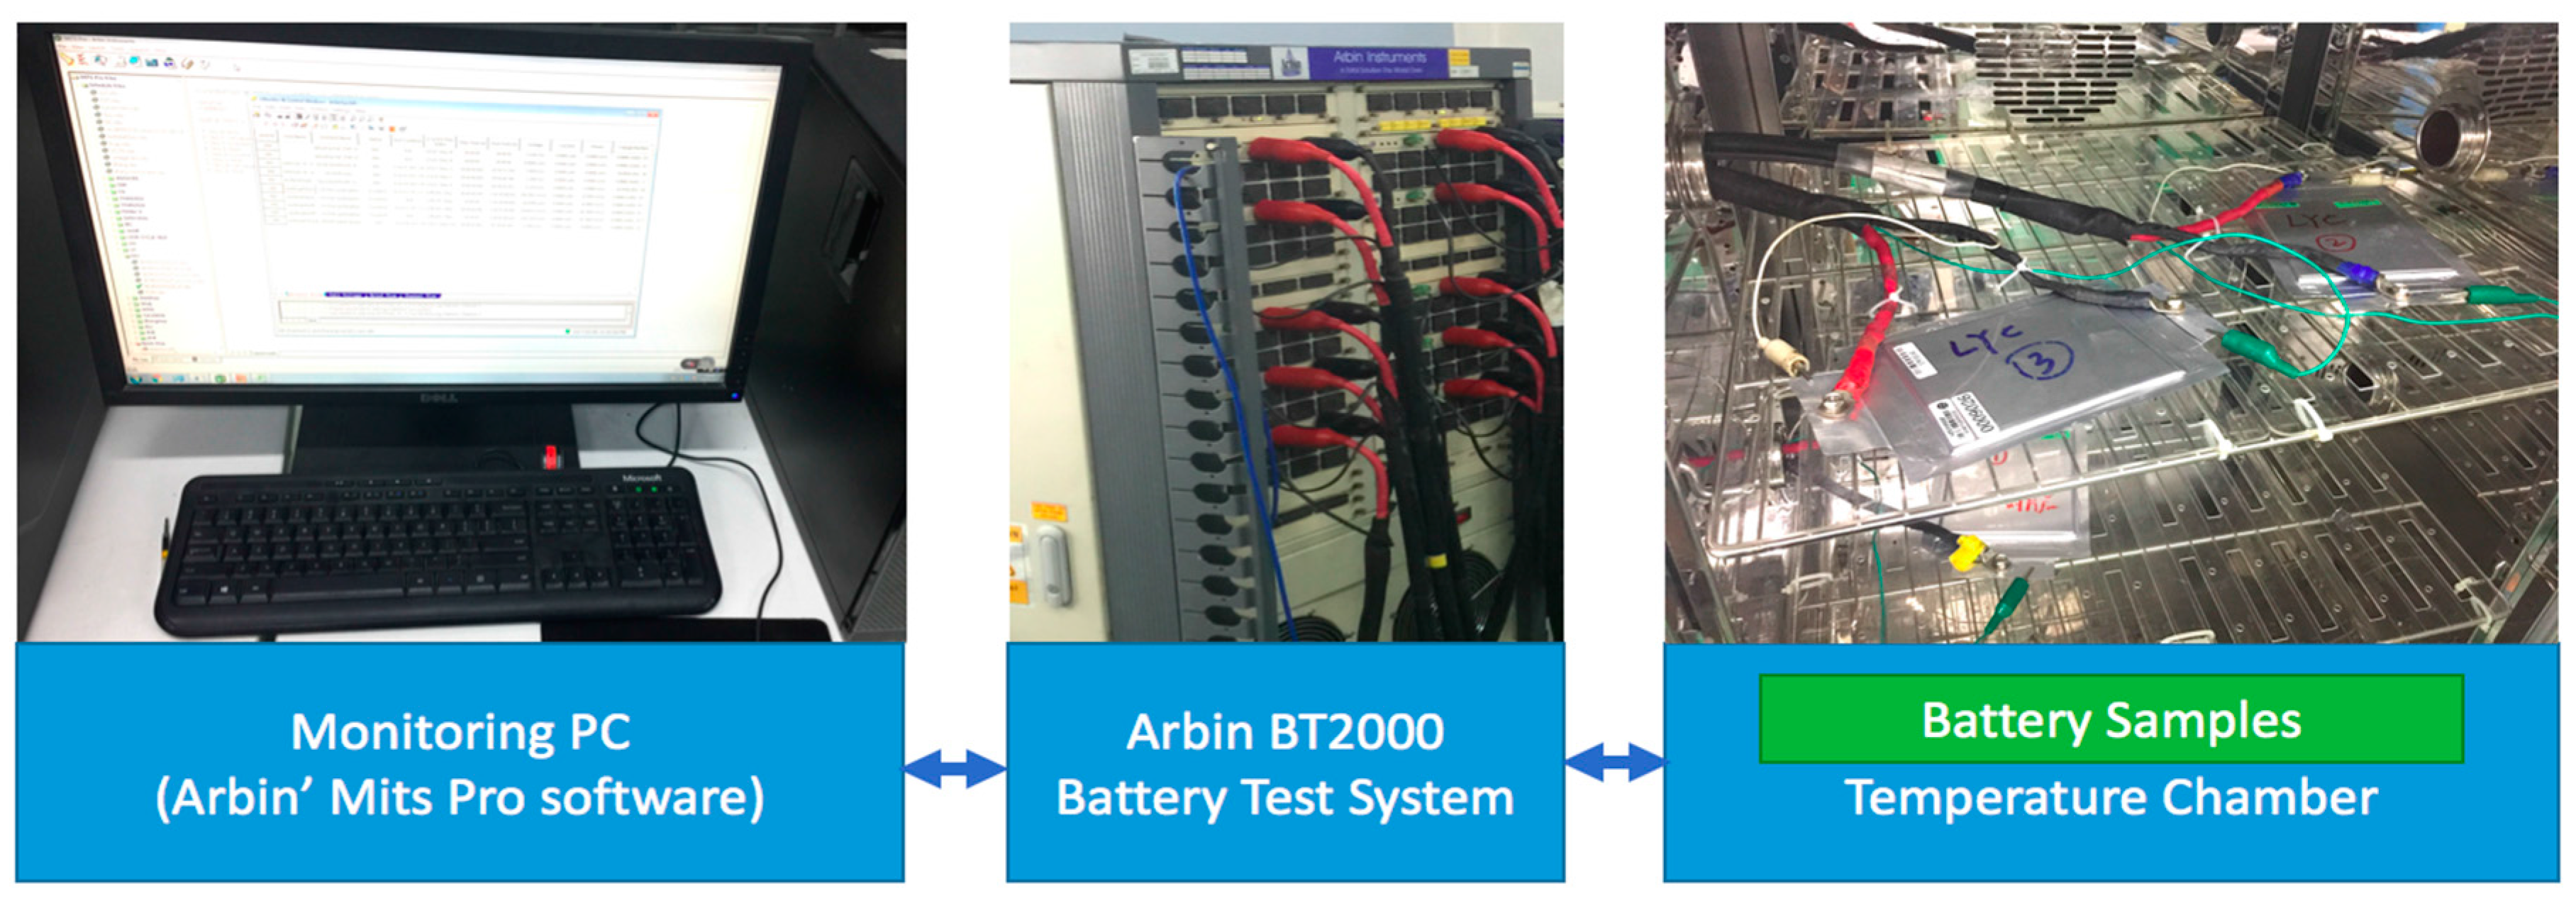
3. Basic Information about the Experiment

As shown in Figure 1, the experimental platform consists of the lithium titanate battery test samples, a constant climate chamber which can balance the temperature at 25 ± 2 °C, an Arbin BT2000 battery test system (Arbin Instrument, lush Brazos Valley, TX, USA) to charge and discharge the battery, and a PC with Arbin software (Arbin Instrument) to monitor the testing procedure and store data.
The test samples used in this research are the lithium titanate batteries whose alternative anode material is Li4Ti5O12. The nominal voltage of the test samples is 2.3 V and the nominal capacity is 8.5 Ah. The main properties of the batteries are listed in Table 1.
Li4Ti5O12 material has no structural change during the charge/discharge process, and as such, it is also called a zero-strain insertion material [42,43]. It offers a flat operating voltage around 2 V [42,44]. Figure 2a shows the activation process of the batteries. During the whole testing process, the batteries were put inside a constant climate chamber under a constant temperature of 25 °C. The working voltage of the lithium titanate batteries was between 1.5 V and 2.8 V. During the process, the batteries were fully charged with a constant current of 1C (1C equals 8.5 A) following the constant voltage of 2.8 V. Then, an hour of rest time between the charge process and discharge process enabled the batteries to reach chemical equilibrium. After that, the batteries were discharged with a constant current of 1C to 0% SOC. Figure 2b zooms in on the discharge process, with the discharge from 100% to 10% SOC, the voltage slightly drops down from 2.6 V to 2.3 V, and when the SOC is below 10%, the voltage reaches a catastrophic point and drops dramatically to 1.5 V.

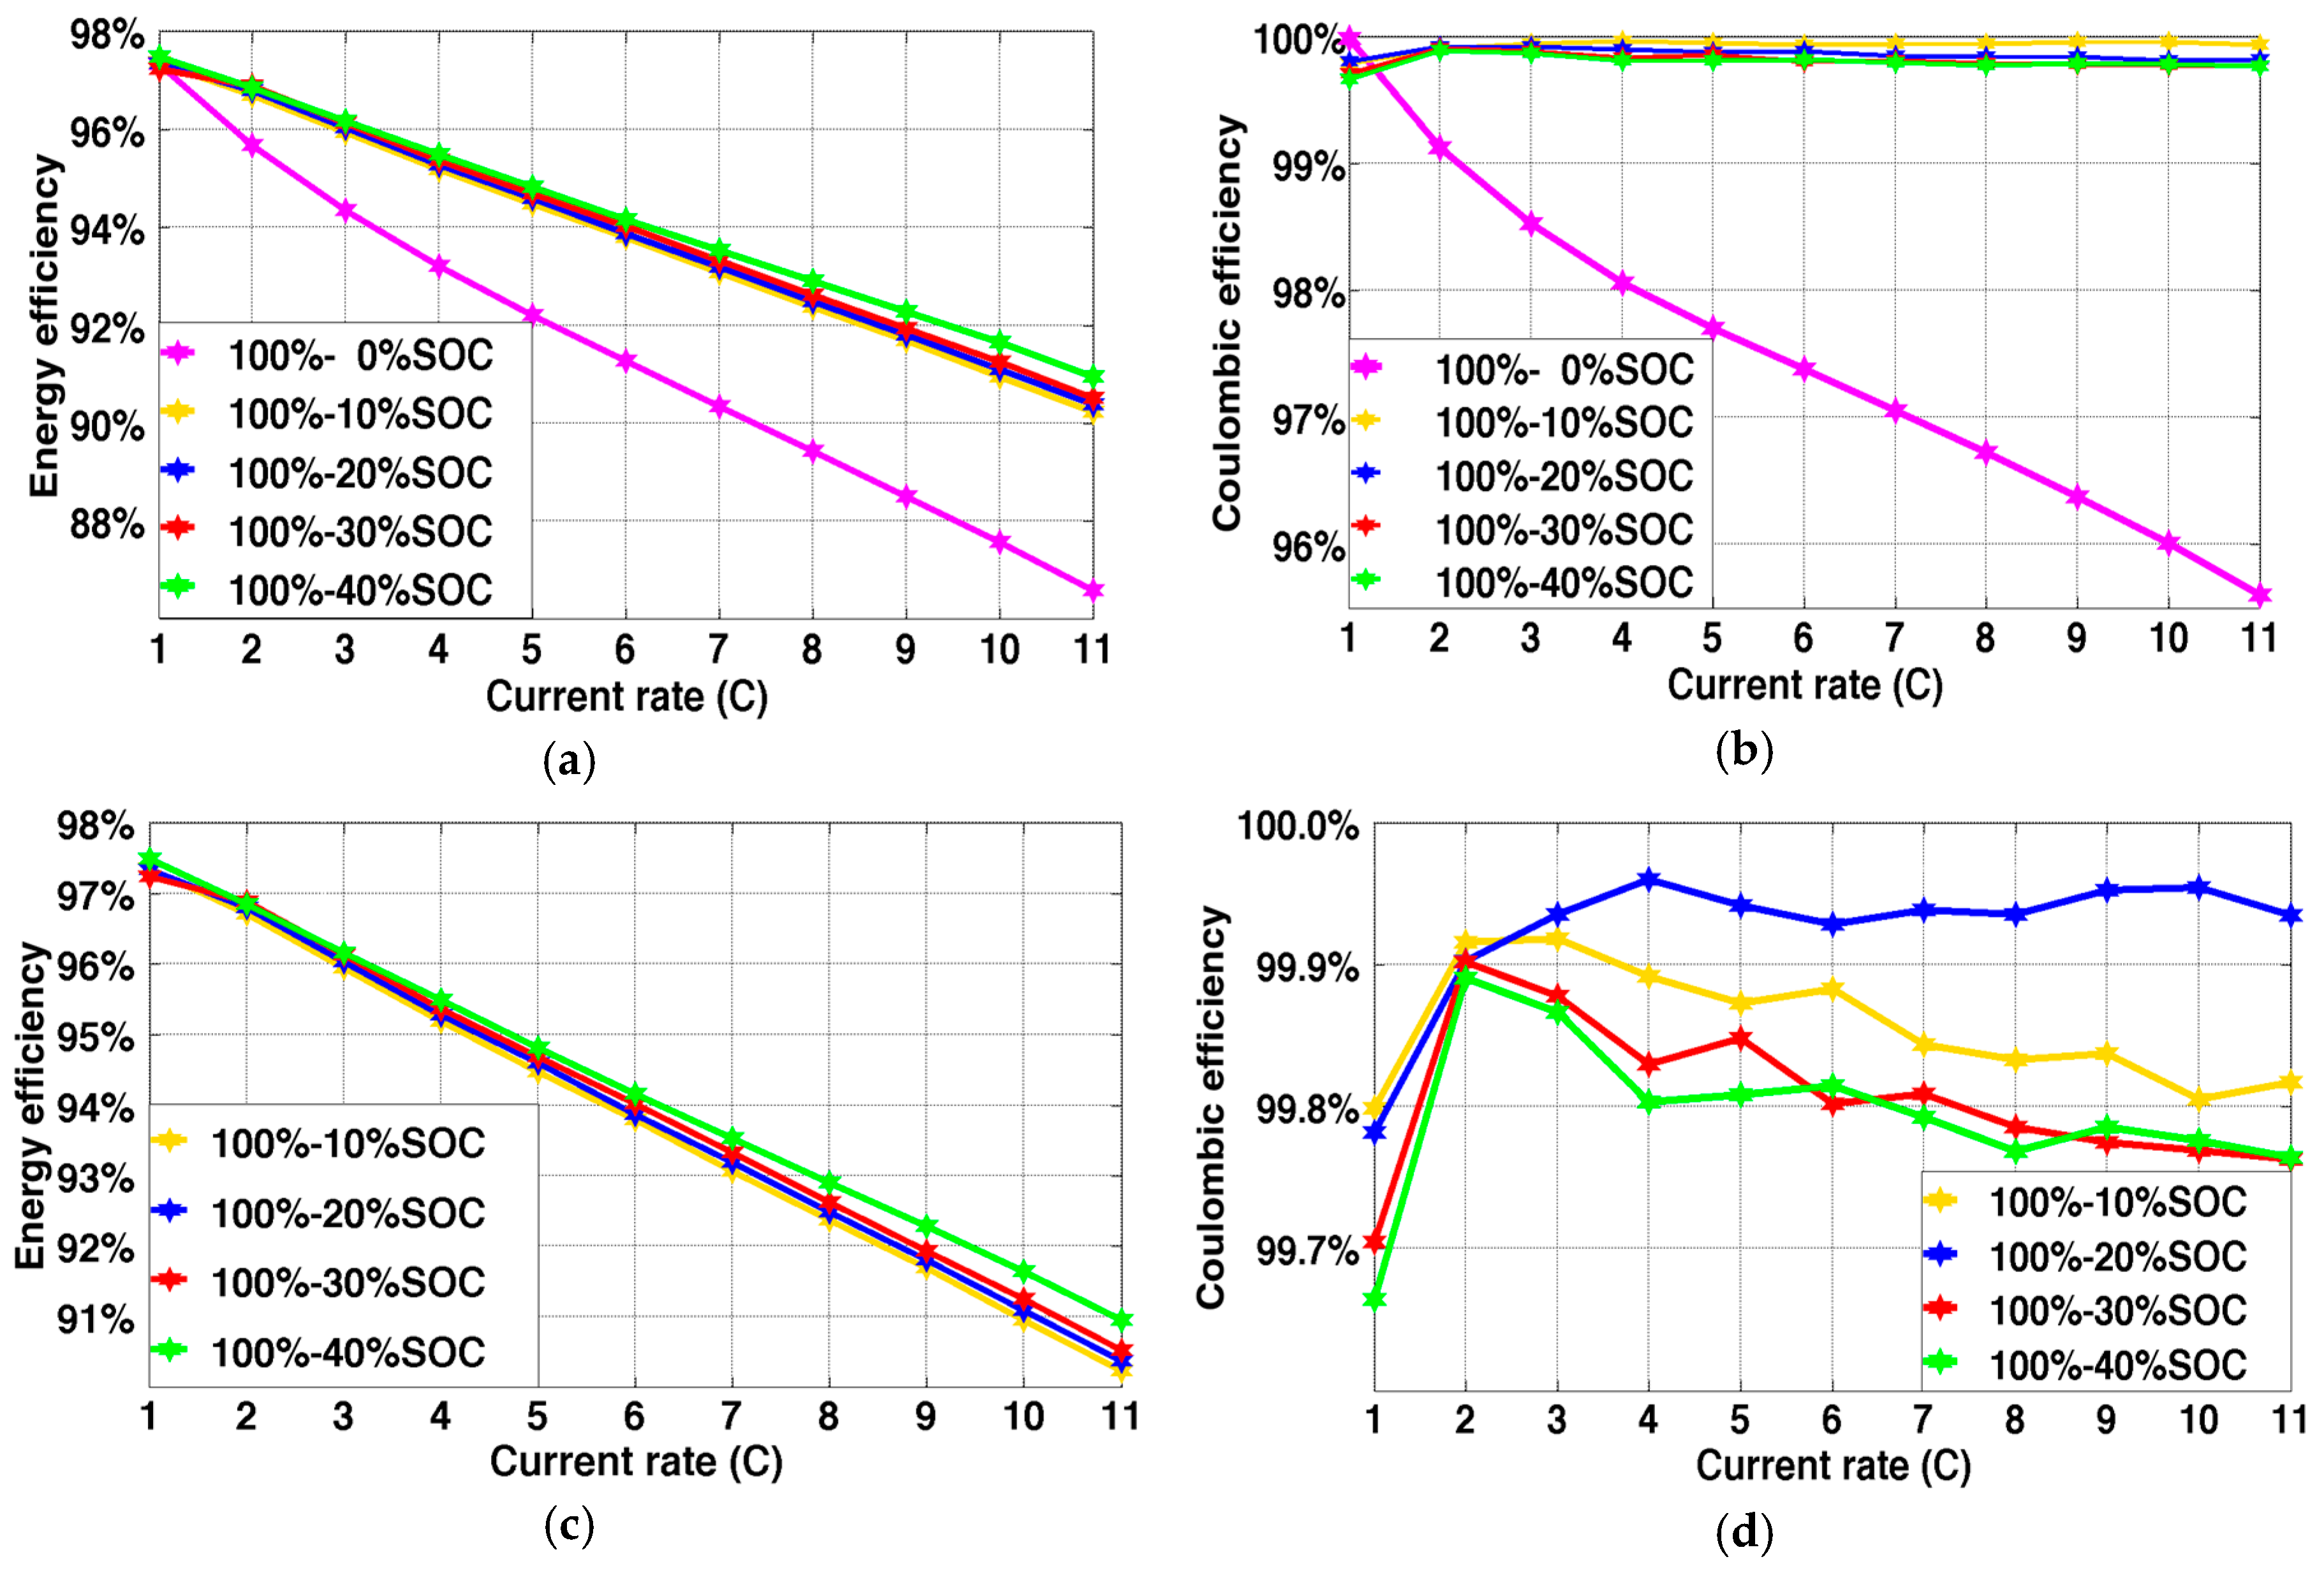
4. Efficiency Test When Fully Charged and Not Fully Discharged
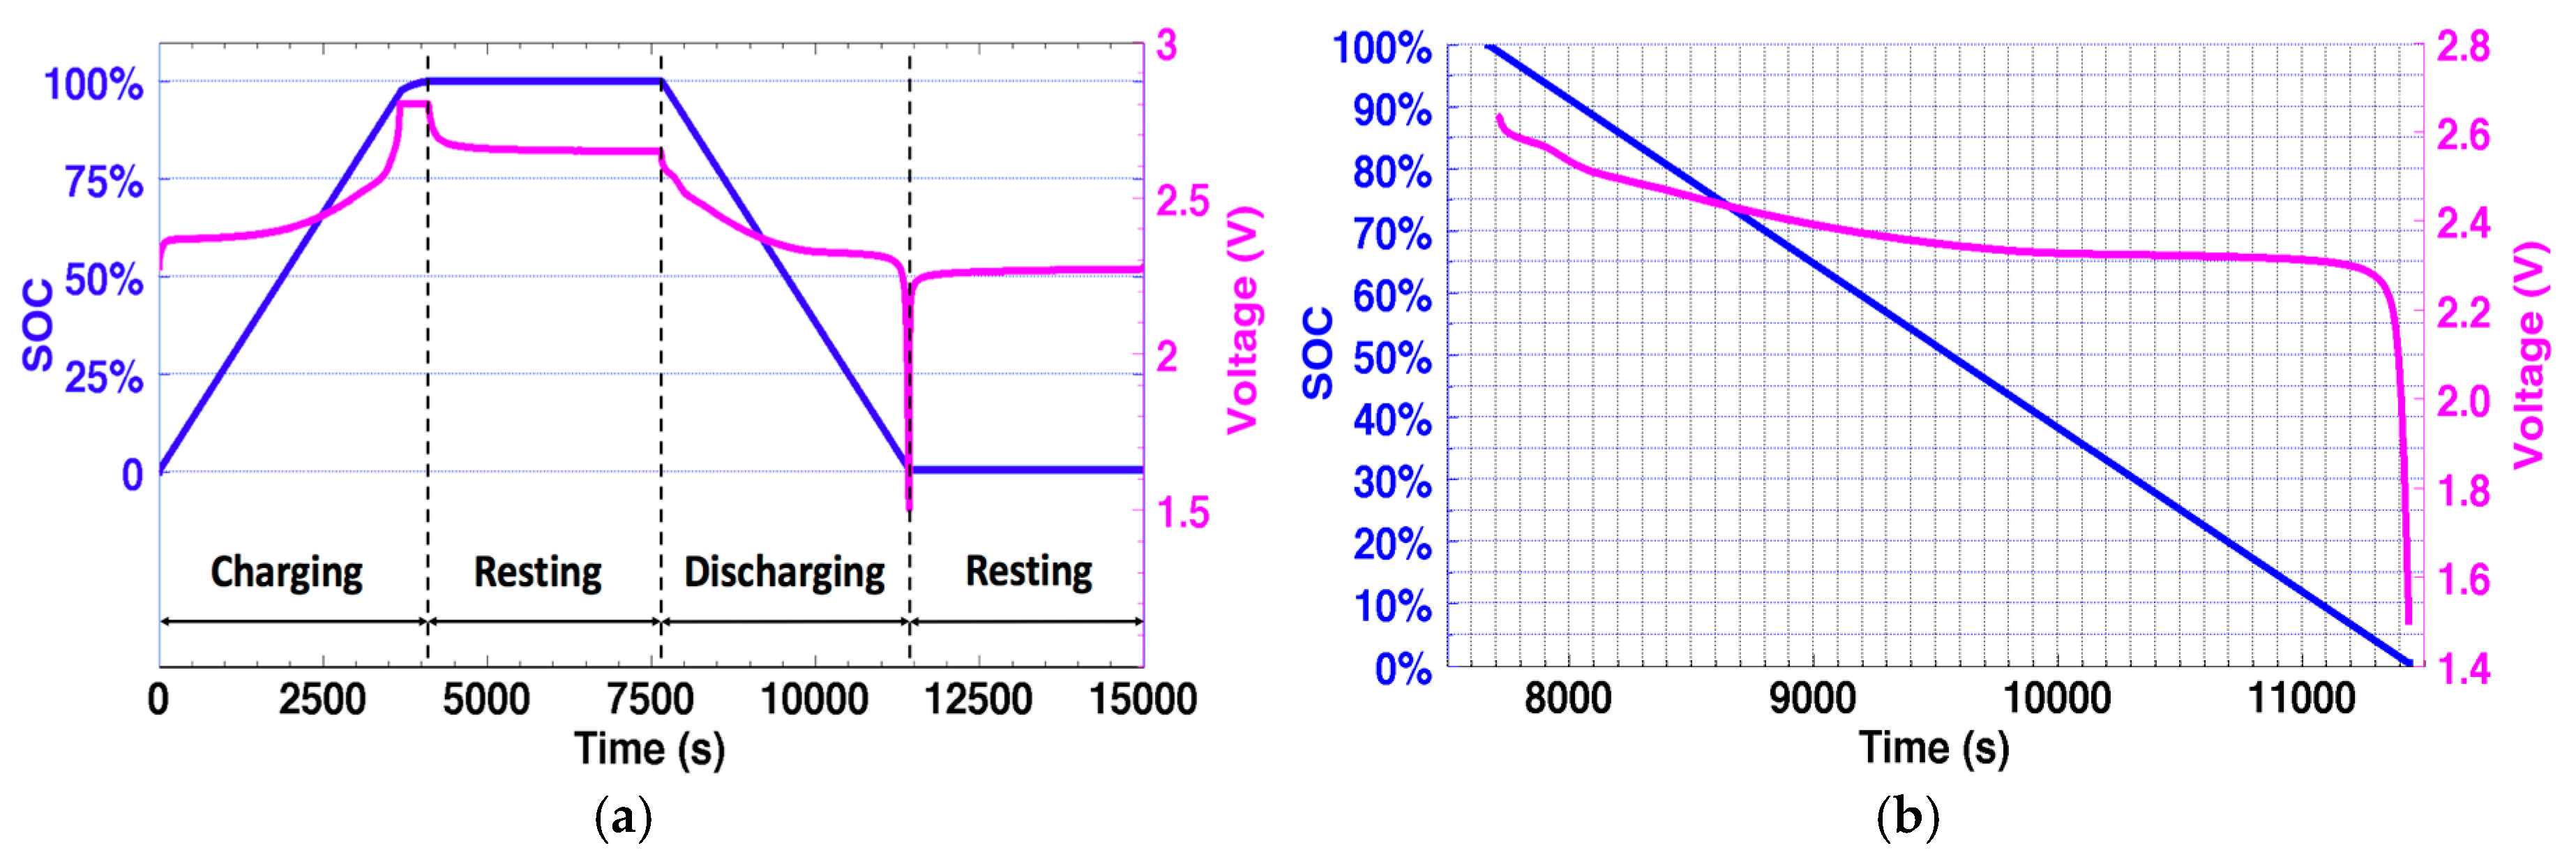
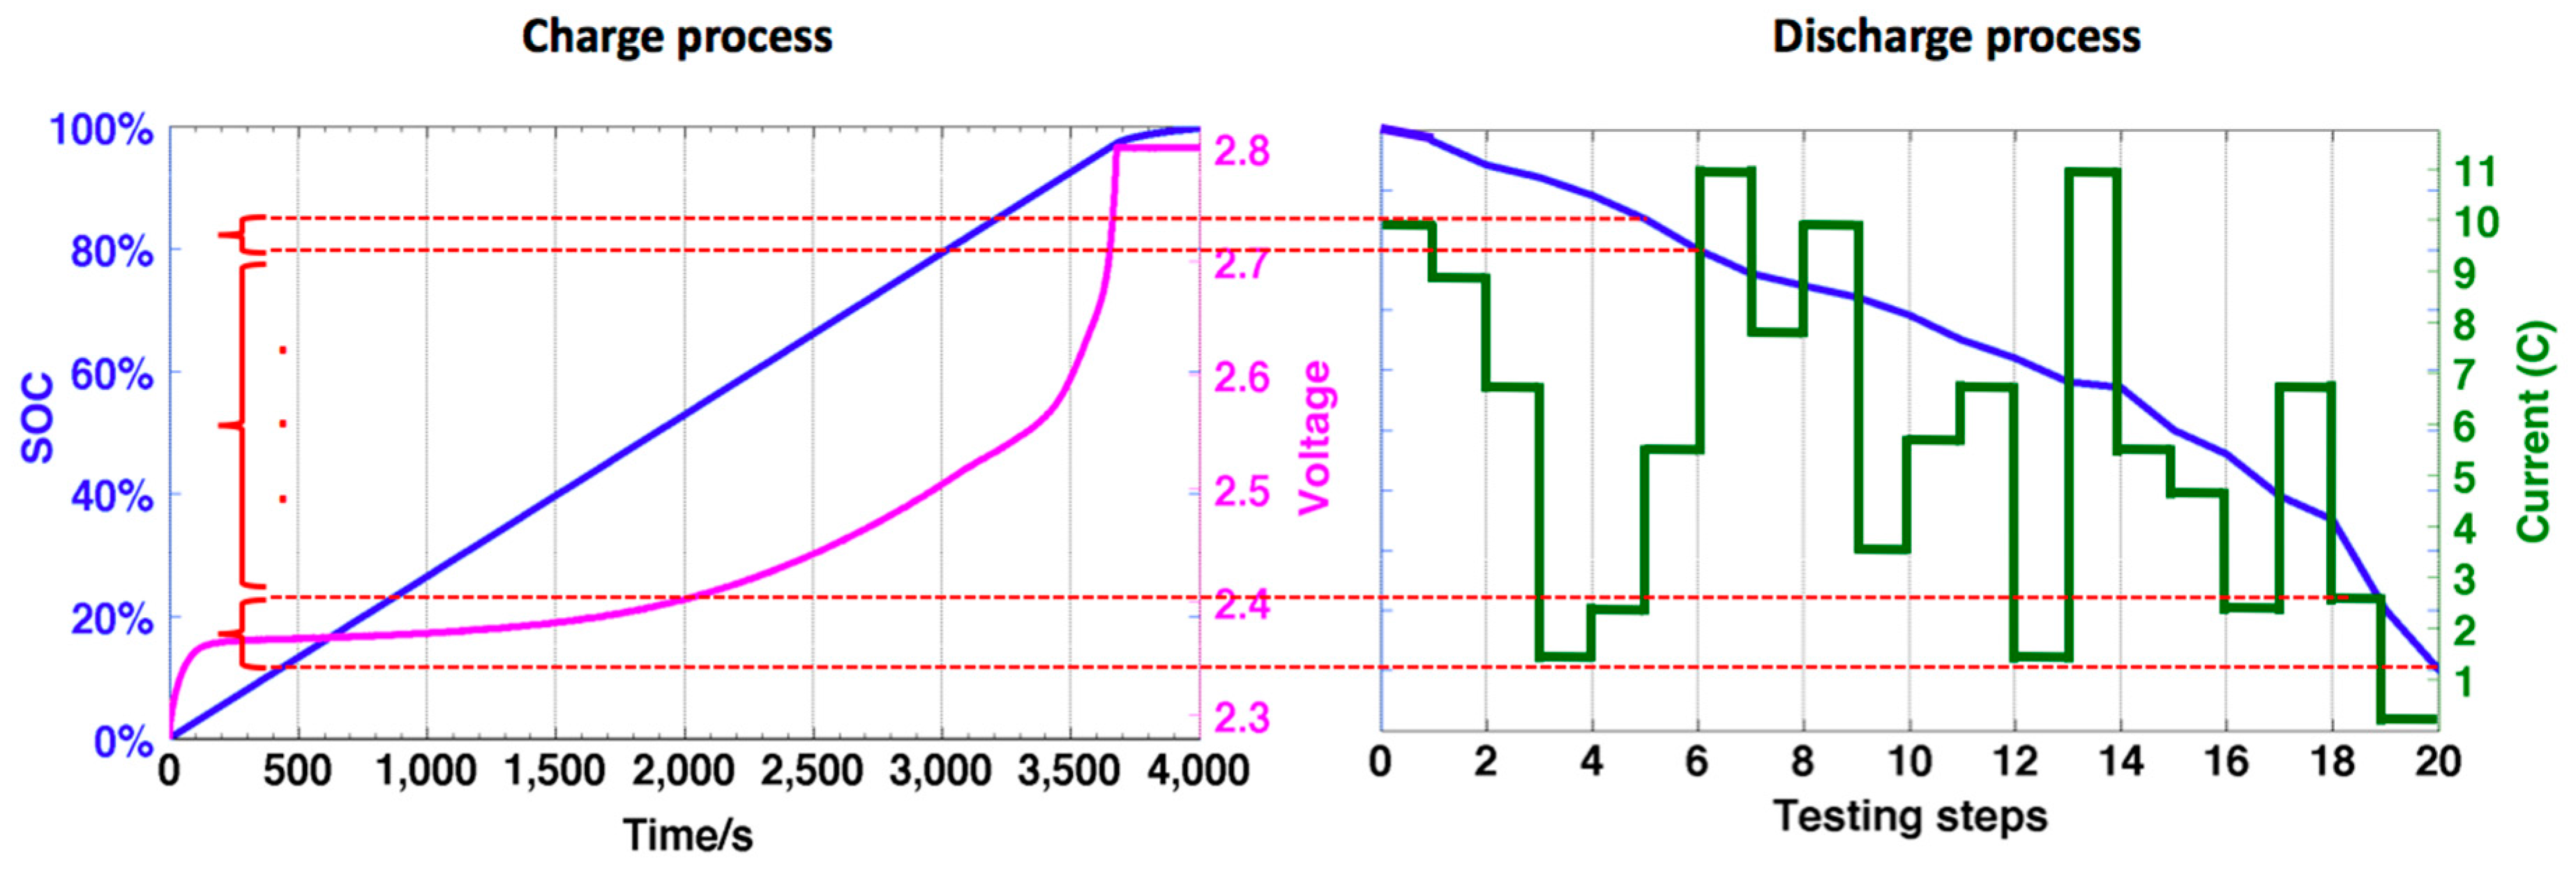
Considering the sharp drop in voltage when the SOC was extremely low, the batteries were initially tested under a moderately stable condition, in which the minimum SOC of the batteries was over 10%. Two main variables, the SOC region and the discharge current, were taken into consideration. The SOC regions of the testing cycle were [100%, 10%], [100%, 20%], [100%, 30%], and [100%, 40%], respectively. For each SOC region, the batteries were discharged under different discharge current rates from 1C to 11C, which covered the majority of the required discharge current rates of the power system in electric vehicles.

4.1. Test Cycle

Before the test procedure began, the batteries were fully charged/discharged over 10 cycles for activation as presented in Figure 2. In the testing cycle, every test cycle was repeated three times for each battery. In order to reduce the testing error, the average efficiencies obtained by the same test cycles were used to train the final model.
A procedure to minimize the polarization was needed at the beginning of each test cycle, which repeated the process of activation. After this procedure, the batteries were prepared for the following testing process. In the testing process, the batteries were fully charged with a constant 1C current rate to 2.8 V following the constant voltage of 2.8 V. Then, an hour of resting time was needed to ensure that the batteries return to chemical equilibrium. After that, the batteries were discharged with the chosen constant current rate to the specific SOC according to each testing SOC regions, followed by another one hour of resting time. In order to make sure the battery cells were fully discharged before the next step, another 1C-rate discharge to 0% SOC was needed, and after one hour-resting time to minimize the polarization effect, the next test cycle was ready to be launched.

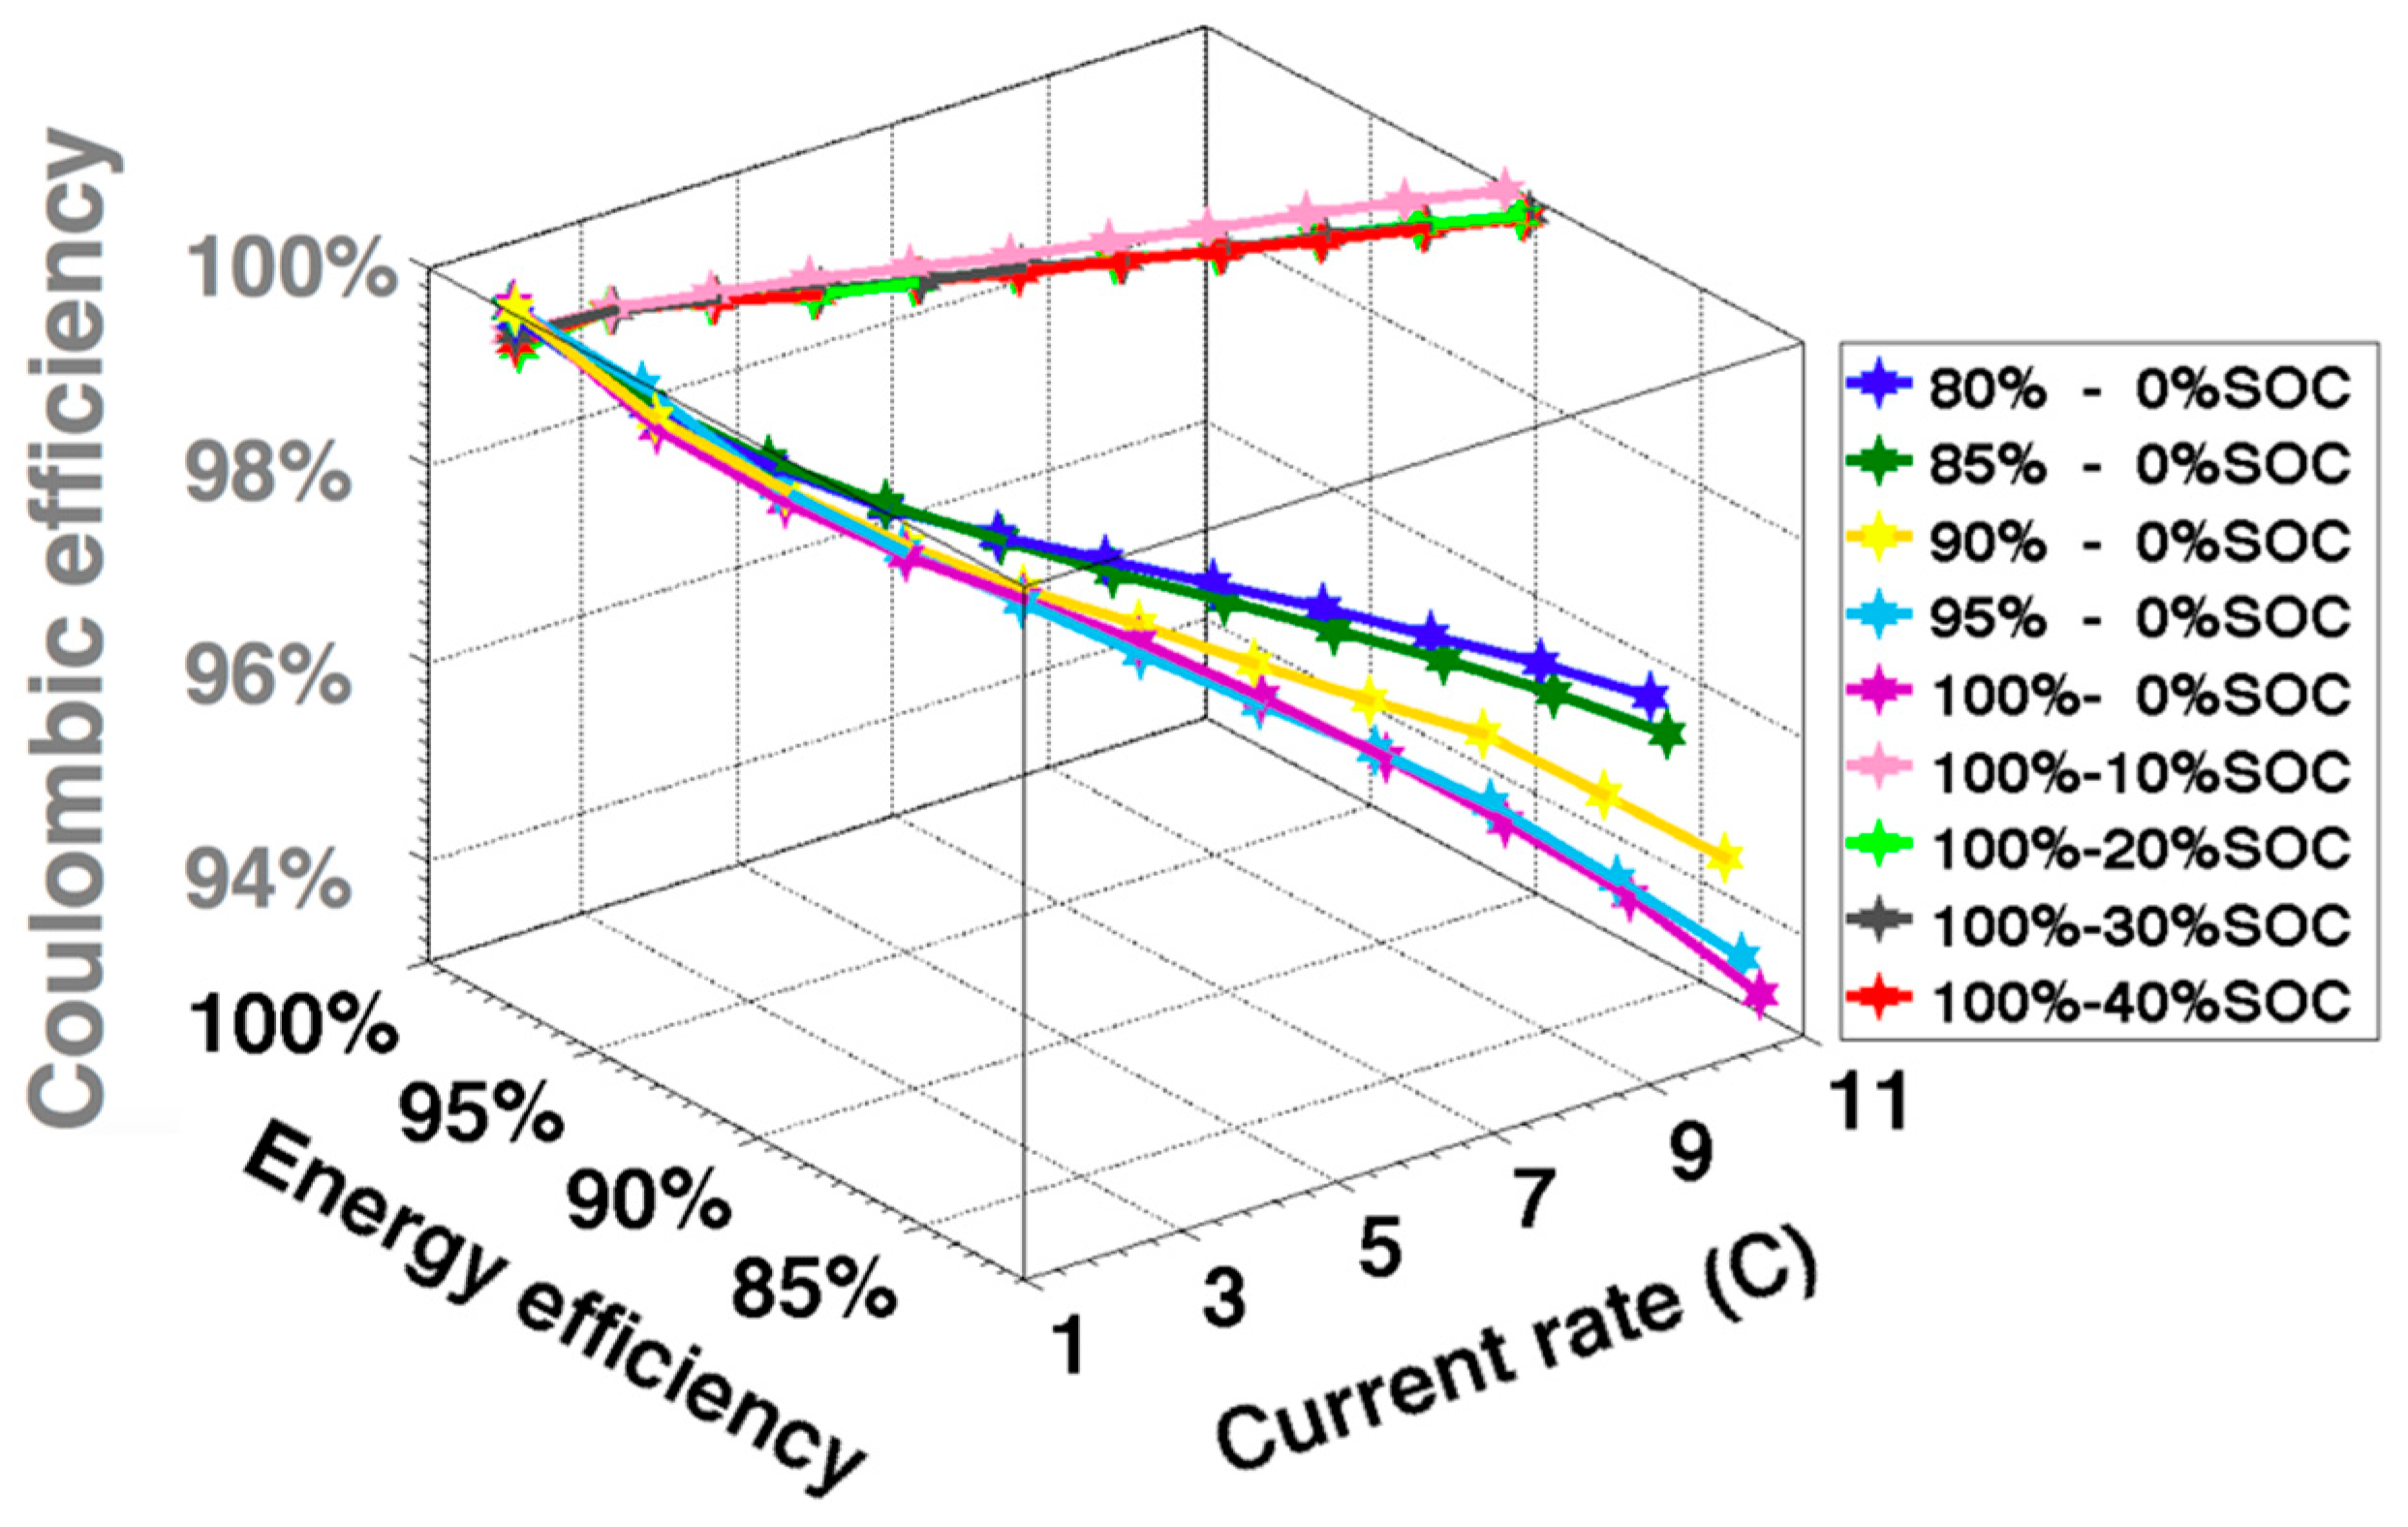
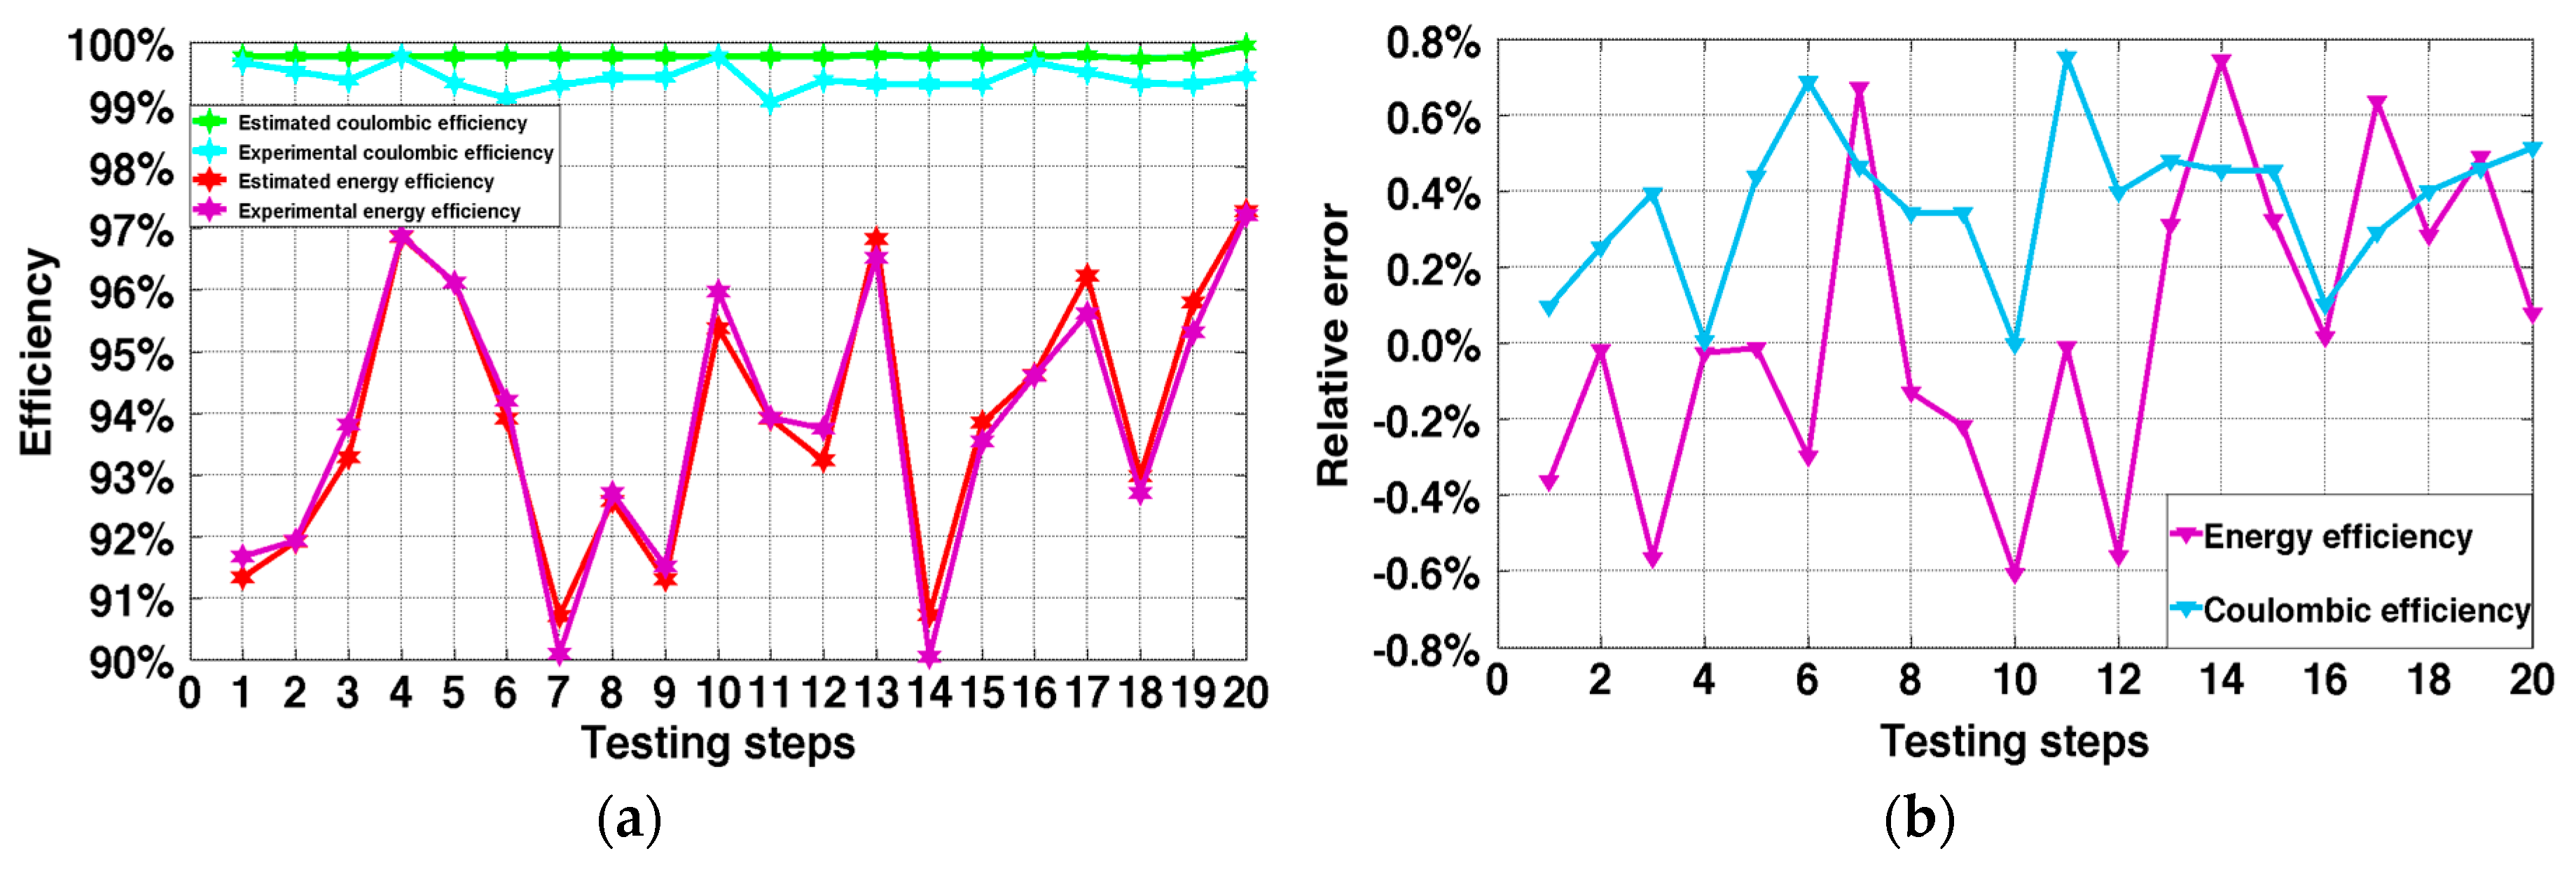
4.2. Result Analysis

Figure 3 shows the efficiency results under different SOC regions and discharge current rates. Figure 3a,b compares the energy and coulombic efficiency of the batteries for the non-fully discharged cycles with one full discharge cycle (a cycle works between 100% and 0% SOC). From Figure 3a,b, obvious differences can be observed for the [100%, 0%] SOC cycle, which shows a large decrease both in energy efficiency and coulombic efficiency when compared to the non-fully discharged curves. Considering the relationship between SOC and the battery’s internal resistance, when the battery is nearly fully discharged, only a small trace of electrochemical reactions occur inside the battery, and the internal resistance rises sharply in an extremely low SOC. According to the results shown in Figure 3a,b, this phenomenon results in a 5%, or greater, loss of the energy efficiency and coulombic efficiency.
Figure 3c,d zoom in the efficiency results when the batteries were not fully discharged, which cycles in the [100%, 10%], [100%, 20%], [100%, 30%], and [100%, 40%] SOC regions. All of these cycles were launched over 10% SOC where the batteries were operating around 2.45 V, according to Figure 2. The results in Figure 3c demonstrate that the energy efficiency-discharge current rate curve varies linearly. Most of the energy loss is caused by thermal consumption of internal resistance. Due to the stable internal resistance with improved current rates, the energy efficiency drops linearly from 97–98% to 90–91% when the discharge current rates increase from 1C to 11C. In comparison with the cycles in different SOC regions, there is only a slight increase in the internal resistance when the cut-off SOC declines, so the energy efficiency decreases when the cut-off discharge SOC is lower, while the variation of efficiency is limited to less than 1%. Figure 3d reveals that the coulombic efficiencies of these tests are all over 99%, indicating that the batteries are working well under test conditions in which they are not fully discharged.

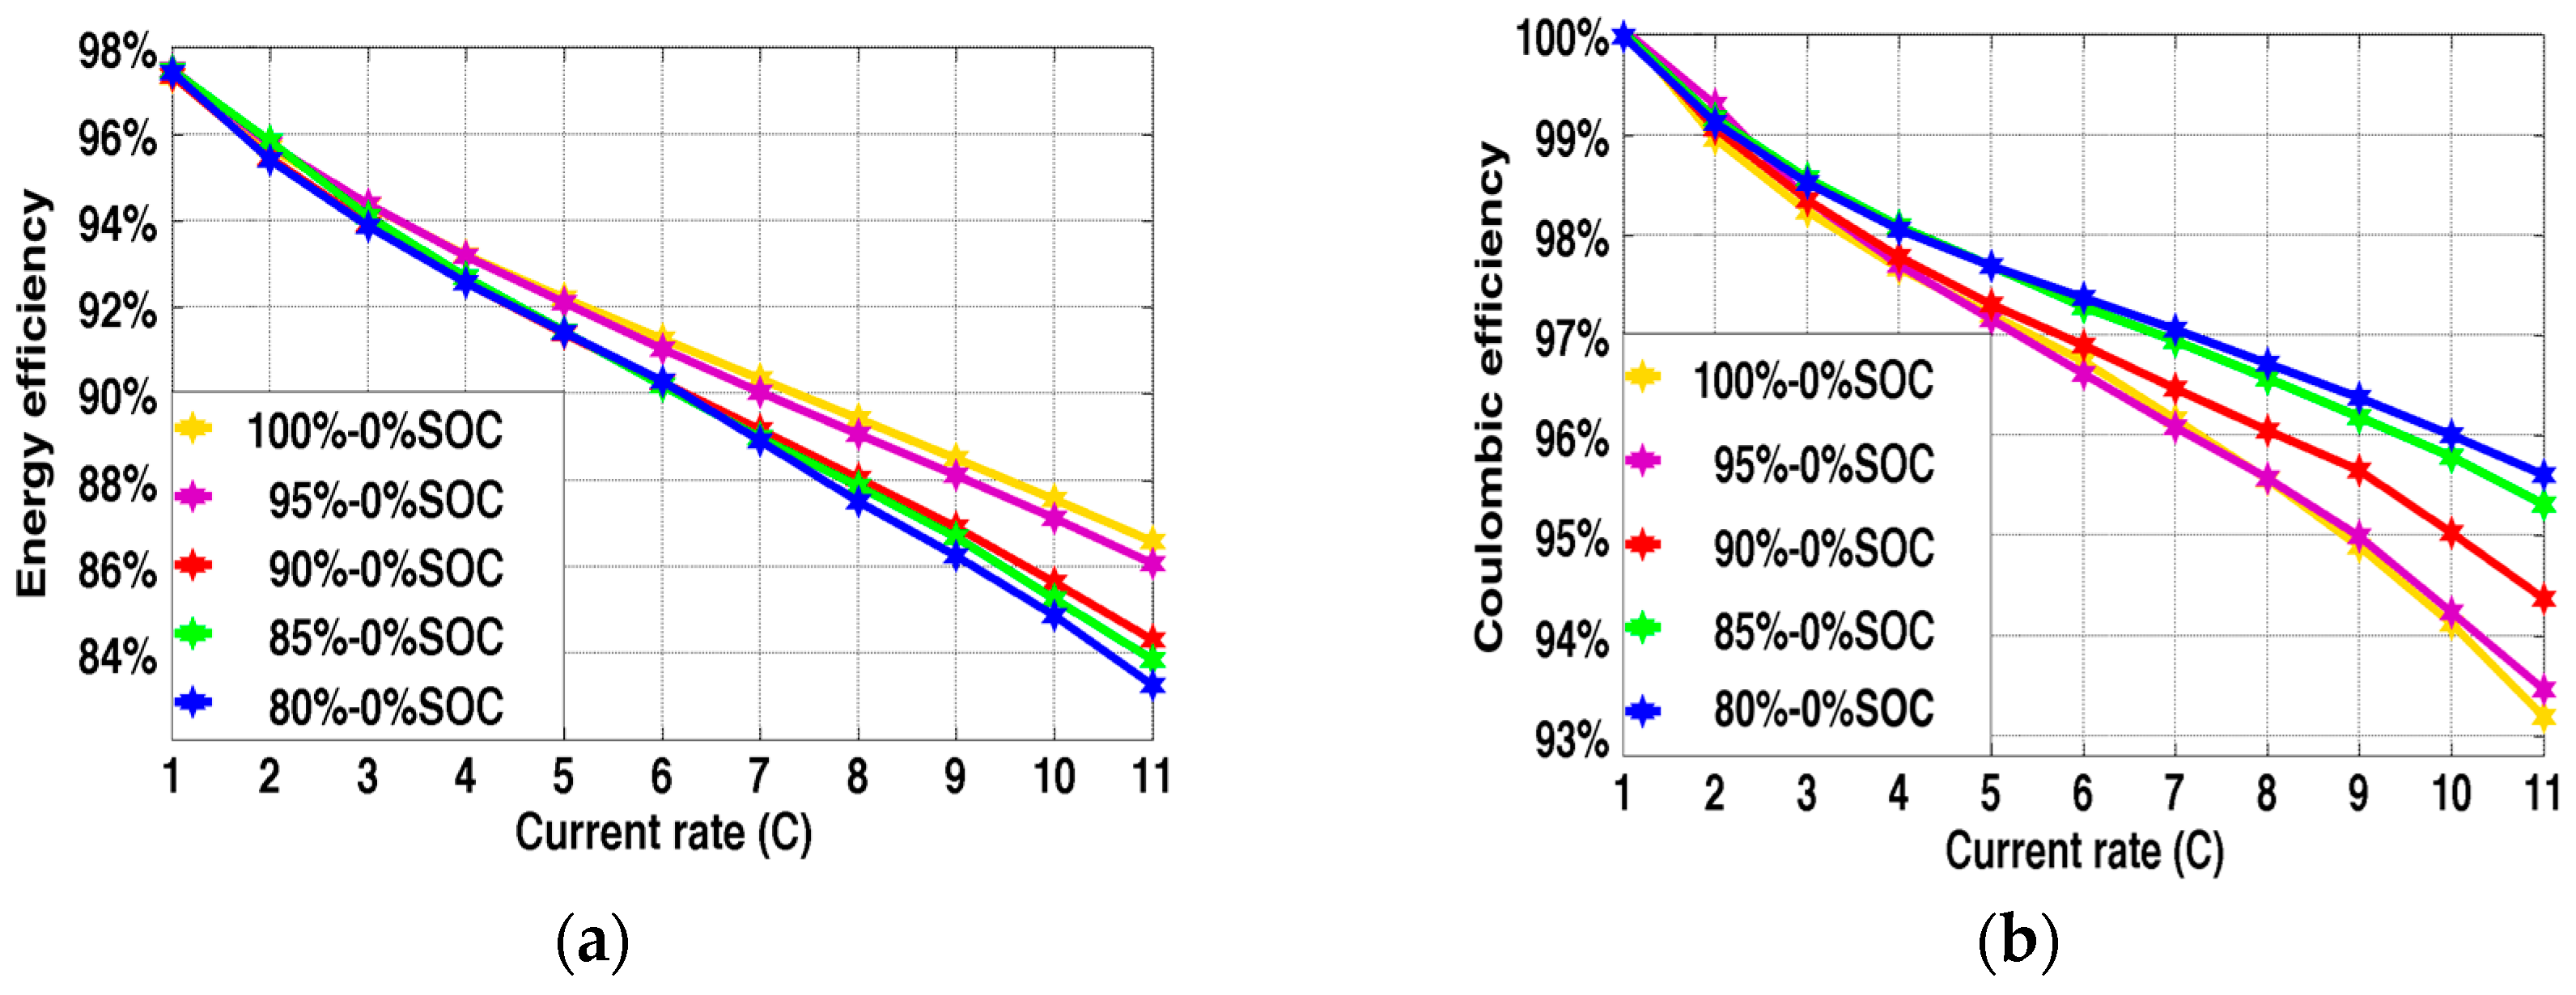
5. Efficiency Test When Fully Discharged and Not Fully Charged

Next, the situation when the charge time is limited and the batteries are not being fully charged before coming into service was considered. In this part of experiment, the batteries were tested when not fully charged to 100% SOC and fully discharged to the cut-off voltage of 1.5 V. The SOC regions of the testing cycle were [100%, 0%], [95%, 0%], [90%, 0%], [85%, 0%], and [80%, 0%], respectively. For each SOC region, the batteries were discharged under different discharge current rates from 1C to 11C.

5.1. Test Cycle

Similar to the test cycle in Section 4.1, activation and minimum polarization procedures were also needed. During the testing process, the batteries were charged with a constant 1C current rate to the maximum SOC of each test. Then, an hour of resting time was needed to make sure that the batteries return to chemical equilibrium. After that, the batteries were fully discharged to 0% SOC with the chosen constant current rate followed by one hour of resting time. In order to minimize the polarization effect for the next step, another 1C-rate discharge to 0% SOC was needed. After one hour of resting time, another test cycle was able to be launched.

5.2. Result Analysis

Figure 4 represents the energy and coulombic efficiency of the cycles in the [100%, 0%], [95%, 0%], [90%, 0%], [85%, 0%], and [80%, 0%] SOC regions. In Figure 4a, due to the effect of internal resistance, energy efficiency drops when discharge current rates increase while, in comparison with the non-fully discharged condition, the energy efficiency drops from 97–98% to 80–87% (the non-fully discharged curves are all over 90%). The energy loss of each cycle is much lower when the cut-off charge SOC is higher. As for the coulombic efficiency in Figure 4b, they decrease to 93–96%, which are much lower than the non-fully discharged conditions in Figure 4b. The 100–0% SOC cycle presents the minimum coulombic efficiency among all of the SOC region cycles. In contrast to the energy efficiency, when the cut-off SOC region decreases, the coulombic efficiency rises.

6. BP Network Continuous-Time Efficiency Estimation Model
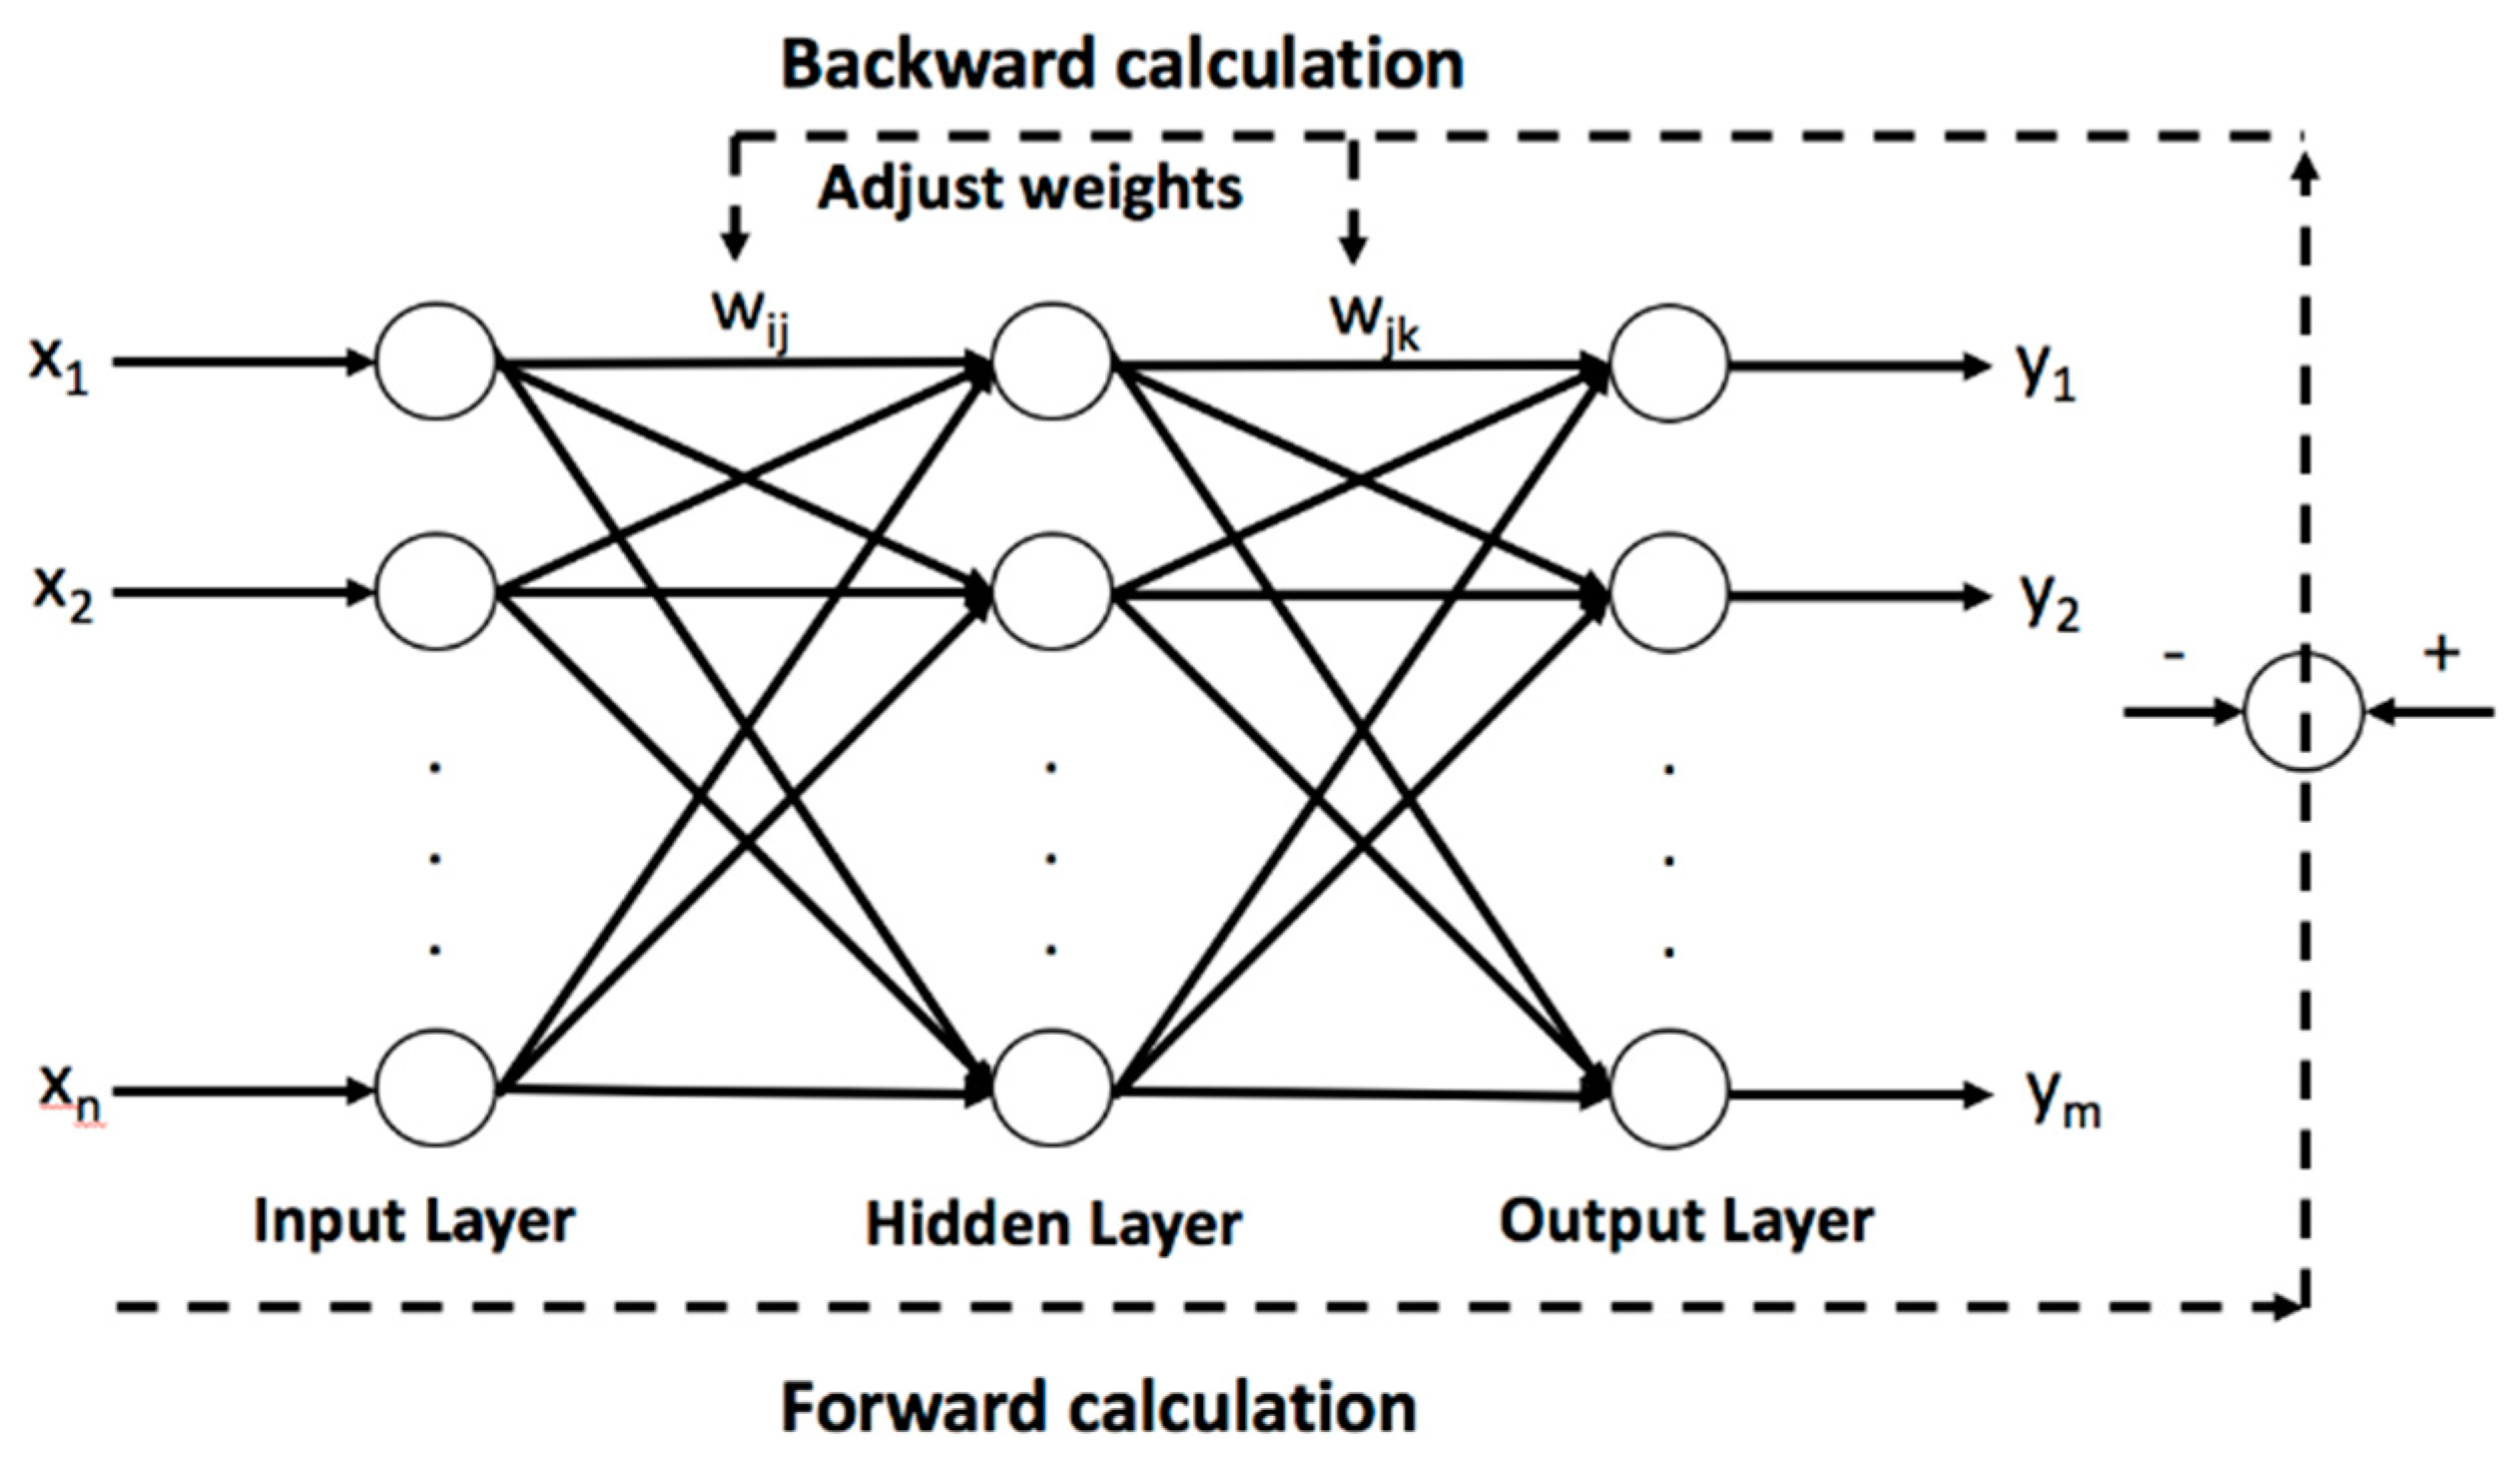
From the definition of efficiency in the Section 2, efficiency can be tested only when the charge process and the discharge process are applied within the same SOC region. In order to measure and compare the efficiency under different conditions, in each test cycle of Section 4 and Section 5, charge/discharge current rates were fixed to make sure that all the variables are fixed during each testing process. In real applications the discharge current may vary in continuous time which makes it such that the efficiency is unable to be tested by the experimental method presented in Section 4 and Section 5. Since monitoring the efficiency in continuous time can be helpful for managing battery performance, an estimation method is necessary to simulate the battery efficiency in continuous time. This part presents a back propagation neural network model to estimate the continuous-time lithium ion battery efficiency based on the data collected in the aforementioned experiments.

6.1. BP Network

An artificial neural network is a learning-based prediction system which imitates the structure and function of human brain cells. It has been applied to study technologies in biology, physics, electronics, mathematics and computers. Due to its excellent capability for non-linear mapping and self-learning [45], it has a very broad application prospects.
A common feed-forward type of ANN usually consists of three types of layers: the input layer, the hidden layers and the output layer. The units of each layer perform a biased weighted sum of their inputs and transfer this activation through a transfer function to create outputs. In the network, units are arranged in a layered feed-forward topology [46].
In 1986, Rumelart [47] proposed an algorithm called the back-propagation network, as shown in Figure 5, in which the training data are propagated backwards minimizing the error by tuning the parameters of the ANN [47]. Due to the limitations of calculation technology when the BP algorithm was developed, it was not widely used. In recent years, with rapid developments in computer science, the BP network has been widely employed for training multilayer connectionist learning systems with nonlinear activation functions, where such systems include a forward-propagating data stream and error signal anti-propagation [48].
Based on the data collected in the experiment, a BP neural network is proposed to estimate and simulate the battery efficiency under continuous-time working conditions with given discharge current rates and SOC regions. During the testing process, as a constant climate chamber is used to balance the temperature at 25 ± 2 °C. In this research, we consider temperature as a fixed variable.
In the simulation study, a BP network was established to predict the efficiency under different working conditions. Figure 6 shows the structure of the BP network used for simulation. In the BP network, three properties including the discharge current rate, the maximum SOC, and the minimum SOC of each SOC region, are required. Energy efficiency and coulombic efficiency are the two outputs of the system.

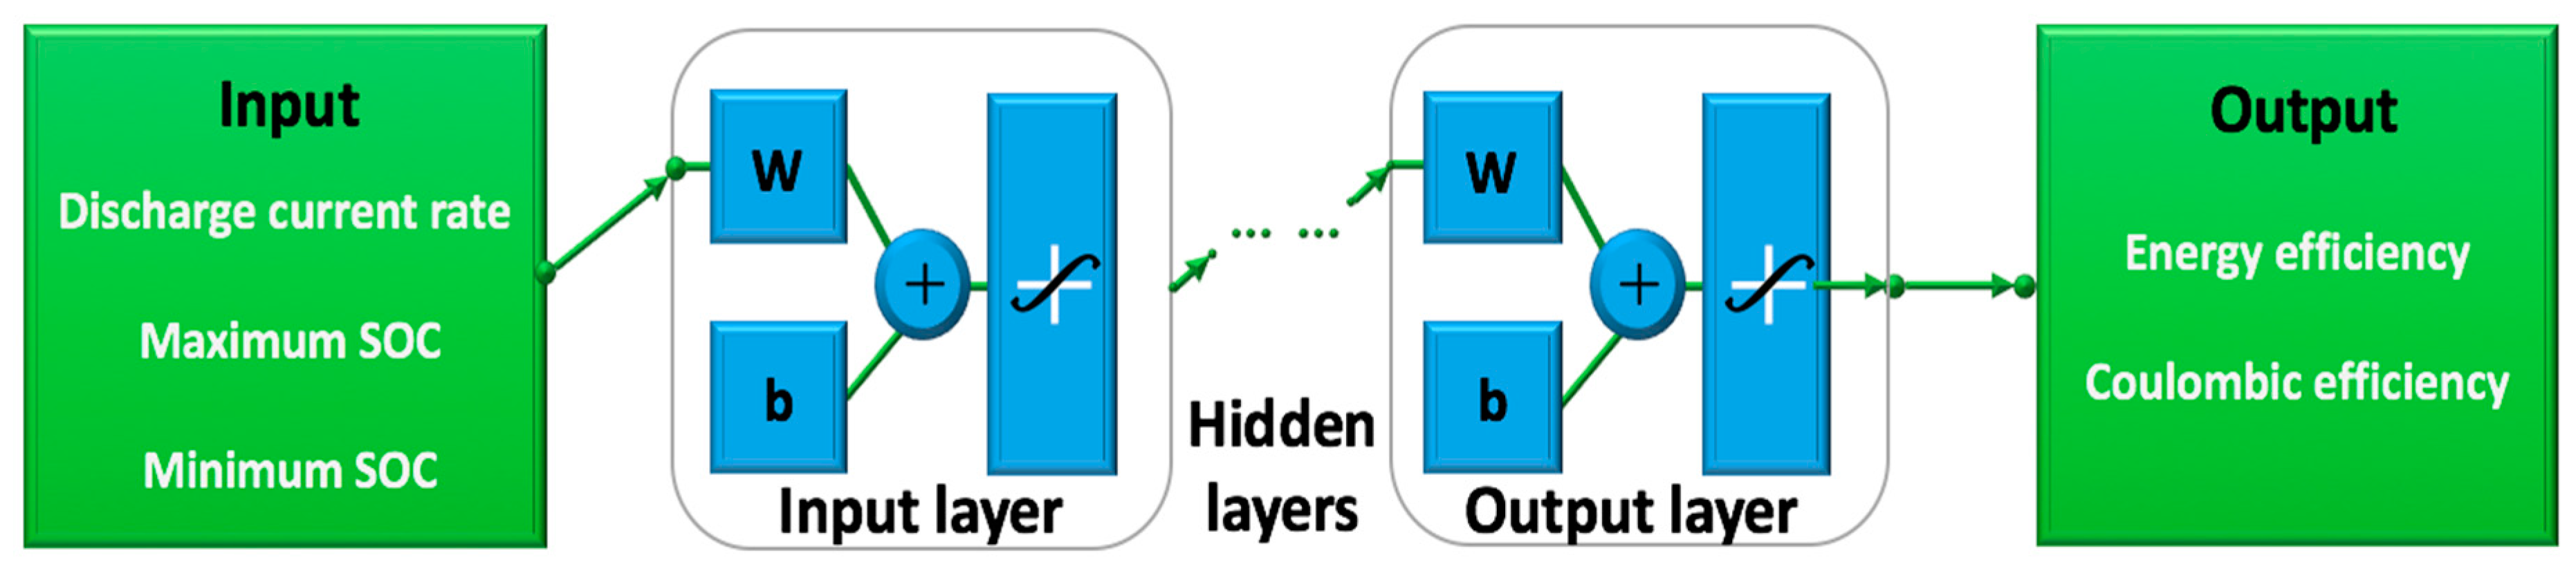
6.2. A Data-Driven Learning-Based System

6.2.1. Collecting Data

Figure 7 shows the experimental results of Section 4 and Section 5, which shows the comprehensive relationship among discharge current rate, SOC region, and efficiency. During the test procedure of Section 4 and Section 5, in order to limit testing error, the data collected from three 8.5 Ah lithium titanate batteries were used as the control group. For each different testing cycle, three of the same cycles were tested for each battery to ensure reliability of the results. The data were collected every second at a 1C rate and every 0.1 s if the discharge current rate was greater than 1C. During the whole process, over eight million datasets were collected which were in turn used to train the BP network.

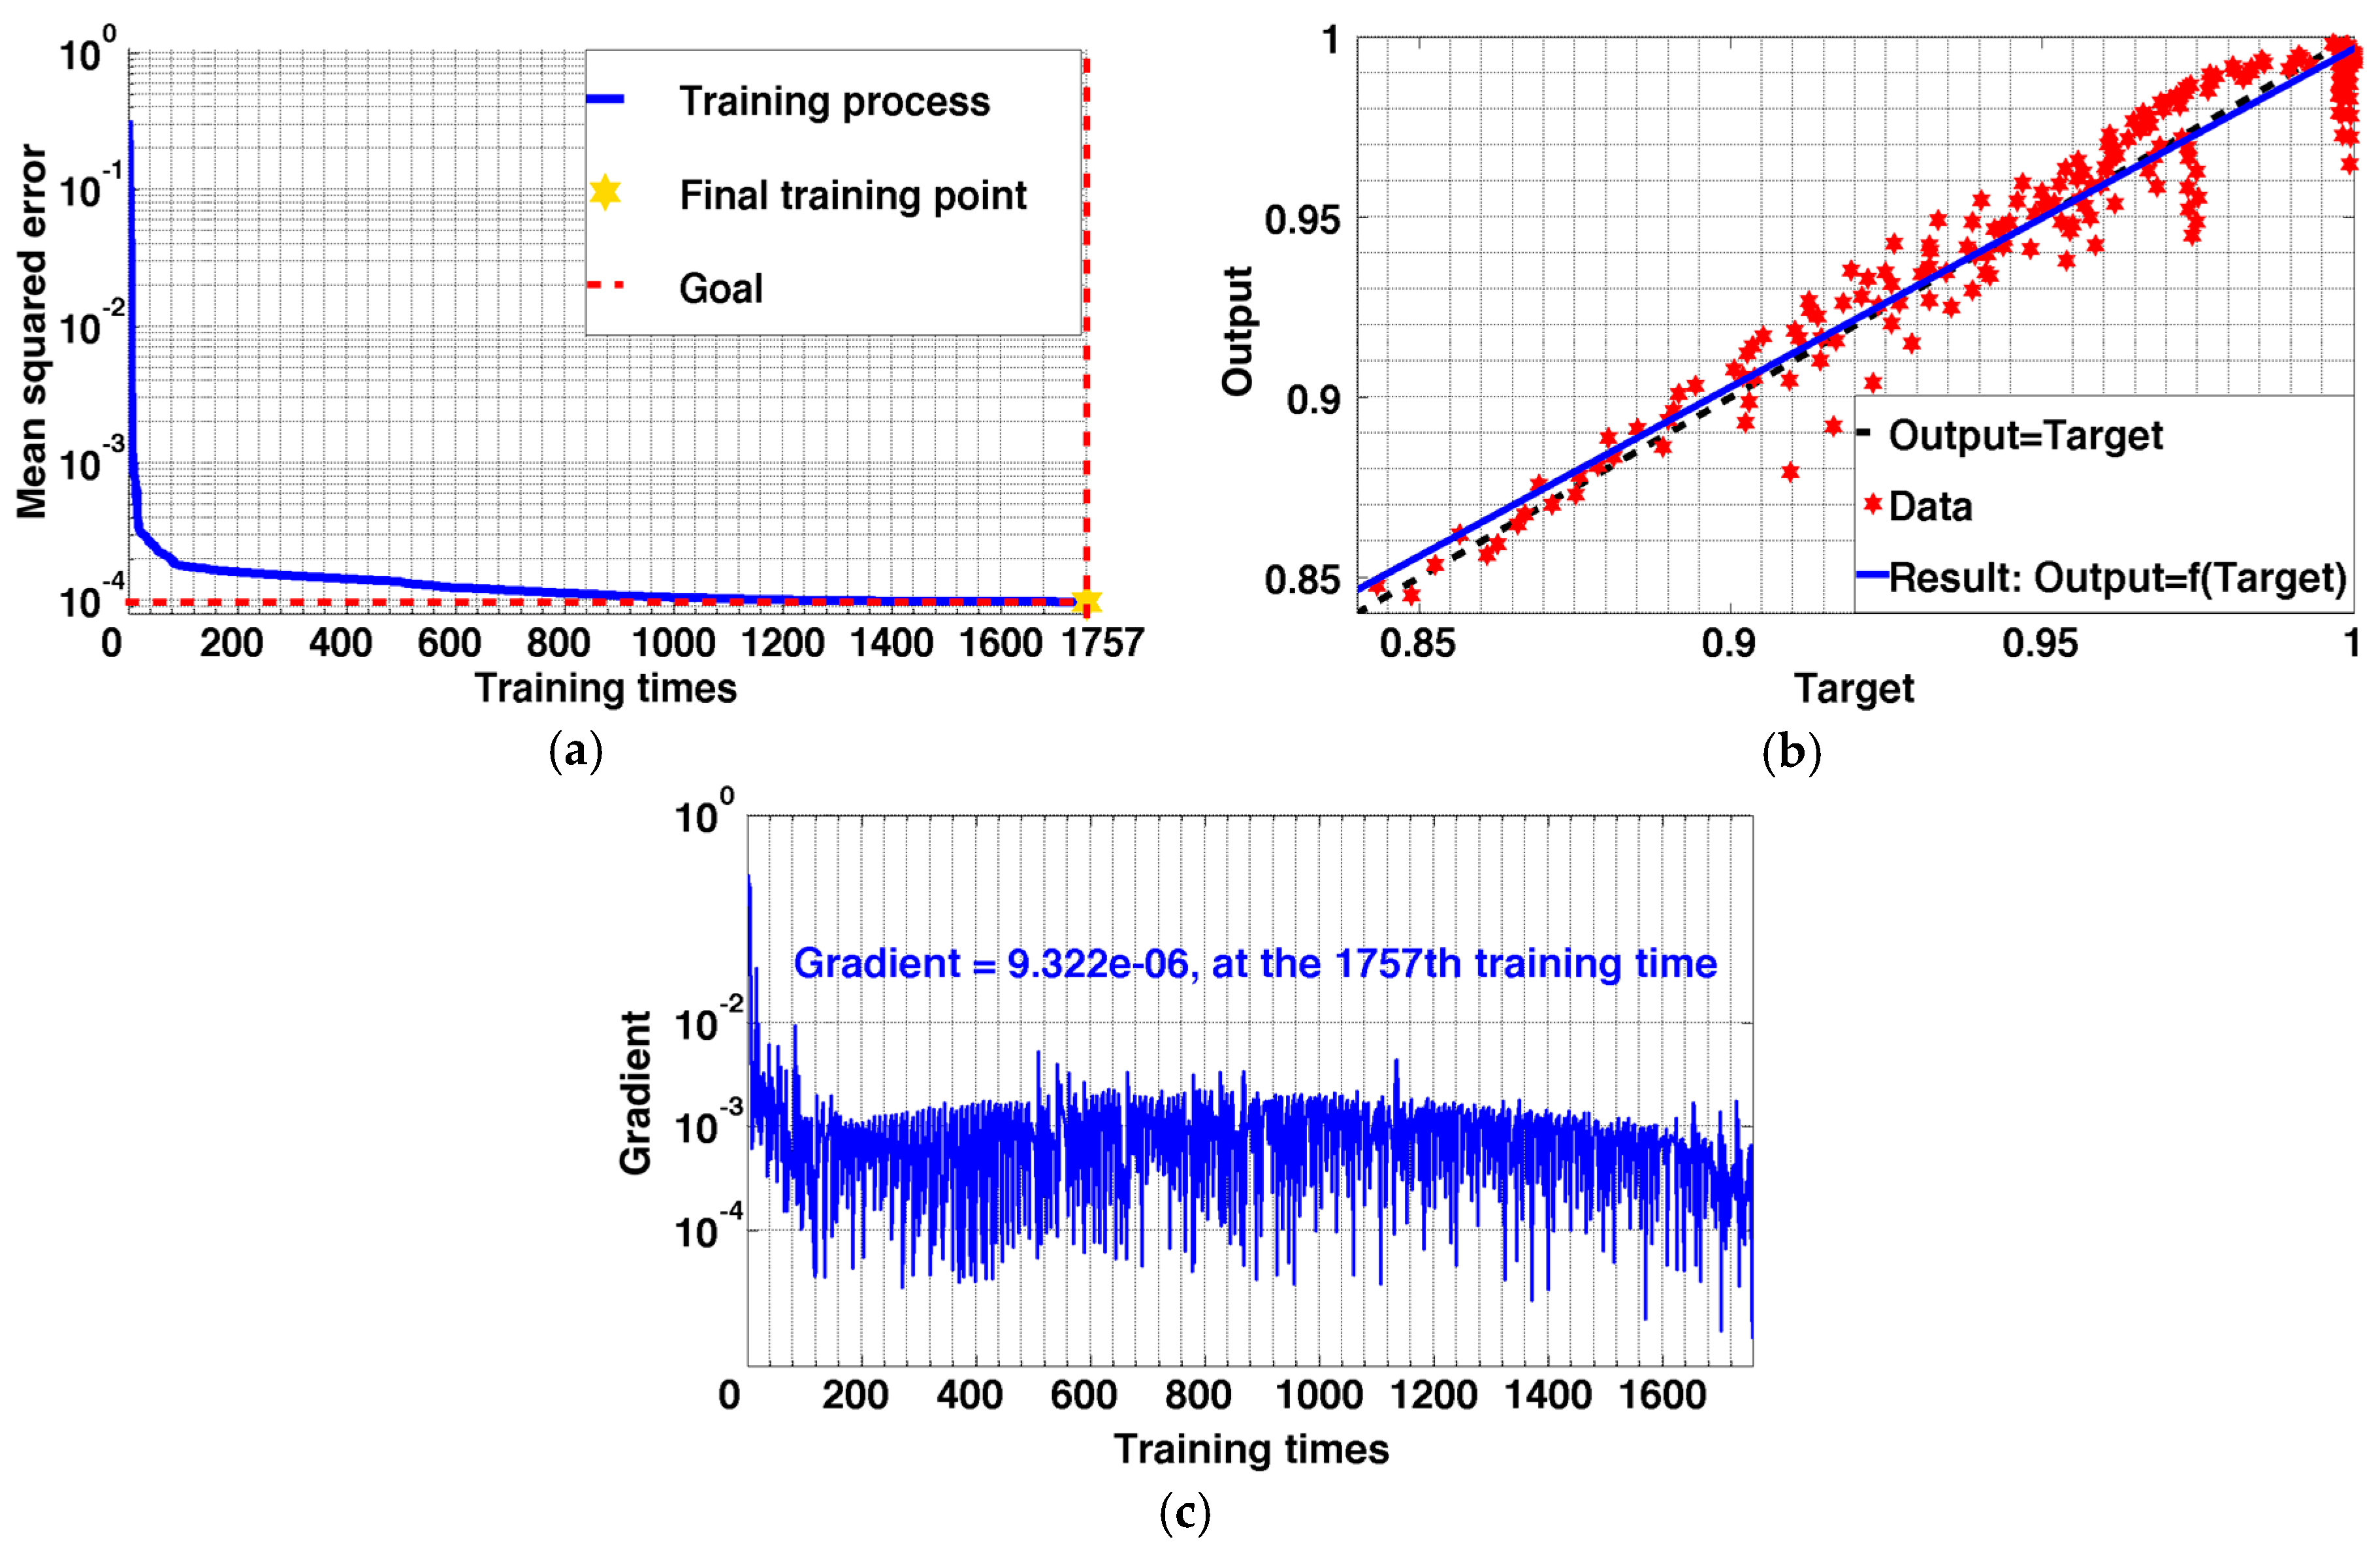
6.2.2. Learning-Based System Training

In the training process, a maximum of 2000 training iterations with an error tolerance of less than 10−4 were required. Figure 8a shows that at the 1757th iteration of the training procedure, the mean squared error reached the error tolerance of 10−4. Figure 8b shows the linear regression relationship between the output value and the target, which has an R-squared value of 0.972, further demonstrating the reliability of the training procedure. Figure 8c shows that the gradient of the error function decreases to approximately zero during the training process, which demonstrates that the error remains in an extremely low level after 100 iterations of training.

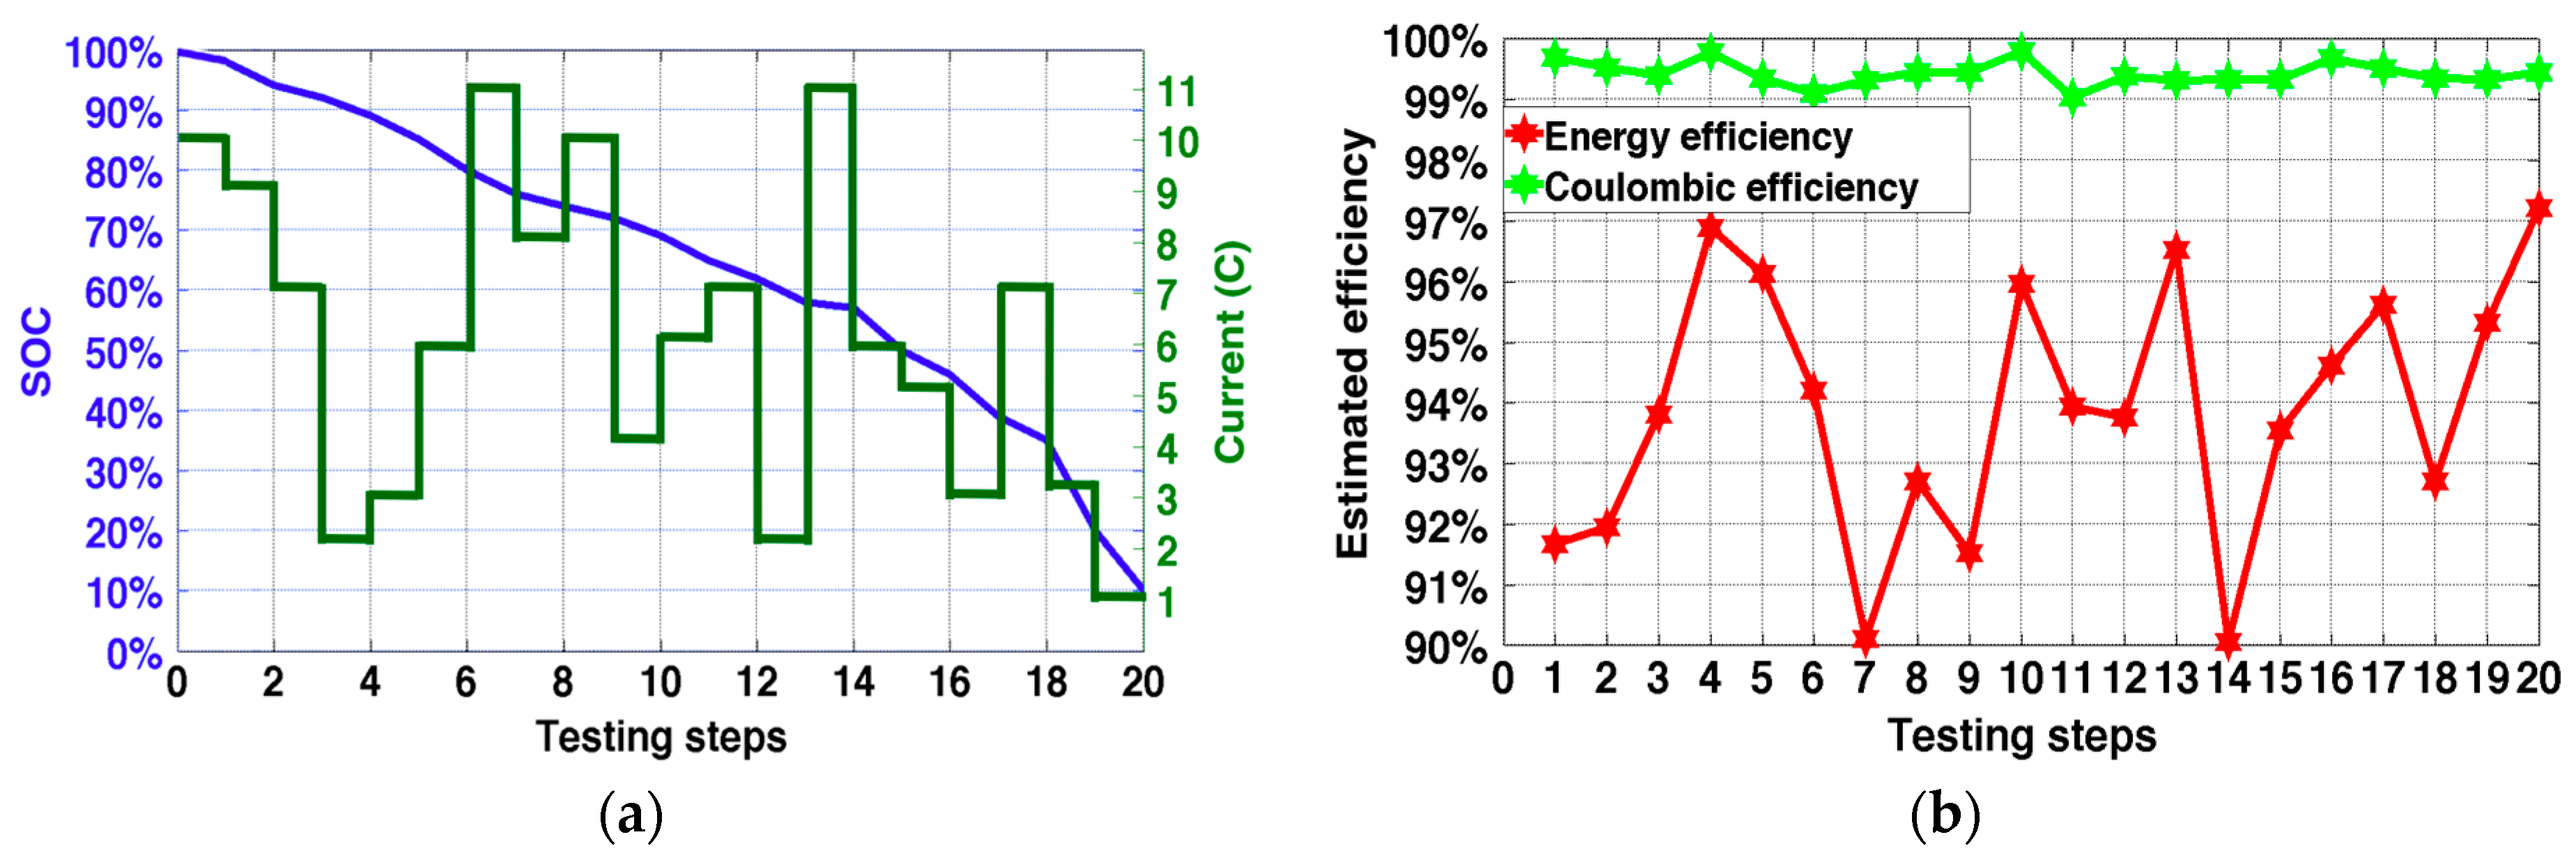
6.3. Continuous-Time Efficiency Estimation

To estimate the continuous-time efficiency, two basic assumptions are proposed to define a real working process. First, the entire real-time working process is divided into small-sized continuous SOC regions which can have different lengths. Second, the discharge current rates remain constant within each SOC region. With the defined working process, we used the trained BP network to estimate the efficiency of each SOC region. If the length of each SOC region is much smaller, more precise results can be obtained.

6.3.1. An Example of Efficiency Estimation

Figure 9 shows an example of a given working process. As presented in Figure 9a, the real-time working cycle was divided into 20 continuous SOC regions; within each region, the current was assumed to be constant. A continuously discharge working cycle without recharging process was designed to testify the result. The working cycle contains discharge current rates from 1C to 11C, which covers the cases in the experiments, and the discharge SOC region is [100%, 10%], within which the battery works at high coulombic efficiency. Figure 9b demonstrates the estimated result of energy efficiency and coulombic efficiency of the working condition in Figure 9a using the given BP network. The simulation results reveal that during the working process, the coulombic efficiency is high and exceeds 98%, and the energy efficiency varies from 90% to 98%, which shows consistent results with the previous tests.

6.3.2. Model Verification

In order to test the accuracy of the BP network continuous-time efficiency estimation model, an experimental test with the same discharge process as shown in Figure 9a was conducted in order to obtain the experimental efficiencies. The charge process and discharge process of the test are presented in Figure 10. During the testing process, initially, the batteries were fully charged with a constant 1C current rate following the constant voltage of 2.8 V; they were then discharged as shown in Figure 9a. When calculating the efficiencies, the energy/capacity growth within each SOC region during the charge process was used as the denominator, and the decrease in energy/capacity within each SOC region was used as the numerator.
Figure 11 shows the comparison between experimental and simulation results. Figure 11a directly displays the differences between the estimated efficiencies and the experimental efficiencies. Figure 11b illustrates that the relative error of the estimated coulombic efficiency is less than 0.8% and the relative error of the estimated energy efficiency is between −0.7% and 0.8%. Therefore, in this case, the proposed model can be used to help estimate and simulate the energy and coulombic efficiency within 1% accuracy.
In order to overcome the difficulties of measuring the continuous-time efficiency of batteries in experiments, especially when the working current changes continuously, the minimum size of SOC regions with constant currents should be applied to approximately describe a continuously changing discharge process. Thus, this method is able to estimate the continuously changing curves of energy efficiency and coulombic efficiency during a varying working process.

7. Conclusions

In this research, the continuous-time energy efficiency and coulombic efficiency of lithium titanate batteries were studied based on different SOC regions and discharge current rates. The experimental results showed the energy efficiency and coulombic efficiency variation in different SOC regions and varying discharge rates. Based on the empirical data, a BP network continuous-time efficiency estimation and simulation model was proposed to evaluate the energy efficiency and coulombic efficiency of the lithium titanate battery. The estimation model revealed an error of 10−4 during the training process and further showed limited error with the verification test.
This continuous-time efficiency estimation method enables insight into valuable information about efficiency variation during continuously-changing working conditions, which is conducive to enable comparison of efficiency curves under different working processes. The results can further be used to help manage and improve battery usage strategies. The efficiency test and prediction method proposed in this paper can also be used to simulate the efficiency of other types of batteries. The effect of external temperature on the battery efficiency, as well as effects of many other variables, needs to be considered to enhance the accuracy of the estimation model. In modern railway applications, this research can be used to optimize energy usage strategies by evaluating and improving battery efficiency.

Acknowledgments

This work is supported by the National Key Technology Support Program (grant number 2015BAG12B01).

Author Contributions

Jiuchun Jiang and Weige Zhang proposed the research topic and basic idea; Yuechen Liu and Linjing Zhang conceived and designed the experiments; Yuechen Liu established the evaluation model and drafted the manuscript; Shaoyuan Wei performed the experiments; and Sijia Liu modified the design of experiments and the paper. All authors contributed to the writing of the manuscript, and have read and approved the final manuscript.

Conflicts of Interest

The authors declare no conflict of interest.

Appendix A

State of charge (SOC):
S O C ( t ) = S O C ( 0 ) I d t C n
The Equation (A1) presents the method to calculate the state of charge, where I refers to the discharge current and Cn is the nominal capacity of the battery [41,49,50].

Appendix B

Charge efficiency:
  η c h a r g e = Δ Q n Q c h a r g e
Discharge efficiency:
η d i s c h a r g e = Q d i s c h a r g e Δ Q n
Battery efficiency:
η b a t t e r y = η c h a r g e × η d i s c h a r g e = Δ Q n Q c h a r g e × Q d i s c h a r g e Δ Q n = Q d i s c h a r g e Q c h a r g e
The Equations (A2) and (A3) show that the charge efficiency is the rate of net energy and charge energy, and the discharge efficiency equals to the rate of discharge energy and net energy. The net energy is defined in Equation (2) as Δ Q n = S O C ( t 0 ) S O C ( t 1 ) U O C V C n d S O C . Equation (A4) reveals the battery efficiency is the ratio of the discharge efficiency and the charge efficiency [9,25].

References

  1. Dunn, B.; Kamath, H.; Tarascon, J.-M. Electrical energy storage for the grid: A battery of choices. Science 2011, 334, 928–935. [Google Scholar] [CrossRef] [PubMed]
  2. Tarascon, J.-M.; Armand, M. Issues and challenges facing rechargeable lithium batteries. Nature 2001, 414, 359–367. [Google Scholar] [CrossRef] [PubMed]
  3. Kang, K.; Meng, Y.S.; Bréger, J.; Grey, C.P.; Ceder, G. Electrodes with high power and high capacity for rechargeable lithium batteries. Science 2006, 311, 977–980. [Google Scholar] [CrossRef] [PubMed]
  4. Gao, L.; Liu, S.; Dougal, R.A. Dynamic lithium-ion battery model for system simulation. IEEE Trans. Compon. Packag. Technol. 2002, 25, 495–505. [Google Scholar]
  5. Scrosati, B.; Garche, J. Lithium batteries: Status, prospects and future. J. Power Sources 2010, 195, 2419–2430. [Google Scholar] [CrossRef]
  6. Balakrishnan, P.; Ramesh, R.; Kumar, T.P. Safety mechanisms in lithium-ion batteries. J. Power Sources 2006, 155, 401–414. [Google Scholar] [CrossRef]
  7. Hassoun, J.; Panero, S.; Reale, P.; Scrosati, B. A new, safe, high-rate and high-energy polymer lithium-ion battery. Adv. Mater. 2009, 21, 4807–4810. [Google Scholar] [CrossRef] [PubMed]
  8. Doerffel, D.; Sharkh, S.A. A critical review of using the peukert equation for determining the remaining capacity of lead-acid and lithium-ion batteries. J. Power Sources 2006, 155, 395–400. [Google Scholar] [CrossRef]
  9. Rydh, C.J.; Karlström, M. Life cycle inventory of recycling portable nickel–Cadmium batteries. Resour. Conserv. Recycl. 2002, 34, 289–309. [Google Scholar] [CrossRef]
  10. Thackeray, M.M.; Wolverton, C.; Isaacs, E.D. Electrical energy storage for transportation—Approaching the limits of, and going beyond, lithium-ion batteries. Energy Environ. Sci. 2012, 5, 7854–7863. [Google Scholar] [CrossRef]
  11. Sandy Thomas, C.E. Transportation options in a carbon-constrained world: Hybrids, plug-in hybrids, biofuels, fuel cell electric vehicles, and battery electric vehicles. Int. J. Hydrogen Energy 2009, 34, 9279–9296. [Google Scholar] [CrossRef]
  12. Wadia, C.; Albertus, P.; Srinivasan, V. Resource constraints on the battery energy storage potential for grid and transportation applications. J. Power Sources 2011, 196, 1593–1598. [Google Scholar] [CrossRef]
  13. Xing, Y.; Ma, E.W.; Tsui, K.L.; Pecht, M. Battery management systems in electric and hybrid vehicles. Energies 2011, 4, 1840–1857. [Google Scholar] [CrossRef]
  14. Yuan, S.; Wu, H.; Yin, C. State of charge estimation using the extended kalman filter for battery management systems based on the ARX battery model. Energies 2013, 6, 444–470. [Google Scholar] [CrossRef]
  15. Chau, K.; Wong, Y.; Chan, C. An overview of energy sources for electric vehicles. Energy Convers. Manag. 1999, 40, 1021–1039. [Google Scholar] [CrossRef]
  16. Esveld, C. Modern Railway Track; MRT-Production: Zaltbommel, The Netherlands, 2001; Volume 385. [Google Scholar]
  17. Viswanathan, V.V.; Kintner-Meyer, M. Second use of transportation batteries: Maximizing the value of batteries for transportation and grid services. IEEE Trans. Veh. Technol. 2011, 60, 2963–2970. [Google Scholar] [CrossRef]
  18. He, H.; Jia, H.; Huo, W.; Sun, F. Field synergy analysis and optimization of the thermal behavior of lithium ion battery packs. Energies 2017, 10, 81. [Google Scholar] [CrossRef]
  19. Zhao, L.; Pan, H.-L.; Hu, Y.-S.; Li, H.; Chen, L.-Q. Spinel lithium titanate (Li4Ti5O12) as novel anode material for room-temperature sodium-ion battery. Chin. Phys. B 2012, 21. [Google Scholar] [CrossRef]
  20. Anbuky, A.H.; Pascoe, P.E. Vrla battery state-of-charge estimation in telecommunication power systems. IEEE Trans. Ind. Electron. 2000, 47, 565–573. [Google Scholar] [CrossRef]
  21. Warner, J.T. The Handbook of Lithium-Ion Battery Pack Design: Chemistry, Components, Types and Terminology; Elsevier: Amsterdam, The Netherlands, 2015. [Google Scholar]
  22. Liu, S.; Jiang, J.; Shi, W.; Ma, Z.; Wang, L.Y.; Guo, H. Butler–volmer-equation-based electrical model for high-power lithium titanate batteries used in electric vehicles. IEEE Trans. Ind. Electron. 2015, 62, 7557–7568. [Google Scholar] [CrossRef]
  23. Ahmadi, L.; Fowler, M.; Young, S.B.; Fraser, R.A.; Gaffney, B.; Walker, S.B. Energy efficiency of Li-ion battery packs re-used in stationary power applications. Sustain. Energy Technol. Assess. 2014, 8, 9–17. [Google Scholar] [CrossRef]
  24. Chiasserini, C.F.; Rao, R.R. Energy efficient battery management. IEEE J. Sel. Areas Commun. 2001, 19, 1235–1245. [Google Scholar] [CrossRef]
  25. Kang, J.Q.; Yan, F.W.; Zhang, P.; Du, C.Q. A novel way to calculate energy efficiency for rechargeable batteries. J. Power Sources 2012, 206, 310–314. [Google Scholar] [CrossRef]
  26. Northrop, P.W.; Suthar, B.; Ramadesigan, V.; Santhanagopalan, S.; Braatz, R.D.; Subramanian, V.R. Efficient simulation and reformulation of lithium-ion battery models for enabling electric transportation. J. Electrochem. Soc. 2014, 161, E3149–E3157. [Google Scholar] [CrossRef]
  27. Liu, C.; Wang, S.; Zhang, C.; Fu, H.; Nan, X.; Yang, Y.; Cao, G. High power high safety battery with electrospun Li3V2(PO4)3 cathode and Li4Ti5O12 anode with 95% energy efficiency. Energy Storage Mater. 2016, 5, 93–102. [Google Scholar] [CrossRef]
  28. Stevens, J.W.; Corey, G.P. A Study of lead-acid battery efficiency near top-of-charge and the impact on PV system design. In Proceedings of the Conference Record of the Twenty Fifth IEEE Photovoltaic Specialists Conference, Washington, DC, USA, 13–17 May 1996; pp. 1485–1488. [Google Scholar]
  29. Zheng, Y.; Ouyang, M.; Lu, L.; Li, J.; Zhang, Z.; Li, X. Study on the correlation between state of charge and coulombic efficiency for commercial lithium ion batteries. J. Power Sources 2015, 289, 81–90. [Google Scholar] [CrossRef]
  30. Kang, J.Q.; Yan, F.W.; Zhang, P.; Du, C.Q. Comparison of comprehensive properties of Ni-MH (nickel-Metal Hydride) and Li-ion (lithium-ion) batteries in terms of energy efficiency. Energy 2014, 70, 618–625. [Google Scholar] [CrossRef]
  31. Haykin, S.O. Neural Networks and Learning Machines; Pearson Upper Saddle River: Hoboken, NJ, USA, 2009; Volume 3. [Google Scholar]
  32. Gorman, C.C.O.; Ingersoll, D.; Jungst, R.G.; Paez, T.L. Artificial neural network simulation of battery performance. In Proceedings of the Thirty-First Hawaii International Conference on System Sciences, Kohala Coast, HI, USA, 9 January 1998; Volume 115, pp. 115–121. [Google Scholar]
  33. Chan, C.; Lo, E.W.C.; Shen, W. The available capacity computation model based on artificial neural network for lead–acid batteries in electric vehicles. J. Power Sources 2000, 87, 201–204. [Google Scholar] [CrossRef]
  34. Li, I.-H.; Wang, W.-Y.; Su, S.-F.; Lee, Y.-S. A merged fuzzy neural network and its applications in battery state-of-charge estimation. IEEE Trans. Energy Convers. 2007, 22, 697–708. [Google Scholar] [CrossRef]
  35. Shen, W.; Chan, C.; Lo, E.; Chau, K. A new battery available capacity indicator for electric vehicles using neural network. Energy Convers. Manag. 2002, 43, 817–826. [Google Scholar] [CrossRef]
  36. Chang, W.-Y. Estimation of the state of charge for a LFP battery using a hybrid method that combines a RBF neural network, an OLS algorithm and AGA. Int. J. Electr. Power Energy Syst. 2013, 53, 603–611. [Google Scholar] [CrossRef]
  37. Chang, W.-Y. The state of charge estimating methods for battery: A review. ISRN Appl. Math. 2013, 2013, 953792. [Google Scholar] [CrossRef]
  38. Dong, C.; Wang, G. Estimation of power battery SOC based on improved BP neural network. In Proceedings of the 2014 IEEE International Conference, Mechatronics and Automation (ICMA), Tianjin, China, 3–6 August 2014; pp. 2022–2027. [Google Scholar]
  39. Lin, H.-T.; Liang, T.-J.; Chen, S.-M. Estimation of battery state of health using probabilistic neural network. IEEE Trans. Ind. Inf. 2013, 9, 679–685. [Google Scholar] [CrossRef]
  40. Fang, K.; Mu, D.; Chen, S.; Wu, B.; Wu, F. A prediction model based on artificial neural network for surface temperature simulation of nickel–Metal hydride battery during charging. J. Power Sources 2012, 208, 378–382. [Google Scholar] [CrossRef]
  41. Sun, F.; Xiong, R.; He, H. Estimation of state-of-charge and state-of-power capability of lithium-ion battery considering varying health conditions. J. Power Sources 2014, 259, 166–176. [Google Scholar] [CrossRef]
  42. Hao, Y.-J.; Lai, Q.-Y.; Liu, D.-Q.; Xu, Z.-U.; Ji, X.-Y. Synthesis by citric acid sol–gel method and electrochemical properties of Li4Ti5O12 anode material for lithium-ion battery. Mater. Chem. Phys. 2005, 94, 382–387. [Google Scholar] [CrossRef]
  43. Amatucci, G.G.; Badway, F.; Du Pasquier, A.; Zheng, T. An asymmetric hybrid nonaqueous energy storage cell. J. Electrochem. Soc. 2001, 148, A930–A939. [Google Scholar] [CrossRef]
  44. Zaghib, K.; Simoneau, M.; Armand, M.; Gauthier, M. Electrochemical study of Li4Ti5O12 as negative electrode for Li-ion polymer rechargeable batteries. J. Power Sources 1999, 81, 300–305. [Google Scholar] [CrossRef]
  45. Sadeghi, B.H.M. A BP-neural network predictor model for plastic injection molding process. J. Mater. Process. Technol. 2000, 103, 411–416. [Google Scholar] [CrossRef]
  46. Zhang, L.; Wu, K.; Zhong, Y.; Li, P. A new sub-pixel mapping algorithm based on a BP neural network with an observation model. Neurocomputing 2008, 71, 2046–2054. [Google Scholar] [CrossRef]
  47. Yi, J.; Wang, Q.; Zhao, D.; Wen, J.T. BP neural network prediction-based variable-period sampling approach for networked control systems. Appl. Math. Comput. 2007, 185, 976–988. [Google Scholar] [CrossRef]
  48. Wen, J.; Zhao, J.L.; Luo, S.W.; Han, Z. The improvements of BP neural network learning algorithm. Proceedings of 2000 5th International Conference the Signal Processing Proceedings (WCCC-ICSP), Beijing, China, 21–25 August 2000; Volume 1643, pp. 1647–1649. [Google Scholar]
  49. Piller, S.; Perrin, M.; Jossen, A. Methods for state-of-charge determination and their applications. J. Power Sources 2001, 96, 113–120. [Google Scholar] [CrossRef]
  50. Lee, J.; Nam, O.; Cho, B. Li-ion battery SOC estimation method based on the reduced order extended kalman filtering. J. Power Sources 2007, 174, 9–15. [Google Scholar] [CrossRef]
Figure 1. Experimental platform of the lithium titanate batteries.
Energies 10 00597 g001
Figure 2. Charge and discharge process of lithium titanate battery: (a) whole charge and discharge curve and SOC variation; and (b) zoomed in discharge curve.
Energies 10 00597 g002
Figure 3. Energy and coulombic efficiency results under different SOC regions and discharge current rates: (a) energy efficiency and (b) coulombic efficiency comparison between fully charged/non-fully discharged cycles and fully discharged/non-fully charged cycles; (c) energy efficiency; and (d) coulombic efficiency of the fully charged/non-fully discharged cycle in the SOC region of 100–10%, 100–20%, 100–30%, and 100–40%.
Energies 10 00597 g003
Figure 4. Energy and coulombic efficiency results of fully discharge/non-fully charge cycle: (a) energy efficiency and (b) coulombic efficiency in the SOC regions of 100–0%, 95–0%, 90–0%, 85–0%, and 80–0%.
Energies 10 00597 g004
Figure 5. A common feed-forward type of ANN.
Energies 10 00597 g005
Figure 6. Structure of the BP network continuous-time efficiency estimation model.
Energies 10 00597 g006
Figure 7. Comprehensive relationship among current rate, SOC region, and efficiency.
Energies 10 00597 g007
Figure 8. System error after training: (a) output error variation of each training times; (b) R-squared of the output; and (c) gradient of error function.
Energies 10 00597 g008
Figure 9. Verification of efficiency estimation: (a) discharge current rates and SOC intervals of a certain working condition; and (b) predicted energy efficiency and coulombic efficiency of certain working conditions.
Energies 10 00597 g009
Figure 10. Experimental test: (left) plot shows the charge process; and (right) plot demonstrates the discharge process; the red dashed lines divide the two plots by small SOC regions in which the currents are constants. The efficiency within each SOC region is calculated by using the capacity/energy variation of the charge/discharge process between the red lines.
Energies 10 00597 g010
Figure 11. Result comparison between experiment and model estimation: (a) differences between estimated and experimental efficiency; and (b) relative error of the estimated efficiency.
Energies 10 00597 g011
Table 1. Properties of the 8.5 Ah lithium titanate batteries.
PropertyParameter
Nominal voltage2.3 V
Nominal capacity8.5 Ah
Mass energy density75 Wh/kg
AC internal resistance 0.6. m Ω
Life cycle 10,000 times
Power density 2000 W/kg
Max charge voltage2.8 V
Min discharge voltage1.5 V
Working temperature−20 60 °C

