Article

Analysis of the Average Annual Consumption of Water in the Hospitals of Extremadura (Spain)

by
Justo Garcia-Sanz-Calcedo
1,*,
Fernando Lopez-Rodriguez
1,
Talal Yusaf
2 and
Awf Al-Kassir
1
1
Industrial Engineering School, University of Extremadura, 06006 Badajoz, Spain
2
University of Southern Queensland Toowoomba, 4350, Australia
*
Author to whom correspondence should be addressed.
Energies 2017, 10(4), 479; https://doi.org/10.3390/en10040479
Submission received: 9 March 2017 / Revised: 27 March 2017 / Accepted: 29 March 2017 / Published: 3 April 2017
(This article belongs to the Special Issue Energy and Water, Current and Future Crisis)

Abstract

:
The aim of this paper is to quantity the annual average consumption of water in 13 public hospitals in Extremadura (Spain). An analytical study in order to reduce water demand was conducted from 2010 to 2014 in the above-mentioned hospitals. The study concluded that, in order to determine the average annual water consumption, a fixed ratio is not the appropriate tool. A parametric type related to the built surface area and/or number of beds by hospital should be used instead. The average annual consumption of cold water for human consumption (CWHC) was 262.82 m3 (102.10) per bed and 1.65 m3 (0.46) per built surface area. The mean annual consumption of domestic hot water (DHW) was 92.96 m3 (35.72) per bed and 0.59 m3 (0.18) per built surface area. The ratio between DHW and CWHC was 35.62% (5.53). The time period of greatest demand was between 12 p.m. and 6 p.m. Considering B as the number of hospital beds and S its built surface area, to calculate the average annual cold water for human consumption in a hospital, the equation 165B + 12,100 (m3) or 1.568S + 2400 (m3) should be used. Similarly, in terms of hot domestic water, the average annual consumption in m3 corresponds to either 53.65B + 5170 (m3) or 0.53S + 1400 (m3).

1. Introduction

The healthcare sector constitutes a major part of the economy of developed nations and consumes significant quantities of energy. The public health expense in Spain in 2013 was 61.710 million euros, which represents 5.9% of the gross domestic product (GDP). The per capita expense was €1309 per habitant. The public health expense was 4.2% of GDP; the private, 1.7% [1].
The growing scarcity of water and the misuse and unfortunate management of water resources currently available are the main threats to sustainable development [2]. In Extremadura, water consumption in 2014 was 170 L per inhabitant and day, with a percentage of actual losses of 24 L per inhabitant and day (14.12%), with an average cost of €1.02/m3 for water supply and €0.52/m3 for sewage and purification [3].
There are around 900 hospitals in Spain, and the healthcare sector is eminently public in nature, to the extent that 108,000 of the country’s 163,000 beds are in public hospitals. Consumption in the hospital sector in Spain reached 0.6 Mteo, accounting for 7% of the total tertiary sector consumption, and representing an expenditure amounting to some €600 million [4].
Hospitals are provided with complex and costly facilities and equipment, whose correct functioning conditions the quality of the services provided [5]. The state of use of these resources depends on the adequate design of facilities and equipment, the quality of the construction, and the efficiency of the maintenance [6].
Healthcare engineering has become a relevant issue in hospital management, since one of its objectives is focused on energy and environmental efficiency of the building [7] and the fulfilment of the Environmental Biosafety conditions, keeping the perspective of patient safety [8].
The usual points of water consumption of a hospital are domestic hot water (DHW) and cold water for human consumption (CWHC), irrigation of green areas, cooling towers, air conditioning, laundry, kitchens, therapeutic swimming pools, and dialysis, among others [9].
The most frequent ratios used present a wide range of dispersion depending on the location, type of hospital, date of construction, number of staff and patients, complementary services, and green zones available. European hospitals generate an average annual water consumption between 182.5 and 365 m3 per bed [10]. In the USA, these values vary between 109.5 and 552.61 m3/bed [11,12], while in the UK it ranges between 193.45 and 415.37 m3/bed [13]. In Germany, the average consumption is 166.26 m3/bed [14], reaching a maximum of 247.84 m3/bed [15]. In Spain, Gonzalez et al. (2015) obtained a ratio of 195 m3/bed [16]. Canadian studies indicate even higher ratios, between 328.5 and 657 m3/bed [17]. In Cuba, the water consumption of a type hospital was estimated at 294 m3/bed [18]. The Mexican Institute of Water Technology indicates a value of 292 m3/bed [19], while the Pan American Health Organization reports a value of 164.25 m3/bed [20]. D’Alessandro et al. (2016) observed a clear correlation between water consumption and the number of hospital beds in Italian hospitals [21].
The annual consumption of DHW per bed in hospitals ranges from 29.2 to 47.45 m3/bed in Europe [22] and from 36.5 to 54.75 m3/bed in the USA [23]. In Greece, the same variable ranges between 32.85 and 43.8 m3/bed [24]. Townend et al. (2005) studied the characteristics of those facilities associated with sustainable healthcare resource [25]. Bujak estimated that the average annual consumption of DHW for a hospital should be between 40.52 and 60.05 m3/bed [26].
One of the best ways to promote energy efficiency is for the Public Administration to apply green technologies in their buildings that demonstrate the feasibility of constructing sustainable facilities, with minimized water consumption. This is achieved through the implementation of reuse and recycling techniques, thus demonstrating the viability of these technologies [27]. In England and the United States, health-related greenhouse gas emissions account for 3% and 8% of total national emissions, respectively [28].
The research performed in this field to date has been scarce, in a small number of buildings, generating low statistical significance. Insufficient reliable data on water consumption generates an over-dimensioning of hospital facilities an over-consumption of materials, and the sedimentation of particles in sewage pipes and water treatment plants [29].
In Spain, the savings potential derived from water management in hospitals has not been systematically studied, with scarce accounts of research works in this field, even though the real prospects for saving are high.
The aim of this paper is to analyse and quantify the average water consumption of hospitals in Extremadura (Spain), both for cold water for human consumption and domestic hot water. For this, several parametric variables will be used in this study in order to determine the average consumption of water and calculate the amount of wastewater generated in Spanish hospitals.

2. Results

The results of the average water consumed per year by the different hospitals analysed, under normal climatological and operational conditions, are presented below.
A homogeneous correlation between the built surface area and the number of beds was found in the sample, as shown in Figure 1, which is useful for extrapolating the results.
In addition, it was found that the ratio between the built surface area and the number of beds increased as the number of beds decreased, which is consistent since common surfaces—needed in all hospitals—are distributed among fewer beds in smaller hospitals, as shown in Figure 2.

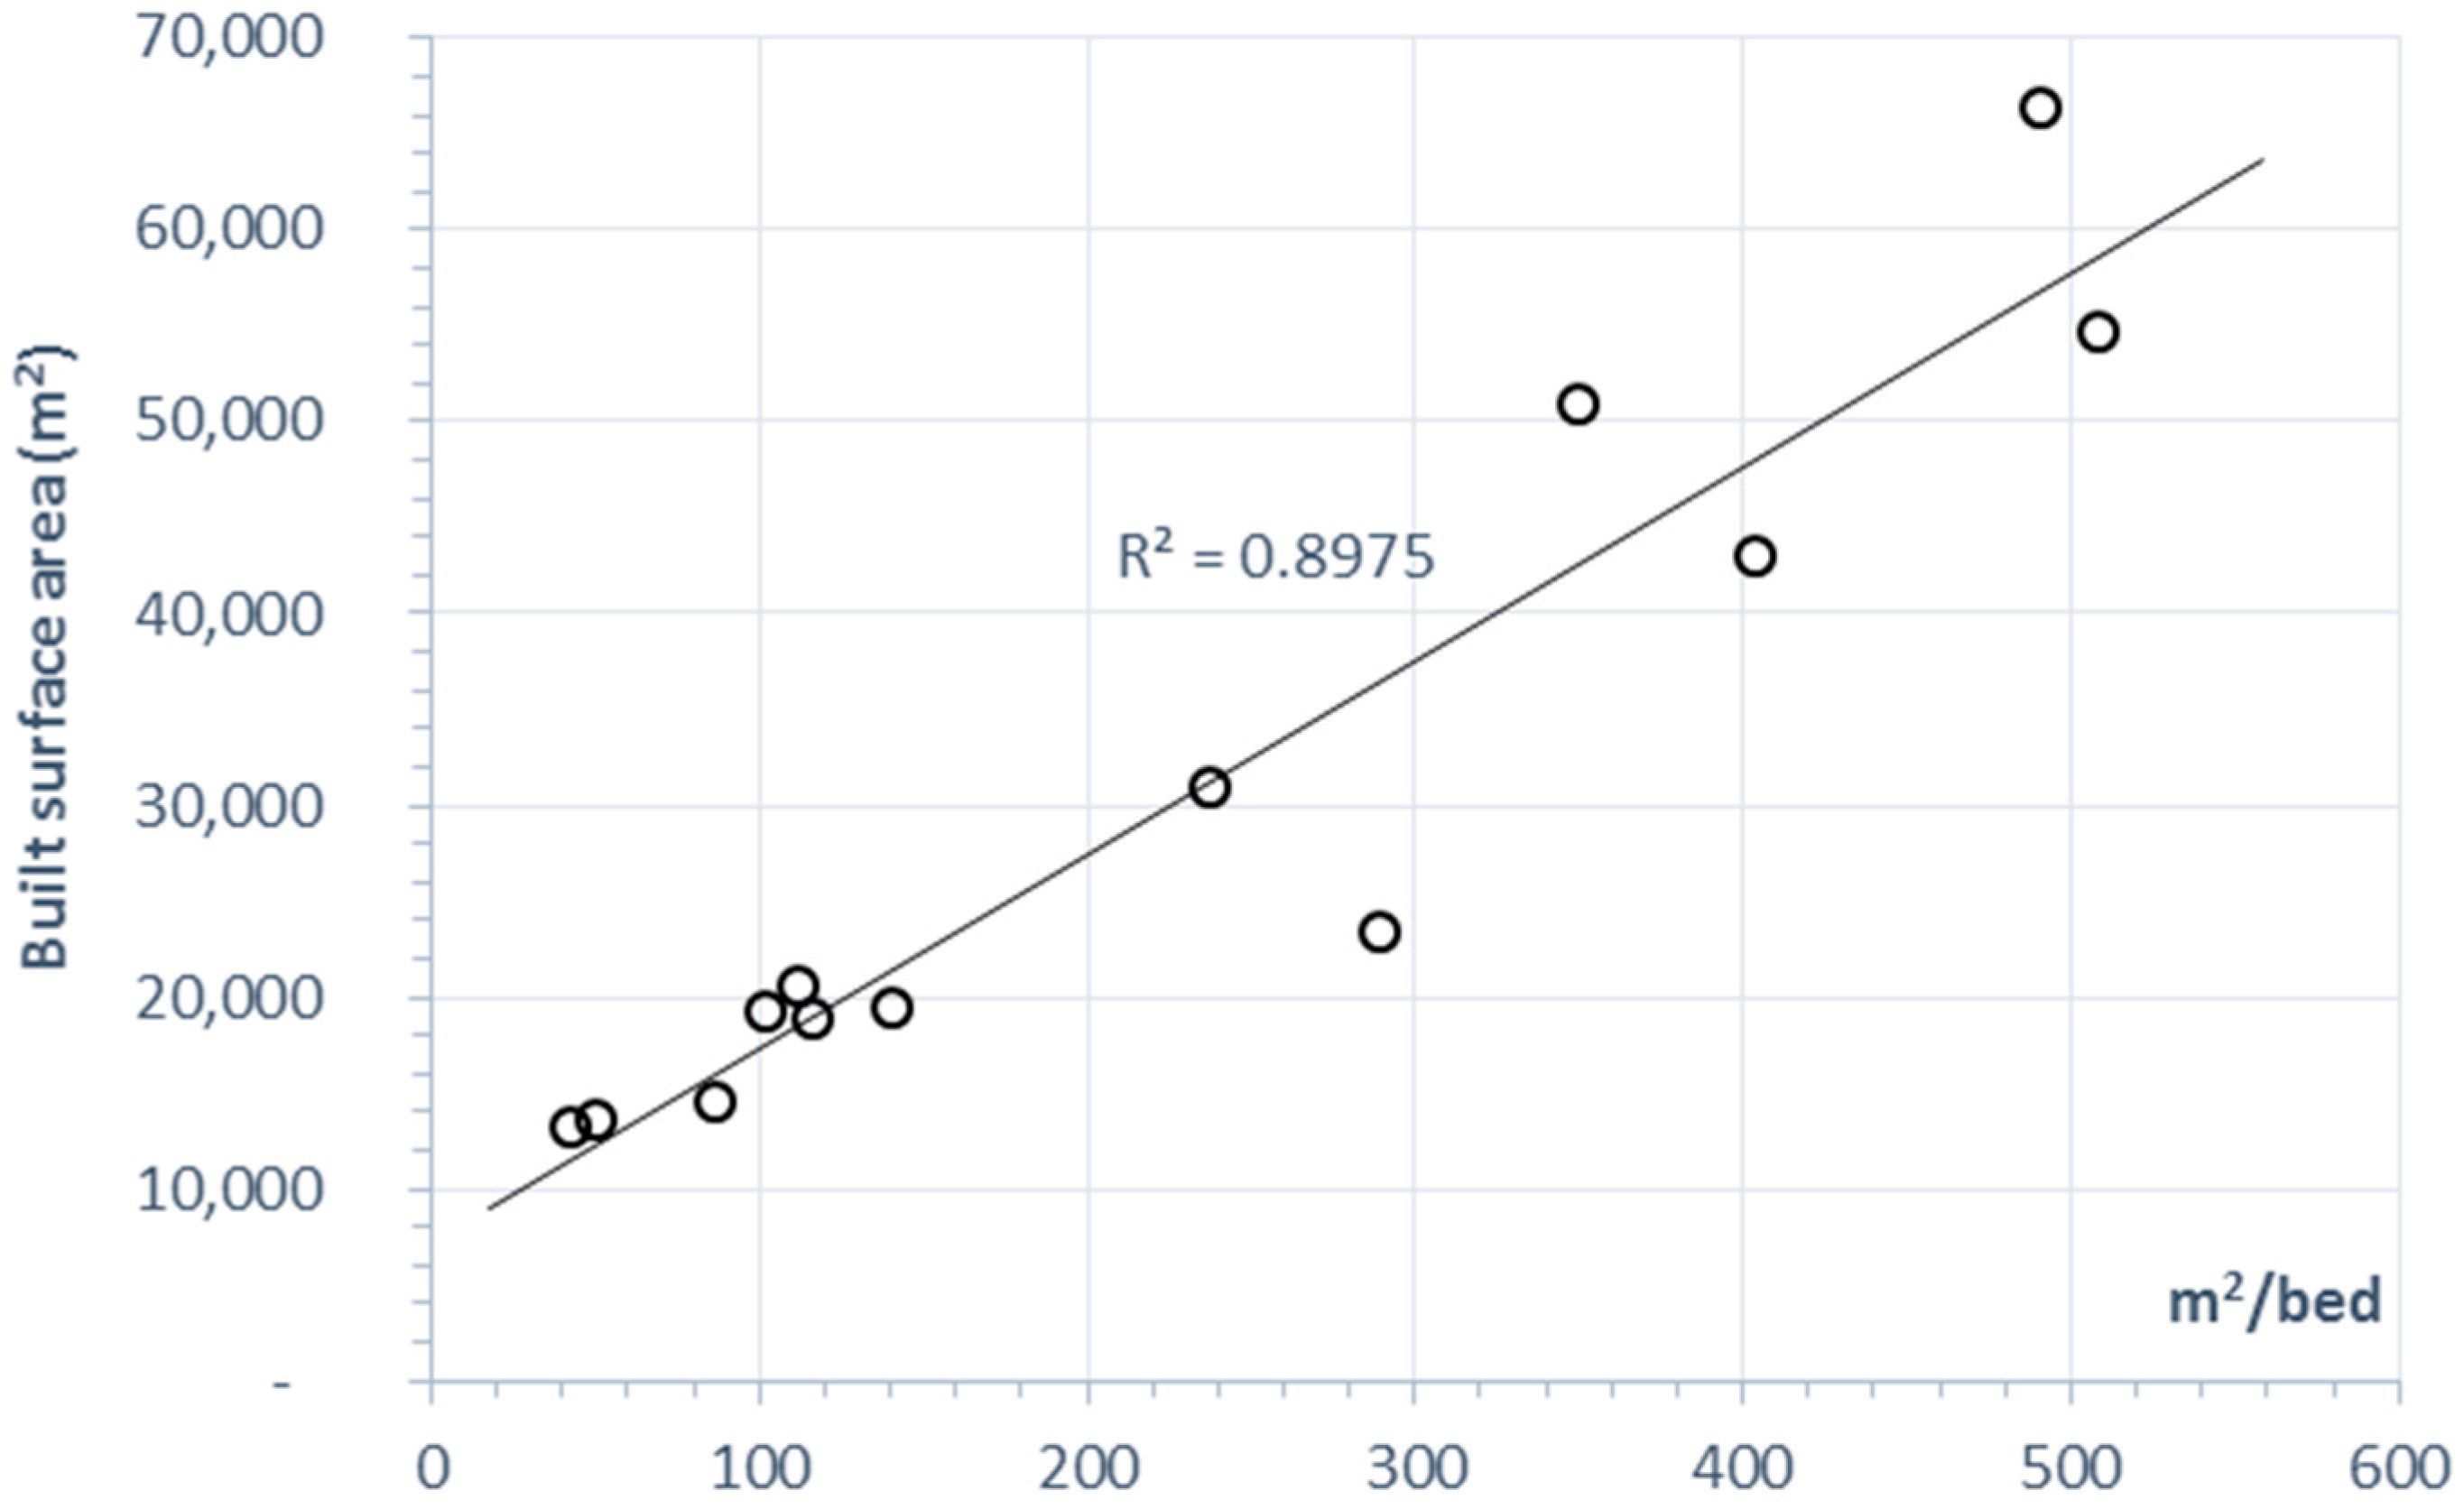
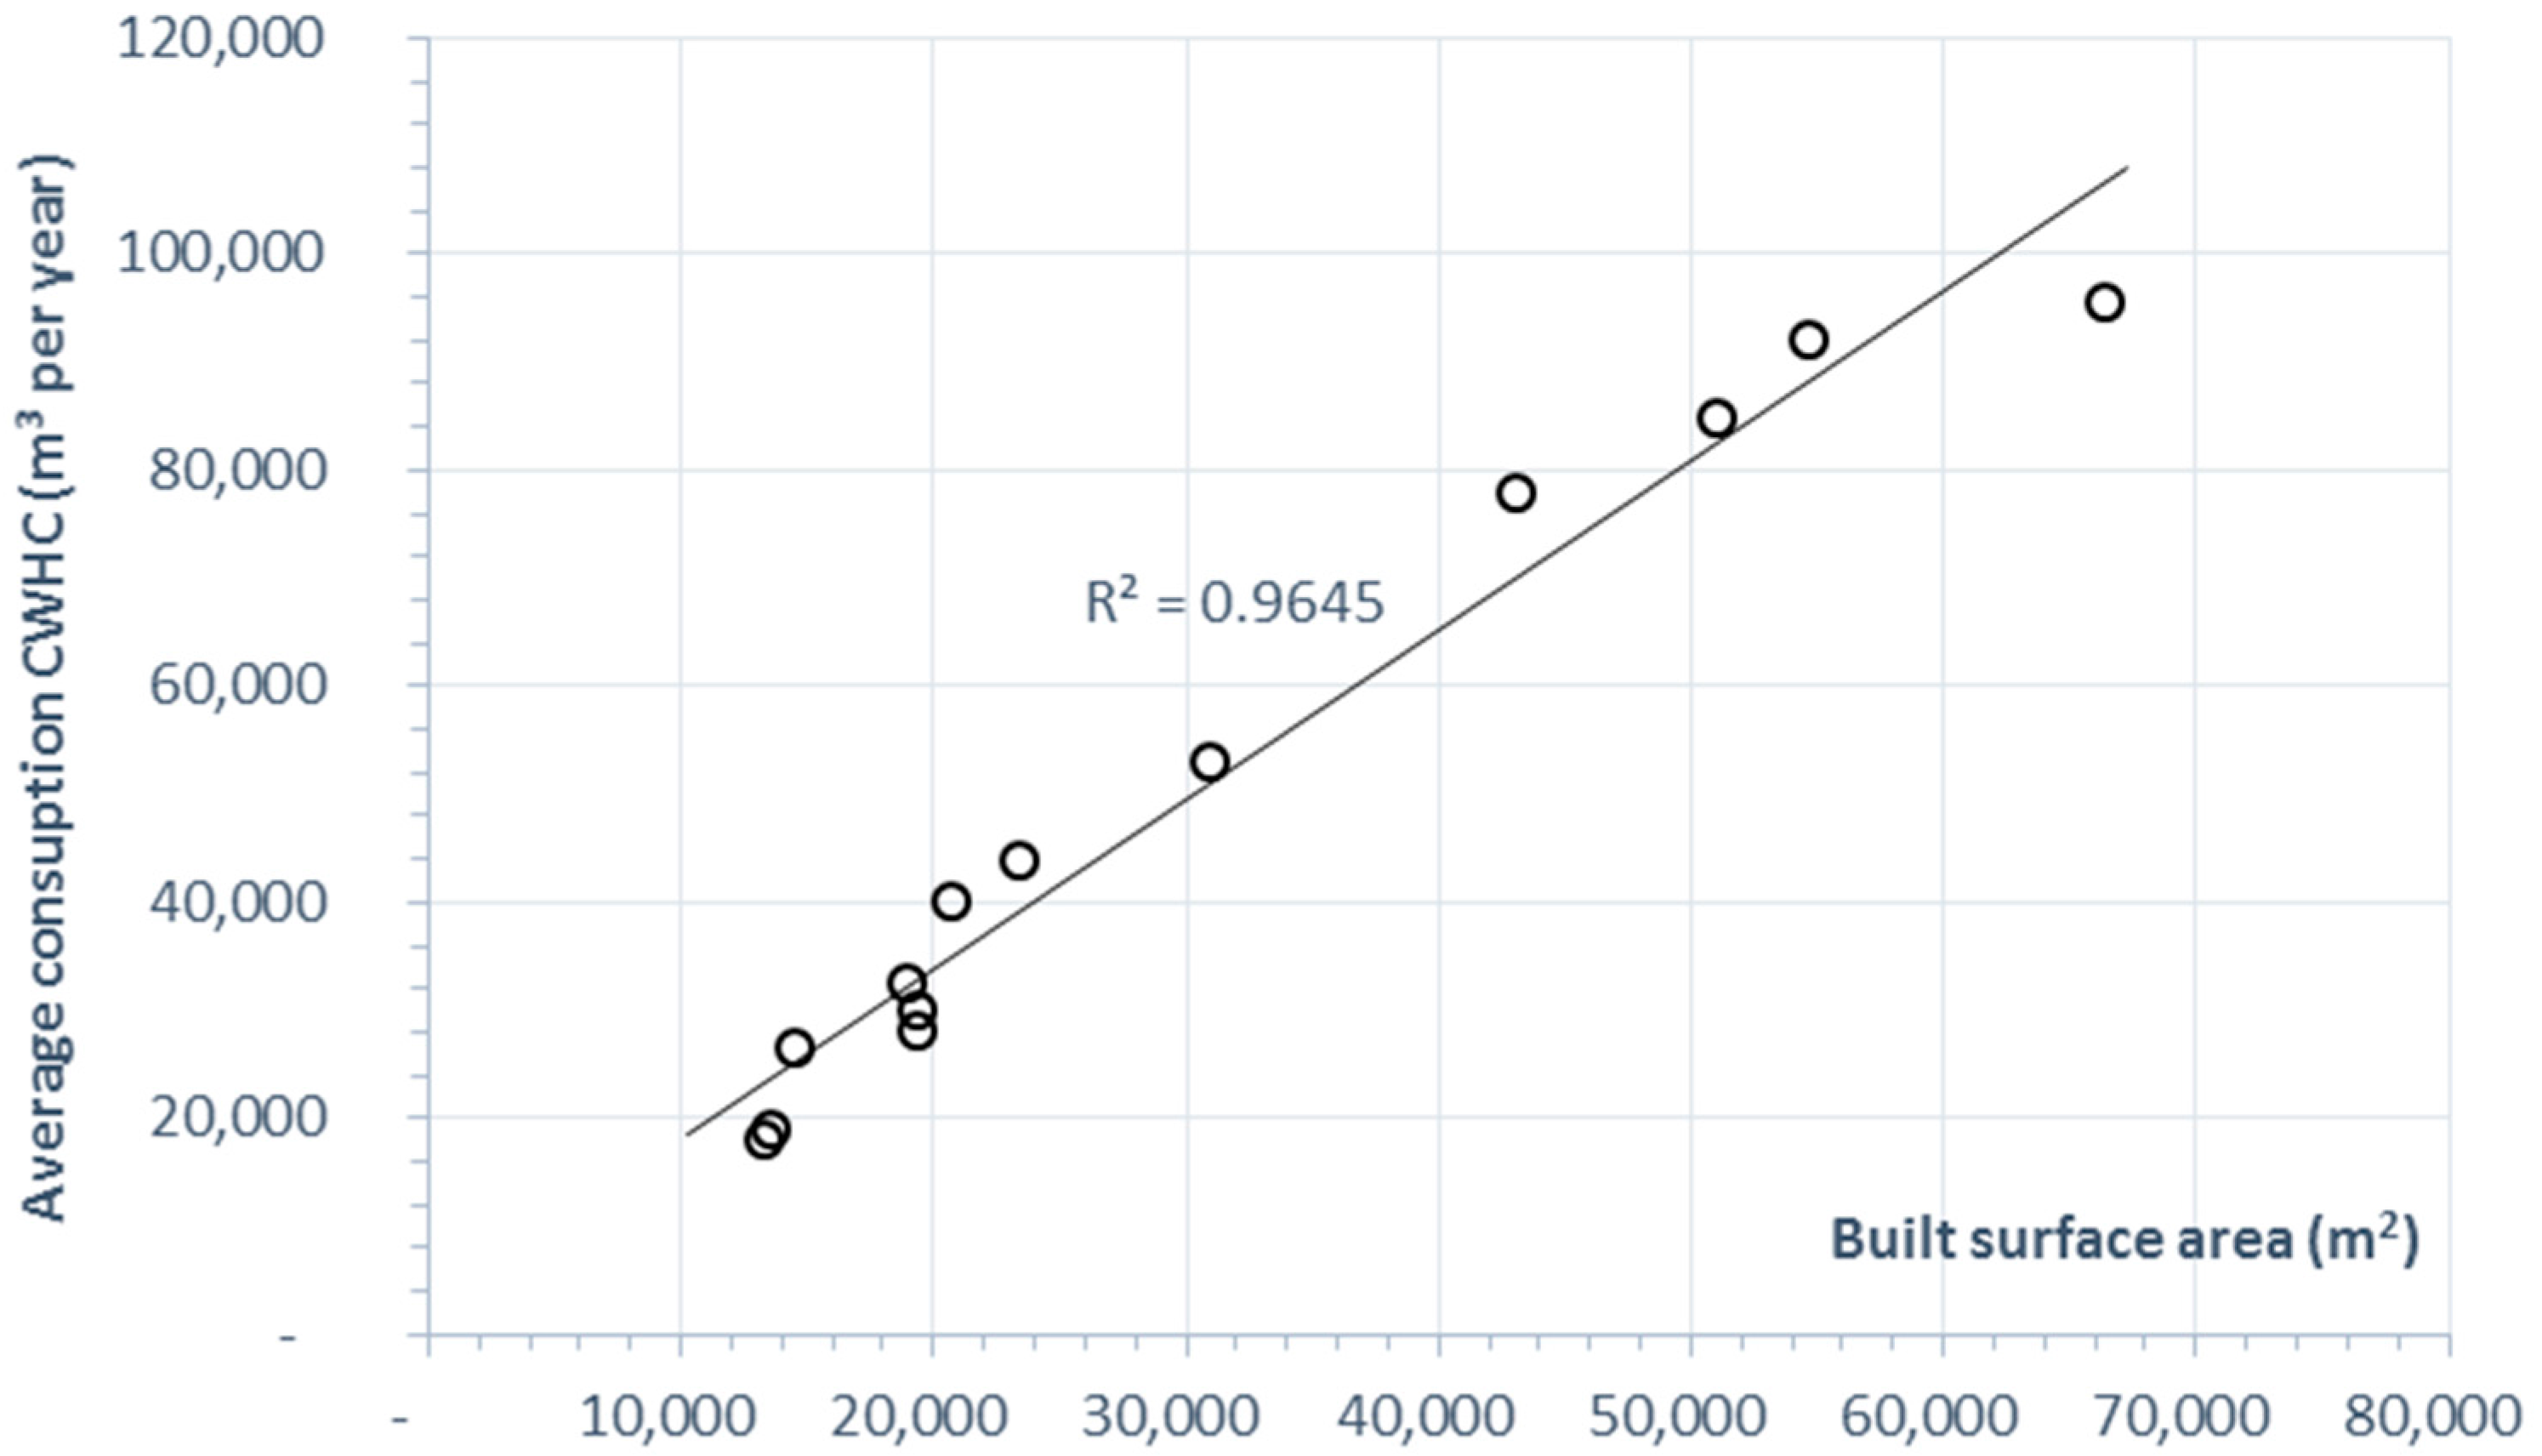
2.1. Relationship between the Average Annual Cold Water Consumption and the Built Surface Area per Hospital

Figure 3 shows the average annual cold water consumption and the built surface area of the hospitals analysed in the sample. A high correlation (R2 = 0.9645) was observed between both variables, proving that there is a close relationship between the built surface area and the average annual water consumption.
Equation (2) defines the relationship between the average annual cold water consumption and the built surface area per hospital.
C = 1.568 S + 2400
C represents the average annual water consumption value expressed in m3, and S is the built surface area of the hospital, expressed in m2.

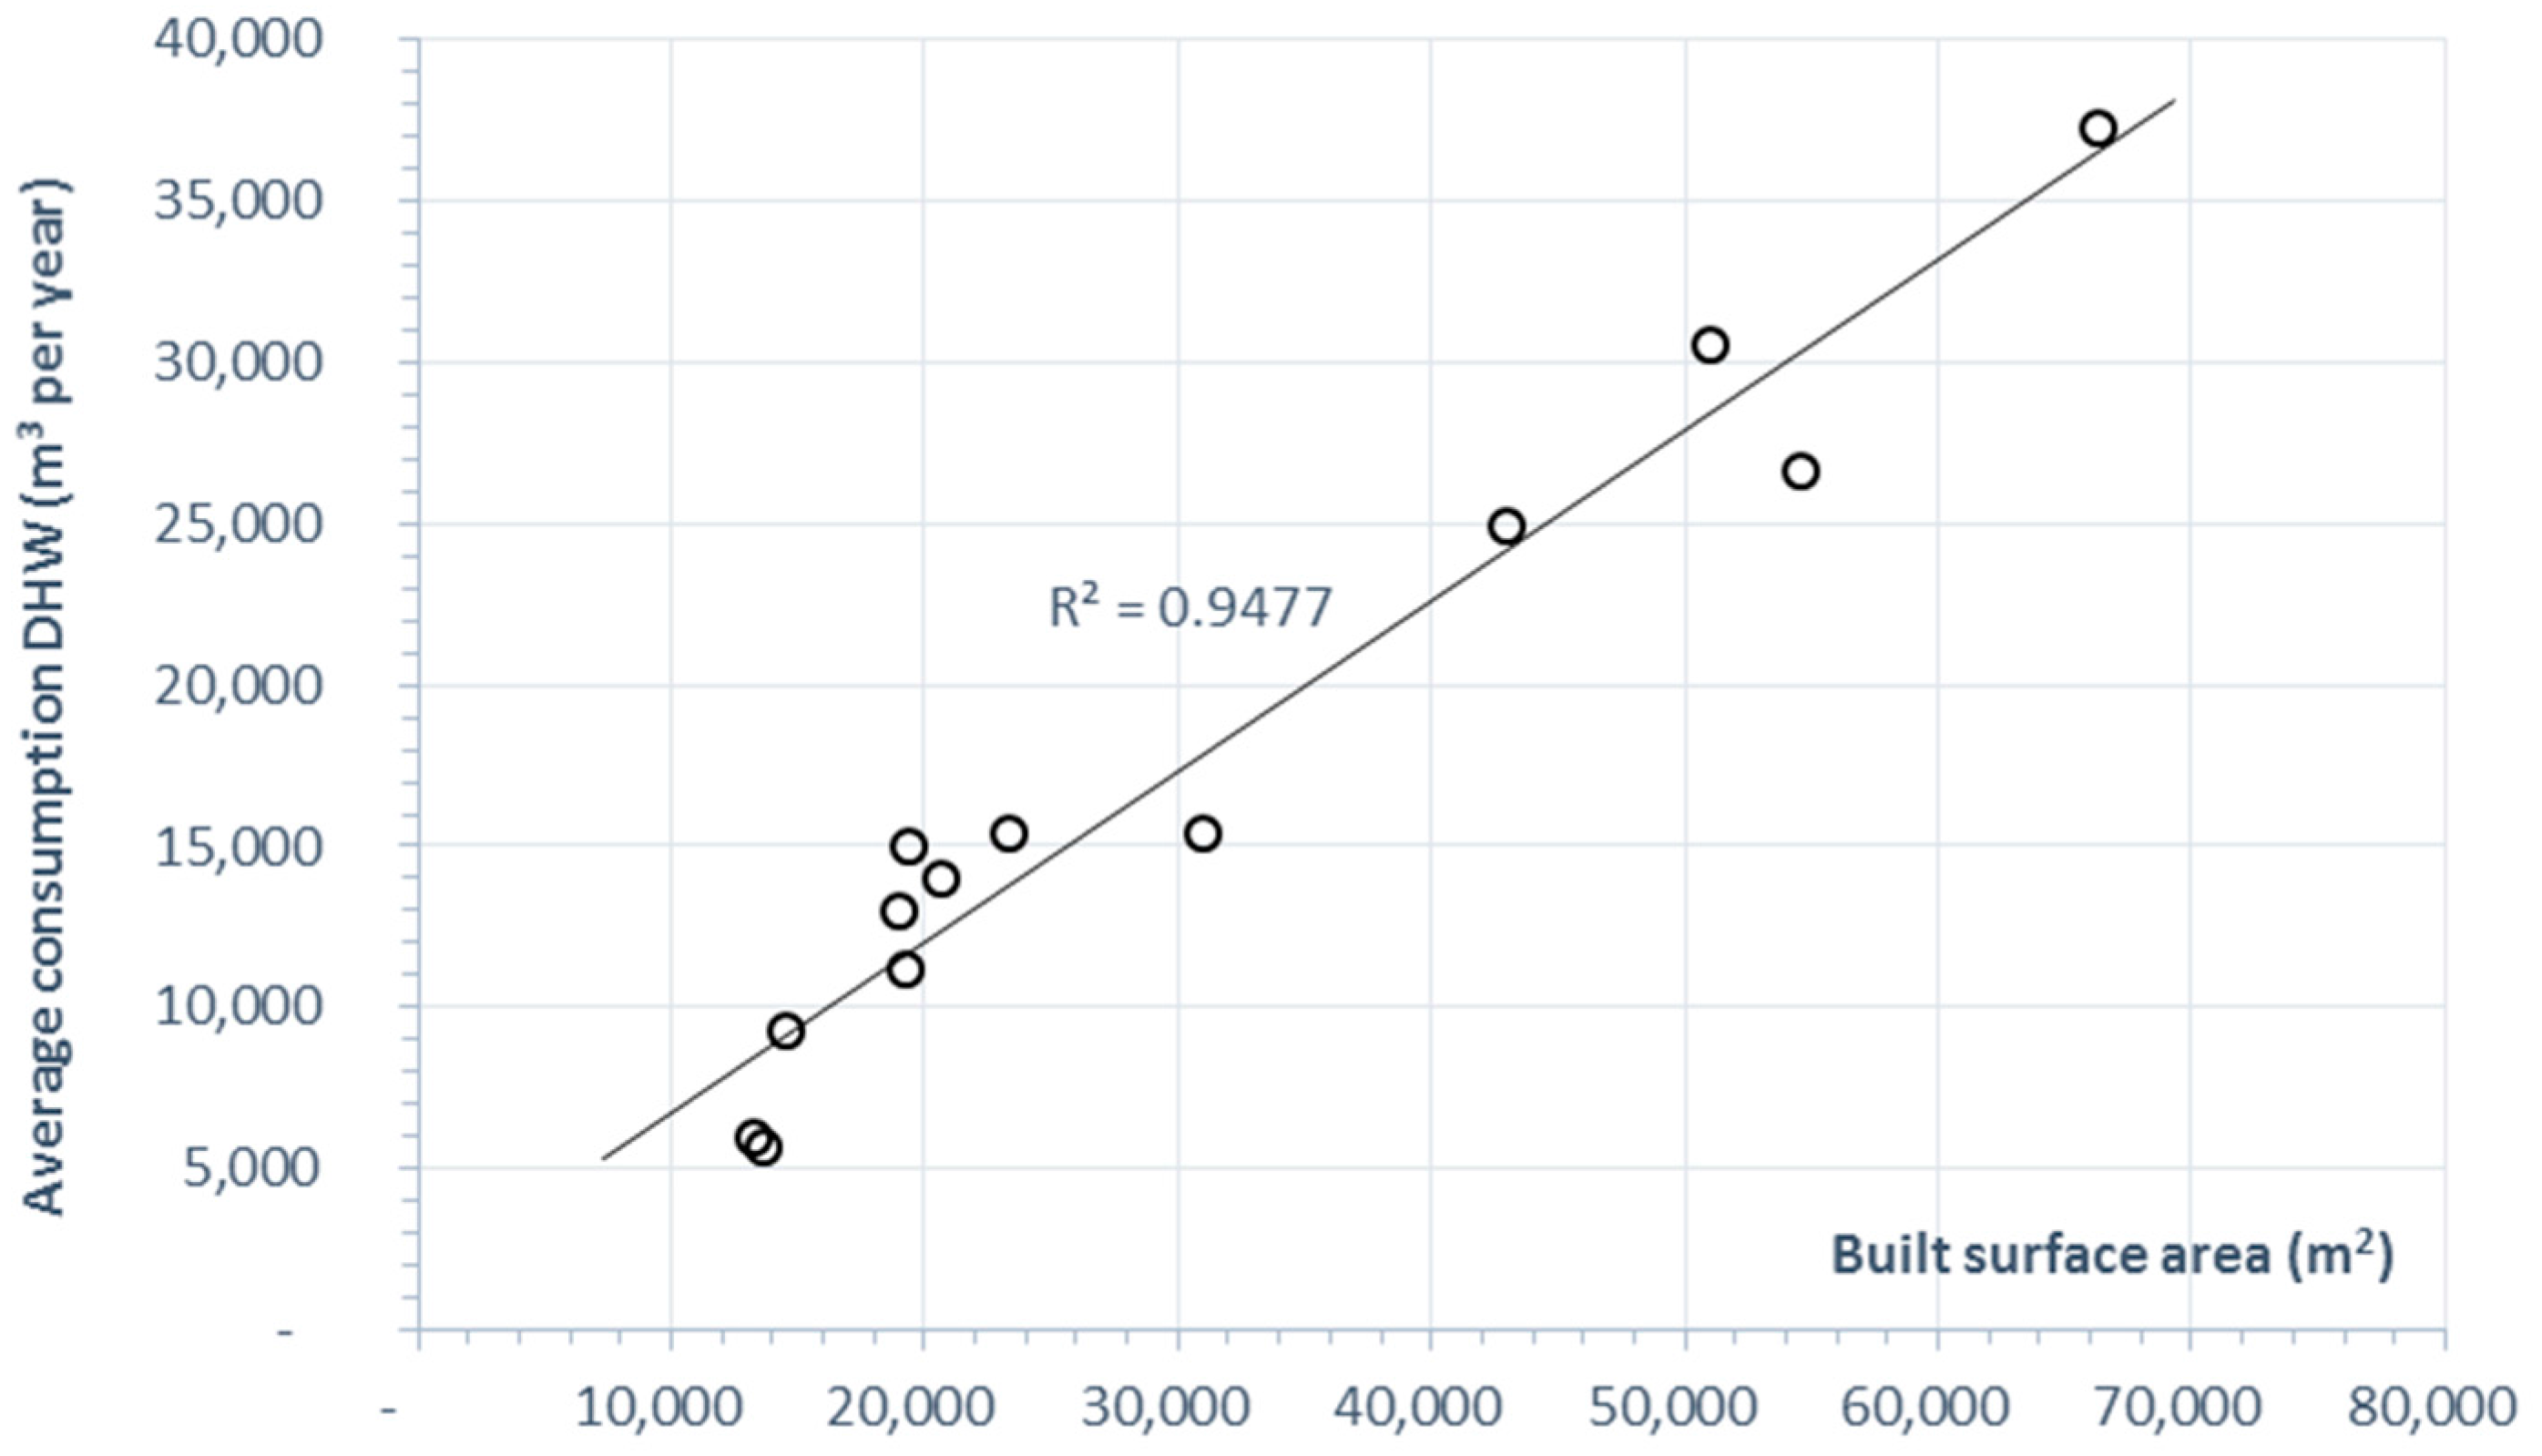
2.2. Relationship between the Average Annual Consumption of Domestic Hot Water and the Built Surface Area of a Hospital

Figure 4 shows the average annual consumption of domestic hot water and the constructed area of the hospitals analysed in the sample. There was a strong correlation between the variables (R2 = 0.9477).
Equation (3) defines the relationship between the average annual water consumption and the built surface area in each hospital.
C = 0.53 S + 1400
where C represents the value of the average annual water consumption expressed in m3 and S the built surface area of the hospital, expressed in m2.

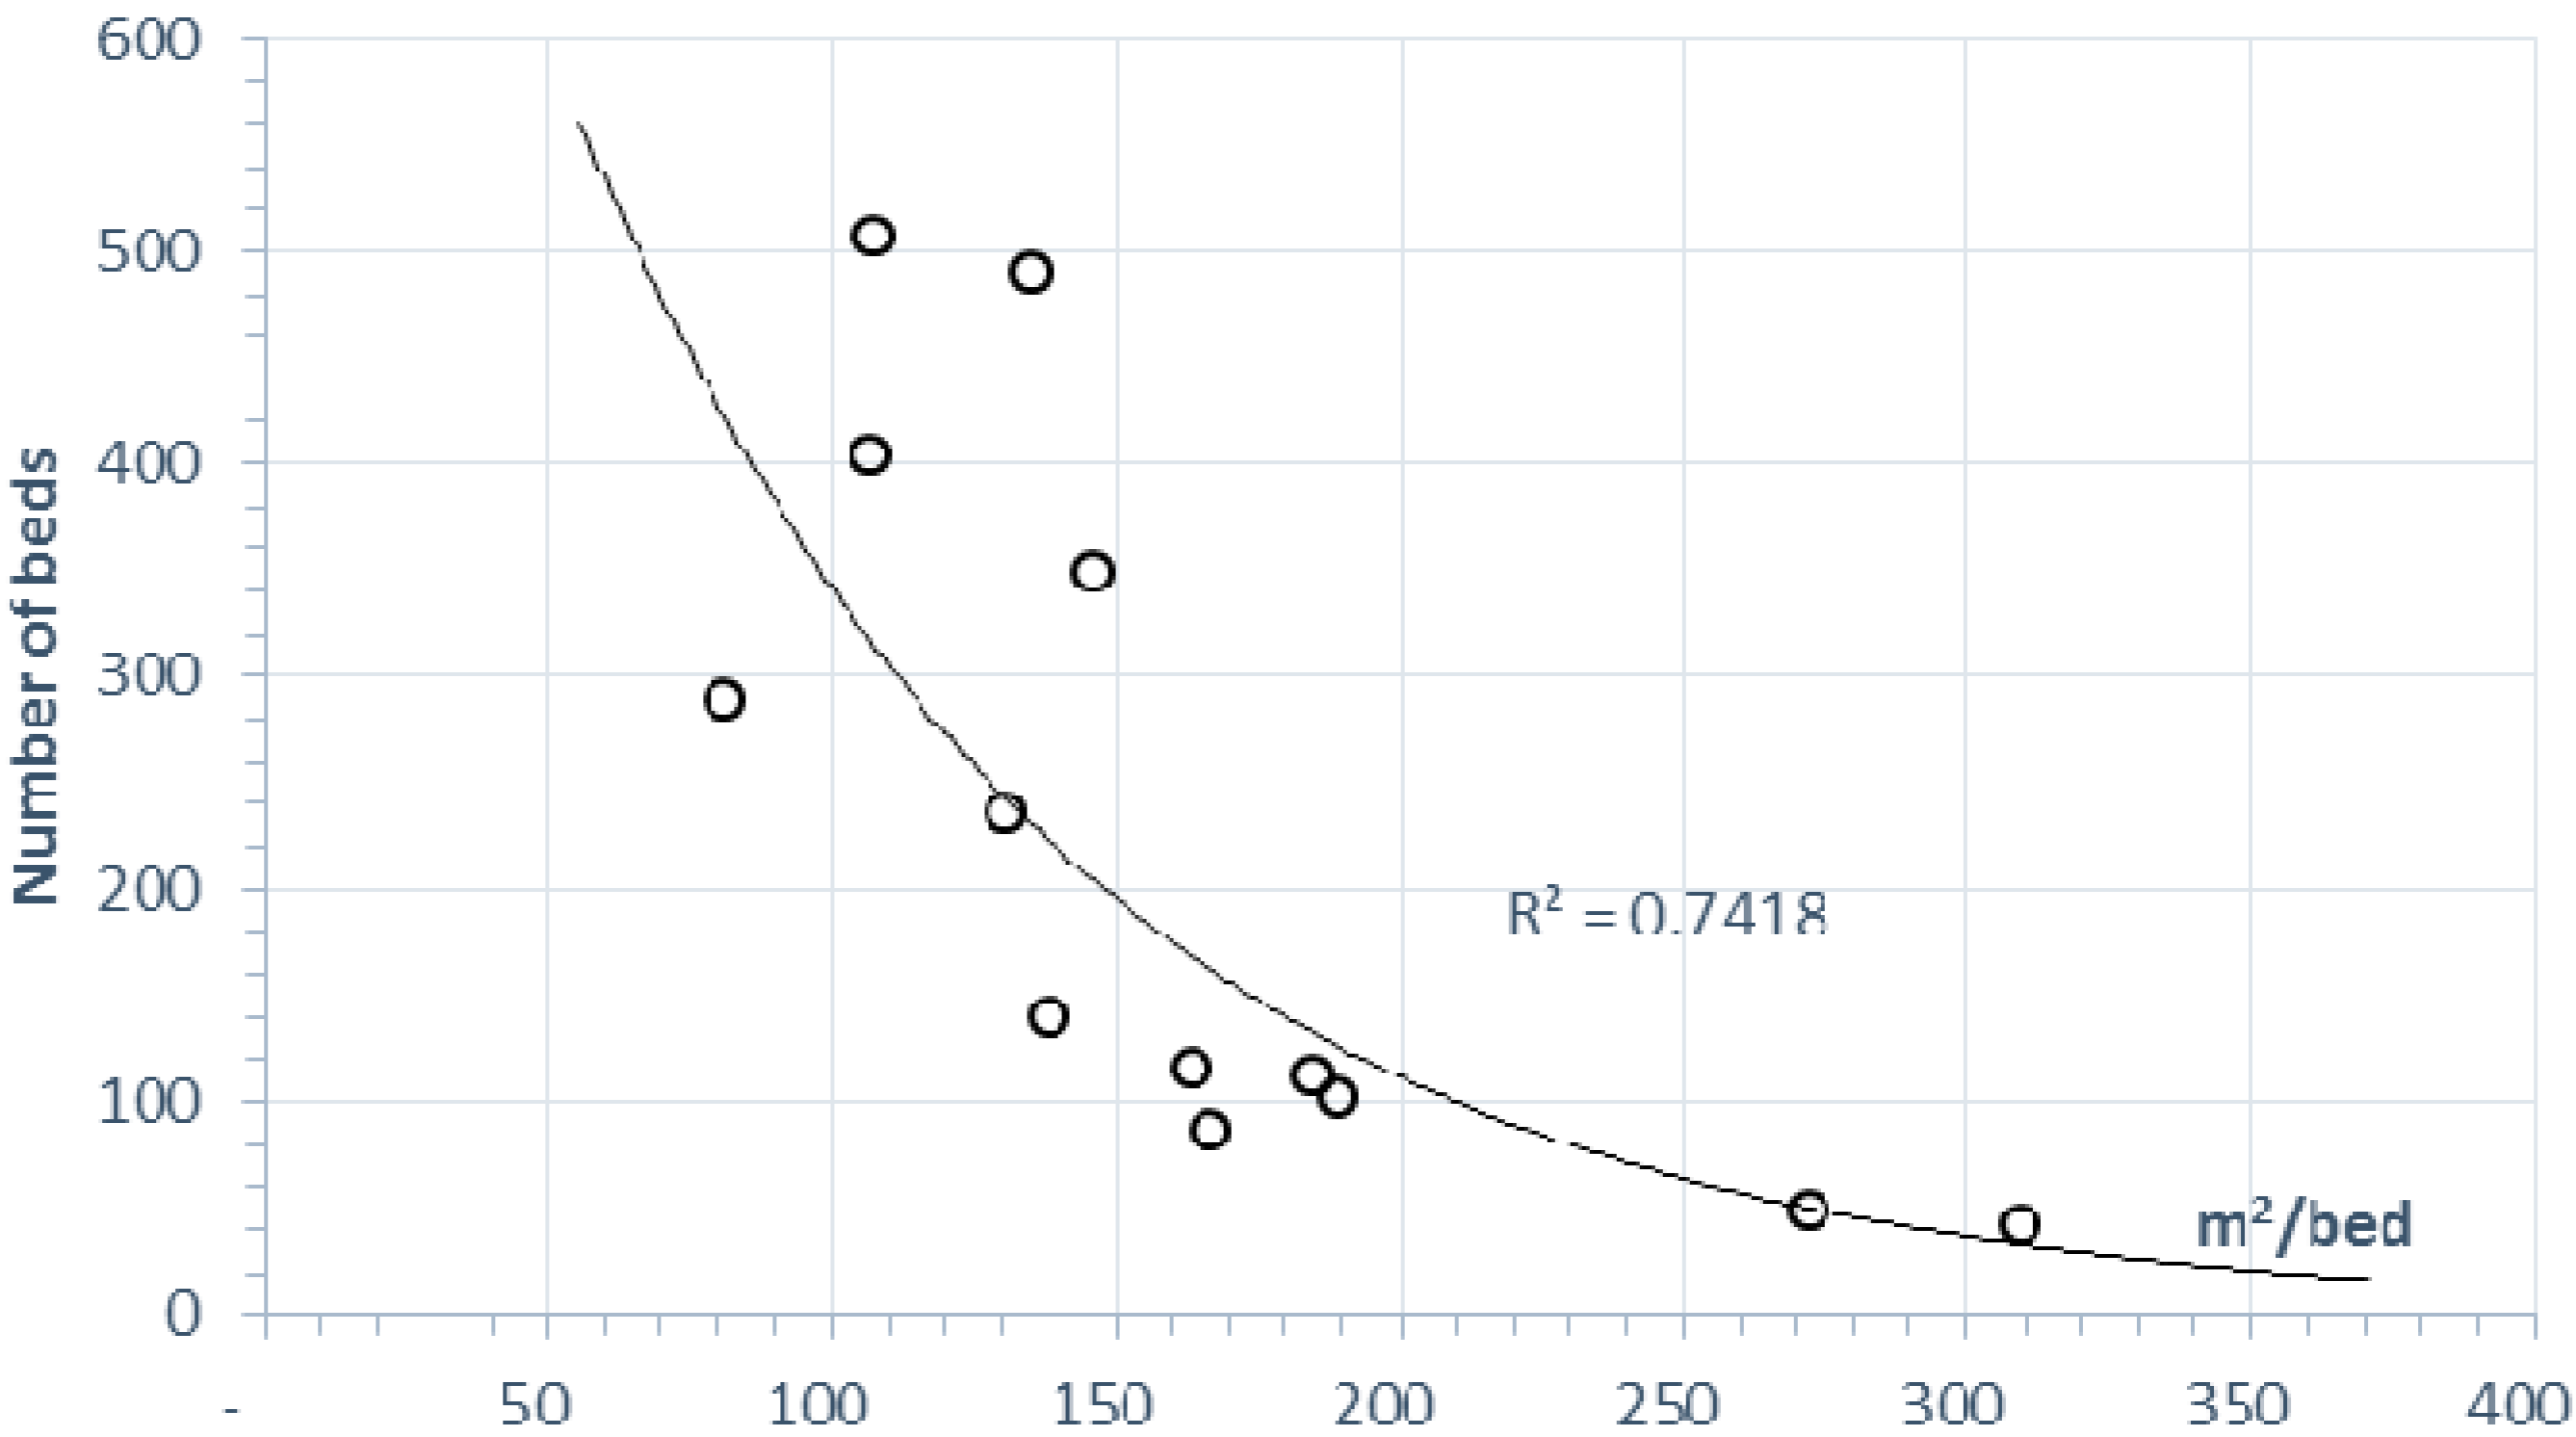
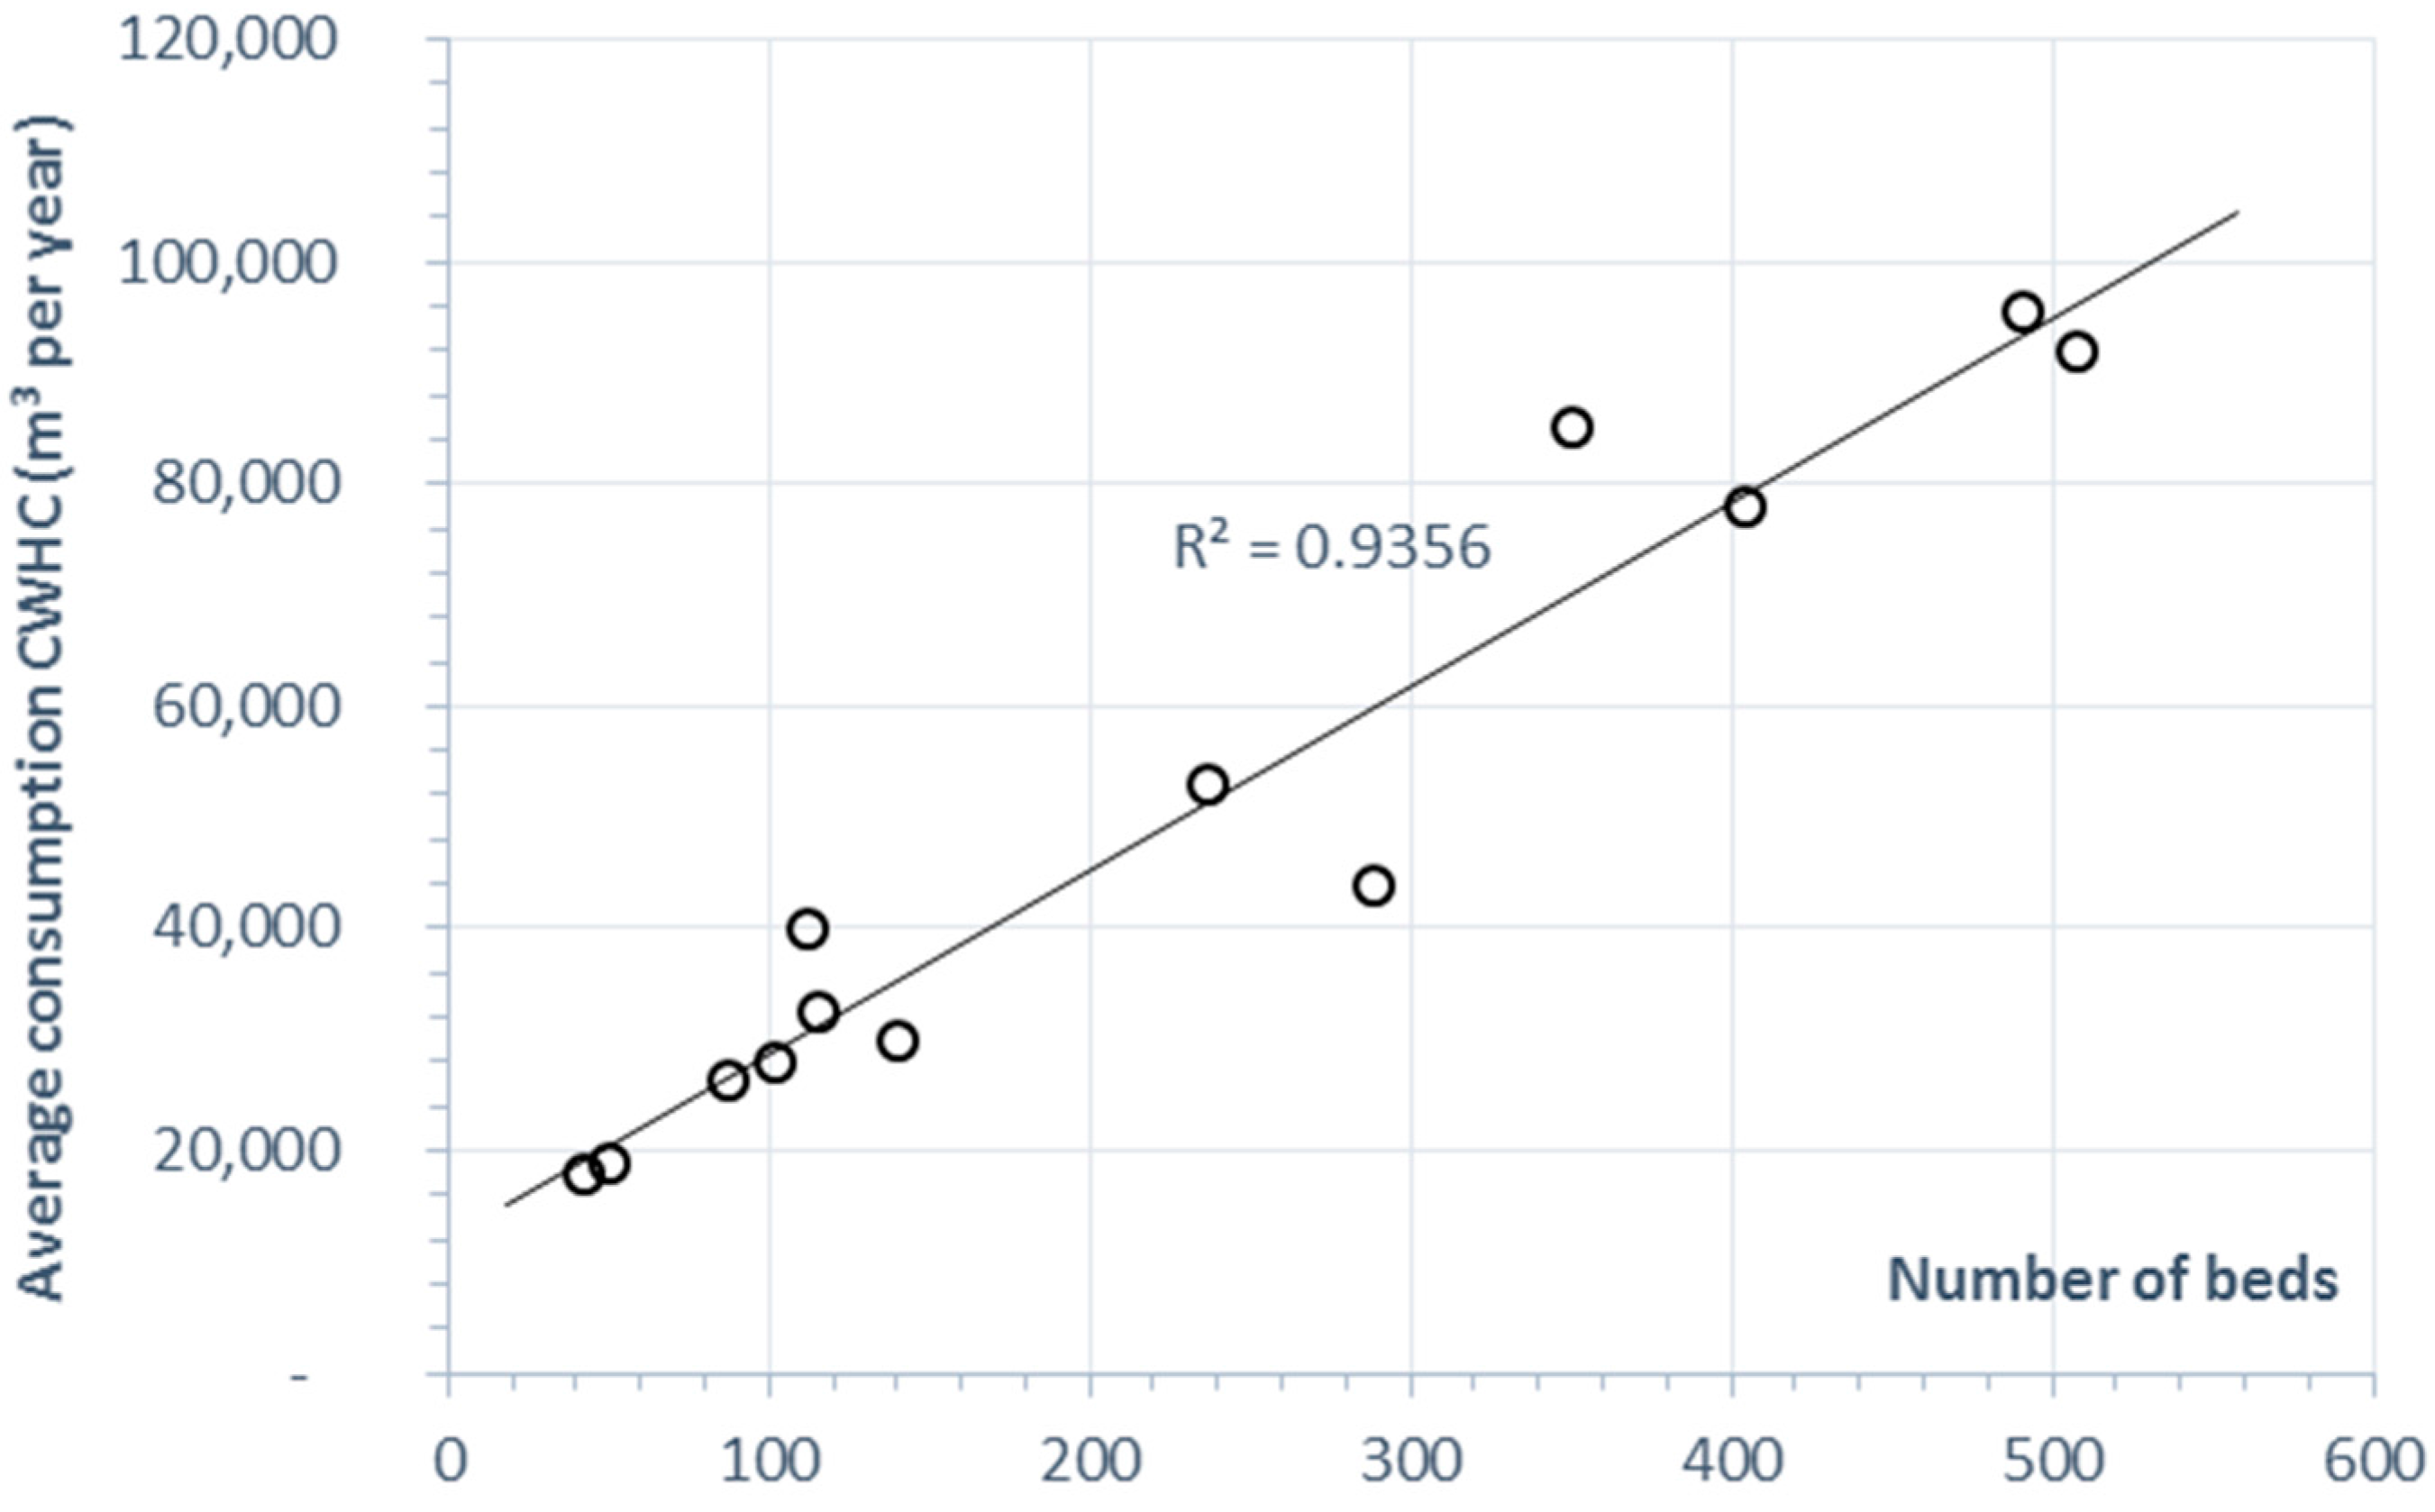
2.3. Relationship between the Average Annual Cold Water Consumption and the Number of Beds

Figure 5 shows the average annual cold water consumption and the number of hospital beds. Therefore, there is a close relationship between those two variables, with a high correlation (R2 = 0.9356).
Equation (4) defines the relationship between the average annual water consumption and the number of beds per hospital.
C = 165 B + 12 , 100
where C represents the value of the average annual cold water consumption in m3, and B is the number of beds per hospital.

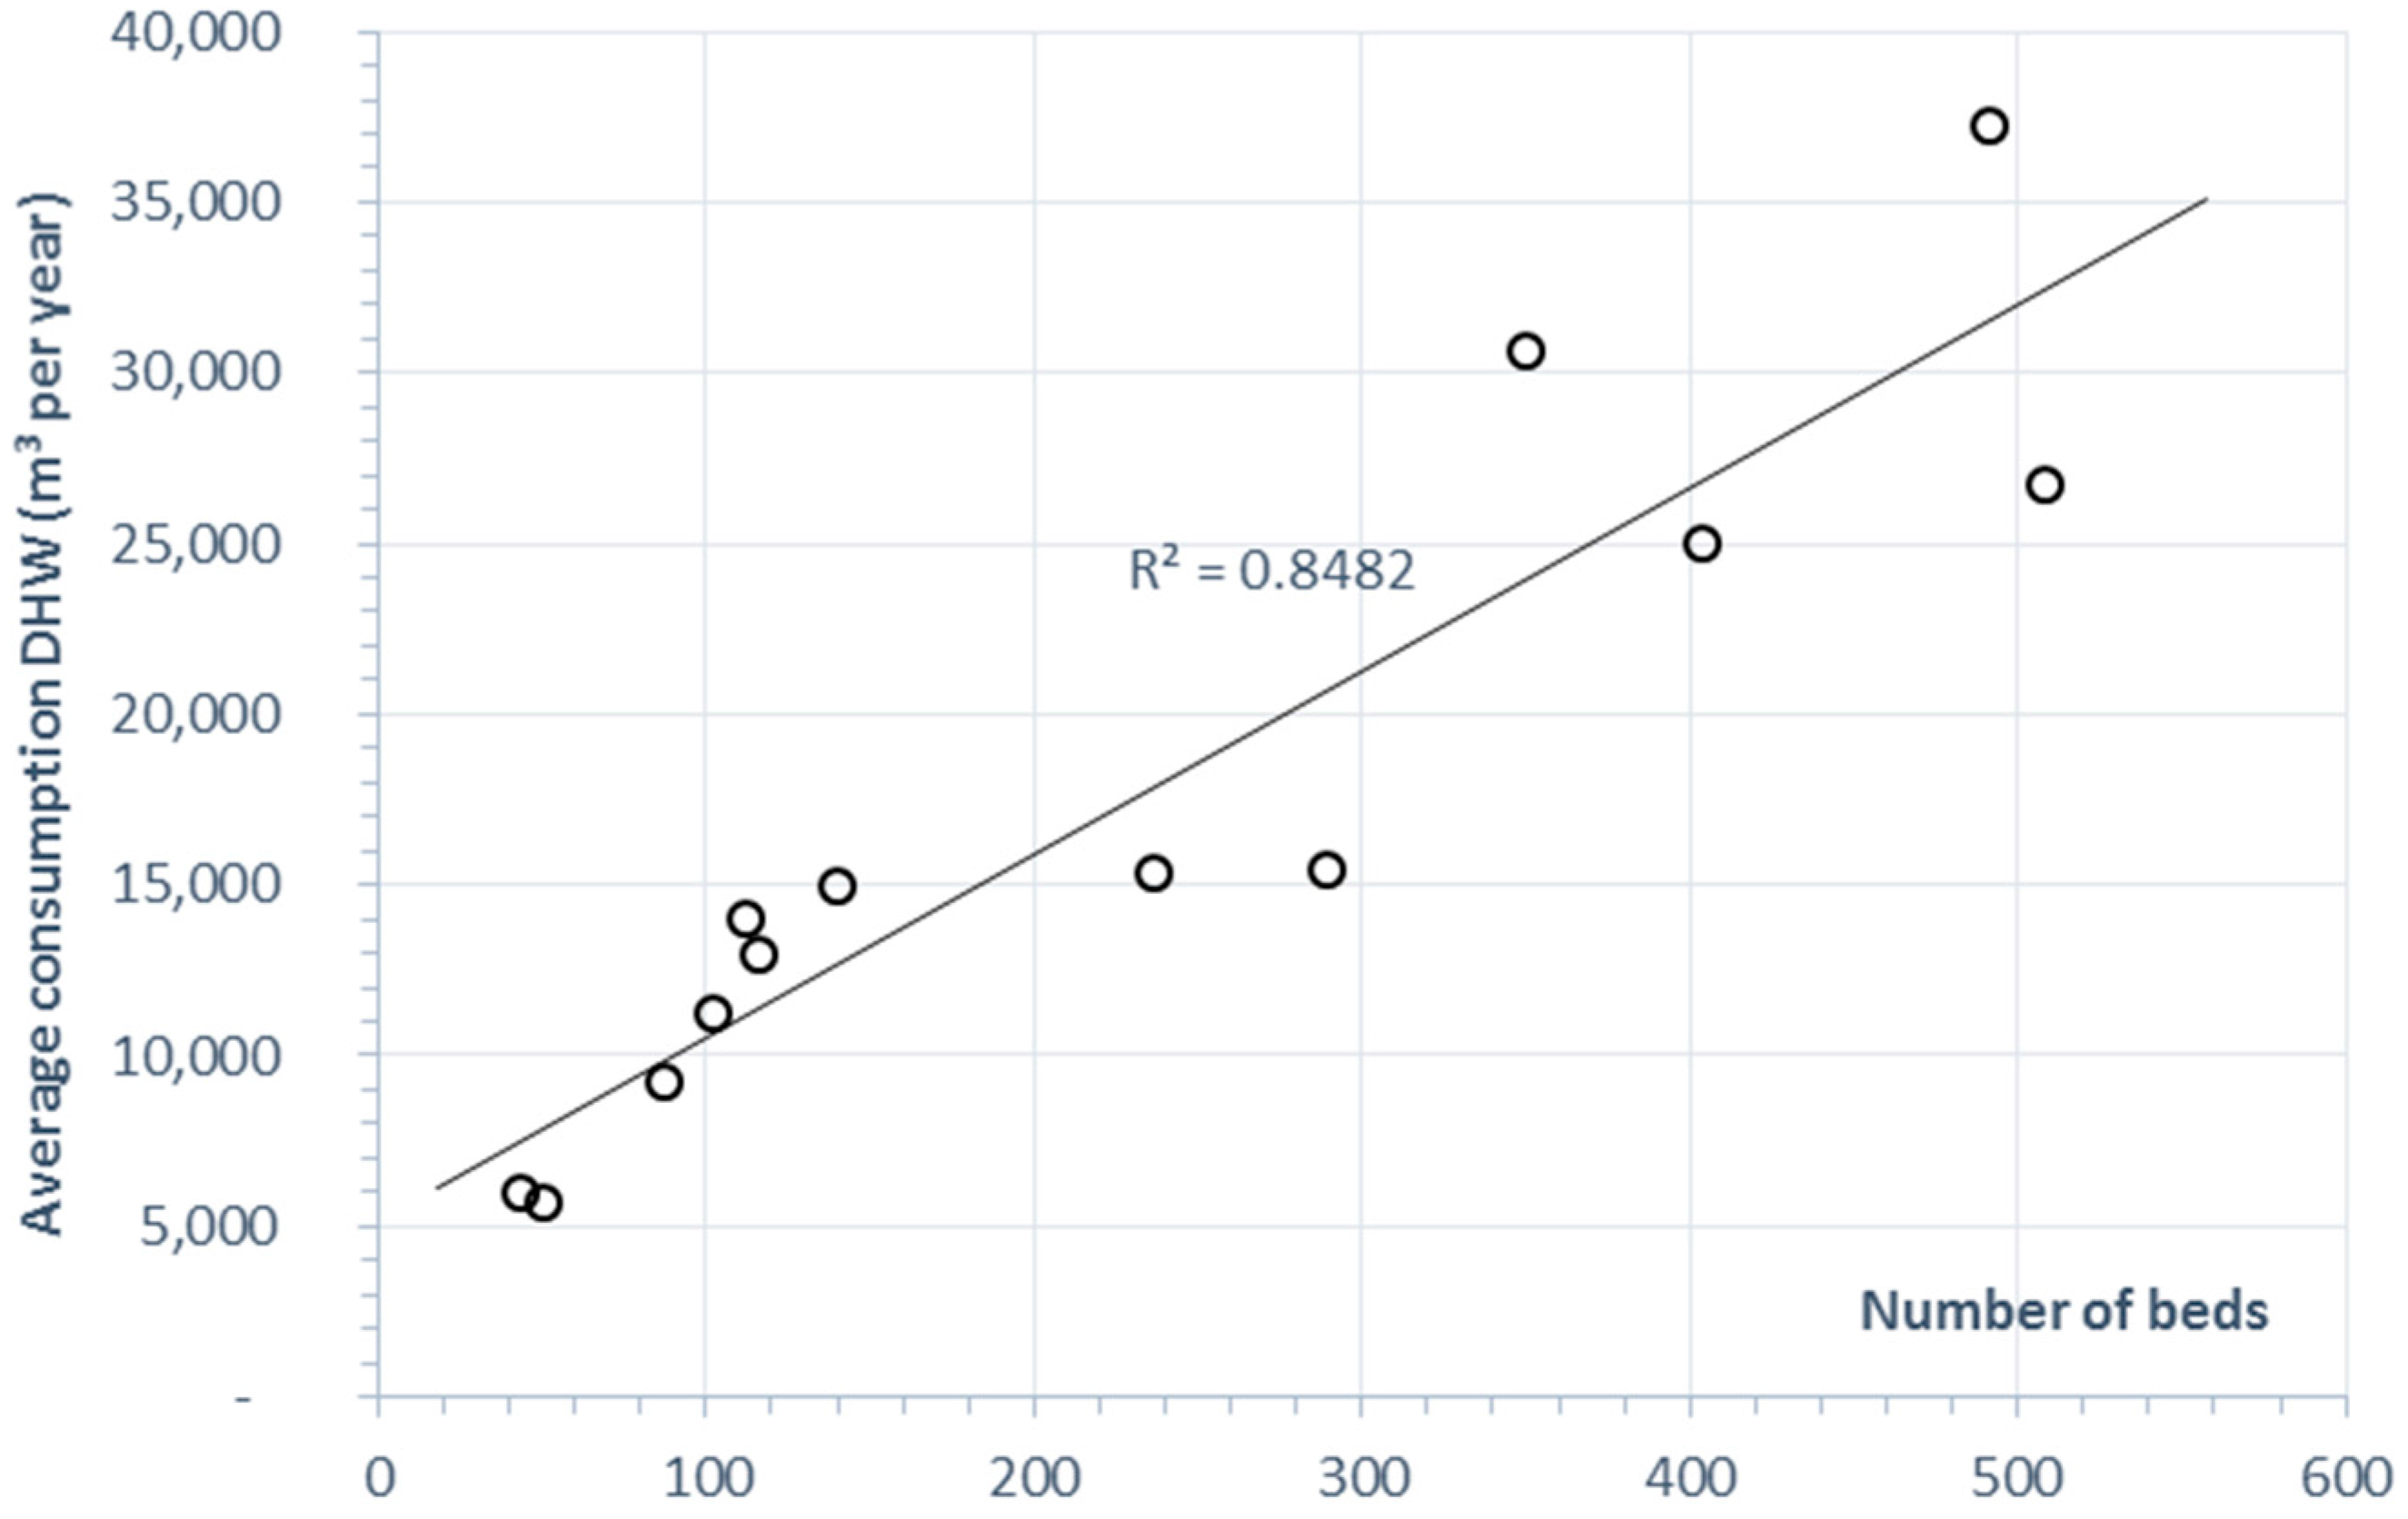
2.4. Relationship between the Average Annual Consumption of Hot Water and Number of Beds

Figure 6 shows the consumption of water and the number of beds per hospital. These two variables present a correlation (R2 = 0.8482). It can be concluded that the average annual hot water consumption depends on the number of beds.
Equation (5) defines the relationship between the average annual consumption of hot water and the number of beds per hospital:
C = 53.65 B + 5170
where C represents the average annual hot water consumption value, expressed in m3, and B is the number of hospital beds.

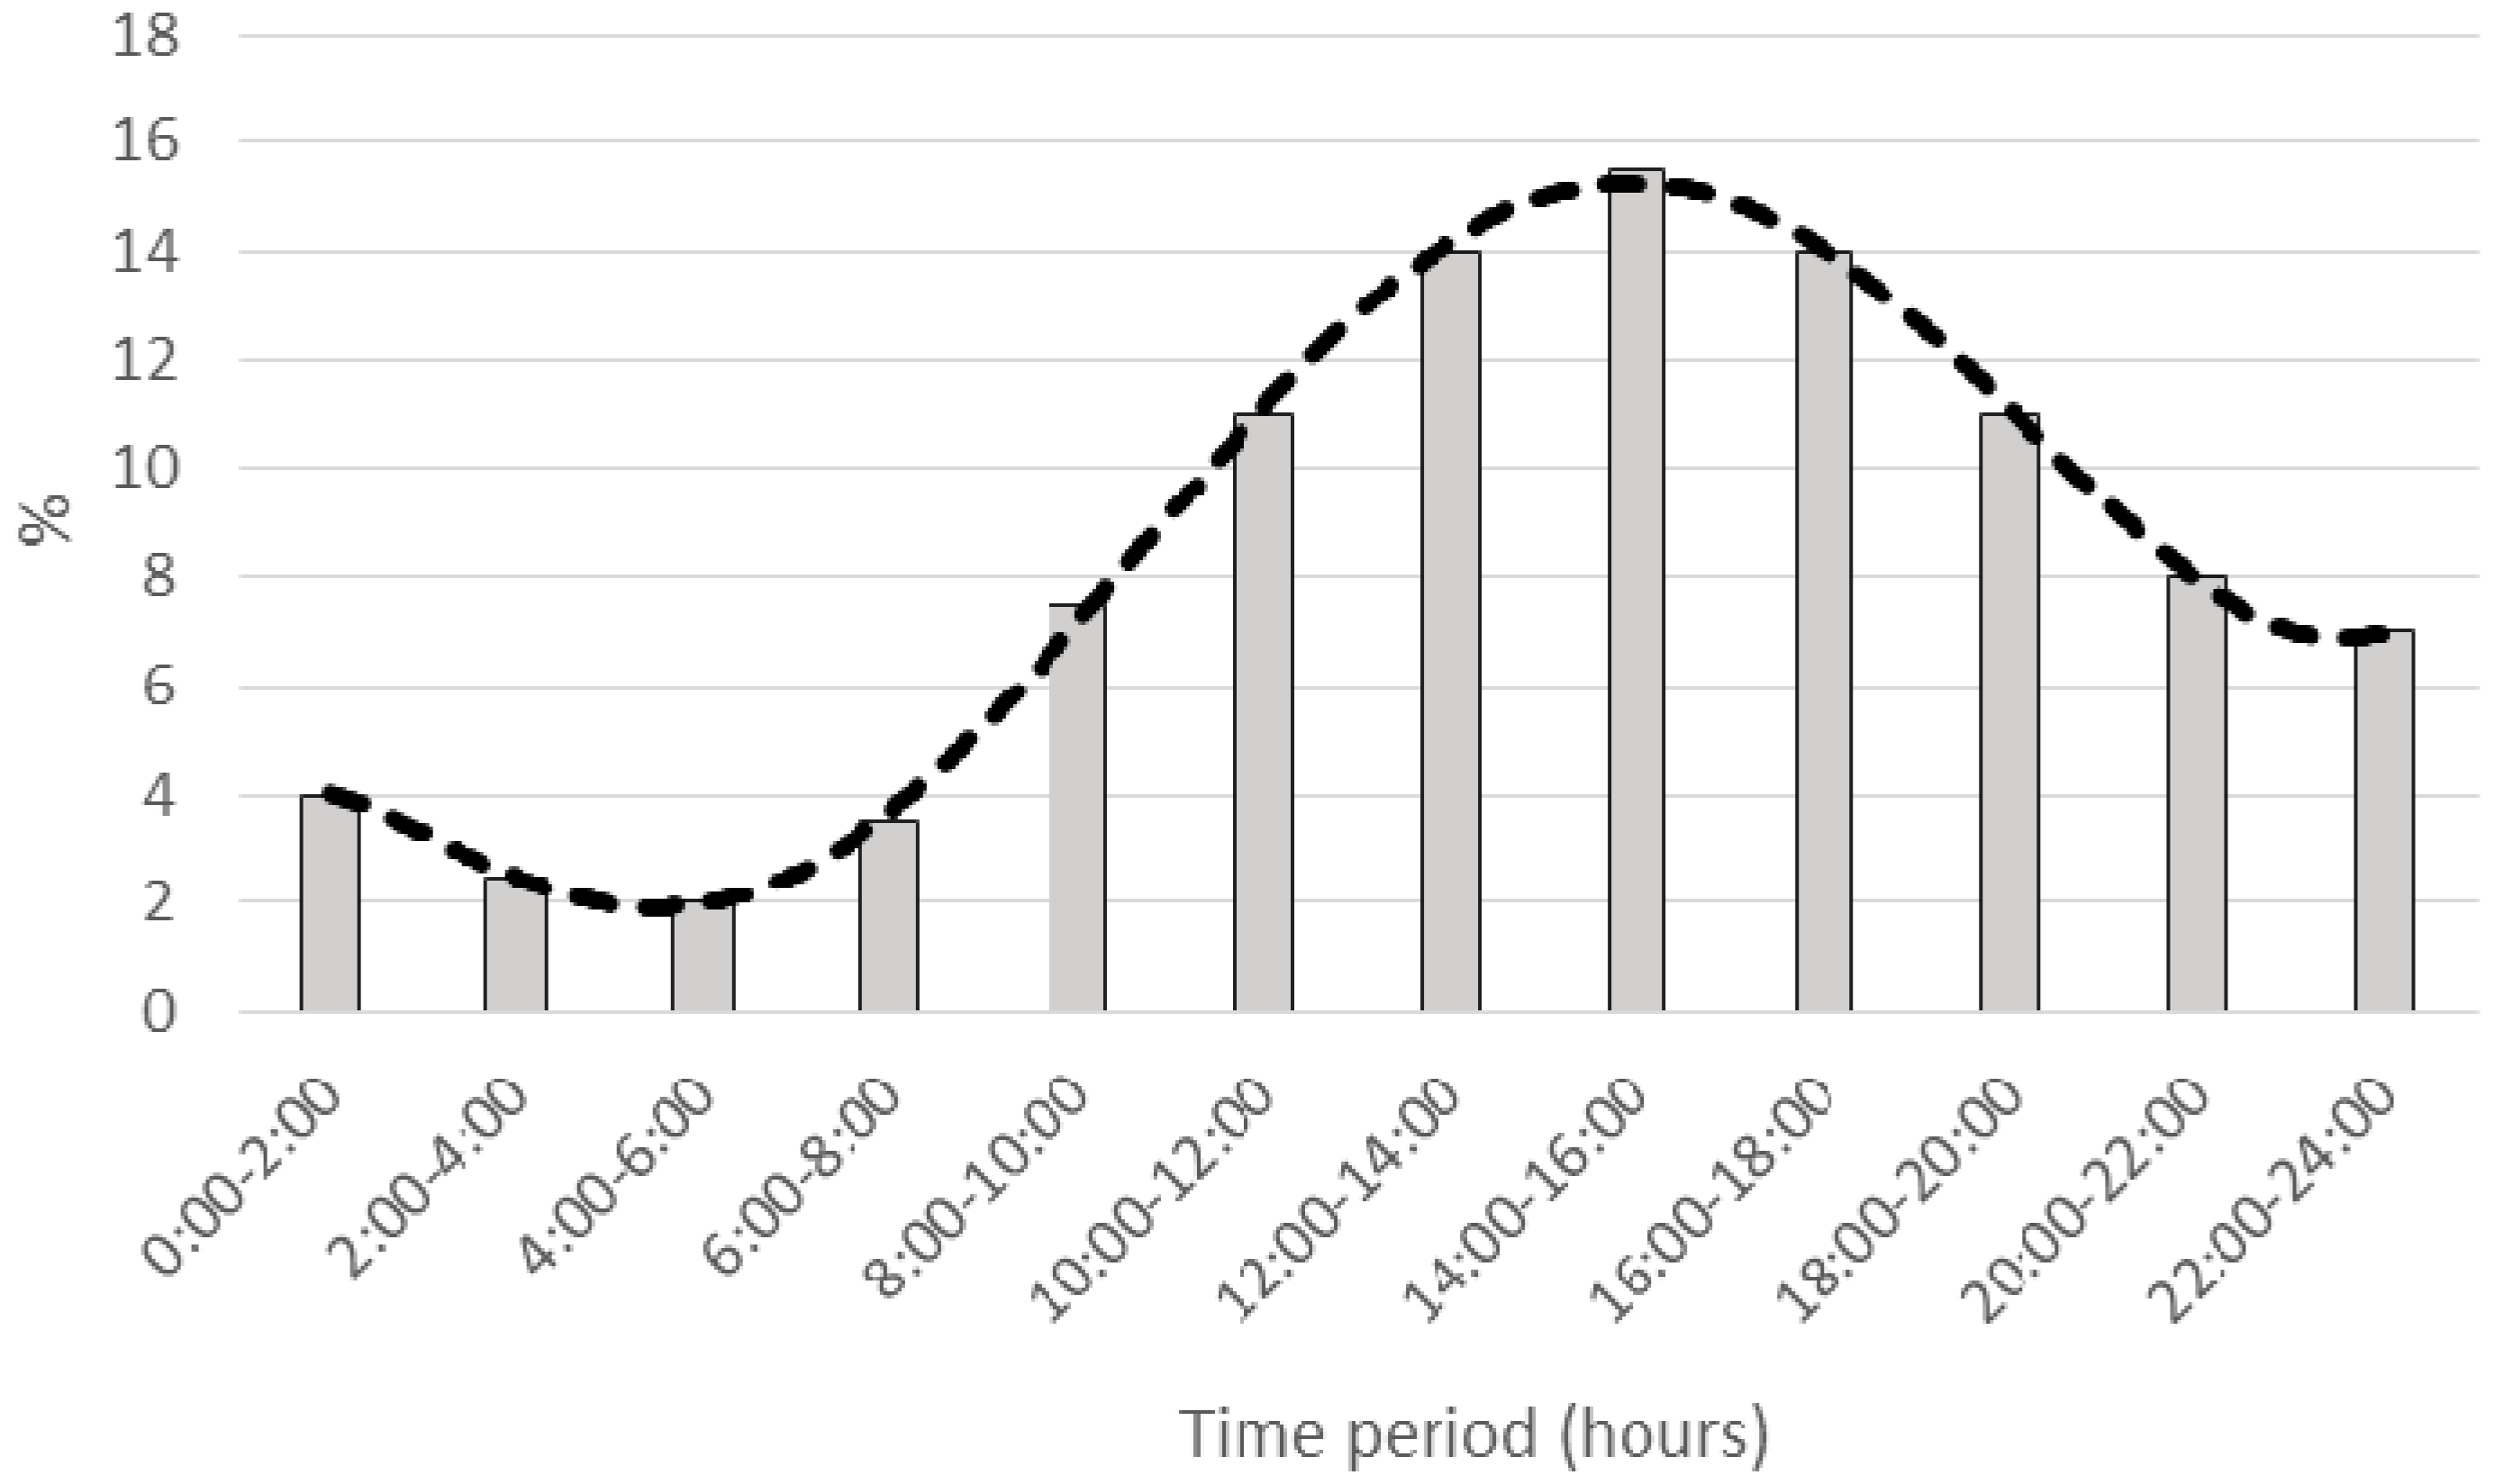
2.5. Monthly Average Hourly Cold Water Consumption

Figure 7 shows the average values of cold water consumption for the hospitals in the sample. It is observed that the daily time period with greater consumption of cold water is between 12 p.m. and 6 p.m.

3. Discussion

Any measure taken in order to improve the efficiency in a hospital should not contravene other essential requirements applicable, namely, the accessibility, safety, and reliability of their installations [30]. Significant water savings in a hospital is directly related to its daily management [31], which is possible to control directly by its staff. It is advisable to raise the awareness of the importance of saving water to the personnel and users through saving campaigns. ISO-14000 and Eco-Management and Audit Scheme (EMAS) certifications are advisable tools for the management of hospital infrastructures, which also contribute to improve image and commitment to the environment [32].
On-site water disinfection contribute to reducing the risk of bacterial proliferation such as Legionella Pneumophila, but considerably increase water consumption [33]. This bacterium could be present in cooling towers, water networks, and DHW production equipment, mainly in accumulation deposits, where water stratification conditions favour its proliferation [34]. The cuts and interruptions in the supply can cause, in some sections of water networks, the adequate conditions of temperature and stratification for bacterial proliferation. In addition, dirt and dust, which contain inactive forms of Legionella, can travel through the air, depositing and contaminating condensate trays in cooling towers [35].
It is advisable to install water meters in certain areas of a given hospital (kitchen, irrigation system, air conditioning, and fire extinguishing systems, among others) to determine the areas that generate greater consumption. In any case, when water saving measures are implemented, investment in hot water systems should be prioritized, as they generate greater energy expenditure.
The use of rainwater for irrigation of garden areas, which can be captured from roofs and parking lots of the hospital, helps to reduce water consumption, although its storage is not recommended in hospitals, due to the possibility of bacterial proliferation. A recommended strategy is to collect water from artesian wells or subsoil for the irrigation of green areas. Grey waters, i.e., water used in showers and toilets, should never be re-used [36].
A poor sizing of water networks or faecal sewer networks can generate sedimentation of particles, both in emissaries and in primary treatment elements. This can lead to an increase in the frequency of maintenance operations and significant obstructions in evacuation networks. It can also lead to an under-dimensioning of hydraulic devices, causing in turn the overflow of sanitation networks or the reduction of efficiency in wastewater treatment plants.
From an environmental quality point of view, it is necessary to take into account the discharges and the quality with which they are performed. The quantity and variety of discharges made with the intervention of water entail physical, biological, chemical, and radioactive factors.
The data and results of this research have been provided to the regional health authorities so that they can serve to improve the management of hospital facilities in the future.

4. Materials and Methods

An analytical study was carried out between 2010 and 2014 in 13 public hospitals located in Extremadura, a region in the southwest of Spain, bordering Portugal. The hospitals were built between 1980 and 2008. These are the Hospitals of Tierra de Barros (Almendralejo), Zafra, Coria, Navalmoral de la Mata, Plasencia, Mérida, San Pedro de Alcántara and Virgen de la Montaña (Cáceres), Infanta Cristina and Perpetuo Socorro (Badajoz), Llerena, Siberia-Serena (Talarrubias), and Don Benito-Villanueva.
The data obtained were collected from audits performed by the Extremadura Energy Agency (AGENEX), financed through a collaboration agreement with the Health Department from the Government of Extremadura. The sample included 100% of the public hospitals in the region. In addition, the monthly consumption indicated in the invoices of the water-supplying companies was analyzed.
The hospitals under study ranged between 13,300 m2 (the smallest) and 66,326 m2. The number of beds ranged between 43 and 508.
In the course of the research, relationships between water consumption and other functional and operational parameters from each center were identified, including the year of construction, the built surface area, the number of users, and the portfolio of services, among others, by using mathematical correlation techniques and sensitivity analysis.
Two study variables were chosen: the built surface area and the number of beds installed. The number of employees in the hospital was not considered as a variable since it had large fluctuations throughout the year.
In the case of hospitals with green areas and/or laundry facilities, 10% and 15% correction factors were applied, respectively, to homogenize the above data [37]. The number of beds variable was obtained from data published annually by the Spanish Ministry of Health [38]. The built surface area of the hospitals was obtained by consulting the respective construction projects.
The mean annual consumption values were obtained by calculating the arithmetical mean value. In order to determine the time periods of consumption of CWHC, daily measurements of water consumption were taken in the hospital water supply connection.

5. Conclusions

Based on the results obtained, it is concluded that, in the analyzed hospitals, there is a close relationship between the consumption of water, both cold and hot, and the built surface area and between water consumption and number of beds. However, to determine the average annual consumption in a hospital, a fixed ratio should not be used, but a parametric type indicator correlated either with the constructed surface or with the number of beds.
The average annual consumption of CWHC was 262.82 m3 (102.10) per bed and 1.65 m3 (0.46) per built surface area, excluding laundries and irrigation of gardens. The mean annual consumption of DHW was 92.96 m3 (35.72) per bed and 0.59 m3 (0.18) per built surface area. The ratio between DHW and CWHC was 35.62% (5.53). The time period of greatest demand was between 12 p.m. and 6 p.m.
It was observed that, as the number of beds and/or the built surface area of a hospital increased, the average annual consumption of CWHC per bed decreased. It was also noticed that the average annual consumption of CWHC per built surface area was not altered by the number of hospital beds. A similar relationship was observed with DHW.
The study also showed that smaller hospitals consume more water per bed and built surface area than larger ones.
In order to determine the average annual water consumption, a fixed ratio should not be the appropriate tool. A parametric type related to the built surface area and/or number of beds by hospital should be used instead. Considering B as the number of hospital beds and S its constructed area, to calculate the average annual cold water for human consumption in a hospital, either 165B + 12,100 (m3) or 1.568S + 2400 (m3) should be used. Similarly, in terms of hot domestic water, the average annual consumption in m3 corresponds to either 53.65B + 5170 (m3) or 0.53S + 1400 (m3).

Acknowledgments

The authors wish to acknowledge to the Fondo Social Europeo (FEDER) and the Ministry of Education, Culture and Sports for the support of this research work. This study has been carried out through the Research Project GR-15057 linked to the V Regional Plan of Research and Investigation from the General Government of Extremadura 2014–2017.

Author Contributions

Justo Garcia-Sanz-Calcedo and Awf Al-Kassir conceived and designed the experiments; Fernando Lopez-Rodríguez and Talal Yusaf performed the experiments; Justo Garcia-Sanz-Calcedo analyzed the data; Fernando Lopez-Rodríguez contributed analysis tools; Justo Garcia-Sanz-Calcedo wrote the paper.

Conflicts of Interest

The authors declare no conflict of interest.

References

  1. Lillo-Fernández, J.M; Rodríguez-Blas, M.C. Estadística de Gasto Sanitario Público: Principales Resultados. Ministerio de Sanidad, Servicios Sociales e Igualdad, España, 2016. Available online: https://www.msssi.gob.es/estadEstudios/estadisticas/docs/EGSP2008/egspPrincipalesResultados.pdf (accessed on 29 March 2017).
  2. Hamdy, A.; Ragab, R.; Scarascia-Mugnozza, E. Coping with water scarcity: Water saving and increasing water productivity. Irrig. Drain. 2003, 52, 3–20. [Google Scholar] [CrossRef]
  3. Instituto Nacional de Estadística de España. Estadística Sobre el Suministro y Saneamiento del agua. 2016. Available online: http://www.ine.es/dyngs/INEbase/es/operacion.htm?c=Estadistica_C&cid=1254736176834&menu=ultiDatos&idp=1254735976602 (accessed on 29 March 2017).
  4. Intelligent Energy Europe. EnerBuilding. The Rational Use of Energy in Public Buildings. Available online: https://ec.europa.eu/energy/intelligent/projects/en/projects/enerbuilding (accessed on 29 March 2017).
  5. Ali, M.M.; Wan, W.M.N. Audit assessment of the facilities maintenance management in a public hospital in Malaysia. J. Facil. Manag. 2009, 7, 142–158. [Google Scholar] [CrossRef]
  6. Shohet, I.M. Key performance indicators for strategic healthcare facilities maintenance. J. Constr. Eng. Manag. 2006, 132, 345–352. [Google Scholar] [CrossRef]
  7. Chyu, M.C.; Austin, T.; Calisir, F.; Chanjaplammootil, S.; Davis, M.J.; Favela, J.; Gan, J.; Gefen, A.; Haddas, R.; Hahn-Goldberg, S.; et al. Healthcare Engineering Defined: A White Paper. J. Healthc. Eng. 2015, 6, 635–648. [Google Scholar] [CrossRef] [PubMed]
  8. Fraile, J.C.; San-José, J.; González-Alonso, A. A Boiler Room in a 600-Bed Hospital Complex: Study, Analysis, and Implementation of Energy Efficiency Improvements. Energy 2014, 7, 3282–3303. [Google Scholar] [CrossRef]
  9. Best Environmental Practices in the Healthcare Sector: A Guide to Improve Your Environmental Performance. Available online: http://www.cp.org.jo/ghdp/docs/Hospital%20Guide.pdf (accessed on 29 March 2017).
  10. Ludwigs, A. Substance-Flow Water/Waste Water Management in European Hospitals—Water Saving Strategies and Strategies for Reducing Waste Water Pollution; Project LIFE99 ENV/D/000455. Available online: http://ec.europa.eu/environment/life/project/Projects/index.cfm?fuseaction=home.showFile&rep=file&fil=LIFE99_ENV_D_000455_LAYMAN.pdf (accessed on 29 March 2017).
  11. Virginia Department of Transportation. Smithfield Design and Construction Standards; Department of Transportation: Smithfield, VA, USA, 2008. [Google Scholar]
  12. Washington State Department of Health. Water System Design Manual; Division of Environmental Health: Olympia, WA, USA, 2009. [Google Scholar]
  13. Audit Commission for Local Authorities in England and Wales, Untapped Savings: Water Services in the NHS; National Health Service: London, UK, 1993.
  14. Reller, A. Greener Hospitals. Improving Environmental Performance; Environment Science Center: Augsburg, Germany, 2003. [Google Scholar]
  15. Dettenkofer, M.; Kuemmerer, K.; Schuster, A.; Mueller, W.; Muehlich, M.; Martin, S.; Daschner, F.D. Environmental auditing in hospitals: First results in a university hospital. Environ. Manag. 2000, 25, 105–113. [Google Scholar] [CrossRef]
  16. González, A.G.; García-Sanz-Calcedo, J.; Salgado, D.R. A quantitative analysis of Cold Water for Human Consumption (CWHC) in hospitals in Spain. J. Healthc. Eng. 2016, 2016, 1–10. [Google Scholar] [CrossRef] [PubMed]
  17. Study on Water Quality and Demand on Public Water Supplies with Variable Flow Regimes and Water Demand. 2011. Available online: http://www.ecc.gov.nl.ca/waterres/training/adww/decade/16_Stephanie_Gora.pdf (accessed on 29 March 2017).
  18. Armas, J.R. Variaciones del caudal y consumos de agua relativos a una cama en el hospital Abel Santamaría en Pinar del Río. Ing. Hidrául. Ambient. 2002, 23, 20–24. (In Spanish) [Google Scholar]
  19. Comisión Nacional del Agua de México. Manual de Agua Potable, Alcantarillado y Saneamiento. Datos Básicos Para Proyectos de Agua Potable y Alcantarillado. México. 2007. Available online: http://aneas.com.mx/wp-content/uploads/2016/04/SGAPDS-1-15-Libro4.pdf (accessed on 29 March 2017).
  20. Organización Panamericana de la Salud et al. Agua y salud; Autoridades Locales, Salud y Ambiente . USA, 1999. Available online: http://www.bvsde.paho.org/acrobat/aguasa.pdf (accessed on 29 March 2017).
  21. D’Alessandro, D.; Tedesco, P.; Rebecchi, A; Capolongo, S. Water use and water saving in Italian hospitals. A preliminary investigation. Annali dell’Ist. Super. di Sanit. 2016, 52, 56–62. [Google Scholar]
  22. Garcia-Sanz-Calcedo, J.; Gómez, M. Quantitative Analysis of the Impact of Maintenance Management on the Energy Consumption of a Hospital in Extremadura (Spain). Sustain. Cities Soc. 2017, 30, 217–222. [Google Scholar]
  23. Bourkas, P.D. Applications of Installations in Hospitals; National Technical University of Athens: Athens, Greece, 1999. [Google Scholar]
  24. Katsanis, J.S.; Halaris, P.G.; Tsarabaris, P.T.; Malahias, G.N.; Bourkas, P.D. Estimation of energy consumption for domestic hot water in hospitals. Energy Power Syst. 2006, 2006, 1–7. [Google Scholar]
  25. Townend, W.K.; Cheeseman, C.R. Guidelines for the evaluation and assessment of the sustainable use of resources and of wastes management at healthcare facilities. Waste Manag. Res. 2005, 23, 398–408. [Google Scholar] [CrossRef] [PubMed]
  26. Bujak, J. Heat consumption for preparing domestic hot water in hospitals. Energy Build. 2010, 42, 1047–1055. [Google Scholar] [CrossRef]
  27. Anderson, J. The environmental benefits of water recycling and reuse. Water Sci. Technol. Water Supply 2003, 3, 1–10. [Google Scholar]
  28. Brown, L.H.; Buettner, P.G.; Canyon, D.V. The energy burden and environmental impact of health services. Am. J. Public Health 2012, 102, 76–82. [Google Scholar] [CrossRef] [PubMed]
  29. Mesdaghinia, A.R.; Naddafi, K.; Nabizadeh, R.; Saeedi, R.; Zamanzadeh, M. Wastewater characteristics and appropriate method for wastewater management in the hospitals. Iran J. Public Health 2009, 38, 34–40. [Google Scholar]
  30. Shepley, M.; Baum, M.; Ginsberg, R.; Rostenberg, W. Eco-effective design and evidence-based design: Perceived synergy and conflict. Health Environ. Res. Des. J. 2009, 2, 56–70. [Google Scholar] [CrossRef]
  31. García-Sanz-Calcedo, J.; Cuadros, F.; López-Rodríguez, F. Influence of the number of users on the energy efficiency of Health Centres. Energy Build. 2011, 43, 1544–1548. [Google Scholar] [CrossRef]
  32. Lizzi, G.D.; Collazzo, R.; Capra, E.; Lazzarini, R.; Goi, D. The Environmental Management System in a Health Structure: The Case study of ORC-Aviano (Italy). Open Waste Manag. J. 2017, 10, 1–12. [Google Scholar] [CrossRef]
  33. García-Sanz-Calcedo, J.; Monzón, P. Analysis of the economic impact of environmental biosafety works projects in healthcare centres in Extremadura (Spain). Dyn. Colomb. 2014, 81, 100–105. [Google Scholar] [CrossRef]
  34. Rivera, J.M.; Aguiar, J.M.; Vos-Arenilla, A.; Aguilar, L.; Gimenez, M.J.; Granizo, J.J. Combination of two methods for Legionella disinfection of water systems (cooling towers and potable water) in a Spanish hospital. Ant. J. Infect. Control 2014, 10, 1–4. [Google Scholar] [CrossRef]
  35. Hanizadeh, G.; Mirmohamadlou, A.; Esmaeli, D. Predictive parameters of Legionella pneumophila occurrence in hospital water: HPCs and plumbing system installation age. Environ. Monit. Assess. 2016, 188, 536. [Google Scholar] [CrossRef] [PubMed]
  36. Hamilton, K.D. The challenge of sustainable hospital building. Front. Health Serv. Manag. 2008, 25, 33–36. [Google Scholar]
  37. Katsanis, J.S.; Tsarabaris, P.I.; Bourkas, P.D.; Hallaris, P.G.; Malahias, G.N. Estimating water and energy consumption of hospital laundries. AATCC Rev. 2008, 8, 32–36. [Google Scholar]
  38. Ministerio de Sanidad, Servicios Sociales e Igualdad de España. Available online: http://www.msssi.gob.es/estadisticas/microdatos.do (accessed on 2 January 2017).
Figure 1. Relationship between the built surface area and the number of beds.
Energies 10 00479 g001
Figure 2. Relationship between the number of beds and the built surface area per bed.
Energies 10 00479 g002
Figure 3. Relationship between the average annual cold water for human consumption and the built surface area per hospital.
Energies 10 00479 g003
Figure 4. Relationship between the average annual consumption of domestic hot water and the built surface area per hospital.
Energies 10 00479 g004
Figure 5. Relationship between the average annual cold water for human consumption and the number of beds in a hospital.
Energies 10 00479 g005
Figure 6. Relationship between the average annual domestic hot water consumption and number of beds in a hospital.
Energies 10 00479 g006
Figure 7. Average of hourly consumption of cold water for human consumption in the hospitals of the sample.
Energies 10 00479 g007

