
Effects of Lean Zones on Steam-Assisted Gravity Drainage Performance


1
Department of Chemical and Petroleum Engineering, University of Calgary, Calgary, AB T2N 1N4, Canada
2
MOE Key Laboratory of Petroleum Engineering, China University of Petroleum, Beijing 102249, China
*
Author to whom correspondence should be addressed.
Energies 2017, 10(4), 471; https://doi.org/10.3390/en10040471
Submission received: 8 February 2017
/
Revised: 21 March 2017
/
Accepted: 29 March 2017
/
Published: 3 April 2017
(This article belongs to the Section L: Energy Sources)
Abstract
:A thorough understanding of the effects of lean zones and the improvement of steam-assisted gravity drainage (SAGD) operations with such heterogeneities is critically important for reducing the disadvantages of lean zones. The numerical model shows: (1) SAGD is most influenced by the single-layer lean zone with the above-injector (AI) location; with the decrease of interval distance and increase of thickness and water saturation in lean zones, the detrimental effect of single-layer lean zones on SAGD performance increases; (2) with the increase of period and decrease of connate and initial water saturations in lean zones, the detrimental effect of multiple-layer lean zones on SAGD performance increases; (3) reducing the injection pressure properly improves SAGD performance in leaky oil sands. The field-scale study indicates: (1) well pair 1 is most affected by lean zones in the studied pad due to the widest distribution of lean zones above its injector, and a hybrid cyclic steam stimulation (CSS)/SAGD method is proposed to overcome the practical problem of a low injection pressure in this area; (2) simulation results prove that the hybrid CSS/SAGD method is better than the conventional SAGD method in leaky oil sands.
1. Introduction
As conventional oil and gas resources become limited, the production from unconventional resources has become popular, one of which is the oil sand composed of clay and sand (80–85%), water (5–10%), and bitumen (10–18%) [1]. Northern Alberta in Canada owns the largest oil sands reserve in the world, with 293 billion m3 of initially in-place crude bitumen [2,3]. The oil sands in northern Alberta are located at a depth between 0 and 600 m, with a high viscosity around 2 × 10⁶ cp [1]. Numerous extraction methods have been applied to enhance the recovery of oil sands, one of which is steam-assisted gravity drainage (SAGD) [4,5,6]. The SAGD process (Figure 1) was invented by Dr. Roger Butler around 1969 [7,8]. This process was tested in several phases at the Alberta Oil Sands Technology and Research Authority (AOSTRA) Underground Test Facility, with success [6]. It has been commercially used in most new thermal projects in the Athabasca Oil Sand Deposit since 2001, because it can be operated at a relatively low pressure in reservoirs with a low solution gas content. In this process, two horizontal wells with a vertical distance of 4–6 m are placed in the pay zone [9]. The injection is oriented in the upward direction and production is oriented downwards. After a few months of preheating, steam is injected from the injector, and oil is drained along the wall of the steam chamber to the producer. Benefiting from the heat of the steam, the viscosity of heavy oil markedly decreases and the oil is drained from a horizontal production well.
The SAGD process is sensitive to the heterogeneity of oil sand formation [10,11,12,13,14,15,16,17,18]. The shale layer limits the growth of the steam chamber and increases the steam-oil ratio (SOR) [10,11,12]. A gas cap and top water greatly increase the steam injection once the steam chamber penetrates into the top zone, which leads to a high SOR [13,14,15]. The lean zone behaves as a thief zone during SAGD production, which increases the SOR and decreases oil production [19,20,21,22,23,24]. Published studies on the role of lean zones in the SAGD process remain limited.
Lean zones have been reported by Long Lake and Firebag oil sands projects in northern Alberta [24], which have substantial effects on the growth of the steam chamber, as heat escapes into the thief zones instead of staying inside the chamber and heating the heavy oil. This effect varies with the change in the distribution and size of these zones. Nasr et al. [13] used a high-temperature/high-pressure experimental facility to inject steam and observe the oil rate and chamber growth in the presence of top water or a gas cap. Their data revealed the existence of overlaying thief zones. Heat loss is greater if the zone is saturated with water rather than gas, which is attributed to the difference in thermal conductivity. This value for water is much larger than that of gas. Doan et al. [25] observed that water sand hampers the SAGD process. The existence of the top water layer worsens the scenario compared with the bottom water layer. An increased thickness of the top water layer likewise causes problems. Fairbridge et al. [26] employed the nodal and channel models to simulate the behaviour of intra-formational zones with high water saturation during SAGD production. They concluded that the intermediate water zones impair the efficiency of an oil production process. SAGD is less effective in oil sands reservoirs with lean zones because these zones increase the steam–oil ratio and reduce the amount of oil recovered [19,20,21,22,23,24].
Cyclic steam stimulation (CSS) was first used in Venezuela in 1959. Since then, this method has been applied in many oil fields across the world, such as in the San Joaquin Valley in the United States [27], Cold Lake in Canada [28], Lake Maracaibo in Venezuela [29], and Liaohe in China [30]. Supported by decades of development, the average recovery factor of 15% exhibited by the conventional CSS producers in the 1980s, has increased to approximately 40% in recent years. The method is attractive because it provides a quick payout at a relatively high success rate as a result of the cumulative field-development experience. However, it is still uncompetitive in terms of the ultimate recovery factor compared with that of other steam drive methods, such as SAGD (60%–70% original oil in place (OOIP)) [10]. Thus, the CSS and SAGD methods are combined. The first way in which this can be achieved is by the construction of an offset well between neighbouring well pairs of SAGD [31]. The second method includes the simultaneous use of CSS wells as injectors and producers [32]. Few studies have simulated reservoirs on a field-scale to investigate the hybrid CSS/SAGD method. Therefore, this paper combines and studies SAGD and CSS to enhance the recovery of bitumen from oil sands reservoirs with lean zones. The advantages of both SAGD and CSS can thus be maximized for reservoir recovery.
In this research, a numerical model is developed to investigate the effects of vertical distribution, horizontal spacing, and size, as well as the spatial relationship with the SAGD horizontal wells of lean zones, on SAGD production. Furthermore, on the basis of an in-depth understanding of the effects of lean zones from numerical approaches, field-scale simulations from a well-defined 3D geostatistical model are performed for the Long Lake Pilot Pad. A hybrid CSS/SAGD process is proposed and studied for the Long Lake reservoir, to decrease the effect of lean zones.
2. Numerical Model
A large amount of mobile water exists in lean zones, and analytical studies (see Supplementary Material) on the effects of mobile water on SAGD performance indicate: (1) with the increase of water saturation, the water velocity beyond the steam chamber increases, which further results in the increase of convective heat flux; this trend is significant in the early stage and tends to be steady in the late stage. The effect of mobile water on conductive heat flux is minimal, and thus, the total heat flux needed for production increases with the increase of water saturation; (2) convective heat flux dominates in the early stage and conductive heat flux dominates in the late stage, which is due to the decrease of water velocity with time; this implies that the lean zones mainly affect the thermal recovery in the early stage. In order to further study the properties of lean zones (location, width, thickness, and interval distance), a numerical model is needed. However, for the stochastic numerical model, it is difficult to employ control variate methods to evaluate the properties of the lean zone due to its random location, width, thickness, and interval distance. Therefore, we adopt a scheme (Figure 1) which is similar to the research methods of Shin and Choe [12] on the study of shale barrier effects during SAGD production. The role of lean zones in the stochastic geological model is further discussed in the third section.
We employ the basic reservoir parameters (Table 1) in the Long Lake to study lean zones in heterogeneous media. Long Lake is an oil sand field with lean zones. The existence of such zones has significantly affected SOR and oil production, which further increases operation costs and decreases corresponding benefits. Accordingly, the parameters in the Long Lake are appropriate for this study.
2.1. Methodology
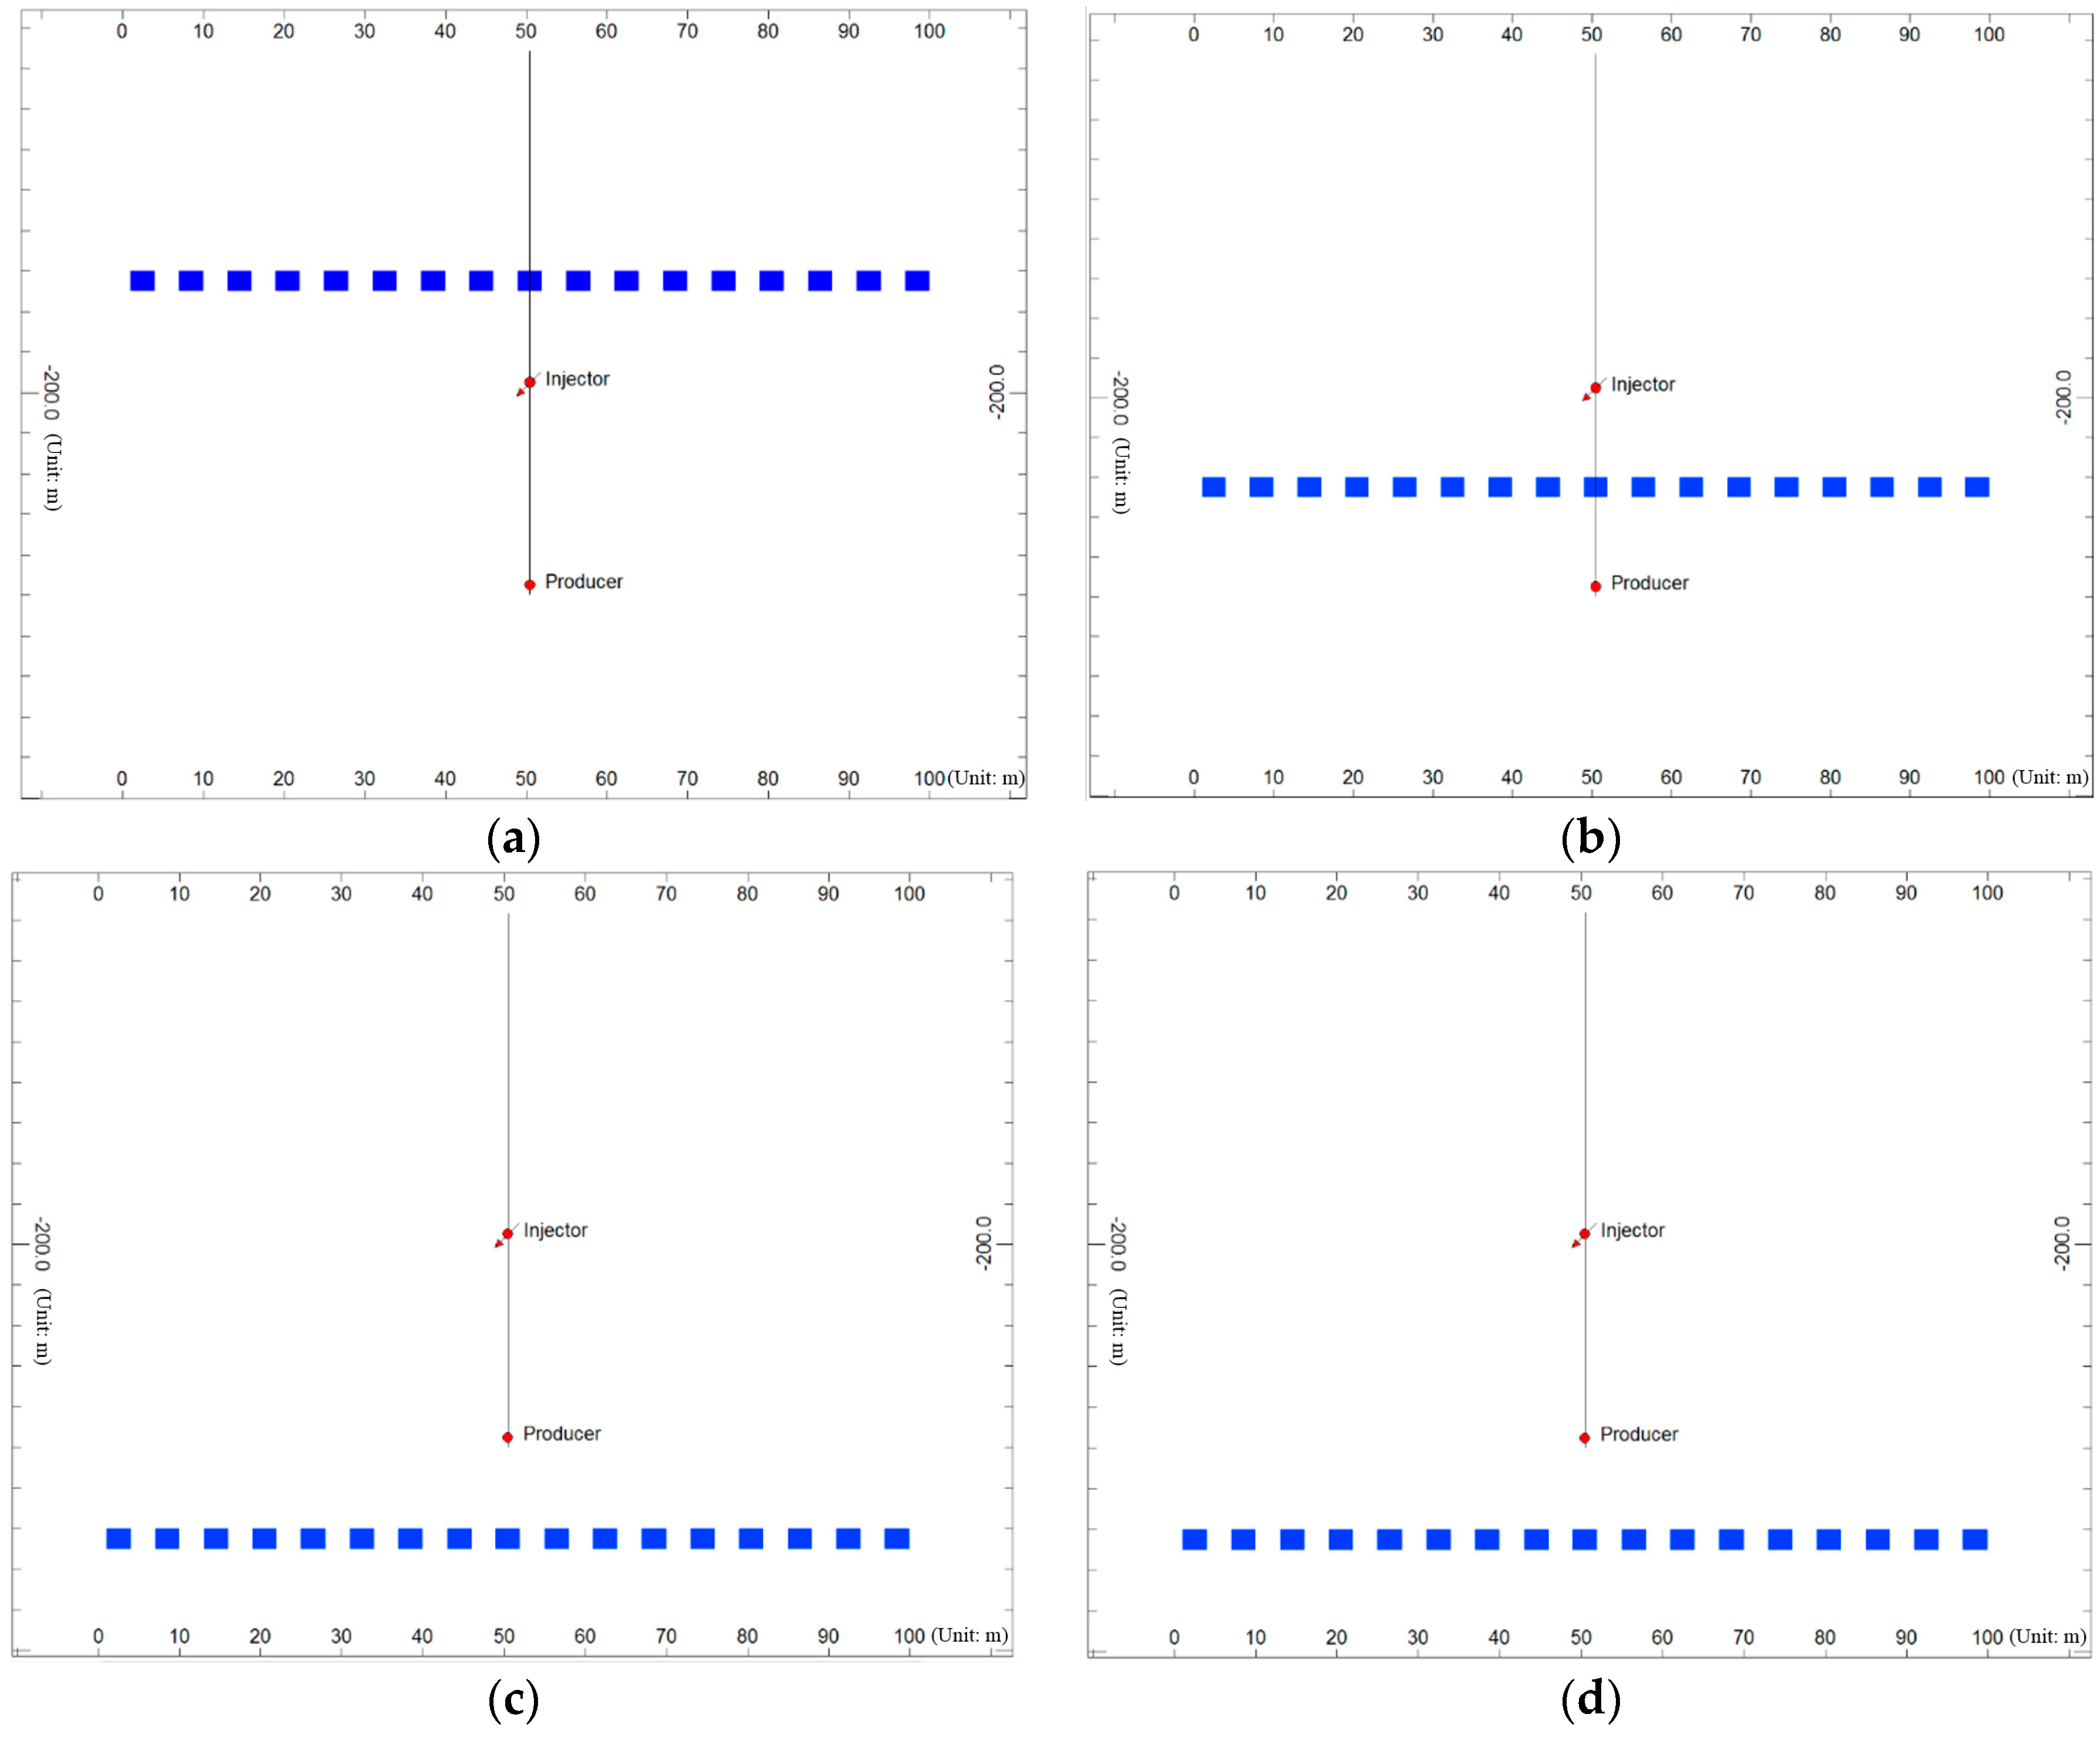
The model is built in Computer Modelling Group (CMG)-Advanced Process & Thermal Reservoir Simulator (STARS) has 8080 grid blocks, with 101, 1, and 80 blocks in the i, j, and k directions, respectively. The corresponding sizes of the i, j, and k blocks are 1, 50, and 0.5 m. The preheating period is three months. The well constraint for the injector is the well bottom-hole pressure (BHP) of 2500 kPa, with an injection temperature of 223.8 °C and a steam quality of 0.8; the well constraint for the producer is a steam trap of 10 °C. For the base case, the ultimate steam chamber volume (SCV) increases to 13,124.69 m3, and the cumulative SOR is 3 m3/m3. There is only one single-layer lean zone in the model. The study cases focus on the size, thickness, interval distance, and location. We classify the location as above the injector (AI) (Figure 2a), between the injector and producer (BIP) (Figure 2b), and below the producer (BP) (Figure 2c) [12]. We perform a sensitivity analysis of size, thickness, and interval distance using these three locations. We change the size to 3, 7, and 11 m; the interval distance to 3, 8, and 13 m; and the thickness to 0.5, 1.5, and 2.5 m. Thus, the sampling method is uniform. For the model of multiple lean-zone layers, the connate water saturation () is 0.25, and the water saturation of the lean zones () is 0.7. We study and in the model of multiple lean-zone layers. We also evaluate SCV and SOR.
Lean zones sometimes appear within multiple layers in reality. According to log analyses and core experiments, these zones scatter randomly throughout the reservoir. A triangular, periodic function that depends on layer depth, connate water saturation, an appearance period of lean zones, and water saturation for these zones, is used to simulate their complicated distribution. The water saturation values for different layers () in the model with multiple-layer lean zones are given as
where is each layer’s water saturation in the model with multiple-layer lean zones, dimensionless; ABS is the absolute value function; ROUNDDOWN is the rounding function; SIN is the sine function; COS is the cosine function; is the layer number (for the first layer at the top, ); is the appearance period of the lean zones; is the water saturation of these zones; and Swc is the connate water saturation. When the appearance period is odd, Equation (1a) is used to assign the water saturation to each layer; otherwise, Equation (1b) is used.
In the case of multiple lean-zone layers, the effect of these lean zones on SAGD performance can be further analysed, as in Figure 2d.
2.2. Results and Discussion
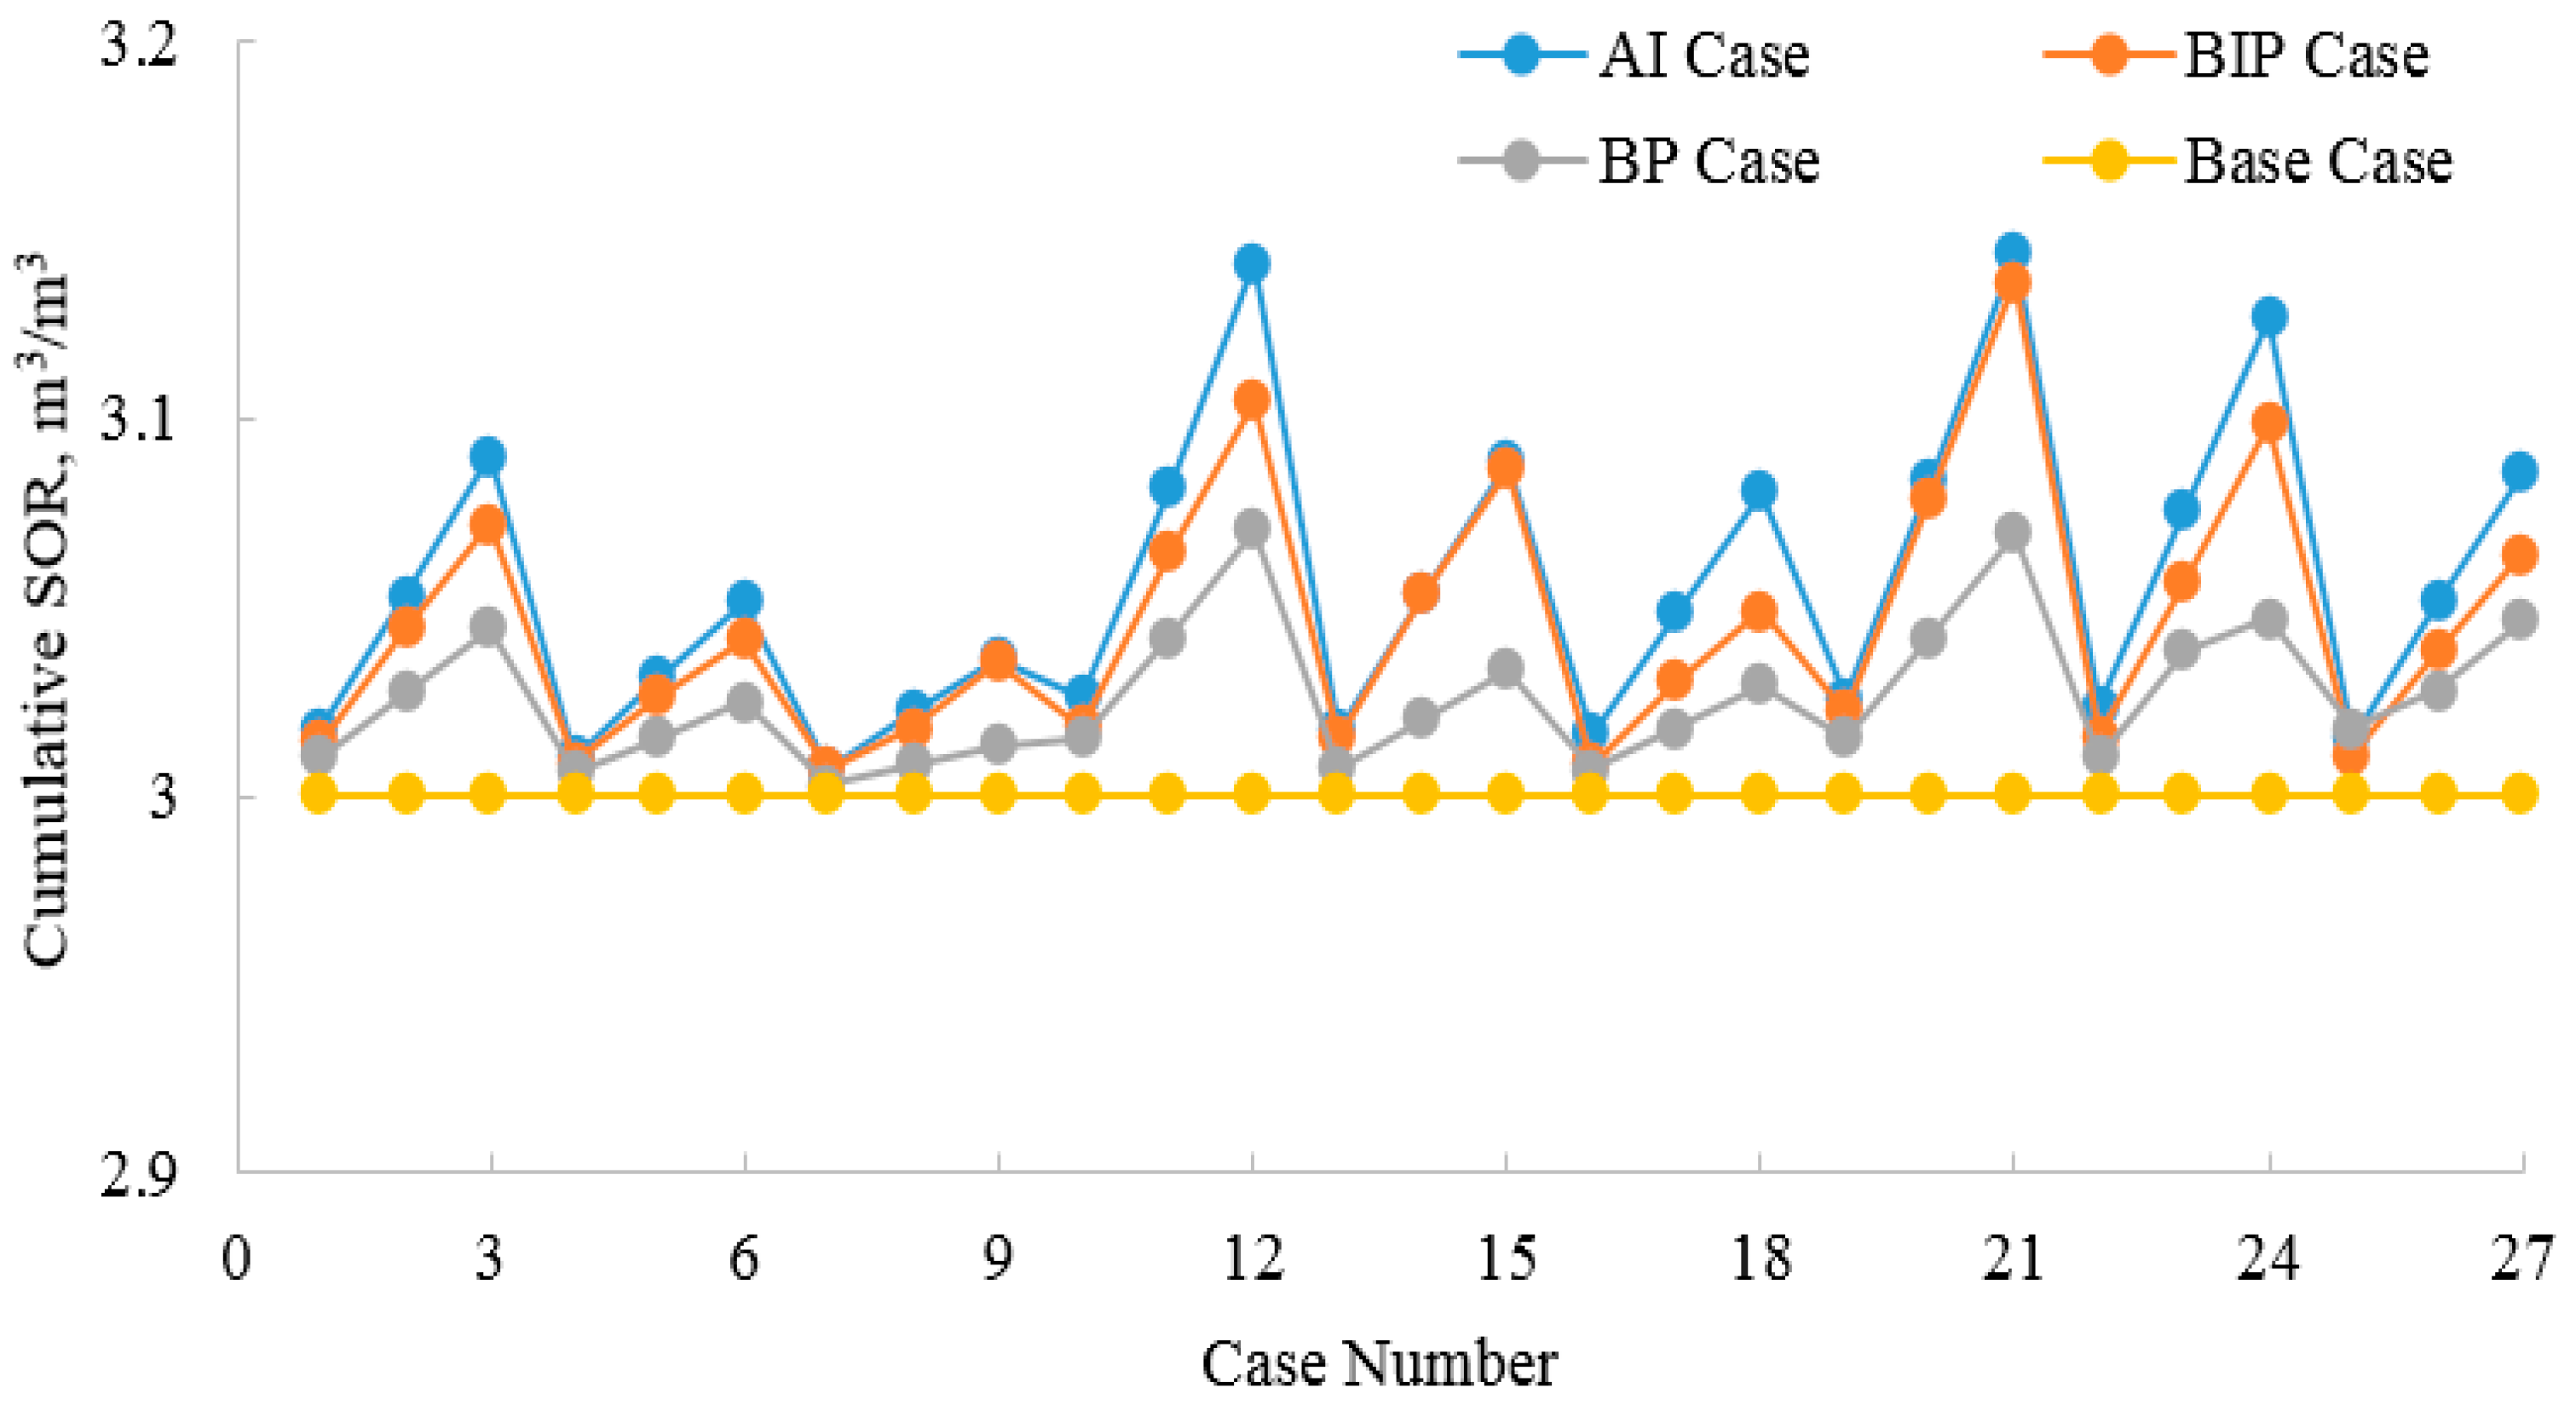
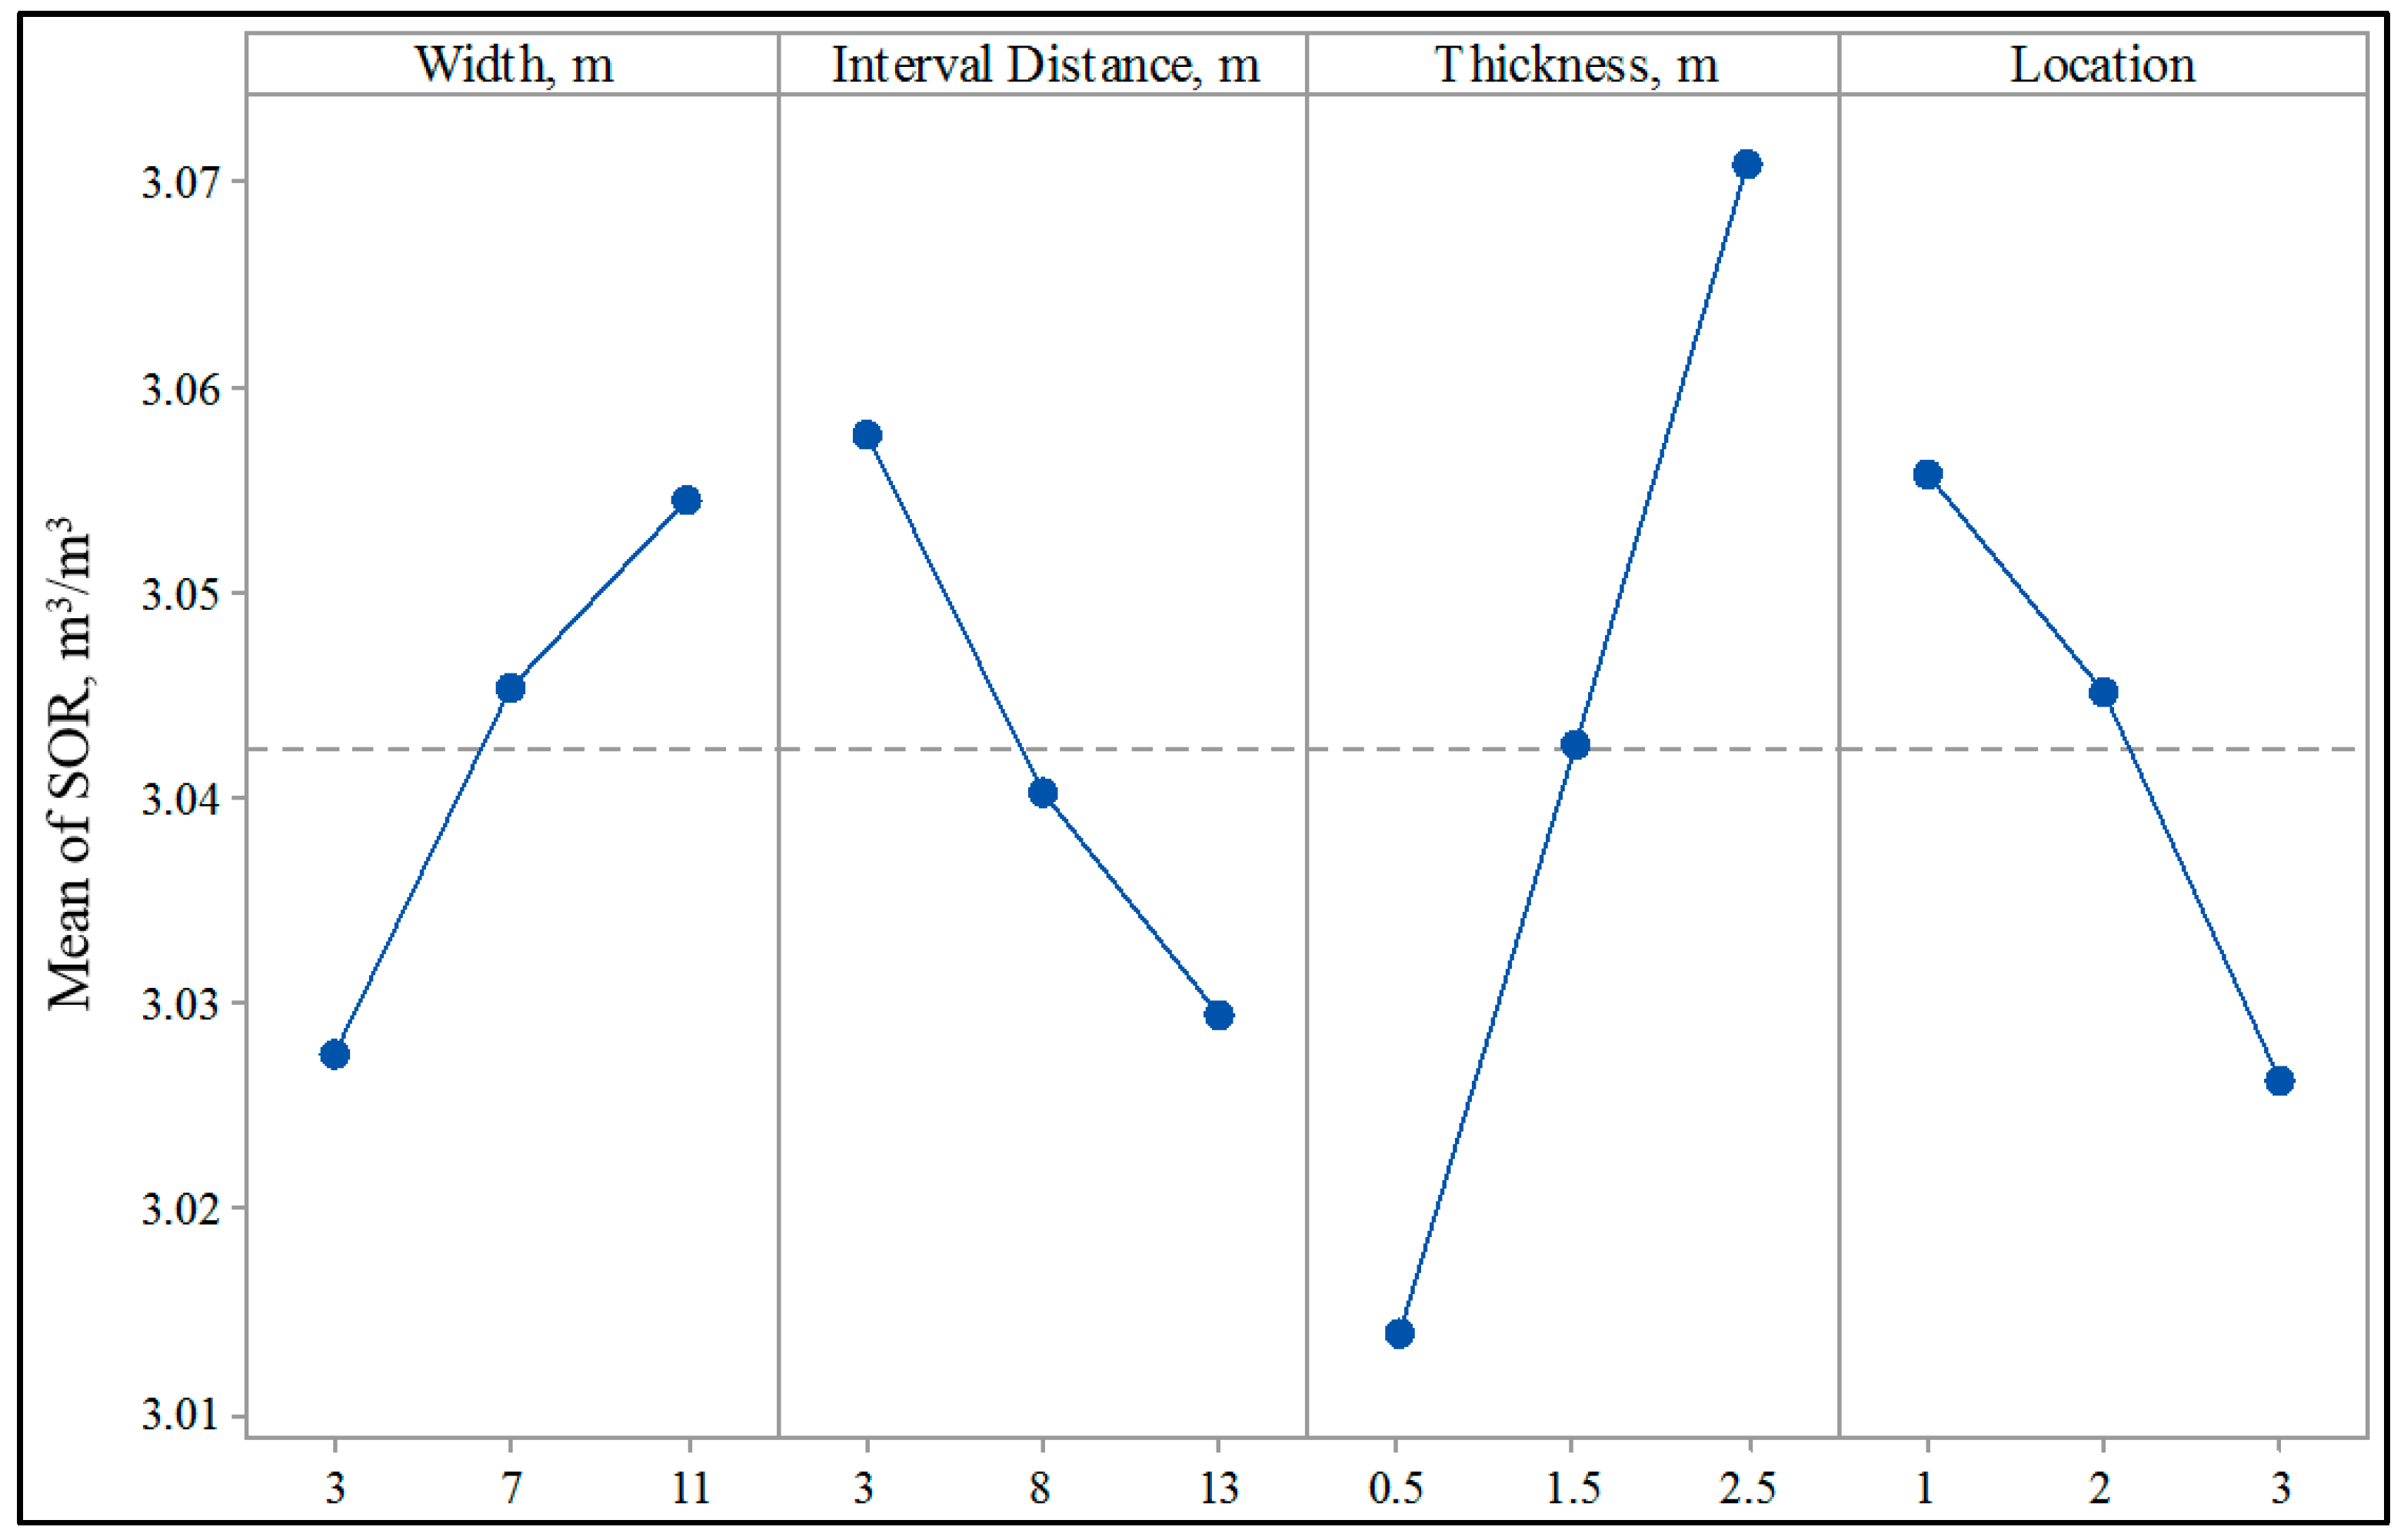
We combine all cases in Figure 3; the SOR of the AI case is the largest, followed by that of the BIP case. The SOR of BP is the smallest. Therefore, the SAGD case with the single-layer lean zone below the producer displays the minimum effect of the lean zone. Under the same steam chamber volume, a more considerable part of the lean zone occurs in the steam chamber for the AI case than for the BP case. Consequently, the lean zone significantly affects SAGD production in the AI case. The largest points in Figure 3 are those (Case No. 21) with a thickness of 2.5 m. In certain locations of the lean zone, the thickness is the dominant parameter for SAGD production with the single lean-zone layer. The main effect analysis in Figure 4 indicates that a larger thickness, larger size, and smaller interval distance lead to a larger SOR. Detailed discussions for each location are provided in the Supplementary Material.
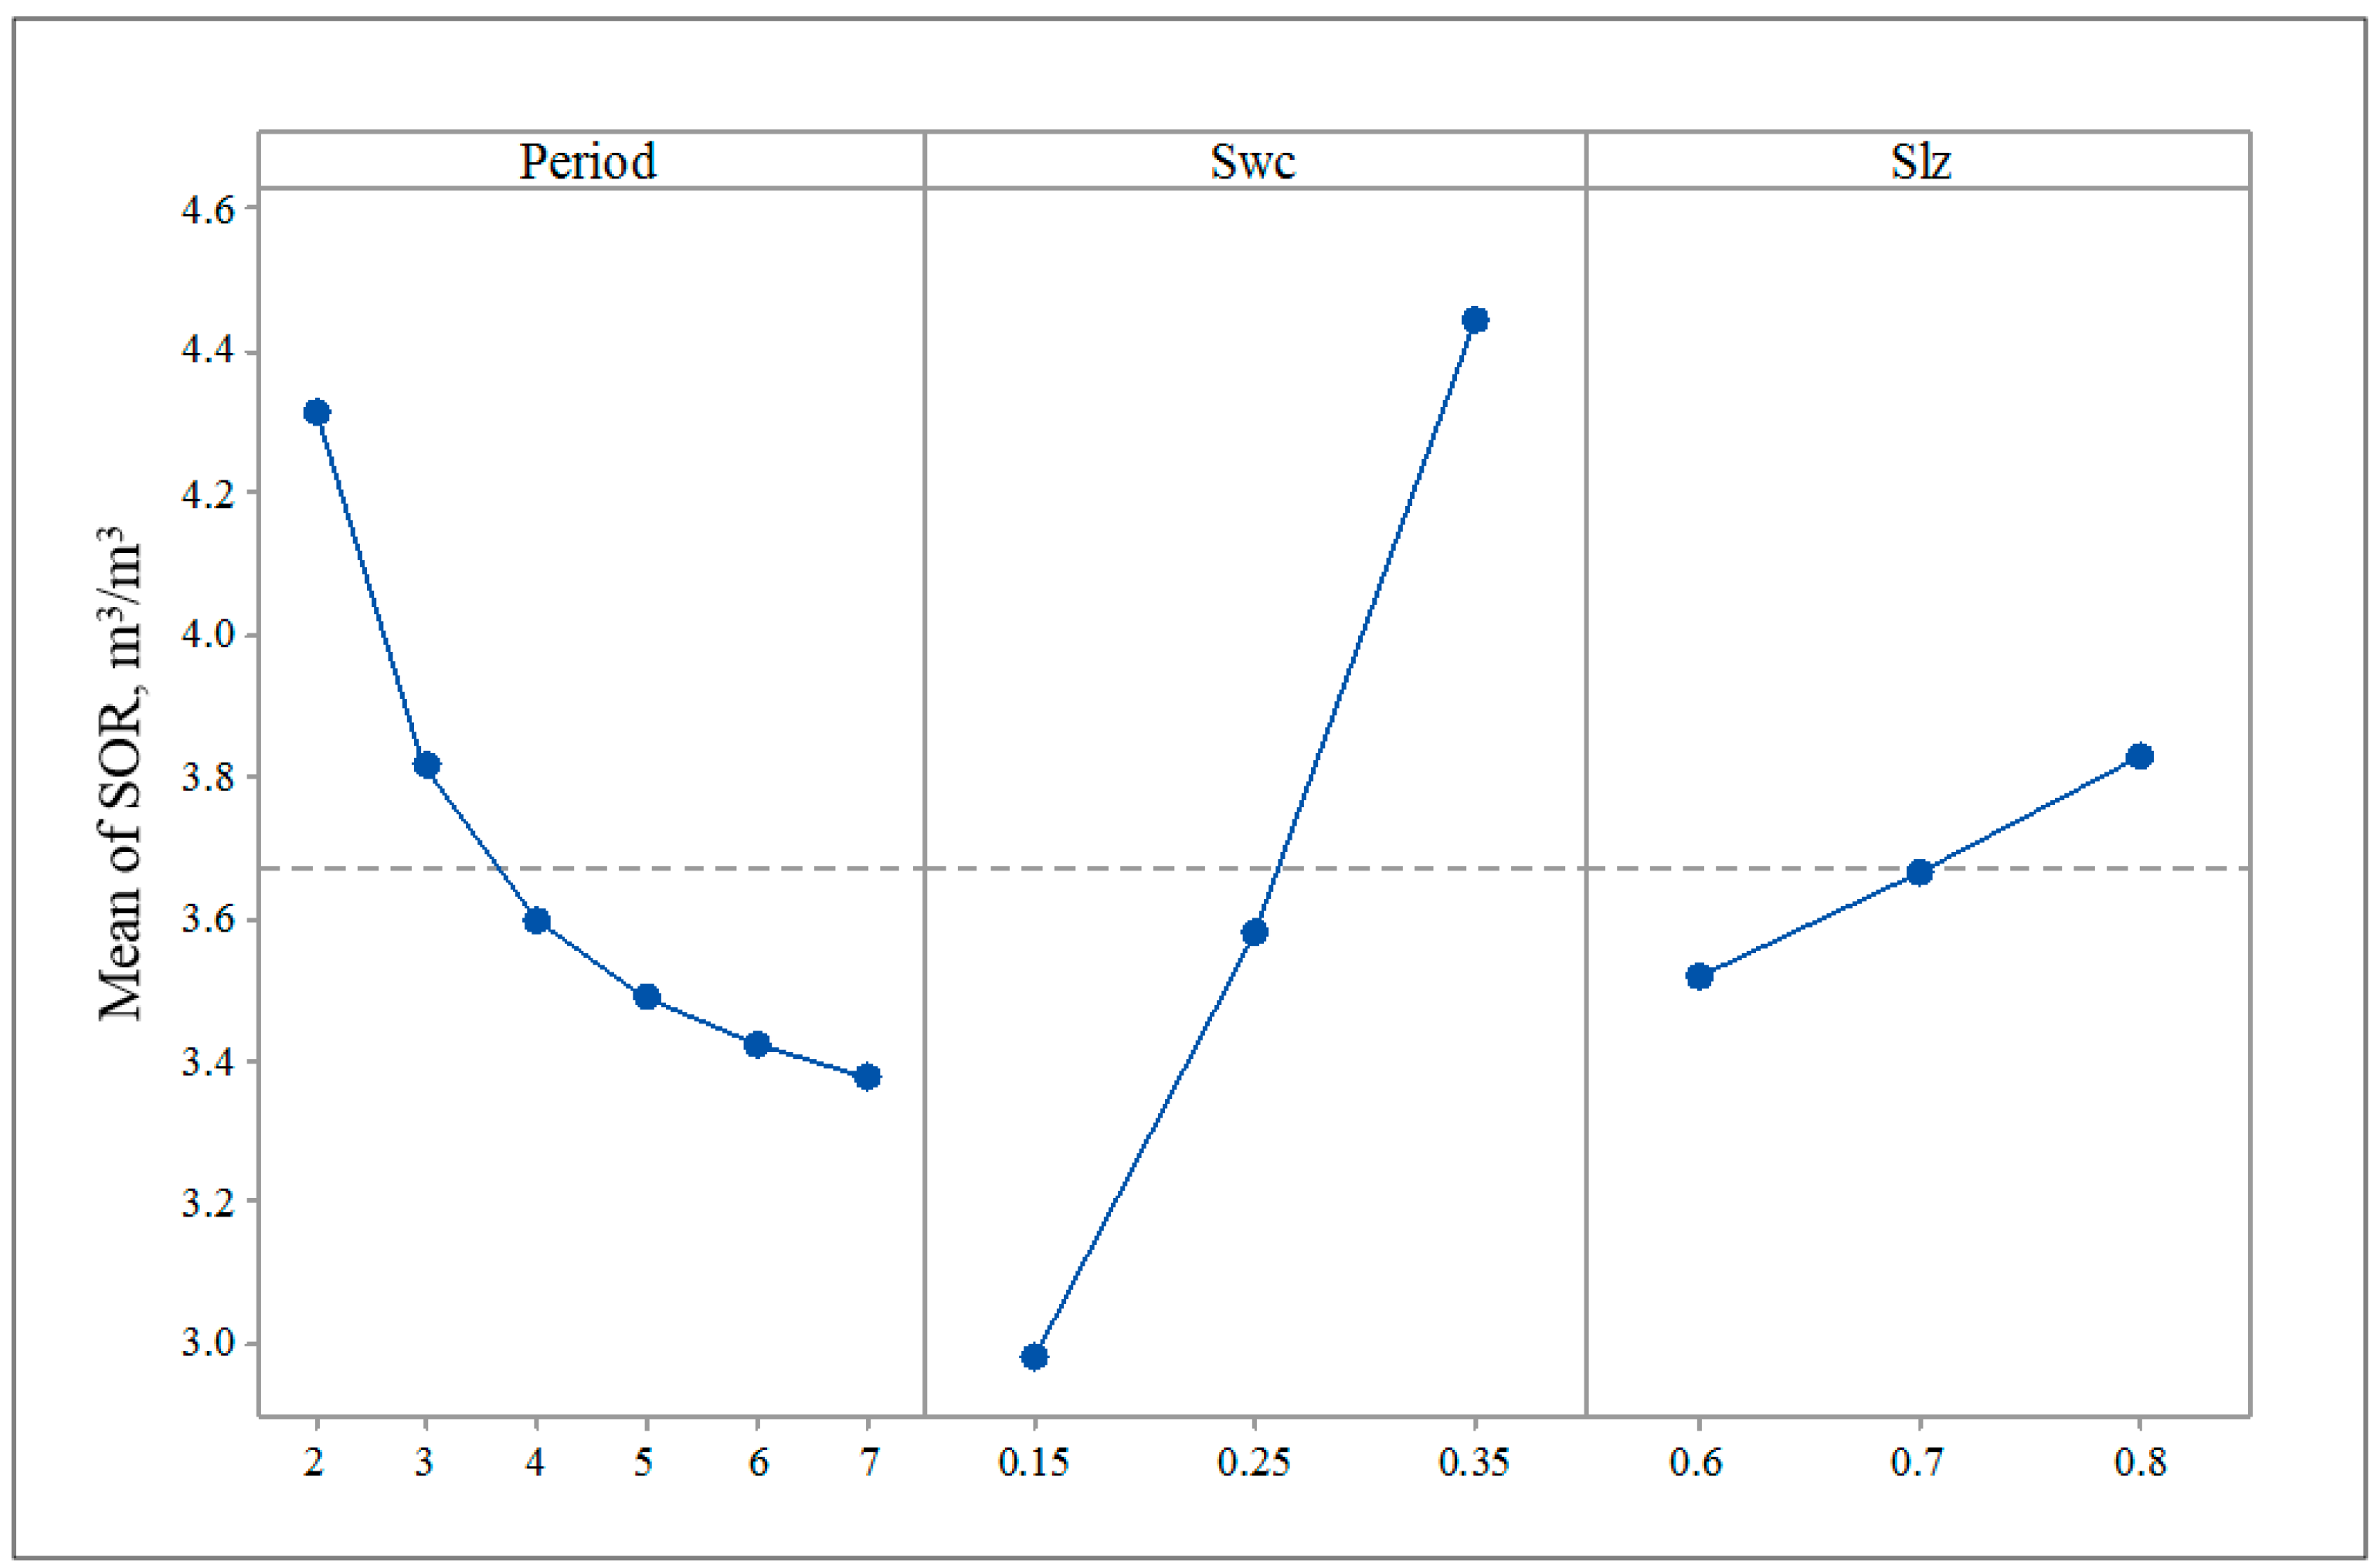
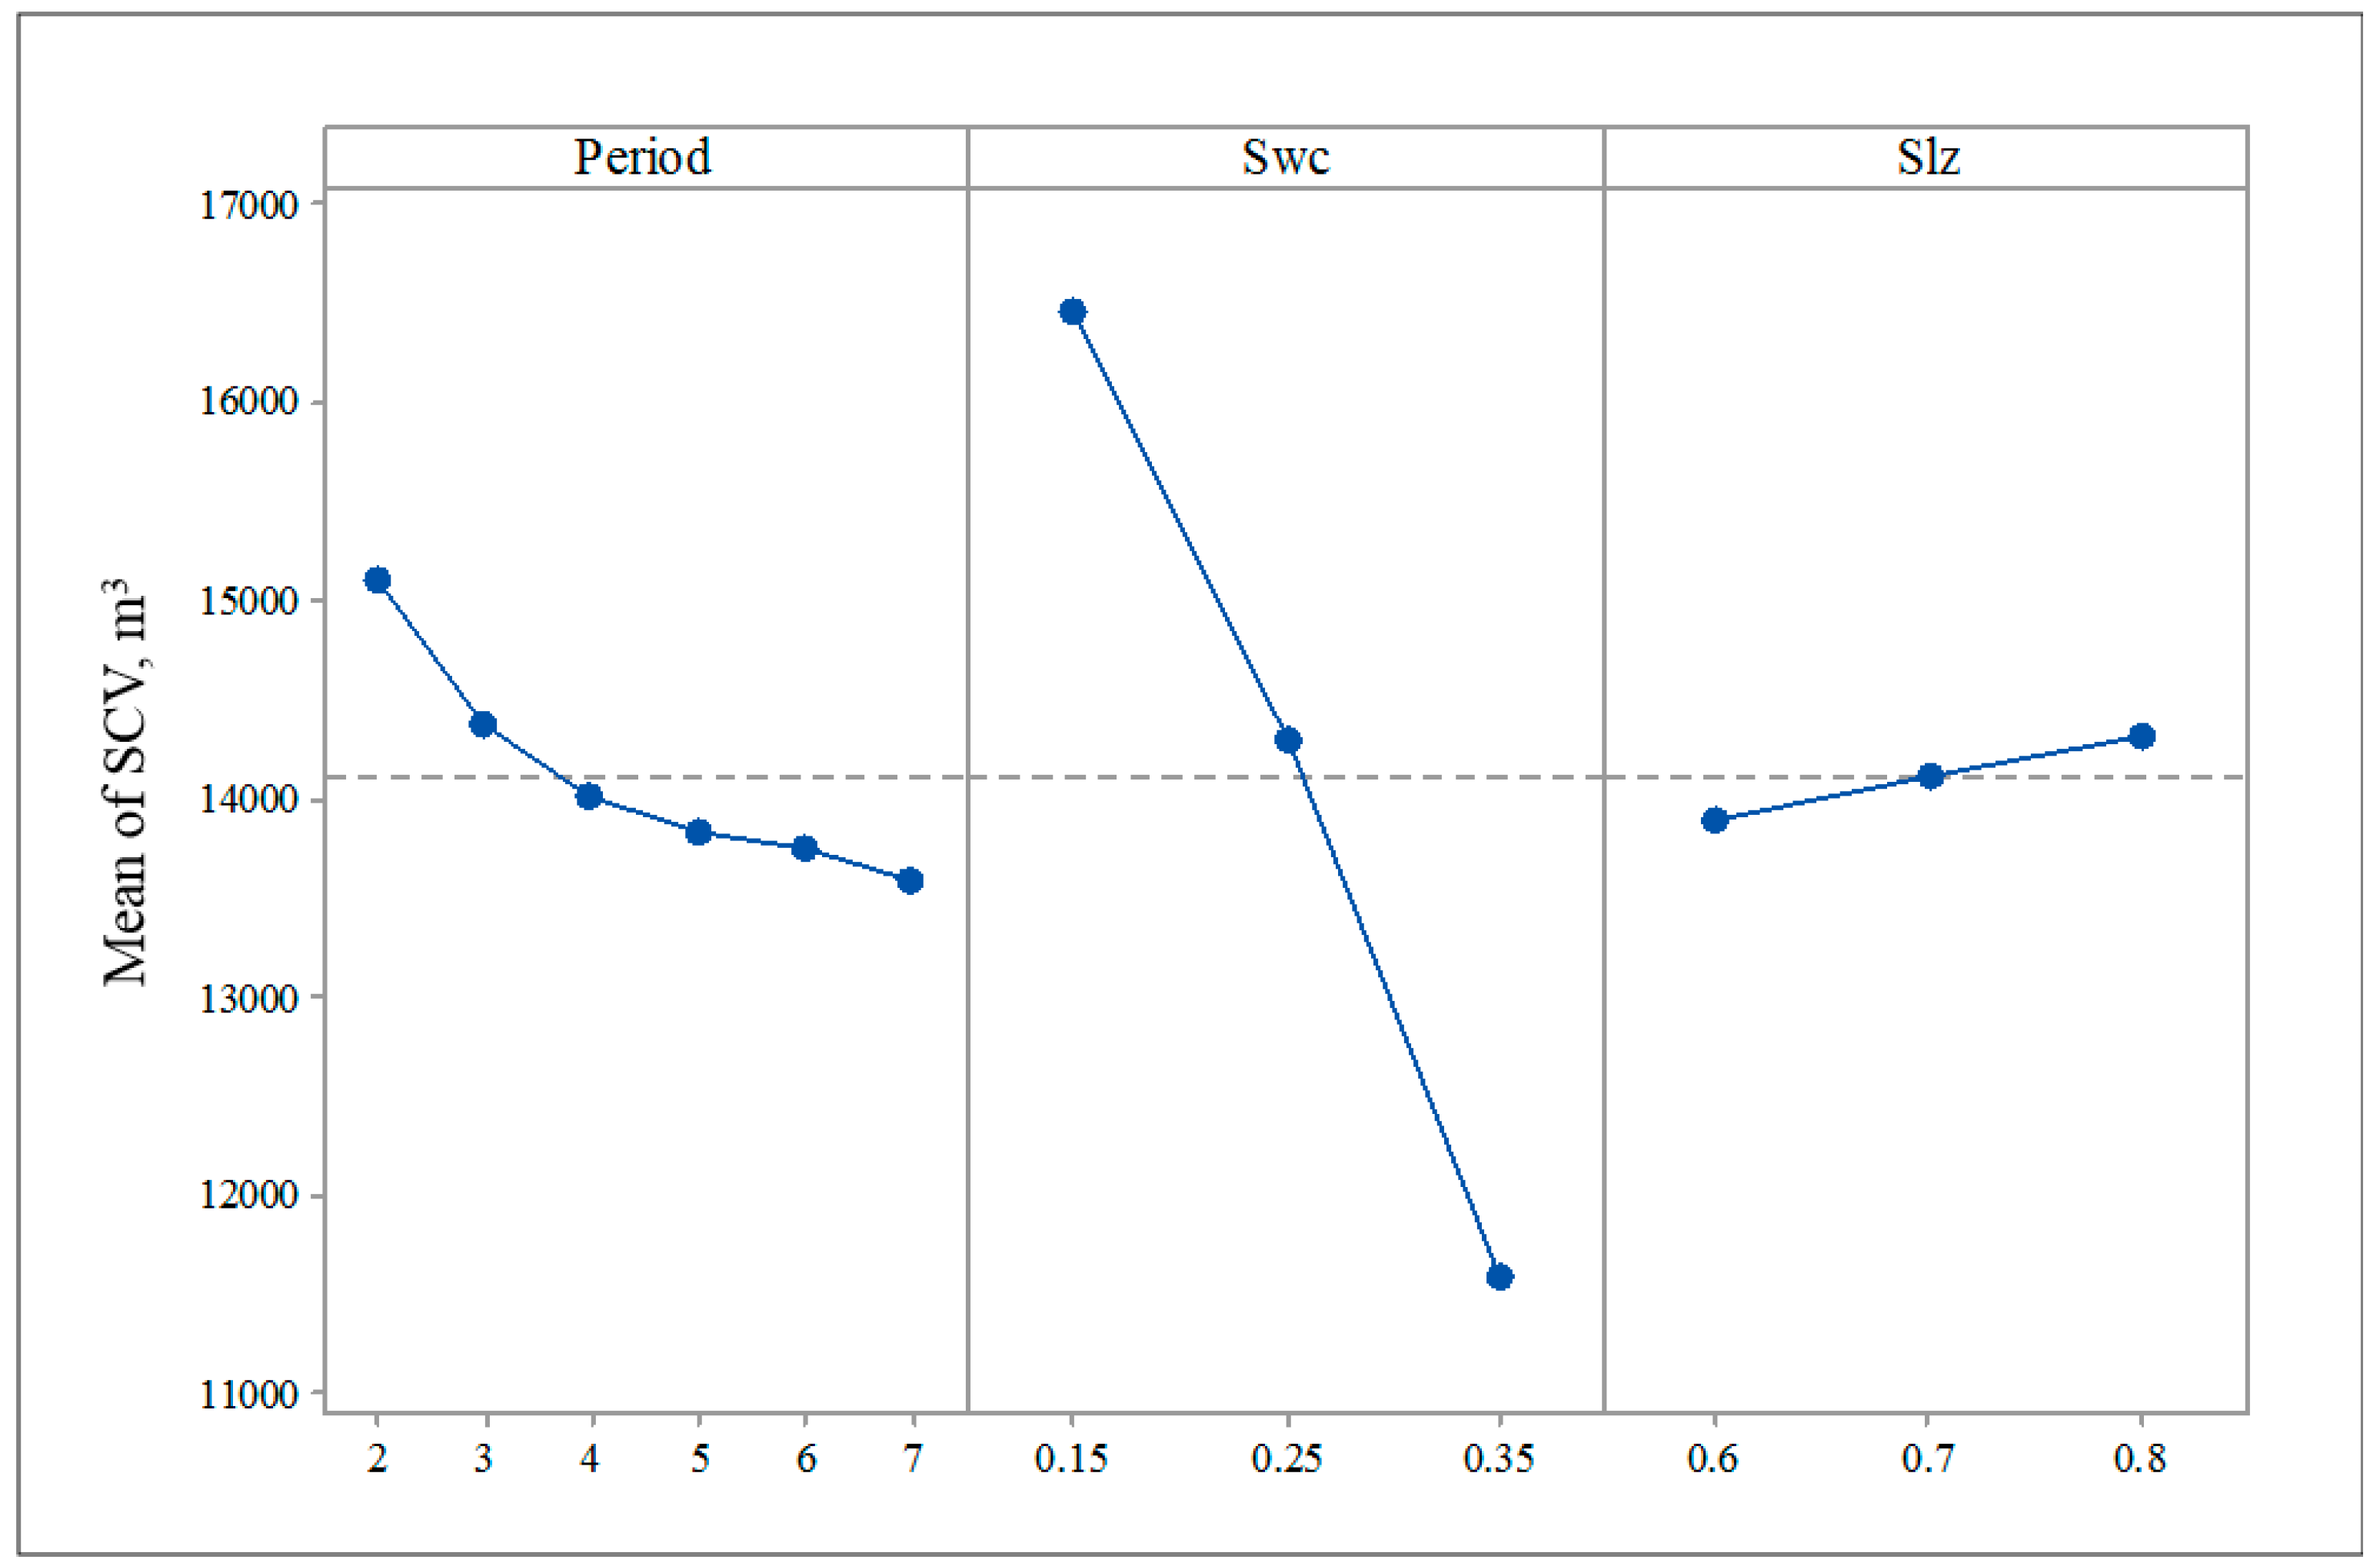
For the case with multiple lean-zone layers, we changed the water saturation of the lean zones to 0.6, 0.7, and 0.8. The connate water saturation varies, with figures of 0.15, 0.25, and 0.35. The period changes with values of 2, 3, 4, 5, 6, and 7. Figure 5 and Figure 6 illustrate that with a small period, low connate water saturation, and high water saturation, we can obtain a high SOR. The connate water saturation dominates among these uncertainties. The trend is the same for SCV, as shown by Figure 7 and Figure 8.
Based on one of the multiple layers cases (, and ), the injection pressure varies from 500 kPa to 3500 kPa, with an increment of 250 kPa. We extend the simulation to 20 years, to study the long-term investment return. Then, the net present value (NPV) is employed as a measurement criterion to ascertain the best injection pressure. NPV is calculated using the following equation:
where the oil price is 105 USD/stb; the discount rate is 4%; the current year is the 20th year; the annual operating cost is 500,000 USD; the number of pairs is one; the operation cost per producer is 100,000 USD; the operation cost per injector is 50,000 USD; the water treatment is 0.28 USD/stb; the water injection cost is 2.43 USD/stb; the cost of the surface facility is 200 MMUSD; the number of wells is two; and the cost of drilling and completion of a horizontal well is 15 MMUSD. Cumulative oil, cumulative water, and cumulative injection water are multiplied by 20, because in reality, the well length is 1000 m, which is 20 times the well length of this model.
NPV = cumulative oil × oil price × (1 − discount rate) − current year × annual operating cost − number of pairs × (operation cost per pair) − cumulative water × water treatment − cumulative injection water × water injection cost − surface facility cost − number of wells × drilling and completion costs
The relationship between the injection pressure and NPV is shown in Figure 9, which indicates that an injection pressure that is too large is not economical. The optimal injection pressure in this case is 1500 kPa.
The numerical discussions show that steam is inclined to escape through the lean zones, causing substantial heat loss. More steam will be lost when a higher pressure is imposed. This result demonstrates that keeping the injection pressure lower than the desirable value when no thief zones are present is a good solution for reducing steam consumption.
3. Field Application
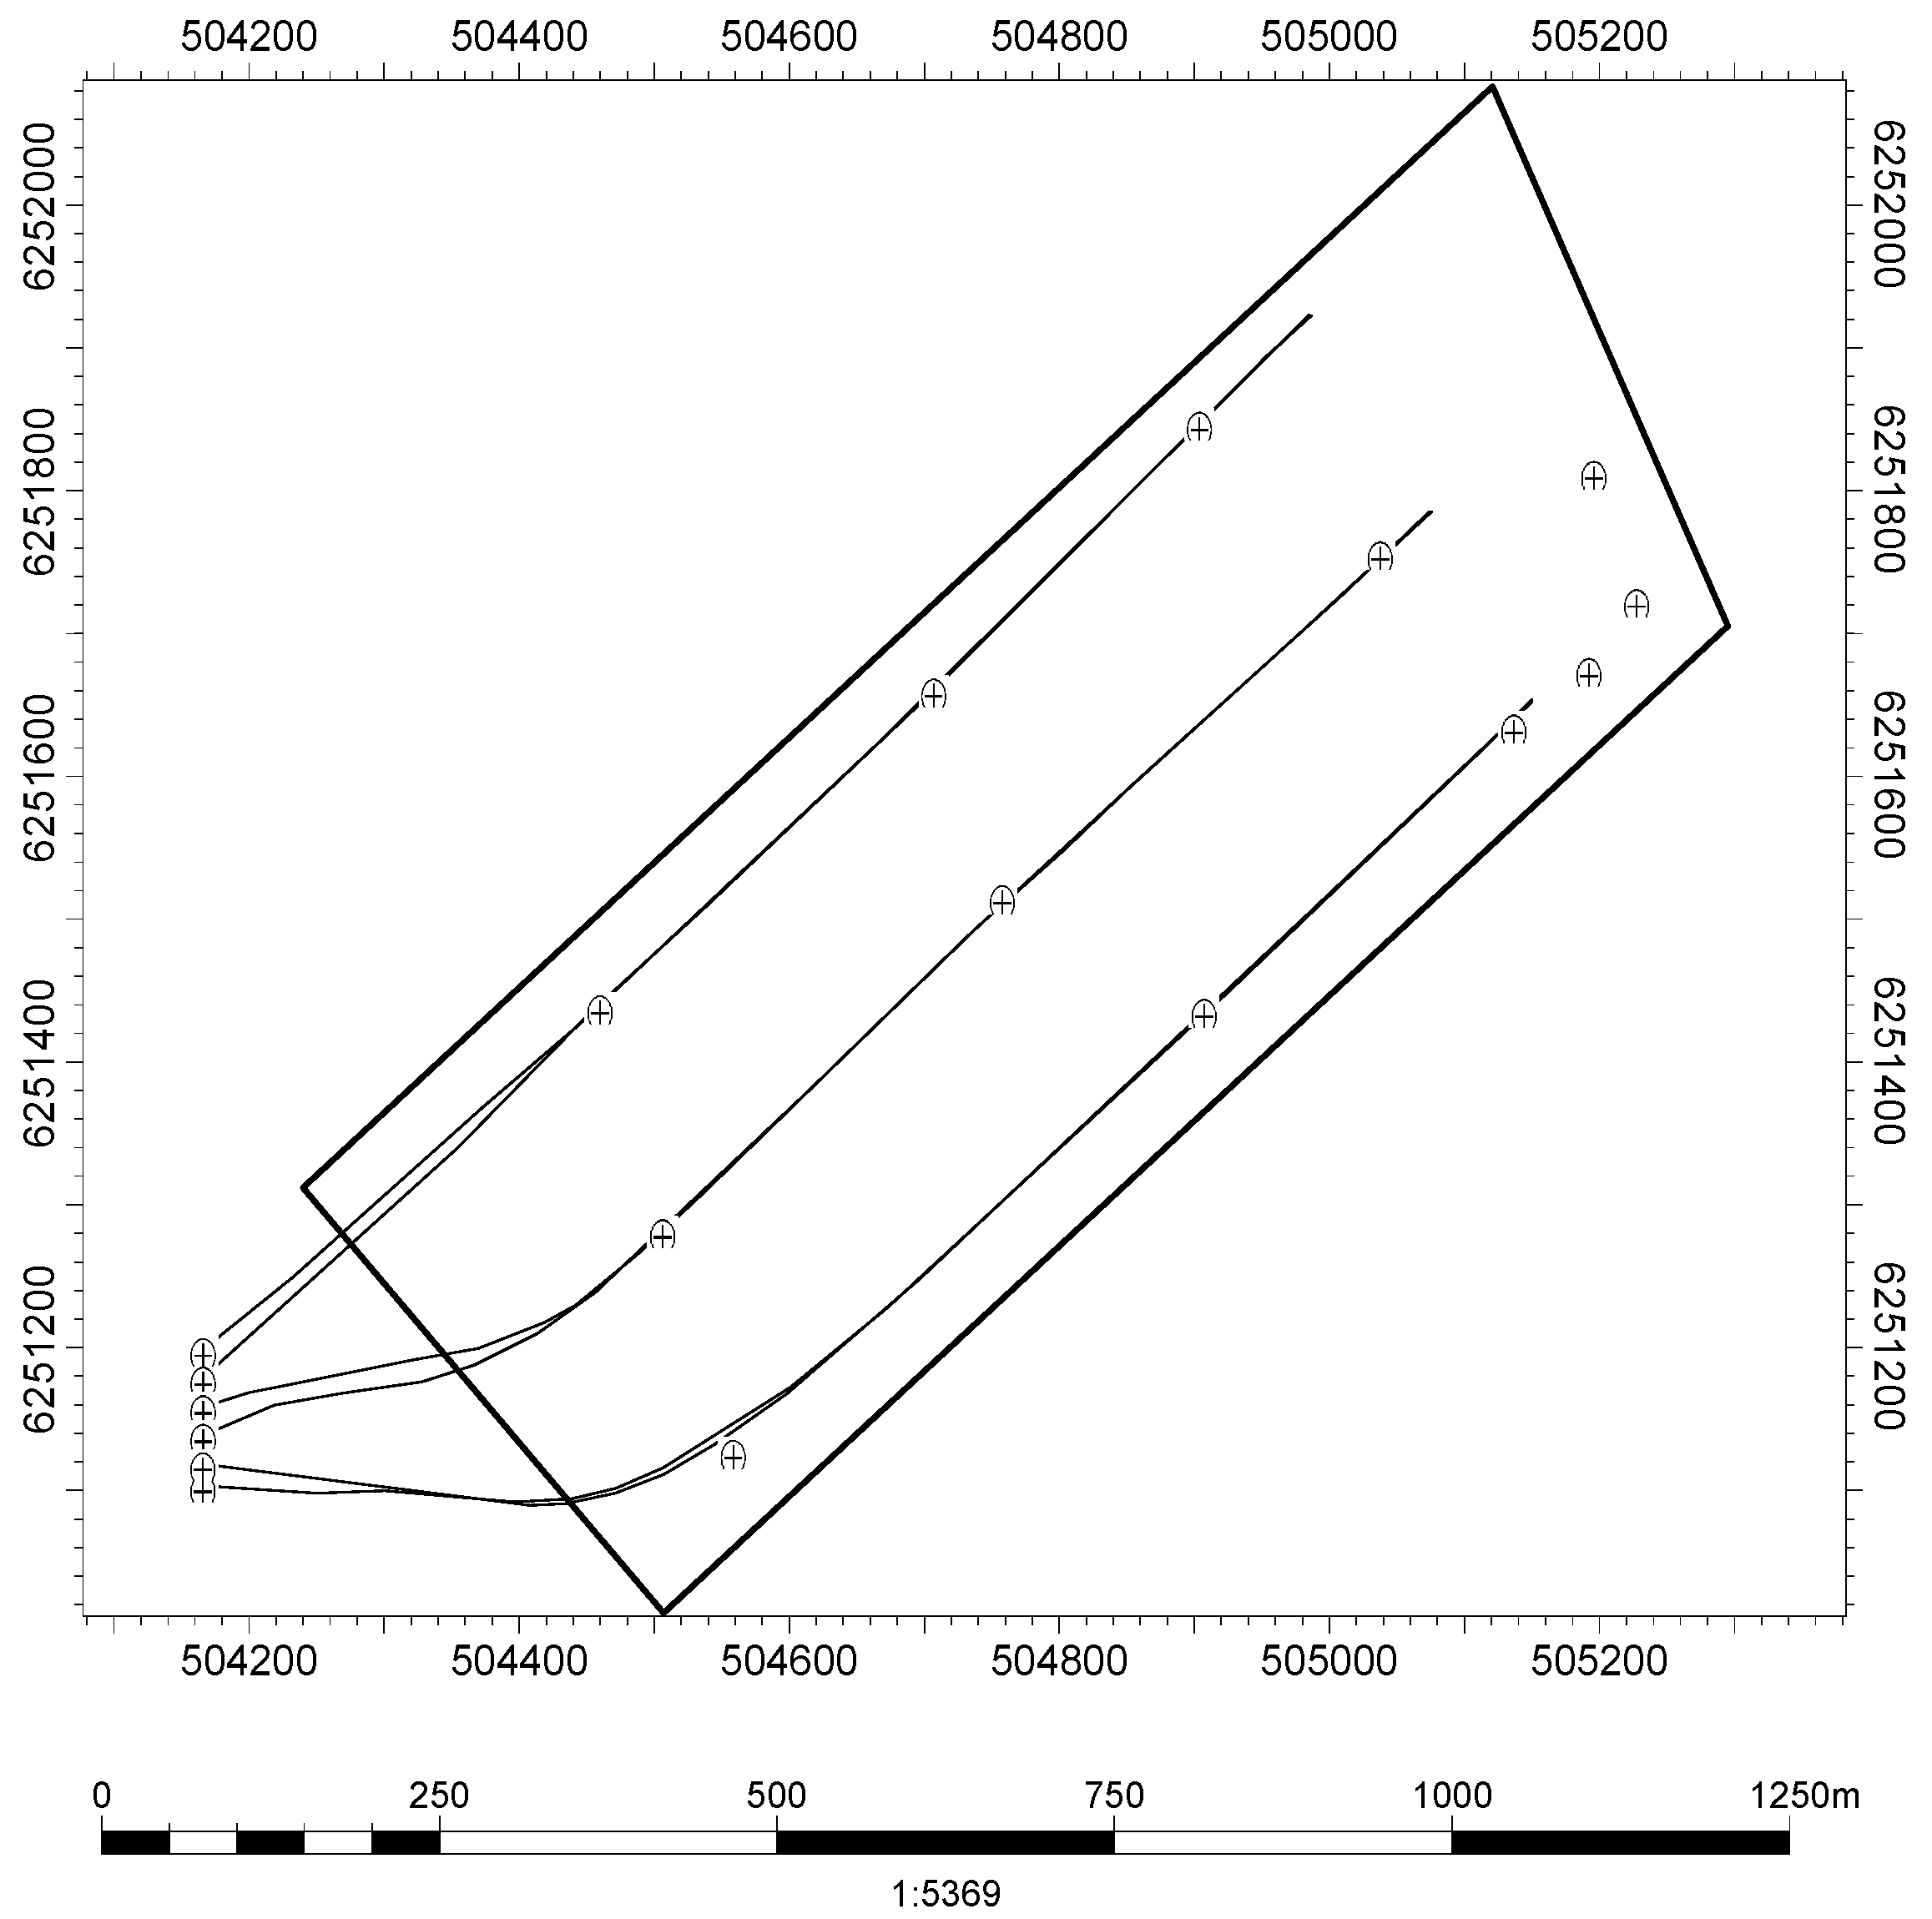
The studied pad, which is a pilot pad, is Pad 1 (Figure 10) in the Nexen’s Long Lake Project. All of the data used are public data obtained from the Long Lake Annual Report and studies presented by the Society of Petroleum Engineers, AccuMap, and Divestco [33,34]. The Long Lake is located in the southeast of Fort McMurray in the Athabasca Oil Sand Region of Alberta, Canada. This project is operated by Nexen, which is wholly owned by China National Offshore Oil Corporation Limited. The Long Lake Phase 1 is the fourth integrated oil-sand project in Canada and the first to combine the SAGD scheme for producing bitumen from the Wabiskaw–McMurray Deposit, with an upgrader that uses proprietary OrCrude™ technology and gasification [34]. The pilot project (Figure 10) with three well pairs, which is the main study area, started production in 2003.
3.1. Methodology
Pad 1 contains three pairs of SAGD wells and 12 observation wells. The geological modelling process [22,23] includes: (1) well log and core analysis: based on the interpretation of lithology, we mainly do the analysis on well logs and data from the core experiment. The correlation between the data from well logs and that from the core experiment is performed; (2) geostatistical analysis: geostatistcal analysis is very important during the geophysical modelling. We mainly analyze the major direction and minor direction, and perform the match for the semi-variogram in this stage; (3) structural and lithological modelling: based on the top McMurray structure and top Beaverhill Lake structure, we construct the structural model. The lithological model is obtained from the average value obtained after 100 realizations using the Sequential Gaussian Simulation (SGS) method; (4) petrophysical modelling: based on the upscaled petrophysical data, we construct the petrophysical model under the lithological constraint. The grid size of this model is 1 m × 1 m × 1 m. The oil formation in Pad 1 is mainly composed of McMurray oil sands, and the lean zones are mainly located in the middle of this formation (Figure 11).
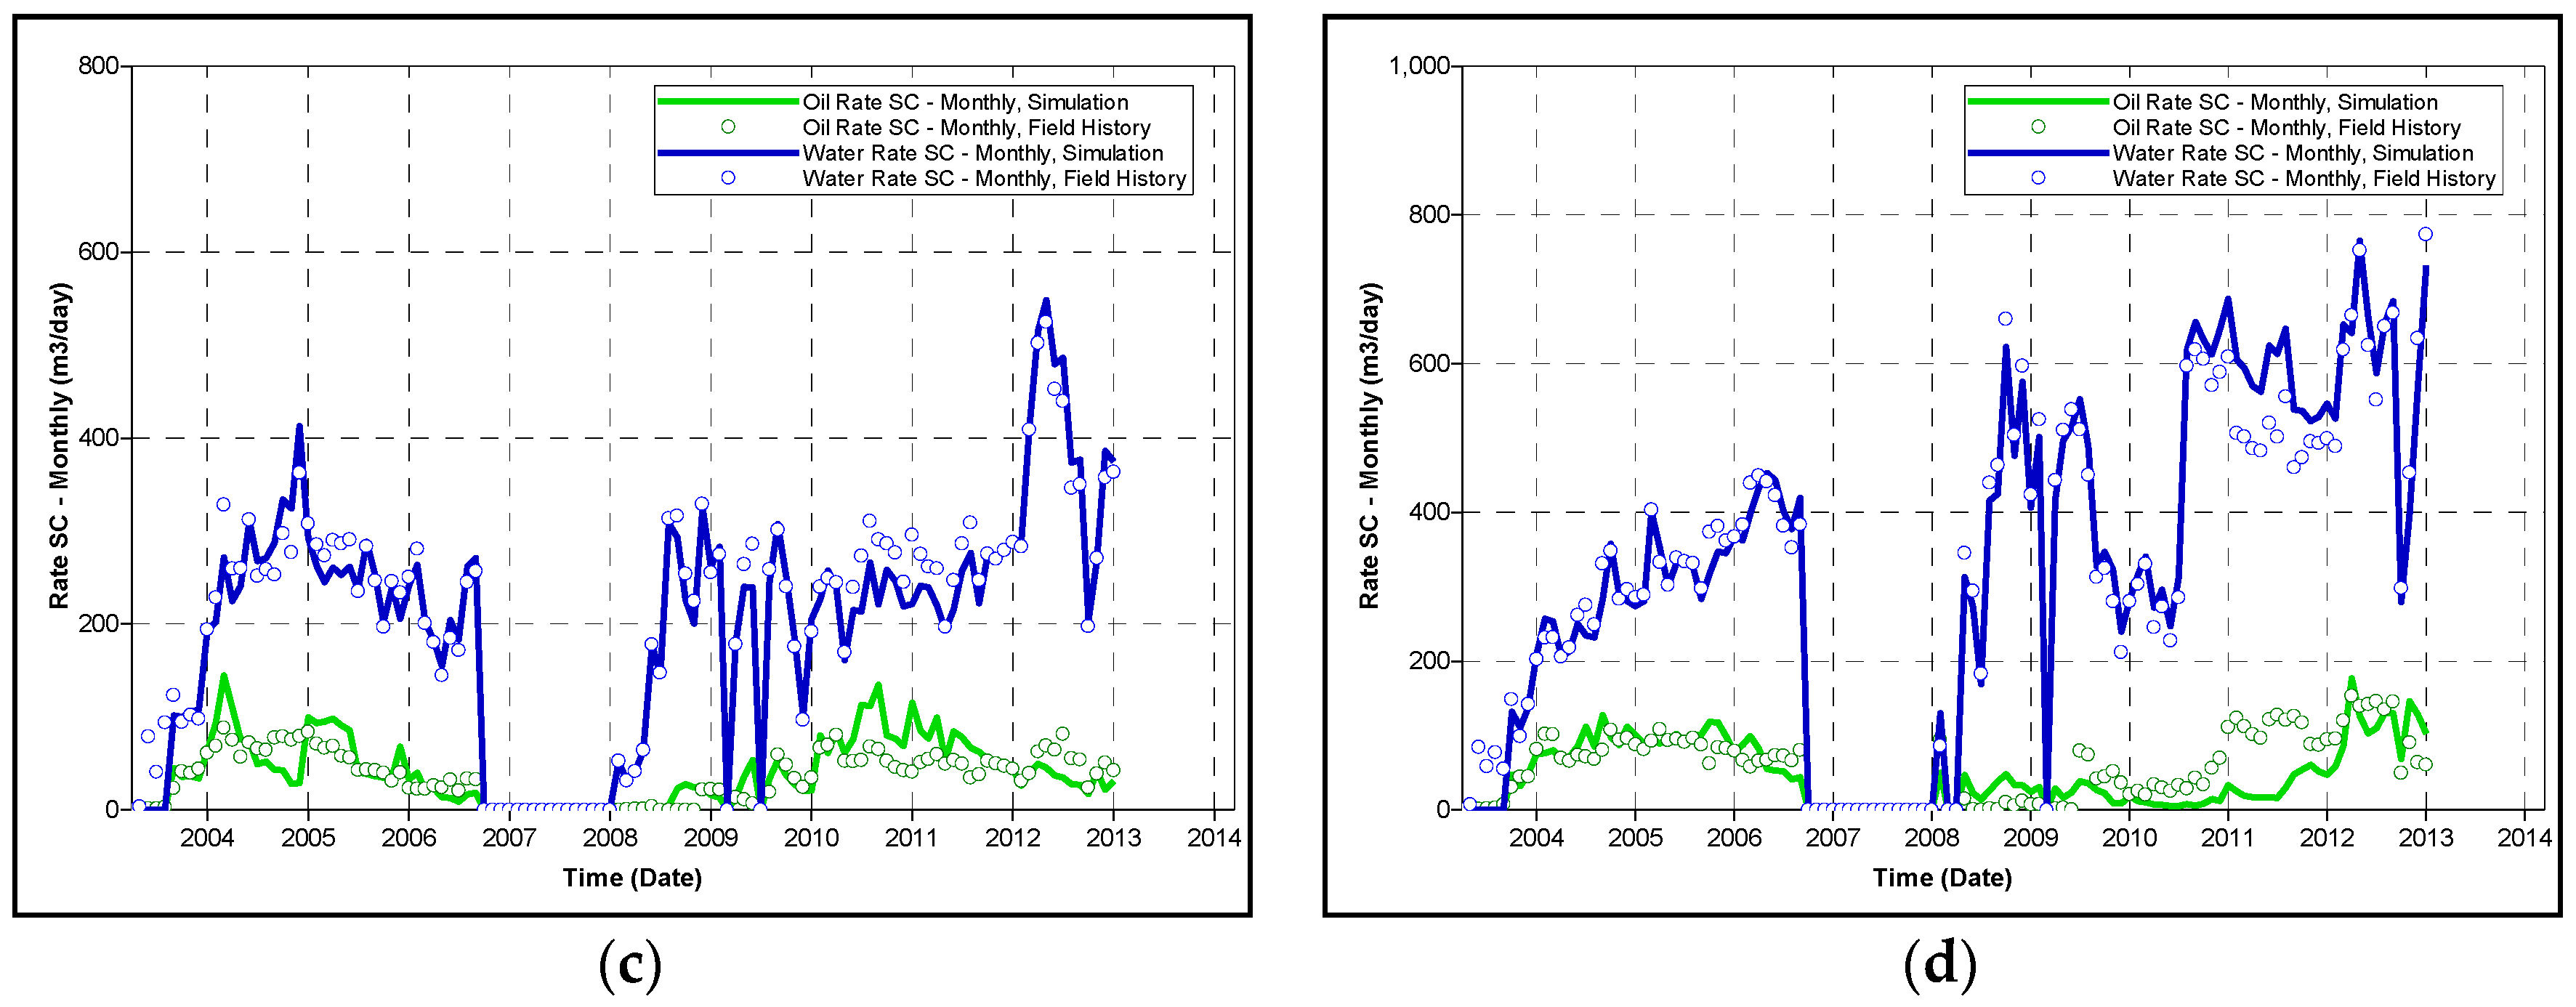
To simulate the reservoir, we scale up the grid size of the geological model to 2 m × 100 m × 1 m. We then divide the model equally among three regions, based on the location of the well pairs. The reservoir simulation model is a three-phase model with bitumen, water, and CH4. The simulation period spanned five years (April 2003 to April 2008). The well constraint for the injector was the steam injection pressure, and the temperature of the injected steam with a steam quality of 0.9 was 240 °C. We obtain the oil and water rates for the entire field and three producers that match historically over 10 years of production (April 2003 to January 2013) (Figure 12).
As with the conventional CSS process, a hybrid CSS/SAGD method is divided into three stages, namely, the huff, soak, and puff phases. Two CSS wells, which are vertical neighbours, act as both the injectors and the producers. During the huff phase, high-pressure steam is injected into these wells to increase the nearby pressure and bitumen mobility. During the soak phase, the wells are shut in, and the heat is transferred to the formation around the wells. During the puff phase, the wells are opened for production, and the oil is driven by both a pressure gradient and gravity.
We simulate the hybrid CSS/SAGD as follows: (1) well drilling and completion: the original well path and perforations are maintained to retain the original cost; (2) enhanced oil recovery method: the SAGD wells (01S01, 01P01) are modified as both the injector and the producer. The original preheating period is maintained; the huff period for both wells is 30 days; the soaking phase lasts three days; the puff period is 120 days. Once the oil rate is less than 20 m3/day during the production phase, the status of the wells is changed to the injection phase; (3) well constraints: During the huff phase, the maximum bottom hole pressure (BHP) is 4000 kPa and the BHP during the huff phase is 1000 kPa. The maximum rate of steam injection for both wells is 600 m3/day. This means that, during the injection phase, the well constraint is the injection rate if the pressure is less than 4000 kPa, and vice versa. To maintain the balance between the injection and production during the puff phase, the rate of liquid production for each well is also set to 600 m3/day for both wells. The minimum oil rate required to transit to the huff phase is 20 m3/day.
3.2. Results and Discussion
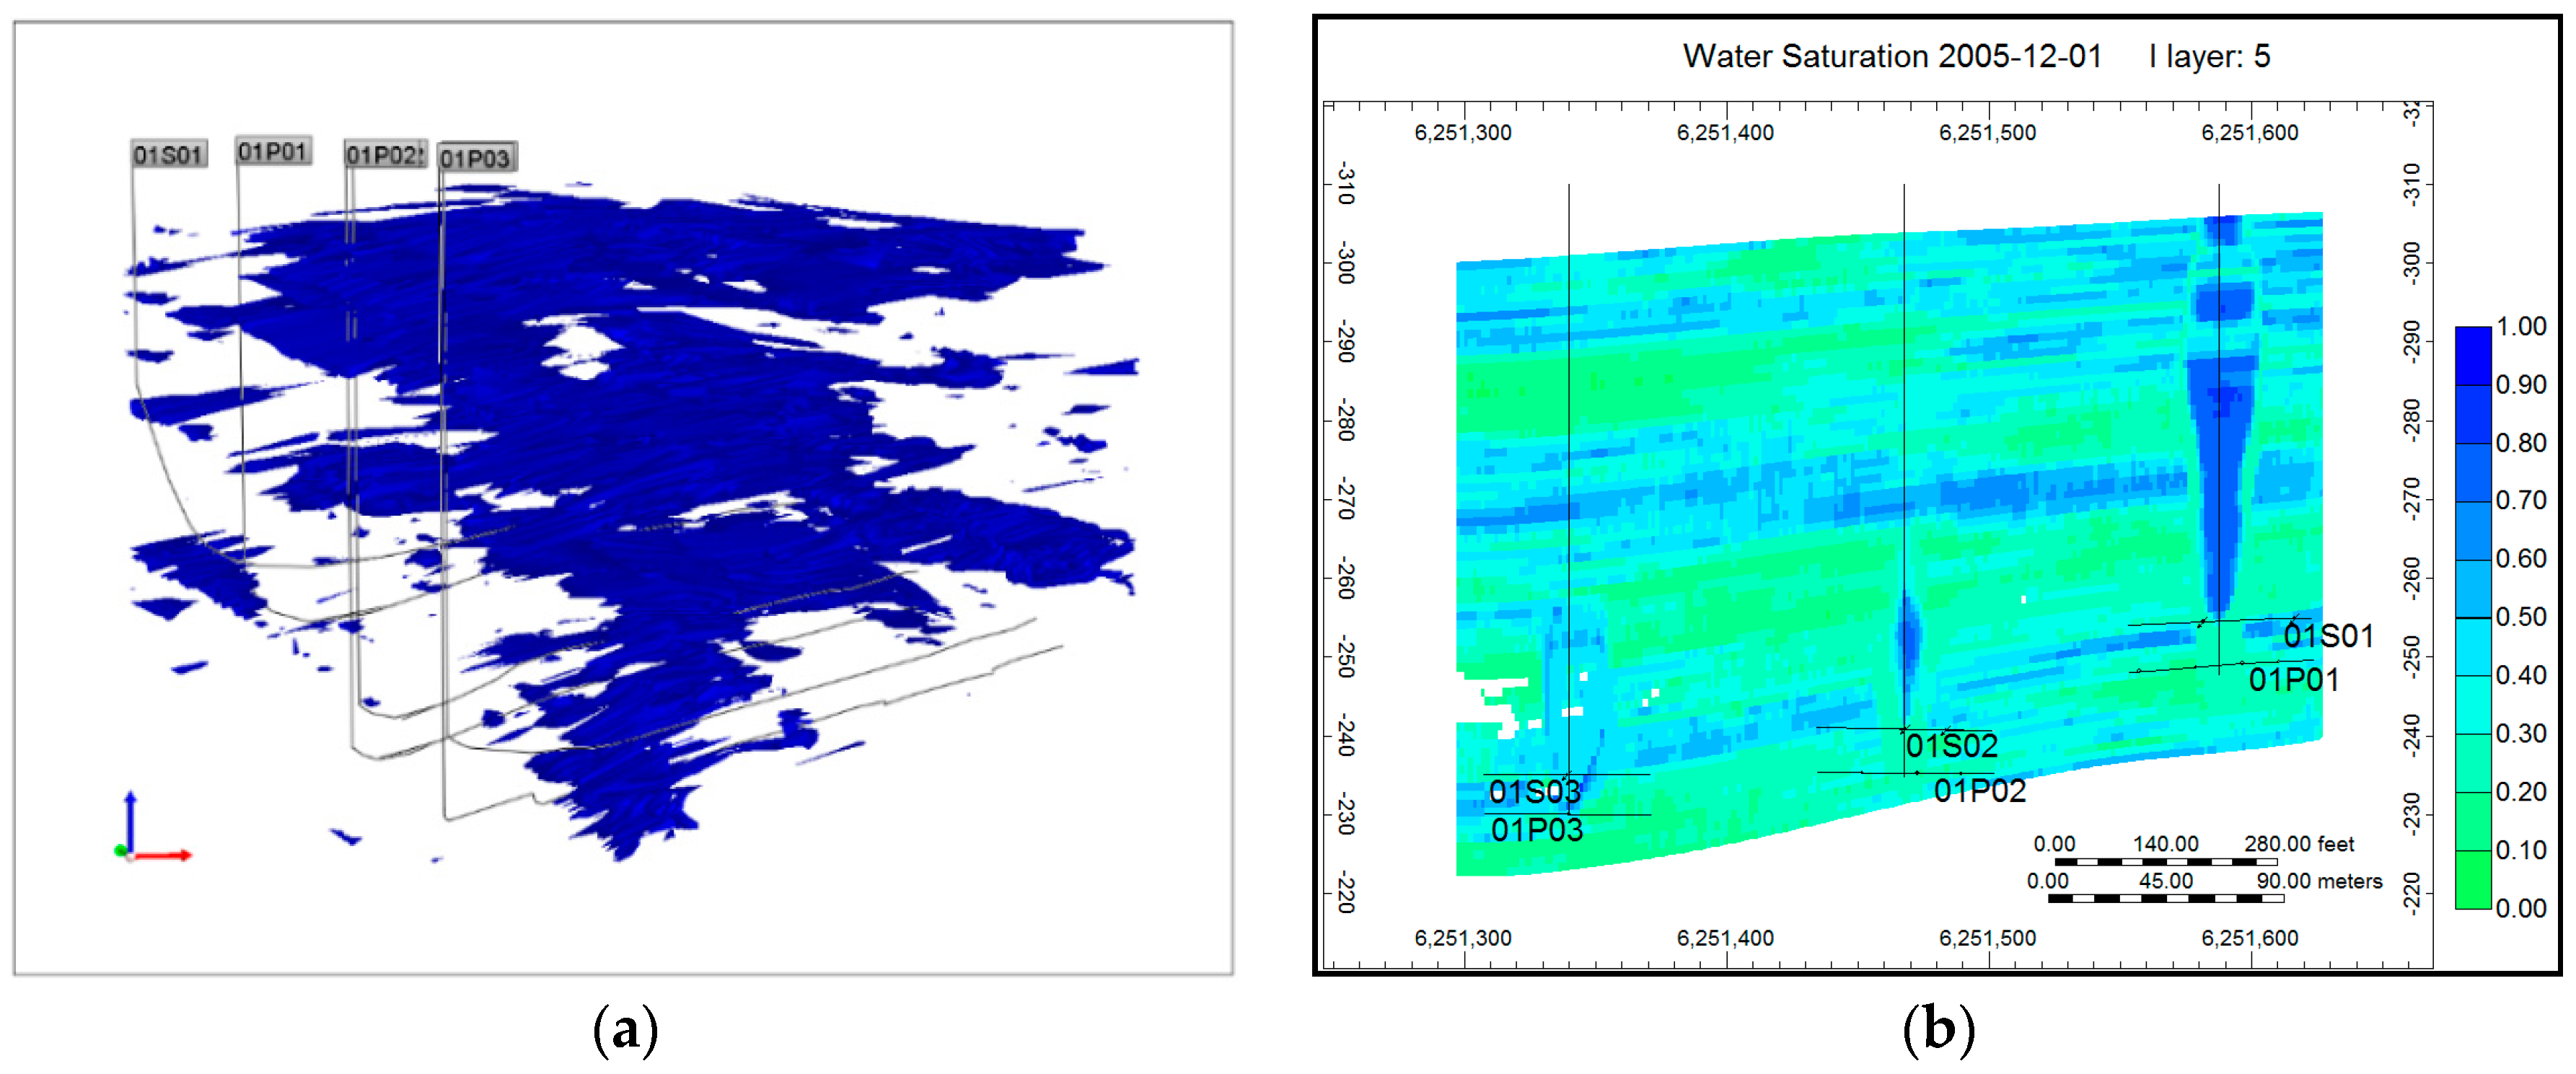
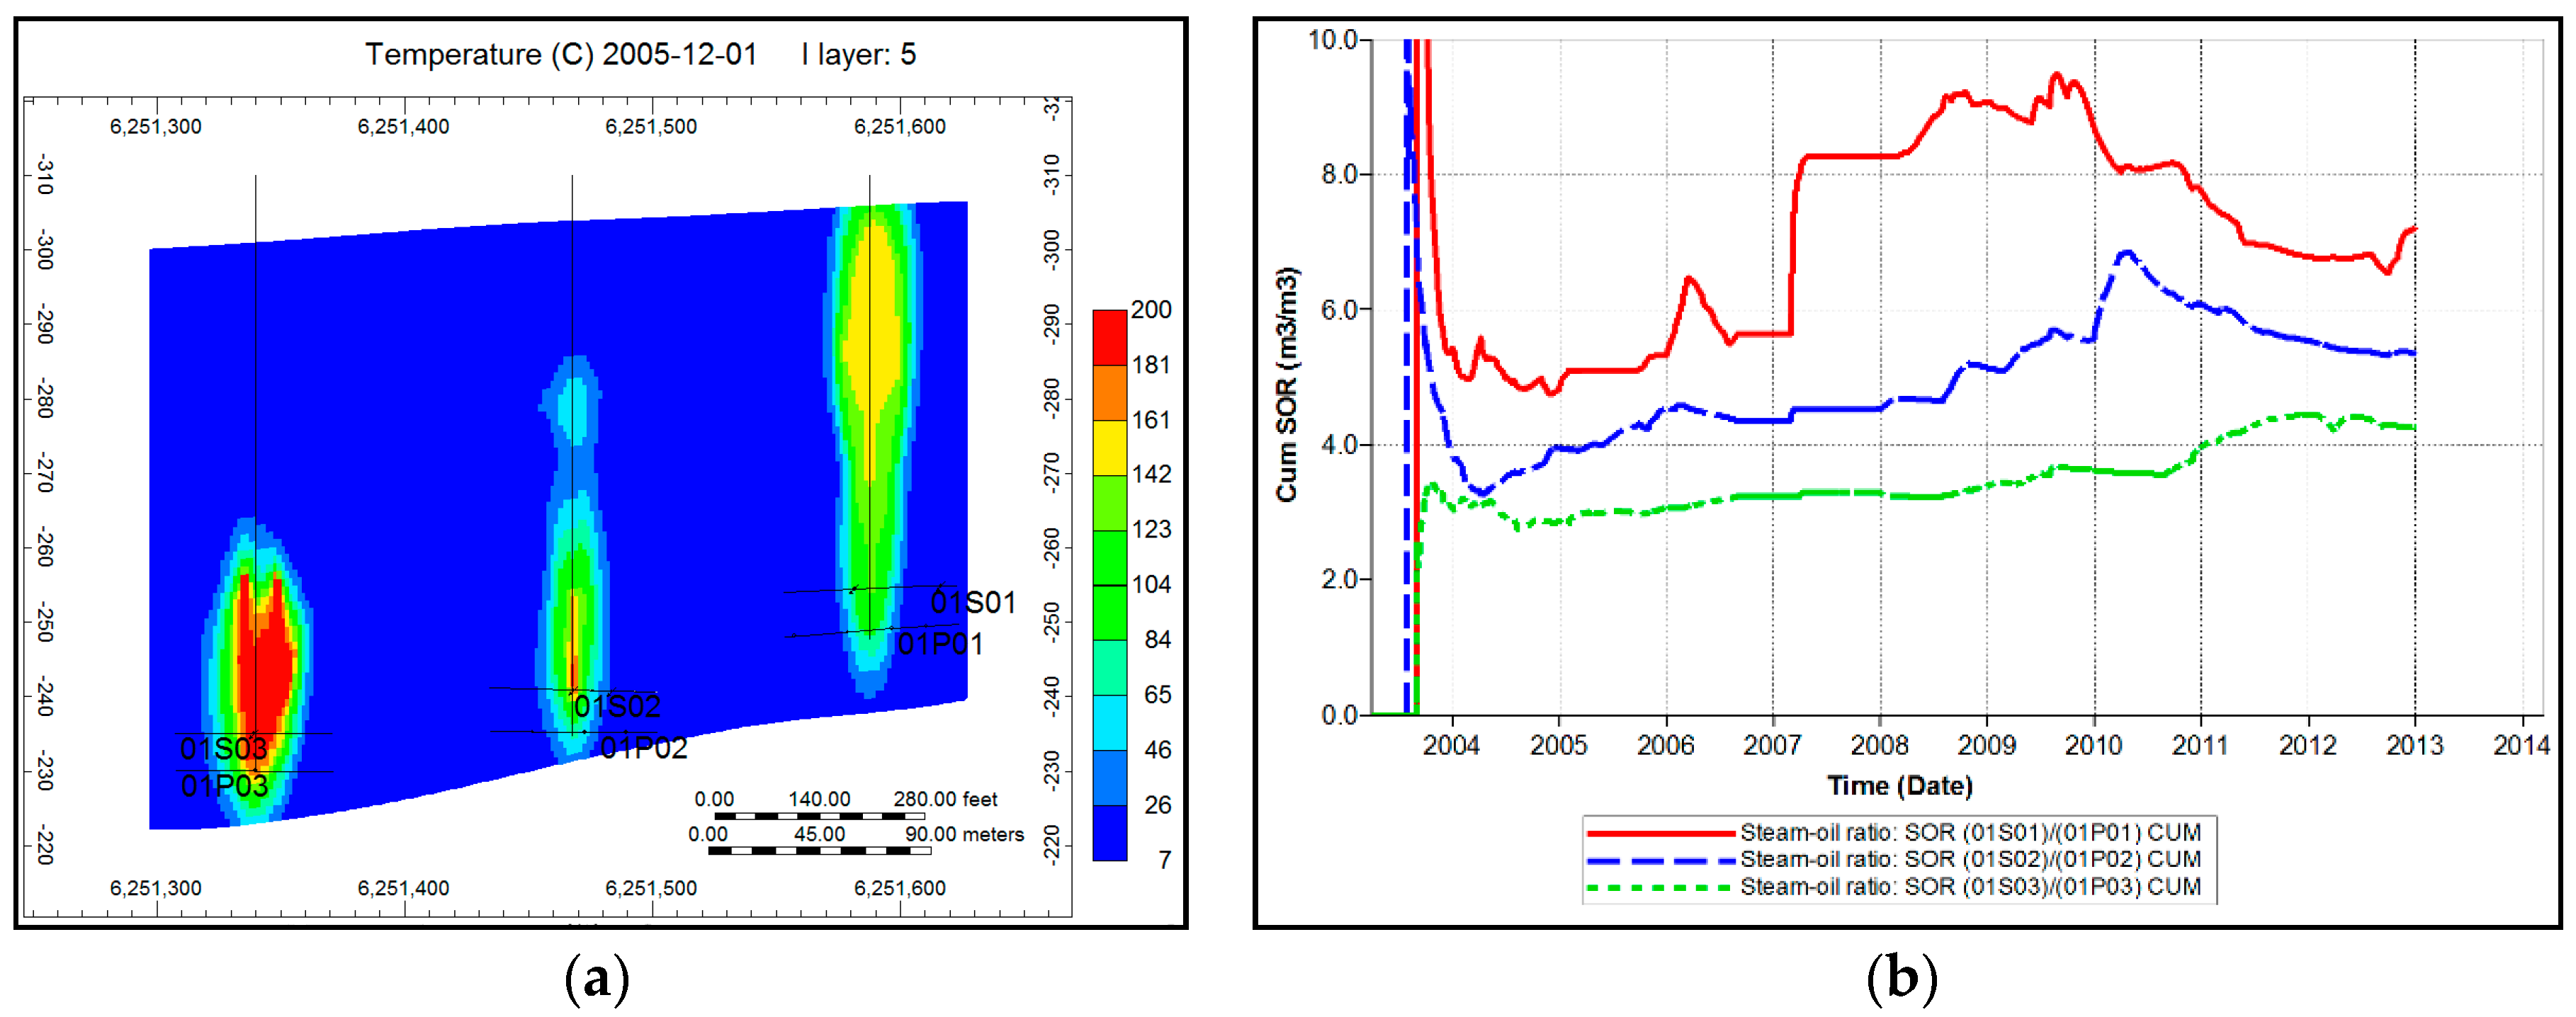
Lean zones are widely distributed in the model (Figure 11 and Figure 13). Based on the injection pressure in Table 2, the period of production is divided into two stages: (1) early stage (2003–2008): the injection pressure of the injector is kept low to avoid the penetration of lean zones in a short period of time; in this phase, a large amount of mobile water in the lean zones is delivered to the producer; (2) late stage (2009–2013): the majority of mobile water in the lean zones has been produced, which results in the decrease of the injectivity and the increase of the injection pressure. As a comparison of the intersections of water saturation in these regions (Figure 13), the lean zone in region 1 (well pair 1) is the most significant in the distribution range above the injector, and thus, well pair 1 exhibits the highest injectivity and lowest injection pressure in the early stage. From Figure 14a, we can see that Pair 1 also has the largest steam chamber volume in the early stage. Based on the comparisons of the cumulative ratio of steam to oil and the cumulative recovery of oil, SAGD in well pair 1 is the most ineffective among the three pairs (Figure 14b). These findings are in agreement with the conclusions from the numerical study.
We conduct the comparison with the conventional SAGD over a period of 10 years. Simulation results indicate that the SOR of CSS/SAGD (5.70 m3/m3) is comparable with the SOR of the conventional SAGD (5.65 m3/m3), as shown by Figure 15a, and that the cumulative oil production of the hybrid CSS/SAGD is 82,072 m3 higher than that of the conventional SAGD, as shown in Figure 15b. Therefore, we highly recommend the hybrid CSS/SAGD as the solution for leaky oil-sand reservoirs.
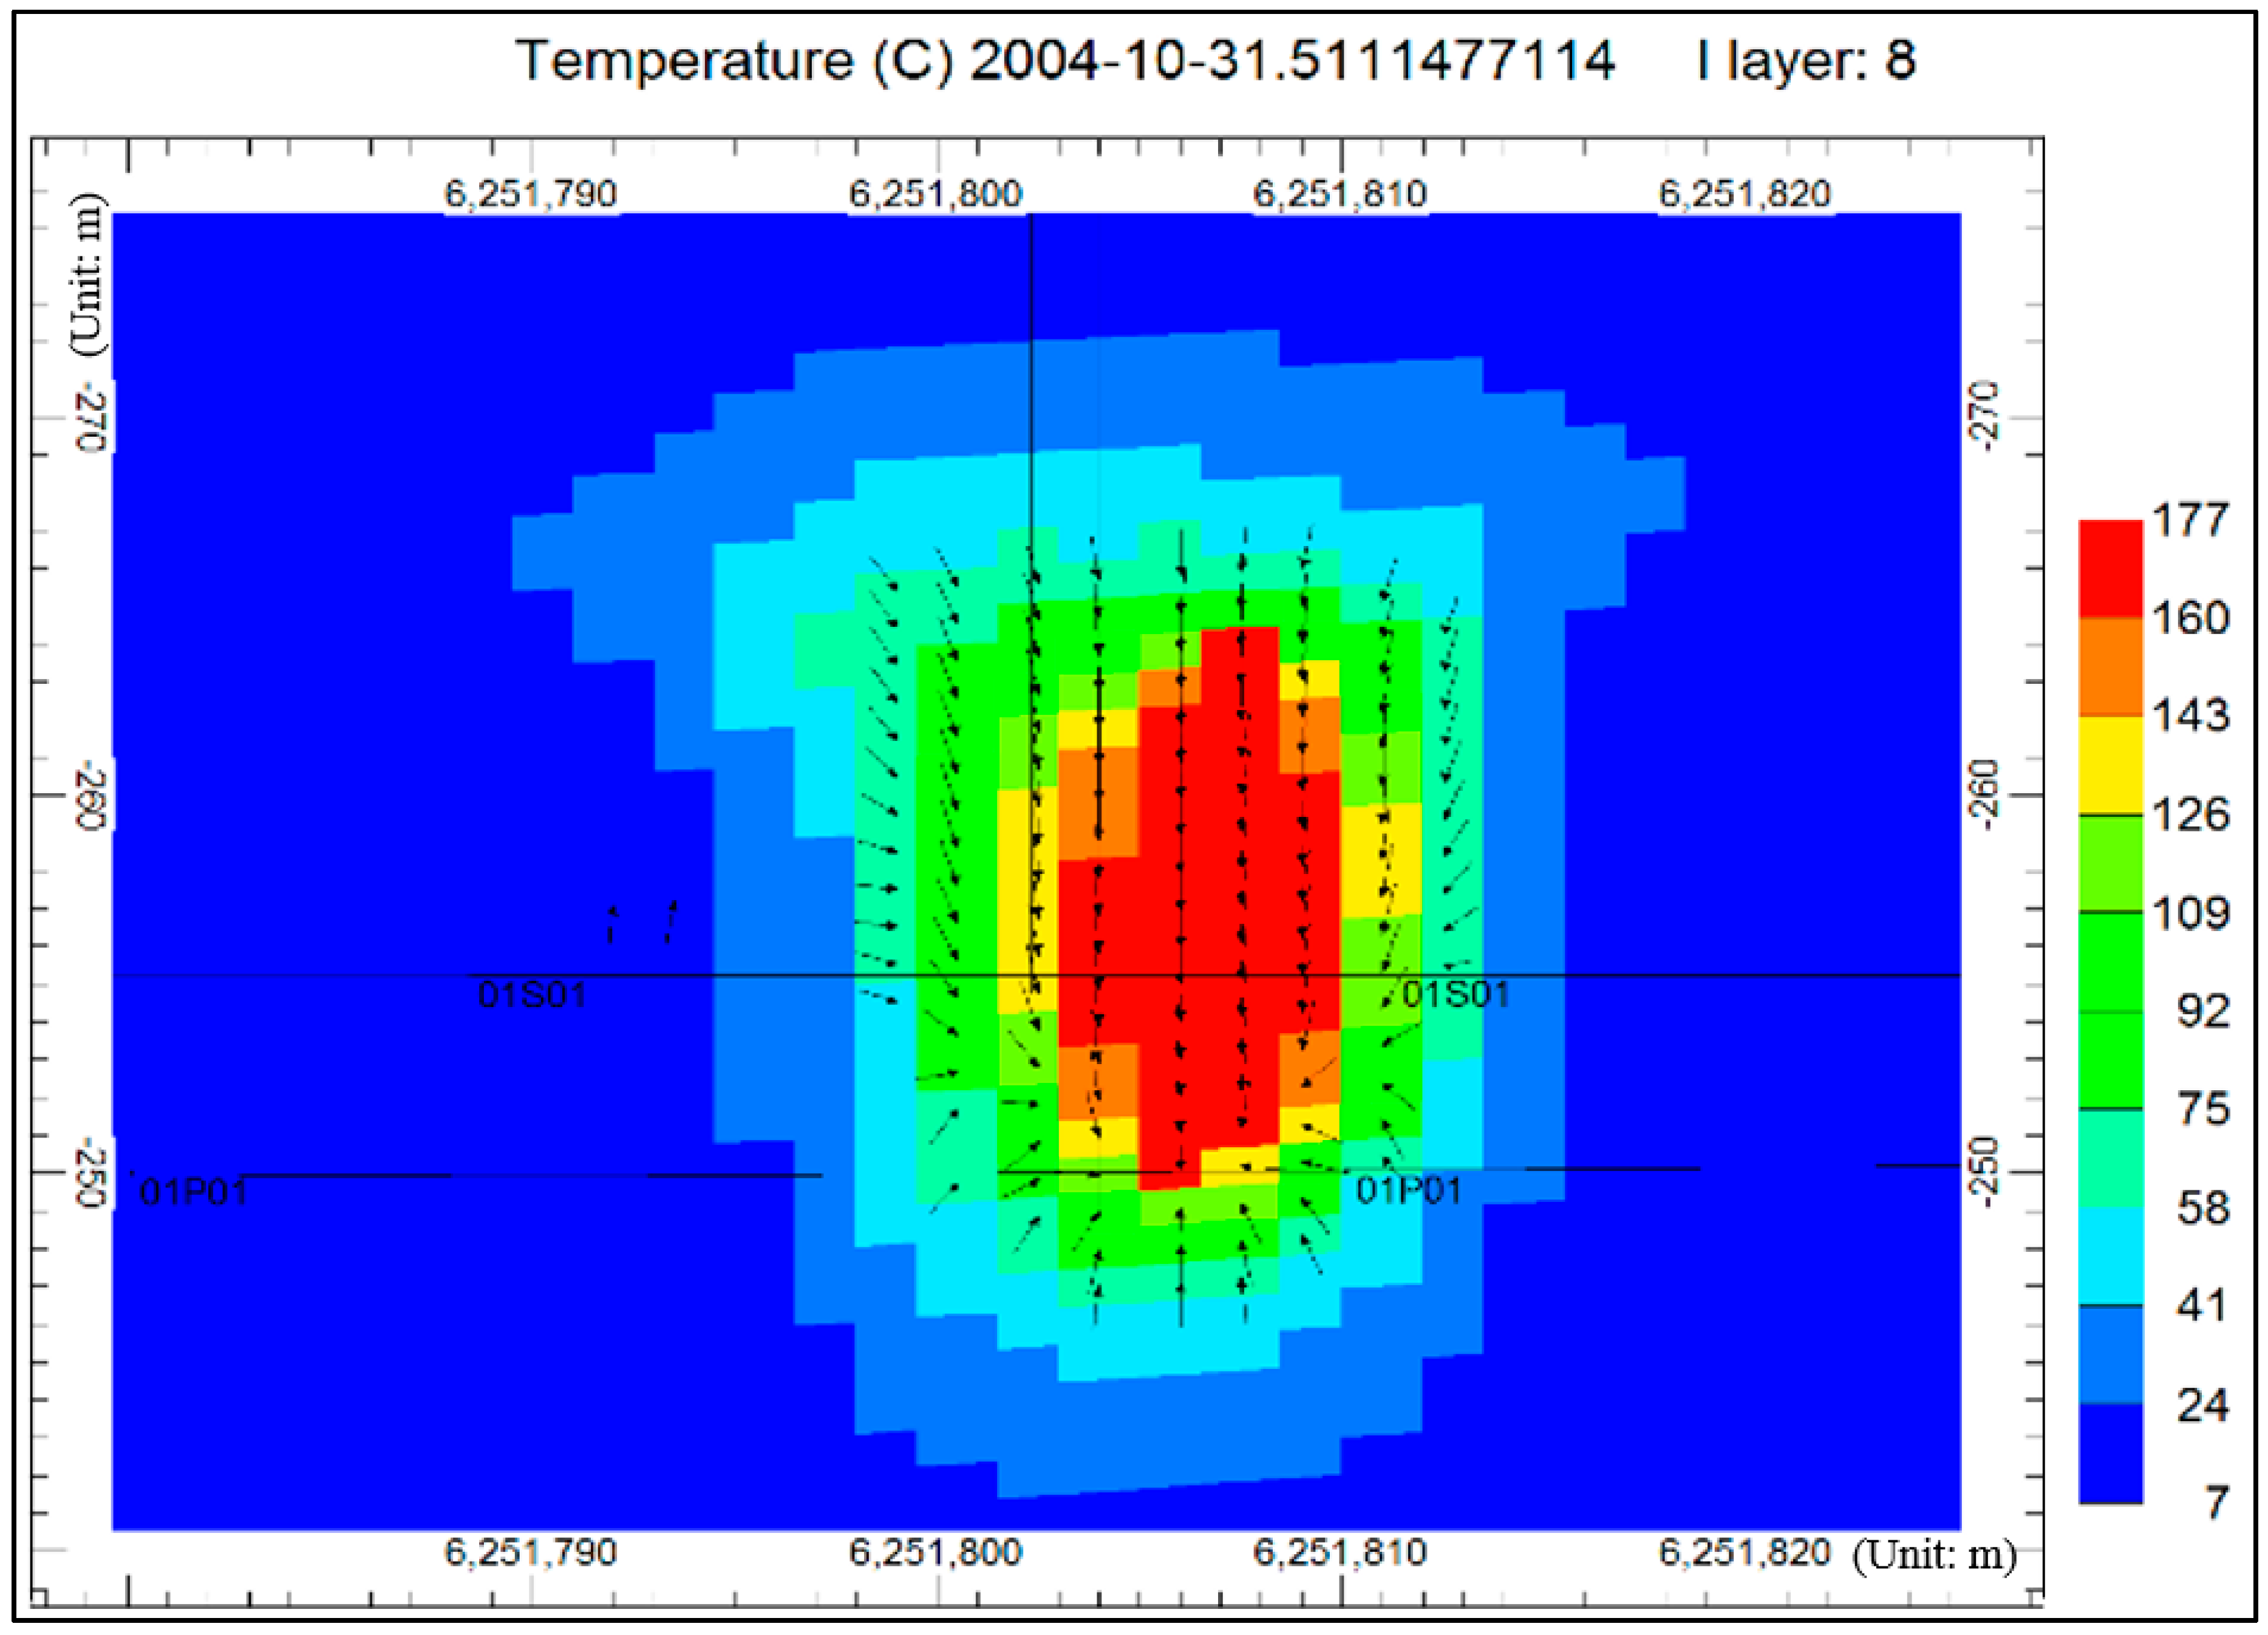
Seven cycles are completed in the hybrid CSS/SAGD production process (Figure 16). A mechanism is derived from the pressure drop between the huff and puff phases. Figure 16a depicts the pressure change in the reservoir. The wave crest represents the phase when the well is injected with steam. The wave trough represents the phase when the well produces oil. Owing to the pressure drop, the pore volume shrinks significantly, as Figure 16b shows, which leads to the squeezing of bitumen. Another mechanism is induced by gravity drainage, as in the conventional SAGD. Figure 17 displays the steam chamber with the flow vector of oil in the puff phase. The flux vector of the oil phase suggests that a large amount of oil flows down into the steam chamber. The two mechanisms drive oil to be produced by the hybrid CSS/SAGD method.
A field-scale reservoir simulation confirms the conclusions from the numerical modelling. With lean zones, the SOR is high and oil production is low. The injection pressure is high because of large injectivity. Reservoir simulation and optimization are performed on the basis of a well-defined geomodel. The Long Lake field is greatly affected by lean zones. In oil-sand reservoirs with lean zones, a hybrid CSS/SAGD performs better than the conventional SAGD. This hybrid method combines the advantages of both SAGD and CSS, to decrease SOR and to enhance oil production. Before the practical application in the field, lab experiments and pilot tests need to be performed.
4. Conclusions
The effects of lean zones are studied based on a numerical model and field-scale application. The numerical study explores the effects of lean zones on SAGD performance, based on numerical models considering single-layer and multiple-layer lean zones, which furthermore supports the discussion of SAGD production in the Long Lake oil sands reservoir with lean zones. The main conclusions are as follows:
- (1)
- Compared with the BIP and BP types, the single-layer lean zone above the injector affects the SAGD performance the most. With the decrease of interval distance and increase of thickness and water saturation in the lean zones, the detrimental effect of single-layer lean zones on SAGD performance increases; the effect of the thickness is the most significant among these three parameters.
- (2)
- With the increase of period and decrease of connate and initial water saturations in the lean zones, the detrimental effect of multiple-layer lean zones on SAGD performance increases; the connate water saturation affects the SAGD performance the most among these three parameters. Reducing the injection pressure to some extent improves SAGD performance in leaky oil sands, as it prevents the steam chamber from penetrating the lean zone too early.
- (3)
- SAGD production in the Long Lake reservoir is being negatively affected by lean zones, where well pair 1 is most affected due to the widest distribution of lean zones above its injector (AI type). Considering the low injection pressure due to the existence of lean zones, a hybrid CSS/SAGD method is proposed, which combines the advantages of CSS (pressure drop between huff and puff phases) and SAGD (gravity drainage). Although the SORs are comparable, the cumulative oil production of the hybrid CSS/SAGD method is 82,072 m3 higher than that of the conventional SAGD method.
Supplementary Materials
The following are available online at www.mdpi.com/1996-1073/10/4/471/s1.
Acknowledgments
NSERC/AIEES/Foundation CMG Chair, AITF (iCORE) Chair, and Frank and Sarah Meyer FCMG Collaboration Centre for Visualization and Simulation are acknowledged for their supports.
Author Contributions
Jinze Xu undertook the modelling, simulation, and paperwork as part of his Master’s research at the University of Calgary, supervised by Zhangxin Chen. Xiaohu Dong and Wei Zhou participated in the discussion of results and manuscript revision.
Conflicts of Interest
The authors declare no conflict of interest.
Abbreviations
The following abbreviations are used in this manuscript:
| number of layer in the numerical model, dimensionless | |
| appearance period of lean zones, dimensionless | |
| water saturation of the lean zone, dimensionless | |
| residual oil saturation, dimensionless | |
| water saturation, dimensionless | |
| connate water saturation, dimensionless | |
| layer’s water saturation in the model with multiple-layer lean zones, dimensionless |
References
- Giacchetta, G.; Leporini, M.; Marchetti, B. Economic and environmental analysis of a Steam Assisted Gravity Drainage (SAGD) facility for oil recovery from Canadian oil sands. Appl. Energy 2015, 142, 1–9. [Google Scholar] [CrossRef]
- Huang, R.; McPhedran, K.N.; Yang, L.; El-Din, M.G. Characterization and distribution of metal and nonmetal elements in the Alberta oil sands region of Canada. Chemosphere 2016, 147, 218–229. [Google Scholar] [CrossRef] [PubMed]
- Hudson, P.V. History of environmental contamination by oil sands extraction. Proc. Natl. Acad. Sci. USA 2013, 110, 1569–1570. [Google Scholar] [CrossRef] [PubMed]
- Dusseault, M.B.; Shafiei, A. Oil Sands. Ullmann’s Encyclopedia of Industrial Chemistry; John Wiley & Sons: New York, NY, USA, 2011; p. 52. [Google Scholar]
- Dusseault, M.B. Screening criteria and technology sequencing for in-situ viscous oil production. In Heavy-Oil and Oil-Sand Petroleum Systems in Alberta and Beyond; Studies in Geology 64; Hein, F.J., Leckie, D.A., Larter, S., Suter, J.R., Eds.; American Association of Petroleum Geologists: Boulder, CO, USA, 2013; pp. 655–668. [Google Scholar]
- Butler, R. SAGD comes of age! J. Can. Petrol. Technol. 1998, 37, 9–12. [Google Scholar] [CrossRef]
- Butler, R. Steam-assisted gravity drainage: Concept, development, performance and future. J. Can. Petrol. Technol. 1994, 33, 44–50. [Google Scholar] [CrossRef]
- Ito, Y.; Ipek, G. Steam fingering phenomenon during SAGD process. In Proceedings of the SPE International Thermal Operations and Heavy Oil Symposium, Calgary, AB, Canada, 1–3 November 2005; Society of Petroleum Engineers: Houston, TX, USA, 2005. [Google Scholar]
- Cyr, T.; Coates, R.; Polikar, M. Steam-Assisted Gravity Drainage Heavy Oil Recovery Process. U.S. Patent 6,257,334, 10 July 2001. [Google Scholar]
- Alvarez, J.; Moreno, R.; Sawatzky, R.P. Can SAGD be exported? Potential challenges. In Proceedings of the SPE Heavy and Extra Heavy Oil Conference, Medellin, Colombia, 24–26 September 2014; Society of Petroleum Engineers: Houston, TX, USA, 2014. [Google Scholar]
- Baker, R.O.; Rodrigues, K.; Sandhu, K.S.; Jong, E.S.W. Key parameters in steam chamber development. In Proceedings of the Canadian Unconventional Resources and International Petroleum Conference, Calgary, AB, Canada, 19–21 October 2010; Society of Petroleum Engineers: Houston, TX, USA, 2010. [Google Scholar]
- Shin, H.; Choe, J. Shale barrier effects on the SAGD performance. In Proceedings of the SPE/EAGE Reservoir Characterization & Simulation Conference, Abu Dhabi, UAE, 19–21 October 2009; Society of Petroleum Engineers: Houston, TX, USA, 2009. [Google Scholar]
- Nasr, T.N.; Law, D.S.; Beaulieu, G.; Golbeck, H.; Korpany, G.; Good, W.K. SAGD application in gas cap and top water oil reservoirs. J. Can. Petrol. Technol. 2003, 42, 32–38. [Google Scholar] [CrossRef]
- Law, D.H.S.; Nasr, T.N.; Good, W.K. Field-scale numerical simulation of SAGD process with top-water thief zone. J. Can. Petrol. Technol. 2003, 42, 32–38. [Google Scholar] [CrossRef]
- Pooladi-Darvish, M.; Mattar, L. SAGD operations in the presence of overlying gas cap and water layer-effect of shale layers. J. Can. Petrol. Technol. 2002, 41, 40–51. [Google Scholar] [CrossRef]
- Masih, S.; Ma, K.; Sanchez, J.; Patino, F.; Boida, L. The effect of bottom water coning and its monitoring for optimization in SAGD. In Proceedings of the SPE Heavy Oil Conference, Calgary, AB, Canada, 12–14 June 2012; Society of Petroleum Engineers: Houston, TX, USA, 2012. [Google Scholar]
- Rodriguez, J.R.; Darche, G.; Espinasse, J. An innovative thermal production scheme for mobile heavy oil reservoirs with bottom aquifer. In Proceedings of the SPE Annual Technical Conference and Exhibition, Denver, CO, USA, 5–8 October 2003; Society of Petroleum Engineers: Houston, TX, USA, 2003. [Google Scholar]
- Saskoil, S.S.; Butler, R.M. The production of conventional heavy oil reservoirs with bottom water using steam-assisted gravity drainage. J. Can. Petrol. Technol. 1990, 29, 78–86. [Google Scholar] [CrossRef]
- Xu, J.; Chen, Z.; Zhong, H. Numerical simulation and optimization of steam-assisted Gravity Drainage in Long Lake Field with Lean Zone and Shale Layer. In Proceedings of the World Heavy Oil Congress, New Orleans, LA, USA, 5–7 March 2014; DMG Events Global Energy: London, UK, 2014. [Google Scholar]
- Xu, J.; Chen, Z.J.; Cao, J.; Li, R. Numerical study of the effects of lean zones on SAGD performance in periodically heterogeneous media. In Proceedings of the SPE Heavy Oil Conference-Canada, Calgary, AB, Canada, 10–12 June 2014; Society of Petroleum Engineers: Houston, TX, USA, 2014. [Google Scholar]
- Xu, J.; Chen, Z.J.; Yu, Y.; Cao, J. Numerical thermal simulation and optimization of hybrid CSS/SAGD process in Long Lake with lean zones. In Proceedings of the SPE Heavy Oil Conference-Canada, Calgary, AB, Canada, 10–12 June 2014; Society of Petroleum Engineers: Houston, TX, USA, 2014. [Google Scholar]
- Xu, J.; Chen, Z.; Li, R. 3D Geological modeling and uncertainty analysis of pilot pad in the Long Lake field with lean zone and shale layer. In Proceedings of the Geoconvention, Calgary, AB, Canada, 12–16 May 2014; Canada’s Energy Geoscientists and Canadian Society of Exploration Geophysicists and Canadian Well Logging Society: Calgary, AB, Canada, 2014. [Google Scholar]
- Xu, J. Effects of Lean Zones on SAGD Performance. Master’s Thesis, University of Calgary, Calgary, AB, Canada, 2015. [Google Scholar]
- Xu, J.; Pan, Y.; Chen, Z. Understanding impacts of lean zones on thermal recovery in view of mobile water. In Proceedings of the SPE Canada Heavy Oil Technical Conference, Calgary, AB, Canada, 7–9 June 2015; Society of Petroleum Engineers: Houston, TX, USA, 2015. [Google Scholar]
- Doan, L.T.; Baird, H.; Doan, Q.T.; Farouq Ali, S.M. Performance of the SAGD process in the presence of a water sand: A preliminary investigation. J. Can. Petrol. Technol. 2003, 42, 25–31. [Google Scholar] [CrossRef]
- Fairbridge, J.K.; Cey, E.; Gates, I.D. Impact of intraformational water zones on SAGD performance. J. Pet. Sci. Eng. 2012, 82, 187–197. [Google Scholar] [CrossRef]
- Cline, V.J.; Basham, M. Improving project performance in a heavy oil horizontal well project in the San Joaquin valley, California. In Proceedings of the SPE International Thermal Operations and Heavy Oil Symposium and International Horizontal Well Technology Conference, Calgary, AB, Canada, 4–7 November 2002; Society of Petroleum Engineers: Houston, TX, USA, 2002. [Google Scholar]
- Donnelly, J.K. The best process for Cold Lake: CSS vs. SAGD. J. Can. Petrol. Technol. 2000, 39, 5–7. [Google Scholar] [CrossRef]
- Escobar, M.A.; Valera, C.A.; Perez, R.E. A large heavy oil reservoir in Lake Maracaibo basin: Cyclic steam injection experiences. In Proceedings of the International Thermal Operations and Heavy Oil Symposium, Bakersfield, CA, USA, 10–12 February 1997; Society of Petroleum Engineers: Houston, TX, USA, 1997. [Google Scholar]
- Peng, S.; Yuan, A.; Jiang, H.; Zhang, S. Cyclic preheating test in SAGD horizontal wells of Liaohe Oilfield. In Proceedings of the International Oil and Gas Conference and Exhibition, Beijing, China, 8–10 June 2010; Society of Petroleum Engineers: Houston, TX, USA, 2010. [Google Scholar]
- Coskuner, G. A new process combining cyclic steam stimulation and steam-assisted gravity drainage: Hybrid SAGD. J. Can. Petrol. Technol. 2009, 48, 8–13. [Google Scholar] [CrossRef]
- Ghanbari, E.; Mighani, S.; Shaabani, E.; Alipour, R. Improving SAGD performance combining with CSS. In Proceedings of the International Petroleum Technology Conference, Bangkok, Thailand, 15–17 November 2011; Society of Petroleum Engineers: Houston, TX, USA, 2011. [Google Scholar]
- Kerr, R.K.; Jonasson, H.P. SAGDOX—Steam assisted gravity drainage with the addition of oxygen injection. In Proceedings of the SPE Heavy Oil Conference, Calgary, AB, Canada, 11–13 June 2013; Society of Petroleum Engineers: Houston, TX, USA, 2013. [Google Scholar]
- Long Lake Subsurface Performance Presentation. Available online: https://www.aer.ca/data-and-publications/activity-and-data/in-situ-performance-presentations (accessed on 29 March 2017).
Figure 1.
Scheme of SAGD Operation.
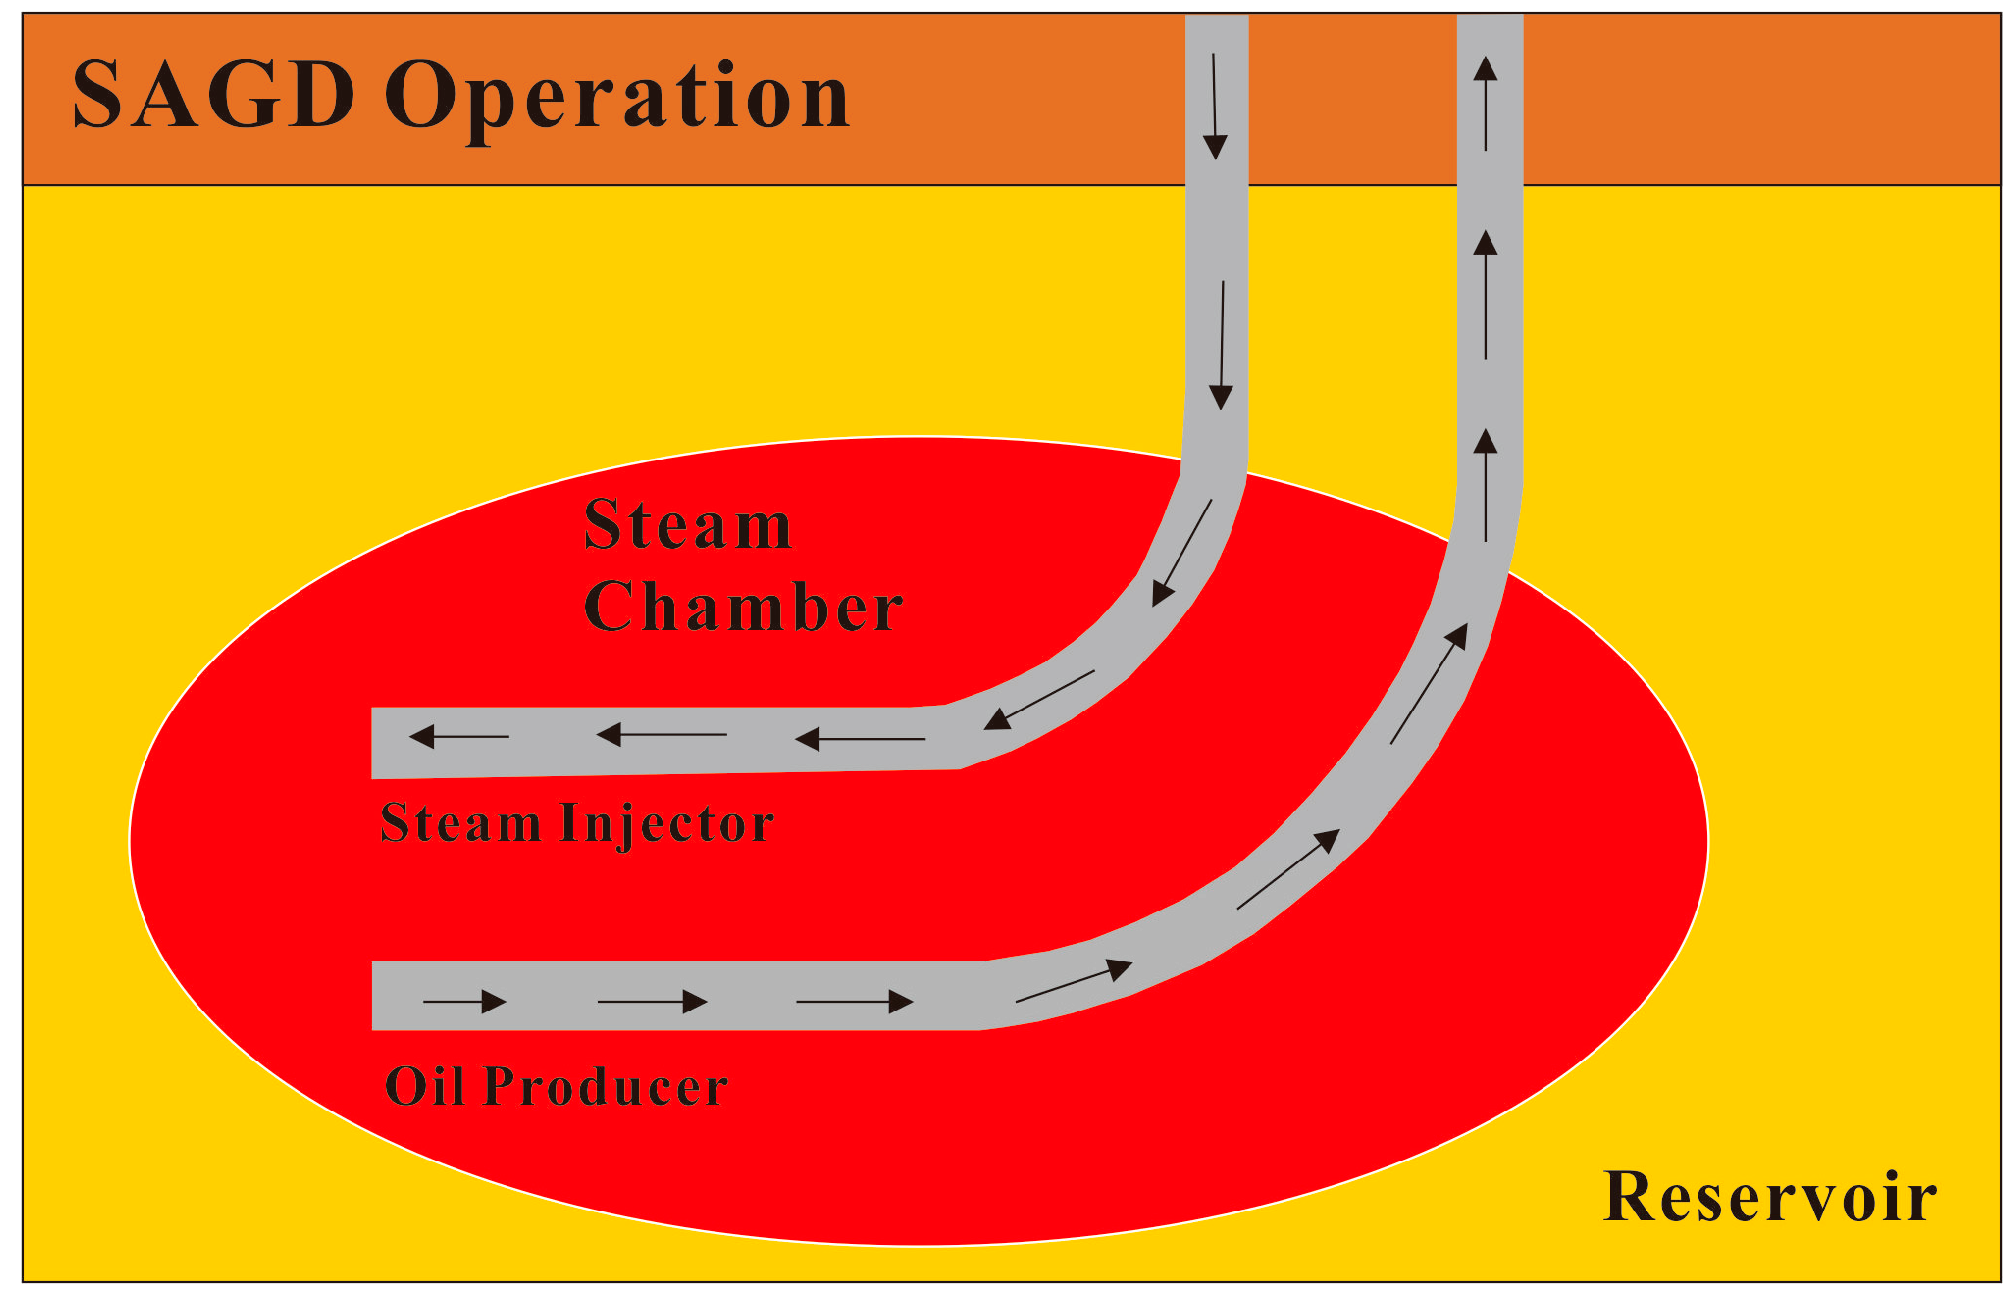
Figure 2.
Distribution types of lean zones ((a) AI type; (b) BIP type; (c) BP type; (d) multiple-layer).
Figure 2.
Distribution types of lean zones ((a) AI type; (b) BIP type; (c) BP type; (d) multiple-layer).

Figure 3.
Comparison of SOR for three types.

Figure 4.
Main effect analysis of SOR for all cases.

Figure 5.
Relationship between width, interval distance, thickness, and SOR.
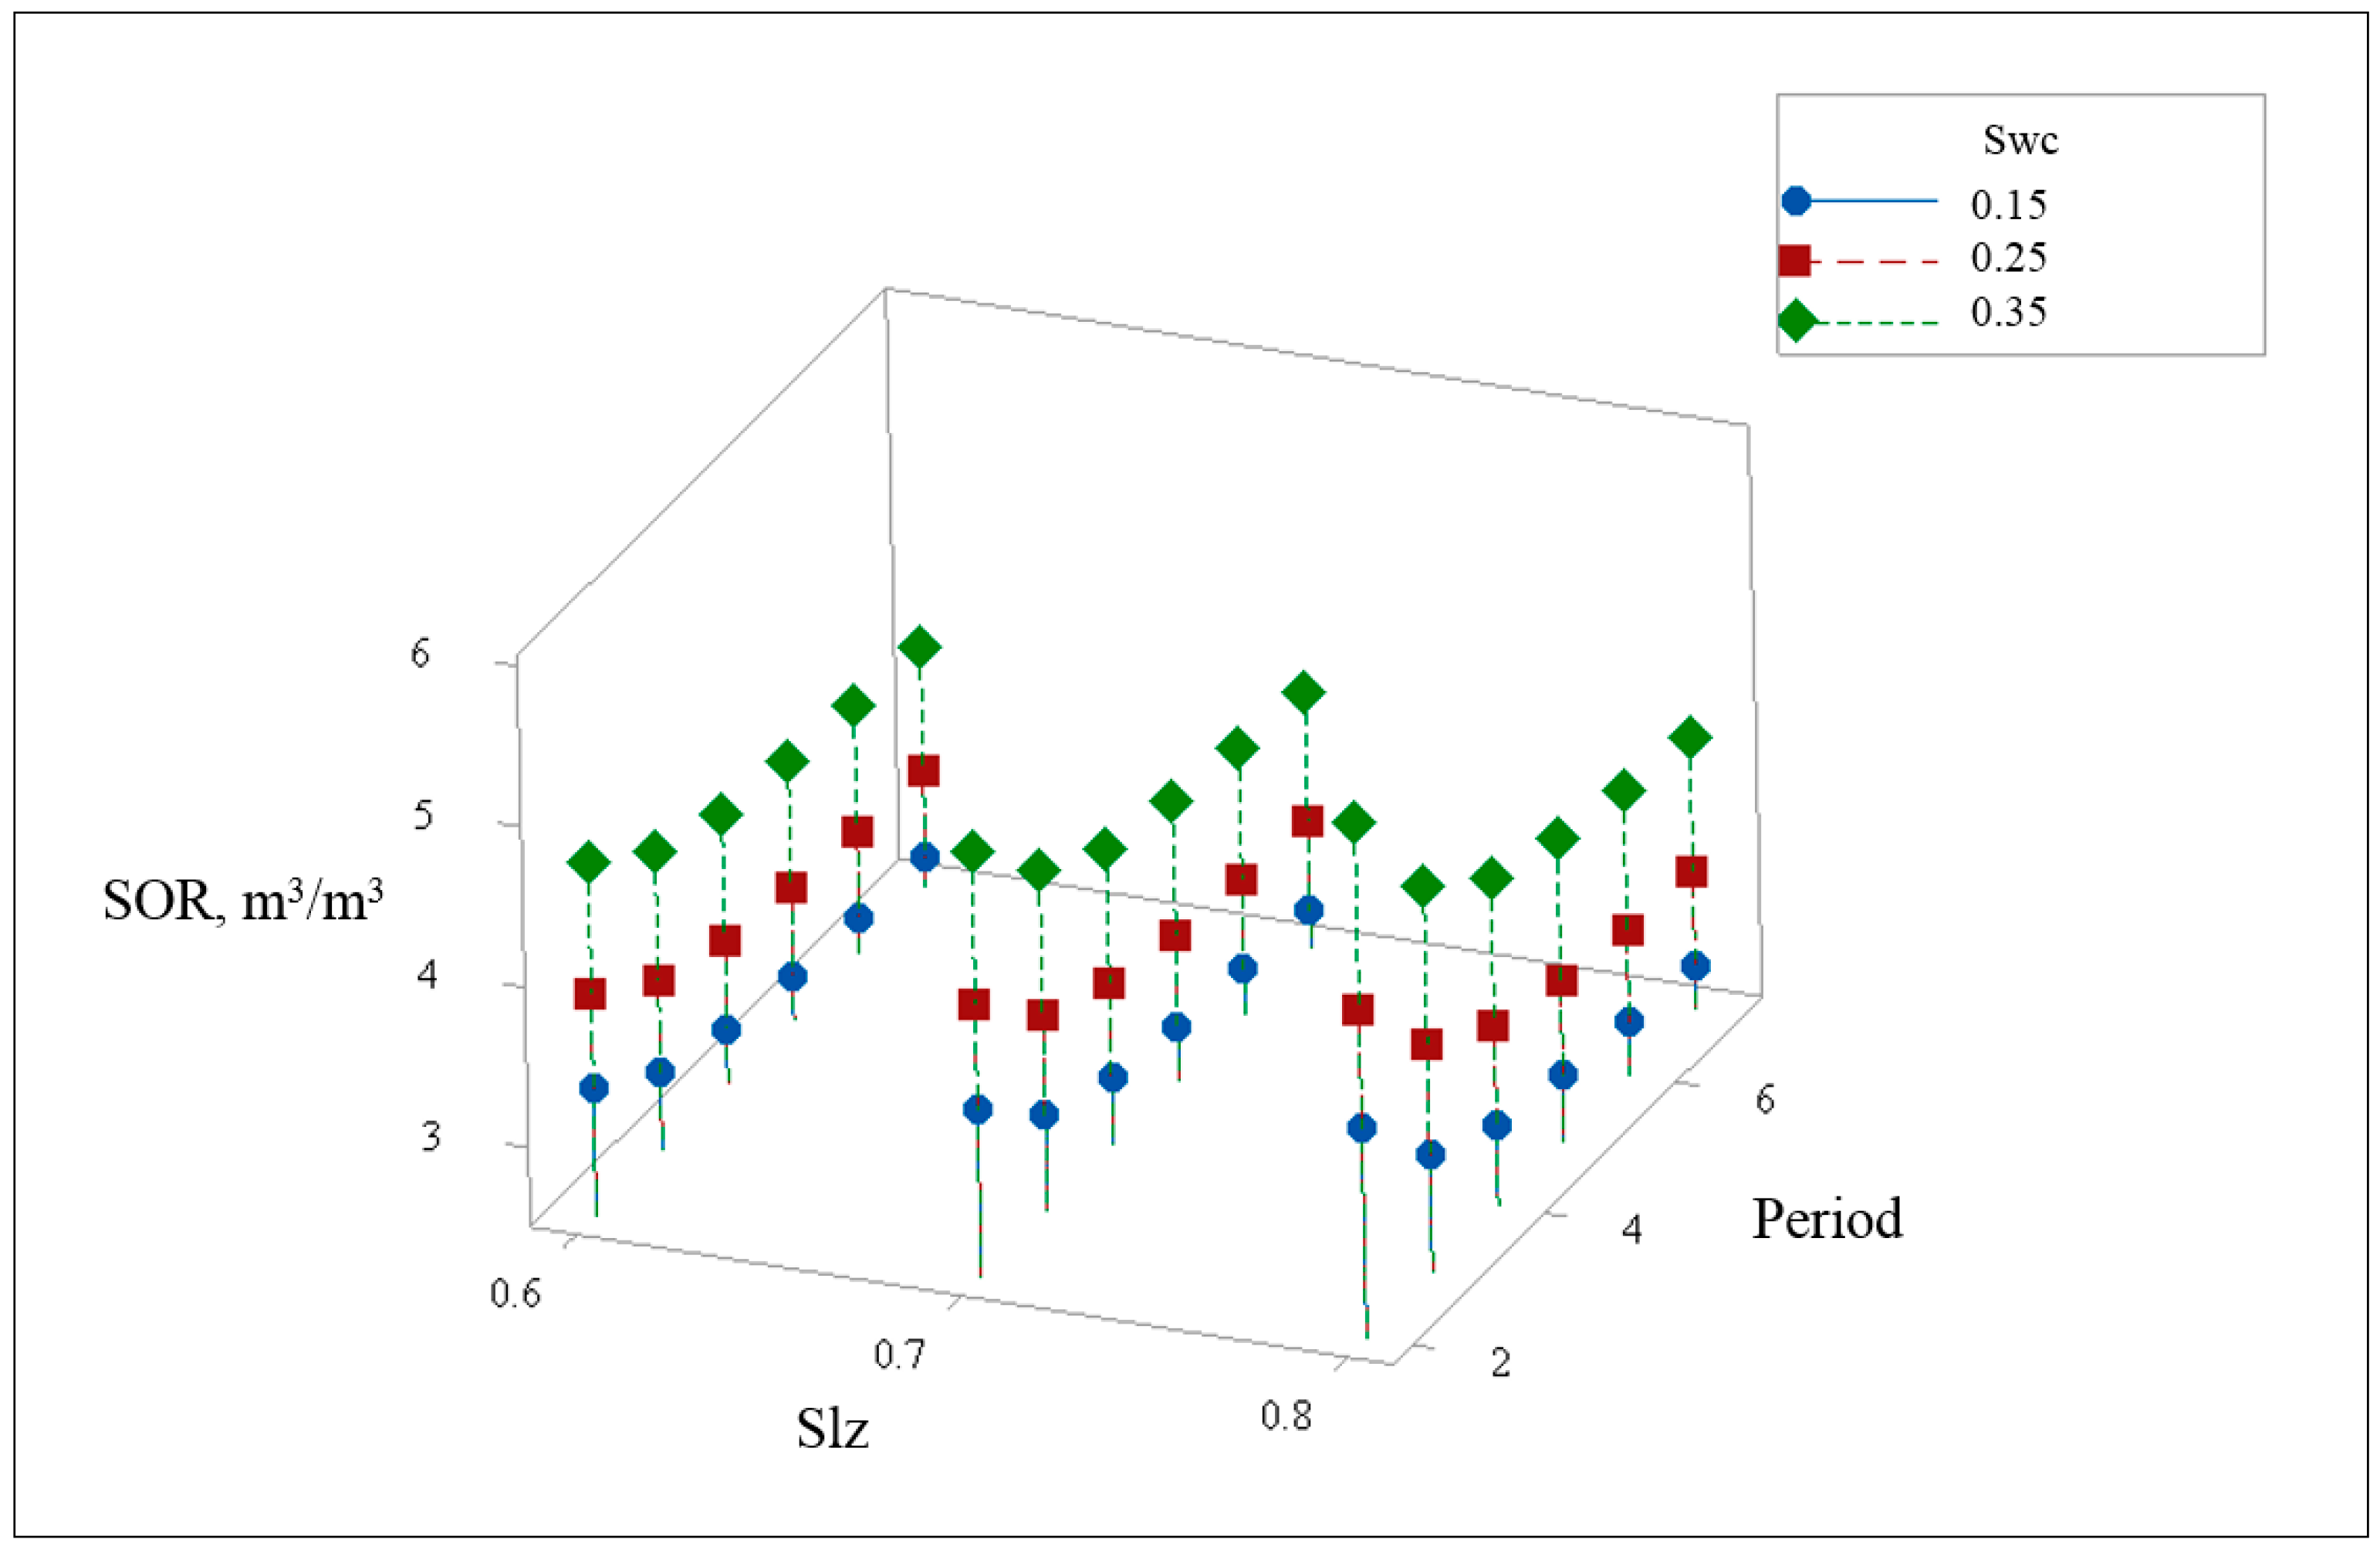
Figure 6.
Main effect analysis for SOR.

Figure 7.
Relationship between width, interval distance, thickness, and SCV.

Figure 8.
Main effect analysis for SCV.

Figure 9.
Relationship between NPV and injection pressure.
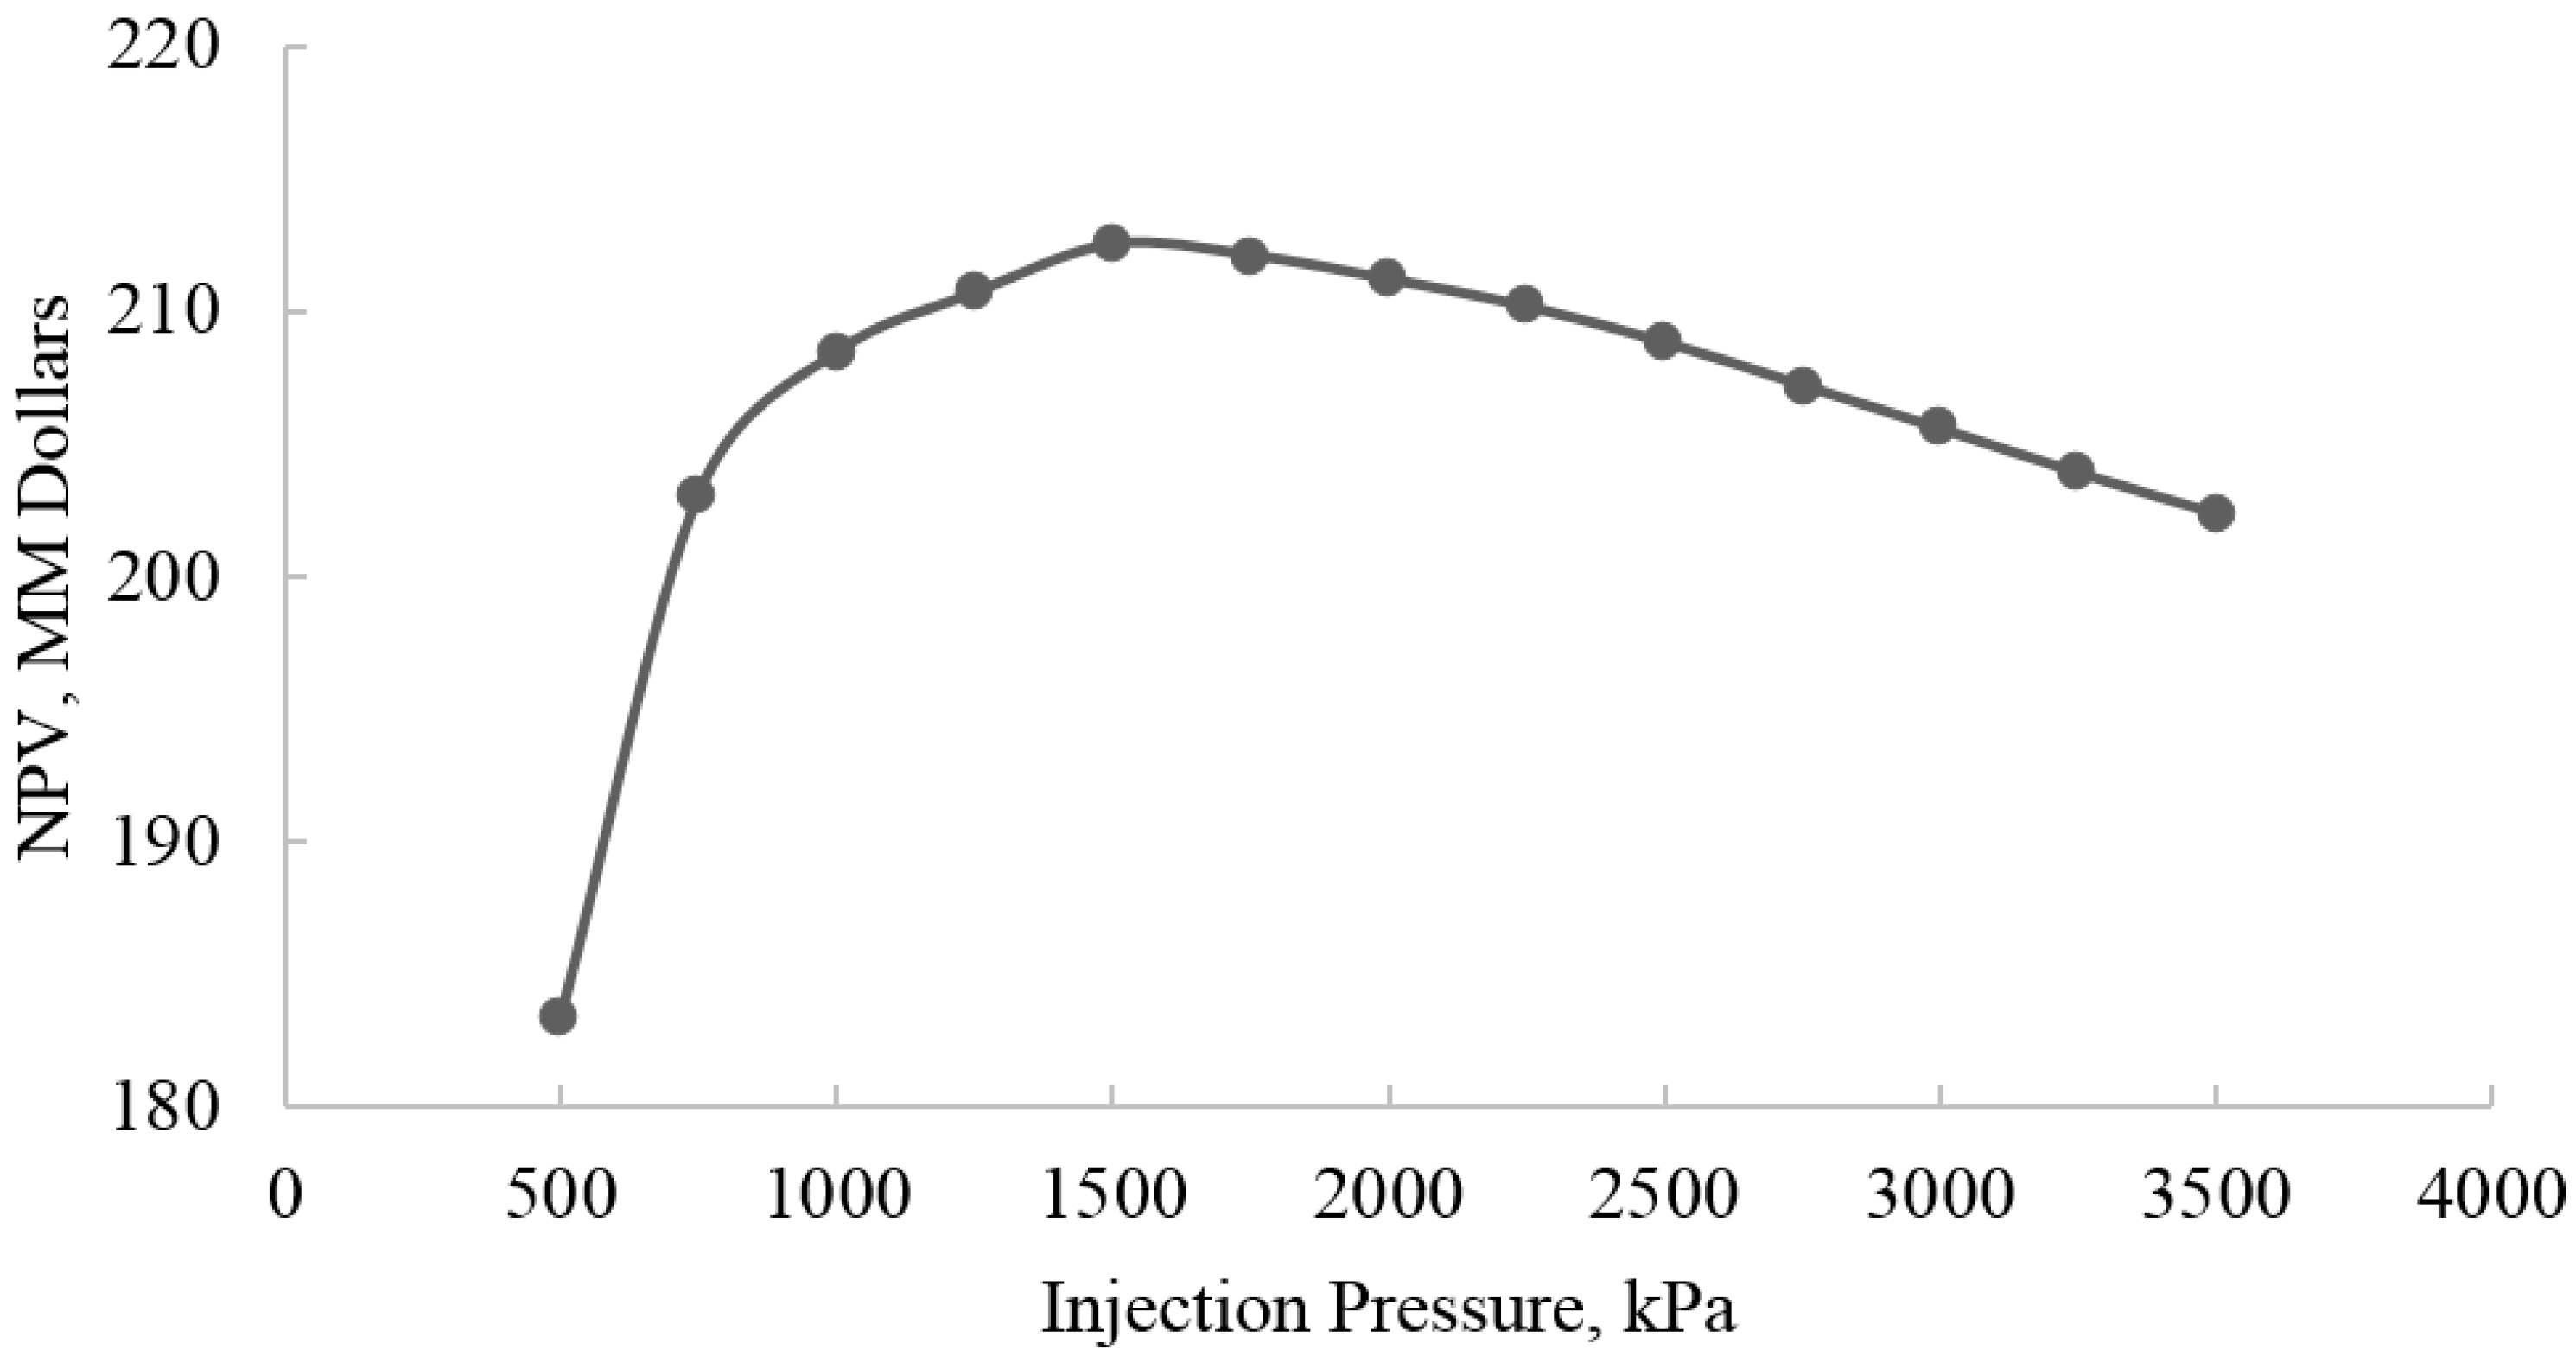
Figure 10.
Study Area Map.

Figure 11.
Cross-sectional map of lithology and water saturation along the horizontal well pair 1.
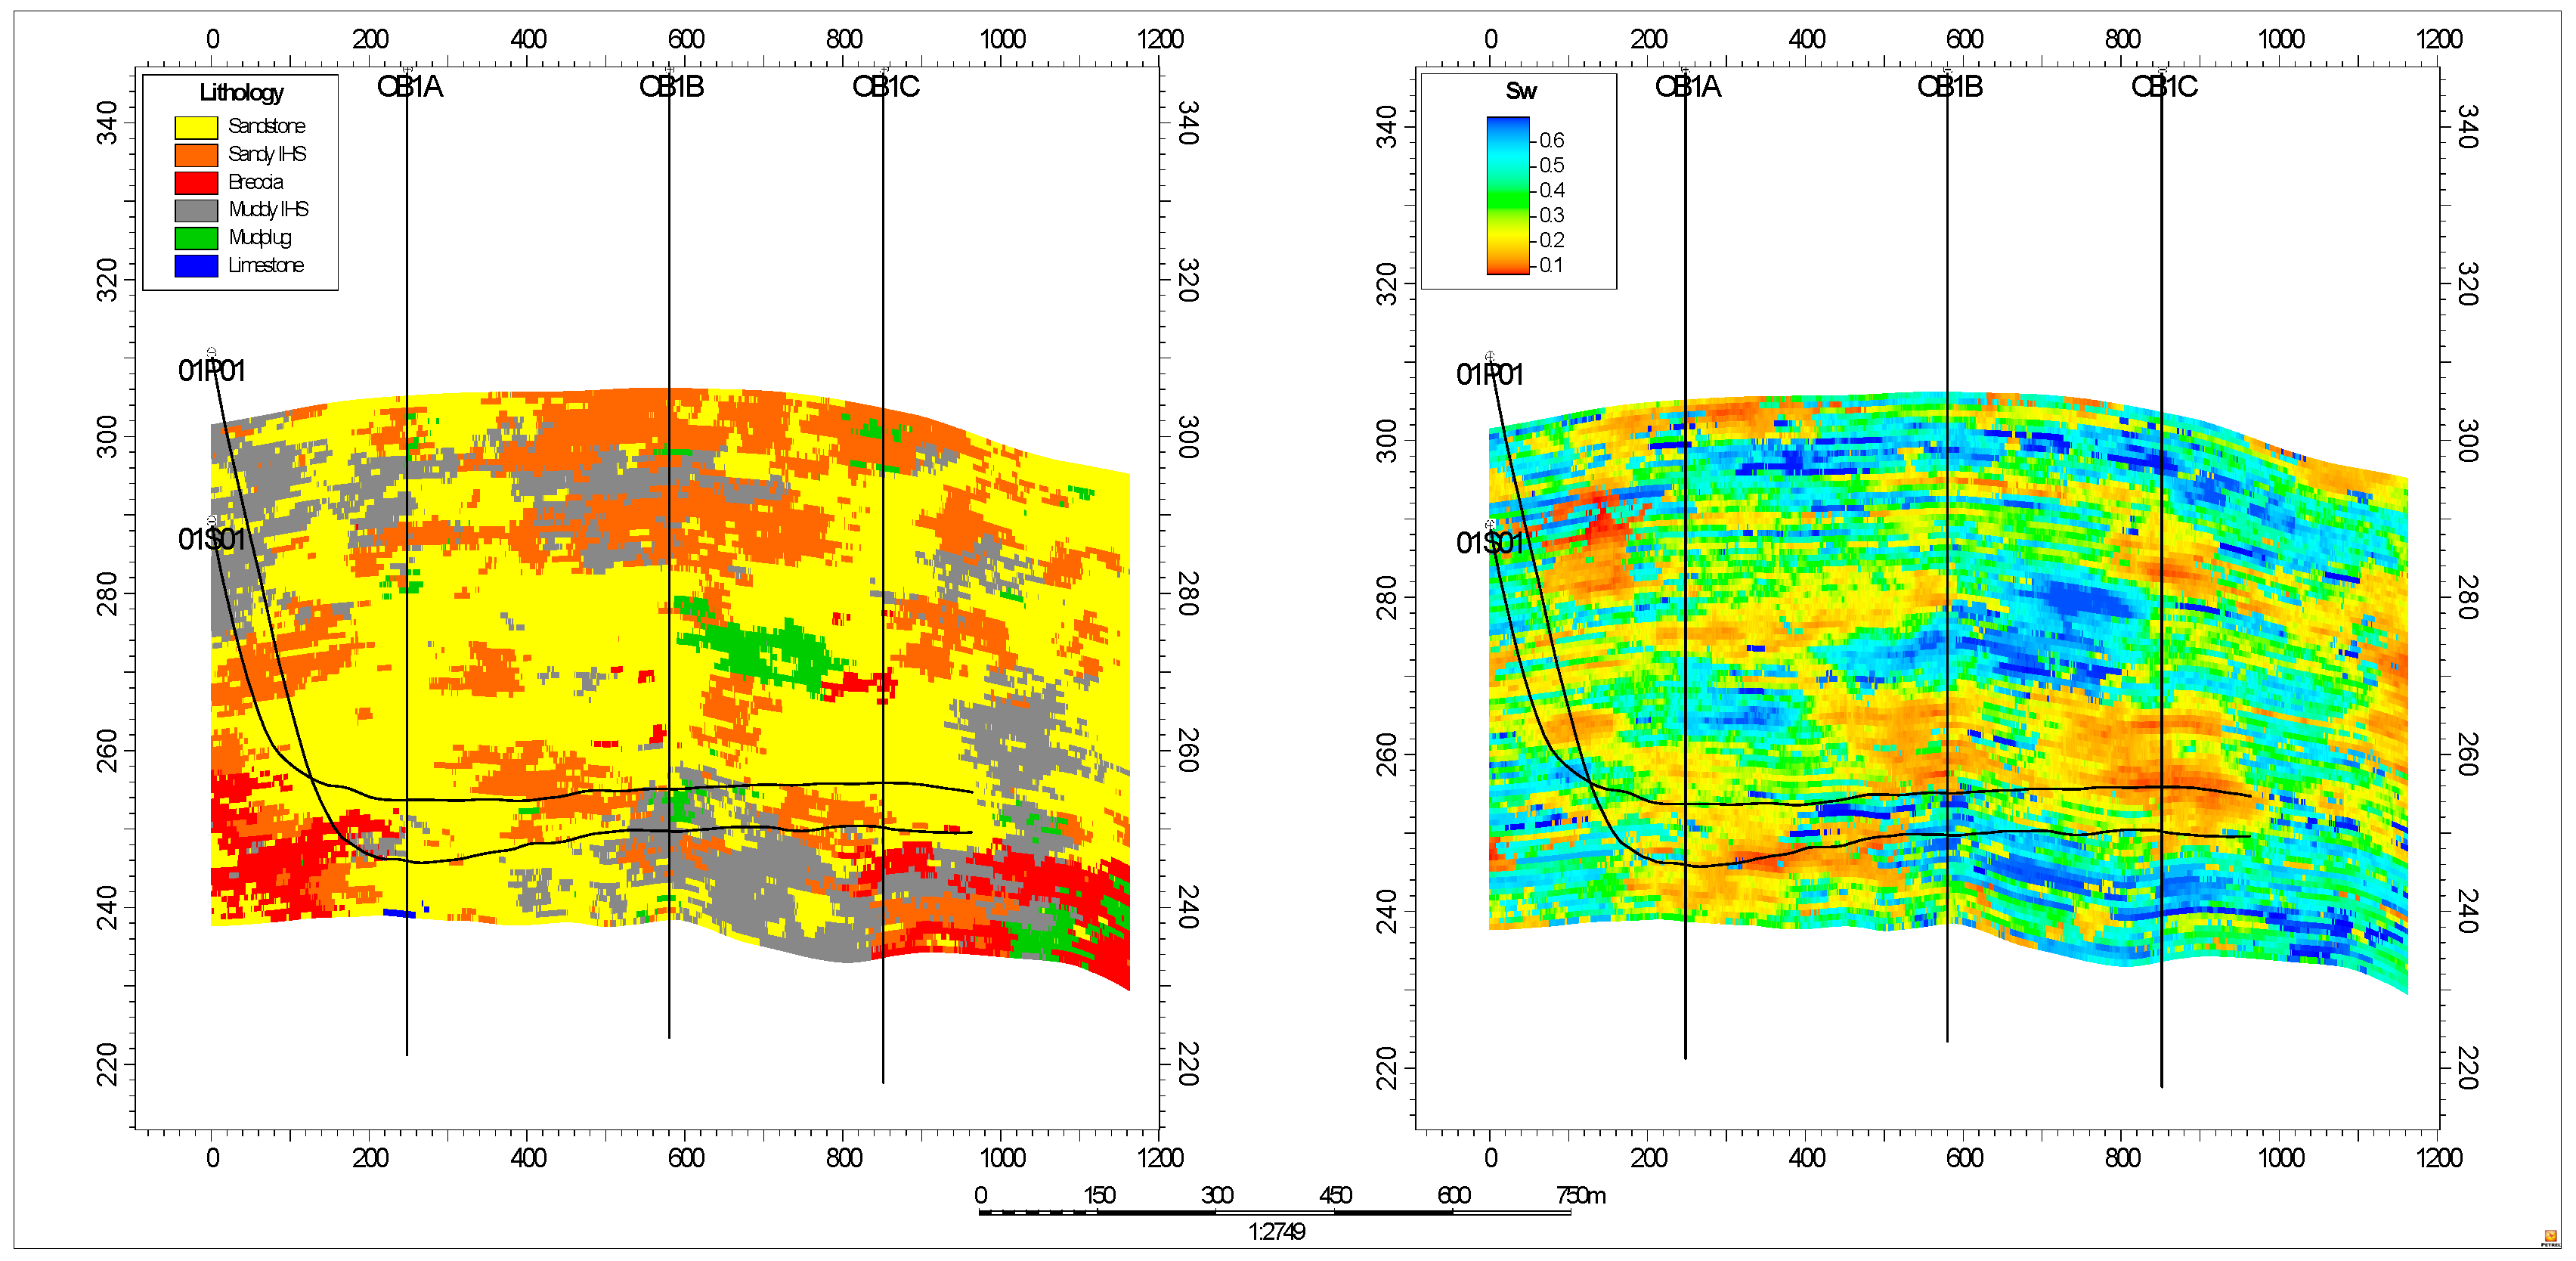
Figure 12.
History match of oil and water production rate ((a) the whole pad; (b) well pair 1; (c) well pair 2; (d) well pair 3).
Figure 12.
History match of oil and water production rate ((a) the whole pad; (b) well pair 1; (c) well pair 2; (d) well pair 3).
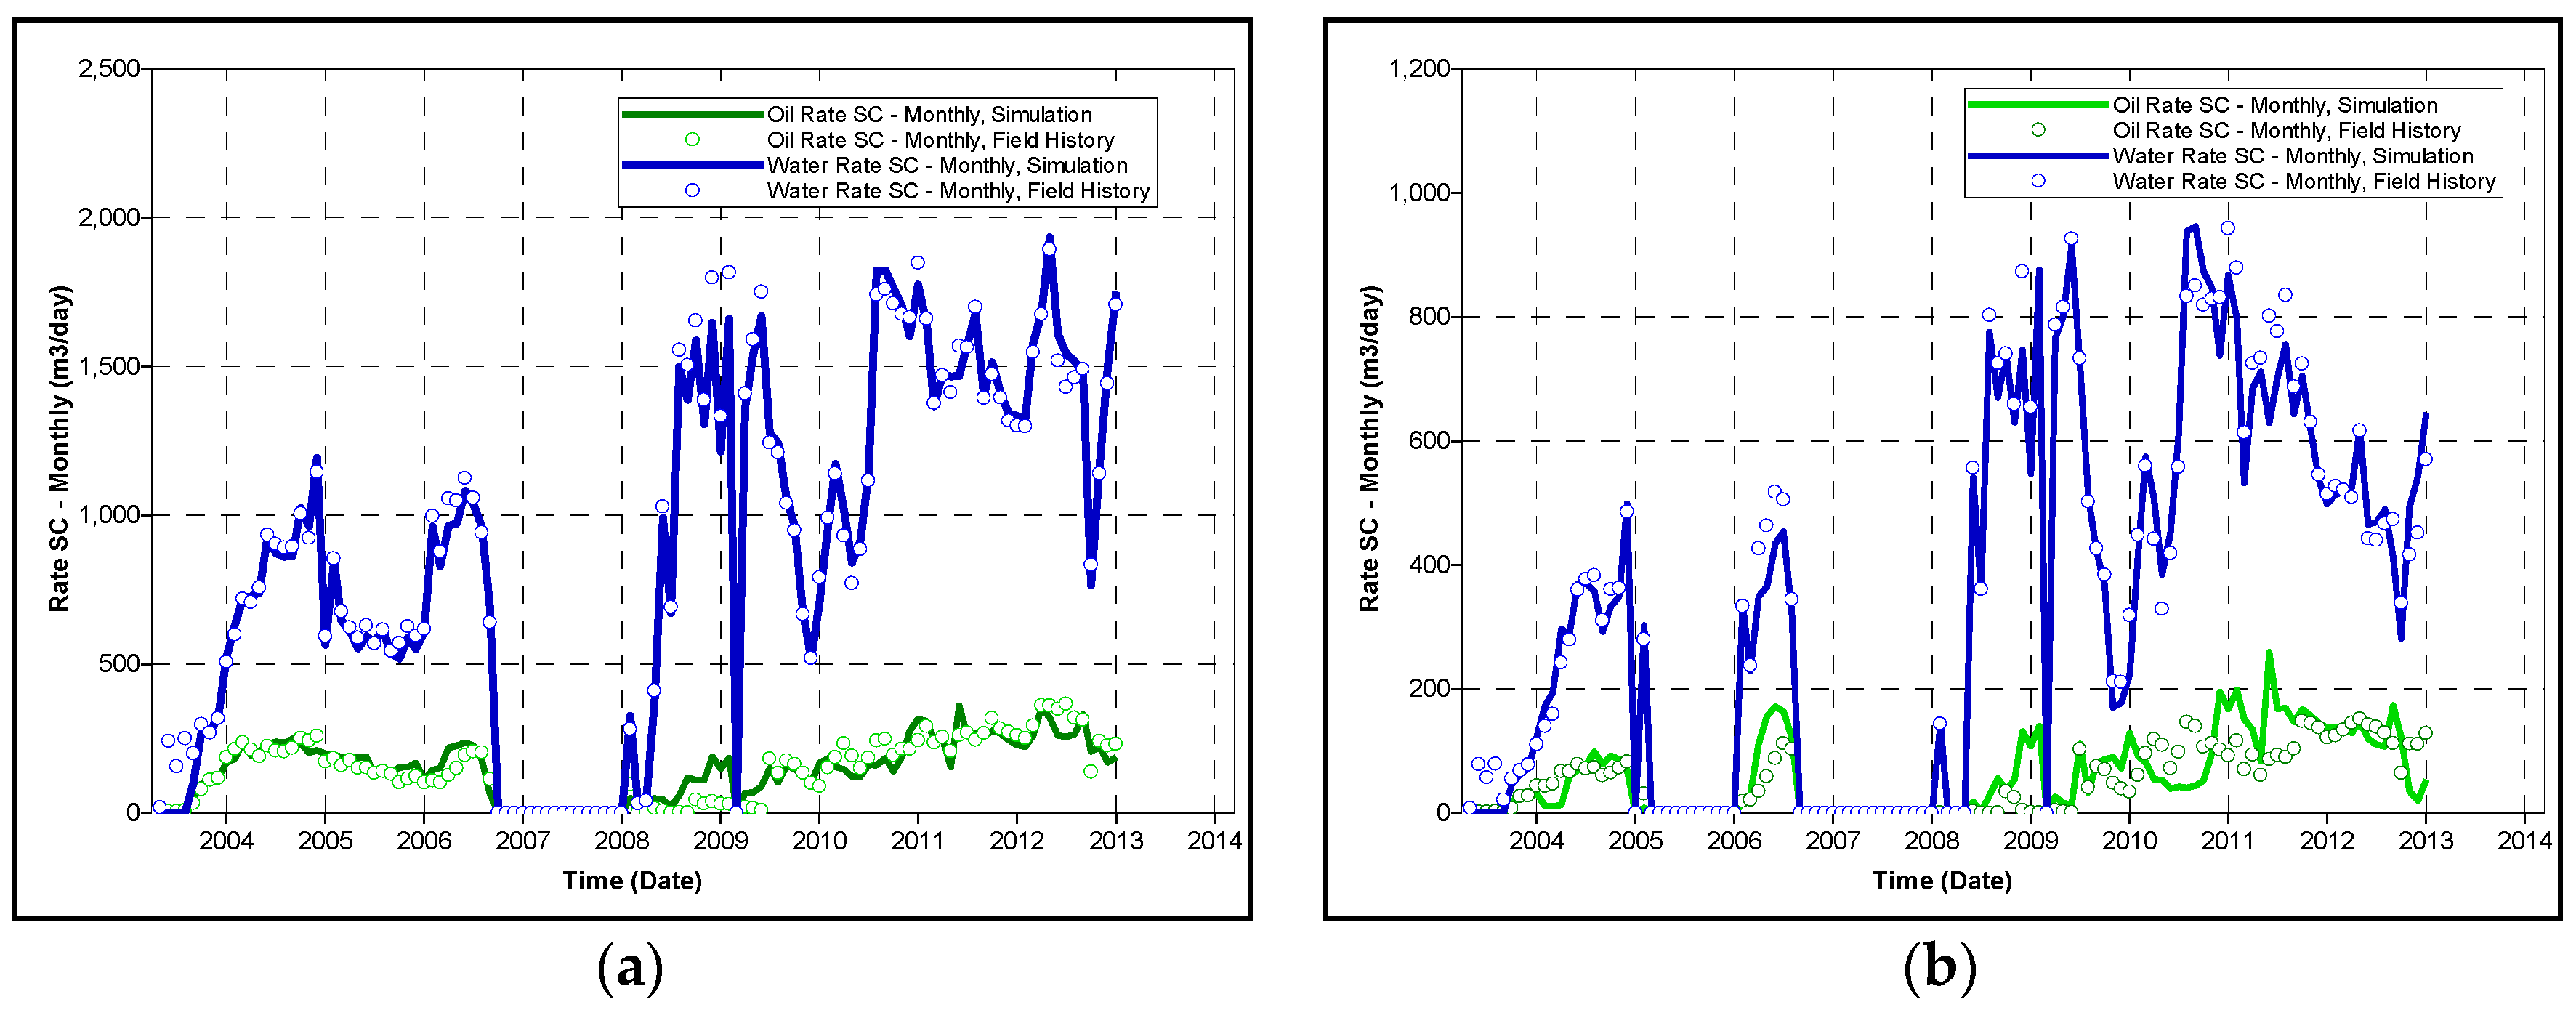

Figure 13.
Distribution of lean zones: (a) 3D view; (b) 2D view.

Figure 14.
Effects of lean zones on steam chamber and steam-oil ratio: (a) 2D view of steam chamber; (b) relationship between steam-oil ratio and time.
Figure 14.
Effects of lean zones on steam chamber and steam-oil ratio: (a) 2D view of steam chamber; (b) relationship between steam-oil ratio and time.

Figure 15.
Comparison between the hybrid CSS/SAGD method and conventional SAGD method: (a) relationship between cumulative SOR and time for hybrid CSS/SAGD and conventional SAGD processes; (b) relationship between cumulative oil production and time for hybrid CSS/SAGD and conventional SAGD processes.
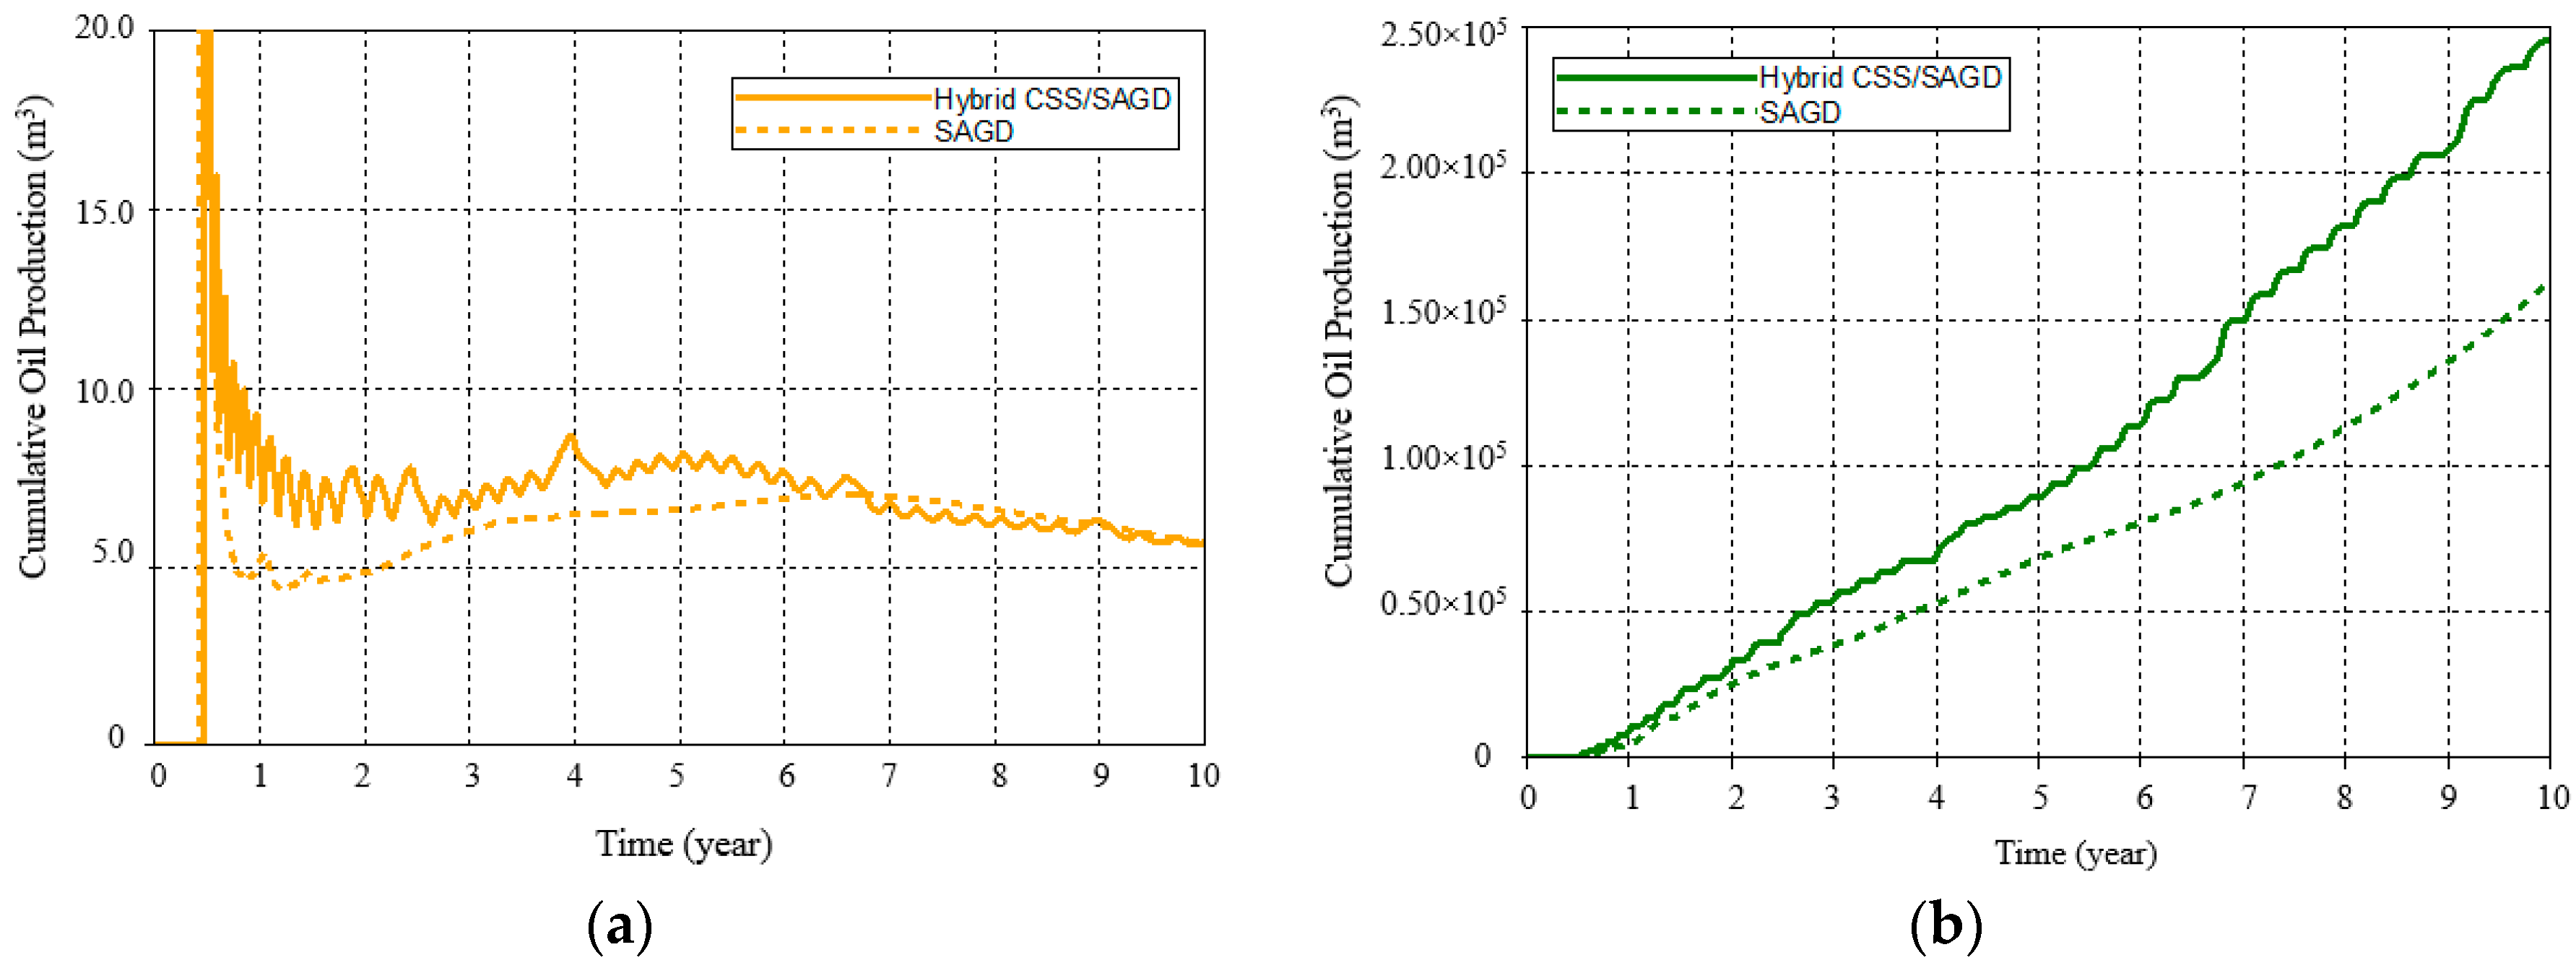
Figure 16.
Change of the average pressure and pore volume during the hybrid CSS/SAGD process: (a) relationship between pressure, oil rate and time; (b) relationship between pore volume, oil rate and time.
Figure 16.
Change of the average pressure and pore volume during the hybrid CSS/SAGD process: (a) relationship between pressure, oil rate and time; (b) relationship between pore volume, oil rate and time.
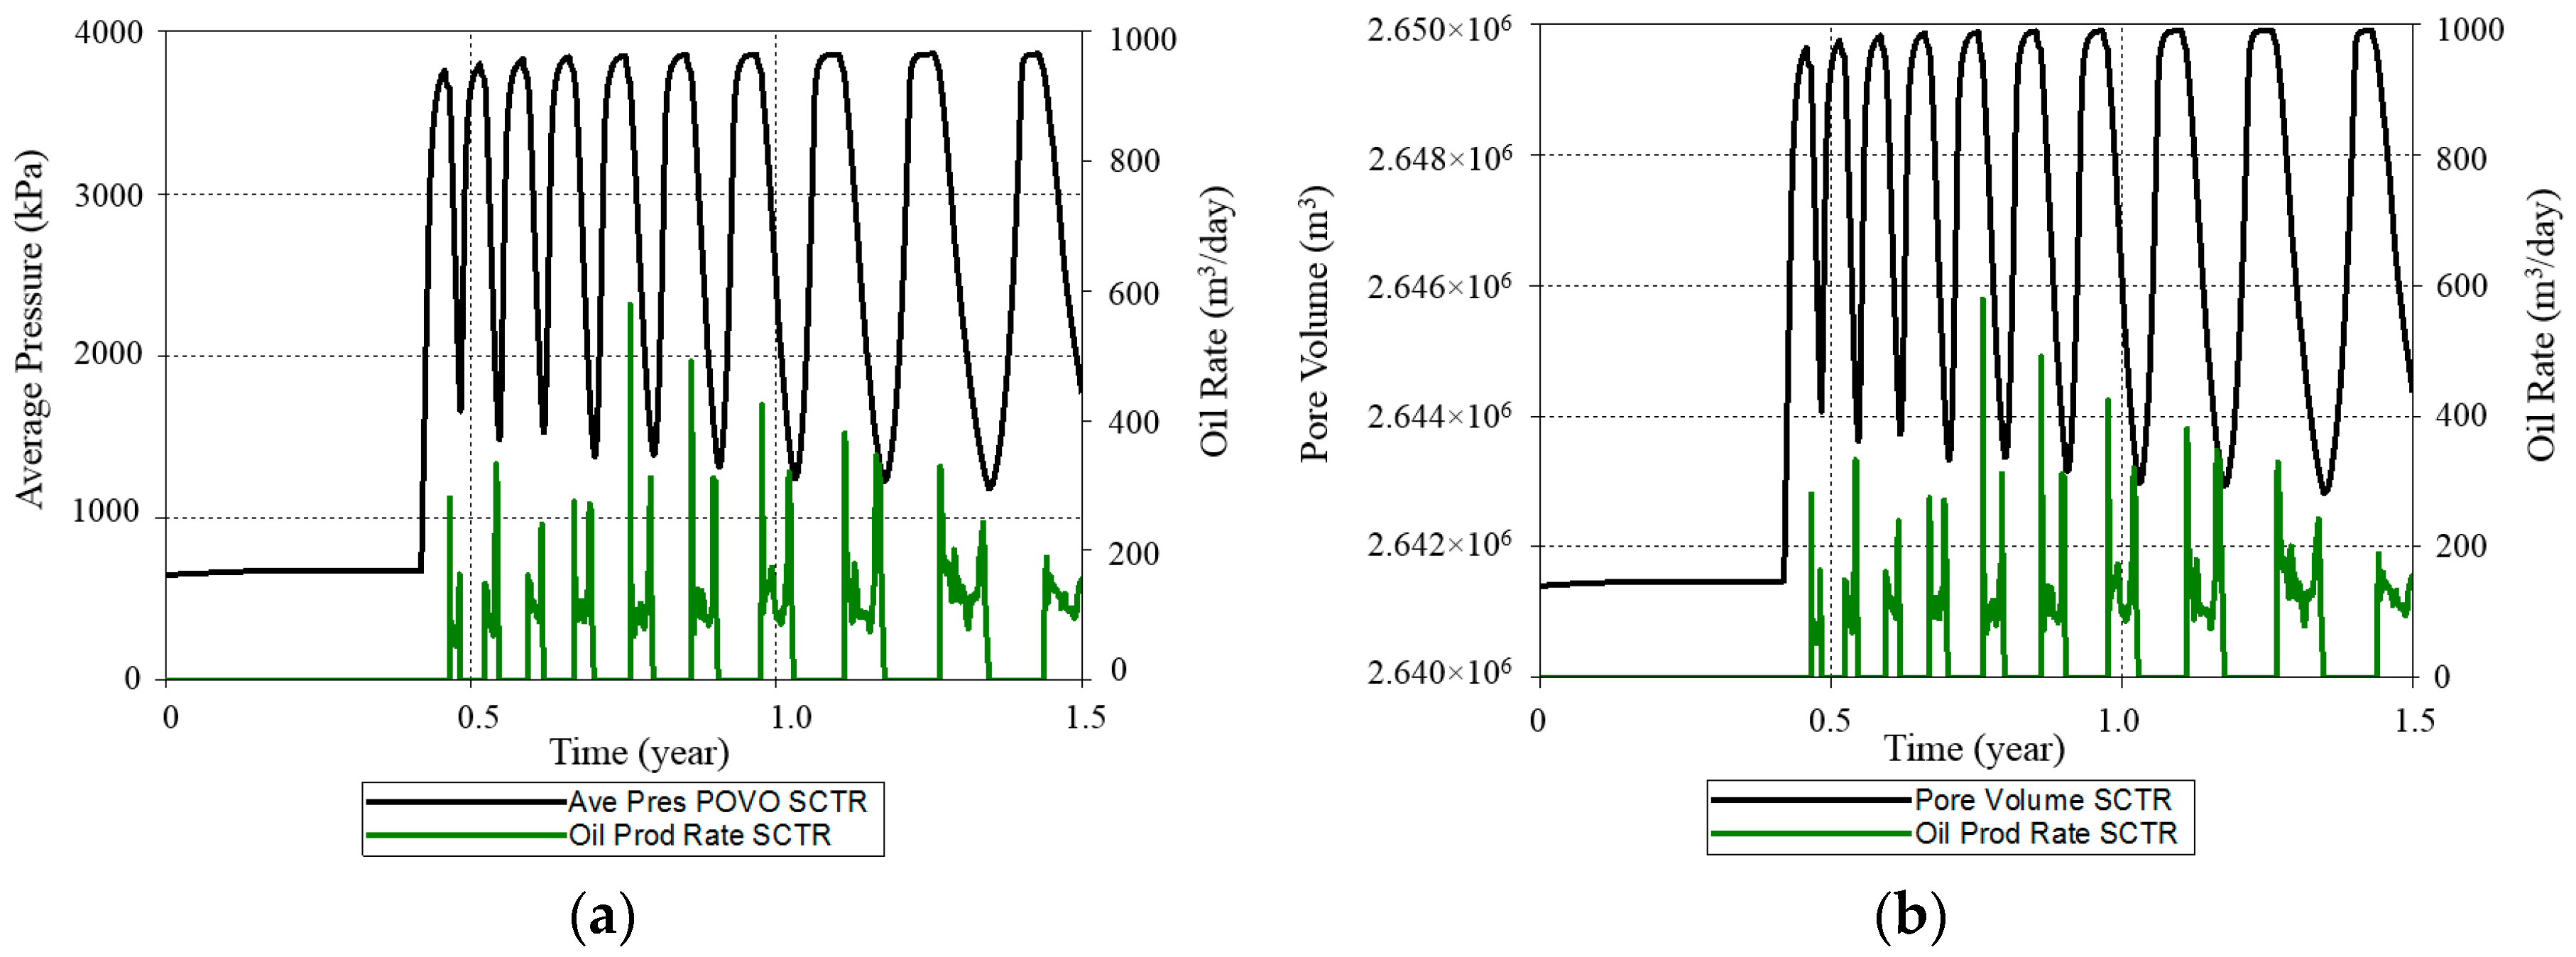
Figure 17.
Steam chamber during the production with oil flow vector.


Table 1.
Basic reservoir parameters in the Long Lake.
| Parameters | Value |
|---|---|
| Reservoir Pressure, kPa | 1050 |
| Depth of Grid Top, m | 230 |
| Reservoir Temperature, °C | 7 |
| Porosity | 0.307 |
| Horizontal Permeability, mD | 6292 |
| Vertical Permeability, mD | 4892 |
| Connate Water Saturation | 0.25 |
Table 2.
Average injection pressure (kPa).
| Phase | Pair 1 | Pair 2 | Pair 3 |
|---|---|---|---|
| Phase 1 (Year 2003–2008) | 1280 | 1340 | 1490 |
| Phase 2 (Year 2009–2013) | 1670 | 1620 | 1530 |
© 2017 by the authors. Licensee MDPI, Basel, Switzerland. This article is an open access article distributed under the terms and conditions of the Creative Commons Attribution (CC BY) license (http://creativecommons.org/licenses/by/4.0/).
Share and Cite
MDPI and ACS Style
Xu, J.; Chen, Z.; Dong, X.; Zhou, W. Effects of Lean Zones on Steam-Assisted Gravity Drainage Performance. Energies 2017, 10, 471. https://doi.org/10.3390/en10040471
AMA Style
Xu J, Chen Z, Dong X, Zhou W. Effects of Lean Zones on Steam-Assisted Gravity Drainage Performance. Energies. 2017; 10(4):471. https://doi.org/10.3390/en10040471
Chicago/Turabian StyleXu, Jinze, Zhangxin Chen, Xiaohu Dong, and Wei Zhou. 2017. "Effects of Lean Zones on Steam-Assisted Gravity Drainage Performance" Energies 10, no. 4: 471. https://doi.org/10.3390/en10040471
Note that from the first issue of 2016, this journal uses article numbers instead of page numbers. See further details here.