Article

The Role of Logistics in Practical Levelized Cost of Energy Reduction Implementation and Government Sponsored Cost Reduction Studies: Day and Night in Offshore Wind Operations and Maintenance Logistics

by
Thomas Poulsen
1,*,
Charlotte Bay Hasager
2 and
Christian Munk Jensen
3
1
Department of Mechanical and Manufacturing Engineering, Aalborg University, A.C. Meyers Vænge 15, 2450 Copenhagen SV, Denmark
2
Department of Wind Energy, Technical University of Denmark, Risø Campus, Frederiksborgvej 399, 4000 Roskilde, Denmark
3
Offshoreenergy.dk, Dokvej 3, 6700 Esbjerg, Denmark
*
Author to whom correspondence should be addressed.
Energies 2017, 10(4), 464; https://doi.org/10.3390/en10040464
Submission received: 11 February 2017 / Revised: 24 March 2017 / Accepted: 28 March 2017 / Published: 2 April 2017
(This article belongs to the Section L: Energy Sources)

Abstract

:
This paper reveals that logistics make up at least 17% of annual operational expenditure costs for offshore wind farms. Annual operational expenditure is found to vary by a factor of 9.5, making its share of levelized cost of energy for offshore wind range from 13% to 57%. These are key findings of a 20-month research project targeting cost reduction initiatives for offshore wind systems. The findings reveal that cost-out measures are difficult to implement due to cultural differences. Implementation efforts are rendered by personnel located offshore in a harsh sea environment which is in stark contrast to the shore-based office personnel who develop studies directing cost reduction efforts. This paper details the company motivation to join industry-wide cost reduction initiatives. A business case for offshore wind operations and maintenance logistics yielding 1% savings in levelized cost of energy is included on how to expand working hours from daytime to also work at night.

1. Introduction

In this paper, new research is presented which indicates that the often government sponsored levelized cost of energy (LCoE) policy studies for offshore wind cost reductions [1,2,3] are hard for industry practitioners to understand, let alone implement. The research indicates that operational expenditure (OpEx) is the cost component within wind farm LCoE calculations that represents the single most significant variance in different studies and reports. This OpEx variance has a big impact on the overall project LCoE as OpEx is a recurring cost item during the 20–25 year operational phase of an offshore wind farm (OWF). Operations and maintenance (O&M) costs make up approx. 50% of offshore wind OpEx and the research findings presented in this paper show that logistics makes up at least 34% of O&M costs and consequently at least 17% of OpEx costs. Logistics is therefore a key cost factor which deserves more focus at a policy level, in academia, and from practitioners.
The research findings include an analysis of eleven LCoE cost-related studies and reports which are made, often at the request of, and with funding from, governments, in order to help the subsidized offshore wind energy industry focus on reducing costs to make wind competitive compared to other energy forms [4,5,6]. Although extensive experience has been amassed since the first wind turbines were erected offshore in the early 1990s in Europe, installing and operating wind power plants in the ocean is no easy task and the pivotal role of shipping and logistics is exacerbated offshore compared to similar operations when performed on land [6]. The analysis of the eleven LCoE cost-related studies and reports examined in combination with the actual learnings from the parallel case study efforts make this research unique and novel. This research provides the most in-depth analysis of LCoE cost-related studies and reports hitherto, the research couples the analysis of the LCoE related studies and reports with a practical cost-out case study angle for the first time, and through a detailed logistics analysis the research presented in this paper illuminates some of the challenges which make offshore wind cost calculations very difficult to compare as well as contrast.
The research design is based on the findings from active participation in a 20-month industry practitioner focused offshore wind LCoE cost reduction initiative in Denmark [7] which serves as the practitioner case study part of this research. The offshore wind industry LCoE cost reduction initiative case study is being facilitated by a Danish not-for-profit and non-government offshore industry member association, Offshoreenergy.dk (OE). OE is a national cluster organization and innovation network for the offshore industry in Denmark [8]. As part of the research project, and the case study developed within the actual cost reduction initiative, a group of offshore wind energy related companies voluntarily got together during 2014–2017 via OE. The companies met from August 2014 to jointly work on implementable cost-out initiatives for the offshore wind industry and it was felt that it was justified to join the initiative as the learning institution representative. By December of 2014, a total of five work streams for potential cost reductions had been selected by the industry practitioners, using the Danish 400 mega-Watt (MW) Anholt OWF as a baseline case [9]. Logistics emerged as a significant theme from practitioners to wish to focus on and as such, 3 of the five work streams had to do with logistics.
In the following, one of the business cases actually developed from the practitioner case study will be presented in detail in order to demonstrate a tangible roadmap from desktop and shore-based government sponsored LCoE studies to practical offshore implementation at a company level. As part of the analysis of the business case, the case study research findings are presented in terms of the reasoning and motivation on the part of the companies for joining this cross-industry initiative. Inherently built-in cultural difficulties will be presented because the research unveiled that such differences exist between shore-based offshore wind personnel and personnel operating offshore or at operational sites in ports to actually execute and implement the cost savings. Findings from the case study will be presented regarding benefits and disadvantages caused by assets and skilled personnel moving from the offshore oil and gas (O&G) industry, often referred to as the petroleum industry in academic contexts, see e.g., [10], to the offshore wind logistics industry.
Throughout the case study efforts, LCoE savings were encountered for offshore wind expressed as a percentage by different company representatives. As company representatives were questioned in more detail and the topic researched further from a perspective of what the cost savings share was indeed measured as a percentage of, significant ambiguity was found in the unit of analysis applied by practitioners, consultancies, government studies, and organizations alike. Challenges existed with the assumptions, calculation process, and methodology behind the different studies and reports providing the basis for the calculations. Consensus did not exist on how to calculate savings due to many different methodologies being used which individually seemed to make sense but do not leave room for comparison. Findings are therefore presented on what causes the annual OpEx component of LCoE cost calculations for offshore wind to vary by up to a factor 9.5 in government funded LCoE studies. Being only one of four cost components in the LCoE calculation [11], the research indicates that the relative OpEx share of total LCoE may vary from 13% to 57% over the life-cycle of an OWF project as a result of the variance within OpEx itself. Finally, research findings are presented which indicate that logistics makes up at least 17% of OpEx costs but could make up as much as 32% depending on how individual cost items are measured and described.
The geopolitical case study context is that of the oil price dropping to a level of United States Dollars (USD) 22.48 per barrel in January 2016 compared to its June 2014 high of USD 110.48 [12]. This has caused distortion in the O&G industry [13]. Because of the fuel component of LCoE calculations [14], oil-generated energy has therefore become relatively cheaper making the journey for offshore wind to reach parity with fossil fuels even steeper [5]. Significant job creation is expected within the offshore wind industry over the coming years [15] and some of the world’s largest fossil fuel companies are now seen to be implementing strategies to actively “diversify into low-carbon energy” [16,17,18] with wind as a strong contender based on e.g., resource efficiency [19]. Idle O&G assets and personnel are seeking deployment in the offshore wind logistics arena which may lead to lower costs and increased industry maturity within wind O&M logistics [20]. Irrespective of the possible contribution from the O&G context (e.g., learnings from O&G in the Gulf of Mexico described by Kaiser and Snyder [21] which could be applied to offshore wind in the North Sea), it is critical for further diffusion of offshore wind as an important renewable energy technology that it becomes cost competitive with other energy forms in terms of comparable LCoE [22]. This ought primarily to be done through cost reductions made by the offshore wind industry itself and with logistics accounting for at least 18% of LCoE within offshore wind [22] according to the definition of offshore wind logistics [22], the area of logistics as researched for the offshore wind O&M life-cycle phase in this paper represents a major cost reduction opportunity. The real-life industry-wide OE project in Denmark is an interesting academic research project and several key reasons served as the motivation to get involved:
  • Going it, it was estimated that this particular industry practitioner initiative had a good chance to succeed in producing tangible cost-out initiatives due to the relatively narrow scope of O&M logistics.
  • It was important to craft a research design which could actively contribute to the steering of the government sponsored and policy level cost-out studies/reports towards a practical trajectory which may actually be implemented by companies in real life, onshore as well as offshore.
  • A strong desire existed academically to obtain information about O&M logistics from the participating companies and in return contribute with a scholarly perspective to the industry practitioner dialogue and process.
Geopolitically, the journey towards a wind energy electricity source being competitive in its’ own right, compared to other energy sources [5], has been made more challenging as a result of the drop in the oil prices. At the time when the practitioner case study opportunity emerged, the need for cost reductions within offshore wind had therefore become even more pronounced which was the final academic justification to get actively involved.
In the next section, the research questions, the key academic terms, and an introduction to the case study will be presented. In Section 3, the results of the case study will be presented followed by Section 4 with the discussion. To conclude, Section 5 sums up the findings and provides input for further research within the area of O&M logistics and LCoE reductions for offshore wind.

2. Research Objectives, Academic Definitions, and Case Study Introduction

Measured in comparable LCoE, offshore wind is not competitive with other energy sources [5], with other renewable energy forms [23], nor can offshore wind projects survive without government subsidies [5,6,7,24]. Proponents of offshore wind argue that other factors should be considered when evaluating whether to continue offshore wind diffusion. Such factors include job creation [15], CO2 emission cost avoidance [25], low offshore wind subsidy levels compared to subsidies for dark energy technologies such as coal [5], [26] (p. 7), and the issue of avoiding to take up scarce land areas onshore [27]. Conversely, opponents of offshore wind diffusion argue that animal life is disturbed, that near-shore offshore wind turbines distort the view of humans, that wind power production cannot be stored, that the grid cannot handle an energy form which is intermittently on/off, and that the subsidy levels are too costly for tax payers.
When comparing LCoE across different energy sources [5], renewable energy forms do not depend on a particular type of fuel to generate electricity and heat [28]. Traditional fossil fuel based energy sources such as coal, oil, and gas do depend on fuel. For fossil fuels, the fuel itself therefore makes up a large portion of the LCoE life-time calculation for these energy forms. Within the European Union (EU), most energy research and development funding is by far directed into nuclear fission while offshore wind receives the least attention and funding [5]. Within the EU, fossil fuels such as coal enjoy far more government subsidies than renewables such as offshore wind [5]. Globally, fossil fuel subsidy levels stood at USD 490 billion against renewables of USD 135 billion in 2014 [26] (p. 7), [29]. Wind power was furthermore found to be the only power source not presenting a security risk to the EU [30] which is important from a geopolitical perspective.
Government studies of LCoE for offshore wind in Denmark [31], the United Kingdom [1], Germany [2], and across industry coupled with academia [3] provide definitions of LCoE for offshore wind and create break-downs of the end-to-end life-cycle cost composition of an OWF [22]. Consultancies [16,32,33,34] and different wind energy associations [15,35,36,37] provide historical data on actual offshore wind diffusion along with scenarios for deployment and costs going forward as forecasts until 2020, 2025, 2030, and 2050. Especially the government LCoE studies for offshore wind also point to possible areas of potential cost reduction opportunities. The government LCoE studies are often made with extensive input from industry practitioner representatives [1,2].

2.1. Research Objectives

From a supply chain perspective, an OWF can be divided into four distinctively different life-cycle phases, i.e., Development & Consent, Installation & Commissioning, Operations & Maintenance, and Decommissioning [7,38]. Logistics makes up a significant portion of the cost of each of these four life-cycle phases and is often embedded or hidden in other cost items not captured by current LCoE models [22], let alone the O&M life-cycle phase with downstream implications (e.g., to failure mode and effects analysis [39]). This paper presents an in-depth review of logistics aspects of the O&M life-cycle phase. The O&M phase starts [40] (p. 4) when the construction of the OWF has been completed including full commissioning of the different wind turbines and offshore sub-station as well as grid connection [7,38]. Typically, the OWF can operate for 20–25 years before it needs to be decommissioned including site abandonment/restoration [1,2,41]. The annual OpEx costs to manage, administer, insure, operate, inspect, maintain, repair, and make replacements within the OWF are included in the LCoE calculations. Within the OpEx calculations, the logistics cost component had qualitatively been estimated at 26% by the world’s leading OWF operator [22]. From this point of departure, this research project was conducted with the following upfront propositions and motivations:
(a)
Major LCoE models and cost reduction initiatives for offshore wind [31] (pp. 1–3) are crafted by a certain type of people, organizations, and companies. These more conceptual studies have a certain audience and are generally characterized by a high degree of complexity, rigor, and financial backing. Is it indeed feasible for the industry practitioners to implement the identified LCoE savings opportunities from these government LCoE studies?
(b)
The harsh sea environment within offshore wind is not native for offshore wind inasmuch as wind turbines were first put up on land and subsequently moved into the sea. Do cultural differences exist between shore-based personnel creating the government LCoE studies and the offshore personnel of the industry practitioners required to implement many of the actual cost-out savings needed for LCoE to factually decrease?
(c)
The major government sponsored LCoE and cost reduction studies are very broad and cover the entire life-cycle of an OWF. These LCoE studies often involve a vast range of consultancies as well as management level industry practitioners and maintain a somewhat high-level perspective [31] (pp. 1–3). Could a specific life-cycle phase, such as O&M, be examined in detail and generate practically implementable cost-out opportunities that can realistically be implemented by industry practitioners to reduce the cost of offshore wind?

2.2. Offshore Wind Operational Expenditure

A good definition of OpEx within offshore wind has been provided in a study for the UK Renewables Advisory Board [40] (p. 4): OpEx “... includes all expenditure occurring from immediately after point of takeover, whether one-time or recurring, related to the wind farm, measured on an annual basis. Excluded are expenses inherent to the operation of the operators business but not directly related to the operation and management of the wind farm”. OpEx is sometimes referred to as variable costs [35] (p. 45), [42], operating & maintenance costs [43], operating costs [1], operations cost [2], or operation, maintenance, and service costs [44]. OpEx may be broken further down to separate costs between “physical maintenance” and “non-physical services such as insurance” [14]. Some studies include added dimensions such as grid transmission charges and seabed rent [1] whereas others point out that present calculation regimes do not include key parameters such as lost revenues due to downtime caused by ineffective operations [45] (p. 365) or logistical factors such as weather windows and vessel availability [46] (p. 5).
From an accounting point of view, the recurring operating costs (OpEx) of a project are deducted from the income in the profit/loss statement of the project on an annual basis. Conversely, the initial capital costs (CapEx) of a project are put on the balance sheet of the project when incurred and subsequently depreciated. Cash flows and profitability are therefore treated very differently accounting wise [47] (p. 119). To be able to understand the value of any project at the time of making the investment decision, the corporate finance perspective prescribes that net of the future revenues less the future costs is discounted back to the time of making the investment decision using a discount factor often referred to as the weighted average cost of capital (WACC). CapEx and OpEx are therefore important terms to fully understand when making investment decisions [47] (p. 121).
As a phenomenon, LCoE focuses on the cost aspect of some of these same accounting and corporate finance terms [1] (p. vii) and as also described by Poulsen and Hasager [22]. The goal of the LCoE measure is to be able to compare the lifetime costs by electricity output unit of different energy producing plant types (for a good example of how to compare costs, see for example Namovicz [
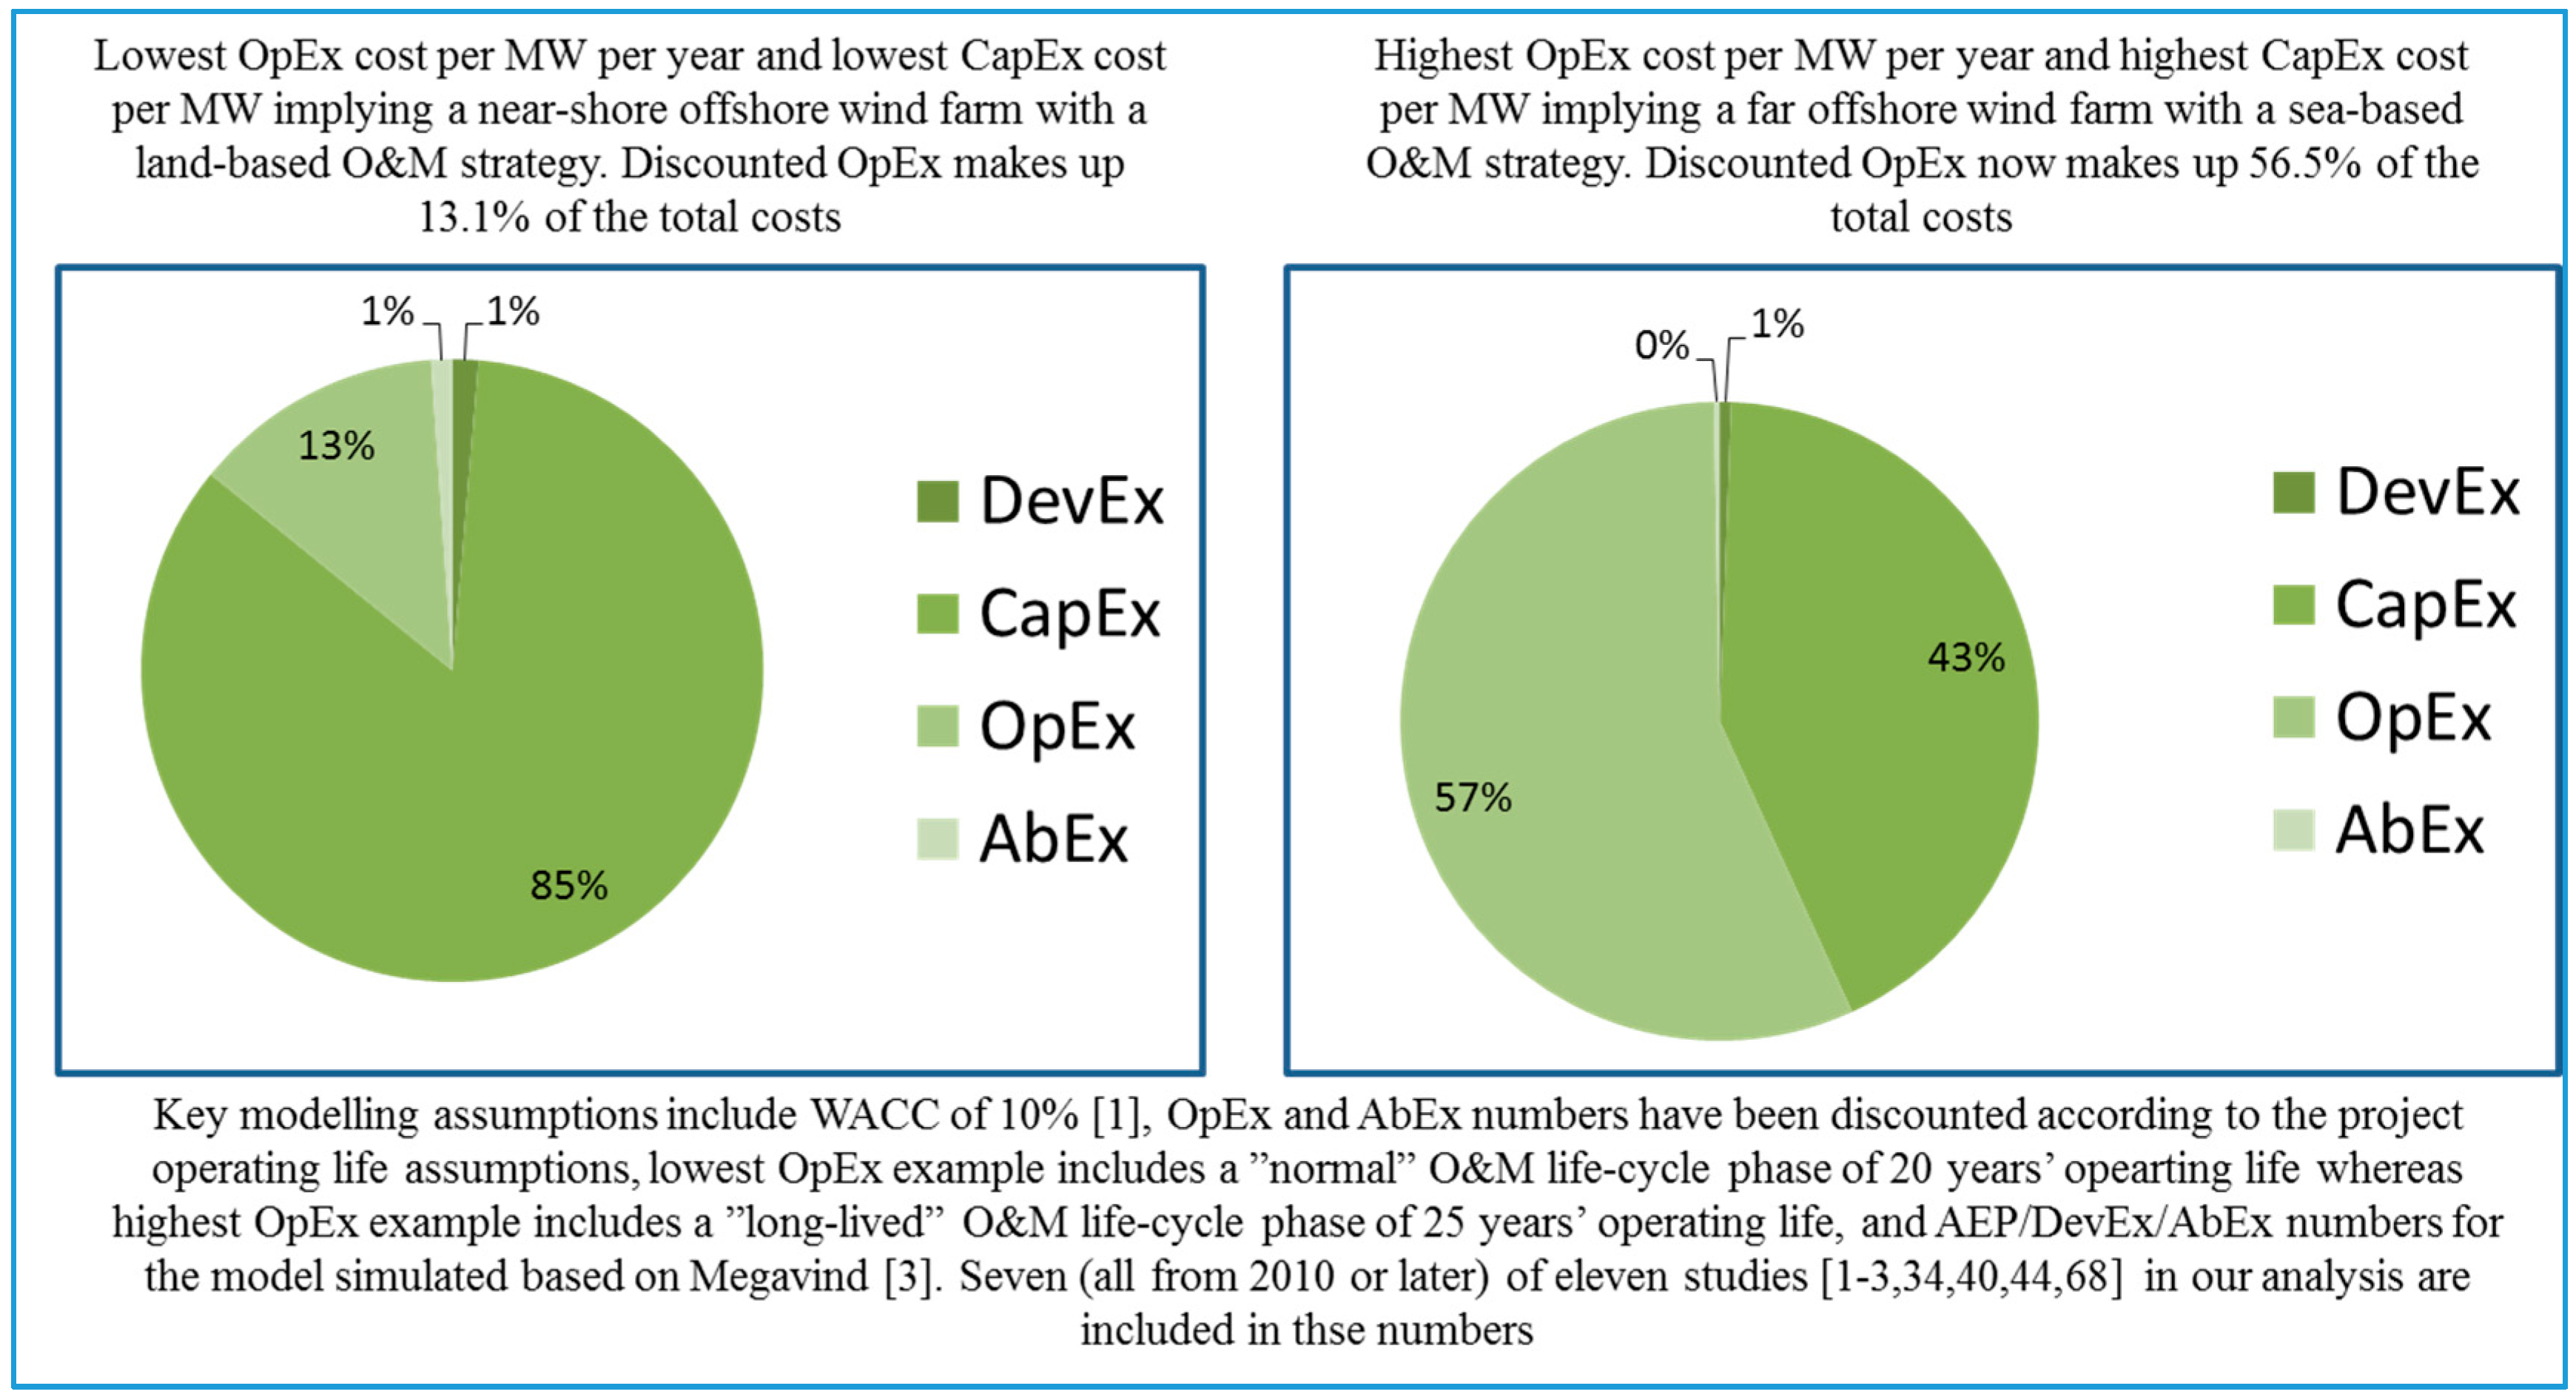
48]). According to the Megavind [3] LCoE calculator, development expenditure (DevEx), CapEx, OpEx, and site abandonment expenditure (AbEx)/decommissioning costs make up the cost factors used in LCoE calculations for offshore wind. From the research presented in this paper, OpEx is the LCoE cost component with the single most variance between different studies, reports, and calculations. This variance has a big impact on the overall project LCoE as OpEx will incur during each year of operations over the entire O&M life-cycle phase of the project which is usually 20–25 years for offshore wind.

2.3. Offshore Wind Operations and Maintenance

Originally, maintenance as a concept can be traced back to work performed by craftsmen before the Industrial Revolution. Later in history, Admiral Nelson’s flagship, HMS Victory, was carefully maintained to an extent where almost all of her parts were replaced more than one time. The HMS Victory used timber corresponding to some 40 hectares of wood meaning that the effort to fell this wood, ready the timber, and ultimately replace it made the vessel a very valuable asset worthy of the expansive maintenance [49]. A review of maintenance history and maintenance management literature based on a number of books published and extensive consulting efforts on the topic was presented in London and cited by many [50]. Another study concluded that the concept of maintenance has evolved through four phases from being “a necessary evil”, to internal company focused “technical specialization”, through to being a “profit contributor”, to finally becoming partnership driven with “positive cooperation” [51].
An early O&M example from the military context was the need for having US airplanes operational at all times for air combat during World War II which required intensive maintenance and repair (M&R) after completed missions in order to get the planes airborne again as soon as possible. The detailed need for such M&R efforts had to be balanced by researchers considering that the war time life-cycle of the airplanes was short and that “major parts” would therefore not need maintenance [52]. M&R understood as “maintenance & repair” is often used as a separate academic theory stream in different fields such as construction [53] and the electric industry [54]. Competing theory streams use the same abbreviation of “M&R” differently, e.g., maintenance & renewal [55], maintenance & replacement, maintenance & rehabilitation [56].
Within the O&G industry, O&M is often referred to as inspection, maintenance, and repairs (IMR) thus including the inspection function as a means to diagnose the problem at hand [34]. Another commonly used abbreviation [10,57,58] within sub-sea O&G is inspection, repair, and maintenance (IRM). Different theory streams include a wider array of functions such as inspection, repair, maintenance, and replacement (IRMR) in their definition [59]. The different groupings of several lines of thought into different theory streams make literature searches and comparisons of academic literature difficult across industries and one recent literature review found a total of 10 different maintenance management techniques within the many groupings of tasks [60]. Each maintenance management technique is either quantitative or qualitative in nature and each technique such as Total Productive Maintenance (TPM) is described extensively in literature and across different industries (for TPM as an example, please refer to e.g., Nakajima [61] and McKone, Schroeder, and Cua [62]).
O&M for OWFs can be split into four distinctively different generations of evolution according to Petersen [63]: “Run to failure”, “systematic maintenance”, “condition based”, and “failure elimination”. An offshore wind O&M taxonomy built on several sources has been crafted by May [46].

2.4. The Logistics Share of Offshore Wind Operations and Maintenance Costs

The logistics share of OpEx or O&M costs in offshore wind is not clearly defined in literature, nor in various cost reduction/LCoE studies Whereas the offshore wind industry is a young and somewhat immature industry [22,45,64], the topic of logistics within offshore wind O&M academic literature has been covered at operational, tactical, and strategic levels as summarized by Shafiee [65] and operations reviewed from a perspective of the wind turbine generator (WTG) and impact on the grid [66,67]. As determined in a separate study [22], logistics itself was previously not defined for offshore wind nor had a share of LCoE been attributed to logistics. The offshore wind logistics definition of that study [22] (p. 13) encompasses the O&M logistics chain and when prior academic work on OpEx cost shares of LCoE is reviewed as a starting point, it was concluded that several recent and very extensive studies [46] (p. 5), [63] (p. 3) were based on relatively few and quite similar sources. Upon reviewing these sources, it was found that one source [42] based its estimate that OpEx equals 30% of LCoE on a single study on offshore wind from 2007 but was very rich on onshore examples. Another source [68] was rather specific on OpEx cost items but contained a variance between the referenced minimum and maximum monetary values equal to a factor 2.3. Therefore, it was found to be necessary to scope and define what O&M logistics is for OWFs and perform a more detailed study of this phenomenon. This tallied with a prior recommendation for researchers to perform further research in the form of specific quantitative studies of the logistics costs for OWFs [22] (p. 20). In performing such a quantitative study as part of this research, with focus on logistics for the O&M life-cycle phase in particular, a total of eleven studies were analyzed in detail. These particular studies were selected because they had previously been included in related work scopes [1,2], [31] (pp. 1–2), [34] (p. 3), [44], because they were cited by major recent academically related O&M research efforts (such as May [46], Petersen [63], and Brink, Madsen, and Lutz [69]), or because they have been broadly recognized by academicians and/or practitioners to be of major relevance to the offshore wind industry [35,40,68,70,71]. These eleven different studies were performed by and on behalf of different—often government—constituencies from 2007 through 2015 (see Table 1 below for a high-level presentation of the eleven studies). Similar to earlier conclusions by e.g., Blanco [42] (p. 1374) and Dinwoodie et al. [72] (p. 8), it was determined as part of this research that the studies are very different in their fundamental assumptions and methodology including key parameters such as OWF capacity in MW and WTGrating. It was also concluded that none of the studies have a clear logistics definition nor does any single study break down logistics as a separate OpEx/O&M cost item.
The most detailed OpEx cost itemization was found in the study made for Scottish Enterprise and The Crown Estate [68]. In this particular study, OpEx costs have been broken down into 18 different cost items which have been separately described in the study (see Table 5). Following overall logic of other studies for The Crown Estate at that time [1,44,73], costs for a 500 MW OWF with a WTG rating of 6 MW has been modeled by GL Garrad Hassan [68]. Of the 18 cost items, it was possible to attribute five fully to O&M logistics.

2.5. Case study Introduction

Leading OWF developer and operator DONG Energy Wind Power set out to reduce LCoE for offshore wind by 40% in 2020 compared to 2012 costs [22]. This was supported by a number of EU governments [1,2] as well as the EU Commission. In addition, many different initiatives were started by academia [64], practitioners (for example the Cost Reduction Forum of OE which is the practitioner related topic of this paper), and academia in collaboration with practitioners [69] in order to support this goal to reduce cost. DONG Energy Wind Power has committed to delivering the cost reduction targets for two Dutch OWF projects with a rated capacity of 700 MW [74] as construction of these OWFs will be completed by early July 2020 with an option to extend the completion up to no later than July 2021 [75]. Similarly, Swedish utility Vattenfall has committed to delivering the Danish Vesterhav Syd, Vesterhav Nord, and Kriegers Flak OWFs by winning even lower auction bids in Denmark [76].
As an organization, OE is a non-profit cluster organization with members primarily from the small- to medium sized enterprise (SME) segment. OE focuses on offshore and separates between O&G and renewables. Offshore wind is the main activity within renewables for OE. OE is based in Esbjerg, Denmark which is the major European hub port for wind energy. Some of the key goals of OE are to facilitate strategic collaboration to create innovative solutions to promote the Danish offshore industry, to foster internationalization, and to act as an enabler when it comes to funding applications for industry, government, and/learning institution collaboration. To support the offshore wind industry’s attempt to cut costs by 40% in 2020, OE launched the Cost Reduction Forum (CRF) in August, 2014. This was done after extensive consultation with the offshore wind industry based in Denmark and internationally. Whereas each organization consulted felt that they were doing what they could in their own right regarding cost reductions for offshore wind, especially the SME members of OE felt that a lot more tangible results could be achieved if an industry-wide effort spanning all parts of the offshore wind market could be put together. OE set out to do so and in designing the set-up with the companies, it was important for the CRF initiative to have a learning institution representative actively join up and participate in the work process. This was done in the form of a case study [77] with the detailed methodology applied being a combination of student learning project supervision, participant observation, interviews, focus groups, and action research [78,79,80].
From January, 2015 the academic involvement was increased along with the active participation in the leadership of one of the five specific work stream working groups tasked to review potential cost reductions within the area of O&M logistics. Following two series of intensive meetings in the practitioner working group, five specific O&M logistics cost-out initiatives were in different stages of completion by the time academic case study participation was terminated in April 2016 (see Table 2 for an overview of the five cost-out initiatives).
In total, 30 organizations comprised the main CRF member organizations (see Table 3).
From the time the case study coverage was initiated in August 2014 until coverage was terminated in April 2016, a total of 3 CRF meetings had been conducted as follows:
  • 25 August 2014: Inaugural meeting and kick-off. Through a focus group set-up, rules of engagement established and the Anholt OWF chosen as a “base case” scenario to work from and ensure focus on tangible results [9].
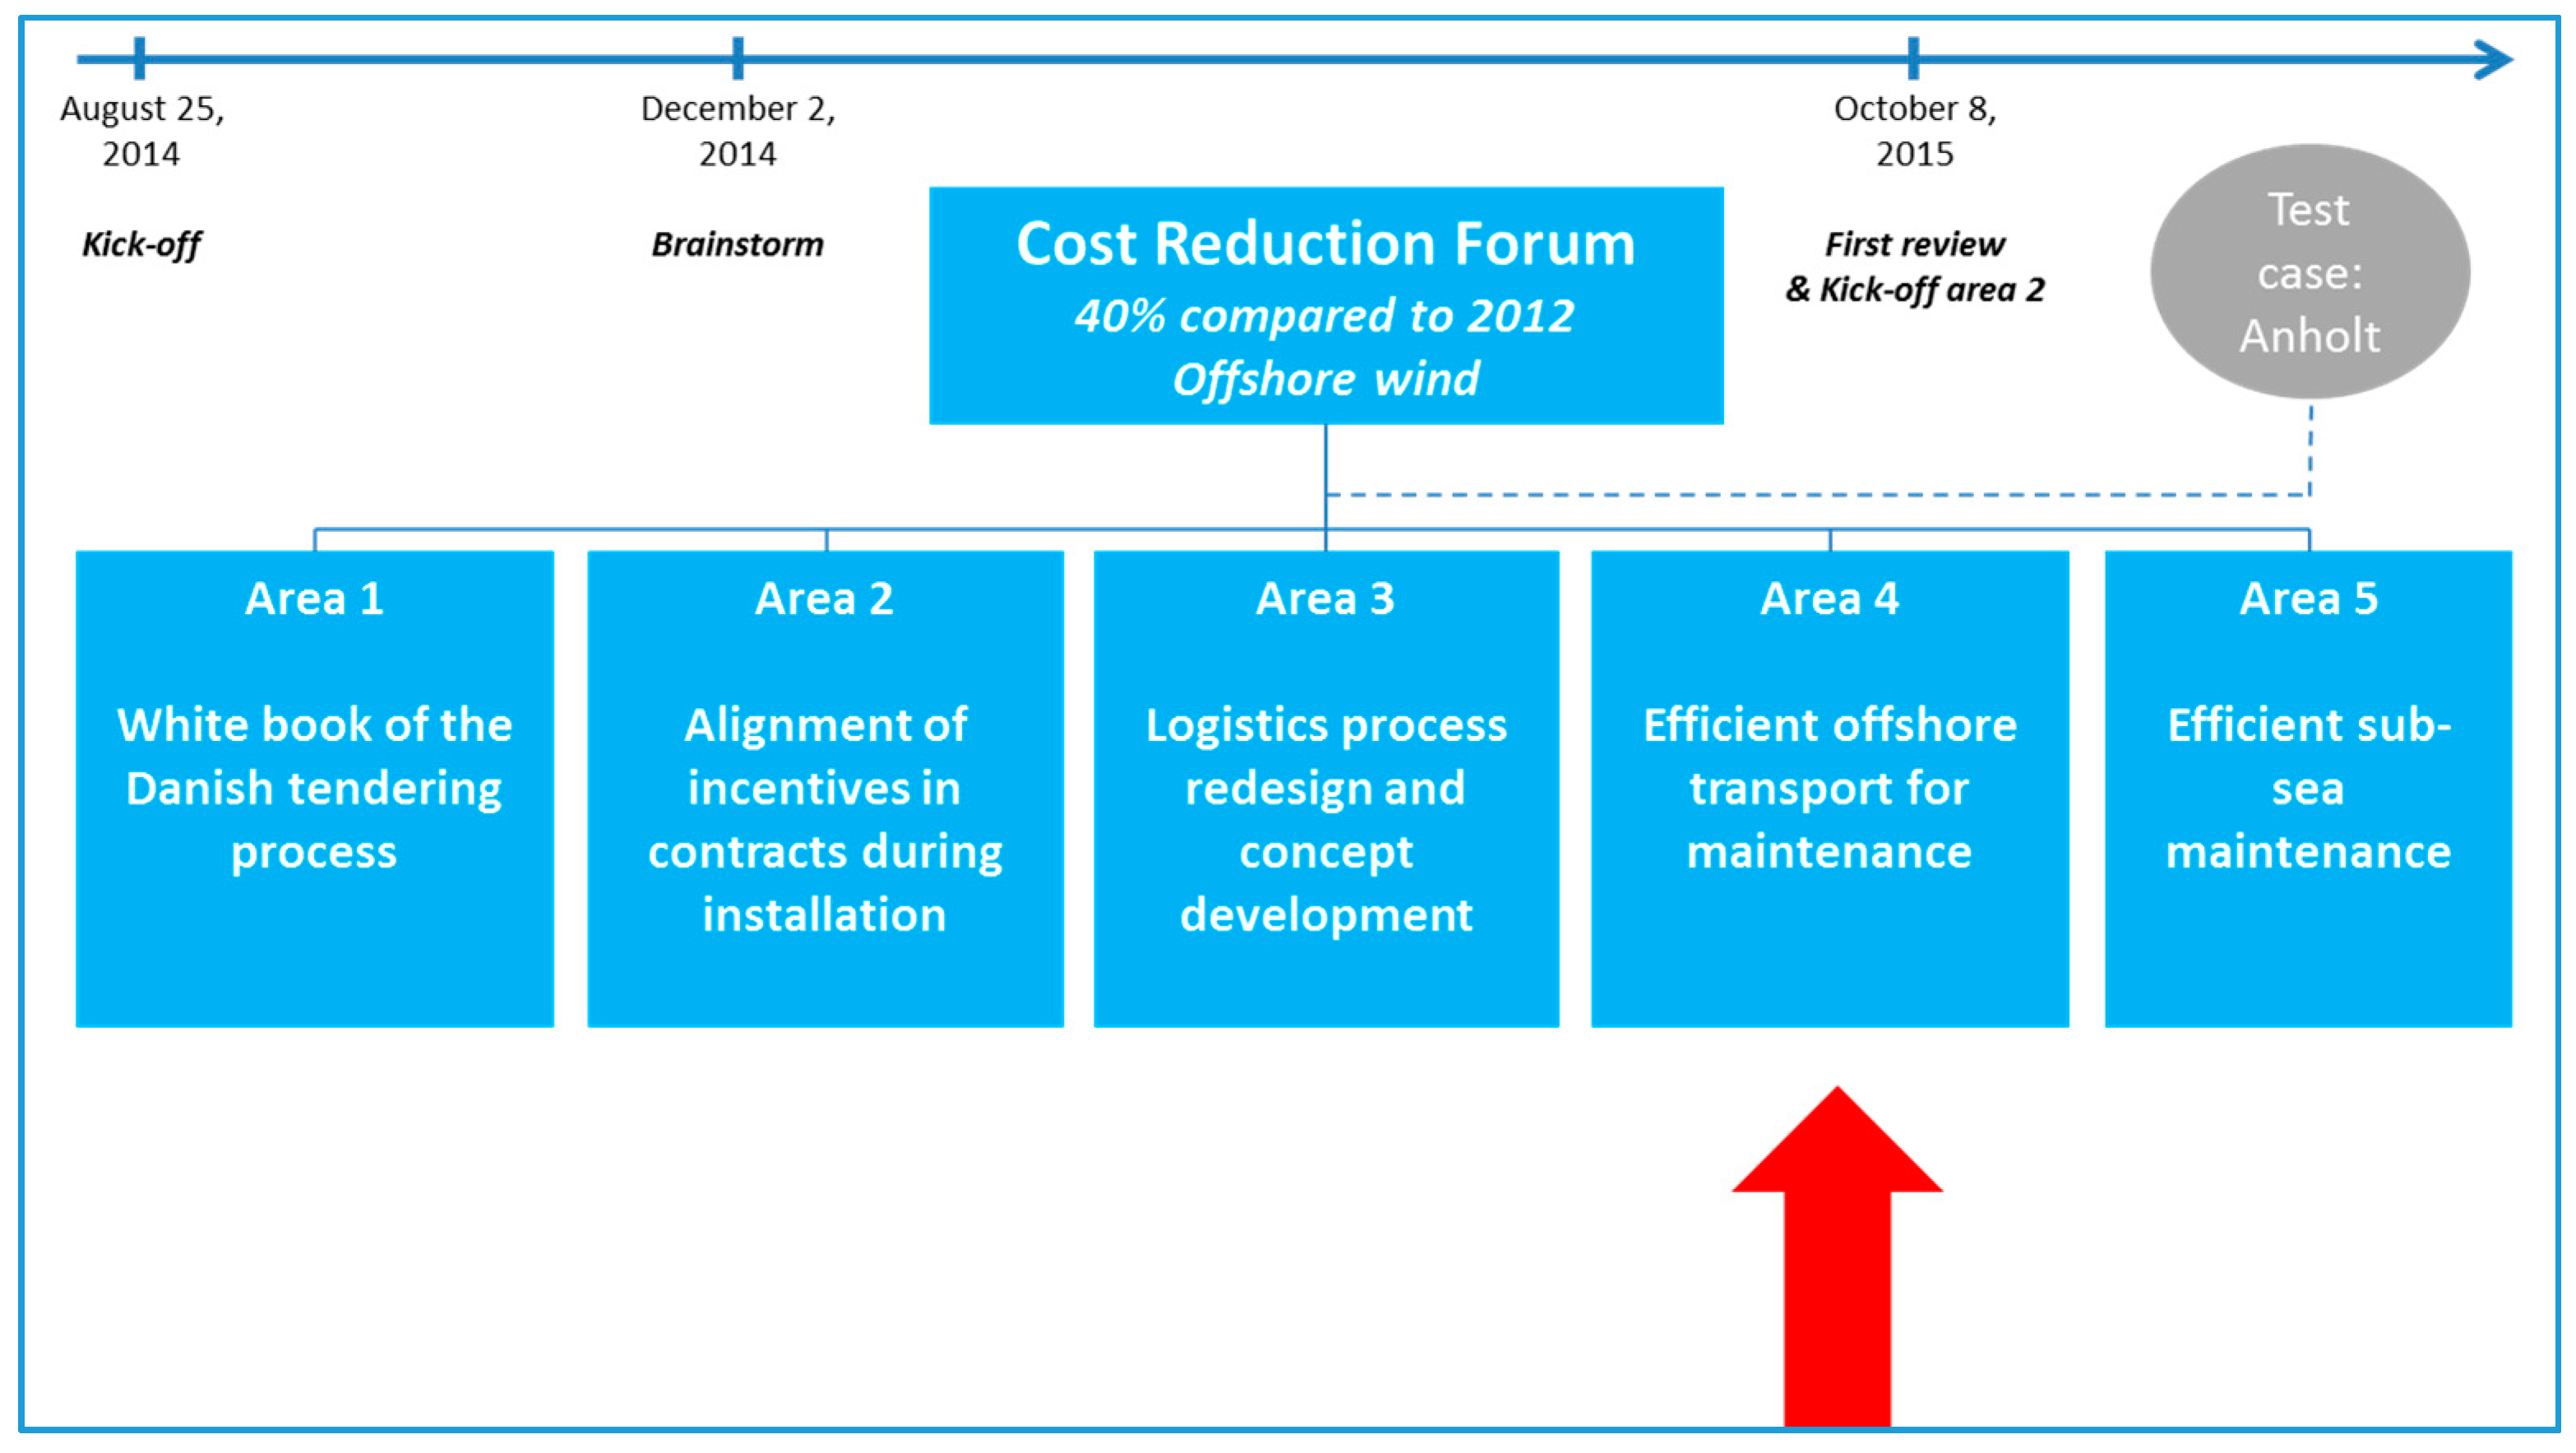
  • 2 December 2014: Brainstorm meeting. The 30 participating organizations could attend an OE facilitated focus group session. The focus group session led to the establishment of five different working groups, each dealing with a single focus area on behalf of the CRF (see Figure 1).
  • 8 October 2015: Progress review meeting. Progress from the working groups engaged with the five different focus areas was reported back to the CRF forum. Only working group 4 on O&M logistics (the group included in this paper) had made real progress. Other work groups were kicked off including Group 3 which had obtained separate public funding to progress in a more comprehensive manner to review installation and commissioning (I&C) logistics. Figure 1 below outlines the structure of the Cost Reduction Forum compared to the work groups working on the individual areas of possible cost reduction.
The detailed research on potential cost reductions for offshore wind O&M logistics as reported in this paper is a direct result of the decision to actively join the work of CRF Group 4. The research team consisted of two researchers, both members of the CRF group 4 O&M logistics initiative. The Group 4 research design for the first series of meetings to generate cost reduction ideas and business cases was carried out in January and February of 2015 where an initial interview protocol was designed for open-ended semi-structured interviews [79]. During March 2015, coinciding with the European Wind Energy Association (now WindEurope) Offshore Wind 2015 conference in Copenhagen, a total of 18 interviews were carried out. The interview guide was specific in terms of focus on the logistics processes involved in the O&M phase of the OWF life-cycle and ideas for cost reductions. Fourteen of the interviews were carried out face-to-face and four additional interviews carried out by phone. The interviews were summarized in writing with a focus on cost reduction ideas which were highlighted. The initial interview summary interview process yielded a total of 36 cost reduction ideas within the area of O&M logistics which were reviewed by the researchers and further grouped during a workshop focus group.
Effectively, Group 4 had a very narrow O&M logistics focus and as such, it made sense that some of the main CRF member forum organizations took part in the Group 4 work and that particularly knowledgeable subject matter experts were invited to join as well (see Table 4). At the inaugural Group 4 O&M logistics meeting on 13 April 2015, a focus group setting was facilitated by OE to jointly review and qualify the 36 cost reduction ideas and the total number of ideas was increased to 44. The ideas were grouped into five categories and a delimitation session performed where only cost savings ideas from quay side up to and within the OWF site were deemed to be included for the group going forward. The findings from the focus group session were summarized in writing and shared with all participants for comments and edits.
Shortly after the Group 4 kick-off meeting, a follow-up meeting was conducted on 4 May 2015. At this meeting, two more ideas were generated and all ideas prioritized using a funnel technique with several criteria: Impact on LCoE, investment required, time need to implement the idea, alignment with the participating companies’ own strategies, and probability of successful implementation. Three projects were chosen at the meeting for sub-work groups to focus on in detail: How to make the O&M logistics process more lean (the lean sub-group), how to work daytime and at night for preventive maintenance and repair campaigns (the 24/7 sub-group), and how to more objectively evaluate safety. The work performed was again summarized in writing and shared with all focus group participants. The lean and 24/7 sub-groups subsequently gained the most traction and were chosen as the projects to move forward with.
During August 2015, the lean and 24/7 sub-groups each met twice to perform more detailed work on how to practically realize the selected projects, selection of elements to be focused on in a business case, and detailed discussions about business case calculations. These meetings were smaller sub-working group meetings facilitated by OE and were more hands-on and practical in nature. Each meeting was summarized in writing and the results were shared with the participants for comments/edits. The business case documents were also included as they started to take shape from the discussions (mainly Microsoft Excel spreadsheet models). A subsequent online focus group meeting was facilitated by OE and supported by emails in order to jointly review and actively evaluate the results of the work crafted by the two sub-work groups working separately on the lean and 24/7 business cases. Additional focus was put on implementation planning, risk analysis, and an evaluation of the likeliness of the success of each of the projects. The business case documents were updated further and the overall discussions summarized and shared along with the business case documents to all participants.
Three extensive face-to-face business case review meetings were conducted as semi-structured open-ended interviews with selected key players in terms of actual operational knowledge. The three interview participants were carefully hand-picked from the team members of working group 4 based on their perceived ability to evaluate the process of generating the business cases, answer questions to fill in the last remaining assumptions for calculations, and also review the business case calculations themselves. A single interview protocol had been developed for this purpose of final validation and the questions were split between the interviewees.
The final versions of the business cases for lean and 24/7 were presented at the 8 October 2015 CRF meeting where the key CRF member organizations were represented. The progress of Group 4 including the lean and 24/7 business cases caused the main CRF member organizations to express satisfaction with the work efforts rendered thus far. An extended focus group session itself, the CRF forum entered into a review of the work results generated by Group 4 including detailed feed-back and comments to the working group members. A further brainstorming focus session about subsequent and “second series” of group 4 O&M logistics cost reduction ideas took place as part of the 8 October 2015 CRF meeting itself. Already on 26 November 2015, the second series of cost reduction business case working group meetings was kicked off with a focus group meeting to prioritize this new set of O&M logistics cost reduction ideas. More participating organizations had now joined and the meeting was facilitated by OE by splitting the meeting participants in 3 groups working on different methods to prioritize the cost reduction ideas. At this session, three ideas were selected for further focus thus taking the total number of business cases being worked on by Group 4 to a total of five (see Table 2).
Three of the organizations participating in the work efforts of Group 4 never really became actively involved in the detailed work efforts associated with building the business cases. Of the remaining 22 organizations, a total of 26 people were actively engaged and the organizational split was 38% top management, 38% middle management, 19% execution layer, and 4% site layer. In this paper, the 24/7 business case of extending working hours from day to night will be used as the representative example of the work efforts rendered within this practitioner case study.

3. Results

The results from this research are divided into two parts. One part is the empirical findings from the practitioner case study and the other part is the quantitative analysis of eleven LCoE related cost studies. To present the case study findings, a detailed review of one out of a total five business cases has been included in this paper. This approach has been developed with an aim towards exemplifying work done in order to create practically implementable business cases useful for taking costs out of the logistics chain. The selected business case is that of working daytime and at night 24/7 instead of only during daytime. In the work to quantify the savings generated from the different business cases, eleven different LCoE related cost studies for offshore wind were analyzed with the goal to be able to quantify the savings as a percentage of either O&M costs, OpEx, or LCoE in an accurate manner. In doing this quantitative work, the first realization was that the unit of analysis utilized in the various studies differed greatly, e.g., OpEx measured as a percentage of CapEx [34,65], OpEx as a percentage of LCoE measured as a sum of the discounted lifetime electricity output (in MWh) [1], annual OpEx per kWh [35], total OpEx costs as a percentage of total lifetime costs [44], OpEx per MW per year [2], total OpEx costs per year for the OWF [3], or outright costs per OpEx line item [68,71]. One study on behalf of Scottish Enterprise and The Crown Estate concludes in terms of unit of analysis that O&M “… is best considered on a per turbine basis as costs tend to scale most strongly with turbine numbers, rather than per MW of installed capacity” [66]. However, other and more elaborate cross-industry studies on potential cost reductions in the UK [1] and Germany [2] used very complex scenario modeling with different WTG ratings, foundations, distances to shore, water depths, and wind speeds. Both of these studies [1,2] make use of OpEx costs measured by MW per year and on the basis of the complex scenario models providing a more representative view of the reality within offshore wind, it was decided to also utilize the OpEx/MW/year unit of analysis in the following.

3.1. Differences in the Dimensions Used for Calculations

Besides the differences noted in terms of the unit of analysis, it would seem that the different studies have evolved dramatically over time. This learning curve built into the study logic applied can be demonstrated by the different dimensions that have gone into the calculation of LCoE in the different studies. Apart from the macro level country LCoE differences such as whether the offshore sub-station is part of the national country level scope or that of the developer, as reviewed in earlier work [22] (pp. 4–6), a number of other differences in terms of dimensions applied for OpEx became clear from the detailed analysis performed of the eleven studies. Examples of differences in dimensions include:
  • WTG rating determines the number of WTG positions to be operated and maintained. The bigger MW rating of each WTG, the fewer positions to maintain in some scenarios where the OWF concession is based on over OWF MW rating [1]. In other scenarios, the OWF concession is based on an award of a certain number of WTG positions [2] which means that the annual energy production will be higher if the WTG rating is increased. A higher WTG rating means lower LCoE in both studies, however, as new technology is introduced, insurance premiums and the cost of capital (WACC) will increase due to increased project risks.
  • Higher project risks will increase WACC and 1% increase in WACC equals a 6% increase in overall LCoE costs for an OWF [1] (p. ix). The same study cites logistics topics “… installation costs and timings, turbine availability and operating and maintenance costs …” to be the key project risks and WACC influencers.
  • Distance from the OWF to shore significantly affects the overall O&M logistics strategy for the individual OWF. Only later studies [1,2] with different site scenarios are able to distinguish whether the O&M strategy should be land-based (using crew transfer vessels (CTVs) operating daily from a shore base) or sea-based (with fixed platform/floating hotel vessel [floatel]/service operation vessel (SOV) enabling personnel to stay offshore for longer periods of time). The sea-based scenarios are more expensive in both studies.
  • Water depth determines the kind of foundation type to be used [44] and this again determines O&M efforts needed subsea. OWFs further from shore in deeper waters use more expensive foundations [1] that are less proven in terms of technology and therefore more expensive to insure due to increased technological risk which again negatively impacts WACC [2].
  • The initial O&M warranty period for WTGs is contractually paid for as part of the CapEx costs as the WTGs are sold including warranty [40] (p. 5). This creates “… invisible costs covered in the supply chain during warranty periods” [40] (p. 17) which effectively means that OpEx costs are frequently artificially deflated.
  • OpEx costs are not constant over the life-cycle of the OWF. One study for the UK Department of Trade and Investment highlights that “… final costs being higher as the farm comes to its life end and maintainability and reliability issues increase” [70]. Other studies consider that early OWFs need to have their operating life extended as they were designed for a 20-year operational life only. Costs for “repowering” or “end of service life extension” for WTGs [34] or prolonging operating life of WTGs [2] are considerable and have undergone some study also by academia [81]. Some operators consider costs for repowering or prolonging operating life to be outside of the normal realm of O&M costs and one operator treats these types of actions to be refurbishments which are accounted for financially as maintenance projects or maintenance investments [63] (p. 27).
  • One of the studies quantifies that a learning curve will produce cost savings for an operator of an OWF over time [70].
  • LCoE definitions are specific about OpEx and AbEx costs being used in a discounted manner in order to be able to compute the comparable numbers [1,2,3]. Some studies do, however, make use of undiscounted OpEx numbers [44] (p. 11).
Last but not least, the studies use the terminologies O&M and OpEx intermittently and interchangeably. Early academic work on LCoE concluded that their definition of O&M could explain 50% of OpEx, mainly for onshore wind [42] (p. 1377). Early practitioner work for the UK government stipulates O&M as a share of OpEx for offshore wind to be between 60% and 75% [70]. A paper recommending strategies to be applied for O&M in the UK offshore wind sector in 2015 and 2016 points to their definition of O&M making up some 52%–54% of OpEx [82] (p. 3) with costs for lease, transmission, and insurance considered to be excluded. This latter paper [82] bases its calculations on interpretations of the UK cost reduction study [1] including comparisons with key conclusions from one of the sub-work streams [73] of this extensive UK cost reduction study.

3.2. Comparison of Operations and Maintenance Calculations

Having selected a unit of analysis and with due attention paid to the different dimensions applied in the eleven studies subjected to the analysis, any studies with O&M numbers were first converted to OpEx numbers to ensure that an adequate comparison could be made of the annual OpEx figures per MW. Figure 2 shows the annual minimum (min), average (avg), and maximum (max) OpEx costs per MW per year converted to Euro (EUR). Due to the learning curve observed within the LCoE related studies pertaining to the calculation of OpEx costs and the different OpEx dimensions described earlier, the minimum and maximum ranges for OpEx costs in absolute terms per MW per year vary from EUR 24,363.- to EUR 600,000.-.
If the very early studies from before 2010 are excluded, where WTG rating and the total OWF capacity were smaller and mainly based on exclusively near shore locations which make these studies hard to compare to later studies, a minimum/average/maximum OpEx cost of EUR 62,893.-/166,895.-/600,000.- may be obtained respectively (a variance factor of 9.54 between minimum and maximum values). If these minimum and maximum OpEx cost numbers per MW per year are applied to a simplified LCoE calculation following the principles of Megavind [3] where it is possible to simultaneously apply the corresponding minimum and maximum ranges for CapEx in the respective study scenarios, the relative proportion of the discounted total life-cycle OpEx costs as a percentage of LCoE fluctuates from 13.1% to 56.5% as illustrated in Figure 3.
These findings highlight the importance that applying the right O&M strategy whilst carefully monitoring OpEx costs can have a very significant impact on whether to enter into an OWF project at all from a financial perspective. The right O&M strategy with OpEx cost balancing greatly impacts the overall profitability of the OWF project over its life-time. The different dimensions used and settings for OpEx cost models seem to be somewhat subjective and the actual application for each OWF project therefore becomes critical.

3.3. Ascertaining the Logistics Share of Operational Expenditure for Offshore Wind

One of the eleven studies analyzed included a very detailed cost itemization of OpEx costs [68] and this was selected as the “logistics base case” for determining the logistics share of OpEx. When the 18 cost items (outlined in Table 5) are compared to the definitions of OpEx in the other studies analyzed and academic literature, it was found that although itemized in the greatest level of detail, several line items were still missing (see Table 6). Each line item contained in the base case cost model (Table 5) contained both a minimum and maximum amount provided by the source.
Individual OpEx line items that are similar in their descriptions across different studies analyzed were found to vary in size and this is also the case for logistics. Using “Port Operations” as an example, this line item ranges from approx. 1.2% of O&M [68] to 5% of OpEx [34] to 31% of OpEx [40]. Another example is the “Vessel costs” line item (including helicopters) which ranges from 9% of OpEx [34] to 30% of O&M [68] to 38% of O&M [70]. It was possible to ascertain that the different results vary based on the data itself (actual costs vs. simulations), the data collection method (quantitative modeling vs. qualitative interviews), and the actual OWF projects modeled (the LCoE dimensions applied). The research efforts indicate that the individual OpEx cost line items were furthermore aggregated and described at a somewhat high level due to the immaturity of the O&M part of the offshore wind industry [40,42,70]. This should be contrasted and compared to other industries where more detailed and advanced phenomena can be analyzed [83,84].
In the eleven studies, each line item had been applied with a more or less thorough description within its source. From this description, a calculated proportion of the line item contents (“the logistics factor”) was applied in a manner within which it was possible to attribute to the definition of offshore wind logistics [22]. For several line items of the base case (Table 5), the logistics factor is 100% as the descriptions of the line items can be fully correlated with logistics beyond any reasonable doubt. An example could be the line item “Senior authorized person and marine coordination”. In other cases, the logistics factor attributed had to be less than 100% if the description of the line item was ambiguous or only partly inclusive of logistics tasks. “Administration” was one example of a somewhat ambiguous line item which—in most descriptions reviewed—contained logistics related costs such as “Inventory management for parts and consumables” as well as “Procurement activities”. In the analysis using the logistics base case [68], a logistics factor of 20% has—as an example—been attributed to “Administration” and the logistics base case has both a minimum and a maximum cost range. Table 7 shows that if logistics is conservatively attributed only to those line items that can be classified with 100% accuracy as being logistics costs, logistics makes up a minimum of 17% of offshore wind OpEx costs if the lower cost ranges are applied. Conversely, if the logistics factor is applied to all line items at the higher cost ranges, logistics could make up as much as 31% of OpEx. These numbers happen to tally with previous qualitative research findings of Poulsen and Hasager [22] (p. 15) on this topic in the world’s leading offshore wind operator.
Even at the lowest share of close to 17% of OpEx costs excluding many cost line items (detailed in Table 6), logistics ought to be a focus area for any operator of OWFs. This should be the case when evaluating the overall project viability before the investment decision as well as later on when the OWF becomes operational and the warranty period ends.

3.4. Calculated Savings from the Business Case on Working 24/7

Only one of the eleven studies related to LCoE mentioned working 24/7 as an area where costs may potentially be reduced [1] (p. 62). The results from producing the 24/7 business case indicate that by extending working hours to also include night time operations, a savings of approx. EUR 1.8 million per year can be realized. For a 400 MW near shore OWF with a land-based O&M set-up as modeled in the business case, this equals a reduction of just above 1% of LCoE.
The practitioner business case is based on a number of assumptions and the savings generated are based on using CTVs in a land-based or sea-based far offshore O&M set-up. The business case logic applied follows other studies that also utilize several sites with multiple dimensions applied [1,2]. No significant savings were found working 24/7 in the scenario modeled for a sea-based O&M set-up operating exclusively using SOVs. Therefore, the sea-based scenario was based on either a fixed accommodation platform set-up and/or stationary floatel set-up. Several assumptions were considered and subsequently ruled out in the business case as these criteria were deemed to be similar whether working daytime only or daytime and at night. These excluded criteria with a zero-sum impact on the business case comprised the overall OWF output yield measured in MW rating, the individual WTG yield rating in MW, number of WTG positions within the OWF, number of trips to WTGs during the summer season, and fuel consumption. Other assumptions have been entered as criteria in the 24/7 business case which effectively act as “levers” which—if altered—may impact the overall results of the business case:
  • Number of vessels needed if working daytime (12/7) vs. also at night (24/7)
  • Night-shift add-on salary payment for technicians
  • Night shift add-on to cover on-shore support for monitoring purposes
  • Months per year working 24/7
  • OWF capacity factor
  • Time for production stop per WTG as a result of faults/repair time
  • Number of errors/faults/stoppages per wind turbine per month
  • Price of electricity during and after subsidy period
A good example of a lever in the business case model is the OpEx costs per MW/year. The business case is built based on the Danish Anholt OWF and to some extent also the Danish Horns Reef I OWF. This has resulted in a near shore OWF modeling assumption with a land-based O&M strategy estimated at EUR 104,250.-/MW/year based on the focus group practitioner interviews and a linear view on OpEx costs included in the Megavind [3] 400 MW Anholt reference case. In the case study work forming part of this research, this number had been applied throughout the life-cycle of the OWF (the OWF life-cycle has in this case been set to be 25 years). However, following the analysis of the eleven government sponsored LCoE cost-related studies, a more realistic number for OpEx seems to be EUR 170,000.-/MW/year. In the land-based 24/7 CTV scenario, applying this higher and more realistic annual OpEx cost level affects the overall LCoE savings from 0.75% impact to 0.73% (see Figure 4). This can be explained as follows: When the annual OpEx lever is increased, the overall share of OpEx as a part of LCoE increases. Kept at a constant level in terms of savings impact in actual monetary values, the relative savings impact as a percentage of LCoE decreases. The business case model utilizes the Megavind [3] LCoE calculator tool methodology to compute the savings impact on LCoE. The Megavind [3] (p. 7) calculator tool offers four different LCoE calculation perspectives (developer costs pre-tax and post-tax, society costs pre-tax and post-tax) and a choice was made to work with the developer costs including tax, i.e., the Megavind “developer post-tax” scenario [3]. This scenario most accurately reflects the true project LCoE to be compared across OWF projects in different countries.
Another example of a lever is the weather window which determines offshore WTG accessibility. The focus group work yielded a result of 15 days per month with no OWF accessibility for a land-based set-up using CTVs. The focus group work furthermore yielded a perception among the subject matter experts that the weather is less adverse during night time. This hypothesis was tested based on wave data from Fino-1 and Sylt, courtesy BSH and the MARNET network, respectively. The significant wave height data was subjected to a statistical test (t-test) and it was concluded that there is no significant difference between daytime and night wave heights. As this is very OWF site specific, the business case was left with this lever open to adjustment based on a site-specific analysis of weather data observations. In this respect, it is worth noting that it is possible to better exploit WTG accessibility weather windows if the work continues 24/7.
The business case model for 24/7 operates with three scenarios that each have a low and high impact sensitivity analysis which provide output ranges per scenario respectively. Figure 5 outlines the key outcomes of the business case cost savings components where the high impact ranges are primarily a result of lower costs for technicians and higher subsidy prices per MWh used for early OWFs (in this case Burbo Bank Extension based on www.4coffshore.com [85] contrasted against recent DONG Energy Wind Power [75] Dutch award subsidy price including a higher number of errors per WTG per month and long production stops).
The scenarios and low/high impact sensitivities do not change in terms of absolute cost savings values as the lever with annual OpEx/MW cost is altered as the analysis is moved from near shore to far offshore. However, OpEx as such becomes higher within the Megavind [3] calculator tool as DevEx, CapEx, and AbEx are kept constant. With a higher annual OpEx for the far offshore output, this results in OpEx growing as a share of LCoE compared to the land-based O&M example for near shore Danish OWFs like Anholt and Horns Reef III. Conversely, the production as well as number of errors per WTG per month are parameters which could be expected to be higher for a far offshore OWF because of higher wind speeds and the cost savings impact of working 24/7 would therefore be further amplified.

3.5. Why Companies Chose to Join the Industry-Wide Cost Reduction Initiative

A particular area of interest for this research design was to determine why companies are interested in joining these industry wide cost reduction initiatives. The empirical evidence collected centered around 3 major areas:
  • The larger companies attended with senior managers from staff functions working exclusively to reduce LCoE. These larger companies were interested in working with other large companies to steer cost saving initiatives. Simultaneously, the larger companies wished to work with SMEs to benefit from a more agile, lean, and innovative approach to the market. The larger companies felt that the combination of other large companies with SMEs generated a mix of companies useful for the quest towards lowering the costs for offshore wind.
  • The SMEs attended with top managers who at times brought practitioners with hands-on experience to the focus group meetings and subject matter expert interviews. In addition, the SME top managers often had hands-on subject matter expert experience themselves. The SMEs used the cost reduction initiative to try to impact the industry overall because the offshore wind industry is very immature and therefore driven by different operators on a project-by-project basis. The SMEs were individually not significant enough to impact a large group of operators and hoped to be able to get close to decision makers from larger companies in a more informal setting.
  • Common to large companies and SMEs was the wish to be able to work together as a larger group across the offshore wind industry to create truly useful cost-out opportunities which no individual company would have otherwise been able to develop or implement on their own. A sense of unity and urgency existed in the different working group meetings which resulted in passionate discussions and innovative dialogue. No single company had this much O&M logistics experience amongst their ranks of employees and the diversity in the working group composition yielded a very unique foundation to create useful business cases to be applied by all in an open access manner.
The sheer opportunity to meet new customers and suppliers respectively was a clear undeclared driver for some participants. As work progressed and the OE CRF became more widely known, more participants voiced interest in becoming part of the work which provided for better opportunities academically to triangulate data points used in the business cases and thereby strengthen the validity of the results presented.

4. Discussion

The key finding of the part of the research efforts focused on the eleven LCoE cost-related studies is that what constitutes the OpEx part of LCoE is not very clearly defined or agreed. Because of the inconsistencies in both unit of analysis and key assumptions making up the different LCoE calculation methods, the variance of the OpEx share of LCoE is significant. When the O&M portion of OpEx was subsequently analyzed, it was again found that definitions and assumptions varied extensively in terms of how each of the eleven cost studies was put together. As the area of logistics as a cost element within the annual O&M expenditure was further understood, a significant variance was again encountered in terms of the individual line items that make up the total logistics costs as part of O&M. For the logistics portion, supposedly easy-to-compare areas like costs of vessels, helicopters, and ports displayed great variance within the eleven reports reviewed.
These findings correspond to the separate case study performed within the organization of the world’s largest offshore wind operator [22] and that research study indicates the root cause being that logistics is an area which is not yet subjected to proper organizational focus within offshore wind. The detailed line-item cost breakdowns of the government sponsored LCoE cost-related studies are immaturely applied and uncoordinated across different studies which ultimately make the studies impossible to compare.

4.1. Government Sponsored Studies—Not Useful for Practitioner Implementation

The first research question set out to understand whether practitioners can understand and implement the government sponsored LCoE cost-related studies. When the case study findings are combined with the analysis of the eleven LCoE cost-related studies and reports, the emerging pattern is that the government sponsored LCoE studies are used at policy level to drive strategic thinking and work with industry to lower the future costs for offshore wind energy. This work is contrasted within the case study part of this research where industry practitioners working ashore devised specific LCoE cost-out measures for their site colleagues working offshore to realize and implement immediately.
From the analysis, the largely government sponsored LCoE cost-related studies and reports are primarily driven by a strong desire at policy level to avoid subsidies for wind energy and to ensure that offshore wind is competitive with other energy forms. In the case study, the large OWF operators ultimately in control of the offshore wind projects took part as well as the SMEs serving the individual OWF projects and it was observed how their respective involvement and motivations varied considerably. At the policy level, the ability to utilize the government sponsored LCoE cost-related studies to generate ideas for cost savings opportunities supported by the proper research and analysis are the key success factors utilized to determine forward trajectories of offshore wind diffusion. At the execution level, the OWF operators attended the practitioner case study to ensure that they could benefit from any possible cost savings ideas generated whereas the SMEs attended mainly to be able to speak to the operators in a more united manner, with a stronger voice.
It was not easy to produce a clear path from the largely government sponsored LCoE cost-related studies and reports at policy level to the case study work with industry practitioners to create practical cost-out initiatives. This was mainly because the industry practitioners ultimately focused on the cost models of the operators involved in the case study, not government policy/industry strategy matters, as being the driving force behind the need for LCoE reductions. As such, the largely government sponsored LCoE cost-related studies were not directly tied to the work performed by practitioners in the cost reduction case study.
As a final caveat, it is worth mentioning that if applying the most extreme OpEx estimate of EUR 600,000.- year in the higher range applied of the study [34], it would, according to the calculations forming part of this research, not be possible for the OWF to be profitable even under the highest subsidy schemes seen hitherto.

4.2. Cultural Barriers between Cost-Out Initiative Planning and Implementation

The second research question pertained to the interest in understanding whether cultural differences exist between the players involved in devising the paths for cost reduction and those responsible for the actual cost-out implementation. Here, the first major finding had to do with the different types of stake-holders. A pattern of several distinctively different levels of cost reduction efforts therefore emerged from the research in terms of stake-holders and objectives:
  • Government (policy/industry strategy level);
  • Operator (OWF portfolio and operator specific cost model/experience);
  • Shore based execution personnel (defining the cost reduction initiatives);
  • Site personnel located either in offices ashore or offshore in the harsh marine environment and whether their background, as well as experience, were onshore or offshore based (responsible to implement and execute the cost-out initiatives such as working at night).
In the largely government sponsored LCoE cost-related studies forming part of the research, the involvement of major consulting firms to lead the analysis portion, perform the research, and engage with the industry practitioners was integral to the contents produced. In the case study, 77% of the participants were from the top management and middle management layers of the companies whereas only 23% were from the office execution/offshore site layers tasked to actually implement the cost-out business cases. In the government sponsored LCoE cost-related studies, the consultancies with government backing gained access to a broad base of industry stake-holders representing the entire offshore wind market in a very adequate, balanced, and justifiable manner. Conversely, the case study participant roster contained four participants from three operator organizations and three participants from a major OEM meaning that 74% of the case study participants were from SME organizations. Within the operators and OEM segment, the case study participants were comprised exclusively of shore based personnel with an onshore background. Within the SME participant segment, 80% of the case study participants had an offshore background.
In the government sponsored LCoE cost-related studies, it was determined that most of the directly involved participants appear to be office based and this was similar in the practitioner case study forming part of this research. The execution layer of the organizations as well as the responsible parties at e.g., port sites and offshore maritime operations are not well represented in the analytical phase of planning the cost-out measures to be implemented.
In the case study, a significant cultural barrier was experienced as the difference between being shore based working from a secure desk location in an office with theoretical concepts and ideas is very different from being deployed into an offshore site. When working offshore with harsh weather conditions and health/safety considerations to be taken into account as part of the daily operations, the background as well as experience from having worked offshore in the past was very important and could be directly contrasted to that of onshore personnel such as technicians working offshore.

4.3. Offshore Wind Logistics Operations and Maintenance Savings Are Achievable

The third and last research question pertained to whether it would be possible to create practically implementable cost-out initiatives by analyzing a particular life-cycle phase in much more detail and by joining a practitioner work effort as a case study. This research substantiates that cost reductions in the offshore wind O&M life-cycle phase are indeed possible through cost-out initiatives. This is evidenced by the work with business cases in the case study described in detail in this paper. The lean initiative, the asset sharing business case, the pre-planning of parts/tools/consumables, as well as the 24/7 business case presented in more depth are all examples of practical and short-term cost-out initiatives that can be applied by the operators and/or OEMs together with the SME suppliers serving them.
Separately, cost reductions may also be achieved through innovation as evidenced by the separate case study about offshore wind logistics innovation with DONG Energy Wind Power [22]. It is, however, critical that the organization driving the innovation has a certain size and mass to be able to accommodate and also test the innovation cases being worked with. And here, the offshore wind innovation conundrum exists in terms of wanting innovation on the one hand versus wishing to reduce risk by only using fully tested and proven concepts on the other hand [22]. Significant differences exist in terms of supply chain composition, readiness, and set-up between Europe and Asia [86].
To get offshore wind to be competitive with other energy forms, the paths of practically implementable cost-out initiatives and innovation need to be combined and logistics would be an ideal demonstration ground.

4.4. Application of the Studies Was Possible for Several of the Business Cases

Individually, each LCoE cost-related study can be very useful. In the practitioner case study, the selected business case pertaining to extending the operational working hours offshore at sea to 24/7, the Megavind [3] LCoE calculator tool was successfully applied and it was found to be appropriate.
However, for one of the more conceptual business cases forming part of the case study such as creating a vision for the future of O&M logistics in 2025, the Megavind LCoE calculator tool [3] would not be similarly appropriate.
Most of the case study business cases were fairly sophisticated in nature and based on a learning curve in Europe of offshore wind dating back to 1991. Many of the findings should also be applicable in Asia where especially the fastest growing market of China has cited O&M and logistics as significant gaps that need to be filled [86]. However, O&M logistics for floating wind turbines have not been considered within the case study performed [87].

4.5. Case Study Findings about Operations and Maintenance Logistics Strategies

One of the three goals identified as a justification for joining the practitioner cost reduction case study was to learn about offshore wind O&M logistics. Several dimensions emerged from the analysis of the eleven studies and the case study efforts as structural considerations for O&M logistics strategy going forward.
The distance from shore to the OWF would determine if a shore-based or sea-based O&M set-up would be required. These decisions would again have significant implications on the shipping and logistics strategy and thereby the costs involved.
The degree to which OWF operators are able to obtain data from the OWF in general and each WTG position in particular to use for preventive maintenance efforts would also have an impact on the shipping and logistics strategy. Advanced utilization of condition monitoring and structural health monitoring software and kits [46] would create an environment of more precisely pre-planned O&M activities. If done correctly, preventive maintenance of main components such as the generator or gearbox could avoid significant costs for jack-up vessels with cranes to have to be deployed on short notice for major repairs. The operators, who were part of the practitioner case study, expressed that whereas they were generally aware of the existence of these softwares and kits, their access was via the WTG OEMs which means that in practice, several different systems and kits operate in parallel because operators generally utilize WTGs from more OEMs. Each OEM would continuously upgrade their solutions with a strong focus on protecting intellectual property rights and the operators would constantly try to gain full access to already purchased software, especially towards the end of the warranty period. Reviews of new technology and kits were cited as constantly being performed by the operators and for existing and future OWFs, a clear business case proof had to exist in order to justify investments on the part of the operators. For such business case proofs, logistics was cited to play a key role for work performed subsea, below water, as well as topside, above the waterline, due to the high overall cost share attributed to offshore wind logistics.
Different supply chains exist for O&M activities which can be planned long in advance compared to scenarios where an offshore asset ceases to operate and needs to be diagnozed and subsequently repaired in an ad-hoc and unplanned manner. In the pre-planned scenario, efficiencies can be built in through efforts such as lean. When an asset breaks down and diagnostics as well as subsequent repairs need to happen quickly, the supply chain is mobilized swiftly and in an ad-hoc manner. This causes the supply chain to be more expensive to deploy as the deployment is often bespoke and without economies of scale.
Whether the preventive maintenance or the needed repairs take place topside or subsea also greatly affect the shipping and logistics strategy. Implications, in terms of deployment of vessels carrying divers and remotely operated submarines with cameras and repair capabilities, need to be considered for subsea operations on foundations and cables. This is contrasted to bringing technicians, parts, tools, and consumables to wind turbines and/or offshore sub-stations for preventive maintenance and/or repair work above water where the technicians and equipment are transferred from vessels to the OWF asset.
Finally, the implications of a break-down or damages incurred to an export cable and/or a sub-station were in the research efforts found to be comparatively more severe and thus warrant a different shipping/logistics response. In such break-down cases, damages could cause an entire OWF asset to be unavailable which could often be very costly for the operator if the downtime is over an extensive period of time due to e.g., a cable damage which needs to be located. Situations where the entire OWF asset is down may be contrasted and compared to a break-down of an individual WTG unit within an OWF which is also critical but with very different cost implications for the operator.

5. Conclusions

This research has provided new knowledge about the learning curve involved in order to produce the largely government sponsored LCoE cost-related studies within the offshore wind industry. It was found that this learning curve has been steep over the last ten years as evidenced by the analysis of eleven extensive studies. As part of the research presented in this paper, OpEx as a single component of the LCoE calculation was found to be able to vary by a factor of 9.5×. When applied to a commonly accepted LCoE calculator tool for offshore wind [3], this high variance resulted in creating a range of 13%–57% for the OpEx portion of LCoE in the low/high scenarios presented in this paper. It would therefore seem prudent for a standardized methodology for cost modeling to now be implemented, for example in line with the work done by Strategic Energy Technologies Information System [88]. Alternatively, the use of LCoE as a way to evaluate progress of offshore wind compared to other industries would seem to be futile.
As a phenomenon, LCoE is already being subjected to harsh criticism for not being an accurate measure to compare energy forms. For wind, this is argued to be of particular relevance as wind is intermittent in nature and therefore non-dispatchable from a grid perspective [89]. Dispatchable energy forms are more valuable to the overall grid balancing and this is argued to be a critical flaw of the LCoE measure itself. Other ways to compare energy forms have been proposed e.g., by Evans et al. [27], Ueckerdt et al. [28] and Dale [90]. LCoE in combination with Levelized Avoided Cost of Energy is being proposed by the United States (US) Energy Information Agency [91] as a new methodology to make evaluations more holistically for an area, region, or country [92].
For now, the analysis of OpEx and O&M costs within offshore wind presented in this paper reveals that different assumptions have been applied to the different LCoE studies by different countries and that these assumptions have changed as the wind energy technology has evolved over time. If the main objective at policy level of producing LCoE cost-related studies is to create an opportunity to benchmark costs at a certain point in time compared to the future, as well as, compare the costs of offshore wind to other energy forms, the findings presented in this paper call for further research efforts which are critically needed in order to devise solutions on how to apply the assumptions of the cost studies down to a line-item cost level. This was evidenced by the work efforts rendered as part of this research to exemplify our findings within the specific areas of shipping, logistics, and port line item costs as analyzed in this research.
The work presented in this paper from the case study with industry practitioners on practically feasibly and immediately implementable cost-out initiatives in the form of business cases has been very useful in terms of actively being part of the process of understanding how to contrast the often very policy level macro studies of LCoE cost-related issues sponsored by governments to real-life practitioner cost reduction pressures. Working intensively at the practitioner level with action research, it became apparent that further research should be undertaken to further study the impact of the key structural dimensions identified in this paper (Section 4.5) to have a major influence on O&M logistics strategy going forward.
It became evident from this research that the cultural gap between shore-based personnel and the maritime personnel, often working offshore at sea and being ultimately responsible for the majority of the actual, practical cost-out implementation work, is a critical area in need of further research (Section 4.2). This cultural gap could in fact be an important barrier to the actual realization of cost savings as opposed to desktop efforts to identify, simulate, and track more theoretical initiatives organized without a true ability on the part of the operators and supporting companies to determine the true bookkeeping impact.
Finally, the work with the very specific 24/7 cost-out business case example yielded an opportunity to compare this not only to the LCoE cost studies and reports but also to the separate, prior case study on offshore wind logistics and logistics innovation [22]. Whereas the goals and objectives of logistics cost-out (the topic of this paper) and logistics innovation (the topic of the former paper [22]) are somewhat similar in terms of the wish to bring forward tangible cost reductions, the methodology and processes would need further research as well. The two paths to cost reductions for offshore wind are metaphorically as different as night and day. And working both night and day is exactly what is required from the offshore personnel having to work 24/7 should the key business case of this paper be implemented by OWF operators going forward.

Acknowledgments

This research is funded by the Danish Maritime Foundation (grant 2012-097) and Aalborg University. The authors would like to thank Offshoreenergy.dk for case study access. A special thank you goes out to the interviewees as well as the participating companies and personnel both within the Cost Reduction Forum and the Cost Reduction Forum Group 4. The authors would like to acknowledge that some or all of the Cost Reduction Forum efforts of Offshoreenergy.dk are sponsored by The Region of Southern Denmark. The authors would like to thank PhD supervisor Lars Bo Henriksen of Aalborg University. Wave data provided by BSH and MARNET are acknowledged and wave data analysis efforts rendered by Ioanna Karagali with financial support from EU-Mermaid are also duly acknowledged.

Author Contributions

Thomas Poulsen and Christian Munk Jensen conceived the research design involving the practitioners; Thomas Poulsen conceived the research covering the eleven cost related government studies; Thomas Poulsen and Christian Munk Jensen performed the practitioner action research with support from the team of practitioners; Thomas Poulsen performed the analysis of the eleven cost related government studies; Christian Munk Jensen created the business cases with support from the practitioners and Thomas Poulsen; Thomas Poulsen wrote the manuscript with support from Charlotte Bay Hasager; Christian Munk Jensen reviewed the manuscript.

Conflicts of Interest

The authors declare no conflict of interest.

Abbreviations

The following abbreviations are used in this manuscript:
AbExAbandonment expenditure, decommissioning cost
AEPAnnual energy production
AvgAverage
CapExCapital expenditure
CRFCost reduction forum
CLVCable laying vessel
CTVCrew transfer vessel
DevExDevelopment Expenditure
EUEuropean Union
EUREuro
EPCiEngineering, procurement, construction, and installation companies
FloatelFloating hotel vessel
GWGiga-Watt
HSSEQHealth, safety, security, environmental, and quality
I&CThe installation and commissioning life-cycle phase of an offshore wind farm
IEAInternational Energy Agency
IMRInspection, maintenance, and repairs
IRMInspection, repair, and maintenance
IRMRInspection, repair, maintenance, and replacement
LCoELevelized cost of energy
M&RMaintenance and repair, maintenance and renewal, maintenance and replacement, maintenance and rehabilitation
MaxMaximum
MinMinimum
MWmega-Watt
MWhMega-Watt hours
O&GOil and gas
O&MOperations and maintenance
OEOffshoreenergy.dk
OEMOriginal equipment manufacturer
OpExOperational expenditure
OWFOffshore wind farm
ROVRemotely operated vehicle
SMESmall to medium sized enterprise
SOVService operations vessel
TPMTotal productive maintenance
UKUnited Kingdom
USUnited States of America
USDUnited States Dollars
WACCWeighted average cost of capital
WTIVWind turbine installation vessel
WTGWind turbine generator

References

  1. The Crown Estate. Offshore Wind Cost Reduction Pathways Study. 2012. Available online: http://www.thecrownestate.co.uk/media/5493/ei-offshore-wind-cost-reduction-pathways-study.pdf (accessed on 2 July 2016).
  2. Prognos & Ficthner Group. Cost Reduction Potentials of Offshore Wind Power in Germany, Long Version. 2013. Available online: http://www.offshore-stiftung.com/60005/Uploaded/SOW_Download%7cStudy_LongVersion_CostReductionPotentialsofOffshoreWindPowerinGermany.pdf (accessed on 16 May 2016).
  3. Megavind. LCoE Calculator Model. 2015. Available online: http://megavind.windpower.org/download/2452/1500318_documentation_and_guidelinespdf (accessed on 15 June 2016).
  4. Ecofys. Subsidies and Costs of EU Energy, Final Report; European Commission: Utrecht, The Netherlands, 2014. [Google Scholar]
  5. Mazzucato, M. The Entrepreneurial State, 2nd ed.; Anthem Press: London, UK, 2014. [Google Scholar]
  6. Poulsen, T. Changing strategies in global wind energy shipping, logistics, and supply chain management. In Research in the Decision Sciences for Global Supply Chain Network Innovations; Stentoft, J., Paulraj, A., Vastag, G., Eds.; Pearson Education: Old Tappan, NJ, USA, 2015; pp. 83–106. [Google Scholar]
  7. Høg, J. Offshore Vind skal spare 40 pct. [Offshore Wind Needs to Save 40%]; Børsen Logistik: Copenhagen, Denmark, 29 September 2015. [Google Scholar]
  8. Offshoreenergy.dk. Information about the Organization. 2016. Available online: http://offshoreenergy.dk/offshoreenergy/about.aspx (accessed on 2 August 2016).
  9. Poulsen, T.; Rytter, N.G.M.; Chen, G. Offshore Windfarm Shipping and Logistics—The Danish Anholt offshore windfarm as a case study. In Proceedings of the 9th European Academy of Wind Energy PhD Seminar on Wind Energy in Europe, Visby, Sweden, 18–20 September 2013. [Google Scholar]
  10. Martin, A.T. Model Contracts: A Survey of the Global Petroleum Industry. J. Energy Nat. Resour. Law 2004, 22, 281–340. [Google Scholar] [CrossRef]
  11. International Energy Association. Projected Costs of Generating Electricity; OECD: Paris, France, 2005. [Google Scholar]
  12. Organization of Petroleum Exporting Countries. Reference Basket. 2016. Available online: http://www.opec.org/opec_web/en/data_graphs/40.htm (accessed on 1 August 2016).
  13. Krauss, C. Oil Prices: What’s Behind the Drop? Simple Economics. New York Times. 27 July 2016. Available online: http://www.nairaland.com/3053439/oil-prices-whats-behind-drop (accessed on 31 July 2016).
  14. Heptonstall, P.; Gross, R.; Greenacre, P.; Cockerill, T. The cost of offshore wind: Understanding the past and projecting the future. Energy Policy 2012, 41, 815–821. [Google Scholar] [CrossRef]
  15. Organization for Economic Co-operation and Development. The Ocean Economy in 2030; OECD Publishing: Paris, France, 2016. [Google Scholar]
  16. Wood Mackenzie. Fossil Fuels to Low-Carbon. Time to Diversify? Wood Mackenzie: Edinburgh, UK, 2016. [Google Scholar]
  17. Holter, M. Statoil Sets up Renewables Unit as CEO Shakes up Management. Bloomberg. 12 May 2016. Available online: https://www.bloomberg.com/news/articles/2015-05-12/statoil-sets-up-renewables-unit-as-ceo-changes-executive-team (accessed on 3 February 2017).
  18. Macalister, T. Shell creates green energy division to invest in wind power. The Guardian. 15 May 2016. Available online: https://www.theguardian.com/business/2016/may/15/shell-creates-green-energy-division-to-invest-in-wind-power (accessed on 3 February 2017).
  19. Wiesen, K.; Teubler, J.; Rohn, H. Resource Use of Wind Farms in the German North Sea—The Example of Alpha Ventus and Bard Offshore I. Resources 2013, 2, 504–516. [Google Scholar] [CrossRef]
  20. Runyon, J. AWEA 2016 Showcases Knowledge Transfer from Offshore Oil and Gas to Wind. Renewable Energy World. 24 May 2016. Available online: http://www.renewableenergyworld.com/articles/2016/05/awea-2016-showcases-knowledge-transfer-from-offshore-oil-and-gas-to-wind.html (accessed on 31 May 2016).
  21. Kaiser, M.J.; Snyder, B. Modelling service vessel activity in the Outer Continental Shelf Gulf of Mexico. Int. J. Logis. Res. Appl. 2013, 16, 51–85. [Google Scholar] [CrossRef]
  22. Poulsen, T.; Hasager, C.B. How Expensive Is Expensive Enough? Opportunities for Cost Reductions in Offshore Wind Energy Logistics. Energies 2016, 9, 437. [Google Scholar] [CrossRef]
  23. Edenhofer, O.; Hirth, L.; Knopf, B.; Pahle, M.; Schlömer, S.; Schmid, E.; Ueckerdt, F. On the economics of renewable energy sources. Energy Econ. 2013, 40, S12–S23. [Google Scholar] [CrossRef]
  24. Min, C.-G.; Park, J.K.; Hur, D.; Kim, M.-K. The Economic Viability of Renewable Portfolio Standard Support for Offshore Wind Farm Projects in Korea. Energies 2015, 8, 9731–9750. [Google Scholar] [CrossRef]
  25. Edenhofer, O.; Seyboth, K.; Creutzig, F.; Schlömer, S. On the Sustainability of Renewable Energy Sources. Ann. Rev. Environ. Res. 2013, 38, 169–200. [Google Scholar] [CrossRef]
  26. International Energy Agency. World Energy Outlook 2015. Executive Summary; International Energy Agency: Paris, France, 2015. [Google Scholar]
  27. Evans, A.; Strezov, V.; Evans, T.J. Assessment of sustainability indicators for renewable energy technologies. Renew. Sustain. Energy Rev. 2009, 13, 1082–1088. [Google Scholar] [CrossRef]
  28. Ueckerdt, F.; Hirth, L.; Luderer, G.; Edenhofer, O. System LCOE: What are the costs of variable renewables? Energy 2013, 63, 61–75. [Google Scholar] [CrossRef]
  29. International Energy Agency. Energy Subsidies; International Energy Agency: Paris, France, 2015. [Google Scholar]
  30. Pregger, T.; Lavagno, E.; Labriet, M.; Seljom, P.; Biberacher, M.; Blesl, M.; Trieb, F.; O’Sullivan, M.; Gerboni, R.; Schranz, L.; et al. Resources, capacities and corridors for energy imports to Europe. Int. J. Energy Sect. Manag. 2011, 5, 125–156. [Google Scholar] [CrossRef]
  31. Deloitte. Analysis on the Furthering of Competition in Relation to the Establishment of Large Offshore Wind Farms in Denmark. 2011. Available online: https://stateofgreen.com/files/download/382 (accessed on 17 May 2016).
  32. Navigant Research. A BTM Navigant Wind Report. World Wind Energy Market Update 2015. International Wind Energy Development: 2015–2019; Navigant Research: Chicago, IL, USA, 2015. [Google Scholar]
  33. FTI Intelligence. Global Wind Supply Chain Update 2015; FTI CL Energy: Baltimore, MD, USA, 2015. [Google Scholar]
  34. Douglas-Westwood. World Offshore Wind Market Forecast 2016–2025; Douglas-Westwood Limited: Faversham, UK, 2015. [Google Scholar]
  35. European Wind Energy Association. The Economics of Wind Energy; A Report by the European Wind Energy Association; WindEurope: Brussels, Belgium, 2009. [Google Scholar]
  36. European Wind Energy Association. Wind Energy Scenarios for 2030; WindEurope: Brussels, Belgium, 2015. [Google Scholar]
  37. Global Wind Energy Council. Global Wind Report. Annual Market Update; Global Wind Energy Council: Brussels, Belgium, 2016. [Google Scholar]
  38. Poulsen, T.; Rytter, N.G.M.; Chen, G. Global Wind Turbine Shipping & Logistics—A Research Area of the Future? In Proceedings of the International Conference on Logistics and Maritime Systems (LogMS), Singapore, 12–14 September 2013. [Google Scholar]
  39. Shafiee, M.; Dinmohammadi, F. An FMEA-Based Risk Assessment Approach for Wind Turbine Systems: A Comparative Study of Onshore and Offshore. Energies 2014, 7, 619–642. [Google Scholar] [CrossRef]
  40. BVG Associates. Value Breakdown for the Offshore Wind Sector; A Report Commissioned by the Renewables Advisory Board; The UK Renewables Advisory Board: London, UK, 2010. [Google Scholar]
  41. Luengo, M.M.; Kolios, A. Failure Mode Identification and End of Life Scenarios of Offshore Wind Turbines: A Review. Energies 2015, 8, 8339–8354. [Google Scholar] [CrossRef]
  42. Blanco, M.I. The economics of wind energy. Renew. Sustain. Energy Rev. 2009, 13, 1372–1382. [Google Scholar] [CrossRef]
  43. Gross, R.; Blyth, W.; Heptonstall, P. Risks, revenues and investment in electricity generation: Why policy needs to look beyond costs. Energy Econ. 2010, 32, 796–804. [Google Scholar] [CrossRef]
  44. BVG Associates. UK Offshore Wind Supply Chain: Capabilities and Opportunities; UK Department for Business, Innovation, and Skills: London, UK, 2014.
  45. Dinwoodie, I.A.; McMillan, D. Operational strategies for offshore wind turbines to mitigate failure rate uncertainty on operational costs and revenue. IET Renew. Power Gener. 2013, 8, 359–366. [Google Scholar] [CrossRef]
  46. May, A.F. Operational Expenditure Optimisation Utilising Condition Monitoring for Offshore Wind Parks. Ph.D. Thesis, University of Strathclyde, Glasgow, UK, January 2016. [Google Scholar]
  47. Brealey, R.A.; Myers, S.C.; Allen, F. Principles of Corporate Finance, 9th/International ed.; McGraw-Hill/Irwin: New York, NY, USA, 2008. [Google Scholar]
  48. Namovicz, C. Assessing the Economic Value of New Utility-Scale Generation Projects; United States Energy Information Administration: Washington, DC, USA, 2013.
  49. Sherwin, D. A review of overall models for maintenance management. J. Qual. Maint. Eng. 2000, 6, 138–164. [Google Scholar] [CrossRef]
  50. Kelly, A. Maintenance and Its Management; Conference Communication: London, UK, 1989. [Google Scholar]
  51. Pintelon, L.; Gelders, L.; Puyvelde, F.V. Maintenance Management, 1st ed.; ACCO UITGEVERIJ: Leuven, The Netherlands, 1997. [Google Scholar]
  52. Maccloskey, J.F.; Coppinger, J.M.; Tefethen, F.M.N. A History of Operations Research. Operations Research for Management; The Johns Hopkins Press: Baltimore, MD, USA, 1954. [Google Scholar]
  53. Bon, R.; Pietroforte, R. New construction versus maintenance and repair construction technology in the US since World War II. Constr. Manag. Econ. 1993, 11, 151–162. [Google Scholar] [CrossRef]
  54. Hoster, F. Effects of a European electricity market on the German electricity industry: Results from a simulation model of the European power systems. Appl. Econ. 1999, 31, 107–122. [Google Scholar] [CrossRef]
  55. Guler, H. Prediction of railway track geometry deterioration using artificial neural networks: A case study for Turkish state railways. Struct. Infrastruct. Eng. 2014, 10, 614–626. [Google Scholar] [CrossRef]
  56. Farran, M.; Zayed, T. Fitness-oriented multi-objective optimisation for infrastructures rehabilitations. Struct. Infrastruct. Eng. 2015, 11, 761–775. [Google Scholar] [CrossRef]
  57. Carreraa, A.; Palomerasa, N.; Hurtósa, N.; Kormushevb, P.; Carreras, M. Cognitive system for autonomous underwater intervention. Pattern Recogn. Lett. 2015, 67, 91–99. [Google Scholar] [CrossRef]
  58. Bogue, R. Underwater robots: A review of technologies and applications. Ind. Robot Int. J. 2015, 42, 186–191. [Google Scholar] [CrossRef]
  59. Bharadwaj, U.R.; Silberschmidt, V.V.; Wintle, J.B. A risk based approach to asset integrity management. J. Qual. Maint. Eng. 2012, 18, 417–431. [Google Scholar] [CrossRef]
  60. Garg, A.; Deshmukh, S.G. Maintenance management: Literature review and directions. J. Qual. Maint. Eng. 2006, 12, 205–238. [Google Scholar] [CrossRef]
  61. Nakajima, S. Introduction to Total Productive Maintenance; Productivity Press: Cambridge, MA, USA, 1988. [Google Scholar]
  62. McKone, K.E.; Schroeder, R.G.; Cua, K.O. Total productive maintenance: A contextual view. J. Oper. Manag. 1999, 17, 123–144. [Google Scholar] [CrossRef]
  63. Petersen, K.R. New Models for Maintenance of Offshore Wind Farms. Ph.D. Thesis, University of Southern Denmark, Odense, Denmark, 24 February 2016. [Google Scholar]
  64. Stentoft, J.; Narasimhan, R.; Poulsen, T. Reducing cost of energy in the offshore wind energy industry. The promise and potential of supply chain management. Int. J. Energy Sect. Manag. 2016, 10, 151–171. [Google Scholar] [CrossRef]
  65. Shafiee, M. Maintenance logistics organization for offshore wind energy: Current progress and future perspectives. Renew. Energy 2015, 77, 182–193. [Google Scholar] [CrossRef]
  66. Duong, M.Q.; Nguyen, H.H.; Le, K.H.; Phan, T.V.; Mussetta, M. Simulation and Performance Analysis of a New LVRT and Damping Control Scheme for DFIG Wind Turbines. In Proceedings of the 2016 IEEE International Conference on Sustainable Energy Technologies (ICSET), Hanoi, Vietnam, 14–16 November 2016; pp. 288–293. [Google Scholar]
  67. Duong, M.Q.; Le, K.H.; Tran, V.T.; Nguyen-Huu, H.; Grimaccia, F.; Leva, S.; Mussetta, M. Small and Large Signal Stability Analysis of IMPSA Wind Power Plant Integration on Vietnamese Power System. In Proceedings of the 2015 IEEE Eindhoven PowerTech, Eindhoven, The Netherlands, 29 June–2 July 2015; pp. 1–6. [Google Scholar]
  68. GL Garrad Hassan. A Guide to UK Offshore Wind Operations and Maintenance; Scottish Enterprise and the Crown Estate: Egham, UK, 2013. [Google Scholar]
  69. Brink, T.; Madsen, S.O.; Lutz, S. Perspectives on how Operation & Maintenance (O&M) Innovations Contribute to the Reduction of Levelized Cost of Energy (LCoE) in Offshore Wind Parks; Danish Wind Industry Association and Offshoreenergy.dk: Esbjerg, Denmark, 2015. [Google Scholar]
  70. Offshore Design Engineering (ODE) Limited. Study of the Costs of Offshore Wind Generation; URN Number: 07/779; UK Renewables Advisory Board & DTI: London, UK, 2007.
  71. Vattenfall VindKraft. Kentish Flats Offshore Wind Farm 3rd Annual Report; Offshore Wind Capital Grants Scheme 2009, URN Number: 09D/P46B; UK Department of Energy and Climate Change: London, UK, 2009.
  72. Dinwoodie, I.A.; Endrerud, O.-E.V.; Hofmann, M.; Martin, R.; Sperstad, I.B. Reference Cases for Verification of Operation and Maintenance Simulation Models for Offshore Wind Farms. Wind Eng. 2015, 39, 1–14. [Google Scholar] [CrossRef]
  73. BVG Associates. Offshore Wind Cost Reduction Pathways. Technology Work Stream; The Crown Estate: Egham, UK, 2012. [Google Scholar]
  74. Sterling, T. Denmark’s DONG Energy wins Dutch offshore wind tender. Daily Mail. 2016. Available online: http://www.dailymail.co.uk/wires/reuters/article-3675746/Denmarks-DONG-Energy-wins-Dutch-offshore-wind-tender.html#ixzz4FVidKG7l (accessed on 26 July 2016).
  75. DONG Energy Wind Power. DONG Energy Wins Tender for Dutch Offshore Wind Farms; DONG Energy: Fredericia, Denmark, 2016. [Google Scholar]
  76. Weston, D. Denmark Agrees PSO Deal. WindPower Offshore. 2016. Available online: http://www.windpoweroffshore.com/article/1416054/denmark-agrees-pso-deal (accessed on 19 November 2016).
  77. Flyvbjerg, B. Five Misunderstandings about Case-Study Research. Qual. Inq. 2006, 12, 219–245. [Google Scholar] [CrossRef]
  78. Neergaard, H. Sampling in entrepreneurial settings. In Handbook of Qualitative Research Methods in Entrepreneurship; Neergaard, H., Ulhøi, J.P., Eds.; Edward Elgar Publishing Limited: Cheltenham, UK, 2007; pp. 253–278. [Google Scholar]
  79. Kvale, S.; Brinkmann, S. Interviews. Learning the Craft of Qualitative Research Interviewing, 2nd ed.; SAGE Publications Inc.: Thousand Oaks, CA, USA, 2012. [Google Scholar]
  80. Yin, R.K. Case Study Research. Design and Methods, 5th ed.; SAGE Publications Inc.: Thousand Oaks, CA, USA, 2014. [Google Scholar]
  81. Ortegon, K.; Nies, L.F.; Sutherland, J.W. Preparing for end of service life of wind turbines. J. Clean. Prod. 2013, 39, 191–199. [Google Scholar] [CrossRef]
  82. Offshore Renewable Energy CATAPULT. Operations and Maintenance in Offshore Wind: Key Issues for 2015/16. Available online: https://ore.catapult.org.uk/wp-content/uploads/2016/05/Operations-and-maintenance-in-offshore-wind.-Key-issues-for-2015-16.pdf (accessed on 2 August 2016).
  83. Juntunen, J.; Juntunen, M. External economies and confidence: A way to reduce logistics costs. Int. J. Logist. Res. Appl. 2010, 13, 329–337. [Google Scholar] [CrossRef]
  84. Hsu, C.-I.; Wang, C.-C. Reliability analysis of network design for a hub-and-spoke air cargo network. Int. J. Logist. Res. Appl. 2013, 16, 257–276. [Google Scholar] [CrossRef]
  85. 4COffshore.com. Events on Burbo Bank Extension. Project Dates. Available online: http://www.4coffshore.com/windfarms/project-dates-for-burbo-bank-extension-uk59.html (accessed on 15 May 2016).
  86. Poulsen, T.; Lema, R. Is the Supply Chain ready for the Green Transformation? The Case of Offshore Wind Logistics. Renew. Sustain. Energy Rev. 2017, 73, 758–771. [Google Scholar] [CrossRef]
  87. Castro-Santos, L.; Martins, E.; Soares, C.G. Methodology to Calculate the Costs of a Floating Offshore Renewable Energy Farm. Energies 2016, 9, 324. [Google Scholar] [CrossRef]
  88. Strategic Energy Technologies Information System. Key Performance Indicators for the European Wind Industrial Initiative; European Commission Directorate General Joint Research Centre, 2016. Available online: https://setis.ec.europa.eu/system/files/Key_Performance_Indicators_Wind.pdf (accessed on 24 August 2016).
  89. Joskow, P.L. Comparing the Costs of Intermittent and Dispatchable Electricity Generating Technologies. Am. Econ. Rev. 2011, 100, 238–241. [Google Scholar] [CrossRef]
  90. Dale, M. A Comparative Analysis of Energy Costs of Photovoltaic, Solar Thermal, and Wind Electricity Generation Technologies. Appl. Sci. 2013, 3, 325–337. [Google Scholar] [CrossRef]
  91. United States Energy Information Agency. Assessing the Economic Value of New Utility-Scale Electricity Generation Projects; United States Energy Information Agency: Washington, DC, USA, 2013.
  92. Electric Power Research Institute. LCOEs and Renewables; United States Energy Information Administration: Washington, DC, USA, 2013.
Figure 1. Offshoreenergy.dk Cost Reduction Forum structure including work groups.
Energies 10 00464 g001
Figure 2. Calculated annual OpEx cost ranges per mega-Watt for the eleven studies.
Energies 10 00464 g002
Figure 3. Scenarios displaying fluctuations in Operating Expenditure share of total costs.
Energies 10 00464 g003
Figure 4. Selected business case impact on offshore wind farm levelized cost of energy.
Energies 10 00464 g004
Figure 5. Business case outcome for working 12/7 (left columns, daytime only) and 24/7 (right columns, daytime and at night) for three cases (land-based CTV, sea-based CTV and sea-based SOV) for low and high impact estimates.
Energies 10 00464 g005
Table 1. Analysis of inclusion of O&M logistics in eleven major LCoE related studies.
YearStudyCost Itemization
2015Megavind 2015 LCoE calculator [3]Built-in template data based on 400 MW OWF modeled after Danish Anholt OWF. Contains up to 15 OpEx/O&M cost line items with 7 pre-suggested types of which none can be attributed to logistics
2015Douglas-Westwood offshore wind global forecast 2025 [34]Forecast up to 2025 of global OWFs. Defines OpEx as a percentage range of CapEx costs. Breaks OpEx down into 6 cost items of which 3 can be directly attributed to logistics
2014BVG Associates UK Supply Chain Assessment [44]500 MW OWF using 6 MW WTGs. Operation, maintenance, and service costs defined as 39% of lifetime costs. Operation, maintenance, and service costs split between minor service and major service with cost items defined but not further broken down
2013Prognos and Fichtner Group Germany cost reduction [2]Extensive study with 3 different sites ranging from 320 to 450 MW OWFs modeled with 4, 6, and 8 MW WTGs based on distance to shore and water depth. O&M costs modeled for different scenarios and costs provided per MW per year. Insurance costs are separated
2013GL Garrad Hassan offshore wind O&M spend guide for Scottish Enterprise and The Crown Estate [68]500 MW OWF using 6 MW WTGs. OpEx cost items broken down into 18 line items of which 5 can be fully attributed to logistics. OpEx provided per line item
2012The Crown Estate UK cost reduction pathways study including sub-studies in work streams [1,73]Extensive study with 4 different 500 MW sites modeled based on distance to shore, water depth, and wind speeds. Operating costs estimated at 33% of total LCoE [1] (p. 15)
2011Deloitte study on offshore wind competitiveness for Denmark [31]Study considers O&M to be out of scope [31] (p. 4)
2010BVG Associates for UK Renewables Advisory Board offshore wind sector value break-down report [40]500 MW OWF using 5 MW WTGs. 5 O&M cost items discussed including operation, maintenance, and license fees. One cost item is port activities. Costs also segmented into labor, materials, and other where “other” includes vessels and cranes.
2009European Wind Energy Association report on the economics of wind energy [35]The report is largely built based on onshore wind technology and findings except one section on offshore wind based on 2 MW WTGs and a park capacity of 160–200 MW. The onshore wind O&M break-down has 5 line items of which none can be attributed to logistics. Offshore wind O&M defined as a cost per MW hour (MWh).
2009Vattenfall VindKraft third annual technical report for Kentish Flats OWF [71]30 WTG OWF with 3 MW capacities. 6 OpEx cost items including administration, insurance, lease & rent. O&M under warranty from OEM. Estimated OpEx costs broken down per line item.
2007Offshore Design Engineering OW cost study for UK Department of Trade and Investment [70]Early study based on 30 WTGs each with 3.6 MW capacities, near shore. 5 OpEx cost items of which 4 were WTG related and 1 related to vessels. OpEx costs set as a percentage of CapEx.
Table 2. The five cost-out initiatives for O&M logistics.
Initiative NameCost-Out Initiative DescriptionIdea Agreed
Lean in O&M logisticsEliminate waste from quay side up to in within the offshore wind farm siteFirst series of meetings
Working 24/7Adding a night shift to present daytime operations (12/7) during maintenance campaignsFirst series of meetings (and the focus of this research)
Asset sharingThe sharing of vessels and helicopters between different offshore wind projectsSecond series of meetings
Parts, tools, and consumables pre-planningOptimization of advance packing of parts and tools including location of toolsSecond series of meetings
O&M logistics vision 2025Vision for the future of O&M logistics in both near shore and far shore contextSecond series of meetings
Table 3. Main Cost Reduction Forum member organizations.
UtilitiesOEMsEPCi Engineering and DesignShipping and TruckingLogistics and ForwardingPortsSuppliers of ManpowerLearning Institutions
DONG EnergyMHI VestasMT HøjgaardRambøll Offshore WindA2seaBlue Water ShippingPort of EsbjergApro WindAalborg University
VattenfallSiemens Wind PowerPer AarsleffBlaaholmTorben RafnDeugroPort of GrenaaAlpha Offshore
E.OnEnvision Granly Engineering Nils Winther Total Wind
Bladt Industries Thomas as Global Wind Service
Semco Maritime AH Industries Solutions VB Enterprise
R&D
Table 4. Specialized CRF Group 4 O&M logistics member composition.
Main CRF Forum Members Also Participating in Group 4Specialist Firms in Group 4 (Rounds 1 and 2)
DONG EnergyHvide Sande Skibs og Både Byggeri
VattenfallDansk Offshore Transport
E.OnValling Ship Management
Siemens Wind PowerEsvagt
A2SeaDanish Yacht
DBB Jackup/ZitonWorld Marine Offshore
Thomas asUni-Fly
Niels Winther ShippingK2 Management
Port of EsbjergMaersk Broker
Aalborg UniversityWaypoint North/SeaState Aviation
Siemens Service
Oddfjell Windservice AS
FairWind
Table 5. Cost line items in the logistics base case study (table developed based on [68]).
Contract PackageAdditional ExplanationMinimum (GBP)Maximum (GBP)Logistics Factor
Onshore logisticsShore base400,000700,000100%
WorkboatsCrew transfer vessels (CTVs)2,000,0003,000,000100%
AviationHelicopters1,500,0003,000,000100%
Crane barge servicesWind turbine installation vessels (WTIVs)4,000,00012,000,000100%
Senior authorized person and marine co-ordinationOn-site senior authorized person, monitoring of vessels/personnel 24/7400,000800,000100%
Export cable surveys and repairsSurveys, repairs, remotely operated vehicle (ROV), cable laying vessels (CLVs)50,000200,00080%
Array cable surveys and repairsSurveys, repairs, ROV, CLVs200,000500,00080%
Scour and structural surveysDivers, ROVs, surveys, inspections, repairs, survey vessels200,000600,00080%
Foundation repairsPaint, cleaning, grout, scour, repairs, lighting, vessels100,000600,00080%
Offshore accommodation/baseFixed platform or floating (floatel, service operation vessel [SOV])10,000,00020,000,00070%
Lifting, climbing & safety equipment inspectionsInspections, drills, certified personnel, vessels100,000200,00060%
Offshore substation maintenanceInspections, services, repairs, paint, WTIVs, CTVs50,000200,00040%
AdministrationFinancial reporting, public relations, procurement, inventory/HSSEQ/permits management, administration200,000500,00020%
Onshore electricalSkilled personnel, some logistics20,000100,00010%
Turbine maintenanceSkilled personnel2,000,0008,000,0000%
Turbine spare parts, components, consumablesExcl. storage and sourcing3,000,0006,000,0000%
SCADA and condition monitoringData monitoring, analysis400,000800,0000%
Daily weather forecastingWind, wave, atm pressure, precipitation, temperature, visibility40,00090,0000%
24,660,000.-57,290,000.-
Table 6. Missing line items in most detailed levelized cost of energy related cost study.
Line ItemSourceIncluded in This Study
Seabed rentalThe Crown Estate 2012 [1]No
InsurancePrognos and Fichtner Group 2013 [2]No, found to be able to explain about 25% of the delta from O&M to OpEx
Transmission chargesThe Crown Estate 2012 [1]No
Weather windowsMay 2016 [46]No
Lost revenueDinwoodie and McMillan 2013 [45]No
Vessel availabilityMay 2016 [46]No
Table 7. The logistics costs share range of operational expenditure.
Logistics CostsMinimum Cost LevelsMaximum Cost Levels
Cost line items with a logistics factor of 100%17%17%
All cost line items with logistics factor applied32%31%

