
Aggregators’ Optimal Bidding Strategy in Sequential Day-Ahead and Intraday Electricity Spot Markets


Department of Electrical Engineering, Universidad Carlos III de Madrid, Avenida de la Universidad 30, 28911 Leganés, Madrid, Spain
*
Author to whom correspondence should be addressed.
Energies 2017, 10(4), 450; https://doi.org/10.3390/en10040450
Submission received: 2 February 2017
/
Revised: 21 March 2017
/
Accepted: 22 March 2017
/
Published: 1 April 2017
(This article belongs to the Special Issue Distributed Energy Resources Management)
Abstract
:This paper proposes a probabilistic optimization method that produces optimal bidding curves to be submitted by an aggregator to the day-ahead electricity market and the intraday market, considering the flexible demand of his customers (based in time dependent resources such as batteries and shiftable demand) and taking into account the possible imbalance costs as well as the uncertainty of forecasts (market prices, demand, and renewable energy sources (RES) generation). The optimization strategy aims to minimize the total cost of the traded energy over a whole day, taking into account the intertemporal constraints. The proposed formulation leads to the solution of different linear optimization problems, following the natural temporal sequence of electricity spot markets. Intertemporal constraints regarding time dependent resources are fulfilled through a scheduling process performed after the day-ahead market clearing. Each of the different problems is of moderate dimension and requires short computation times. The benefits of the proposed strategy are assessed comparing the payments done by an aggregator over a sample period of one year following different deterministic and probabilistic strategies. Results show that probabilistic strategy reports better benefits for aggregators participating in power markets.
1. Introduction
The smart grid will be the future standard at the distribution level, after generalization of active demand and distributed generation, mainly from renewable energy sources. The spread of automation and control is currently a major challenge for regulators and grid operators and it also opens a large field of opportunities to make a better use of all of the available resources in the grid, in order to achieve a safer, cheaper, and more sustainable electric supply [1]. In this context and from the demand side, a new player emerges: the aggregator, which could encompass the role of a retailer, a flexibility manager, and a balanced responsible party or market agent [2,3,4,5]. The participation of the aggregator in the power markets is relatively new since it exploits the flexibility of customers, as well as the optimal management of distributed generation resources. The aggregator needs to solve optimal scheduling and bidding problems to manage their prosumers’ resources and participate in the power markets in an efficient way. However, the approach from the aggregator point of view is new and different from traditional producers and retailers regarding the supply-demand balance, the bounds of the possible imbalance incurred by the aggregator, and the uncertainties involved in the problem. Considering these differences, the optimal participation of an aggregator in sequential electricity spot markets (only day-ahead and intraday markets are considered), with the objective of minimizing the cost of the traded energy is addressed in this paper.
Optimal scheduling problem is addressed in the literature in different ways, for instance the objectives functions including maximization of profits, social welfare, utility for the demands and minimization of energy capacity, and cost of imbalances and operational costs are considered in References [6,7,8,9,10]. The focus on the optimal bidding problem involves different objectives, some of which are the minimization of negative returns and the cost related to emissions in [11], evaluation of different prosumer risk tolerance in [12], as well as jointly minimizing the risk and maximizing profits in [13,14,15]. The bids to submit to the electricity market depends on the energy market rules and many solutions of the bidding problem result in one optimal price-energy pair [16] for a certain time period, but a more realistic bid consists of a curve composed of multiple price-energy pairs, as that presented in references [17,18]. There are few documents in the literature concerning both scheduling and bidding problems; for instance, in [19], a two-stage stochastic mixed integer linear program where the bidding decision is made in the first stage and the scheduling in the second is solved for aggregators that sell electricity to prosumers and buy back surplus electricity in the spot market.
In practice, the aggregator must face some difficulties, mainly related to the uncertainties of the intermittent and non-dispatchable nature of renewable energy sources (RES) generation, but also because the demand and the energy prices cannot be accurately predicted in advance. Moreover, the forecast errors derive unpredictable imbalances between the real-time production/consumption and the energy previously scheduled in the electricity market. Imbalance penalties also depend on the energy market rules. Some works in the literature such as [20] envisage the likely imbalances leading to unpredicted imbalance costs. In [7], penalties for failure to supply the market and customers are considered. Penalties due to over-production or under-production status are penalized with different values of a weight coefficient introduced into the model [12]. In [19], since they penalize imbalances heavily, the case becomes not realistic because avoiding imbalance is forced. In this formulation, it is assumed that market prices, loads, and generation are known with certainty before the optimal schedule is decided, and they then run a deterministic optimization for the scheduling process, but only market results are revealed. In our work, realistic imbalance prices and day-ahead market results are considered. The penalties due to deviations of a wind power producer are formulated in references [17,21], but in our case we are considering an aggregator, and then the problem is different. In [22], the formulation of deviations and its penalizations is like our proposal, but they assume that only unidirectional bids are allowed for the aggregator in the electricity market, i.e., it can only buy energy but cannot sell excessive energy back to the wholesale energy market.
Participating in intraday markets is a way for any market participant to reduce the forecast error costs, updating previous day-ahead scheduling as in [23]. The cost of the purchased energy can also be reduced in this market as in [24]. In addition, the flexibility offered by shiftable demand and battery storage also contributes to an increase of the expected benefit of the aggregator as shown in [25]. This flexibility allows the aggregator to shift the consumption from peak hours to valley hours, buying energy at low-cost hours, selling it at high-cost hours, and reducing the energy imbalance caused by bid deviation.
The optimal bidding in the day-ahead market taking into account all subsequent markets as intraday or balancing markets is assessed commonly in the literature. However, profit comparisons of taking into account or not the intraday markets when preparing the bidding for the day-ahead market (coordinated or separate bidding) are questioned in previous works, such as [26,27]. Additionally, several optimization techniques are widely used to solve the optimal bidding problem under uncertainty, such as modified particle swarm, stochastic, robust, fuzzy, model predictive control in [7,9,28,29] and other metaheuristic techniques, whose effectiveness and efficiencies considering different initial solution algorithms are compared in [30]. In [31,32], a comparison between the stochastic and robust optimization with the perfect information case is carried out and the results show that stochastic programming provides better solutions. However, new optimization techniques and improvements over the existent techniques are still under research.
The proposed approach solves separate probabilistic optimization problems, which considers the uncertainty of market prices (day-ahead and intraday), RES generation and fixed demand, and takes into account the possible imbalance costs the aggregator may incur. We assume a neutral risk aggregator, because reducing risk through changing operating decisions can be costly compared to financial operations [33]. The imbalances are regulated by a dual pricing mechanism that implies penalizations for those incurring energy deviations against the system [34]. The proposed probabilistic approach is based on the formulation presented in [35] and the work presented in this paper extends the method presented in [36] by considering the intraday market, and improves the mathematical formulation of the problem.
Our approach differs from other works in the literature and the main difference with related previous works is that we consider an independent bidding strategy in each electricity spot market, which allows taking advantage of both the gain in certainty of forecasts and the knowledge of previous market results. We also take into consideration time dependent constraints. The optimization problems proposed here are set for a whole day aggregator’s portfolio that includes shiftable demand, RES generation, and batteries. A simple modelling of shiftable demand is used with the purpose of testing the method. A thorough modelling of this demand is out of the scope of the paper. Furthermore, the method of aggregating and coordinating the flexibility of customers is out of the scope of this paper, since it requires much information on customers’ behavior and preferences that is not available. The intended contributions of this paper are listed as follows:
- (1)
- To propose a simple and effective optimization model that provides hourly optimal bidding curves for an aggregator who manages fixed and shiftable demand, RES generation, and storage devices when participating in the electricity markets (daily and intraday markets), aiming to minimize the daily energy cost.
- (2)
- To include in the optimization model in (1) the different uncertainties faced by the aggregator, namely fixed demand, RES generation and market prices, and the possible imbalance costs in which the aggregator may incur.
- (3)
- To assess the benefits of the optimization model in (1) over a whole year comparing the yearly payments performed by the aggregator under different strategies using realistic data taken from publicly available sources; case studies based on a whole year with realistic data are not widely assessed in the literature.
The paper continues with some previous considerations regarding the market framework and the uncertainty of the random variables involved in Section 2. Then, the main assumptions and constraints are described in Section 3. The formulation of each decision-making problem follows in Section 4. Next, Section 5 describes the case study and in Section 6, the participation of an aggregator in the Spanish electricity market is simulated over a year, considering different strategies in order to assess the benefits of the proposed approach. Conclusions and future work are given at the end of the paper.
2. Previous Considerations
Consider an aggregator that represents a cluster of prosumers with RES generators (wind and photovoltaic) and storage devices (batteries). If this aggregator wants to participate in the electricity markets (day-ahead and intraday markets), he has to solve different decision-making problems that involve uncertainties (demand, RES generation, and market energy prices), with the aim of minimizing the cost of the daily traded energy. The aggregator is considered as a price taker, because its participation does not affect the resulting market prices. The participation in the reserves market is not considered. The approach for the aggregator decision-making process follows the sequence of the markets considered and therefore optimization problems may be solved independently, deriving the optimal bidding curves to be submitted first to the day-ahead market and next to the intraday markets. The market framework is based in the Iberian electricity market [37] because it has a more liquid intraday market compared with other European intraday markets (most of them with continuous trading implementing a pay-as-bid matching algorithm). According to [38], the Spanish intraday market has effectively contributed to RES generation balancing and, intermittent energy sources have more flexibility to bid in this market aimed at the maximization of their economic profits.
The optimization problems solved by the aggregator and their mathematical formulations are detailed in Section 3 and Section 4.
2.1. Market Framework
The energy traded in the Iberian electricity spot market is managed by OMIE (the Spanish division of the Iberian Energy Market Operator), which is in charge of collecting orders, clearing the markets, and publishing results, available in [39,40]. Most of the energy is negotiated in the day-ahead market (or daily market) where purchase and sale bids for day D must be sent to OMIE before the gate closure at 12 a.m. of day D-1. Once the daily market has ended, and until 12:45 p.m. of the following day, six sessions of the intraday market are held, which allow participants to adjust their generation and consumption schedules to their best forecasts for their real-time needs. The agents who have participated in the day-ahead market have there an opportunity to change their energy bids to reduce their imbalances. A review of different European market designs and the importance of sufficient liquidity in intraday markets can be found in [41], which concludes that the Spanish mechanism auctions is considered the most attractive market design for systems with a high share of non-dispatchable generation. Finally, the Transmission System Operator (TSO) is in charge of ensuring a balanced and secure system operation. The net energy system imbalance between generation and demand is corrected through the balancing services, whose costs are covered by those incurring imbalances. In the Iberian market, a dual imbalance pricing mechanism is followed, where the imbalance prices depend on the sign of the net system imbalance. Thus, if an aggregator incurs a positive imbalance (higher production or lower consumption than scheduled) in any period of time, then the energy surplus is paid at the sell imbalance price (), lower than or equal to the day-ahead market price (). On the contrary, if the imbalance is negative (lower production or higher consumption than scheduled) at any time, the energy deficit must be bought at the buy imbalance price (), higher than or equal to the day-ahead market price. The relation between the imbalance prices and the market price at any time period t may be written as follows:
2.2. Predictions and Uncertainties
In the decision-making problem faced by the aggregator, there are three main sources of uncertainty: demand, RES production, and market prices. This uncertainty increases with the horizon of the forecast; thus, it is greater in the day-ahead market than in the intraday market. The uncertainty can be obtained by some prediction programs [42] and the aggregator can use this information to produce optimal bids to the market. However in this work, given that no prediction programs were available, the uncertainty is modelled through scenarios, i.e., we try to reproduce the results of prediction programs by creating scenarios from a given time series.
Scenarios are created in two steps:
- (1)
- First, the basic trajectories of forecasts are generated from historical data or synthesized production series.
- (2)
- From the basic trajectory and using an autoregressive time series AR(1) for modelling the forecast error, the desired number of equiprobable scenarios for each time period t are created.
Note that uncertainty characterization or scenario generation is not a goal of this work because the uncertainty quantification would come, in reality, from advanced forecasting tools, as said before. A brief description of the random variables considered in this work is given. An example of basic trajectories and scenarios generated is given in Section 5.2.
2.2.1. Demand
Demand is divided into two kinds, namely fixed and shiftable demand. Fixed demand is supplied to the user at any time without restrictions (within the limit of the contracted power), but its value is not known beforehand, and the aggregator must forecast it. It might correspond to certain manually operated appliances or systems such as lighting, computers, etc. Shiftable demand can be shifted along a given time period but it is assumed that the daily amount of the energy required by this shiftable demand is known and previously agreed on between the aggregator and his customers through a contract, which reflects the will of the aggregator’s customers in shifting their consumption along the day. It could correspond to electric vehicles, or noncritical devices such as washing machines, dishwashers, etc. Thus, only fixed demand uncertainty is considered in this paper through scenario generation.
2.2.2. RES Generation
Only renewable energy (solar and wind generation) is considered in the study. Hence, the aggregator must forecast the power supplied by RES generators for the considered time interval. For the basic pattern of solar production, a site is chosen in order to fit real conditions, and the basic trajectory is obtained as in [43]. For the wind production, wind speed scenarios are generated from a basic trajectory of wind speed. Once the wind speed scenarios are generated, they are transformed into power scenarios through the power curve associated to the turbine model of the wind farm.
2.2.3. Fixed Demand Minus RES Generation
Once scenarios of RES generation (photovoltaic and wind production) and fixed demand are obtained, a new random variable () can be defined as the fixed demand minus photovoltaic and wind productions, for any period of time t and scenario s.
These random variables are not independent, but their predictions errors are.
2.2.4. Energy and Imbalance Prices
The aggregator must also perform forecasts of energy prices. Day-ahead market price scenarios and intraday market price scenarios can be created from historic prices of a given period. Imbalance prices are modelled in a simpler way: since they are extremely volatile, an hourly constant ratio between the imbalance price and the daily energy price is taken, as in [20]. Thus, the uncertainty of imbalance prices is not modelled directly.
2.2.5. Global Uncertainty
Thus, the uncertainty characterizing the aggregator bidding problem in day-ahead/intraday market is modeled through a symmetric scenario tree that is specifically built as follows:
- (1)
- Generate Ndp/Nip price scenarios for the day-ahead/intraday market.
- (2)
- From the basic trajectory and using an autoregressive time series AR(1) for modelling the forecast error, the desired number of equiprobable scenarios for each time period t is created. For each realization of the day-ahead/intraday market prices, generate Ndr/Nir wind power realizations, Ndr/Nir photovoltaic power realizations, and Ndr/Nir fix demand realizations, and calculate the Ndr/Nir realizations of the new variable fix demand minus RES generation with (3).
Hence, the total number of scenarios composing the tree is Nw = Ndp·Ndr for the day-ahead market and Niw = Nip·Nir for the intraday market.
3. Optimization Problem Assumptions and Modelling Details
This section presents an overview of the optimization process as well as the constraints that should be considered. The mathematical formulation of the problem is given in the next section.
The aggregator participates in the day-ahead market in order to purchase the net energy for his customers’ portfolio. With this purpose, the aggregator solves a probabilistic optimization problem resulting in the optimal quantity of energy to be purchased (or sold) in each period of time, depending on the market price. Once the day-ahead market is cleared, and the scheduled energy for each period of time is known, it may happen that the constraints related to the flexible demand (shiftable demand and batteries) are not fulfilled, and the aggregator performs an adjustment process of scheduling in order to ensure the fulfillment of constraints within the time horizon. For the intraday market, the aggregator can update his previous market position aimed at minimizing the total cost of the energy, using fresh and more accurate predictions and the knowledge on day-ahead market prices and flexible demand schedule. The complete process of the aggregator’s participation in sequential electricity markets is illustrated in Figure 1. Note that the day-ahead (DA) and intraday (ID) market clearing processes are performed by the Market Operator (MO), and thus they are external to the aggregator.
In the problem formulation, it has been assumed that:
- (1)
- The energy prices in the market are not affected by the aggregator bids, because the market is large enough.
- (2)
- The aggregator buys and purchases energy at the same price, i.e., grid access tariffs have not been included. Losses are included, according to the Spanish regulation, as a fixed percentage of the demand, added to the forecasted consumption.
The aggregator must solve two different decision-making problems involving uncertainties, one for the day-ahead market and another for the intraday market. Furthermore, the aggregator must solve two additional optimization problems in order to schedule the flexible demand after the day-ahead market clearing. When solving those problems, the aggregator has to take into account several constraints related to shiftable demand, batteries, RES generation, and energy imbalances, as described next. In the following subsections, all the decision variables are denoted with a superscript s representing a generic scenario s.
3.1. Shiftable Demand
This demand can be shifted over a given period of time but the amount of the daily energy to be consumed is known and previously agreed upon between the aggregator and his consumers through a contract. It could correspond to electric vehicles, or noncritical devices such as washing machines, dishwashers, etc. The optimization process will tend to shift this demand to lower price hours. Regarding this type of demand, (4) defines the total energy consumed by the shiftable demand, for a certain scenario s over a planning horizon of Nh periods of time. This equation could be reformulated if the periods of time for consumption are limited to a given set (e.g., tariff charging of electric vehicles during the night). Equation (5) models the bounds of the hourly shiftable demand for any period of time t and scenario s.
3.2. Batteries
Batteries are modelled in a simple way (rated power, maximum/minimum capacity) as in [24], but in this paper losses are also included, which are considered as constant. The following constraints must be satisfied for any period of time t and any scenario s:
The constraint (6) set the bounds of the rated power. The binary variable avoids battery charge and discharge at the same time step; it is equal to 1 if batteries are discharging in period t and 0 otherwise. Constraint (7) set the limits of the storage energy, respectively. Here, the level of battery storage at the end of the scheduling horizon is equal to its initial energy level. It is assumed that to exploit the flexibility of the batteries during the first periods of time of the horizon. Constraint (8) represents the energy balance in the batteries. Note that no battery degradation costs are considered in this work because we have compared the results from the participation of the aggregator in the power markets for the next day or few hours before the energy delivery time.
3.3. Energy Imbalances
The imbalance which the aggregator could incur is defined as the gap between the energy traded in the electricity market (day-ahead or intraday) and the actual consumption/production. If the actual energy of the aggregator is greater than the scheduled energy in the market, the aggregator’s imbalance is positive, otherwise it is negative. Note that this is different from the point of view of a producer.
As the aggregator’s imbalance makes the problem nonlinear, in order to keep the linearity, Equation (9) decomposes the energy imbalance into positive and negative imbalances, as in [35,44]. Constraint (10) set the limits of the imbalances, which could reach the sum of the contracted power (maximum buying bid) and the installed generating power (maximum selling offer) in both senses, for any period of time t and scenario s.
4. Problem Formulation
In this section the probabilistic formulations of the proposed method are presented.
4.1. Day-Ahead Market
The aim of the aggregator is to buy energy in the day-ahead market at the minimum cost, taking into account the likely imbalance cost. This problem is formulated as a mixed integer linear probabilistic programming of one stage. The number of scenarios considered is Nw = Ndp∙Ndr, with Ndp being the number of day-ahead market prices scenarios, each one with a probability of occurrence , and Ndr as the number of fixed demand minus RES production scenarios, each one with a probability of occurrence . It is assumed that both random variables are independent because the size of the aggregator is small compared to the market. Thus, the probability of occurrence of scenario w is . Then the optimization problem may be formulated as follows:
subject to constraints (3)–(10),
The objective function in (11) is the expected cost of the energy traded by the aggregator in the day-ahead market considering the possible imbalance cost. The first term corresponds to the cost from the purchase of energy and the second term to the cost due to the imbalance. It must be remarked that only one direction of the net system imbalance is possible at a given period of time. The first term in (11) is affected by the daily price probability because it depends only on the scenarios of energy prices at this market whereas the second term is affected by the global probability . Constraints (3)–(10) have already been explained in Section 3. Equation (12) defines the deviation of the aggregator in each period of time t and scenario w of the day-ahead market. Constraint (13) forces the bidding curves to be monotonically decreasing, which is a requirement in most markets. Constraint (14) limits the amount of power that can be sold or purchased in the day-ahead market in any period of time t and scenario dp.
The optimization problems (3)–(14) derive the Nh bidding curves, one for each period of time t of the time horizon, with Ndp pairs of possible values of energy-price, which correspond to the scenarios of the energy prices. It must be remarked that constraints related to shiftable demand (4) and batteries (6) and (7) are fulfilled for every scenario, but it may happens that after the market clearing, the committed energy for each period of time corresponds to different scenarios, and thus, those constraints will not be satisfied. A possible solution is to perform an adjustment process for rescheduling the flexible power, as explained below, but other solutions could be followed.
4.2. Flexible Power Scheduling
Once the day-ahead market is cleared and the daily prices and the committed energy are already known, the flexible power, i.e., the power from/to batteries and the shiftable demand, must be scheduled to ensure the satisfaction of constraints (4), (6), and (7). This flexible power is optimized along the time horizon according to the daily market price . The batteries are adjusted with the objective function (15) and constraints (6)–(8), whereas the shiftable demand is optimized with the objective function (16) and constraints (4) and (5), in which market results are used. It should be remarked that only one scenario is considered in this process.
4.3. Intraday Market
The aggregator participates in the intraday market in order to correct the previous position taken in the day-ahead market, and it is assumed that the aggregator corrects the position only once for each period of time, participating in the ID market session closer to that period.
At this market level, daily market prices are already known, the flexible power (power from/to batteries and shiftable power) has been scheduled and new forecasts of intraday energy prices, fixed demand, and RES production are available, thus the global uncertainty decreases. The number of scenarios considered in this problem is Niw = Nip·Nir, with Nip being the number of intraday market price scenarios, each one with a probability of occurrence , and Nir as the number of fixed demand minus RES production scenarios, each one with a probability of occurrence . Again, it is assumed that both random variables are independent and therefore the probability of occurrence of scenario iw is . The optimization problem in the intraday market may be formulated as follows:
subject to constraints (3), (9), and (10),
the objective function (17) is the expected cost of the traded energy by the aggregator in this market, envisaging the likely imbalance cost. The first term in (17) corresponds to the cost from the purchase/sale of the energy in the intraday market and it is affected by the intraday energy price probability , since this term only depends on the intraday market price scenarios. The second term in (17) represents the final imbalance cost which the aggregator can incur and it is affected by the global probability . The intraday market bids can be positive (purchase of energy) or negative (sale of energy) and this has an effect over the total traded energy and the final imbalance at the end of both markets, defined in (18), where the terms with an upper index d correspond to results from the day-ahead market or the scheduling process for the flexible demand carried out after the day-ahead market clearing. Equation (19) forces the bidding curves to be monotonically decreasing and constraint (20) set the limits of the total offered power in both markets.
The optimization problem (3), (9)–(11), and (17)–(20) derive Nh bidding curves, one for each period of time t of the time horizon, with Nip pairs of possible values of energy-price, which correspond to the scenarios of intraday market energy prices.
5. Case Study
The performance of the proposed method has been assessed through a case study where the aggregator participates in the Spanish electricity market [45] over a period of one year. Following the rules of this market, the schedule for updating bids in the intraday market for day D is depicted in Table 1. For example, the bids for hourly periods 1 to 4 of day D are updated in the second ID market session. In this way, the lead time for the six existing intraday markets spread throughout the day varies from 3 to 4 h until 5 to 8 h.
Input data used in this realistic example is explained below. The entire problem was modelled in Matlab R2015a (version 8.5.0.197613, The Mathworks, Inc., Natick, MA, USA).
5.1. Grid Data
The data of consumers and generators are taken from the Conseil International des Grands Réseaux Électriques (CIGRE) medium voltage European benchmark grid [46]. Dispatchable units have not been included because they do not add uncertainty to the problem. The total installed generating power capacity considered is 1710 kW, with 1500 kW of wind power and 210 kW of photovoltaic power. The total load is 5291.6 kW, with 3843.6 kW and 1448 kW of fixed and shiftable demand, respectively. The storage consists of two batteries of 600 kW and 200 kW with 90% charge and discharge efficiency. The total capacity is 1600 kWh and the initial/final capacity in the batteries is taken as 80 kWh.
5.2. Forecast Data Scenarios
The set of scenarios for the probabilistic problems was created from available real data from the year 2013. Energy prices were taken from the web of the Spanish Market Operator [39]. Twenty-four ratios and for the imbalance prices were estimated for each hour of the day as an hourly average of the 365 values of each hour of the year 2013. The average energy prices analyzed with their standard deviation during the whole year are shown in Table 2.
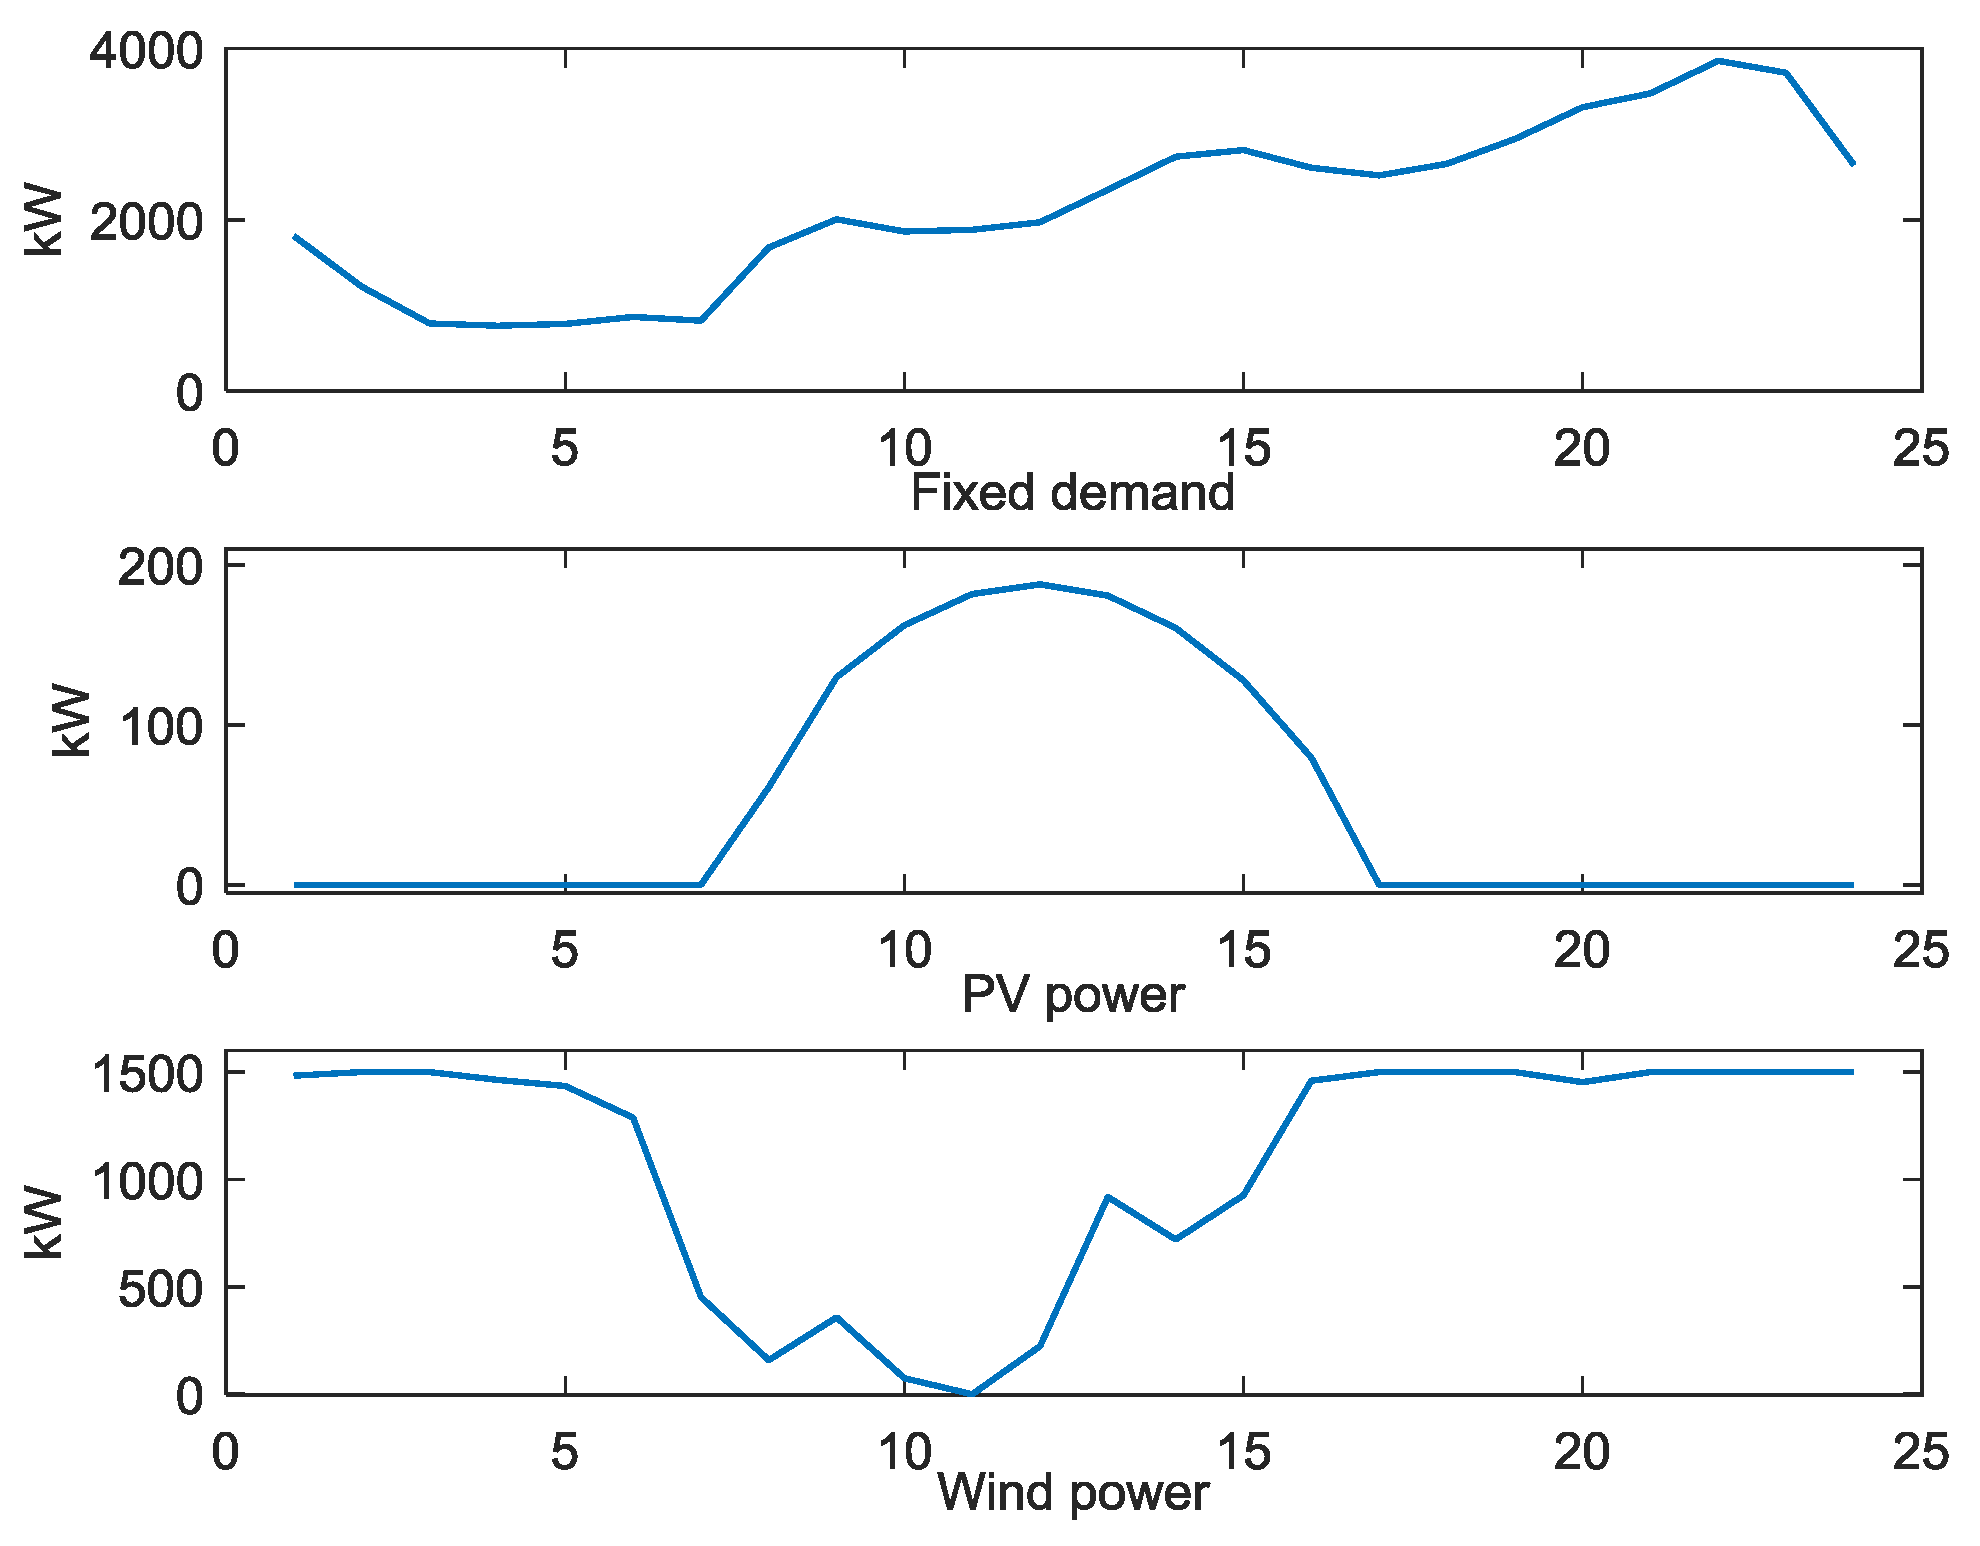
Scenarios of photovoltaic power were created from a synthesized production pattern of a solar plant located in Girona, Spain. The wind power scenarios were produced from data of a real wind farm that was used as a basic trajectory. A typical demand profile for residential customers from the Spanish System Operator Red Eléctrica de España (REE) [47] was used to create the probabilistic scenarios of demand. An example of the basic trajectories of demand and RES generation for a winter day in January is depicted in Figure 2.
The number of total scenarios created for each one of the probabilistic optimization problems (day-ahead and intraday markets) was 106, 1000 for energy prices and 1000 for fixed demand minus RES production. Given the large number of scenarios created, a backward scenario reduction algorithm [48] was used to decrease the computational complexity and time, while preserving the most representative scenarios. Thus, the final number of scenarios was 200 (10 for energy prices and 20 for fixed demand minus RES production). From the basic trajectories shown in Figure 2, the reduced scenarios for the random variable for the day-ahead and intraday markets are depicted in Figure 3.
The normalized mean squared errors (NMSE) for each set of forecasts are shown in Table 3. Note that the forecast error for fixed demand is adequate, taking into account that the level of aggregation is low (the more aggregation, the lower forecast error); a NMSE of 13.6% corresponds to a maximum root mean squared error of 98 kW. The reduction of the PV forecast error from 24% to 15% has been considered analogous to the improvement of the new statistical learning methods over the numerical weather prediction model output, which is 10–15% [49]. We have considered that this reduction of the error is reasonable and it is enough for the purposes of the paper.
5.3. Assessment of the Possible Aggregator Strategies
Different strategies are compared to assess the benefits of the proposed method along a year (8760 periods of one hour). These strategies refer to the participation or not in the intraday market and the application of the proposed probabilistic optimization compared to a more conventional deterministic one, as in [36]. The comparison among them is based on the annual payment performed by the aggregator, calculated with (21), where the first summation represents the payment in day-ahead and intraday markets for the purchase of energy over the period, and the second one is the payment due to the true real-time energy imbalances. If the aggregator only participates in the day-ahead market, the second term of the first brackets is null.
6. Results
Given the uncertainty involved, the results of each market optimization problem are the bidding curves that would minimize the cost of the traded energy in the corresponding market. Each curve consists of 10 pairs of values of energy and price (one for each price scenario considered). Figure 4 shows the day-ahead optimal bidding curves for some hours of a sample day. For instance, the bidding curve for t = 9 h means that the aggregator would buy 4082 kWh if the market price is less than 6.37 c€/kWh at this hour, but he would buy 3717 kWh if the price were higher.
Figure 5 shows the optimal bidding curves for different hours and different intraday market sessions. Some curves change from positive (buy) to negative energy values (sell), reflecting the aggregator’s opportunity of submitting buying or selling bids for each hour aiming to update the committed energy at the day-ahead market framework.
6.1. Benefit Comparisons
6.1.1. Case 1: Participation Only in the Day-Ahead Market
In this case, the aggregator decides to only participate in the day-ahead (DA) market representing a cluster of RES generators, batteries, and fixed and shiftable demand. In Table 4, the annual payment made by the aggregator following a deterministic and a probabilistic strategy are shown. This payment has been disaggregated in both terms of (21). The deterministic strategy does not consider the uncertainty and the likely imbalances, and is formulated as in [36]. The results show a reduction in the payment made with a probabilistic strategy over a deterministic one of 1.7%. Note that the probabilistic strategy leads to a higher purchase of energy in the DA market. In Table 4, the negative sign of the payment for the probabilistic net imbalance means that the imbalance term represents an income, i.e., there were more hours in which the consumption scheduled in the day-ahead market was greater than the actual consumption of the aggregator’s customers, and this energy difference was paid at the positive imbalance price.
6.1.2. Case 2: Participation in the Day-Ahead and Intraday Markets
If the aggregator also decides to participate in the intraday (ID) markets, several strategies could be followed, depending on the type of the optimization problem followed in each market (probabilistic (Prob) or deterministic (Det)); the strategies considered in this work are depicted in Table 5. The annual payments derived from each strategy are compared in Table 6. As in Table 4, the payment is disaggregated in payments in the markets and payments due to the imbalances; the last row shows the gain in payment obtained by following the different strategies over the pure deterministic one (strategy S1). It may be thought that, given the high uncertainty at the time of the day-ahead market regarding RES generation random variables, strategy S2 could be good enough (a gain of 2.84% over strategy S1 is achieved), but the results show a better performance of the strategy S3 proposed in this work, which leads to a benefit of 4.06% over strategy S1.
From Table 6, it is seen that payments done in the markets increase from strategies S1 to S2 and S3, but the total payments decrease. This is due to the behavior of the imbalance term. With strategy S1, the aggregator pays 8 k€ because of the deviations, but with strategies S2 and S3, the aggregator is paid because of the deviations (negative payment), meaning that positive deviations have been more frequent than negative deviations.
An in-depth analysis of each type of payment in Table 6 is performed next. First, the comparison between the energy traded in each market for the best and worse strategies (i.e., strategies S3 and S1, respectively) is shown in Table 7, distinguishing buying and selling energy. Second, the comparison between the total energy deviations incurred by the aggregator after the participation in the markets is included in Table 8.
From Table 7, it is derived that the consideration of the uncertainties leads to a greater quantity of energy traded in the markets (with the probabilistic strategy S3, the aggregator trades more energy than with the deterministic one S1), and thus the net payment in the markets is also higher, as shown in Table 6. As the net position in the ID market is selling energy, the aggregator tends to purchase an excess of energy in the DA market with both strategies, but this effect is more accentuated with the strategy S3. The reason may be that strategy S3 takes into account the possible payments due to imbalances, and while sell imbalance prices are limited (0 ≤ ≤ ), buy imbalance prices could reach very high values. Then, it is seen that the aggregator tends to trade more energy in the markets with a knowledge improvement. From Table 8, it can be said that: energy deviations are reduced with the participation in the ID market, as expected; and the probabilistic strategy leads to higher energy deviations than the deterministic one.
For a better understanding of the payments made due to energy deviations (Net Imbalance term in Table 6), approximate probability density functions (PDF) of the annual energy deviations and the payment/revenue derived from the deviations are shown in Figure 6 and Figure 7 for strategies S3 and S1. Figure 6 shows the results after the participation only in the DA market, whereas Figure 7 shows the results after the participation in the ID market (having participated in the DA market). After the participation in the DA market, it can be remarked in Figure 6a that the energy deviations derived from the deterministic strategy S1 are symmetrically distributed with a slightly displacement to the negative side. By contrast, energy deviations derived from the probabilistic strategy S3 have a right-skewed bi-modal distribution, showing higher positive imbalances (i.e., real-time demand of energy lower than scheduled in the DA market), both in number and value, although most of the imbalances are associated with the left mode. If the aggregator participates in the ID market after the DA market, the PDFs of final energy deviations are shown in Figure 7a. In this case, the imbalances from the deterministic strategy S1 do not present any significant variation but most of the imbalances from the probabilistic strategy S3 are now located around the mean. Also, the tails are longer than in Figure 6a, which means that there are few values of deviated energy higher than in the DA market.
Regarding the payment/revenue derived from the energy deviations, it can be seen in Figure 6b and Figure 7b that:
- Using the deterministic strategy S1, its variability after the ID market decreases compared to the variability after the DA market, but with the probabilistic strategy S3, the payment/revenue variability increases after the ID market.
- With the probabilistic strategy S3, the PDFs present a right-skewed distribution compared to the deterministic S1, which means that the probability of the aggregator to be remunerated for a positive imbalance is higher with S3 than with S1.
Thus, the probabilistic approach tends to maximize the revenue due to positive deviations and minimize the payment due to the negative deviations. The deterministic strategy does not consider this, leading to a higher payment. The probabilistic strategy may also benefit from arbitrage between the ID markets and the imbalance prices, selling or buying in the ID market, when the expected imbalance price is, respectively, lower or higher than the forecasted intraday market price. Of course, this strategy might lead to occasional losses, but the overall results are favorable. Risk-averse strategies to limit these losses are less profitable in the long term [20].
Overall, the proposed method has a good performance and the computation time is reduced (the computation time of both problems (day-ahead plus intraday) for a planning period of 24 h is around 15 s).
7. Conclusions and Future Work
A method for producing optimal bidding curves for an aggregator participating in day-ahead and intraday markets has been presented. The objective is minimizing the payment done by the aggregator for the energy purchase for his customers. The method consists of different optimization problems which considers flexible consumption through shiftable demand and the use of batteries, and takes into account the uncertainty of the forecasts (RES generation, market prices, and fixed demand) and the likely imbalance costs. The overall process is performed in three steps: First, the optimal bidding curves are produced and submitted to the day-ahead market; Second, after the day-ahead market clearing, intertemporal constraints related to the flexible consumption are fulfilled through a rescheduling process; and finally, new optimal bidding curves are produced and submitted to the intraday market, trying to take advantage of the lower lead time and the knowledge gained with the day-ahead market clearing about marginal prices. The payment done by an aggregator participating in the Iberian market, over a whole year, has been calculated and compared with the payments done using different strategies, yielding better results. A thorough analysis is performed comparing the probabilistic strategy proposed in this paper with a more conventional one. Results show that although the deviations in the proposed strategy are higher than in the deterministic one, the overall payments are lower because the probabilistic method tends to produce positive imbalances. This work demonstrates that simple and independent probabilistic optimization problems report meaningful benefits for aggregators participating in power markets.
In the future, we will extend the proposed method to obtain an optimal bidding and scheduling to real cases of urban and semirural grids of small size represented by the aggregator and including electric vehicles, and heating and cooling loads. Moreover, we will perform the assessment of likely scheduling for future scenarios of resources available in these grids.
Acknowledgments
This work was supported by the European research project IDE4L (Ref. FP7-SMARTCITIES-2013-608860) and the Spanish project RESmart (Ref. ENE2013-48690-C2-1-R).
Author Contributions
Xiaolin Ayón, María Ángeles Moreno, and Julio Usaola conceived and designed the experiments; Xiaolin Ayón performed the experiments; María Ángeles Moreno and Xiaolin Ayón wrote the paper and overall all authors set and refined the manuscript.
Conflicts of Interest
The authors declare no conflict of interest.
Notations
The main notations used throughout the paper is reproduced below for quick reference. Other symbols are defined as required.
| Indices and Numbers | |
| dp, ip | Indices of day-ahead/intraday market prices scenarios running from 1 to Ndp/Nip. |
| dr, ir | Indices of day-ahead/intraday scenarios of fixed demand minus renewable energy sources (RES) production running from 1 to Ndr/Nir. |
| t | Index of time periods running from 1 to Nh. |
| w, iw | Indices of day-ahead/intraday market scenarios of the global random variables running from 1 to Nw/Niw. |
| s | Index of generic scenarios (dp, ip, w, and iw). |
| Continuous Variables | |
| Energy stored in the batteries in time period t and scenario s [kWh]. | |
| Power from/to the batteries in time period t and scenario s [kW]. | |
| Shiftable demand in time period t and scenario s [kW]. | |
| Net power offered to the market in time period t and scenario s [kW]. | |
| Energy deviation incurred by the aggregator with respect to the schedule in time period t and scenario s [kWh]. | |
| Deficit of energy (positive deviation)/Excess of energy (negative deviation) incurred by the aggregator with respect to the schedule in time period t and scenario s [kWh]. | |
| Random Variables | |
| Fixed demand in time period t and scenario s [kW]. | |
| Photovoltaic generation in time period t and scenario s [kW]. | |
| Fixed demand minus RES production in time period t and scenario s [kW]. | |
| Wind generation in time period t and scenario s [kW]. | |
| Market price in time period t and scenario s [c€/kWh]. | |
| Constants and Data | |
| ps | Probability of occurrence of scenario s. |
| dt | Duration of the time period t (in hours). |
| Maximum/minimum energy in the storage system [kWh]. | |
| Daily limit of total shiftable energy [kWh]. | |
| Scheduled power from/to the batteries for time period t after the flexible demand scheduling process [kW]. | |
| Maximum power from/to the batteries [kW]. | |
| Total installed capacity and contracted power of the aggregator’s customers (prosumers) [kW]. | |
| Scheduled net power in day-ahead/intraday market for time period t [kW]. | |
| Scheduled shiftable demand for time period t after the flexible demand scheduling process [kW]. | |
| Maximum shiftable demand [kW]. | |
| Ratios between positive/negative imbalance price and day-ahead market price in time period t. A superscript est or true is added to indicate the estimated or true values. | |
| Efficiencies of giving back/storing energy of the batteries. | |
| Energy losses in the storage system [kWh]. | |
| Actual day-ahead/intraday market price in time period t [c€/kWh]. | |
| Actual deficit of energy (positive deviation)/excess of energy (negative deviation) incurred by the aggregator with respect to the schedule in time period t [kWh]. | |
References
- CIRED Working Group on Smart Grids. Smart Grids on the Distribution Level—Hype or Vision? CIRED’s Point of View, Final Report. 2013. Available online: http://www.cired.at/pdf/CIRED_WG_SmartGrids_FinalReport.pdf (accessed on 19 December 2016).
- Pudjianto, D.; Ramsay, C.; Strbac, G. Virtual power plant and system integration of distributed energy resources. IET Renew. Power Gener. 2007, 1, 10–16. [Google Scholar] [CrossRef]
- Momber, I.; Gómez, T.; Söder, L. PEV fleet scheduling with electricity market and grid signals charging schedules with capacity pricing based on DSO’s long run marginal cost. In Proceedings of the IEEE 10th International Conference on European Energy Markets, Stockholm, Sweden, 27–31 May 2013. [Google Scholar]
- Carrión, M.; Arroyo, J.M.; Conejo, A.J. A bilevel stochastic programming approach for retailer futures market trading. IEEE Trans. Power Syst. 2009, 24, 1446–1456. [Google Scholar] [CrossRef]
- Carrión, M.; Philpott, A.B.; Conejo, A.J.; Arroyo, J.M. A stochastic programming approach to electric energy procurement for large consumers. IEEE Trans. Power Syst. 2007, 22, 744–754. [Google Scholar] [CrossRef]
- Rahimiyan, M.; Baringo, L.; Conejo, A.J. Energy management of a cluster of interconnected price-responsive demands. IEEE Trans. Power Syst. 2014, 29, 645–655. [Google Scholar] [CrossRef]
- Bornapour, M.; Hooshmand, R.A.; Khodabakhshian, A.; Parastegari, M. Optimal coordinated scheduling of combined heat and power fuel cell, wind, and photovoltaic units in micro grids considering uncertainties. Energy 2016, 117, 176–189. [Google Scholar] [CrossRef]
- Dehghani, H.; Vahidi, B.; Hosseinian, S.H. Wind farms participation in electricity markets considering uncertainties. Renew. Energy 2017, 101, 907–918. [Google Scholar] [CrossRef]
- Zhou, Y.; Wang, C.; Wu, J.; Wang, J.; Cheng, M.; Li, G. Optimal scheduling of aggregated thermostatically controlled loads with renewable generation in the intraday electricity market. Appl. Energy 2017, 188, 456–465. [Google Scholar] [CrossRef]
- Soares, J.; Ghazvini, M.A.F.; Borges, N.; Vale, Z. A stochastic model for energy resources management considering demand response in smart grids. Electr. Power Syst. Res. 2017, 143, 599–610. [Google Scholar] [CrossRef]
- Parisio, A.; Glielmo, L. Stochastic model predictive control for economic/environmental operation management of microgrids. In Proceedings of the IEEE European Control Conference, Zürich, Switzerland, 17–19 July 2013; pp. 2014–2019. [Google Scholar]
- Ferruzzi, G.; Cervone, G.; Delle Monache, L.; Graditi, G.; Jacobone, F. Optimal bidding in a day-ahead energy market for Micro Grid under uncertainty in renewable energy production. Energy 2016, 106, 194–202. [Google Scholar] [CrossRef]
- Puglia, L.; Bernardini, D.; Bemporad, A. A multi-stage stochastic optimization approach to optimal bidding on energy markets. In Proceedings of the IEEE 50th Conference on Decision and Control and European Control Conference, Orlando, FL, USA, 12–15 December 2011; pp. 1509–1514. [Google Scholar]
- Shi, L.; Luo, Y.; Tu, G.Y. Bidding strategy of microgrid with consideration of uncertainty for participating in power market. Int. J. Electr. Power Energy Syst. 2014, 59, 1–13. [Google Scholar] [CrossRef]
- PandŽić, H.; Morales, J.M.; Conejo, A.J.; Kuzle, I. Offering model for a virtual power plant based on stochastic programming. Appl. Energy 2013, 105, 282–292. [Google Scholar] [CrossRef]
- Asensio, M.; Contreras, J. Risk-constrained optimal bidding strategy for pairing of wind and demand response resources. IEEE Trans. Smart Grid 2017, 8, 200–208. [Google Scholar] [CrossRef]
- Morales, J.M.; Conejo, A.J.; Pérez-Ruiz, J. Short-term trading for a wind power producer. IEEE Trans. Power Syst. 2010, 25, 554–564. [Google Scholar] [CrossRef]
- Nojavan, S.; Mohammadi-Ivatloo, B.; Zare, K. Robust optimization based price-taker retailer bidding strategy under pool market price uncertainty. Int. J. Electr. Power Energy Syst. 2015, 73, 955–963. [Google Scholar] [CrossRef]
- Ottesen, S.Ø.; Tomasgard, A.; Fleten, S.E. Prosumer bidding and scheduling in electricity markets. Energy 2016, 94, 828–843. [Google Scholar] [CrossRef]
- Moreno, M.Á.; Bueno, M.; Usaola, J. Evaluating risk-constrained bidding strategies in adjustment spot markets for wind power producers. Int. J. Electr. Power Energy Syst. 2012, 43, 703–711. [Google Scholar] [CrossRef]
- Laia, R.; Pousinho, H.M.I.; Melíco, R.; Mendes, V.M.F. Bidding strategy of wind-thermal energy producers. Renew. Energy 2016, 99, 673–681. [Google Scholar] [CrossRef]
- Xu, Z.; Hu, Z.; Song, Y.; Wang, J. Risk-averse optimal bidding strategy for demand-side resource aggregators in day-ahead electricity markets under uncertainty. IEEE Trans. Smart Grid 2017, 8, 96–105. [Google Scholar] [CrossRef]
- Sanchez-Martin, P.; Alberdi-Alen, A. Day ahead and intraday stochastic decision model for EV charging points. In Proceedings of the IEEE Powertech Grenoble Conference, Grenoble, France, 16–20 June 2013. [Google Scholar]
- Herranz, R.; Muñoz San Roque, A.; Villar, J.; Campos, F.A. Optimal demand-side bidding strategies in electricity spot markets. IEEE Trans. Power Syst. 2012, 27, 1204–1213. [Google Scholar] [CrossRef]
- Nguyen, D.T.; Le, L.B. Optimal bidding strategy for microgrids considering renewable energy and building thermal dynamics. IEEE Trans. Smart Grid 2014, 5, 1608–1620. [Google Scholar] [CrossRef]
- Faria, E.; Fleten, S.E. Day-ahead market bidding for a Nordic hydropower producer: Taking the Elbas market into account. Comput. Manag. Sci. 2011, 8, 75–101. [Google Scholar] [CrossRef]
- Klaboe, G.; Fosso, O.B. Optimal bidding in sequential physical markets–A literature review and framework discussion. In Proceedings of the IEEE Powertech Grenoble Conference, Grenoble, France, 16–20 June 2013. [Google Scholar]
- Baringo, L.; Conejo, A.J. Offering strategy via robust optimization. IEEE Trans. Power Syst. 2011, 26, 1418–1425. [Google Scholar] [CrossRef]
- Ansari, M.; Al-Awami, A.T.; Sortomme, E.; Abido, M.A. Coordinated bidding of ancillary services for vehicle-to-grid using fuzzy optimization. IEEE Trans. Smart Grid 2015, 6, 261–270. [Google Scholar] [CrossRef]
- Sousa, T.; Morais, H.; Castro, R.; Vale, Z. Evaluation of different initial solution algorithms to be used in the heuristics optimization to solve the energy resource scheduling in smart grids. Appl. Soft Comput. 2016, 48, 491–506. [Google Scholar] [CrossRef]
- Wei, M.; Zhong, J. Optimal bidding strategy for demand response aggregator in day-ahead markets via stochastic programming and robust optimization. In Proceedings of the IEEE 12th International Conference on European Energy Markets, Lisbon, Portugal, 19–22 May 2015. [Google Scholar]
- Chen, Z.; Wu, L.; Fu, Y. Real-time price-based demand response management for residential appliances via stochastic optimization and robust optimization. IEEE Trans. Smart Grid 2012, 3, 1822–1831. [Google Scholar] [CrossRef]
- Fleten, S.E.; Wallace, S.W.; Ziemba, W.T. Hedging electricity portfolios via stochastic programming. In Decision Making under Uncertainty, 1st ed.; Greengard, C., Ruszczynski, A., Eds.; Springer: New York, NY, USA, 2002; Volume 128, pp. 71–93. [Google Scholar]
- Fernandes, C.; Frías, P.; Reneses, J. Participation of intermittent renewable generators in balancing mechanisms: A closer look into the Spanish market design. Renew. Energy 2016, 89, 305–316. [Google Scholar] [CrossRef]
- Conejo, A.J.; Carrión, M.; Morales, J.M. Decision Making under Uncertainty in Electricity Markets, 1st ed.; Springer: New York, NY, USA, 2010; pp. 211–230. [Google Scholar]
- Ayon, X.; Usaola, J. An optimal scheduling for aggregators in smart grid. In Proceedings of the IEEE 12th International Conference on European Energy Markets, Lisbon, Portugal, 19–22 May 2015. [Google Scholar]
- Daily and Intraday Electricity Market Operating Rules. pp. 67–71. Available online: http://www.omel.es/files/reglas_agosto_2012_ingles.pdf (accessed on 19 December 2016).
- Chaves-Ávila, J.P.; Fernandes, C. The Spanish intraday market design: A successful solution to balance renewable generation? Renew. Energy 2015, 74, 422–432. [Google Scholar] [CrossRef]
- Electricity Iberian Market Operator: OMIE, Market Results. Available online: http://www.omie.es/files/flash/ResultadosMercado.swf (accessed on 19 December 2016).
- Spanish System Operator’s Information System. Available online: http://www.esios.ree.es/es (accessed on 19 December 2016).
- Christoph, W. Adequate intraday market design to enable the integration of wind energy into the European power systems. Energy Policy 2010, 38, 3155–3163. [Google Scholar]
- Abedi, S.; Riahy, G.H.; Farhadkhani, M.; Hosseinian, S.H. Improved Stochastic Modeling: An Essential Tool for Power System Scheduling in the Presence of Uncertain Renewables; INTECH Open Access: Rijeka, Croatia, 2013; pp. 113–120. [Google Scholar]
- Usaola, J.; Ramírez, V.; Gafurov, T.; Prodanovic, M. PV modelling for generation adequacy studies. In Proceedings of the 3rd Solar Integration Workshop, London, UK, 21–22 October 2013. [Google Scholar]
- Plazas, M.A.; Conejo, A.J.; Prieto, F.J. Multimarket optimal bidding for a power producer. IEEE Trans. Power Syst. 2005, 20, 2041–2050. [Google Scholar] [CrossRef]
- Spanish Electricity Market. Available online: http://www.omie.es/inicio/mercados-y-productos/mercado-electricidad/nuestros-mercados-de-electricidad/diario-e-intradia (accessed on 19 December 2016).
- Rudion, K.; Orths, A.; Styczynski, Z.A.; Strunz, K. Design of benchmark of medium voltage distribution network for investigation of DG integration. In Proceedings of the IEEE Power Engineering Society General Meeting, Montreal, QC, Canada, 18–22 June 2006. [Google Scholar]
- Spanish Consumption Profiles. Available online: http://www.ree.es/es/actividades/operacion-del-sistema-electrico/medidas-electricas (accessed on 19 December 2016).
- Razali, N.M.; Hashim, A.H. Backward reduction application for minimizing wind power scenarios in stochastic programming. In Proceedings of the IEEE 4th International Power Engineering and Optimization Conference, Shah Alam, Malasya, 23–24 June 2010; pp. 430–434. [Google Scholar]
- Tuohy, A.; Zack, J.; Haupt, S.E.; Sharp, J.; Ahlstrom, M.; Dise, S.; Grimit, E.; Mohrlen, C.; Lange, M.; Casado, M.G.; et al. Solar forecasting: Methods, challenges, and performance. IEEE Power Energy Mag. 2015, 13, 50–59. [Google Scholar] [CrossRef]
Figure 1.
Aggregator participation in the day-ahead and intraday markets.
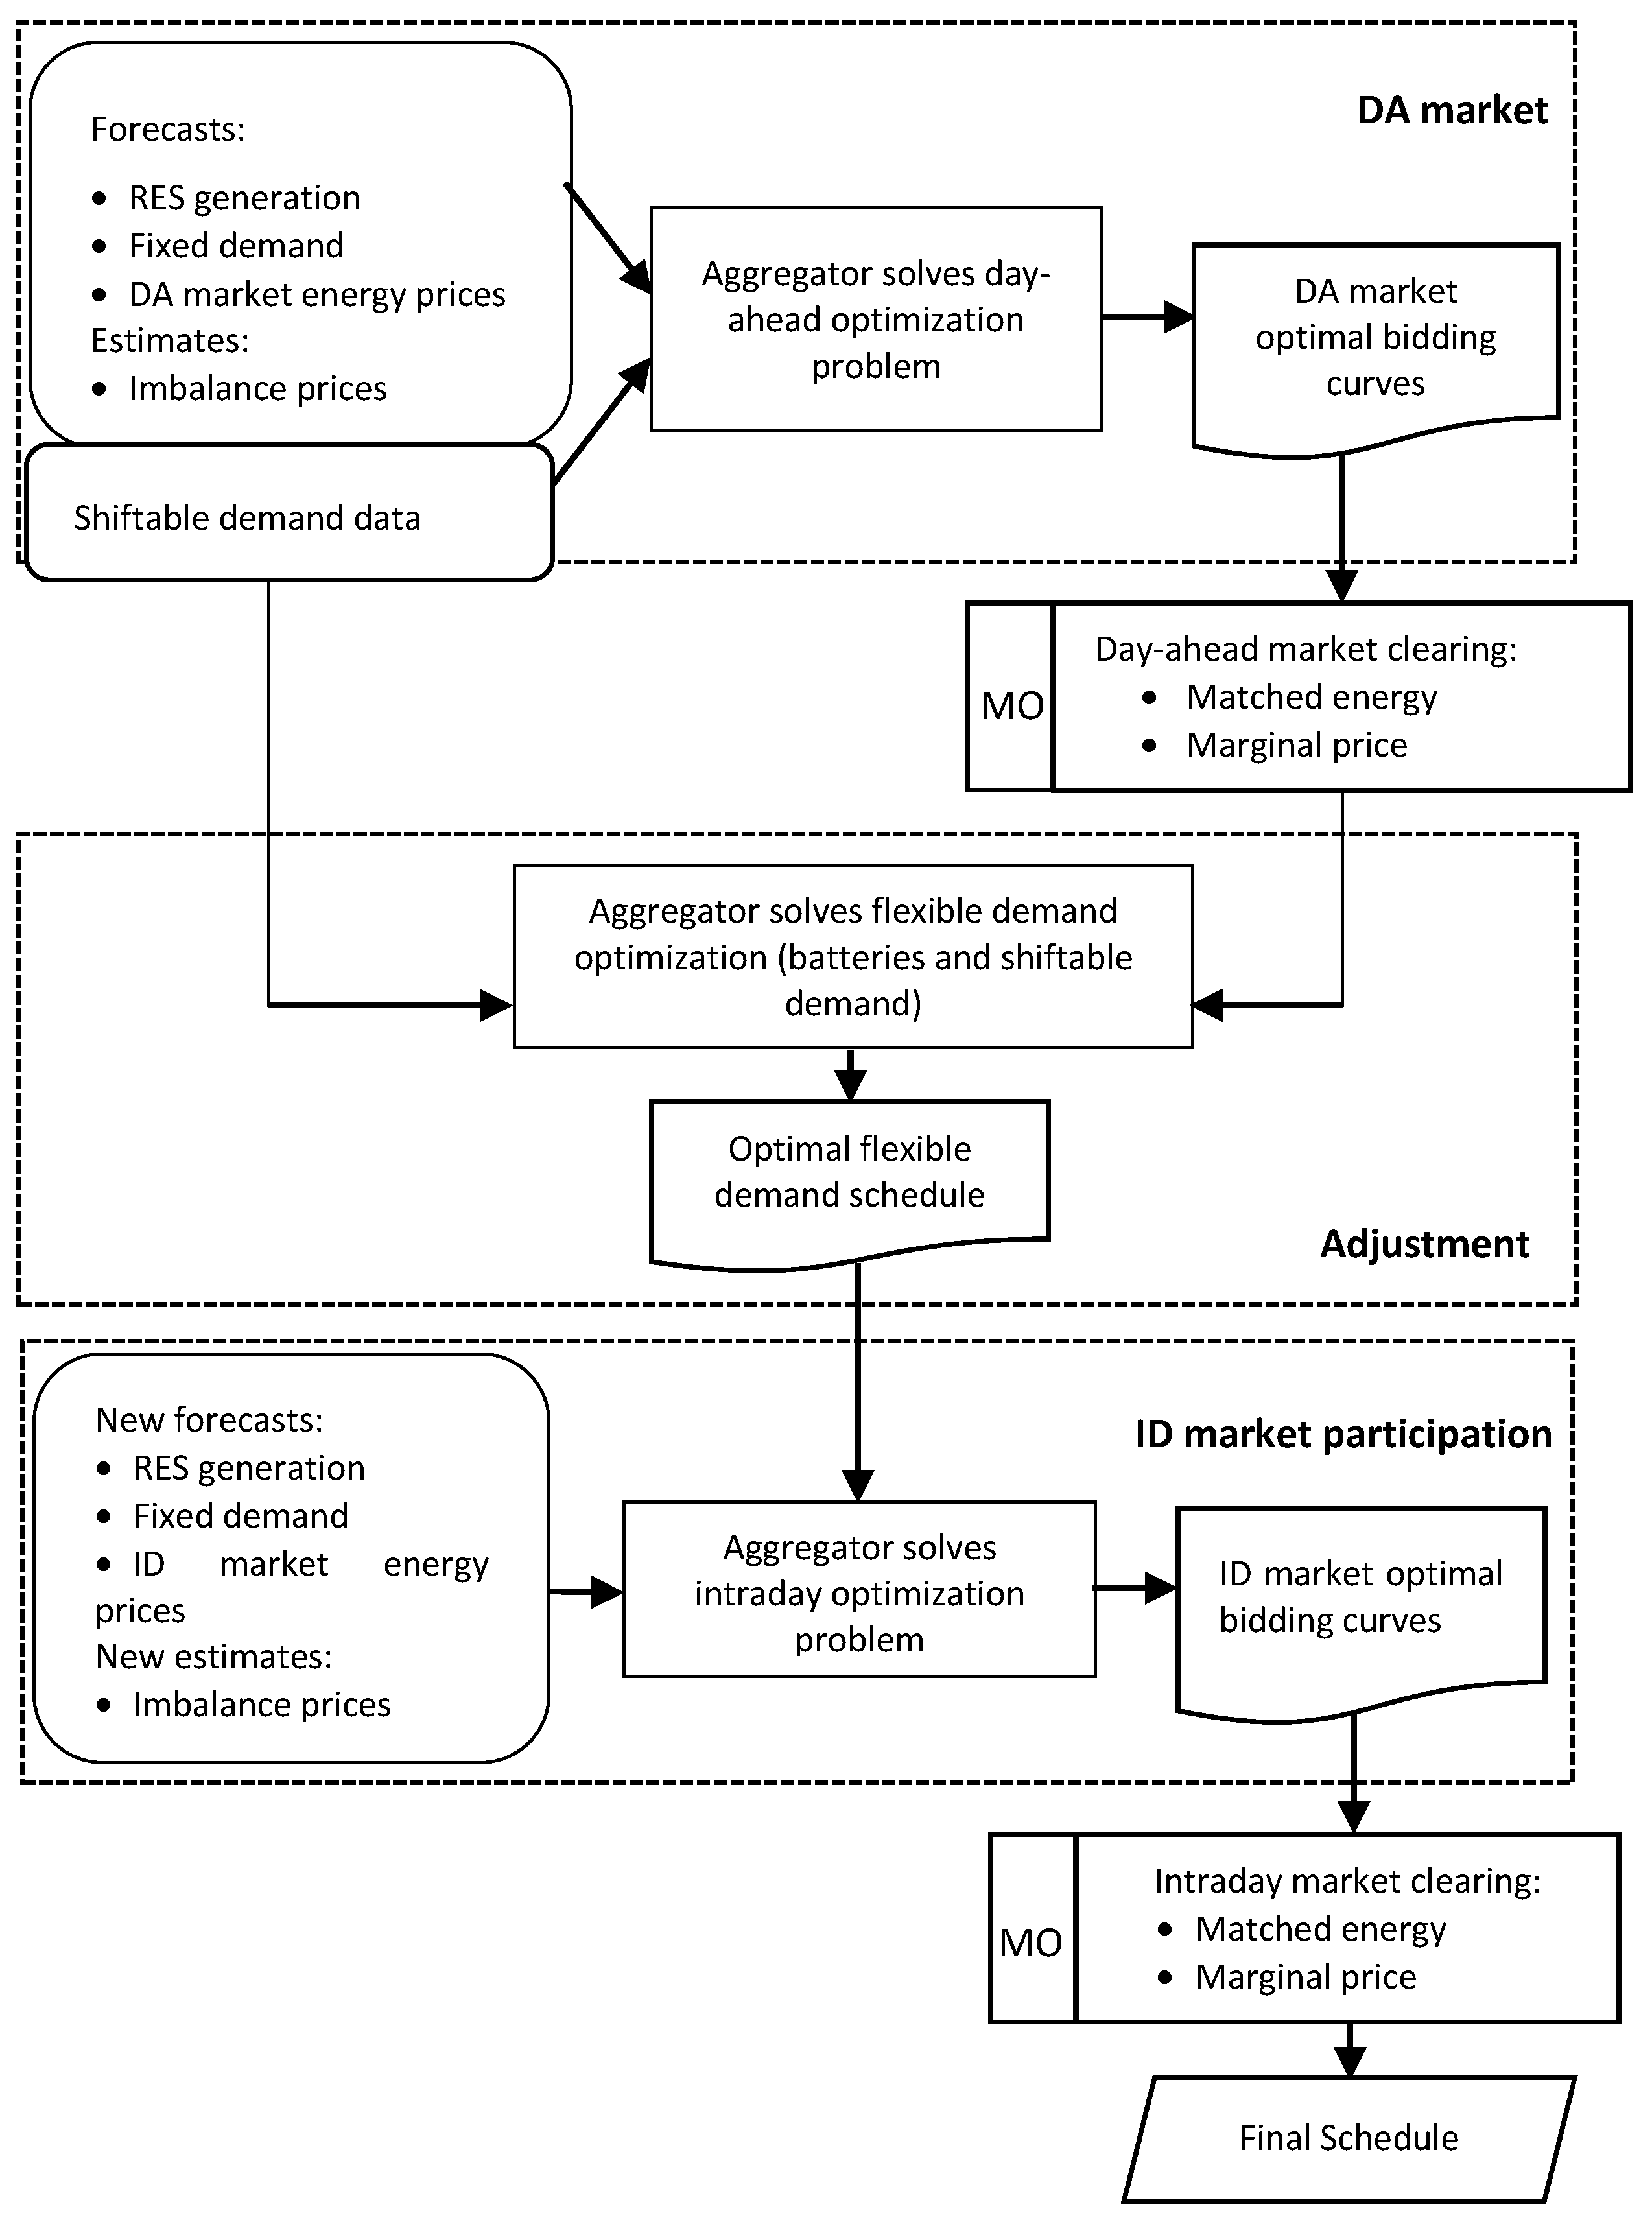
Figure 2.
Basic trajectories of fixed demand, photovoltaics (PV), and wind power.

Figure 3.
Reduced scenarios of fixed demand minus renewable energy sources (RES) generation to participate in (a) Day-ahead market and (b) Intraday markets.
Figure 3.
Reduced scenarios of fixed demand minus renewable energy sources (RES) generation to participate in (a) Day-ahead market and (b) Intraday markets.

Figure 4.
Optimal bidding curves to buy energy in the day-ahead market.
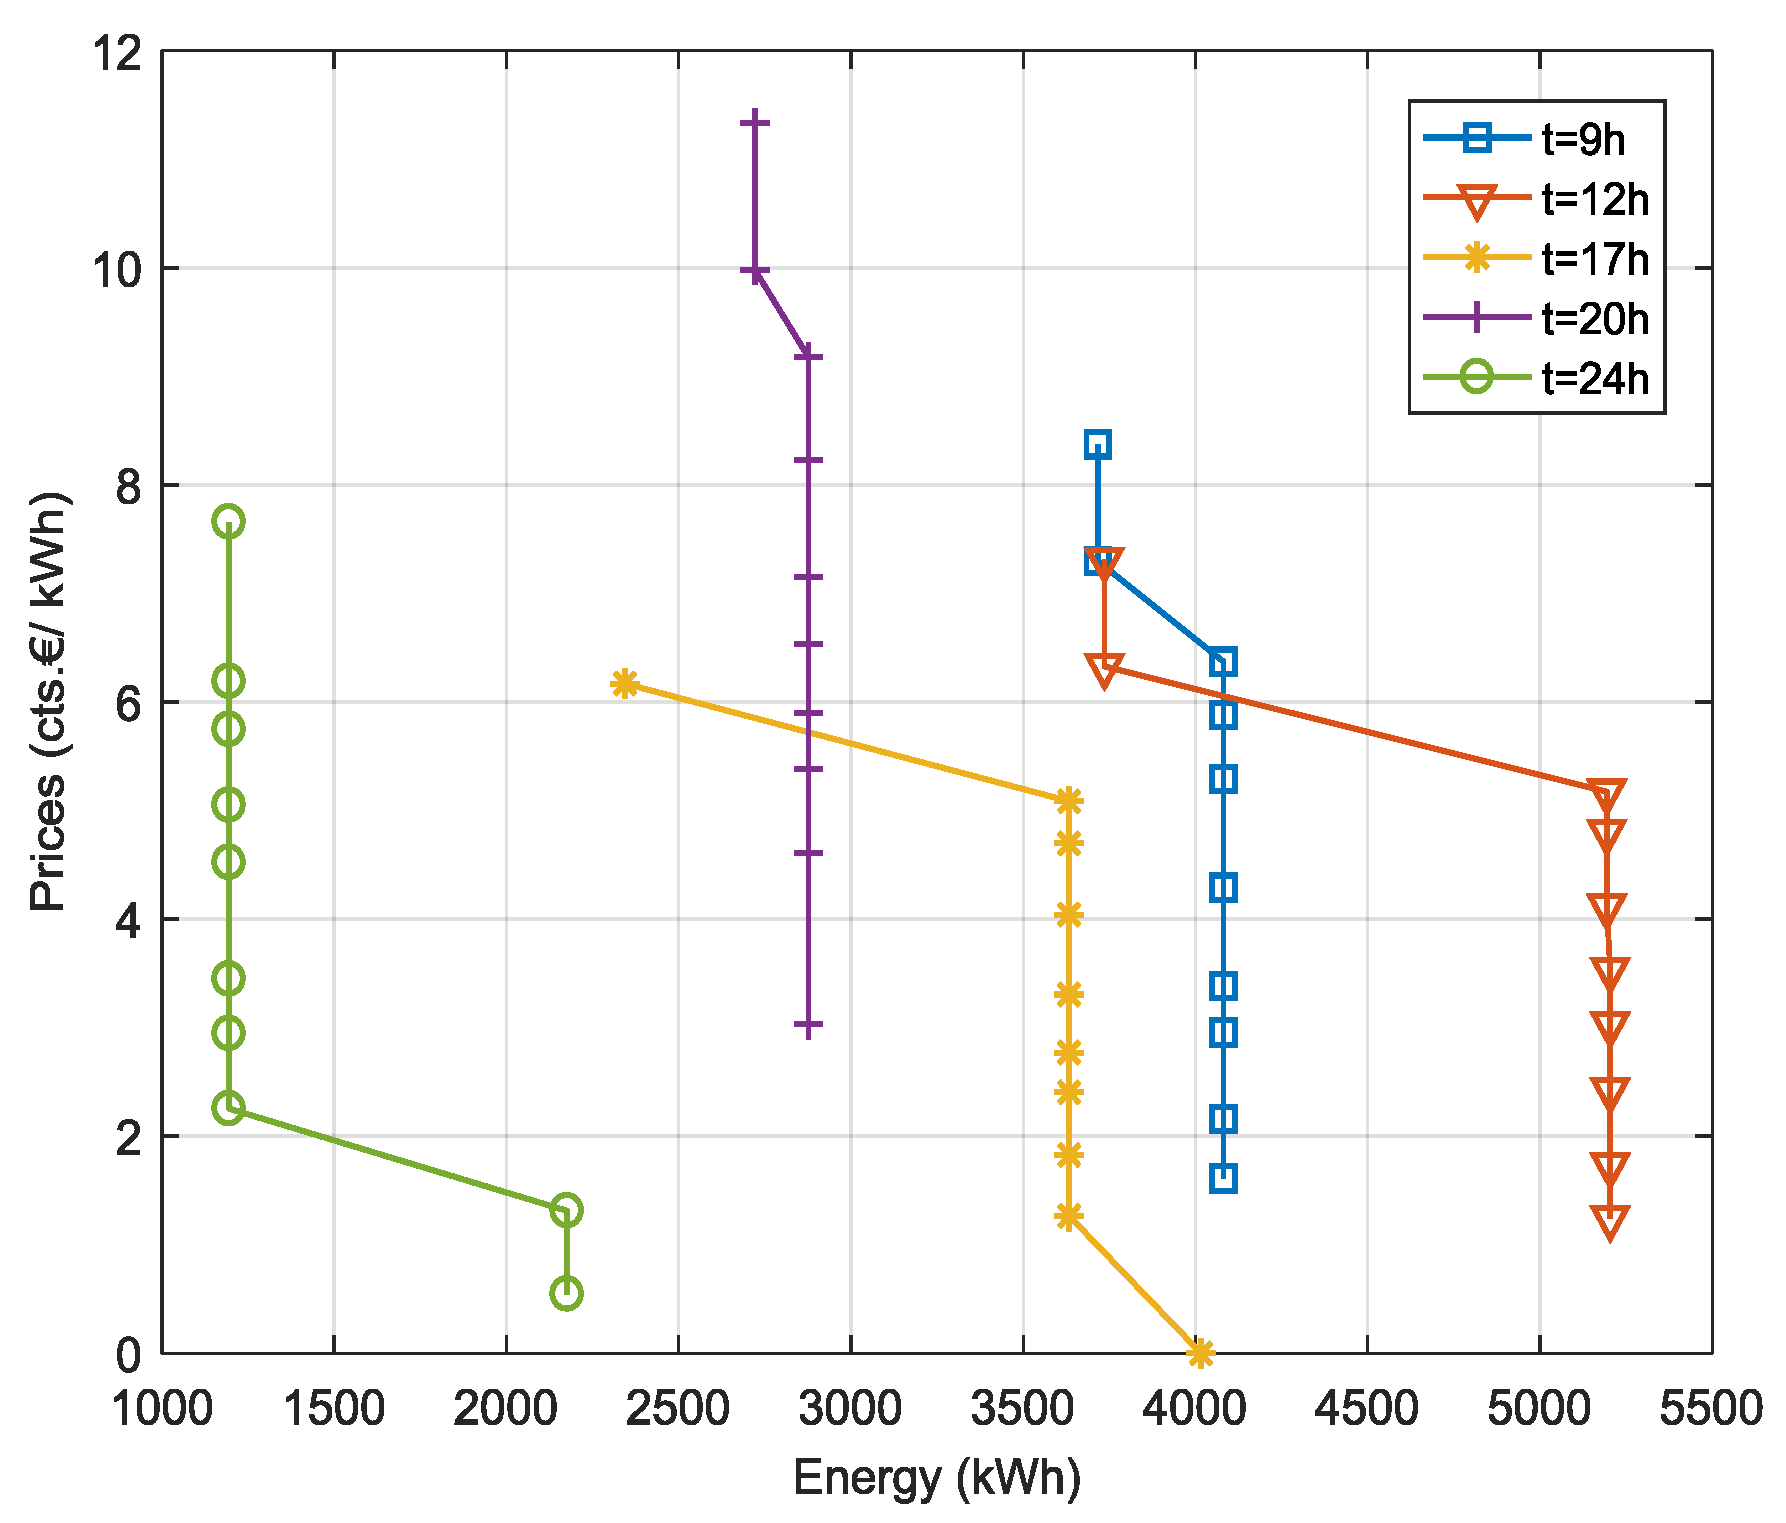
Figure 5.
Optimal bidding curves to buy energy in the intraday market.

Figure 6.
(a) Approximate probability density functions (PDF) of the energy deviation after the day-ahead market; (b) PDF of the payment/revenue due to deviation after the day-ahead market.
Figure 6.
(a) Approximate probability density functions (PDF) of the energy deviation after the day-ahead market; (b) PDF of the payment/revenue due to deviation after the day-ahead market.
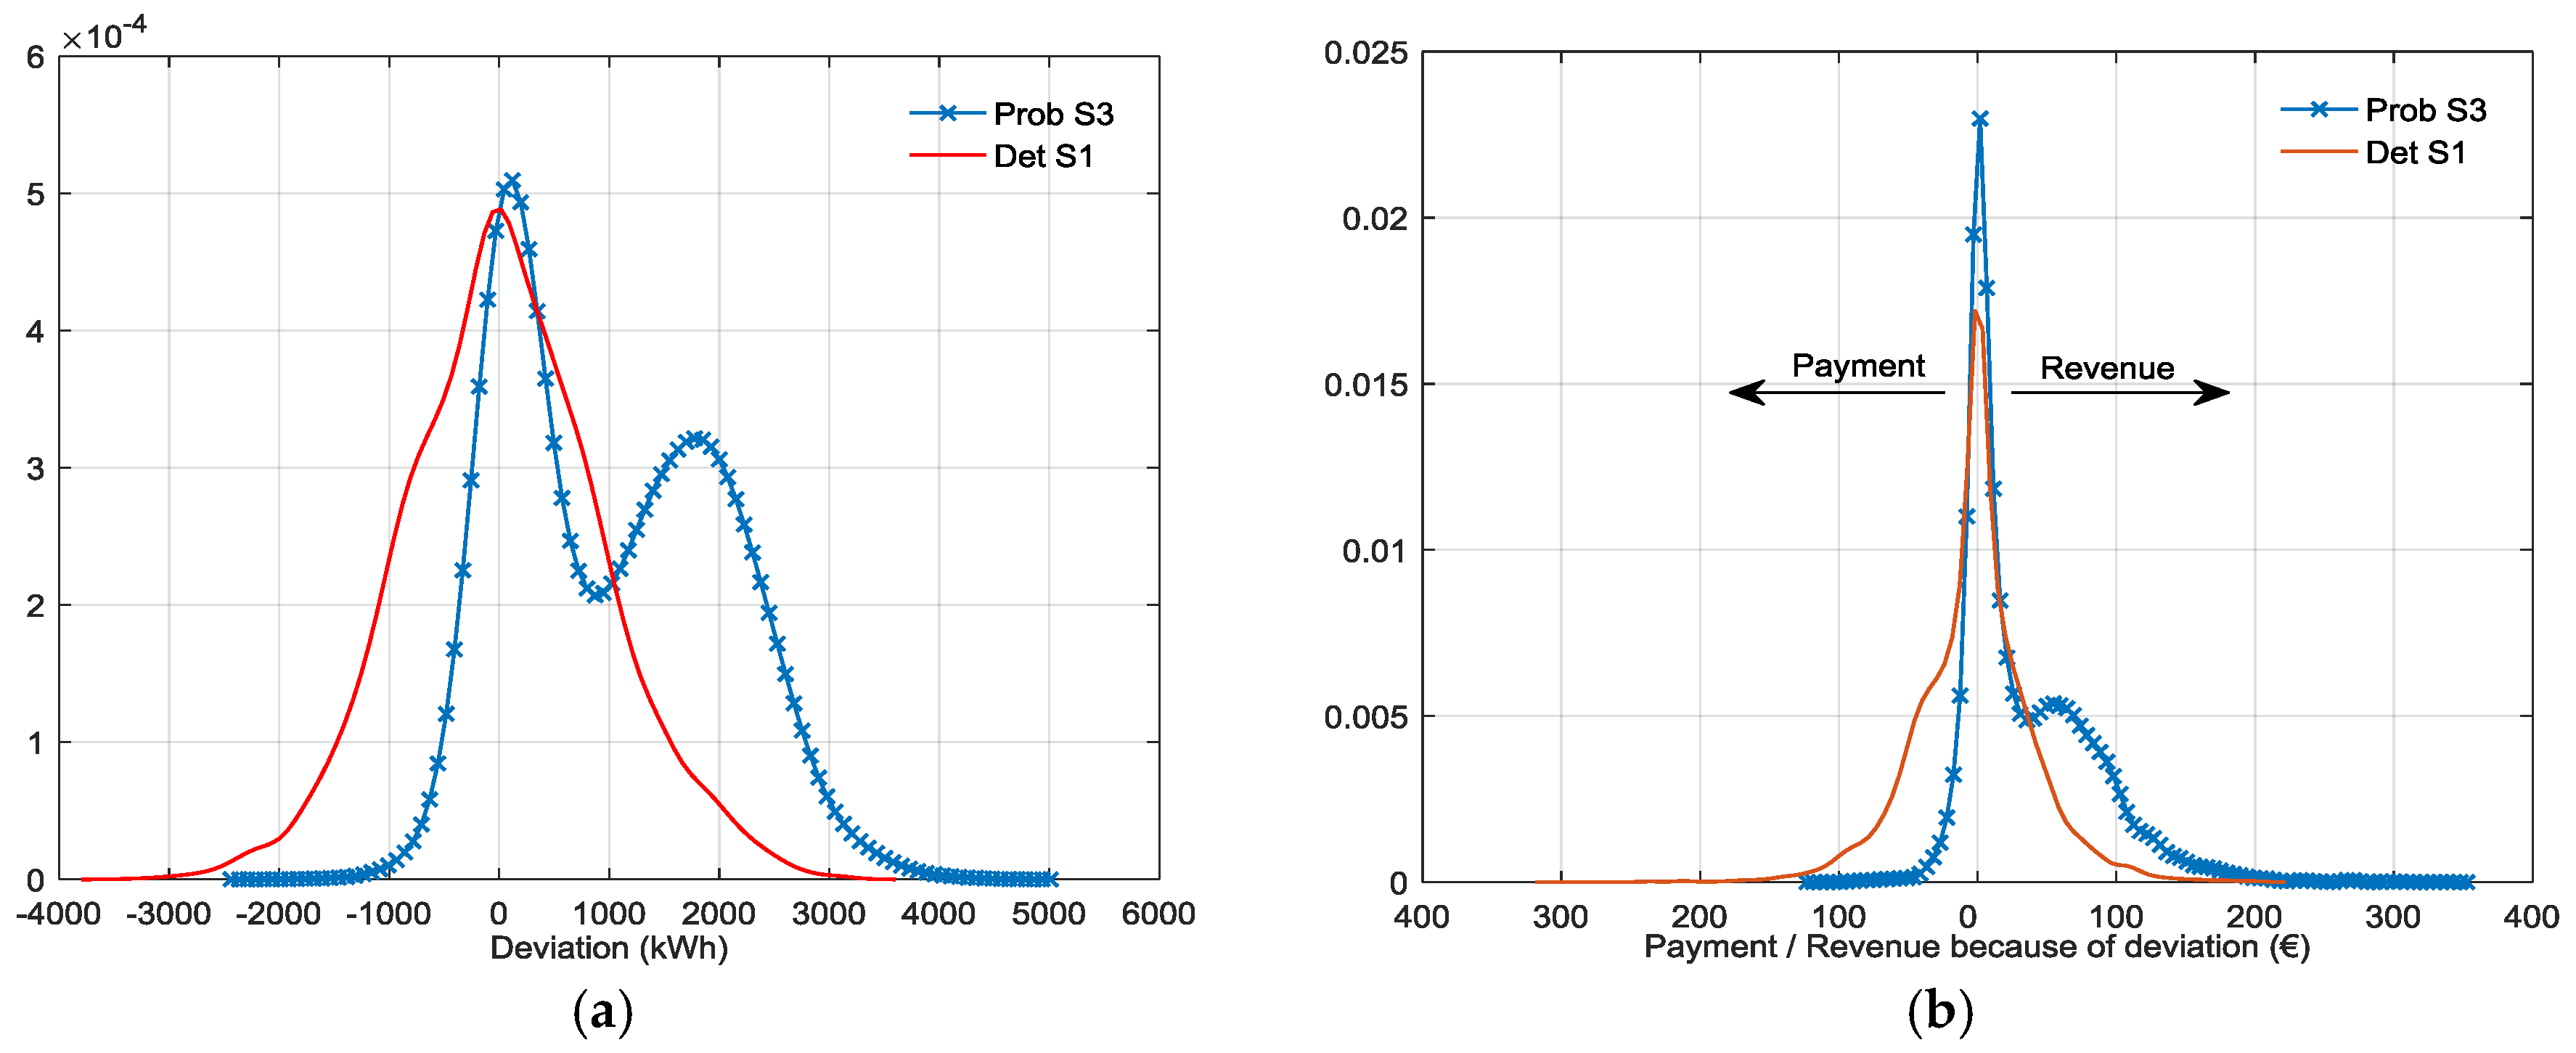
Figure 7.
(a) PDF of the energy deviation after the intraday market; (b) PDF of the payment/revenue due to deviation after the intraday market.
Figure 7.
(a) PDF of the energy deviation after the intraday market; (b) PDF of the payment/revenue due to deviation after the intraday market.


Table 1.
Rules for updating energy bids for day D in intraday markets.
| Hourly time period of day D | 1–4 | 5–7 | 8–11 | 12–15 | 16–21 | 22–24 |
| ID market session for updating bids | 2 | 3 | 4 | 5 | 6 | 1 (D + 1) |
Table 2.
Real data of energy prices for the whole year analyzed.
| Energy Prices | Average (c€/kWh) | Standard Deviation (c€/kWh) |
|---|---|---|
| Day-ahead | 4.43 | 2.07 |
| Intraday | 4.3 | 2.13 |
| Buy Imbalance | 5.2 | 2.06 |
| Sell Imbalance | 3.63 | 2.23 |
Table 3.
Normalized mean squared errors of random variables.
| Random Variables | Forecast Errors (%) | |
|---|---|---|
| Day-Ahead | Intraday | |
| Photovoltaic Power | 24.0 | 15.0 |
| Wind Power | 9.8 | 3.7 |
| Fixed Demand | 13.6 | 3.1 |
| Energy Prices | 0.2 | 0.08 |
Table 4.
Aggregator annual payment from the participation only in the Day-ahead (DA) market.
| Payment (k€) | Deterministic | Probabilistic |
|---|---|---|
| Day-ahead market (k€) | 999 | 1308 |
| Net Imbalance (k€) | 22 | −304 |
| Total (k€) | 1021 | 1004 |
| Gain (%) | - | 1.7 |
Table 5.
Possible aggregator strategies to participate in the DA plus intraday (ID) markets.
| Market | Strategy S1 | Strategy S2 | Strategy S3 |
|---|---|---|---|
| DA + ID | Det + Det | Det + Prob | Prob + Prob |
Table 6.
Aggregator annual payment from the participation in the DA plus ID markets.
| Payment (k€) | Strategy S1 | Strategy S2 | Strategy S3 |
|---|---|---|---|
| DA + ID markets (k€) | 977 | 1108 | 1111 |
| Net Imbalance (k€) | 8 | −151 | −166 |
| Total (k€) | 985 | 957 | 945 |
| Gain (%) | - | 2.84 | 4.06 |
Table 7.
Energy traded in DA and ID markets.
| Strategy | Annual Quantity | DA Market | ID Market | Total Traded/Paid |
|---|---|---|---|---|
| S3 Probabilistic Energy (MWh) | Total buying | 30,402 | 4122 | 34,524 |
| Total selling | 0 | 6586 | 6586 | |
| Net (buying) | 30,402 | −2464 | 27,938 | |
| S1 Deterministic Energy (MWh) | Total buying | 21,867 | 2941 | 24,808 |
| Total selling | 73 | 3197 | 3270 | |
| Net (buying) | 21,794 | −256 | 21,538 |
Table 8.
Total energy deviation.
| Term | Strategy | DA Market | ID Market |
|---|---|---|---|
| Total Energy Deviation (MWh) | S3 Probabilistic | 9013 | 6529 |
| S1 Deterministic | 406 | 144 |
© 2017 by the authors. Licensee MDPI, Basel, Switzerland. This article is an open access article distributed under the terms and conditions of the Creative Commons Attribution (CC BY) license (http://creativecommons.org/licenses/by/4.0/).
Share and Cite
MDPI and ACS Style
Ayón, X.; Moreno, M.Á.; Usaola, J. Aggregators’ Optimal Bidding Strategy in Sequential Day-Ahead and Intraday Electricity Spot Markets. Energies 2017, 10, 450. https://doi.org/10.3390/en10040450
AMA Style
Ayón X, Moreno MÁ, Usaola J. Aggregators’ Optimal Bidding Strategy in Sequential Day-Ahead and Intraday Electricity Spot Markets. Energies. 2017; 10(4):450. https://doi.org/10.3390/en10040450
Chicago/Turabian StyleAyón, Xiaolin, María Ángeles Moreno, and Julio Usaola. 2017. "Aggregators’ Optimal Bidding Strategy in Sequential Day-Ahead and Intraday Electricity Spot Markets" Energies 10, no. 4: 450. https://doi.org/10.3390/en10040450
Note that from the first issue of 2016, this journal uses article numbers instead of page numbers. See further details here.