
The Social Costs of Electricity Generation—Categorising Different Types of Costs and Evaluating Their Respective Relevance


Abstract
:1. Introduction
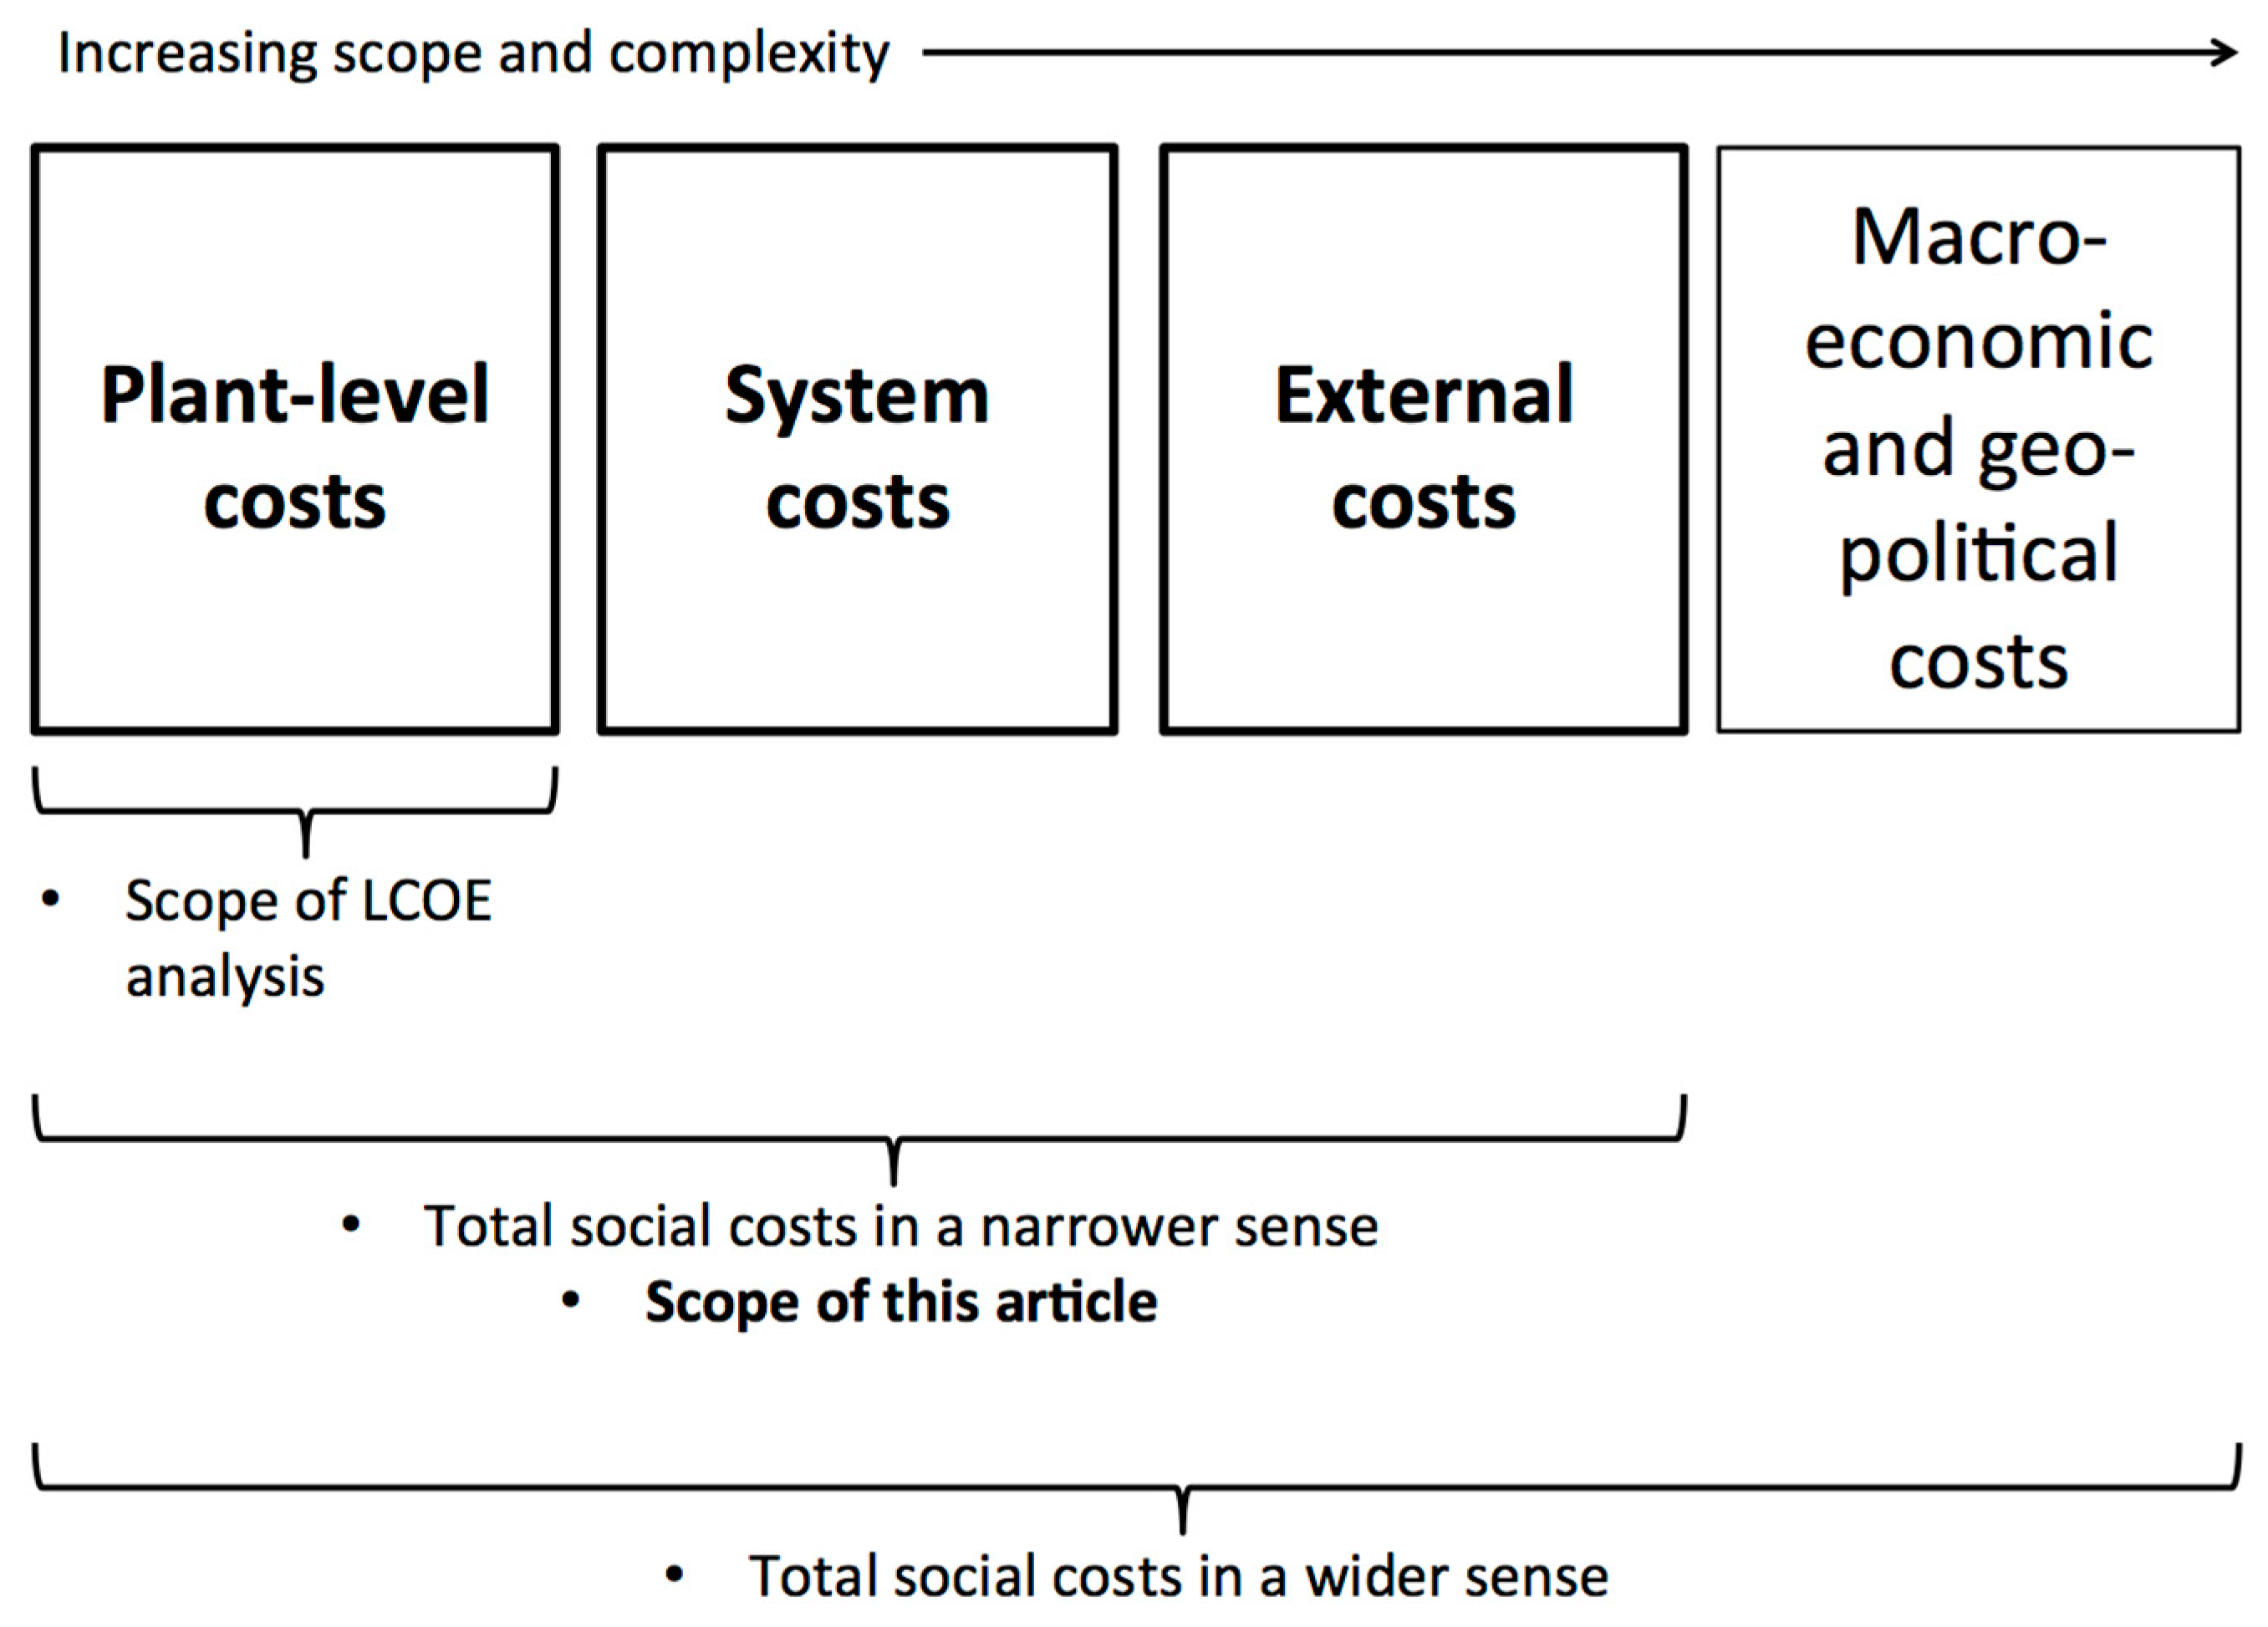
2. Defining and Categorising the Social Costs of Electricity Generation
3. Discussing the Individual Types of Social Costs of Electricity Generation
3.1. Plant-Level Costs
- Capital costs;
- Fuel costs;
- Market costs of greenhouse gas (GHG) emissions;
- Non-fuel operation and maintenance costs (fixed and variable).
3.1.1. Capital Costs
3.1.2. Fuel Costs
3.1.3. Market Costs of GHG Emissions
3.1.4. Non-Fuel Operation and Maintenance Costs
3.1.5. Sum of Plant-Level Costs in the Form of Levelized Cost of Electricity (LCOE)
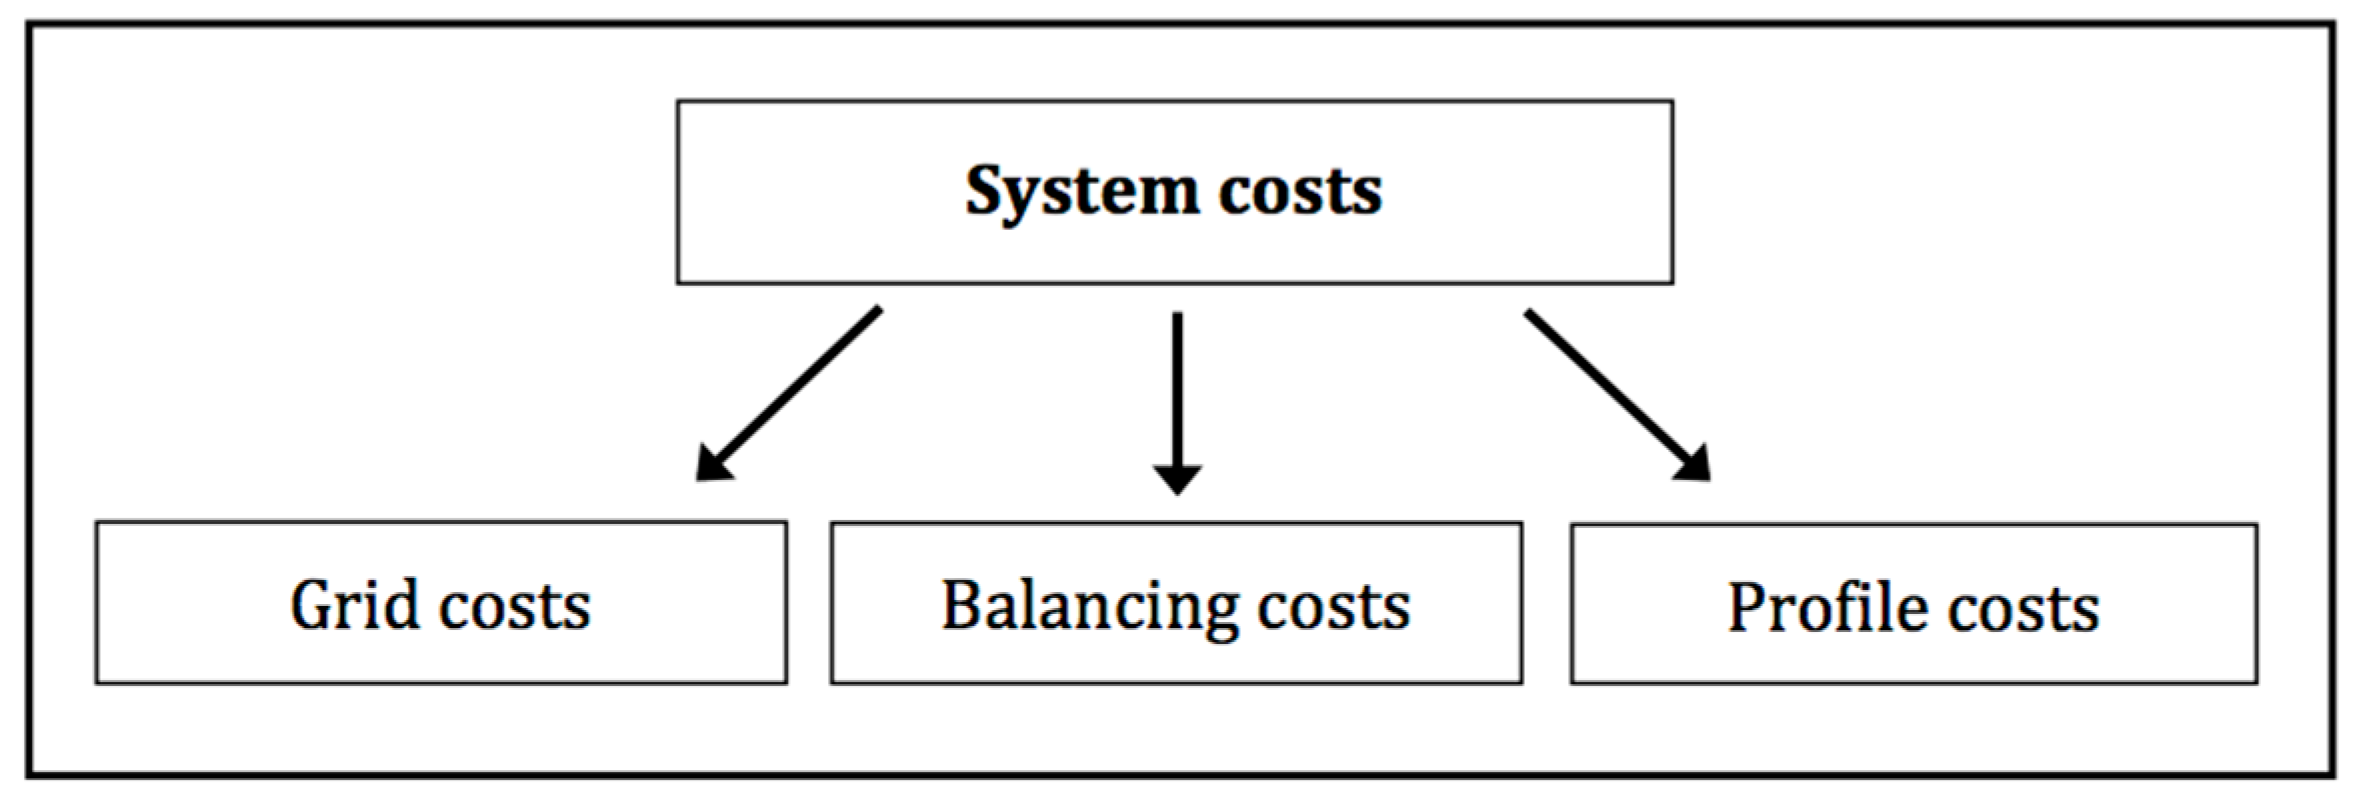
3.2. System Costs
3.2.1. Grid Costs
3.2.2. Balancing Costs
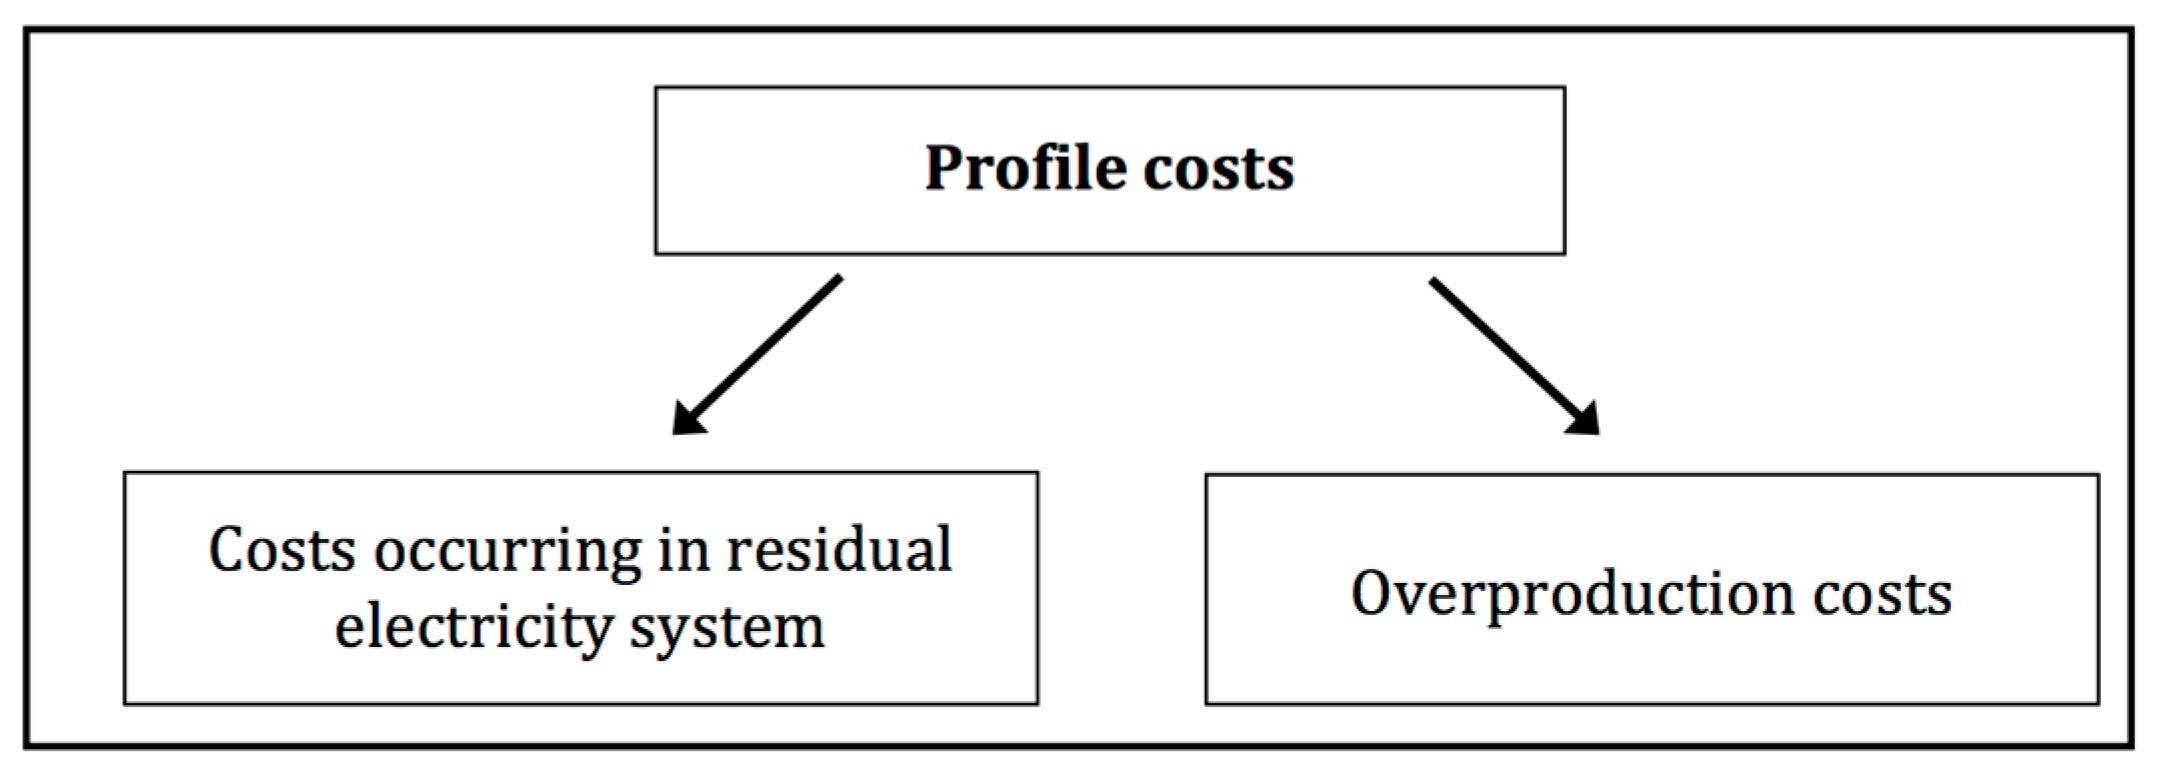
3.2.3. Profile Costs
3.3. External Costs
3.3.1. Social Costs of Greenhouse Gas Emissions
3.3.2. Impacts of Non-GHG Pollution Caused by Using Various Energy Sources
- Neurological damage, especially to foetuses, newborns and children, leading e.g., to mental retardation, seizures or delayed development;
- Cardiovascular morbidity and mortality, e.g., strokes;
- Pulmonary morbidity and mortality, e.g., lung cancer;
- Respiratory diseases, especially in children, e.g., asthma.
3.3.3. Landscape and Noise Impacts
3.3.4. Impacts on Ecosystems and Biodiversity (Non-Climate Change-Related)
3.3.5. External Costs Associated with Radionuclide Emissions
3.3.6. Other Potential External Costs
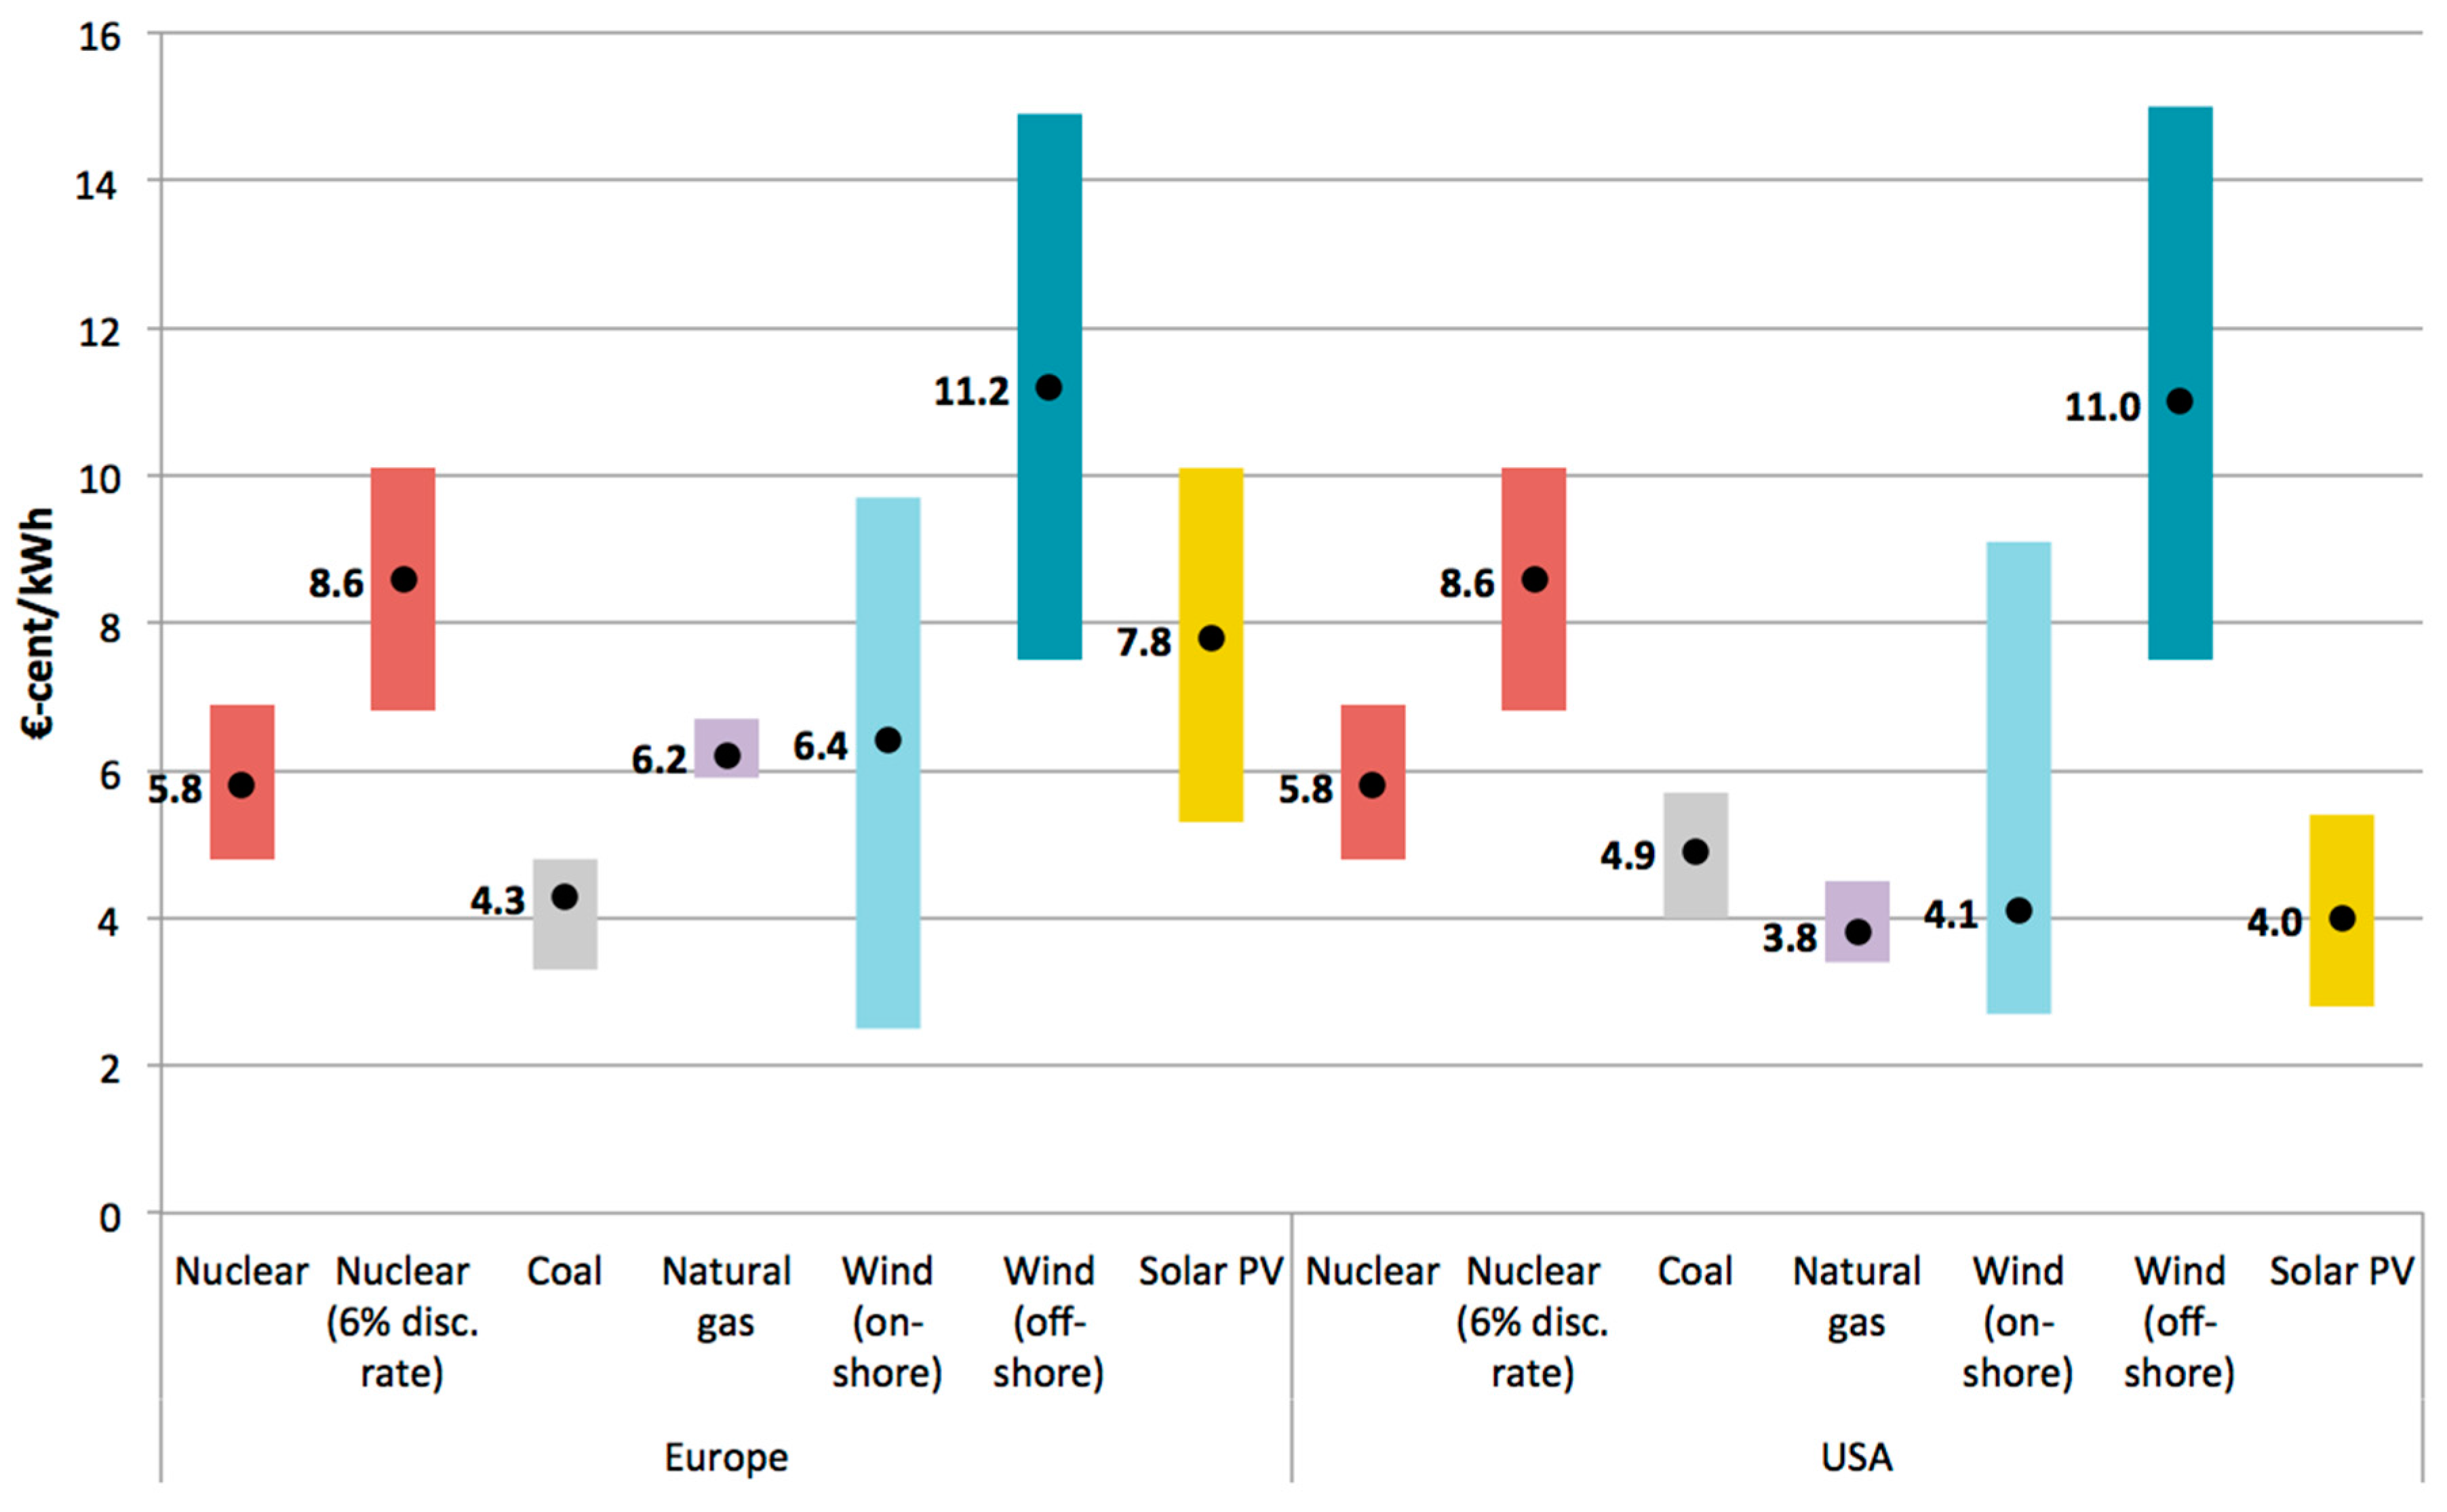
4. Synthesis: Comparing the Social Costs of Electricity Generation Technologies
4.1. Current Costs
4.2. Expected Costs in 2040
5. Conclusions and Further Research Needs
- The costs to assign to specific CO2 emissions;
- The costs to assign to specific air pollution emissions;
- The types of costs that are highly location-specific, such as disamenity costs;
- The profile costs of VRE power generation in future electricity systems with very high VRE shares;
- The relevance of several potential externalities (including the costs of potential nuclear accidents) for which no widely accepted methods of quantification exist.
Supplementary Materials
Acknowledgments
Conflicts of Interest
References
- Pereira, M.G.; Sena, J.A.; Freitas, M.A.V.; da Silva, N.F. Evaluation of the impact of access to electricity: A comparative analysis of South Africa, China, India and Brazil. Renew. Sustain. Energy Rev. 2011, 15, 1427–1441. [Google Scholar] [CrossRef]
- IEA World Energy Outlook 2016—Electricity Access Database 2016. Available online: http://www.worldenergyoutlook.org/media/weowebsite/2015/WEO2016Electricity.xlsx (accessed on 10 March 2017).
- Key World Energy Statistics 2016; International Energy Agency: Paris, France, 2016.
- Energy Technology Perspectives 2016—Towards Sustainable Urban Energy Systems; International Energy Agency: Paris, France, 2016.
- Lechtenböhmer, S.; Samadi, S. The Power Sector: Pioneer and Workhouse of Decarbonization. In Decarbonization in the European Union: Internal Policies and External Strategies; Dupont, C., Ed.; Palgrave Macmillan: Basingstoke, UK, 2015; pp. 46–69. [Google Scholar]
- Teske, S.; Sawyer, S.; Schäfer, O. Energy [r]evolution—A Sustainable World Energy Outlook 2015—100% Renewable Energy for All; Greenpeace International, Global Wind Energy Council, SolarPower Europe: Hamburg, Germany, 2015. [Google Scholar]
- Krey, V. Global energy-climate scenarios and models: A review. WIREs Energy Environ. 2014, 3, 363–383. [Google Scholar] [CrossRef]
- Pfenninger, S.; Hawkes, A.; Keirstead, J. Energy systems modeling for twenty-first century energy challenges. Renew. Sustain. Energy Rev. 2014, 33, 74–86. [Google Scholar] [CrossRef]
- Eyre, N. External costs. Energy Policy 1997, 25, 85–95. [Google Scholar] [CrossRef]
- Dorigoni, S.; Gullí, F. Energy tax harmonization in the European Union: A proposal based on the internalization of environmental external costs. Eur. Environ. 2002, 12, 17–34. [Google Scholar] [CrossRef]
- Streimikiene, D.; Simanaviciene, Z.; Kovaliov, R. Corporate social responsibility for implementation of sustainable energy development in Baltic States. Renew. Sustain. Energy Rev. 2009, 13, 813–824. [Google Scholar] [CrossRef]
- Lehmann, P.; Gawel, E. Why should support schemes for renewable electricity complement the EU emissions trading scheme? Energy Policy 2013, 52, 597–607. [Google Scholar] [CrossRef]
- Christensen, J.M.; Halsnæs, K.; Sathaye, J. Mitigation and Adaptation Cost Assessment: Concepts, Methods and Appropriate Use; Risø National Laboratory, UNEP Collaborating Centre on Energy and Environment: Roskilde, Denmark, 1998. [Google Scholar]
- Hirth, L.; Ueckerdt, F.; Edenhofer, O. Integration costs revisited—An economic framework for wind and solar variability. Renew. Energy 2015, 74, 925–939. [Google Scholar] [CrossRef]
- Wang, Y.; Brown, M.A. Policy drivers for improving electricity end-use efficiency in the USA: An economic–engineering analysis. Energy Effic. 2014, 7, 517–546. [Google Scholar] [CrossRef]
- Hoffman, I.M.; Rybka, G.M.; Leventis, G.; Goldman, C.A.; Schwartz, L.C.; Billingsley, M.A.; Schiller, S.R. The Total Cost of Saving Electricity through Utility Customer-Funded Energy Efficiency Programs: Estimates at the National, State, Sector and Program Level; Lawrence Berkeley National Laboratory: Berkeley, CA, USA, 2015. [Google Scholar]
- Levy, J.I.; Woo, M.K.; Penn, S.L.; Omary, M.; Tambouret, Y.; Kim, C.S.; Arunachalam, S. Carbon reductions and health co-benefits from US residential energy efficiency measures. Environ. Res. Lett. 2016, 11. [Google Scholar] [CrossRef]
- Cossent, R.; Gómez, T.; Frías, P. Towards a future with large penetration of distributed generation: Is the current regulation of electricity distribution ready? Regulatory recommendations under a European perspective. Energy Policy 2009, 37, 1145–1155. [Google Scholar] [CrossRef]
- Lehmann, P.; Creutzig, F.; Ehlers, M.-H.; Friedrichsen, N.; Heuson, C.; Hirth, L.; Pietzcker, R. Carbon lock-out: Advancing renewable energy policy in Europe. Energies 2012, 5, 323–354. [Google Scholar] [CrossRef]
- Swider, D.J.; Beurskens, L.; Davidson, S.; Twidell, J.; Pyrko, J.; Prüggler, W.; Auer, H.; Vertin, K.; Skema, R. Conditions and costs for renewables electricity grid connection: Examples in Europe. Renew. Energy 2008, 33, 1832–1842. [Google Scholar] [CrossRef]
- International Renewable Energy Agency (IRENA). Renewable Power Generation Costs in 2014; IRENA: Abu Dhabi, UAE, 2015. [Google Scholar]
- Wiser, R.; Yang, Z.; Hand, M.; Hohmeyer, O.; Infield, D.; Jensen, P.H.; Nikolaev, V.; O’Malley, M.; Sinden, G.; Zervos, A. Wind Energy. In IPCC Special Report on Renewable Energy Sources and Climate Change Mitigation; Edenhofer, O., Pichs-Madruga, R., Sokona, Y., Seyboth, K., Matschoss, P., Kadner, S., Zwickel, T., Eickemeier, P., Hansen, G., Schlömer, S., et al., Eds.; Cambridge University Press: Cambridge, UK; New York, NY, USA, 2011. [Google Scholar]
- International Energy Agency (IEA). Projected Costs of Generating Electricity: 2010 Edition; IEA: Paris, France, 2010. [Google Scholar]
- International Energy Agency (IEA). Projected Costs of Generating Electricity: 2015 Edition; IEA: Paris, France, 2015. [Google Scholar]
- International Energy Agency (IEA). World Energy Outlook 2011; Organisation for Economic Co-Operation and Development (OECD): Paris, France, 2011. [Google Scholar]
- Valente, S. Intergenerational externalities, sustainability and welfare—The ambiguous effect of optimal policies on resource depletion. Resour. Energy Econ. 2011, 33, 995–1014. [Google Scholar] [CrossRef]
- World Bank; Ecofys; Vivid Economics. State and Trends of Carbon Pricing 2016; World Bank: Washington, DC, USA, 2016. [Google Scholar]
- Ruf, P.; Ehrmann, V.; Ahrens, J. Options to Strengthen the EU ETS; EURELECTRIC: Karlsruhe, Germany, 2016; p. 42. [Google Scholar]
- Government of Canada. Pan-Canadian Framework on Clean Growth and Climate Change—Canada’s Plan to Address Climate Change and Grow the Economy 2016; Government of Canada: Ottawa, ON, Canada, 2016.
- Williams, J.H.; Haley, B.; Kahrl, F.; Moore, J.; Jones, A.; Torn, M.; McJeon, H. Pathways to Deep Decarbonization in the United States; Energy and Environmental Economics, Inc. (E3): San Francisco, CA, USA, 2014. [Google Scholar]
- Lazard. Lazard’s Levelized Cost of Energy Analysis, version 10.0; Lazard: New York, NY, USA, 2016. [Google Scholar]
- Fischedick, M.; Schaeffer, R.; Adedoyin, A.; Akai, M.; Bruckner, T.; Clarke, L.; Krey, V.; Savolainen, I.; Teske, S.; Ürge-Vorsatz, D.; et al. Mitigation Potential and Costs. In IPCC Special Report on Renewable Energy Sources and Climate Change Mitigation; Edenhofer, O., Ed.; Cambridge University Press: Cambridge, UK, 2011; pp. 791–864. [Google Scholar]
- International Energy Agency (IEA). World Energy Outlook 2016; Organisation for Economic Co-Operation and Development (OECD): Paris, France, 2016. [Google Scholar]
- U.S. Energy Information Administration. Capital Cost Estimates for Utility Scale Electricity Generating Plants; U.S. Energy Information Administration: Washington, DC, USA, 2016.
- Schröder, A.; Kunz, F.; Meiss, J.; Mendelevitch, R.; von Hirschhausen, C. Current and Prospective Costs of Electricity Generation until 2050; German Institute for Economic Research: Berlin, Germany, 2013. [Google Scholar]
- Lévy, J.-B.; Ursat, X. EDF, A responsible electricity company, a champion of low carbon energy growth. In Presented at the EDF Press Conference, Paris, France, 3 September 2015.
- Rankin, J. Flamanville: France’s beleaguered forerunner to Hinkley Point C. In The Guardian 2016; Guardian News & Media: London, UK, 2016. [Google Scholar]
- International Renewable Energy Agency (IRENA). Renewable Power Generation Costs in 2016; IRENA: Abu Dhabi, UAE, 2017; forthcoming. [Google Scholar]
- Moné, C.; Stehly, T.; Maples, B.; Settle, E. 2014 Cost of Wind Energy Review; National Renewable Energy Laboratory: Golden, CO, USA, 2015. [Google Scholar]
- International Renewable Energy Agency (IRENA). The Power to Change: Solar and Wind Cost Reduction Potential to 2025; IRENA: Bonn, Germany, 2016. [Google Scholar]
- The European Wind Energy Association (EWEA). Wind in Power—2015 European Statistics; The European Wind Energy Association: Brussels, Belgium, 2016. [Google Scholar]
- Vartiainen, E.; Masson, G.; Breyer, C. PV LCOE in Europe 2014-30; European Photovoltaic Technology Platform: Munich, Germany, 2015. [Google Scholar]
- Bolinger, M.; Seel, J. Utility-Scale Solar 2015: An Empirical Analysis of Project Cost, Performance, and Pricing Trends in the United States; Lawrence Berkeley National Laboratory: Berkeley, CA, USA, 2016. [Google Scholar]
- U.S. Energy Information Administration. Electric Power Monthly with Data for October 2016; U.S. Energy Information Administration: Washington, DC, USA, 2016.
- Caplin, A.; Leahy, J. The Social Discount Rate; National Bureau of Economic Research: Cambridge, MA, USA, 2000. [Google Scholar]
- Moore, M.A.; Boardman, A.E.; Vining, A.R.; Weimer, D.L.; Greenberg, D.H. “Just give me a number!” Practical values for the social discount rate. J. Policy Anal. Manag. 2004, 23, 789–812. [Google Scholar] [CrossRef]
- Hirth, L.; Steckel, J.C. The role of capital costs in decarbonizing the electricity sector. Environ. Res. Lett. 2016, 11. [Google Scholar] [CrossRef]
- Awerbuch, S. Portfolio-Based Electricity Generation planning: Policy implications for renewables and energy security. Mitig. Adapt. Strateg. Glob. Chang. 2006, 11, 693–710. [Google Scholar] [CrossRef]
- Roland Berger. Offshore Wind Power: Takeaways from the Borssele Wind Farm; Think Act: Munich, Germany, 2016. [Google Scholar]
- International Energy Agency (IEA). Harnessing Variable Renewables: A Guide to the Balancing Challenge; IEA: Paris, France, 2011. [Google Scholar]
- Ueckerdt, F.; Hirth, L.; Luderer, G.; Edenhofer, O. System LCOE: What are the costs of variable renewables? Energy 2013, 63, 61–75. [Google Scholar] [CrossRef]
- Hirth, L. The benefits of flexibility: The value of wind energy with hydropower. Appl. Energy 2016, 181, 210–223. [Google Scholar] [CrossRef]
- Hirth, L. The market value of variable renewables: The effect of solar wind power variability on their relative price. Energy Econ. 2013, 38, 218–236. [Google Scholar] [CrossRef]
- Holttinen, H.; Meibom, P.; Orths, A.; Lange, B.; O’Malley, M.; Tande, J.O.; Estanqueiro, A.; Gomez, E.; Söder, L.; Strbac, G.; et al. Impacts of large amounts of wind power on design and operation of power systems, results of IEA collaboration. Wind Energy 2011, 14, 179–192. [Google Scholar] [CrossRef]
- Auer, H.; Huber, C.; Faber, T.; Resch, G.; Obersteiner, C.; Weissensteiner, L.; Haas, R. Economics of large-scale intermittent RES-E integration into the European grids: Analyses based on the simulation software GreenNet. Int. J. Glob. Energy Issues 2006, 25, 219–242. [Google Scholar] [CrossRef]
- Schaber, K.; Steinke, F.; Hamacher, T. Transmission grid extensions for the integration of variable renewable energies in Europe: Who benefits where? Energy Policy 2012, 43, 123–135. [Google Scholar] [CrossRef]
- Mills, A.; Wiser, R.; Porter, K. The cost of transmission for wind energy in the United States: A review of transmission planning studies. Renew. Sustain. Energy Rev. 2012, 16, 1–19. [Google Scholar] [CrossRef]
- Keppler, J.H.; Cometto, M. Nuclear Energy and Renewables: System Effects in Low-Carbon Electricity Systems; Nuclear Energy Agency, OECD: Paris, France, 2012. [Google Scholar]
- Pudjianto, D.; Djapic, P.; Dragovic, J.; Strbac, G. Grid Integration Cost of PhotoVoltaic Power Generation; Energy Futures Lab, Imperial College: London, UK, 2013. [Google Scholar]
- Hou, W.; Allinson, G.; MacGill, I.; Neal, P.; Ho, M. Cost comparison of major low-carbon electricity generation options: An Australian case study. Sustain. Energy Technol. Assess. 2014, 8, 131–148. [Google Scholar] [CrossRef]
- Brouwer, A.S.; van den Broek, M.; Seebregts, A.; Faaij, A. Impacts of large-scale Intermittent Renewable Energy Sources on electricity systems, and how these can be modeled. Renew. Sustain. Energy Rev. 2014, 33, 443–466. [Google Scholar] [CrossRef]
- Milligan, M.R.; Kirby, B. Calculating Wind Integration Costs: Separating Wind Energy Value from Integration Cost Impacts; National Renewable Energy Laboratory: Golden, CO, USA, 2009. [Google Scholar]
- Mason, T.; Curry, T.; Hong, M.; Benson, J.; Olson, S.; Sprouse, M.; Wilson, D. Solar Photovoltaic (PV) Integration Cost Study; Black & Veatch: Overland Park, KS, USA, 2012. [Google Scholar]
- Holttinen, H.; Kiviluoma, J.; Robitaille, A.; Cutululis, N.A.; Orths, A.; van Hulle, F.; Pineda, I.; Lange, B.; O’Malley, M.; Dillon, J.; et al. Design and Operation of Power Systems with Large Amounts of Wind Power; IEA WIND Task 25; VTT Technology: Espoo, Finland, 2013; p. 81. [Google Scholar]
- International Energy Agency (IEA). The Power of Transformation—Wind, Sun and the Economics of Flexible Power Systems; IEA: Paris, France, 2014. [Google Scholar]
- Deetjen, T.A.; Garrison, J.B.; Rhodes, J.D.; Webber, M.E. Solar PV integration cost variation due to array orientation and geographic location in the Electric Reliability Council of Texas. Appl. Energy 2016, 180, 607–616. [Google Scholar] [CrossRef]
- Silva, A.R.; Pimenta, F.M.; Assireu, A.T.; Spyrides, M.H.C. Complementarity of Brazil’s hydro and offshore wind power. Renew. Sustain. Energy Rev. 2016, 56, 413–427. [Google Scholar] [CrossRef]
- International Renewable Energy Agency (IRENA). Renewable Energy Market Analysis: Latin America; IRENA: Abu Dhabi, UAE, 2016. [Google Scholar]
- Agora Energiewende. The Integration Cost of Wind and Solar Power. An Overview of the Debate on the Effects of Adding Wind and Solar Photovoltaic into Power Systems; Agora Energiewende: Berlin, Germany, 2015. [Google Scholar]
- Ghofrani, M.; Arabali, A.; Etezadi-Amoli, M.; Fadali, M.S. Smart scheduling and cost-benefit analysis of grid-enabled electric vehicles for wind power integration. IEEE Trans. Smart Grid 2014, 5, 2306–2313. [Google Scholar] [CrossRef]
- Gils, H.C. Economic potential for future demand response in Germany—Modeling approach and case study. Appl. Energy 2016, 162, 401–415. [Google Scholar] [CrossRef]
- Hirth, L.; Müller, S. System-friendly wind power: How advanced wind turbine design can increase the economic value of electricity generated through wind power. Energy Econ. 2016, 56, 51–63. [Google Scholar] [CrossRef]
- Söderholm, P.; Sundqvist, T. Pricing environmental externalities in the power sector: Ethical limits and implications for social choice. Ecol. Econ. 2003, 46, 333–350. [Google Scholar] [CrossRef]
- Dalianis, D.; Petassis, D.; Santamouris, M.; Argiriou, A.; Cartalis, C.; Asimakopoulos, D.N. Social cost of electricity generation in Greece. Renew. Energy 1997, 12, 281–289. [Google Scholar] [CrossRef]
- Karimzadegan, H.; Rahmatian, M.; Farsiabi, M.M.; Meiboudi, H. Social cost of fossil-based electricity generation plants in Iran. Environ. Eng. Manag. J. 2015, 14, 2373–2381. [Google Scholar]
- Tol, R.S.J. The economic effects of climate change. J. Econ. Perspect. 2009, 23, 29–51. [Google Scholar] [CrossRef]
- Anthoff, D. Report on Marginal External Damage Costs of Greenhouse Gas Emissions. Available online: http://www.needs-project.org/2009/Deliverables/RS1b%20D5.4-5.5.pdf (accessed on 7 March 2017).
- Fabert, B.P.; Dumas, P.; Hourcade, J.-C. What Social Cost of Carbon? A Mapping of the Climate Debate; Social Science Research Network: Rochester, NY, USA, 2012. [Google Scholar]
- Van den Bergh, J.C.J.M.; Botzen, W.J.W. Monetary valuation of the social cost of CO2 emissions: A critical survey. Ecol. Econ. 2015, 114, 33–46. [Google Scholar] [CrossRef]
- Van den Bergh, J.C.J.M.; Botzen, W.J.W. A lower bound to the social cost of CO2 emissions. Nat. Clim. Chang. 2014, 4, 253–258. [Google Scholar] [CrossRef]
- Watkiss, P.; Downing, T. The social cost of carbon: Valuation estimates and their use in UK policy. Integr. Assess. 2008, 8, 85–105. [Google Scholar]
- Interagency Working Group on Social Cost of Carbon. Technical Update of the Social Cost of Carbon for Regulatory Impact Analysis—Under Executive Order 12866. Available online: https://obamawhitehouse.archives.gov/sites/default/files/omb/inforeg/scc-tsd-final-july-2015.pdf (accessed on 7 March 2017).
- Tol, R.S.J. Targets for global climate policy: An overview. J. Econ. Dyn. Control 2013, 37, 911–928. [Google Scholar] [CrossRef]
- Ackerman, F.; Stanton, E.A. Climate risks and carbon prices: Revising the social cost of carbon. Economics 2012, 6, 1–25. [Google Scholar] [CrossRef]
- Moore, F.C.; Diaz, D.B. Temperature impacts on economic growth warrant stringent mitigation policy. Nat. Clim. Chang. 2015, 5, 127–131. [Google Scholar] [CrossRef]
- Revesz, R.L.; Howard, P.H.; Arrow, K.; Goulder, L.H.; Kopp, R.E.; Livermore, M.A.; Oppenheimer, M.; Sterner, T. Global warming: Improve economic models of climate change. Nat. News 2014, 508, 173. [Google Scholar] [CrossRef]
- Weitzman, M.L. Tail-hedge discounting and the social cost of carbon. J. Econ. Lit. 2013, 51, 873–882. [Google Scholar] [CrossRef]
- Stern, N. The structure of economic modeling of the potential impacts of climate change: Grafting gross underestimation of risk onto already narrow science models. J. Econ. Lit. 2013, 51, 838–859. [Google Scholar] [CrossRef]
- Tol, R.S.J. The social cost of carbon. Annu. Rev. Resour. Econ. 2011, 3, 419–443. [Google Scholar] [CrossRef]
- Kopp, R.E.; Golub, A.; Keohane, N.O.; Golub, A.; Keohane, N.O.; Onda, C. The Influence of the specification of climate change damages on the social cost of carbon. Economics 2012, 6, 1–40. [Google Scholar] [CrossRef]
- Lenton, T.M.; Ciscar, J.-C. Integrating tipping points into climate impact assessments. Clim. Chang. 2013, 117, 585–597. [Google Scholar] [CrossRef]
- Weitzman, M.L. Fat-tailed uncertainty in the economics of catastrophic climate change. Rev. Environ. Econ. Policy 2011, 5, 275–292. [Google Scholar] [CrossRef]
- Fischedick, M.; Esken, A.; Pastowski, A.; Schüwer, D.; Supersberger, N.; Nitsch, J.; Viebahn, P.; Bandi, A.; Zuberbühler, U.; Edenhofer, O. RECCS: Ecological, Economic and Structural Comparison of Renewable Energy Technologies (RE) with Carbon Capture and Storage (CCS)—An Integrated Approach; Federal Ministry for the Environment, Nature Conservation and Nuclear Safety: Wuppertal, Germany, 2008.
- Sathaye, J.; Lucon, O.; Rahman, A.; Christensen, J.; Denton, F.; Fujino, J.; Heath, G.; Kadner, S.; Mirza, M.; Rudnick, H.; et al. Renewable Energy in the Context of Sustainable Development. In IPCC Special Report on Renewable Energy Sources and Climate Change Mitigation; Edenhofer, O., Pichs-Madruga, R., Sokona, Y., Seyboth, K., Matschoss, P., Kadner, S., Zwickel, T., Eickemeier, P., Hansen, G., Schlömer, S., et al., Eds.; Cambridge University Press: Cambridge, UK; New York, NY, USA, 2011. [Google Scholar]
- Warner, E.S.; Heath, G.A. Life cycle greenhouse gas emissions of nuclear electricity generation. J. Ind. Ecol. 2012, 16, S73–S92. [Google Scholar] [CrossRef]
- National Research Council. Hidden Costs of Energy: Unpriced Consequences of Energy Production and Use; The National Academies Press: Washington, DC, USA, 2010. [Google Scholar]
- European Environment Agency. European Union Emission Inventory Report 1990–2014 under the UNECE Convention on Long-Range Transboundary Air Pollution (LRTAP); European Environment Agency: Copenhagen, Denmark, 2016. [Google Scholar]
- Anderson, J.O.; Thundiyil, J.G.; Stolbach, A. Clearing the air: A review of the effects of particulate matter air pollution on human health. J. Med. Toxicol. 2012, 8, 166–175. [Google Scholar] [CrossRef] [PubMed]
- Gauderman, W.J.; Avol, E.; Gilliland, F.; Vora, H.; Thomas, D.; Berhane, K.; McConnell, R.; Kuenzli, N.; Lurmann, F.; Rappaport, E.; et al. The Effect of air pollution on lung development from 10 to 18 years of age. N. Engl. J. Med. 2004, 351, 1057–1067. [Google Scholar] [CrossRef] [PubMed]
- Kim, K.-H.; Kabir, E.; Kabir, S. A review on the human health impact of airborne particulate matter. Environ. Int. 2015, 74, 136–143. [Google Scholar] [CrossRef] [PubMed]
- Pope, C.A.; Burnett, R.T.; Thun, M.J.; Calle, E.E.; Krewski, D.; Ito, K.; Thurston, G.D. Lung cancer, cardiopulmonary mortality, and long-term exposure to fine particulate air pollution. JAMA 2002, 287, 1132–1141. [Google Scholar] [CrossRef] [PubMed]
- Pope, C.A.; Dockery, D.W. Health effects of fine particulate air pollution: Lines that connect. J. Air Waste Manag. Assoc. 2006, 56, 709–742. [Google Scholar] [CrossRef] [PubMed]
- Sousa, S.I.V.; Alvim-Ferraz, M.C.M.; Martins, F.G. Health effects of ozone focusing on childhood asthma: What is now known—A review from an epidemiological point of view. Chemosphere 2013, 90, 2051–2058. [Google Scholar] [CrossRef] [PubMed]
- United Nations Environment Programme (UNEP). Global Mercury Assessment 2013: Sources, Emissions, Releases and Environmental Transport; UNEP Chemicals Branch: Geneva, Switzerland, 2013; p. 42. [Google Scholar]
- Preiss, P.; Roos, J.; Friedrich, R. Assessment of Health Impacts of Coal Fired Power Stations in Germany; Institute for Energy Economics and the Rational Use of Energy (IER): Stuttgart, Germany, 2013. [Google Scholar]
- Torfs, R.; Hurley, F.; Miller, B.; Rabl, A. A Set of Concentration-Response Functions. Available online: http://www.needs-project.org/2009/Deliverables/Rs1b%20D3.7.pdf (accessed on 10 March 2017).
- External Costs from Emerging Electricity Generation Technologies. Available online: http://www.needs-project.org/docs/RS1a%20D6_1%20External%20costs%20of%20reference%20technologies%2024032009.pdf (accessed on 10 March 2017).
- Epstein, P.R.; Buonocore, J.J.; Eckerle, K.; Hendryx, M.; Stout, B.M., III; Heinberg, R.; Clapp, R.W.; May, B.; Reinhart, N.L.; Ahern, M.M.; et al. Full cost accounting for the life cycle of coal. Ann. N. Y. Acad. Sci. 2011, 1219, 73–98. [Google Scholar] [CrossRef] [PubMed]
- Schwartz, J.; Coull, B.; Laden, F.; Ryan, L. The effect of dose and timing of dose on the association between airborne particles and survival. Environ. Health Perspect. 2008, 116, 64–69. [Google Scholar] [CrossRef] [PubMed]
- Machol, B.; Rizk, S. Economic value of U.S. fossil fuel electricity health impacts. Environ. Int. 2013, 52, 75–80. [Google Scholar] [CrossRef] [PubMed]
- Hoen, B.; Brown, J.P.; Jackson, T.; Thayer, M.A.; Wiser, R.; Cappers, P. Spatial hedonic analysis of the effects of us wind energy facilities on surrounding property values. J. Real Estate Financ. Econ. 2015, 51, 22–51. [Google Scholar] [CrossRef]
- Hoen, B.; Atkinson-Palombo, C. Wind turbines, amenities and disamenities: A study of home value impacts in densely populated Massachusetts. J. Real Estate Res. 2016, 38, 473–504. [Google Scholar]
- Lang, C.; Opaluch, J.J.; Sfinarolakis, G. The windy city: Property value impacts of wind turbines in an urban setting. Energy Econ. 2014, 44, 413–421. [Google Scholar] [CrossRef]
- Laposa, S.; Mueller, A. Wind farm announcements and rural home prices: Maxwell ranch and rural northern Colorado. J. Sustain. Real Estate 2010, 2, 383–402. [Google Scholar]
- Dröes, M.I.; Koster, H.R.A. Renewable energy and negative externalities: The effect of wind turbines on house prices. J. Urban Econ. 2016, 96, 121–141. [Google Scholar] [CrossRef]
- Gibbons, S. Gone with the wind: Valuing the visual impacts of wind turbines through house prices. J. Environ. Econ. Manag. 2015, 72, 177–196. [Google Scholar] [CrossRef]
- Sunak, Y.; Madlener, R. The impact of wind farm visibility on property values: A spatial difference-in-differences analysis. Energy Econ. 2016, 55, 79–91. [Google Scholar] [CrossRef]
- Sunak, Y.; Madlener, R. The impact of wind farms on property values: A locally weighted hedonic pricing model. Pap. Reg. Sci. 2015. [Google Scholar] [CrossRef]
- Krueger, A.D.; Parsons, G.R.; Firestone, J. Valuing the visual disamenity of offshore wind power projects at varying distances from the shore: An application on the delaware shoreline. Land Econ. 2011, 87, 268–283. [Google Scholar] [CrossRef]
- Ladenburg, J.; Lutzeyer, S. The economics of visual disamenity reductions of offshore wind farms—Review and suggestions from an emerging field. Renew. Sustain. Energy Rev. 2012, 16, 6793–6802. [Google Scholar] [CrossRef]
- Meyerhoff, J.; Ohl, C.; Hartje, V. Landscape externalities from onshore wind power. Energy Policy 2010, 38, 82–92. [Google Scholar] [CrossRef]
- Westerberg, V.; Jacobsen, J.B.; Lifran, R. The case for offshore wind farms, artificial reefs and sustainable tourism in the French mediterranean. Tour. Manag. 2013, 34, 172–183. [Google Scholar] [CrossRef]
- Mirasgedis, S.; Tourkolias, C.; Tzovla, E.; Diakoulaki, D. Valuing the visual impact of wind farms: An application in South Evia, Greece. Renew. Sustain. Energy Rev. 2014, 39, 296–311. [Google Scholar] [CrossRef]
- Schleisner, L.; Sieverts Nielsen, P. External Costs Related to Power Production Technologies; Externe National Implementation for Denmark; Risoe National Lab.: Roskilde, Denmark, 1997. [Google Scholar]
- Chiang, A.C.; Keoleian, G.A.; Moore, M.R.; Kelly, J.C. Investment cost and view damage cost of siting an offshore wind farm: A spatial analysis of Lake Michigan. Renew. Energy 2016, 96, 966–976. [Google Scholar] [CrossRef]
- Markandya, A.; Bigano, A.; Porchia, R. The Social Cost of Electricity: Scenarios and Policy Implications; Edward Elgar Publishing Ltd.: Cheltenham, UK; Northampton, MA, USA, 2011. [Google Scholar]
- Lewis, L.Y.; Bohlen, C.; Wilson, S. Dams, dam removal, and river restoration: A hedonic property value analysis. Contemp. Econ. Policy 2008, 26, 175–186. [Google Scholar] [CrossRef]
- Bohlen, C.; Lewis, L.Y. Examining the economic impacts of hydropower dams on property values using GIS. J. Environ. Manag. 2009, 90 (Suppl. S3), S258–S269. [Google Scholar] [CrossRef] [PubMed]
- Provencher, B.; Sarakinos, H.; Meyer, T. Does small dam removal affect local property values? An empirical analysis. Contemp. Econ. Policy 2008, 26, 187–197. [Google Scholar] [CrossRef]
- McKean, J.R.; Johnson, D.; Taylor, R.G.; Johnson, R. Willingness to pay for non angler recreation at the lower Snake River reservoirs. J. Leis. Res. 2005, 37, 178–194. [Google Scholar]
- Rolfe, J.; Prayaga, P. Estimating values for recreational fishing at freshwater dams in Queensland. Aust. J. Agric. Resour. Econ. 2007, 51, 157–174. [Google Scholar] [CrossRef]
- Loomis, J.B. Measuring the economic benefits of removing dams and restoring the elwha river: Results of a contingent valuation survey. Water Resour. Res. 1996, 32, 441–447. [Google Scholar] [CrossRef]
- Getzner, M. Importance of free-flowing rivers for recreation: Case study of the River Mur in Styria, Austria. J. Water Resour. Plan. Manag. 2015, 141, 04014050. [Google Scholar] [CrossRef]
- Ricci, A. Annex—A Summary Account of the Final Debate. Available online: http://www.needs-project.org/docs/Annexstampa.pdf (accessed on 10 March 2017).
- Nordhaus, W. Estimates of the social cost of carbon: Concepts and results from the DICE-2013R Model and alternative approaches. J. Assoc. Environ. Resour. Econ. 2014, 1, 273–312. [Google Scholar] [CrossRef]
- Sovacool, B.K. Contextualizing avian mortality: A preliminary appraisal of bird and bat fatalities from wind, fossil-fuel, and nuclear electricity. Energy Policy 2009, 37, 2241–2248. [Google Scholar] [CrossRef]
- Willis, C.K.R.; Barclay, R.M.R.; Boyles, J.G.; Mark Brigham, R.; Brack, V., Jr.; Waldien, D.L.; Reichard, J. Bats are not birds and other problems with Sovacool’s (2009) analysis of animal fatalities due to electricity generation. Energy Policy 2010, 38, 2067–2069. [Google Scholar] [CrossRef]
- Ho, C.K. Review of avian mortality studies at concentrating solar power plants. In AIP Conference Proceedings; AIP Publishing: Melville, NY, USA, 2016; Volume 1734, p. 070017. [Google Scholar]
- Walston, L.J., Jr.; Rollins, K.E.; LaGory, K.E.; Smith, K.P.; Meyers, S.A. A preliminary assessment of avian mortality at utility-scale solar energy facilities in the United States. Renew. Energy 2016, 92, 405–414. [Google Scholar] [CrossRef]
- Burgherr, P.; Hirschberg, S. Comparative risk assessment of severe accidents in the energy sector. Energy Policy 2014, 74 (Suppl. S1), S45–S56. [Google Scholar] [CrossRef]
- Friedrich, R.; Rabl, A.; Hirschberg, S.; Desaigues, B.; Markandya, A.; de Nocker, L. New elements for the assessment of external costs from energy technologies. In EU 5th Framework Programme; Institute for Energy Economics and the Rational Use of Energy: Stuttgart, Germany, 2004. [Google Scholar]
- ExternE: Externalities of Energy: Methodology 2005 Update; Bickel, P.; Friedrich, R. (Eds.) Office for Official Publications of the European Communities: Luxembourg, 2005.
- Eeckhoudt, L.; Schieber, C.; Schneider, T. Risk aversion and the external cost of a nuclear accident. J. Environ. Manag. 2000, 58, 109–117. [Google Scholar] [CrossRef]
- Markandya, A.; Dale, N.; Schneider, T. Improvement of the Assessment of the External Costs of Severe Nuclear Accidents; Centre d’Etude sur l’Evaluation de la Protection dans le Domaine Nucleaire: Fontenay-aux-Roses, France, 1998. [Google Scholar]
- OECD; Nuclear Energy Agency. Nuclear Electricity Generation: What Are the External Costs? OECD: Paris, France, 2003. [Google Scholar]
- Rabl, A.; Rabl, V.A. External costs of nuclear: Greater or less than the alternatives? Energy Policy 2013, 57, 575–584. [Google Scholar] [CrossRef]
- Burtraw, D.; Krupnick, A.; Sampson, G.; Beasley, B. The True Cost of Electric Power—An Inventory of Methodologies to Support Future Decisionmaking in Comparing the Cost and Competitiveness of Electricity Generation Technologies; Resources for the Future: Washington, DC, USA, 2012. [Google Scholar]
- Laes, E.; Meskens, G.; van der Sluijs, J.P. On the contribution of external cost calculations to energy system governance: The case of a potential large-scale nuclear accident. Energy Policy 2011, 39, 5664–5673. [Google Scholar] [CrossRef]
- Arnold, S.; Hunt, A. National and EU-Level Estimates of Energy Supply Externalities; Centre for European Policy Studies (CEPS): Brussels, Belgium, 2009. [Google Scholar]
- Markandya, A.; Pemberton, M. Energy security, energy modelling and uncertainty. Energy Policy 2010, 38, 1609–1613. [Google Scholar] [CrossRef]
- Valentine, S.V. Emerging symbiosis: Renewable energy and energy security. Renew. Sustain. Energy Rev. 2011, 15, 4572–4578. [Google Scholar] [CrossRef]
- Mathur, H.M. Displacement and Resettlement in India: The Human Cost of Development; Routledge: Abingdon, UK, 2013; Volume 69. [Google Scholar]
- Owen, J.R.; Kemp, D. Mining-induced displacement and resettlement: A critical appraisal. J. Clean. Prod. 2015, 87, 478–488. [Google Scholar] [CrossRef]
- Scudder, T. Resettlement Outcomes of Large Dams. In Impacts of Large Dams: A Global Assessment; Tortajada, C., Altinbilek, D., Biswas, A.K., Eds.; Water Resources Development and Management; Springer: Berlin/Heidelberg, Germany, 2012; pp. 37–67. [Google Scholar]
- Sovacool, B.K.; Bulan, L.C. Behind an ambitious megaproject in Asia: The history and implications of the Bakun hydroelectric dam in Borneo. Energy Policy 2011, 39, 4842–4859. [Google Scholar] [CrossRef]
- Kronenberg, T. Should we worry about the failure of the hotelling rule? J. Econ. Surv. 2008, 22, 774–793. [Google Scholar] [CrossRef]
- Reynolds, D.B. Uncertainty in exhaustible natural resource economics: The irreversible sunk costs of Hotelling. Resour. Policy 2013, 38, 532–541. [Google Scholar] [CrossRef]
- Schilling, M.; Chiang, L. The effect of natural resources on a sustainable development policy: The approach of non-sustainable externalities. Energy Policy 2011, 39, 990–998. [Google Scholar] [CrossRef]
- Masanet, E.; Chang, Y.; Gopal, A.R.; Larsen, W.P., III; Sathre, R.; Shehabi, A.; Zhai, P. Life-cycle assessment of electric power systems. Annu. Rev. Environ. Resour. 2013, 38, 107–136. [Google Scholar] [CrossRef]
- Grünthal, G. Induced seismicity related to geothermal projects versus natural tectonic earthquakes and other types of induced seismic events in Central Europe. Geothermics 2014, 52, 22–35. [Google Scholar] [CrossRef]
- Ek, K.; Persson, L. Wind farms—Where and how to place them? A choice experiment approach to measure consumer preferences for characteristics of wind farm establishments in Sweden. Ecol. Econ. 2014, 105, 193–203. [Google Scholar] [CrossRef]
- Dastrup, S.R.; Graff Zivin, J.; Costa, D.L.; Kahn, M.E. Understanding the Solar Home price premium: Electricity generation and “Green” social status. Eur. Econ. Rev. 2012, 56, 961–973. [Google Scholar] [CrossRef]
- Blazejczak, J.; Diekmann, J.; Edler, D.; Kemfert, C.; Neuhoff, K.; Schill, W.-P. Energiewende Erfordert Hohe Investitionen; DIW Wochenbericht; DIW: Berlin, Germany, 2013; pp. 19–30. [Google Scholar]
- Grubler, A. The costs of the French nuclear scale-up: A case of negative learning by doing. Energy Policy 2010, 38, 5174–5188. [Google Scholar] [CrossRef]
- Lovering, J.R.; Yip, A.; Nordhaus, T. Historical construction costs of global nuclear power reactors. Energy Policy 2016, 91, 371–382. [Google Scholar] [CrossRef]
- Escobar Rangel, L.; Lévêque, F. Revisiting the Nuclear Power Construction Costs Escalation Curse. Available online: http://www.iaee.org/en/publications/fullnewsletter.aspx?id=27 (accessed on 10 March 2017).
- Sensfuß, F.; Pfluger, B. Optimized Pathways towards Ambitious Climate Protection in the European Electricity System (EU Long-Term Scenarios 2050 II); Fraunhofer ISI: Karlsruhe, Germany, 2014. [Google Scholar]
- Akbilgic, O.; Doluweera, G.; Mahmoudkhani, M.; Bergerson, J. A meta-analysis of carbon capture and storage technology assessments: Understanding the driving factors of variability in cost estimates. Appl. Energy 2015, 159, 11–18. [Google Scholar] [CrossRef]


| Plant-Level Costs |
| ● Capital costs |
| ● Fuel costs |
| ● Market costs of greenhouse gas (GHG) emissions |
| ● Non-fuel operation and maintenance costs (fixed and variable) |
| System Costs |
| ● Grid costs |
| ● Balancing costs |
| ● Profile costs |
| External Costs 1 |
| ● Social costs of GHG emissions (minus market costs of GHG emissions) |
| ● Impacts of non-GHG pollution |
| ● Landscape and noise impacts |
| ● Impacts on ecosystems and biodiversity (beyond those related to climate change) |
| ● External costs associated with radionuclide emissions |
| Source | Country or Region | Technology | Penetration Rate (Share of Total Electricity Generation) | Grid Costs (in €-cent/kWh) | Comments |
|---|---|---|---|---|---|
| [57] 1 (meta-study) | USA | Wind (onshore and offshore) | Not provided (varying) | 1.4 | Median; full range: 0–7.2 |
| [54] (meta-study) | Six European countries | Wind (onshore and offshore) | ≈10%–60% | ≈0.4 | Median; full range: ≈0.2–1.1 Original data in €/kW; conversion assumes 2000 full load hours per year, a discount rate of 7% and a grid lifetime of 40 years No clear correlation between specific grid costs and penetration level |
| [58] 1 | Six OECD countries | Wind (onshore) | 10% | 0.2 | Median; full range: <0.1–0.3 |
| 30% | 0.3 | Median; full range: 0.2–2.0 | |||
| Wind (offshore) | 10% | 0.1 | Median; full range: <0.1–0.2 | ||
| 30% | 0.2 | Median; full range: <0.1–1.1 | |||
| Solar PV | 10% | 0.4 | Median; full range: <0.1–0.5 | ||
| 30% | 0.5 | Median; full range: 0.2–4.3 | |||
| Nuclear, coal, gas | 10% and 30% | 0 | - | ||
| [59] | Eleven European countries | Solar PV | 15% to 18% | 1.2 | Maximum; lower in some countries; only distribution grid and cross-country transmission lines taken into account |
| [60] | Australia | CSP 2 (with storage) | 18%–23% | 0.2 | - |
| Geothermal | 0.3 | ||||
| Biomass | <0.1 | ||||
| Coal CCS | <0.1 |
| Source | Country or Region | Technology | Penetration Rate (Share of Total Electricity Generation) | Balancing Costs (in €-cent/kWh) | Comment |
|---|---|---|---|---|---|
| [58] | Six OECD countries | Nuclear | 10% | <0.1 | - |
| 30% | <0.1 | ||||
| Wind (onshore and offshore) and solar PV | 10% | 0.3 | Median; full range: 0.2–0.7 | ||
| 30% | 0.5 | Median; full range: 0.5–1.3 | |||
| [63] 1 | Arizona, USA | Solar PV | 8% | 0.2 | Median, full range: 0.2–0.3 |
| [64] (meta-study) | USA and several European countries | Wind (onshore and offshore) | ≈10% | 0.3 | Median; full range: <0.1–0.4 |
| ≈20% | 0.3 | Median; full range: <0.1–0.5 | |||
| ≈30% | 0.4 | Median; full range: 0.1–-0.6 | |||
| [59] | Eleven European countries | Solar PV | 15% | 0.1 | - |
| [14] (meta-study) | Several European countries and several regions of the USA | Wind (onshore and offshore) | ≈1% to 40% | ≈0.3 | Median, full range: <0.1–1.3 No clear correlation between specific balancing costs and penetration level |
| Source | Method Used | VRE Technology | Penetration Rate (Share of Total Electricity Generation) | Profile Costs (in €-cent/kWhVRE) | Comment | |
|---|---|---|---|---|---|---|
| Average | Marginal | |||||
| [51] 1 | Generic modelling (typical for European countries with mainly thermal power plants) | Wind | 10% | 1.5 | 1.9 | VRE curtailment costs included |
| 20% | 1.9 | 2.5 | ||||
| 40% | 2.5 | 4.6 | ||||
| Solar PV | 10% | 1.5 | 2.7 | |||
| 15% | 2.1 | 3.3 | ||||
| 25% | 3.3 | 9.8 | ||||
| [65] 2 | Generic modelling (based on load data, wind power and solar PV data for Germany) | Wind | 10% | 1.0 | n.s. | No VRE curtailment or related costs assumed |
| 20% | 1.3 | n.s. | ||||
| 40% | 1.5 | n.s. | ||||
| Solar PV | 10% | 0.8 | n.s. | |||
| 20% | 1.3 | n.s. | ||||
| 40% | 2.0 | n.s. | ||||
| Wind (2/3) and solar PV (1/3) | 10% | 0.3 | n.s. | |||
| 20% | 0.7 | n.s. | ||||
| 40% | 1.1 | n.s. | ||||
| [14] 1 | Meta-study (literature sources used cover several European countries and several regions of the USA) | Wind | 10% | 0.5 | 0.8 | No VRE curtailment costs included; based on best-fit curve for values of studies using long-term models |
| 20% | 0.8 | 1.2 | ||||
| 40% | 1.3 | 2.2 | ||||
| Average | 95th Percentile | |||
|---|---|---|---|---|
| Discount rate | 5% | 3% | 2.5% | 3% |
| SCC value (in €2015/ton) | 11 | 37 | 58 | 109 |
| Technology/Energy Source | Low | Medium | High |
|---|---|---|---|
| Lignite | 1.0 | 10.2 | 56.2 |
| Coal | 0.9 | 9.0 | 49.6 |
| Natural gas | 0.4 | 4.5 | 24.8 |
| Coal CCS (post combustion) | 0.3 | 3.0 | 16.4 |
| Coal CCS (oxy-fuel) | 0.2 | 2.0 | 11.0 |
| Natural gas CCS | 0.1 | 1.5 | 8.3 |
| Biomass | <0.1 | 0.4 | 2.3 |
| Hydro | <0.1 | 0.1 | 0.4 |
| Solar PV | <0.1 | 0.3 | 1.7 |
| Wind (onshore) | <0.1 | 0.1 | 0.7 |
| Wind (offshore) | <0.1 | 0.1 | 0.6 |
| CSP | <0.1 | 0.2 | 1.3 |
| Geothermal | <0.1 | 0.5 | 2.5 |
| Ocean | <0.1 | 0.1 | 0.5 |
| Nuclear (LWR) | <0.1 | 0.1 | 0.8 |
| Technology/Energy Source | Health Impacts | Crop Yield Losses | Material Damage | Sum |
|---|---|---|---|---|
| Nuclear power | 0.07 | 0.00 | 0.00 | 0.08 |
| Offshore wind | 0.07 | 0.00 | 0.00 | 0.07 |
| Ocean energy | 0.15 | 0.00 | 0.00 | 0.15 |
| CSP | 0.15 | 0.00 | 0.00 | 0.15 |
| Natural gas (CCGT) | 0.39 | 0.01 | 0.01 | 0.41 |
| Natural gas (CCGT, with post-combustion CCS) | 0.34 | 0.01 | 0.01 | 0.36 |
| Solar PV | 0.59 | 0.00 | 0.01 | 0.60 |
| Lignite | 0.90 | 0.02 | 0.01 | 0.94 |
| Hard coal | 1.31 | 0.02 | 0.02 | 1.36 |
| Hard coal (with post-combustion CCS) | 1.43 | 0.04 | 0.02 | 1.50 |
| Hard coal (with oxy-fuel CCS) | 1.04 | 0.02 | 0.02 | 1.08 |
| Biomass | 1.91 | 0.07 | 0.04 | 2.02 |
| Type of Wind Power | Study | Geographical Scope | Method | Costs of Landscape and Noise Impacts (in €-cent/kWh) | Comments |
|---|---|---|---|---|---|
| Onshore | [115] | The Netherlands | Revealed preference | 0.90 | Average; full range: 0.5–2.0; own assumptions made to derive per kWh costs: home buyers consider disamenity over 25 years and the average full load hours of onshore wind turbines in the Netherlands are 2300/a |
| [123] | South Evia, Greece | Stated preference | 0.27 | - | |
| [124] | Denmark | Revealed preference | 0.02 | Investigated area sparsely populated | |
| Offshore | [119] | Delaware, USA | Stated preference | 0.28 | Wind farm assumed to be 3.6 miles from the coast |
| 0.07 | Wind farm assumed to be 6 miles from the coast | ||||
| [125] | Lake Michigan Area, USA | Stated preference | 0.08 | Mean value provided |
| Technology/Energy Source | Due to Airborne Emissions | Due to Land Use Changes | Sum |
|---|---|---|---|
| Nuclear power | <0.01 | 0.01 | <0.1 |
| Offshore wind | 0.00 | n.a. | n.a. |
| Ocean energy | 0.01 | 0.00 | <0.1 |
| CSP | 0.01 | n.a. | n.a. |
| Natural gas (CCGT) | 0.04 | 0.01 | <0.1 |
| Natural gas (CCGT, with post-combustion CCS) | 0.02 | 0.02 | <0.1 |
| Solar PV | 0.02 | n.a. | n.a. |
| Lignite | 0.09 | 0.01 | 0.1 |
| Hard coal | 0.11 | 0.06 | 0.2 |
| Hard coal (with post-combustion CCS) | 0.21 | 0.07 | 0.3 |
| Hard coal (with oxy-fuel CCS) | 0.09 | 0.07 | 0.2 |
| Biomass | 0.24 | 0.82 | 1.1 |
| Type of Cost | Costs in €-cent/kWh | ||||||
|---|---|---|---|---|---|---|---|
| Renewables | Nuclear (at a 3% Discount Rate) | Nuclear (at a 6% Discount Rate) | Fossil Fuels | ||||
| Onshore Wind | Offshore Wind | Solar PV (Utility-Scale) | Natural Gas (CCGT) | Hard Coal | |||
| Plant-level costs | |||||||
| Installation costs (central values) | 4.4 | 7.6 | 5.8 | 3.4 | 6.2 | 0.7 | 1.5 |
| O&M costs (central values) | 2.0 | 3.6 | 2.0 | 1.6 | 1.6 | 0.6 | 0.8 |
| Fuel costs (central values) | 0.0 | 0.0 | 0.0 | 0.9 | 0.9 | 4.9 | 2.0 |
| Sum of plant-level costs (w/o CO2 costs) (central values; ranges in parenthesis) | 6.4 (2.5–9.7) | 11.2 (7.5–14.9) | 7.8 (5.3–10.1) | 5.8 (4.8–6.9) | 8.6 (6.8–10.1) | 6.2 (5.9–6.7) | 4.3 (3.3–4.8) |
| System costs | |||||||
| Grid costs | 1.0 | 1.0 | 1.0 | 0.5 | 0.5 | 0.5 | 0.5 |
| Balancing costs | 0.3 | 0.3 | 0.2 | 0 | 0 | 0 | 0 |
| Profile costs (additional costs for VRE plants for shares of around or below 10% for wind and solar PV each) | 1.0 | 1.0 | 1.0 | 0 | 0 | 0 | 0 |
| Sum of system costs | 2.3 | 2.3 | 2.2 | 0.5 | 0.5 | 0.5 | 0.5 |
| Quantifiable external costs | |||||||
| GHG emissions costs (at 114 €/t CO2) | 0.1 | 0.1 | 0.3 | 0.1 | 0.1 | 4.5 | 9.0 |
| Air pollution costs (state-of-the art plants) | <0.1 | <0.1 | 0.3 | <0.1 | <0.1 | 0.4 | 1.4 |
| Landscape and noise disamenity costs | 0.5 | 0.2 | 0 | 0 | 0 | 0 | 0 |
| Sum of quantifiable external costs | 0.6 | 0.3 | 0.6 | 0.1 | 0.1 | 4.9 | 10.4 |
| SUM OF ALL QUANTIFIABLE COSTS (with central plant-level values; with plant-level ranges in parenthesis) | 9.3 (5.4–12.6) | 13.8 (10.1–17.5) | 10.6 (8.1–12.9) | 6.4 (5.4–7.5) | 9.2 (7.4–10.7) | 11.6 (11.3–12.1) | 15.2 (14.2–15.7) |
| Potentially relevant non-quantifiable external costs | |||||||
| Radioactive contamination (especially resulting from nuclear accidents) | - | - | - | x | x | - | - |
| Ecosystem and biodiversity impacts (non-climate change related) | x | x | x | x | x | x | x |
| Type of Cost | Costs in €-cent/kWh | ||||||
|---|---|---|---|---|---|---|---|
| Renewables | Nuclear (at a 3% Discount Rate) | Nuclear (at a 6% Discount Rate) | Fossil Fuels | ||||
| Onshore Wind | Offshore Wind | Solar PV (Utility-Scale) | Natural Gas (CCGT) | Hard Coal | |||
| Plant-level costs | |||||||
| Installation costs (central values) | 2.7 | 7.4 | 3.1 | 3.4 | 6.2 | 0.7 | 2.2 |
| O&M costs (central values) | 1.4 | 3.6 | 0.9 | 1.6 | 1.6 | 0.5 | 1 |
| Fuel costs (central values) | 0 | 0 | 0 | 0.9 | 0.9 | 2.7 | 1.7 |
| Sum of plant-level costs (w/o CO2 costs) (central values; ranges in parenthesis) | 4.1 (2.7–9.1) | 11.0 (7.5–14.9) | 4.0 (2.8–5.4) | 5.8 (4.8–6.9) | 8.6 (6.8–10.1) | 3.8 (3.4–4.5) | 4.9 (4.0–5.7) |
| System costs | |||||||
| Grid costs | 1.0 | 1.0 | 1.0 | 0.5 | 0.5 | 0.5 | 0.5 |
| Balancing costs | 0.3 | 0.3 | 0.2 | 0 | 0 | 0 | 0 |
| Profile costs (additional costs for VRE plants for shares of around or below 10% for wind and solar PV each) | 1.0 | 1.0 | 1.0 | 0 | 0 | 0 | 0 |
| Sum of system costs | 2.3 | 2.3 | 2.2 | 0.5 | 0.5 | 0.5 | 0.5 |
| External costs | |||||||
| GHG emissions costs (at 114 €/t CO2) | 0.1 | 0.1 | 0.2 | 0.1 | 0.1 | 4.5 | 9.0 |
| Air pollution costs (state-of-the art plants) | <0.1 | <0.1 | 0.2 | <0.1 | <0.1 | 0.4 | 1.4 |
| Landscape and noise disamenity costs | 0.2 | 0.2 | 0 | 0 | 0 | 0 | 0 |
| Sum of quantifiable external costs | 0.3 | 0.3 | 0.4 | 0.1 | 0.1 | 4.9 | 10.4 |
| SUM OF ALL QUANTIFIABLE COSTS (with central plant-level values; with plant-level ranges in parenthesis) | 6.7 (5.3–11.7) | 13.6 (10.1–17.5) | 6.6 (5.4–8.0) | 6.4 (5.4–7.5) | 9.2 (7.4–10.7) | 9.2 (8.8–9.9) | 15.8 (14.9–16.6) |
| Potentially relevant non-quantifiable external costs | |||||||
| Radioactive contamination (especially resulting from nuclear accidents) | - | - | - | x | x | - | - |
| Ecosystem and biodiversity impacts (non-climate change related) | x | x | x | x | x | x | x |
| Type of Cost | Costs in €-cent/kWh | |||||||
|---|---|---|---|---|---|---|---|---|
| Renewables | Nuclear (at a 3% Discount Rate) | Nuclear (at a 6% Discount Rate) | Fossil Fuels | |||||
| Onshore Wind | Offshore Wind | Solar PV (Utility-Scale) | Natural Gas (CCGT) | Hard Coal | ||||
| GHG emissions costs | Low (11 €/t CO2) | <0.1 | <0.1 | <0.1 | <0.1 | <0.1 | 0.4 | 0.9 |
| Medium (114 €/t CO2) | 0.1 | 0.1 | 0.3 | 0.1 | 0.1 | 4.5 | 9.0 | |
| High (626 €/t CO2) | 0.7 | 0.6 | 1.7 | 0.8 | 0.8 | 24.8 | 49.6 | |
| All other quantifiable costs (with central plant-level values) | 9.2 | 13.7 | 10.3 | 6.3 | 9.1 | 7.1 | 6.2 | |
| SUM OF ALL QUANTIFIABLE COSTS (with central plant-level values) | Low CO2 costs (11 €/t CO2) | 9.2 | 13.7 | 10.3 | 6.3 | 9.1 | 7.5 | 7.1 |
| Medium CO2 costs (114 €/t CO2) | 9.3 | 13.8 | 10.6 | 6.4 | 9.2 | 11.6 | 15.2 | |
| High CO2 costs (626 €/t CO2) | 9.9 | 14.3 | 12.0 | 7.1 | 9.9 | 31.9 | 55.8 | |
| Type of Cost | Costs in €-cent/kWh | ||||||
|---|---|---|---|---|---|---|---|
| Renewables | Nuclear (at a 3% Discount Rate) | Nuclear (at a 6% Discount Rate) | Fossil Fuels | ||||
| Onshore Wind | Offshore Wind | Solar PV (Utility-Scale) | Natural Gas (CCGT) | Hard Coal | |||
| Sum of plant-level costs (w/o CO2 costs) (central values; ranges in parenthesis) | 5.5 (2.3–8.3) | 7.6 (4.7–11.1) | 4.6 (3.0–6.2) | 5.8 (4.8–6.9) | 8.6 (6.8–10.1) | 6.2 (5.9–6.7) | 4.3 (3.3–4.8) |
| Grid costs | 1.0 | 1.0 | 1.0 | 0.5 | 0.5 | 0.5 | 0.5 |
| Balancing costs | 0.3 | 0.3 | 0.2 | 0 | 0 | 0 | 0 |
| Profile costs (additional costs for VRE plants for shares of around 35% for wind and 15% for solar PV) | 2.5 | 2.5 | 2.5 | 0 | 0 | 0 | 0 |
| Sum of system costs | 3.8 | 3.8 | 3.7 | 0.5 | 0.5 | 0.5 | 0.5 |
| Sum of quantifiable external costs | 0.5 | 0.2 | 0.1 | 0.1 | 0.1 | 4.9 | 10.4 |
| SUM OF ALL QUANTIFIABLE COSTS (with central plant-level values; with plant-level ranges in parenthesis) | 9.8 (6.6–12.6) | 11.6 (8.5–15.1) | 8.4 (6.8–10.0) | 6.4 (5.4–7.5) | 9.2 (7.4–10.7) | 11.6 (11.3–12.1) | 15.2 (14.2–15.7) |
| Type of Cost | Costs in €-cent/kWh | ||||||
|---|---|---|---|---|---|---|---|
| Renewables | Nuclear (at a 3% Discount Rate) | Nuclear (at a 6% Discount Rate) | Fossil Fuels | ||||
| Onshore Wind | Offshore Wind | Solar PV (Utility-Scale) | Natural Gas (CCGT) | Hard Coal | |||
| Sum of plant-level costs (w/o CO2 costs) (central values; ranges in parenthesis) | 3.7 (2.3–7.2) | 7.6 (4.7–11.1) | 2.7 (1.6–3.4) | 5.8 (4.8–6.9) | 8.6 (6.8–10.1) | 3.8 (3.4–4.5) | 4.9 (4.0–5.7) |
| Grid costs | 1.0 | 1.0 | 1.0 | 0.5 | 0.5 | 0.5 | 0.5 |
| Balancing costs | 0.3 | 0.3 | 0.2 | 0 | 0 | 0 | 0 |
| Profile costs (additional costs for VRE plants for shares of around 35% for wind and 15% for solar PV) | 2.5 | 2.5 | 2.5 | 0 | 0 | 0 | 0 |
| Sum of system costs | 3.8 | 3.8 | 3.7 | 0.5 | 0.5 | 0.5 | 0.5 |
| Sum of quantifiable external costs | 0.3 | 0.2 | 0.1 | 0.1 | 0.1 | 4.9 | 10.4 |
| SUM OF ALL QUANTIFIABLE COSTS (with central plant-level values; with plant-level ranges in parenthesis) | 7.8 (6.4–11.3) | 11.6 (8.7–15.1) | 6.5 (5.4–7.2) | 6.4 (5.4–7.5) | 9.2 (7.4–10.7) | 9.2 (8.8–9.9) | 15.8 (14.9–16.6) |
| Type of Cost | Costs in €-cent/kWh | |||||||
|---|---|---|---|---|---|---|---|---|
| Renewables | Nuclear (at a 3% Discount Rate) | Nuclear (at a 6% Discount Rate) | Fossil Fuels | |||||
| Onshore Wind | Offshore Wind | Solar PV (Utility-Scale) | Natural Gas (CCGT) | Hard Coal | ||||
| Sum of plant-level costs... | ...when all of the profile costs are allocated to VRE generation | 5.5 | 7.6 | 4.6 | 5.8 | 8.6 | 6.2 | 4.3 |
| ...when parts of the profile costs are allocated to baseload generation | 5.5 | 7.6 | 4.6 | 8.9 | 13.6 | 6.9 | 5.7 | |
| Sum of system costs... | ...when all of the profile costs are allocated to VRE generation | 3.8 | 3.8 | 3.7 | 0.5 | 0.5 | 0.5 | 0.5 |
| ...when parts of the profile costs are allocated to baseload generation | 2.8 | 2.8 | 1.2 | 0.5 | 0.5 | 0.5 | 0.5 | |
| Sum of quantifiable external costs | 0.5 | 0.2 | 0.1 | 0.1 | 0.1 | 4.9 | 10.4 | |
| SUM OF ALL QUANTIFIABLE COSTS... | ...when all of the profile costs are allocated to VRE generation | 9.8 | 11.6 | 8.4 | 6.4 | 9.2 | 11.6 | 15.2 |
| ...when parts of the profile costs are allocated to baseload generation | 8.8 | 10.6 | 5.9 | 9.5 | 14.2 | 12.3 | 16.6 | |
| Cost Category | Relevance for Comparing Costs | Scientific Understanding |
|---|---|---|
| Plant-level costs | ||
| Capital costs | High | High |
| Fuel costs | High | Moderate to high |
| Market costs of GHG emissions | High | High |
| Non-fuel O&M costs | High | Moderate to high |
| System costs | ||
| Grid costs | Low to medium | Moderate |
| Balancing costs | Low | Moderate to high |
| Profile costs | Medium to high | Moderate |
| External costs | ||
| Social costs of GHG emissions | Medium to high | Low |
| Impacts of non-GHG pollution | Medium | Low to medium |
| Visual impacts and impacts of noise | Low to medium | Low to medium |
| Impacts on ecosystems & biodiversity (non-climate) | Unclear | Low |
| Costs associated with radionuclide emissions | Unclear | Low |
| Other potential external costs | Unclear | Very low |
© 2017 by the author. Licensee MDPI, Basel, Switzerland. This article is an open access article distributed under the terms and conditions of the Creative Commons Attribution (CC BY) license ( http://creativecommons.org/licenses/by/4.0/).
Share and Cite
Samadi, S. The Social Costs of Electricity Generation—Categorising Different Types of Costs and Evaluating Their Respective Relevance. Energies 2017, 10, 356. https://doi.org/10.3390/en10030356
Samadi S. The Social Costs of Electricity Generation—Categorising Different Types of Costs and Evaluating Their Respective Relevance. Energies. 2017; 10(3):356. https://doi.org/10.3390/en10030356
Chicago/Turabian StyleSamadi, Sascha. 2017. "The Social Costs of Electricity Generation—Categorising Different Types of Costs and Evaluating Their Respective Relevance" Energies 10, no. 3: 356. https://doi.org/10.3390/en10030356
APA StyleSamadi, S. (2017). The Social Costs of Electricity Generation—Categorising Different Types of Costs and Evaluating Their Respective Relevance. Energies, 10(3), 356. https://doi.org/10.3390/en10030356