Article

Thermodynamic Performance Analysis of a Biogas-Fuelled Micro-Gas Turbine with a Bottoming Organic Rankine Cycle for Sewage Sludge and Food Waste Treatment Plants

School of Mechanical Engineering, Pusan National University, Busan 46241, Korea
*
Author to whom correspondence should be addressed.
Energies 2017, 10(3), 275; https://doi.org/10.3390/en10030275
Submission received: 9 January 2017 / Revised: 17 February 2017 / Accepted: 21 February 2017 / Published: 26 February 2017

Abstract

:
In the Republic of Korea, efficient biogas-fuelled power systems are needed to use the excess biogas that is currently burned due to a lack of suitable power technology. We examined the performance of a biogas-fuelled micro-gas turbine (MGT) system and a bottoming organic Rankine cycle (ORC). The MGT provides robust operation with low-grade biogas, and the exhaust can be used for heating the biodigester. Similarly, the bottoming ORC generates additional power output with the exhaust gas. We selected a 1000-kW MGT for four co-digestion plants with 28,000-m3 capacity. A 150-kW ORC system was selected for the MGT exhaust gas. We analysed the effects of the system size, methane concentration, and ORC operating conditions. Based on the system performance, we analysed the annual performance of the MGT with a combined heat and power (CHP) system, bottoming ORC, or both a bottoming ORC and CHP system. The annual net power outputs for each system were 7.4, 8.5, and 9.0 MWh per year, respectively.

1. Introduction

Ocean dumping of food waste, sewage sludge, and animal manure was banned in 2012–2013 as the 1996 protocol to the London Convention took effect. As an alternative to dumping garbage in the sea, the usage of both garbage incineration and recycling is increasing in the Republic of Korea [1]. The Korean government is paying particular attention to recycling because it produces profitable by-products. The main garbage recycling method is anaerobic digestion (AD) [2], where waste is introduced to a digestion chamber, and anaerobic bacteria start cracking down the organic waste matter after the oxygen is exhausted. The waste is reduced, and as a by-product biogas is produced. The Korean government built 92 biogas plants in 2015, and 21 more plants are planned [3]. A sales network is also being built, and there are plans to supply the biogas to the national natural gas pipeline network [4]. To achieve the required heating value, 2% of the biogas will be mixed with natural gas. Nationwide introduction will take time due to the large costs involved. Unfortunately, Korea lacks biogas-fuelled power technology, so much of the biogas is simply burned in incinerators [5].
Various systems have been discussed for use in a biogas-fuelled power systems, such as fuel cells, internal combustion engines, and micro-gas turbines (MGTs) [6]. Among these, fuel cells show unstable operating characteristics due to their high dependency on the partial pressure of the fuel flow [7]. Internal combustion engines show decreased thermal efficiency due to delayed combustion with a high CO2 concentration fuel [8]. MGTs show a small performance degradation, but it can be alleviated by decreasing the compressor surge margin [9]. MGTs are an ideal solution for current power generation needs because of their low emissions, high efficiency, small footprint, and low maintenance requirements [10]. The Capstone Turbine Corporation offers many clean and green MGTs that are scalable from 30 kW to 30 MW, which can operate using a variety of gaseous liquid fuels that include natural gas, associated gas, propane, flare gas, landfill gas, digester gas, aviation fuel, and kerosene [11].
There are many studies on MGTs and their use in combined heat and power (CHP) systems [12,13,14,15]. Huang et al. evaluated the performance of a molten carbonate fuel-cell/micro-gas turbine (MCFC/MGT) hybrid power system fuelled by both city gas and biogas [12]. Kang et al. analyzed the economic feasibility of small CHP and combined cycle (CC) systems using a 5-MW gas turbine fuelled with biogas [13]. Basrawi et al. investigated the optimal size of an MGT-absorption cooling system based on the scale of sewage treatment plants as a biogas source under various ambient temperature conditions [16].
The system performance can be improved by introducing an additional heat recovery system. The organic Rankine cycle (ORC) is one good candidate for this purpose due to its high performance, simple configuration, simple system control, adjustable system size, and robustness [17]. The ORC is just like an ordinary Rankine cycle, except that it employs organic compounds as its working fluid [18]. The normal boiling point of the organic compounds is less than that of water, so it can be used to harness energy from various low-temperature heat sources, such as solar irradiation, biomass combustion, geothermal reservoirs, and waste heat from various industrial processes or electric generation methods [19].
Various system configurations and working fluids have been widely studied for ICE applications [20]. R245fa has good thermo-physical characteristics as a working fluid when subjected to various ranges of heat source temperatures [21]. In addition, it has little effect on ozone depletion and low global warming potential, and it is non-toxic and non-flammable when used in an ORC system [22]. Data were obtained experimentally for the heat source of a pure refrigerant ORC [23]. The ORC system uses a commercial magnetically coupled scroll expander, plate-type heat exchangers, and a plunger-type feed pump for the working fluid [24].
Schuster et al. [25] proposed using an ORC system for a biogas plant, but they used a rough model of an ICE and the ORC. Lee et al. studied the design and partial load performance of a power generation system that combines an MGT and an ORC. The design performance was analyzed using several different organic fluids and compared with the performance of a steam-based cycle [26]. Ebrahimi et al. proposed an integrated energy-exergy optimization method for a novel micro-CCHP cycle based on an MGT-ORC and a steam ejector refrigerator [27]. Yagil et al. [28] analysed the exergy performance of an MGT-ORC system for a biogas plant.
This study analyses the performance of an MGT/ORC system for utilizing biogas from sewage sludge and food waste. The objective of this study is to clarify the relationship between the scale of a plant and the optimal size of the MGT and ORC. The performance of the MGT is determined based on a commercial Capstone C1000 unit, and a recuperator is considered to improve the system performance. An ORC system with a turbine is used for efficient recovery of the waste heat produced by the exhaust gas of the MGT. Cooling water from the condenser outlet is considered as a heat source for the digesters. The proposed systems are modeled based on the mass and energy balances.

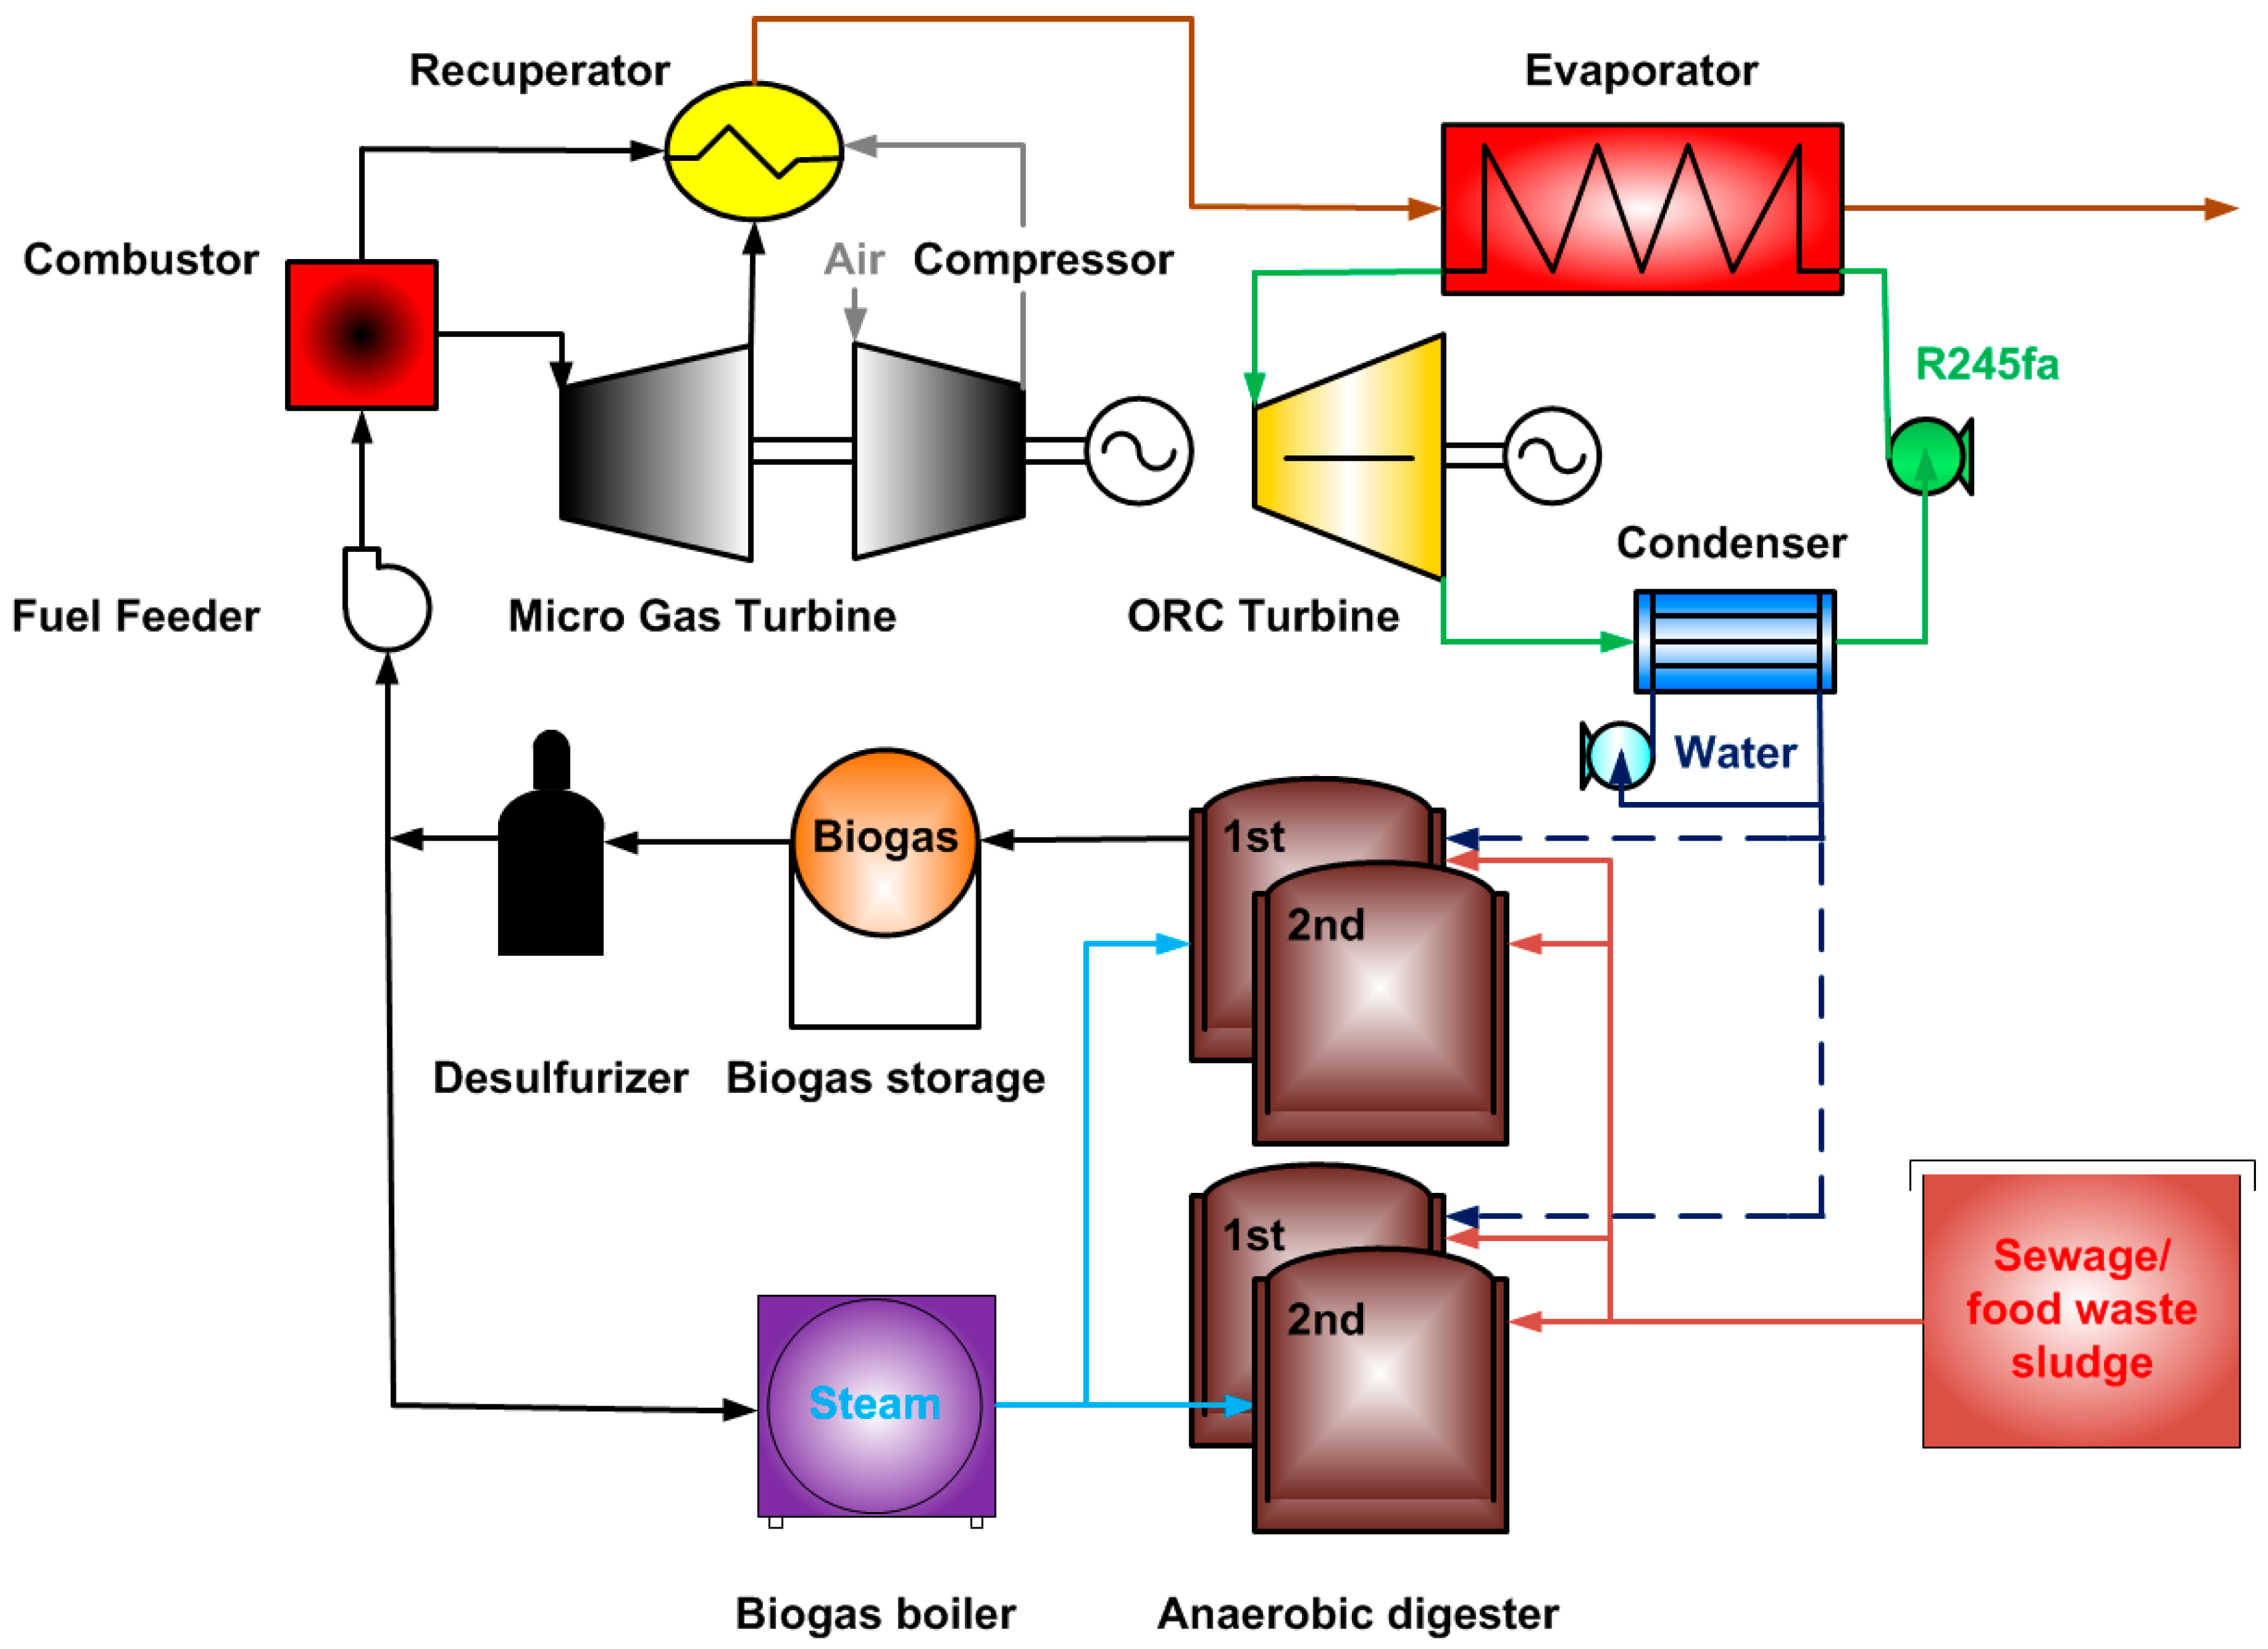
2. System Description

Figure 1 shows a schematic of the system. The Brayton cycle is the topping cycle, and the Rankine cycle is the bottoming cycle. In the case of the Brayton cycle, ambient air enters the air compressor, which raises the pressure and temperature. The air is heated up in the recuperator using exhaust gases from the gas turbine and mixed with compressed fuel in the combustor. The combustor limits the maximum temperature of the product gases, which occurs at the turbine inlet temperature. Next, the hot gases expand in the gas turbine, which is coupled to a generator, and then they enter the low-temperature heat recovery system. A single shaft mechanically connects the compressor and the turbine to the electric generator.
The ORC system is composed of a pump, evaporator, turbine, condenser, and cooling water pump. After the working fluid leaves the pump, it enters the evaporator and absorbs heat from the heat source. The source fluid enters the evaporator and leaves after heating the working fluid. The high-pressure working fluid vapor drives the turbine to generate the expansion work while relieving the pressure with declining temperature. Low-pressure vapor is extracted from the turbine and flows to the condenser, which reduces its temperature using cooling water and produces heating water for the anaerobic digesters. The anaerobic digester temperature must be kept within a proper range to produce biogas. The working fluid is R245fa.

3. System Modelling

The Brayton cycle is designed to maintain a temperature of 950 °C and a pressure ratio of 4.5 at the gas turbine. The organic Rankine cycle is designed to have a constant specific evaporator pressure with an exhaust gas temperature of 280 °C from the MGT.

3.1. Brayton Cycle

3.1.1. Combustor

The combustor is fed with air from the compressor-recuperator and fuel from the fuel feeder. The fuel is completely consumed, and a pressure drop of 2% occurs. The mass flow rate of the fuel entering the combustor is calculated as follows:
m f = Q c L H V CH 4 ,
where Qc is the heat energy supplied to the combustor, and LHVCH4 is the low heating value of the methane. The recuperator output temperature toward the combustor is calculated by:
T r , a , o = ( T r , g , i T r , a , i ) · η r + T r , a , i ,
where Tr,g,i is the temperature of the exhaust gas entering the recuperator, Tr,a,i is the temperature of compressed air entering the recuperator, and ηr is the temperature effectiveness of the recuperator.

3.1.2. Fuel Feeder and Air Compressor

The output temperature of the fuel feeder is calculated as follows [29]:
T f , o = T f , i · ( 1 + ( P f , o P f , i ) ( R f M W f · C p , f ) 1 η f ) ,
where Tf,i and Tf,o are the fuel temperatures entering and leaving the fuel feeder, Pf,i and Pf,o are the fuel pressures before and after the fuel feeder process, Rf is the gas constant of the fuel, MWf is the molecular weight of the fuel, Cp,f is its specific heat at constant pressure, and ηf is the fuel feeder’s isentropic efficiency.
The power consumption by the fuel feeder is calculated by:
W f = m f · C P , f · ( T f , o T f , i ) ,
where mf is the mass of fuel entering the fuel feeder. The air compressor output temperature and work are calculated similarly to those of the fuel feeder.

3.1.3. Micro Gas Turbine (MGT)

The MGT output temperature is calculated as follows [29]:
T g , o = T g , i · ( 1 η g + η g ( P g , i P g , o ) ( R g M W g · C p , g ) ) ,
where Tg,i and Tg,o are the temperature of the combustion gas entering and leaving the MGT, Pg,i and Pg,o are the combustion gas temperatures before and after the MGT process, Rg is the gas constant of the combustion gas, MWg is its molecular weight, Cp,g is its specific heat at constant pressure, and ηg is the gas turbine’s isentropic efficiency.
The power output generated by the MGT is calculated by:
W g = m g · C P , g · ( T g , o T g , i ) ,
where mg is the mass of the combustion gas entering the MGT.

3.1.4. Power and Electrical Efficiency

Considering miscellaneous losses such as mechanical loss and generator loss, the power of the MGT is calculated as follows:
W m g t = ( W g W c ) · η l ,
where ηl is the efficiency of the mechanical parts and generator of the MGT, and W c is the power consumption by the cooling water pump. The electric efficiency is the ratio of useful energy produced by the MGT system to the amount of energy supplied to it.
η m g t = w m g t Q C ,

3.2. Organic Rankine Cycle

3.2.1. Evaporator and Condenser

The amount of waste heat in the exhaust gas is calculated as follows:
Q w = m s · C p , w · ( T w , i T w , i ) ,
where Tw,i and Tw,o are the temperature of the exhaust gas entering and leaving the evaporator, ms is the mass of the heat source entering the evaporator, and Cp,s is the specific heat source at constant pressure. For a specified mass flow rate of exhaust gas fluid mw, the energy balances at the evaporator and condenser can be used to determine the mass flow rate mr of the R245fa fluid in the ORC system and the rate mc of the cooling water:
m r = m s · C s ( T s , i T s , o ) h e , o h e , i ,
m c = m r · ( h e , o h e , i ) h c , o h c , i ,
where Ts,i and Ts,o are the temperature of the heat source entering and leaving the evaporator, he,i and he,o are the enthalpy of the exhaust gas entering and leaving the evaporator, and hc,i and hc,o are the enthalpy of R245fa fluid entering and leaving the condenser.

3.2.2. Pump and Cooling Water Pump

The work done by the pump is calculated as follows:
W p = V p · ( P p , o P p , i ) · m r ,
where Pp,i and Pp,o are the pressure of R245fa fluid entering and leaving the pump, and VP is the volume of R245 fluid entering the pump. The power consumption by the cooling pump is calculated as follows:
W c = V c · ( P c , o P c , i ) · m c ,
where Pc,i and Pc,o are the pressure of cooling water entering and leaving the cooling water pump, and Vc is the volume of R245fa entering the cooling water pump.

3.2.3. Turbine

The work generated by the turbine is calculated as follows:
W t = V t · ( P t , o P t , i ) · m r ,
where Pt,i and Pt,o are the pressures of R245 fluid entering and leaving the turbine, and Vt is the volume of R245 entering the turbine.

3.2.4. Power, Thermal and Electrical Efficiencies

Considering miscellaneous losses such as mechanical loss and generator loss, the power of the MGT is calculated as follows:
W o r c = W t · η l ,
where ηl is the efficiency of the mechanical parts and generator of the MGT. The thermal efficiency is the ratio of useful energy produced by the ORC system to the amount of energy supplied to it:
η o r c = W 0 r c Q w ,
The electrical efficiency is the ratio of useful energy produced by the MGT system to the amount of energy supplied to the total system (MGT + ORC).
η t o l = W m g t + W o r c Q c ,

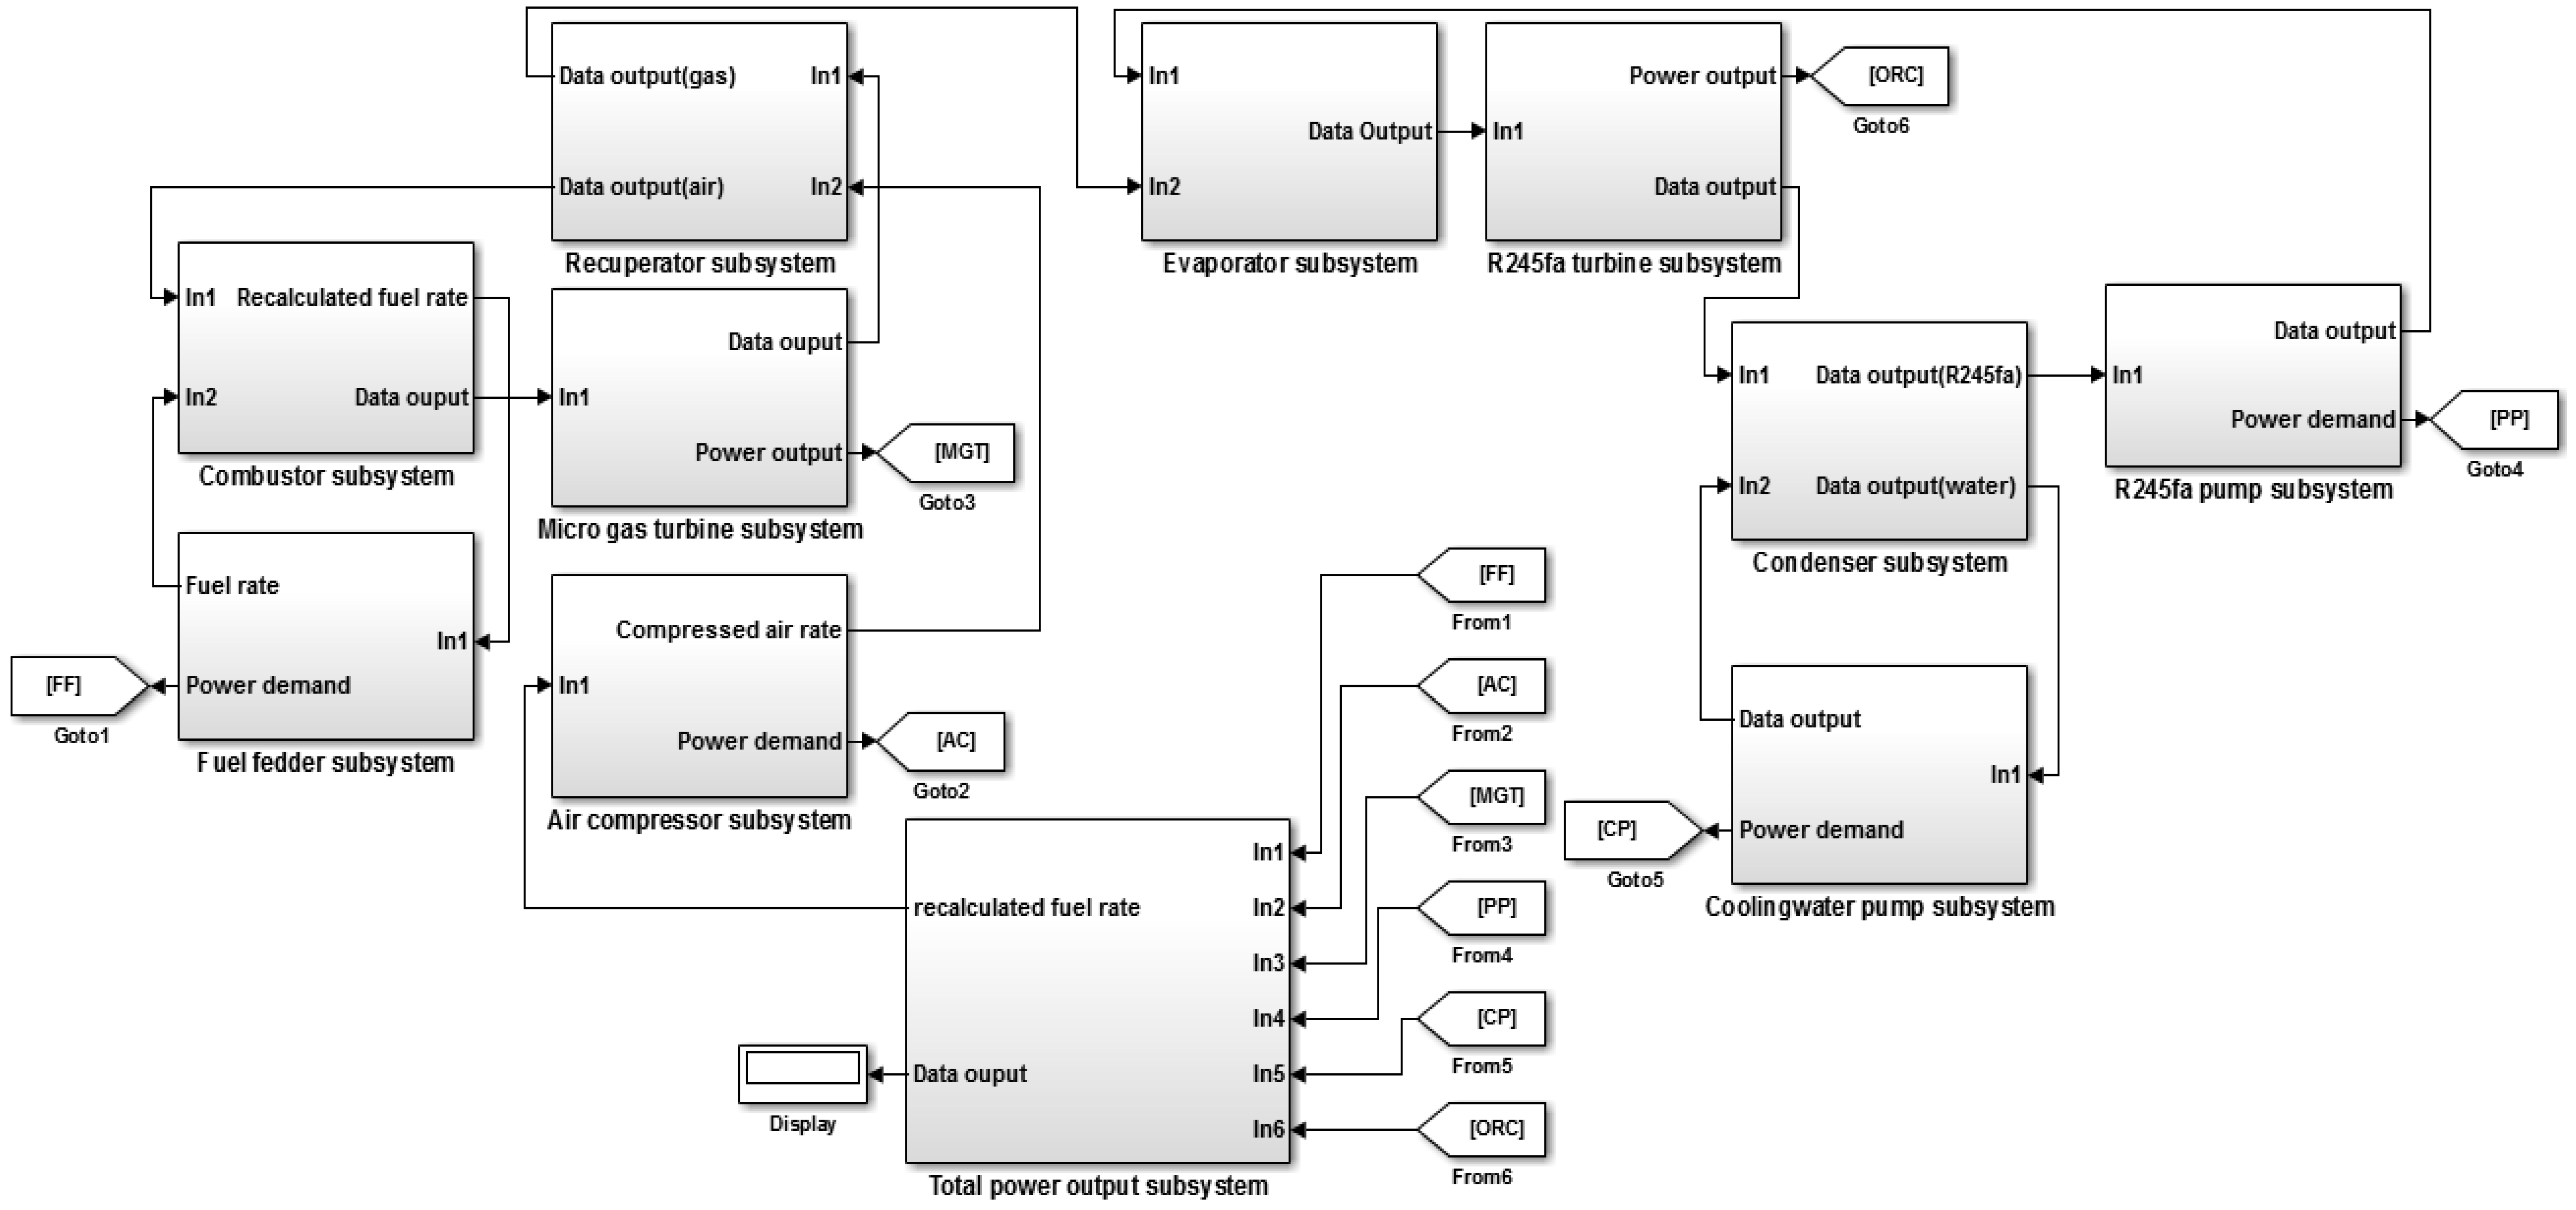
3.3. Solution Methodology

Figure 2 shows the Matlab/Simulink blocks used for performance analysis of the system. The outputs of the block for the MGT provide the mass flow rate and the outlet temperature. The obtained work inputs required by the MGT are used as inputs for the ORC system. The thermophysical properties were calculated using REFPROP 9.1.
Several assumptions and hypotheses were made:
(1)
The systems are in steady state and heat losses are ignored.
(2)
The isentropic efficiencies of the MGT and ORC turbines are assumed to be 85% and 80%. High values are selected to analyze the potential of the system.
(3)
The mass flow rate and heat in the exhaust gas are expressed as those of air to represent different compositions of the exhaust gas. The ORC cooling water is assumed to be pure water for simplicity of the system modelling.
(4)
The components of the biogas are simply assumed to be CH4 and CO2.

4. Results and Discussion

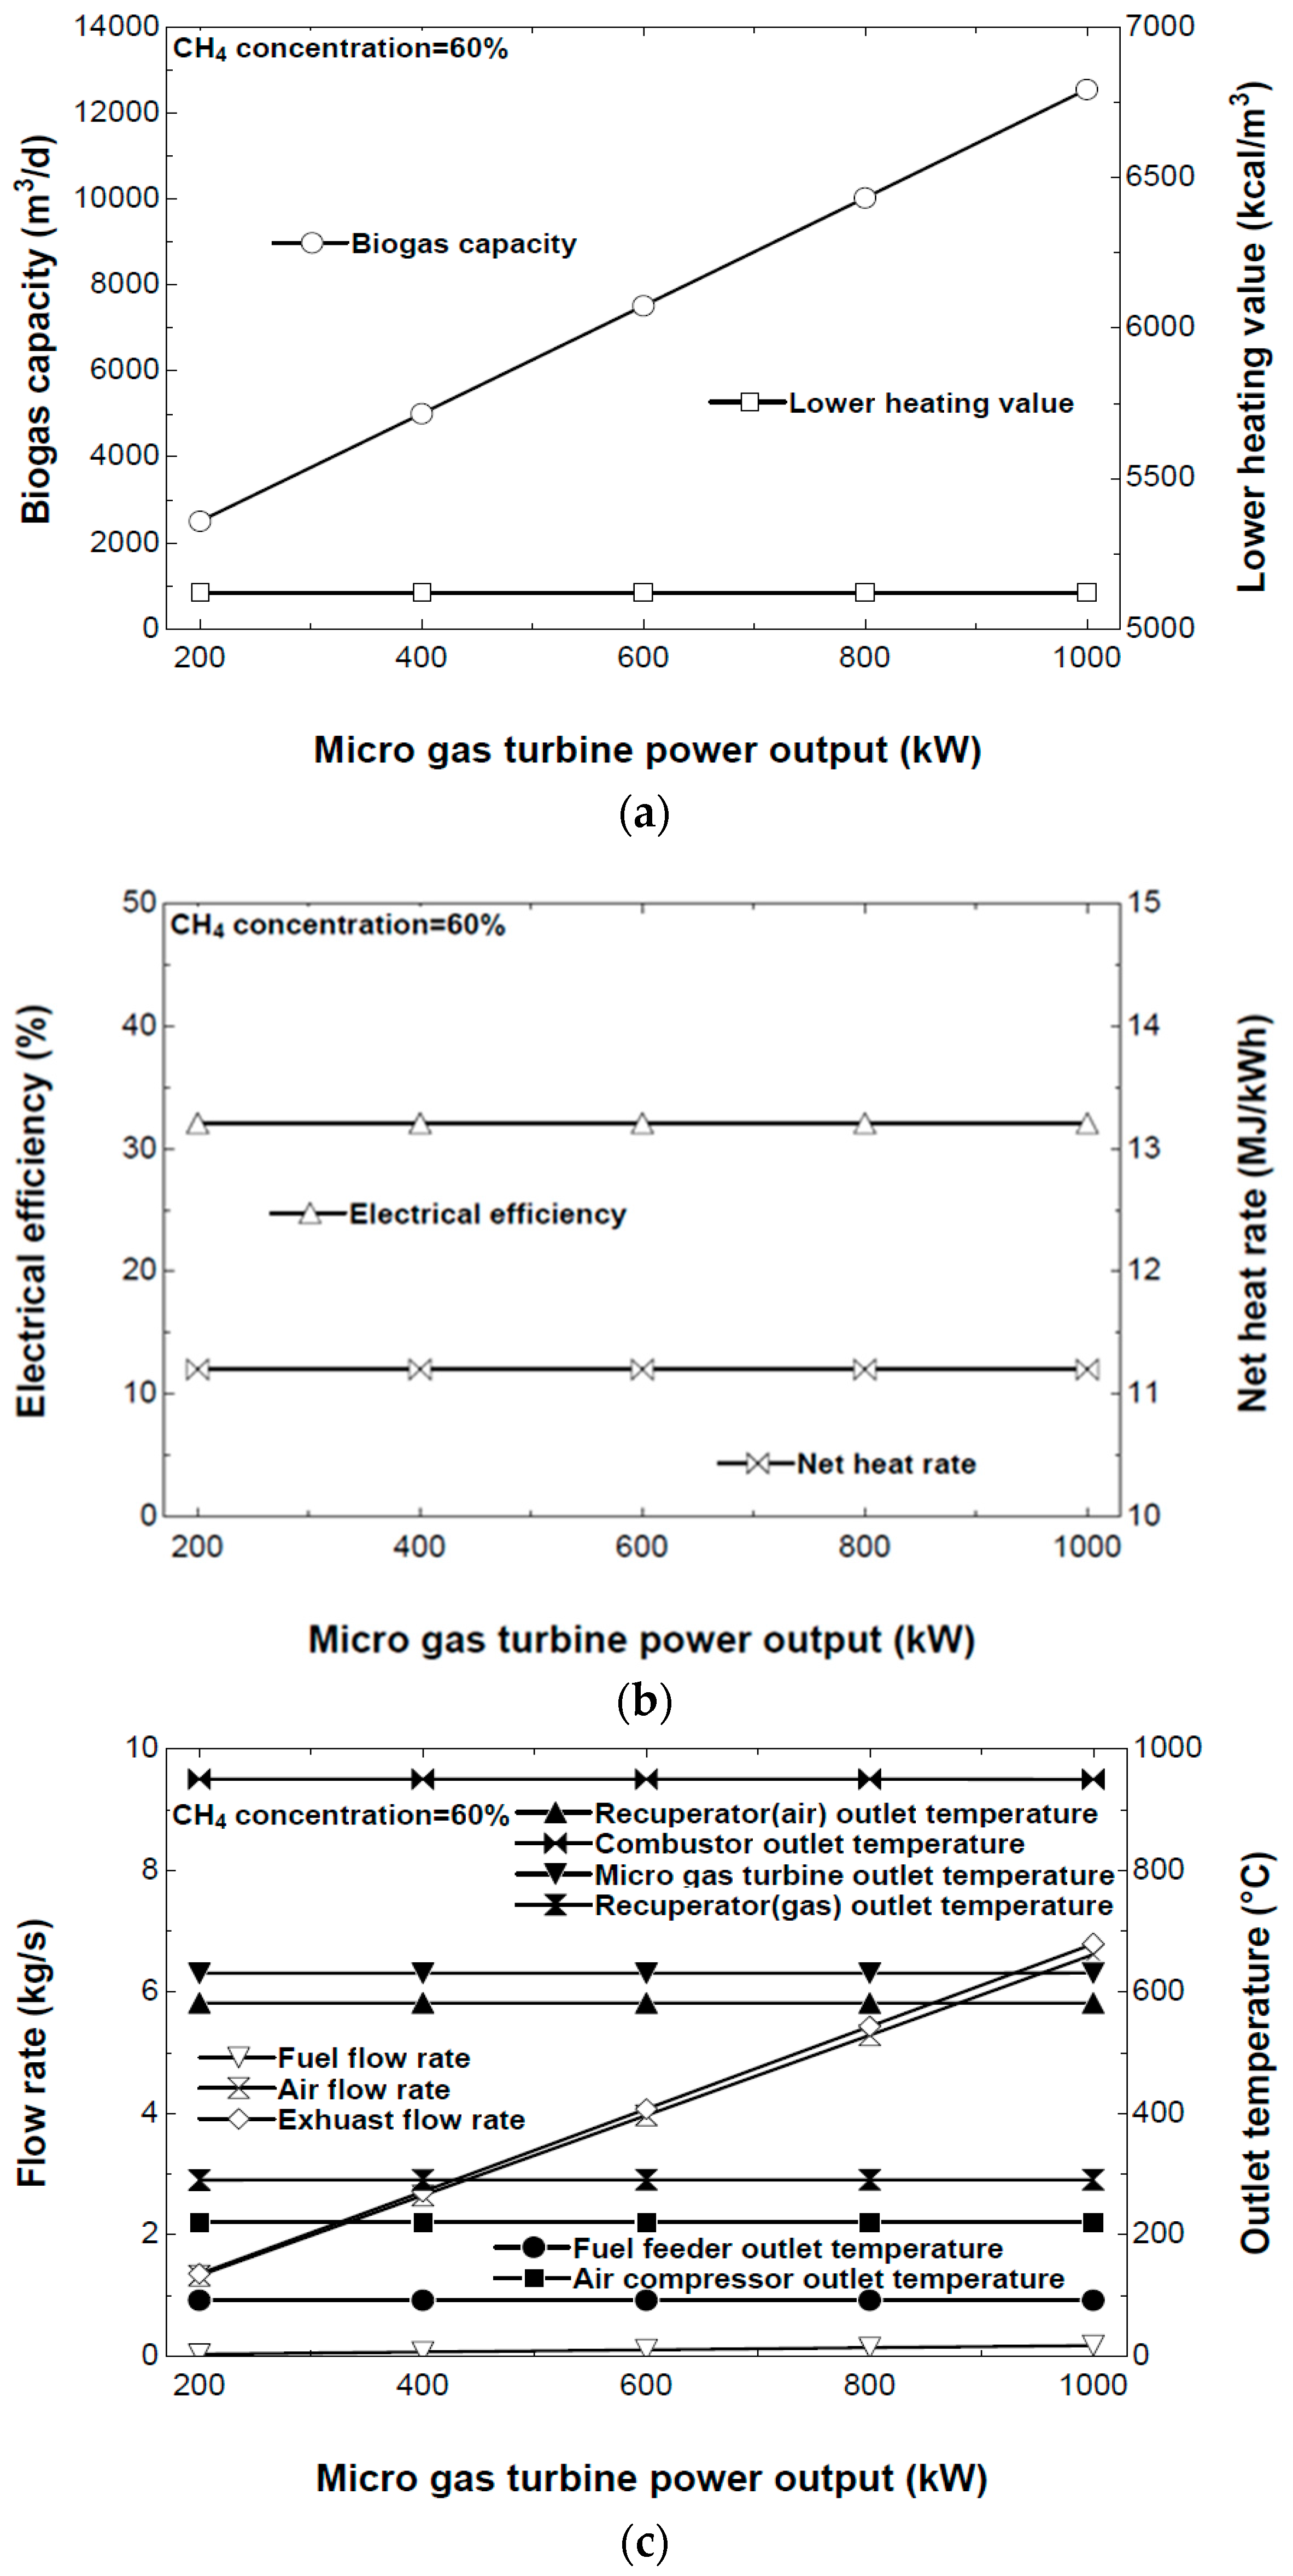
4.1. Micro Gas Turbine (MGT)

Capstone micro turbines (Table 1) can cleanly and effectively run on methane gas obtained from sewage sludge and food waste treatment plants using an anaerobic digester. Rather than simply venting or flaring the methane gas, Capstone micro turbines can convert the free fuel to clean and reliable electricity for use on site [11]. Our system has stable operating conditions for MGT due to the gas bag. In the AD, the waste moves constantly, so the raw gas flow is also unsteady. However, the produced gas is first stored in the gas bag and then supplied to the power system. The gas bag holds 1–3 days’ worth of gas, which is enough to suppress the temporal fluctuations caused by the AD. The heat losses from the MGT are included in the calculation of the MGT thermal efficiency. The heat losses from the ORC are relatively small due to the low operating temperature.
Figure 3 shows the effects of the MGT power output for sewage sludge and food waste treatment plants. Table 2 shows the parameters used in the calculations. The CH4 and CO2 concentrations were set to 60% and 40%, respectively, and other substances were not considered because they have no heating value. Depending on the degree of airtightness of the system, the nitrogen level can be 2%–5%. All other substances are present at less than 1%, but the heating value depends on only the methane concentration.
As shown in Figure 3a, the biogas capacity increased in a straight line. These results came from the difference in the moles of methane entering and leaving the combustor. Figure 3b shows that the electric efficiencies of the MGTs are all the same when there is an increase in the MGT power output. Also, the net heat rates of the MGTs are all the same. Figure 3c shows the calculations of the mass flow rate of the fuel and the corresponding air. The rates increased considerably as the MGT power output increased. This occurs because a higher MGT power output requires higher rates. All of the outlet temperatures are constant within the MGT power output range of 200–1000 kW.

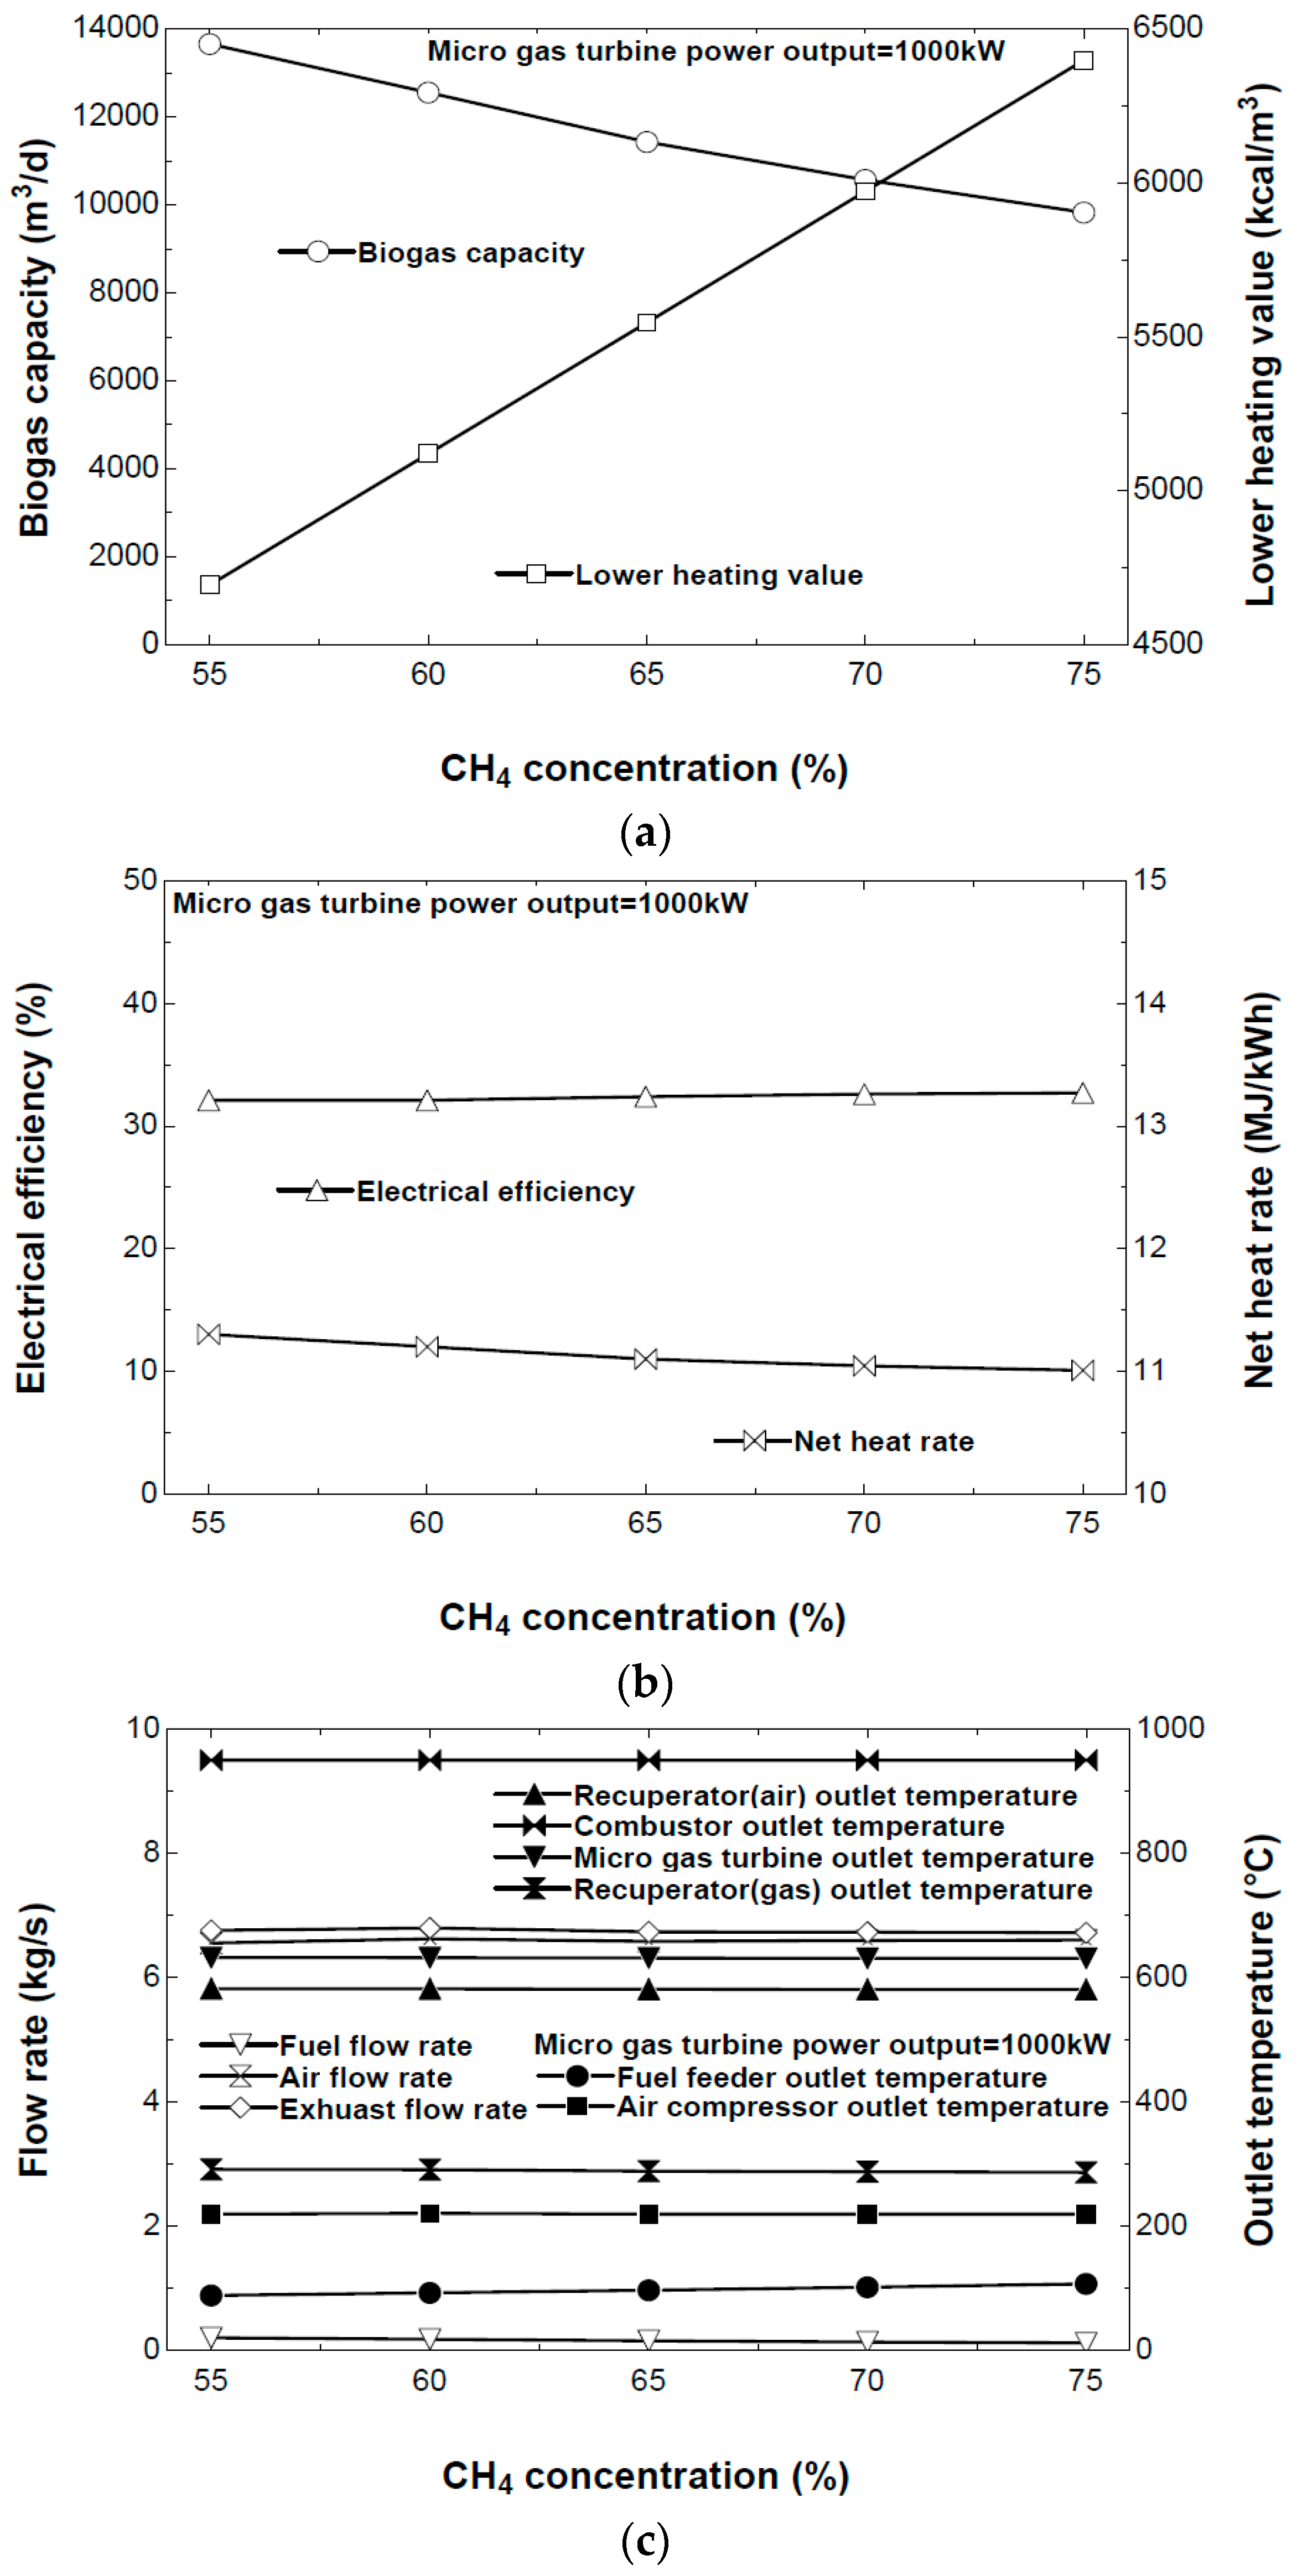
4.2. Effect of Methane Concentration on MGT Operation

An actual sewage sludge and food waste treatment plant was used as a model plant, as shown in Table 3.
The analysis period is January 2014 to December 2014. The plant produces a monthly average of 473,364 m3 of biogas from a population of 1,094,000 [30]. The 1000-kW MGT allows the plant’s four anaerobic digesters to use the recovered biogas to produce electricity and help power its onsite electrical grid.
As shown in Table 4, the CH4 concentration of the product biogas changes between 55% and 75%. As mentioned, the concentration of hydrocarbon contents directly affects the heating value of the product gas, as shown in Figure 4a. The rest of the biogas was assumed to be CO2.
To look at the effect of the CH4 concentration on the MGT operation, we simulated the MGT performance and operating conditions at different concentrations, and the results are shown in Figure 4. Figure 4b shows that the electric efficiencies of the MGTs increased by 1% when the CH4 concentration increased in the MGT, but the net heat rates of the MGTs also decreased by 3% because the CH4 concentration increases with the decreasing fuel flow rate, which leads to a drop in the CO2 concentration. Figure 4c shows the calculations of the mass flow rate of the fuel and corresponding air. The rates are similar because of the 1000-kW MGT power output. All of the outlet temperatures are constant because the parameters are the same for CH4 concentrations in the range of 55%–75%.

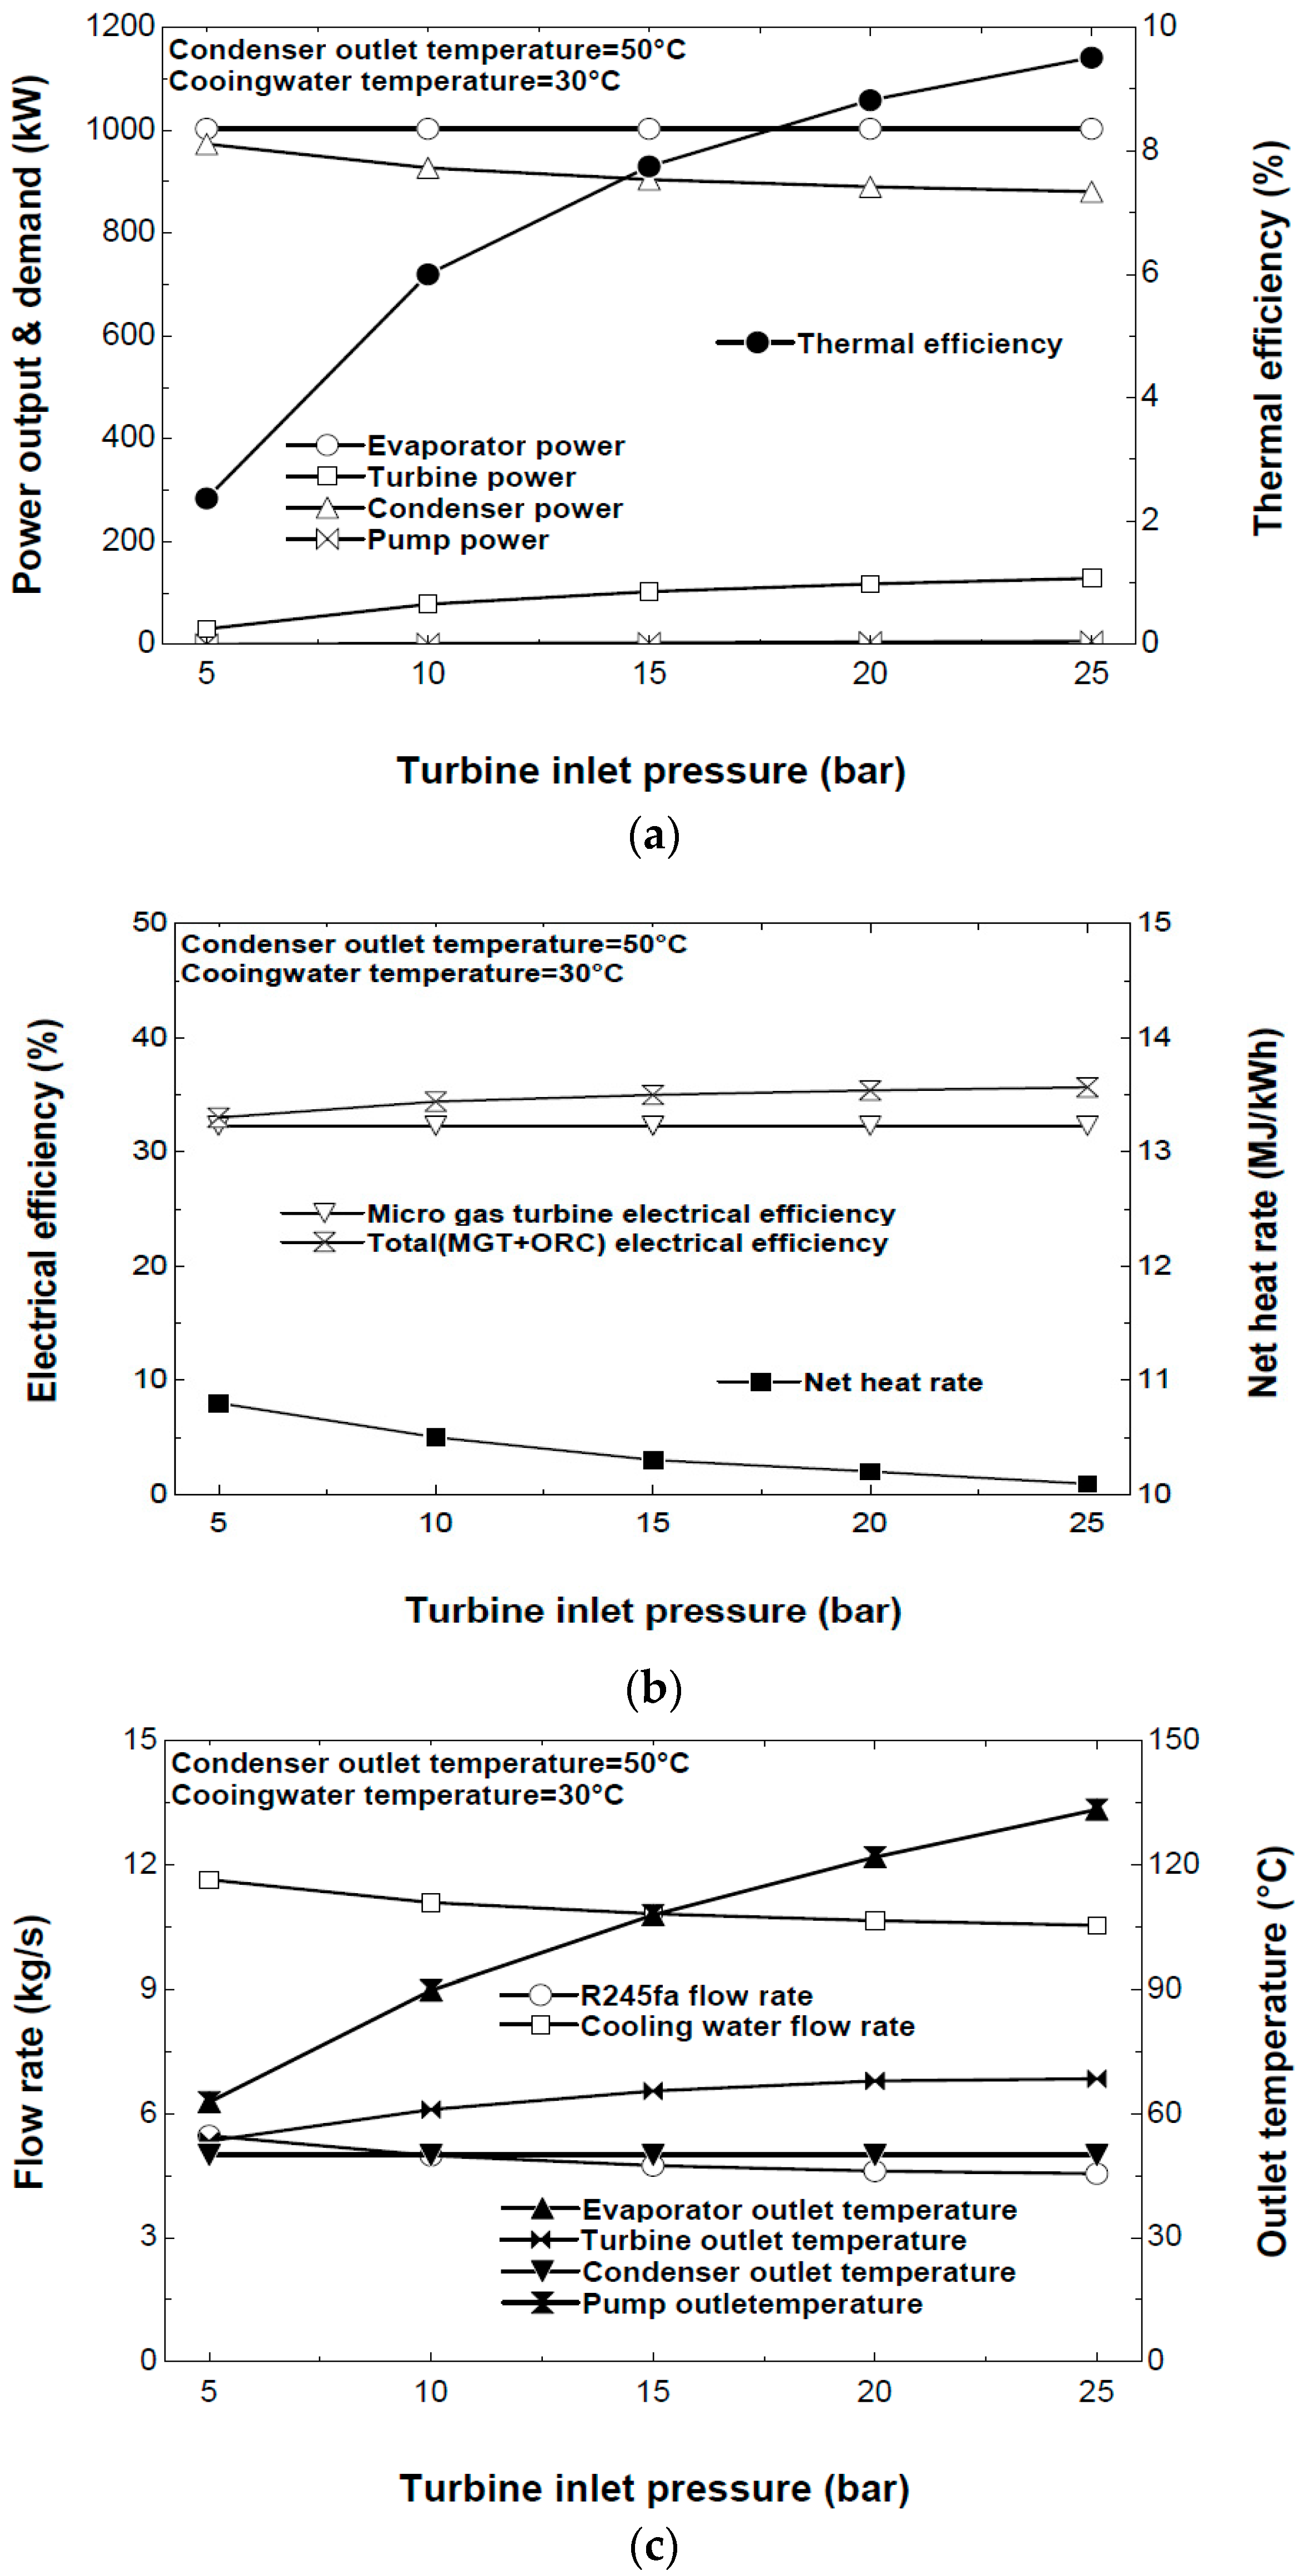
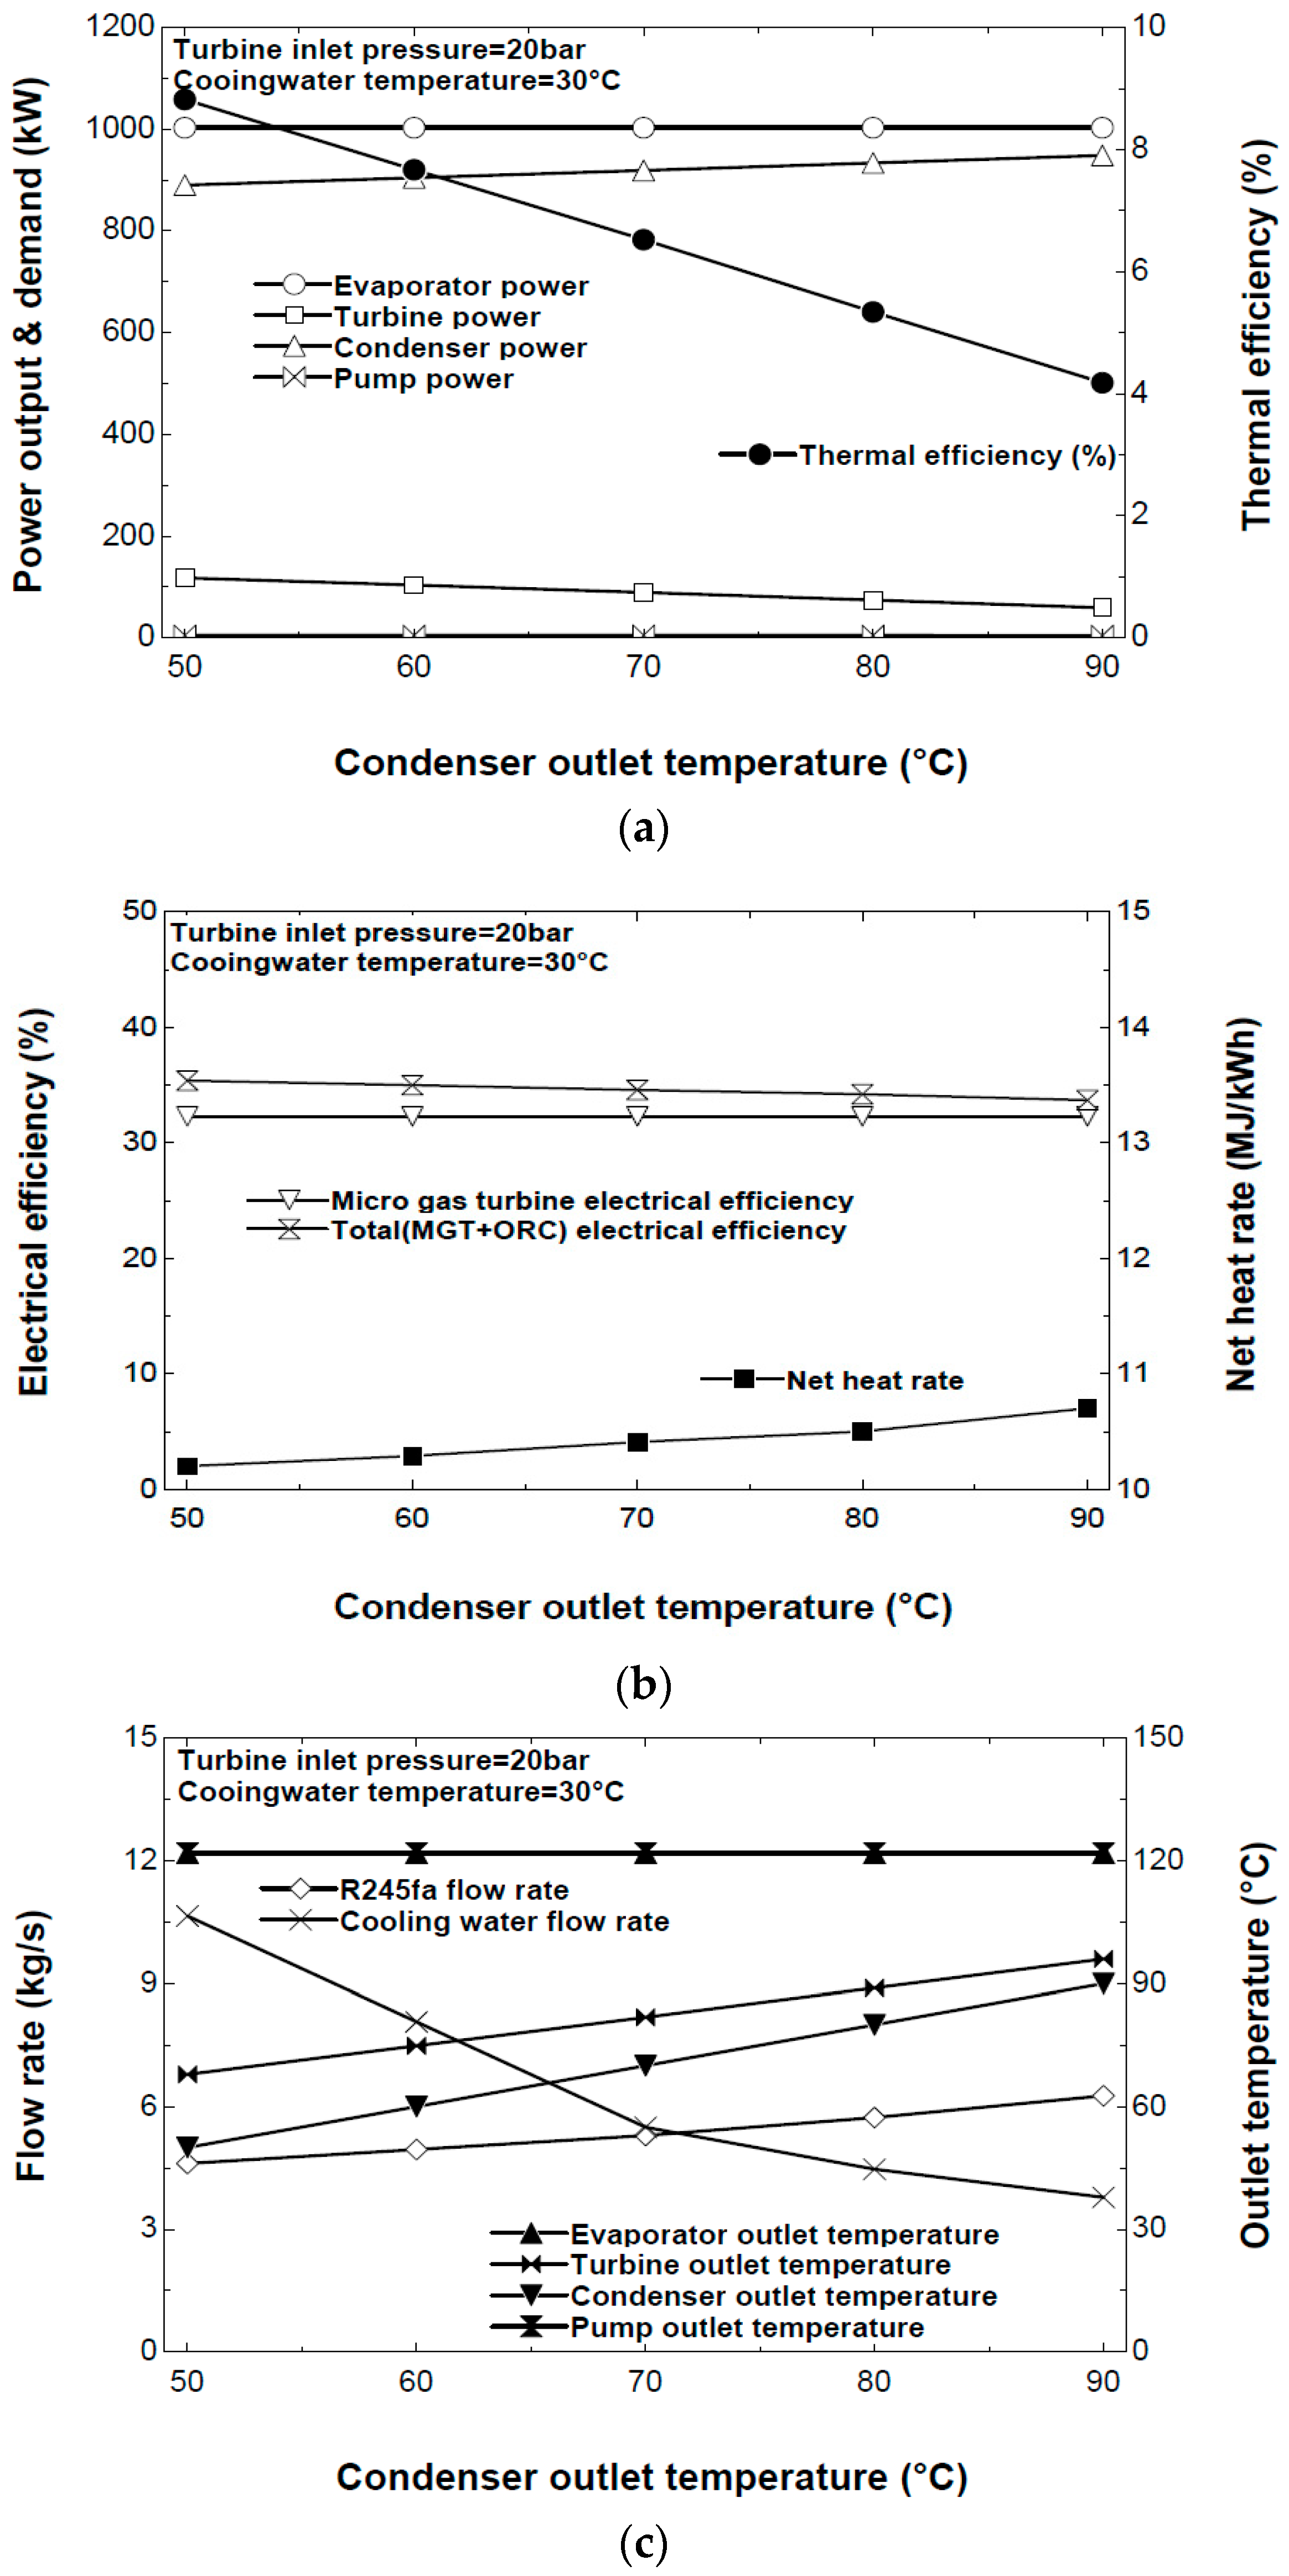
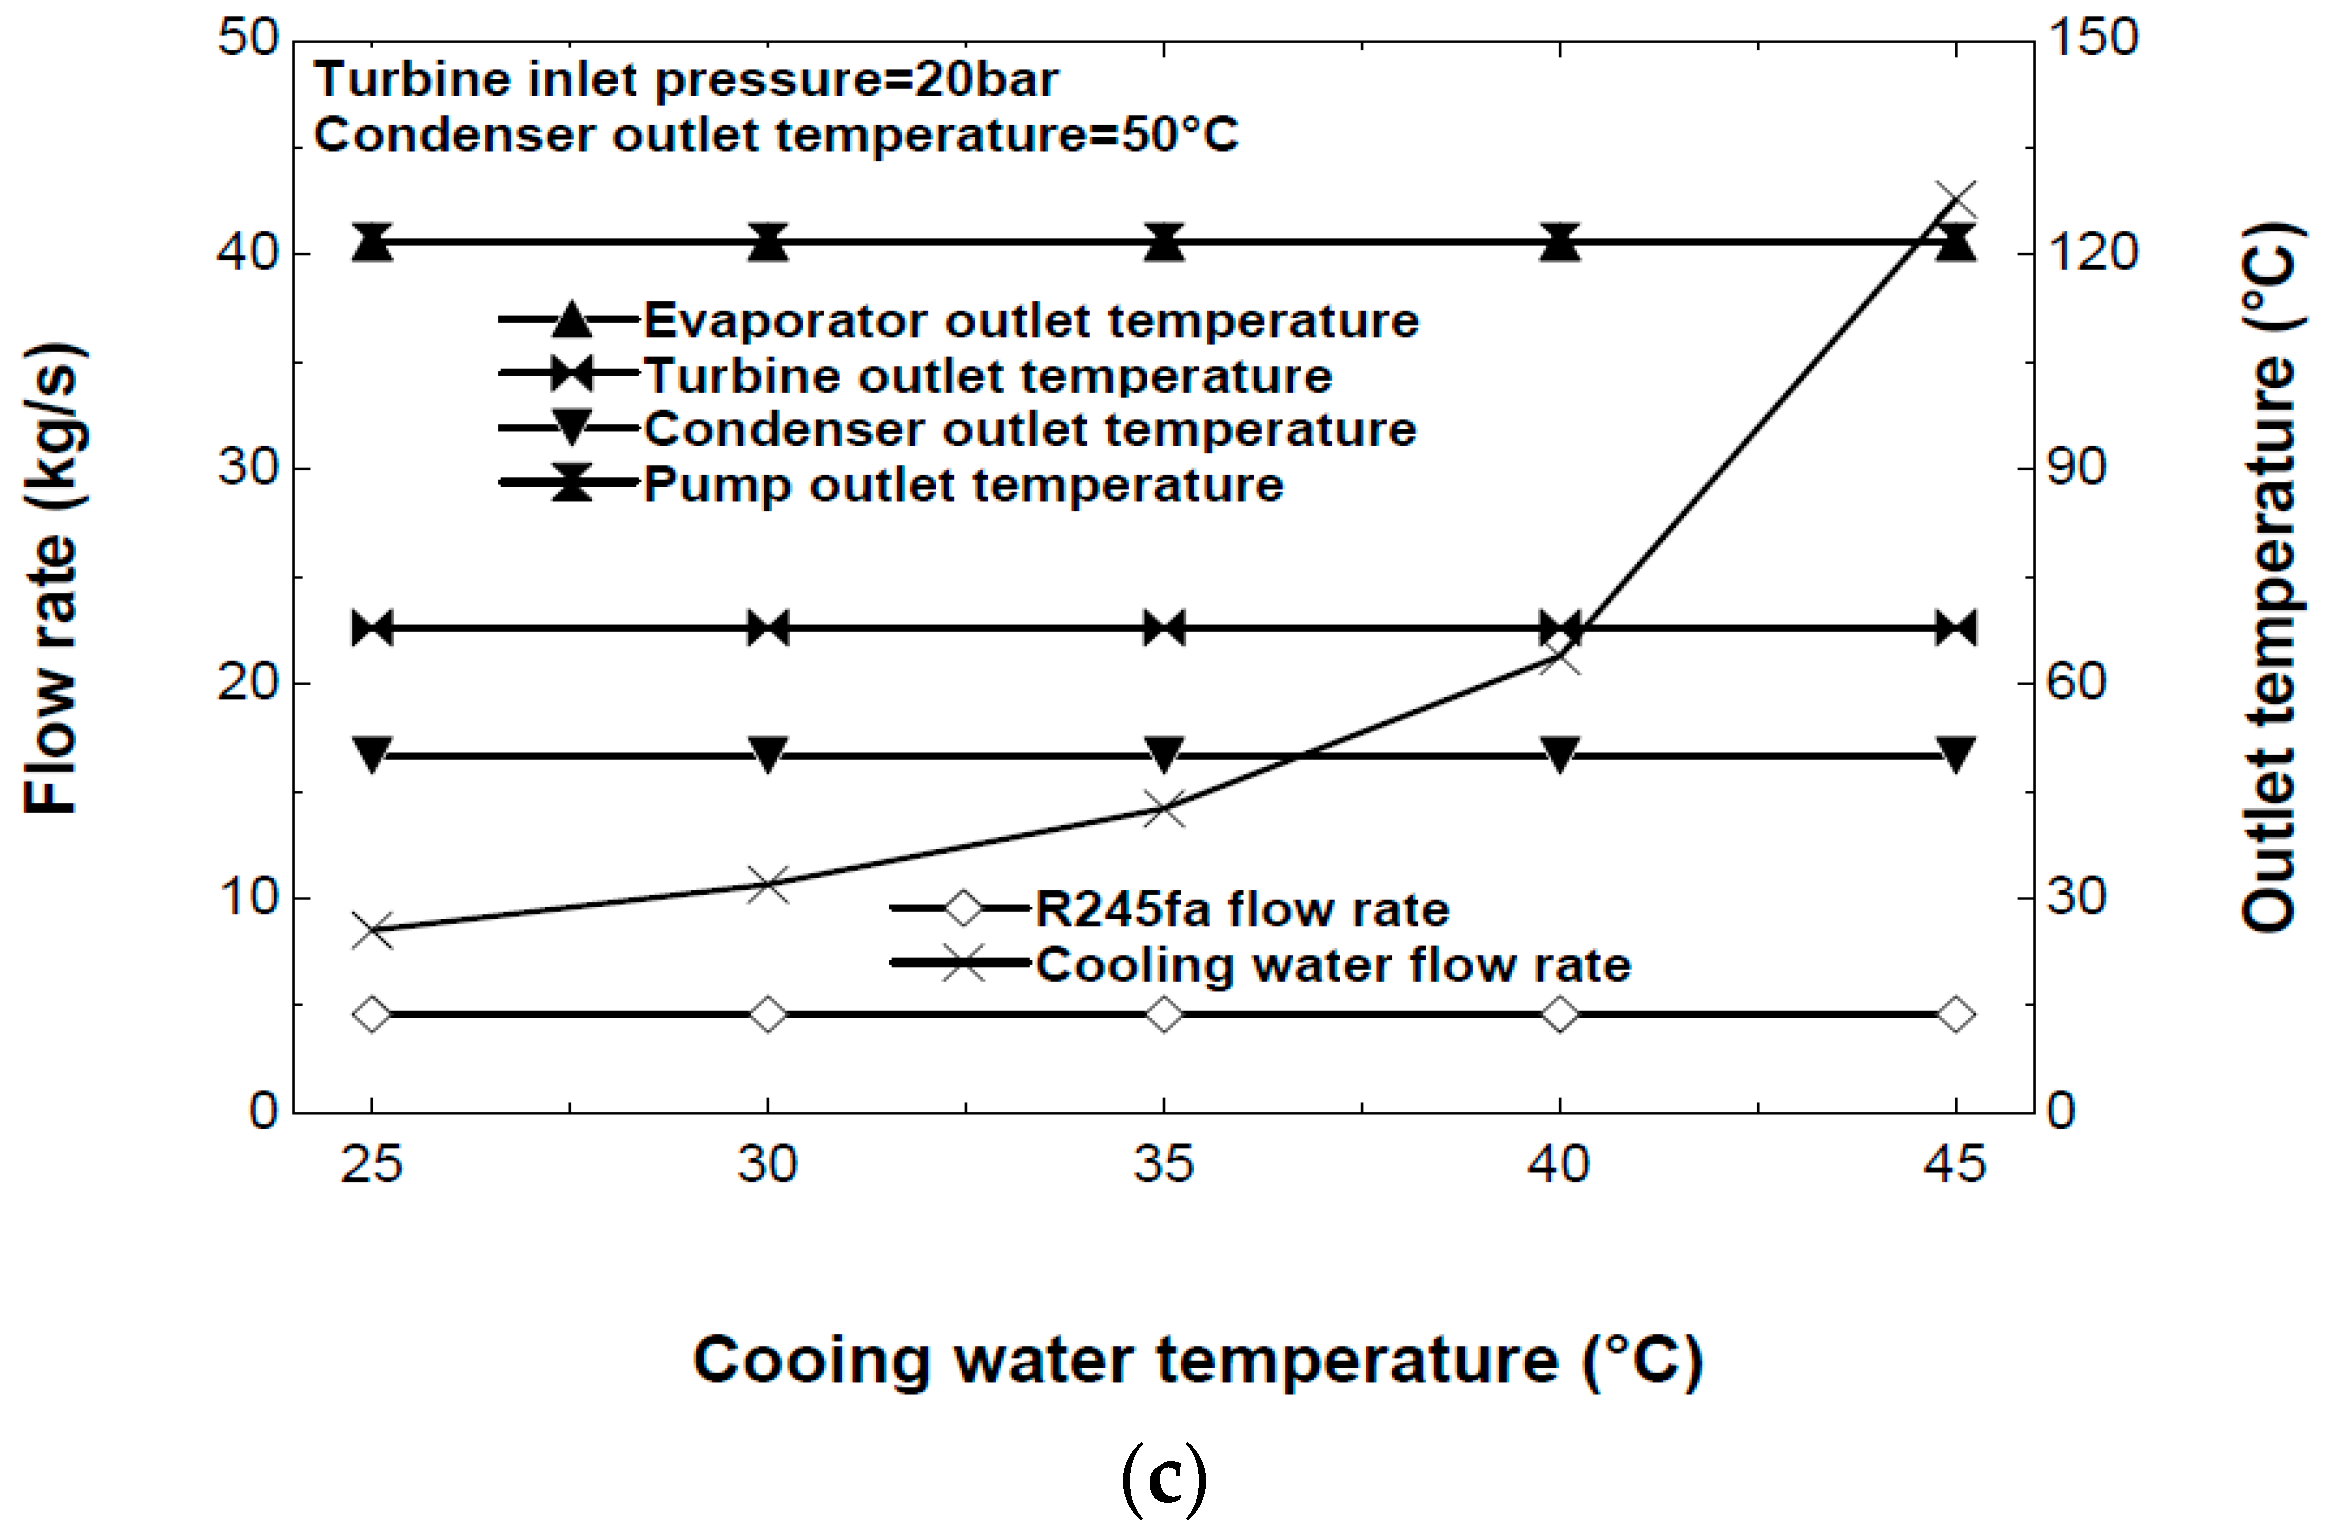
4.3. Organic Rankine Cycle (ORC)
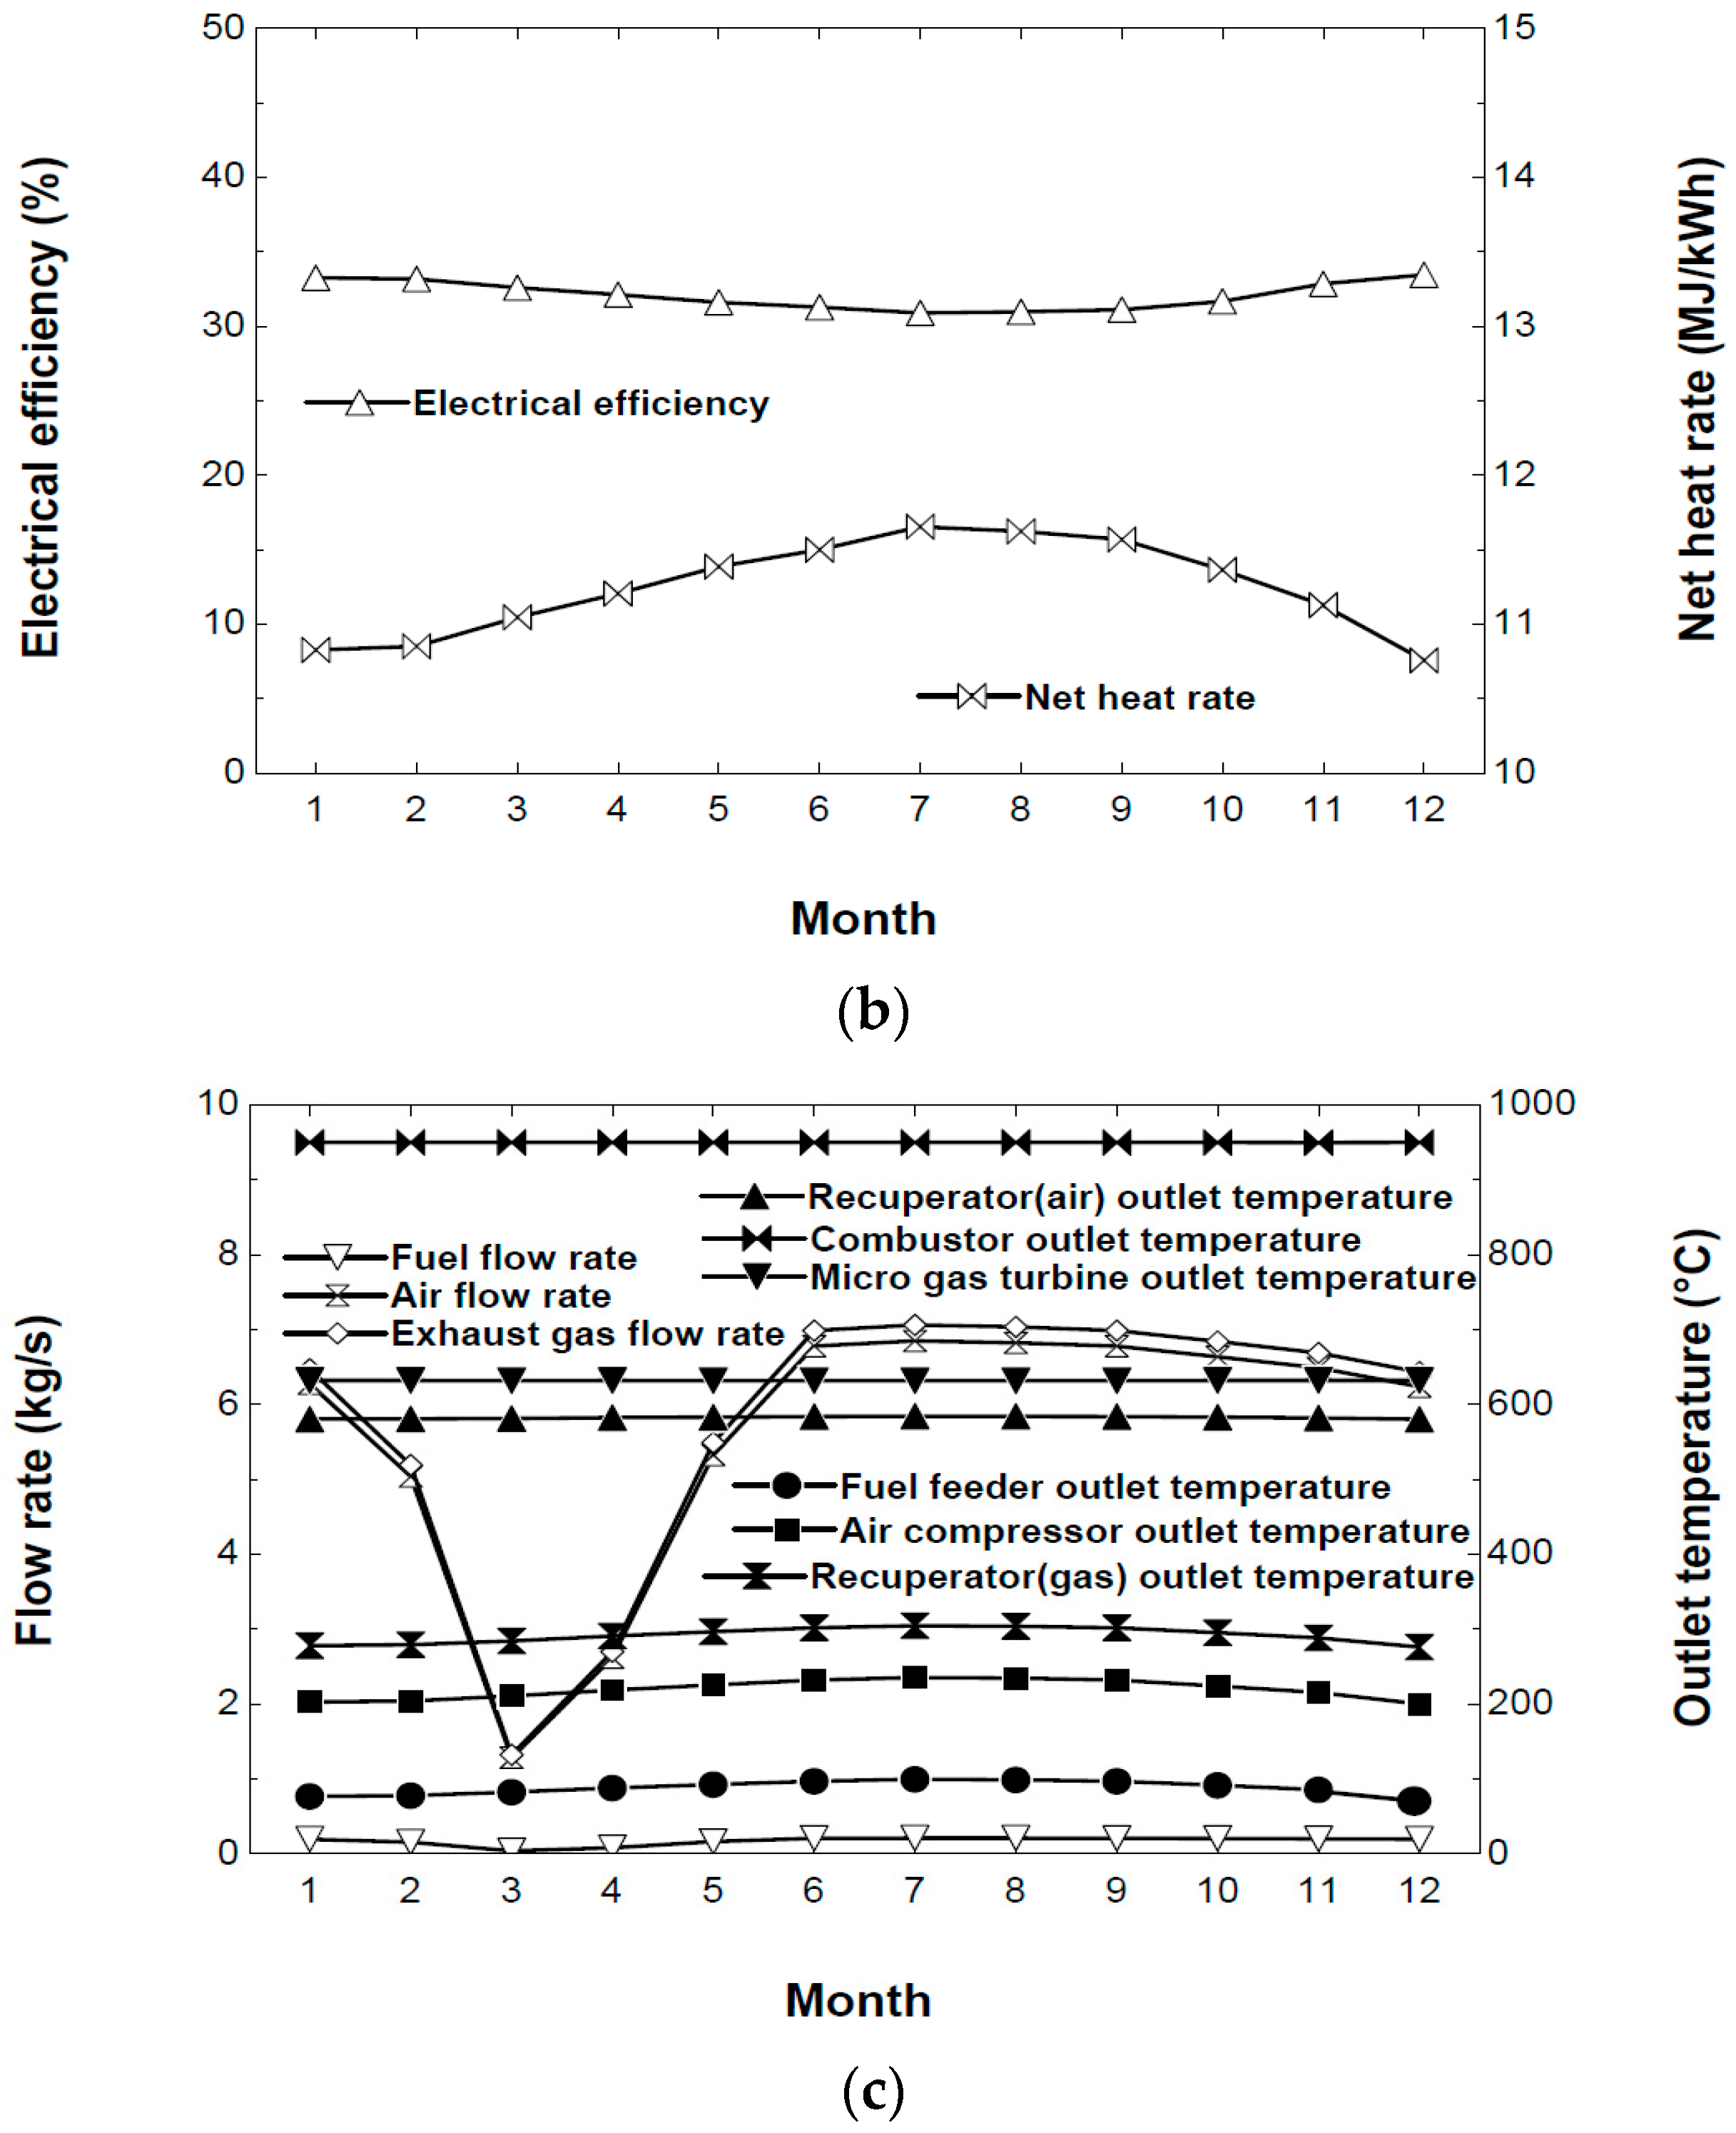
This study considers the 200-kW ORC system presented in Table 5, which consists of heat exchangers for the evaporator and the condenser, a pump to feed R245fa to the evaporator, and a turbine generator [31]. The parameters shown in Table 6 were used for further analysis.
Figure 5 shows the effects of the turbine inlet pressure for the ORC. When we use the ORC for further heating, the biodigester is heated by the cooling water from the ORC system. The biodigester is operated at 36.5 °C to maintain a mesophilic temperature that is optimal for active bacteria [32]. To achieve this, the cooling water temperature is increased to 50 °C. The pressure regulation makes the evaporation temperature fixed for the R245fa. As shown in Figure 5a, the power output of the turbine increased a little, and the power demand of the condenser decreased slightly with increasing turbine inlet pressure. This occurs because of the difference in enthalpy of the R245fa entering and leaving the turbine. The thermal efficiency is directly affected by the power output of the turbine.
Figure 5b shows that the electric efficiency of the MGT/ORC increased a little when the turbine inlet pressure of the ORC increased. In contrast, the net heat rate decreased slightly. Figure 5c shows that the R245fa flow rate and cooling water decreased slightly as the turbine inlet pressure increased. This occurred because the higher turbine inlet pressure leads to more specific net work done and more specific evaporator heat input. Most of the outlet temperatures except at the condenser increased within the turbine inlet pressure range of 5–25 bar.
Figure 6 shows the effects of the condenser outlet pressure for the ORC. In this case, the turbine inlet pressure and cooling water temperature are 20 bar and 30 °C, respectively. The temperature regulation results in fixed condensation pressure for the R245fa. As shown in Figure 6a, the power output of the turbine decreased a little, but the power demand of condenser increased slightly with increasing condenser outlet temperature. This occurs because of the difference in enthalpy of the R245fa entering and leaving the condenser. The thermal efficiency is directly affected by the power demand of the condenser.
Figure 6b shows that the electric efficiency decreased a little when the condenser outlet temperature of the ORC increased, but the net heat rate increased slightly. Figure 6c shows that the R245fa flow rate increased slightly, but the cooling water flow rate decreased considerably as the condenser outlet temperature increases. The higher condenser outlet temperature decreases the specific net work done but increases the specific condenser heat input. The turbine outlet temperature increased within the condenser outlet temperature range of 50–90 °C.
The temperatures of sewage sludge and food waste in different seasons are presented in Table 7. The temperature of cooling water entering the condenser is determined by the temperature of the waste [32]. Figure 7 shows the effects of the cooling water temperature for the ORC. In this case, the turbine inlet pressure and condenser outlet temperature are 20 bar and 50 °C, respectively. Only the cooling water flow rate increased significantly as the cooling water temperature increased. The higher cooling water temperature leads to a higher flow rate for the same condenser heat input. The rest of the cooling water temperatures are constant.
Table 8 summarizes the thermodynamic simulation results. The system electrical efficiency ranges between 33.0% and 35.6%, which means that the optimal ORC system provides a 2.6% efficiency improvement for the parent MGT system.

4.4. Case Study

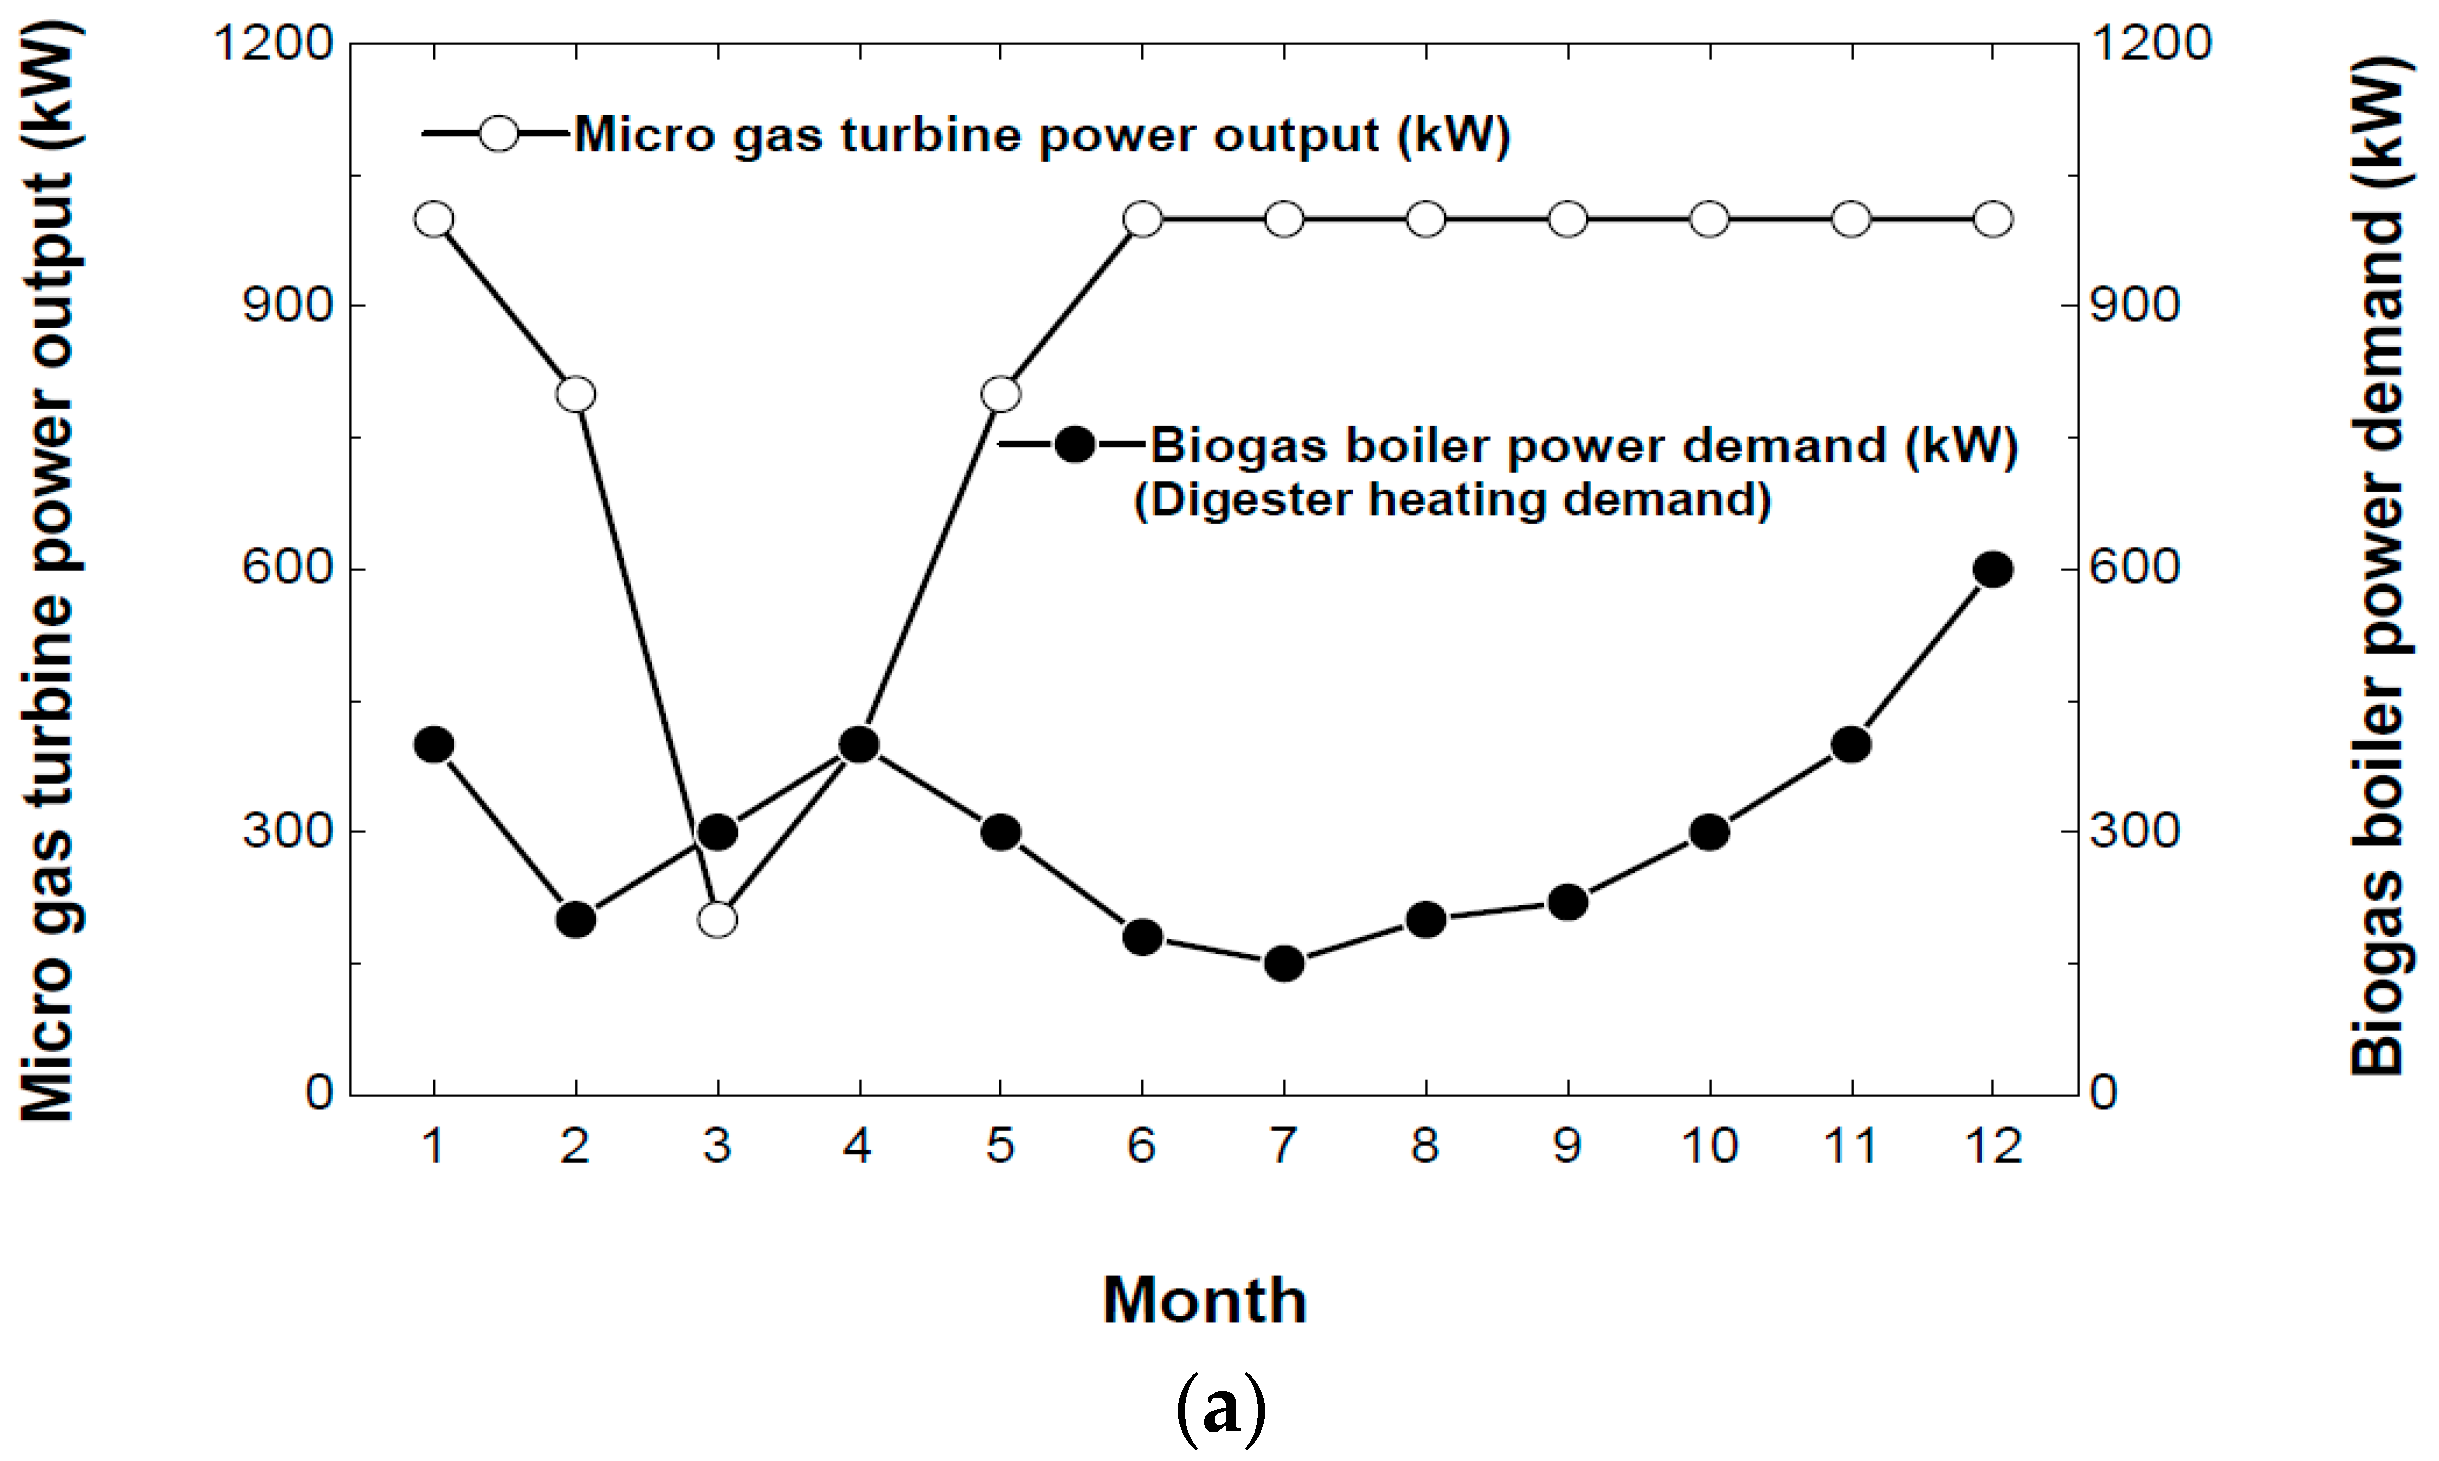
4.4.1. Case 1: MGT + Biogas Boiler

The base case is used for reference and corresponds to the current situation. In this situation, biogas is partially burned in a boiler to heat the first digester, which is enough to supply the heat required during all four seasons (Table 7). The rest of the biogas production can be consumed in a 1000-kW MGT that would run continuously at full load or partial load. The MGT is sensitive to the ambient temperature, which can influence the net power and thermal efficiency.
Figure 8 shows the effects of the biogas production and air/biogas inlet temperature shown in Table 9. Table 10 shows the parameters used to calculate the thermal load of the biodigesters. Figure 8a shows that the power output of the 1000-kW MGT is mostly driven at full load except during spring. This occurs because of the lower biogas production. The power demand of the biogas boiler is directly affected by the seasons. Figure 8b shows that the electrical efficiency declines when the ambient temperature rises, but the heat rate shows an opposite tendency. This occurs because of the air/biogas inlet temperature. Figure 8c shows that the air flow rate increased slightly during the summer at full load.

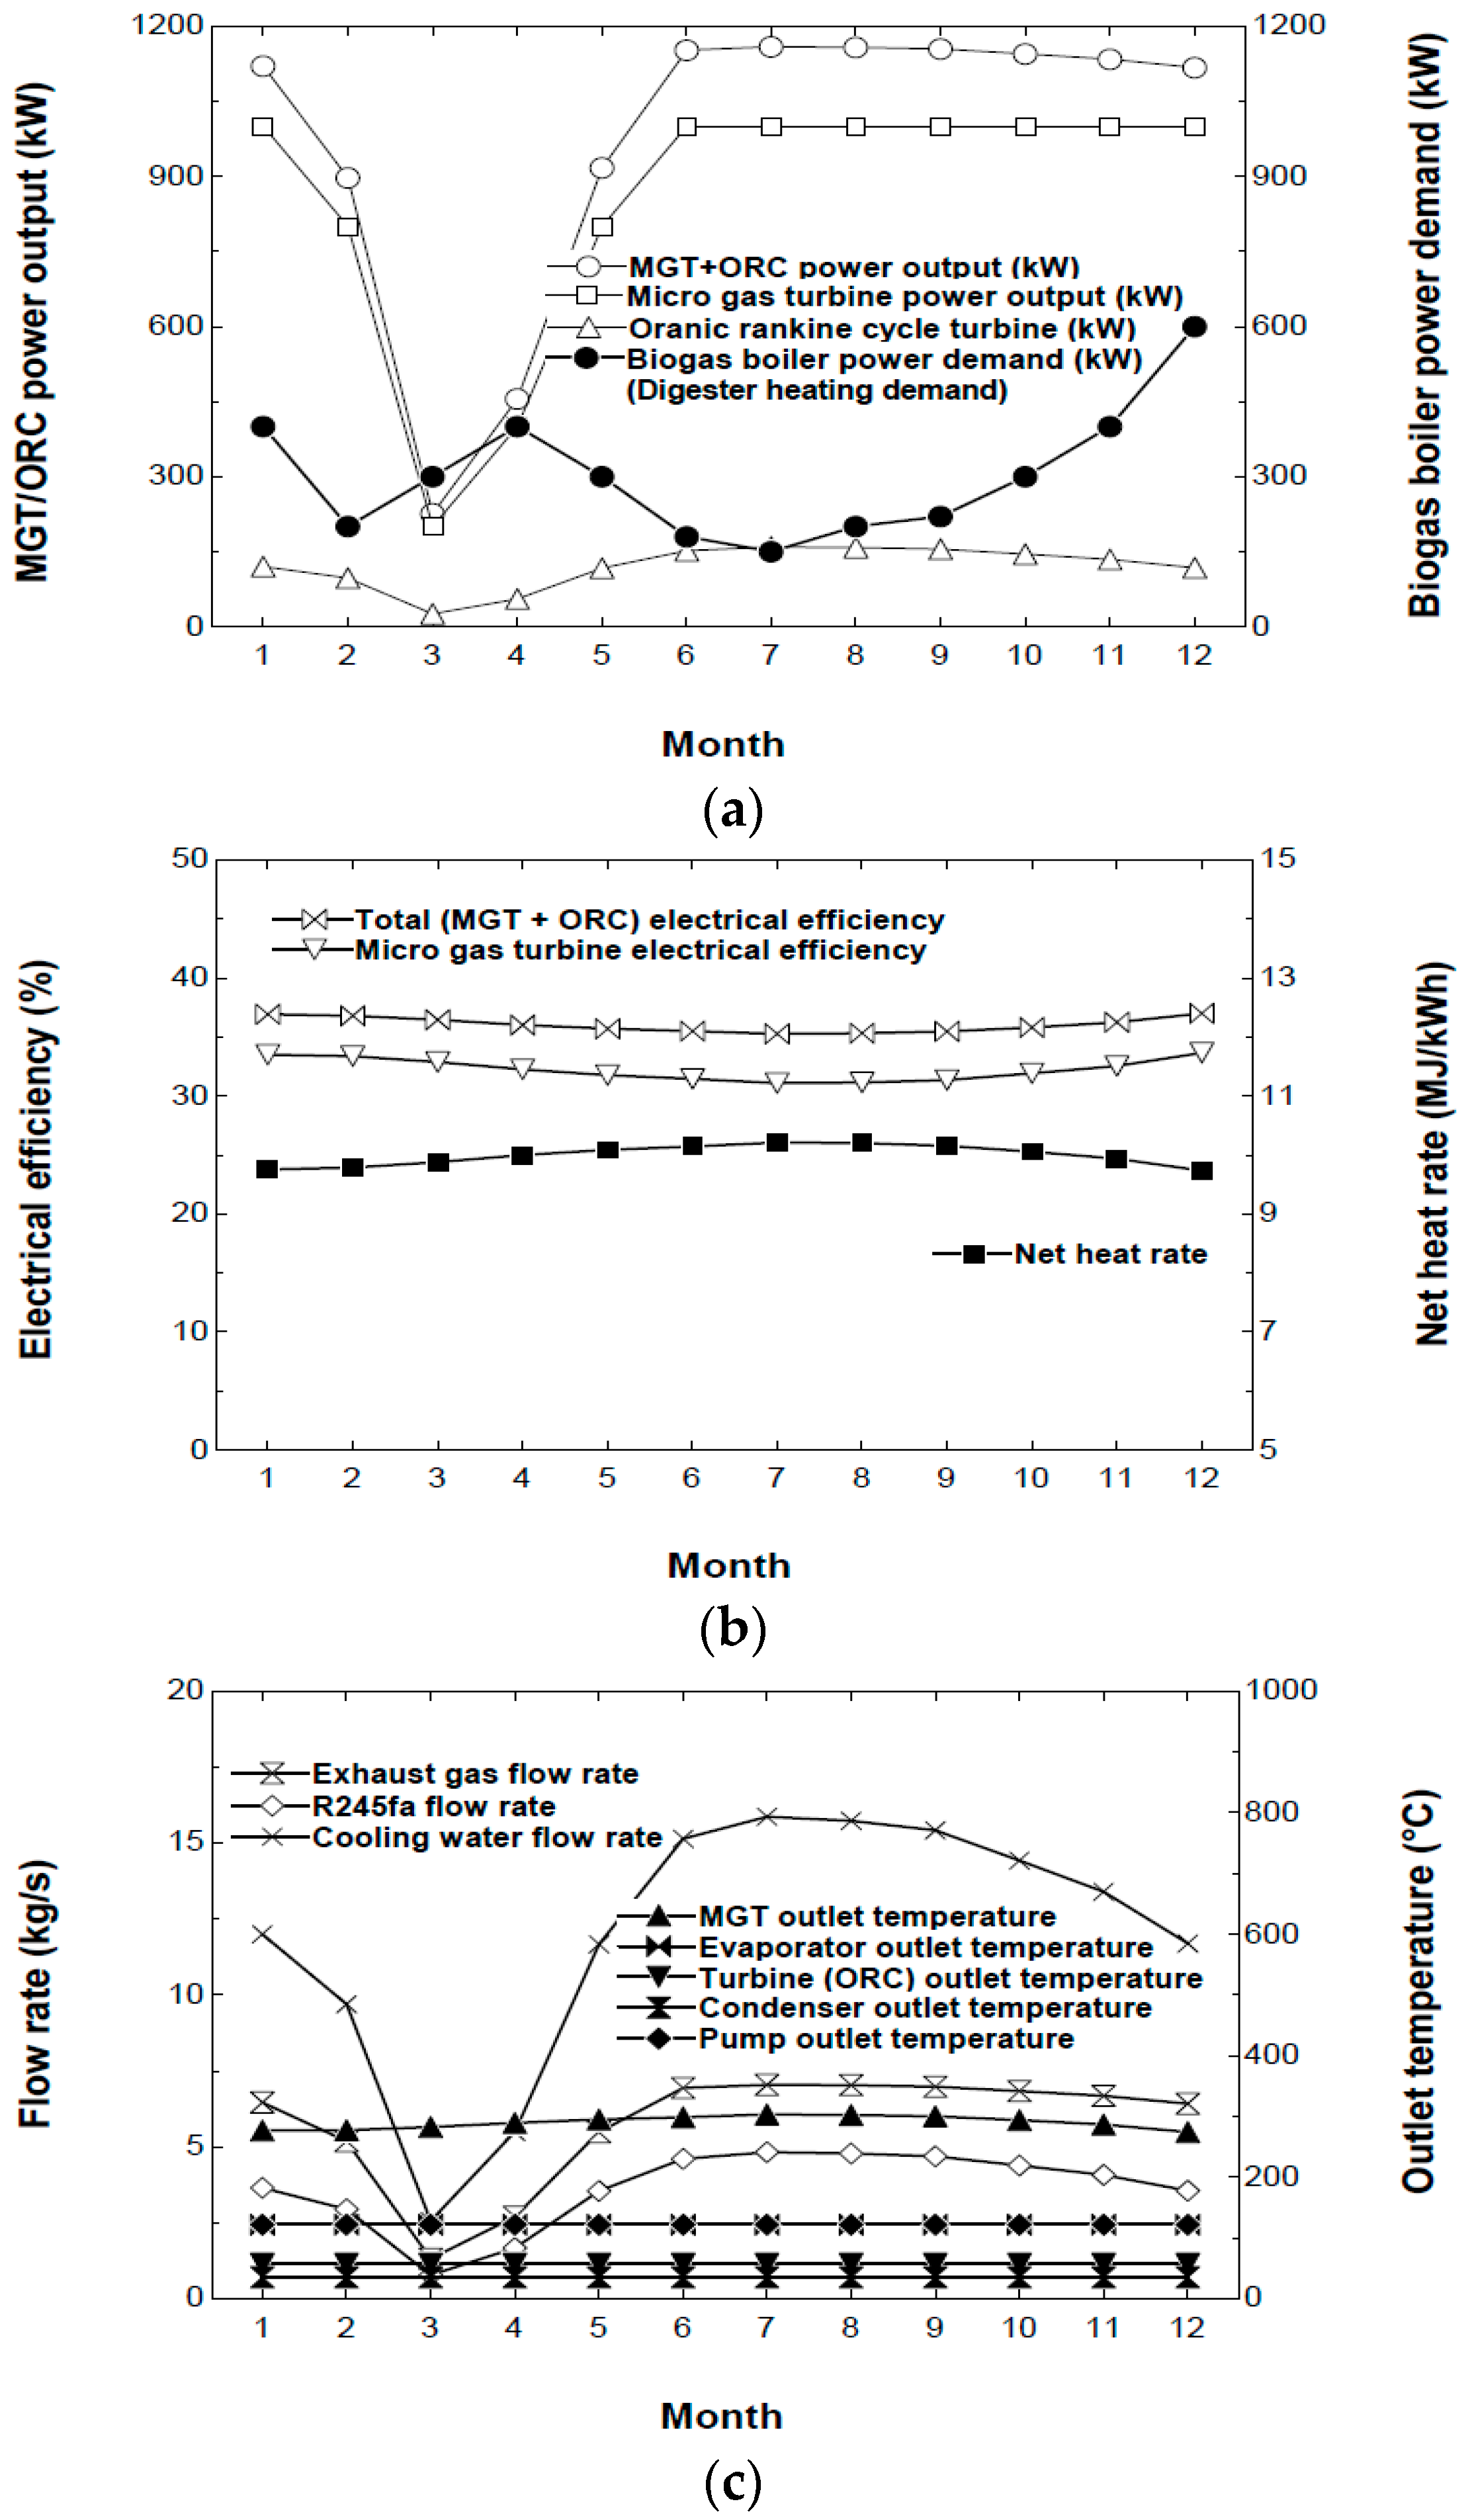
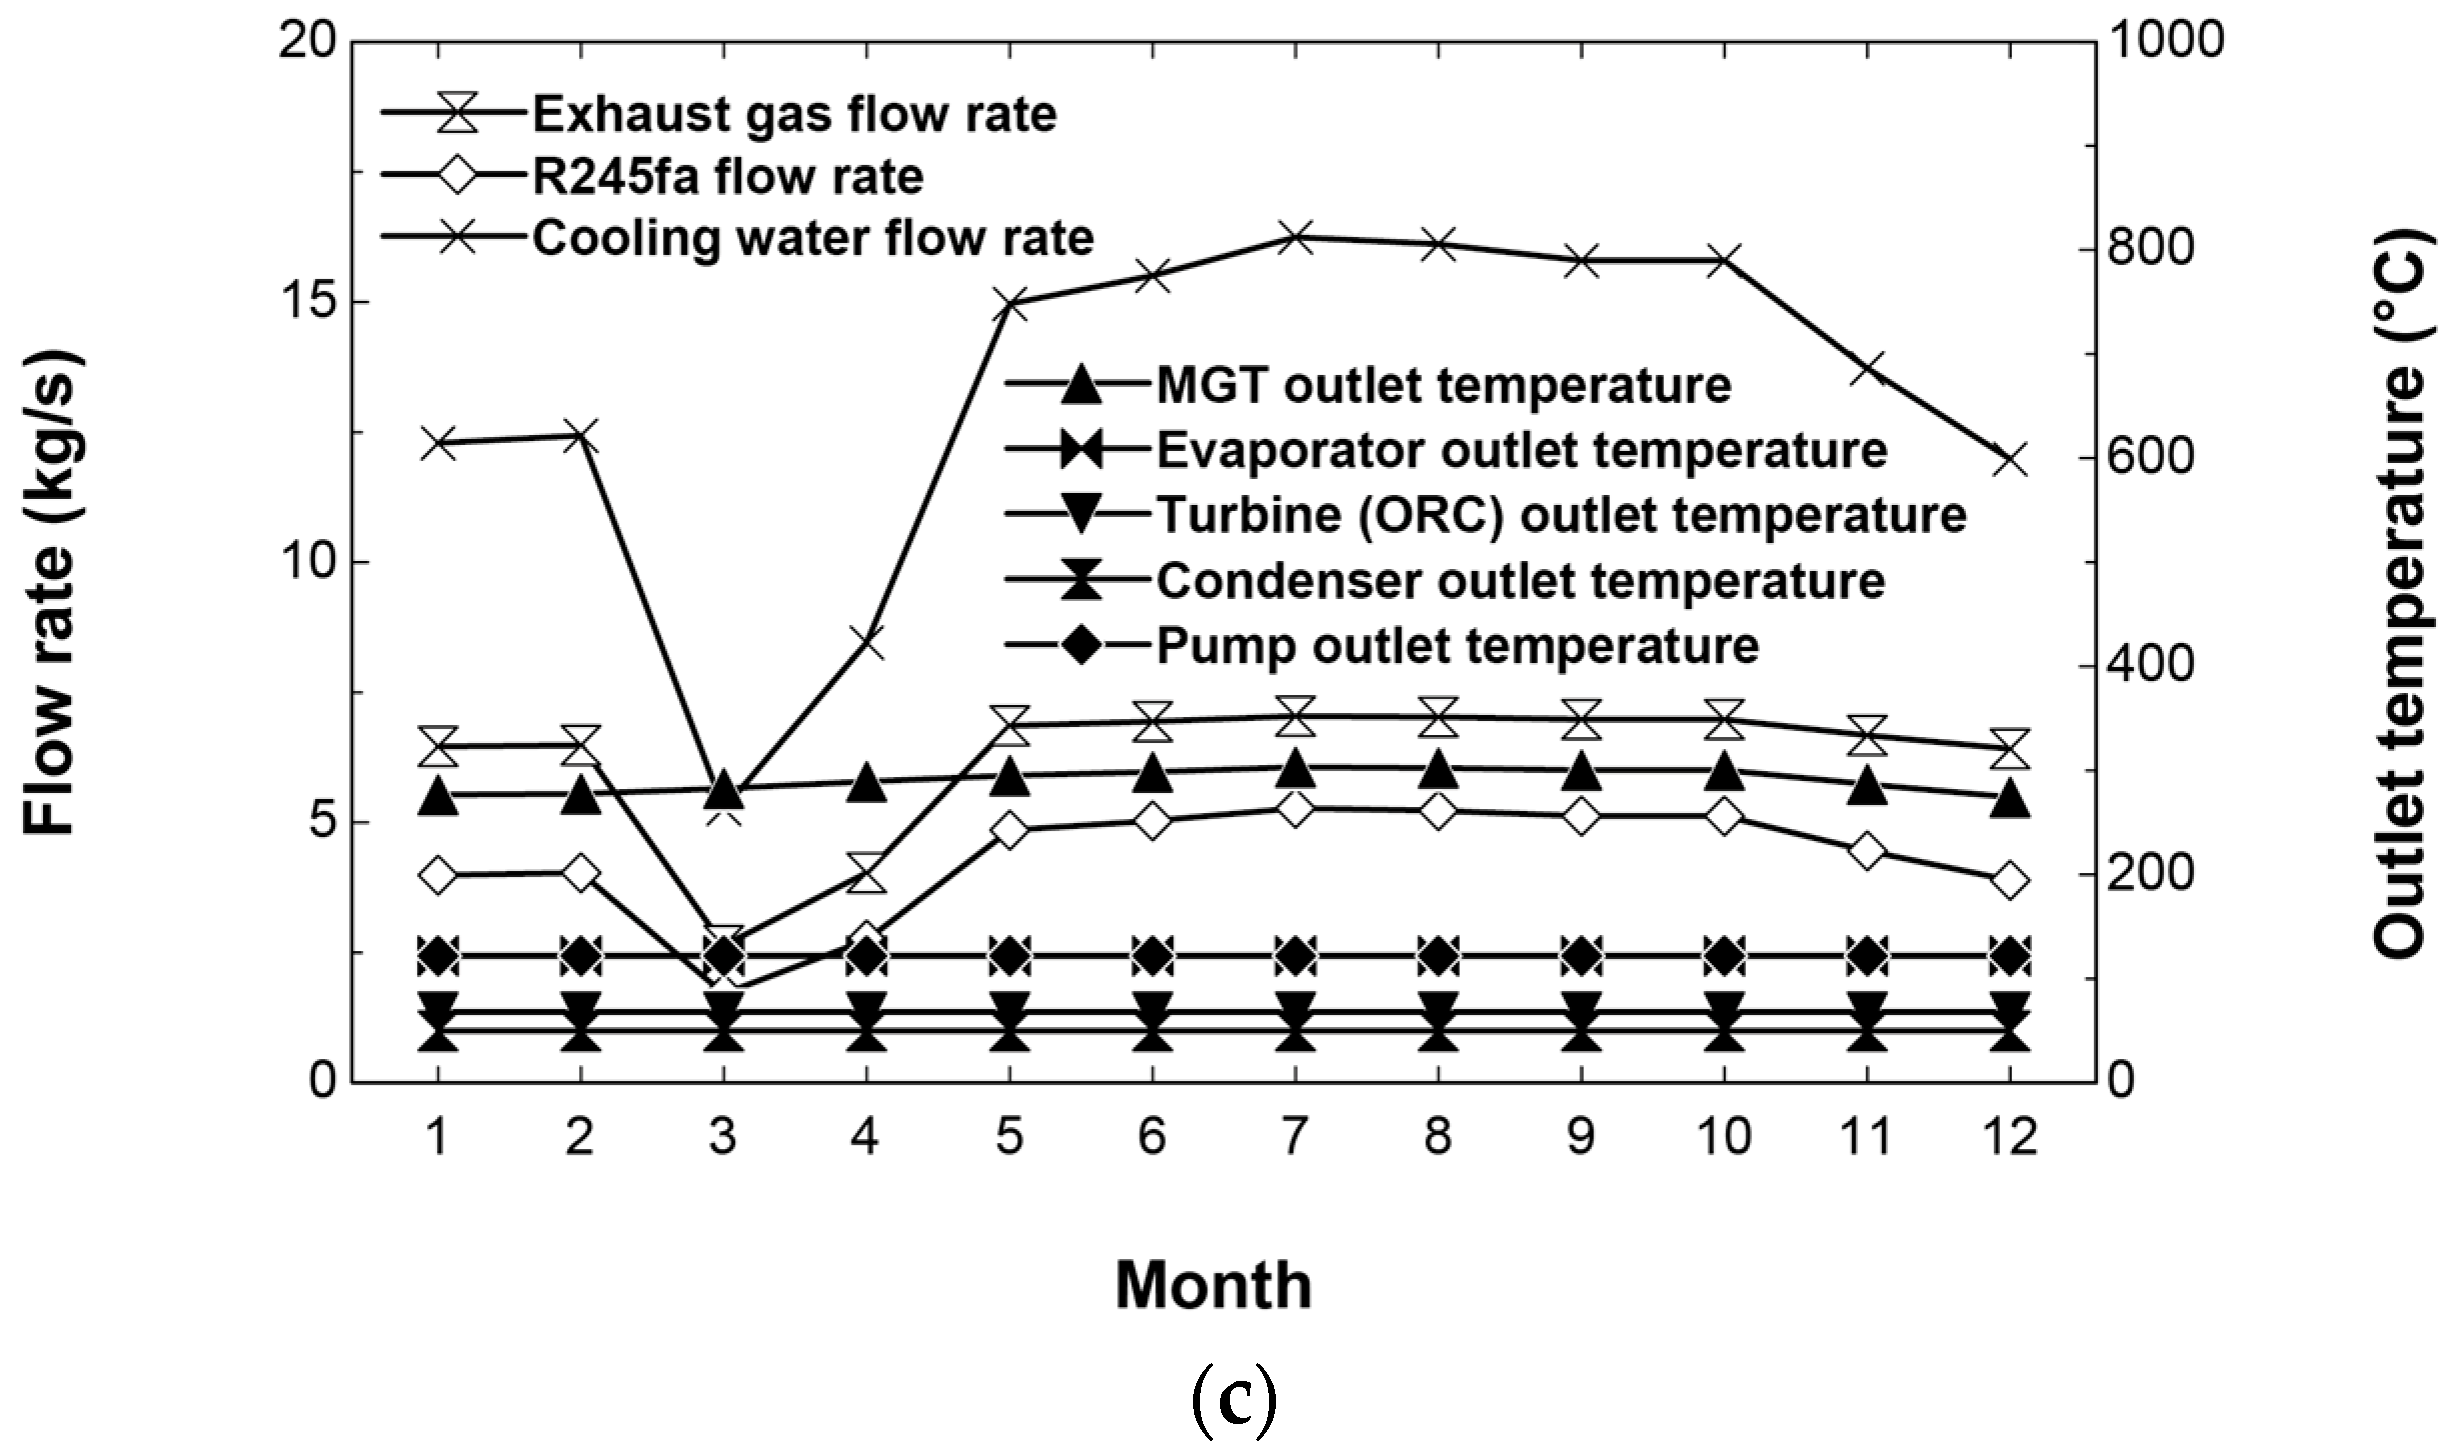
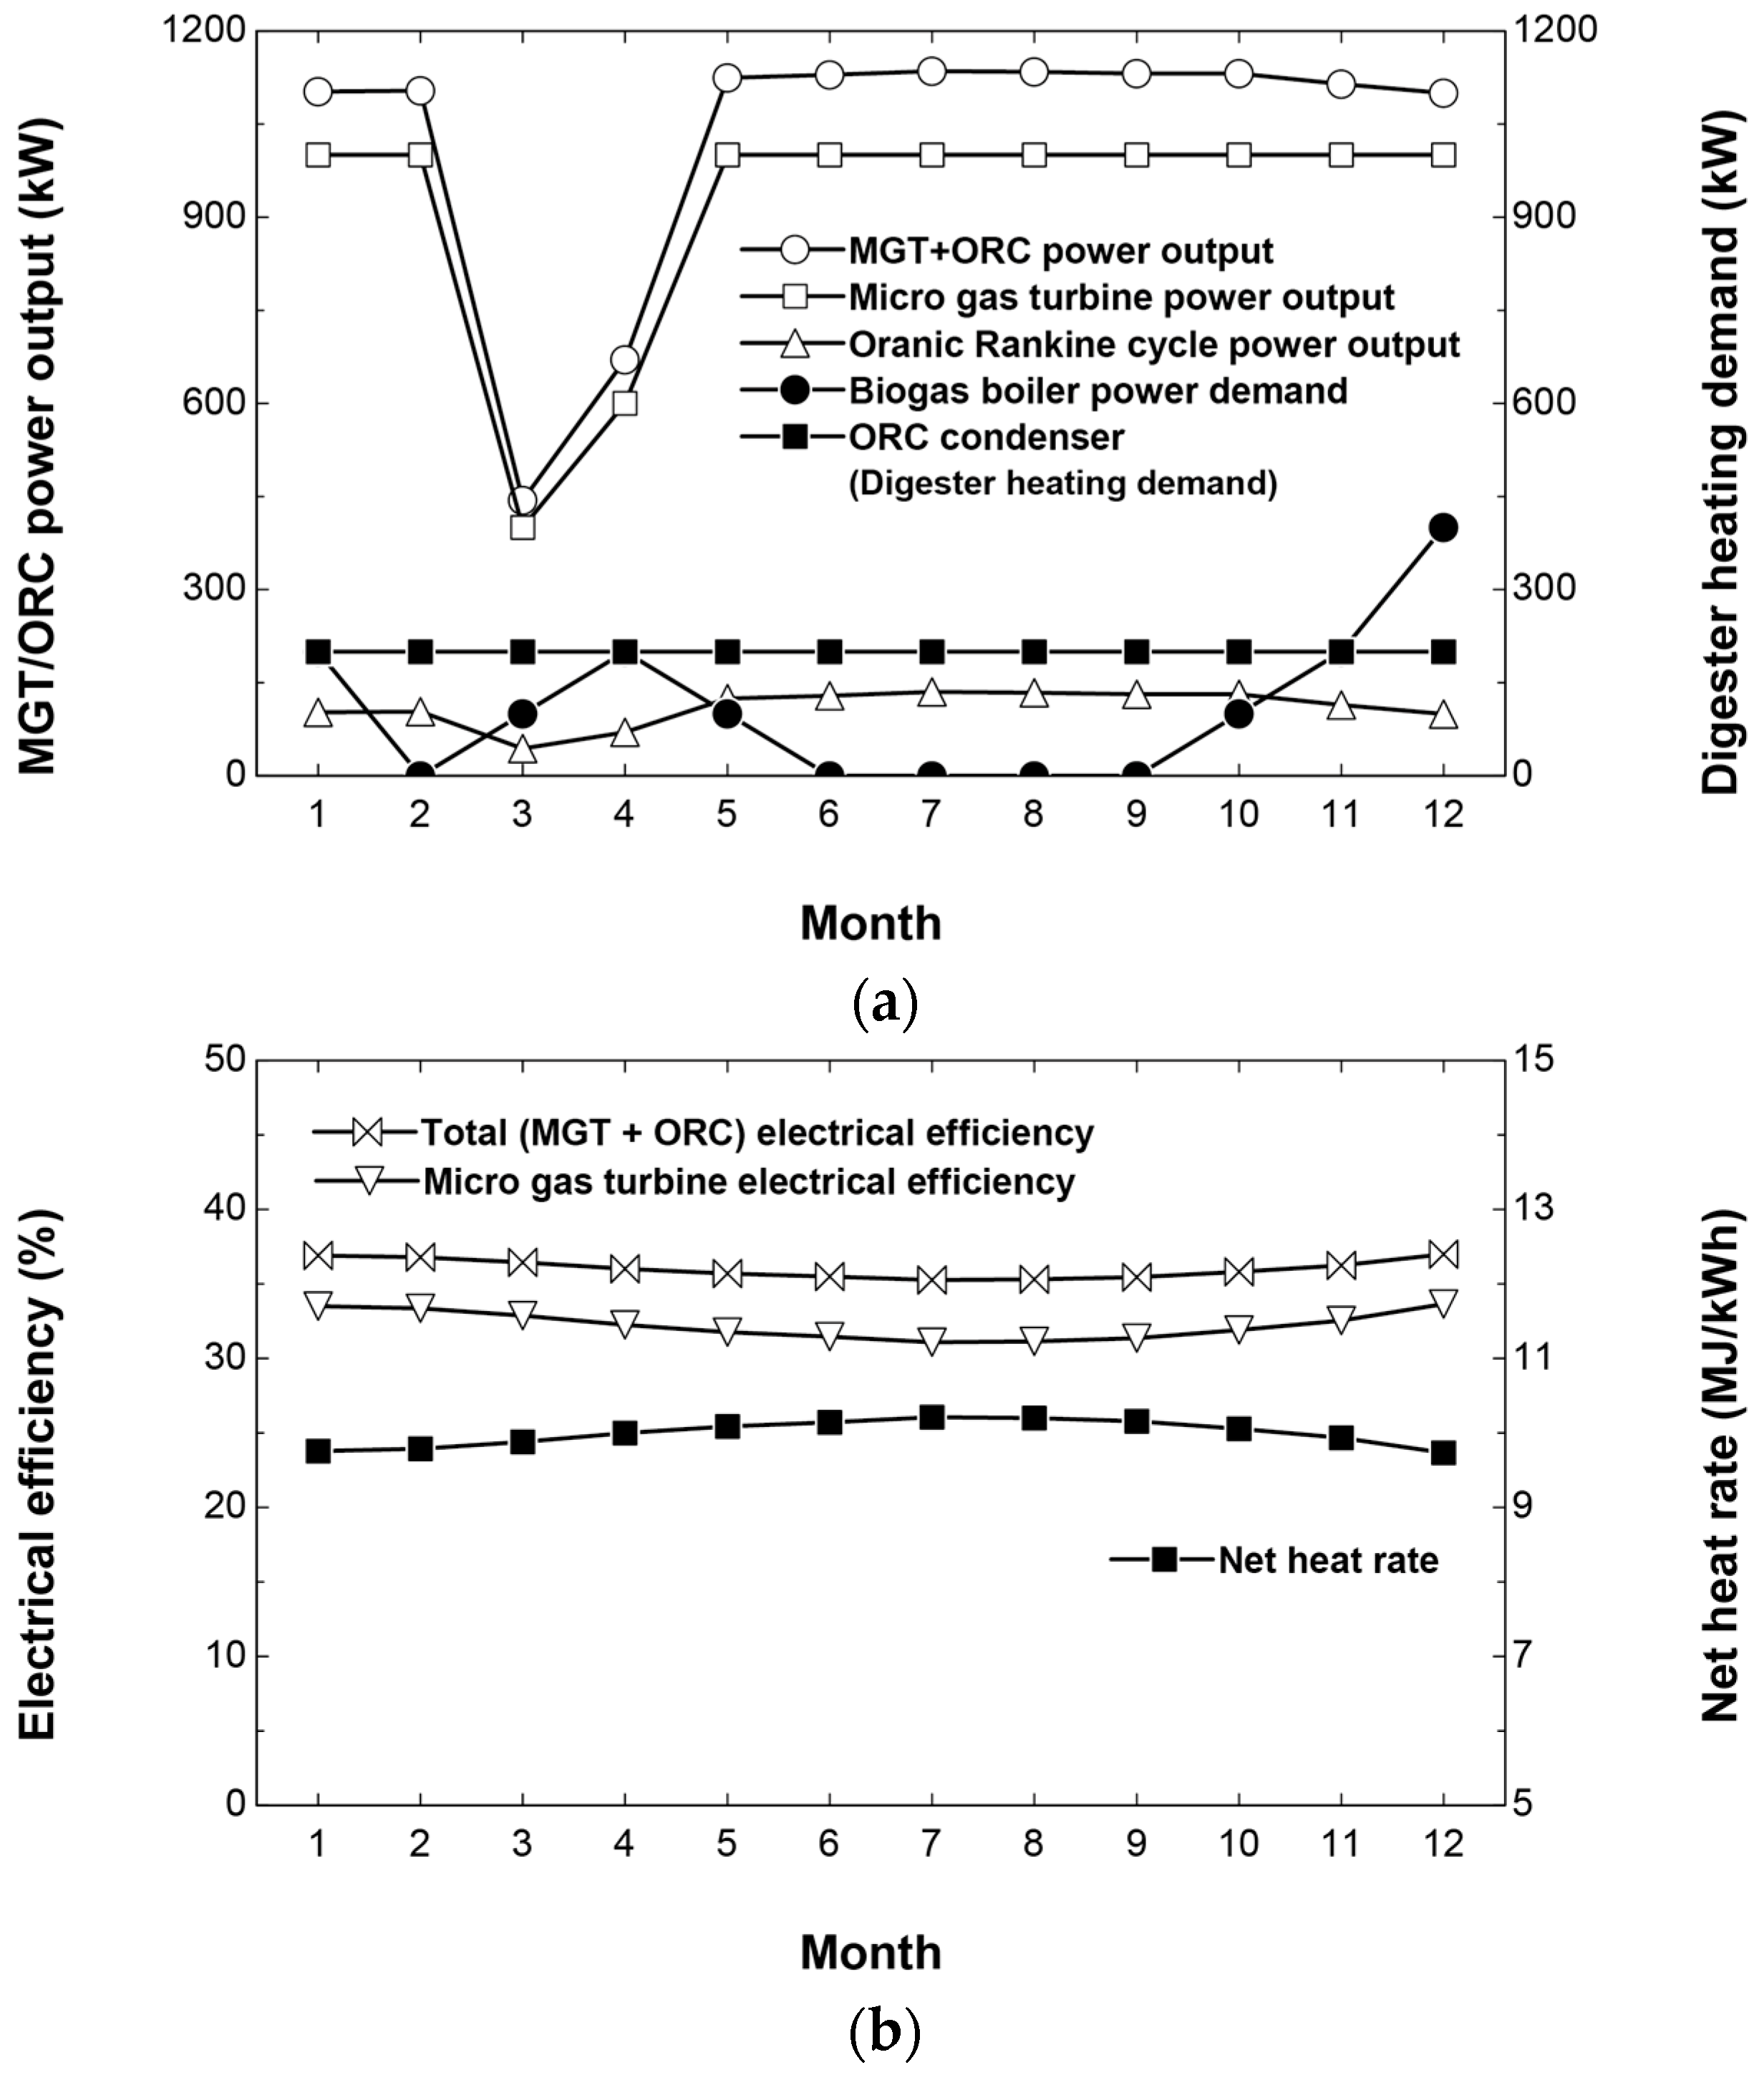
4.4.2. Case 2: MGT + ORC + Biogas Boiler

We analysed the annual performance of the MGT system with the bottoming ORC for the biogas plant. Similar to case 1, the biogas boiler burned the biogas to heat the biodigester, and the MGT used the remaining biogas until reaching its maximum capacity. The ORC system used the exhaust gas from the MGT, so the temperature of the exhaust gas was cooled from 280 to 125 °C. The transferred heat is used to evaporate the ORC working fluid from 35 to 125 °C.
Figure 9 shows the annual operating results of the MGT with the bottoming ORC. Figure 9a shows that the ORC system produced the highest power output during summer due to the high mass flow rate of the exhaust gas (Figure 9c) and the low required heat for the biodigester. Figure 9b shows the electrical efficiencies for the MGT and MGT/ORC systems. The MGT/ORC system has 3% higher efficiency throughout the year due to the additional heat recovery. The performance of MGT was decreased in summer due to increased compression work, and the combined system also showed a similar tendency. Figure 9c shows that the operating parameters of the ORC system did not change because the mass flow rate of the ORC cooling water changed instead.

4.4.3. Case 3: MGT + ORC with Heating Digesters + Biogas Boiler

In this case, the MGT is fuelled with biogas, and its waste heat is used to drive an ORC. The digester’s heating demand could partly be covered by the ORC condenser coolant. The biogas boiler is used to supply heat to the digesters. The monthly average thermal power demand is shown in Table 11. Figure 10 shows the effects of the ORC condenser outlet temperature and digester inlet temperature. As shown in Figure 10a, the digester heating demand of the ORC condenser is continuously 200 kW during all four seasons. The ORC power system is not directly affected by the seasons.
Figure 10b shows that the electrical efficiency and net heat rate are equal to those in Figure 9b. These results occur because parameters are the same. Figure 9c shows that the exhaust gas flow rate varied according to the MGT power output. The ORC system outlet temperature did not change at all. The condenser outlet temperature is fixed at 50 °C for the digester heating demand.
The annual amount of generated gross electricity for the three case studies is shown in Figure 11. In the case of the hybrid power plant, the effect of ORC on total power output is clearly appeared. The generated electricity of the MGT is equal between the hybrid concept and the separate use cases. The highest amount of generated electricity per year is obtained in case study 3. This difference occurs because the condenser water is needed to obtain the required digester heating demand in the MGT/ORC hybrid concept.

5. Conclusions

This study analysed the thermodynamic performance of biogas-fuelled power systems based on an MGT with a CHP, bottoming ORC, or both a bottoming ORC and CHP. We analysed the effects of system size, methane concentration, and ORC operating conditions. The analysis led to the following conclusions:
(1)
We analysed the performance of different sizes of MGTs and selected a 1000-kW MGT for the AD with 28,000-m3 capacity. The AD plant produced a monthly average volume of 473,364 m3 of biogas with 60% methane concentration. Different methane concentrations directly change the required biogas volume because the MGT has good fuel flexibility.
(2)
We analysed the performance of ORC systems with different operating conditions, and the 150-kW ORC system was selected for the MGT exhaust.
(3)
The CHP-ORC system provides heat for the biodigester, and the net power output was decreased to 128.9 kW due to the lower ORC turbine expansion ratio.
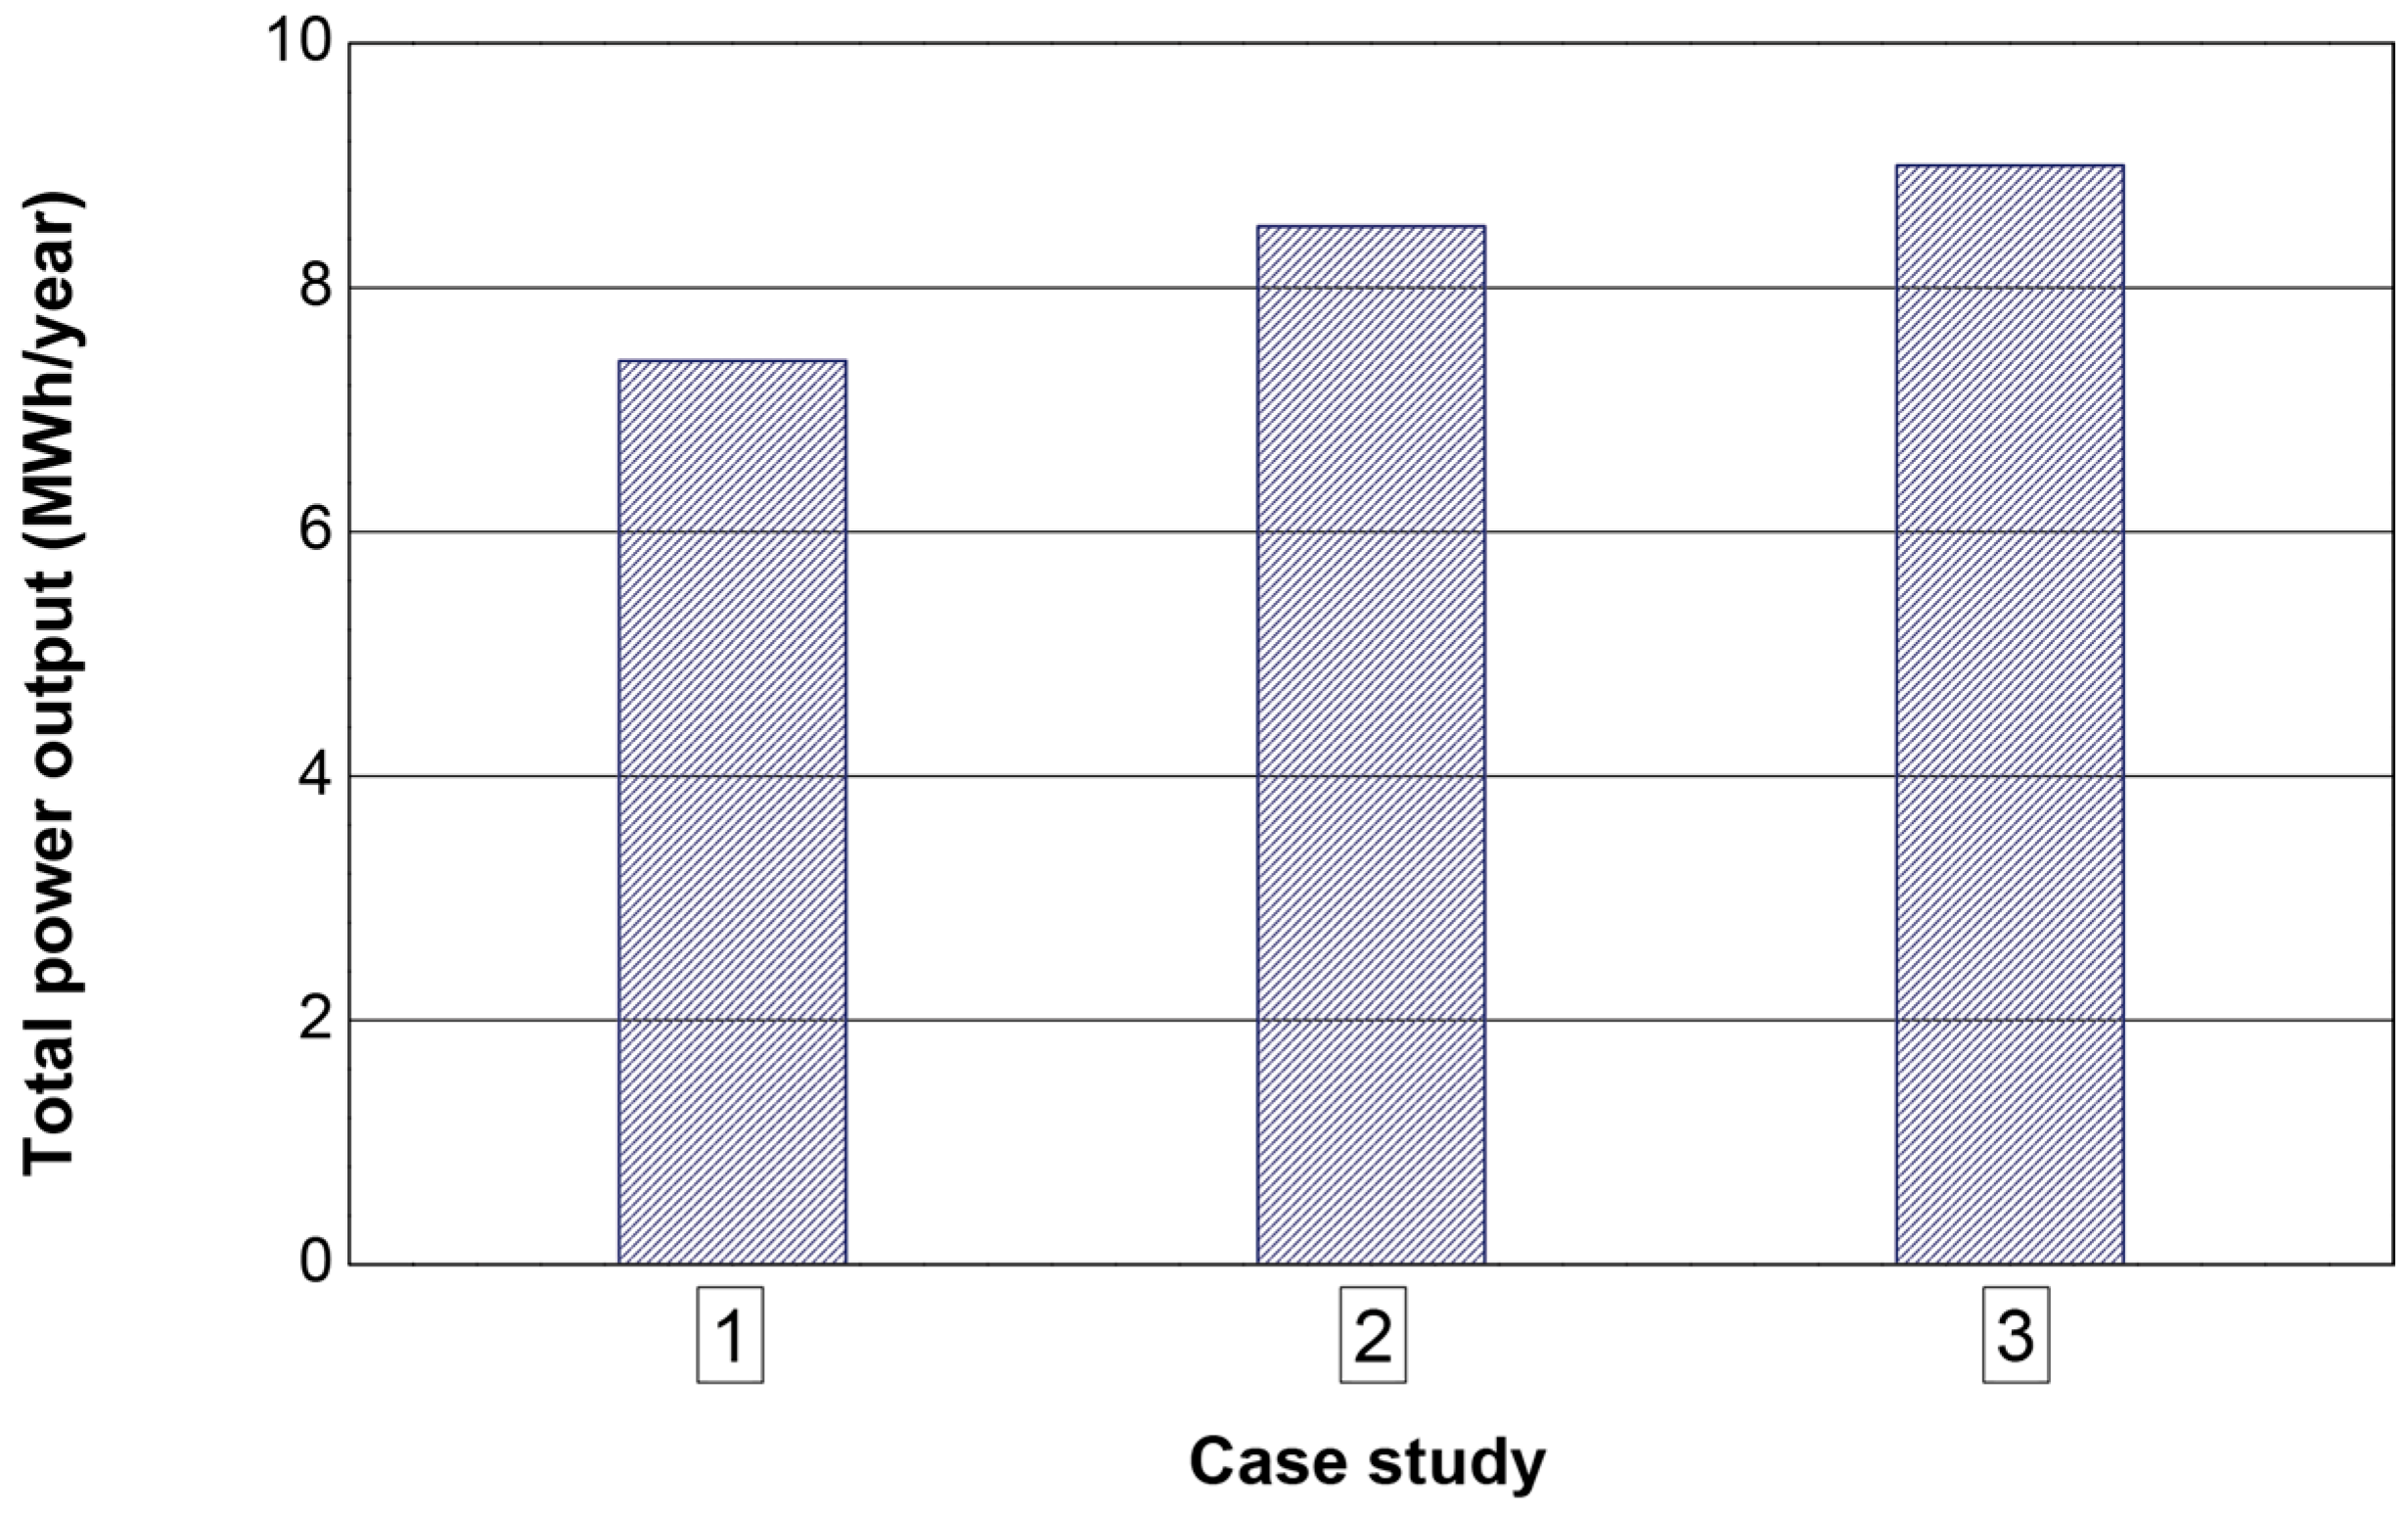
(4)
The annual operating characteristics of each system were evaluated, and the MGT with both the bottoming ORC and CHP provides the highest annual net power output. Each system produced 7.4, 8.5, and 9.0 MWh per year. However, a complete thermoeconomic analysis is required to evaluate the feasibility of the system.

Acknowledgments

This research was supported by the National Research Foundation of Korea (NRF) with a grant funded by the Korean government (MSIP) through the Global Core Research Center for Ships & Offshore Plants (GCRC-SOP, No. 2011-0030013).

Author Contributions

Sunhee Kim designed and simulated the system and wrote the paper. Taehong Sung analysed the data, and Kyung Chun Kim supervised the whole project.

Conflicts of Interest

The authors declare no conflict of interest.

References

  1. Jelodar, M.T.; Rastegar, H.; Abyaneh, H.A. Modeling turbo-expander systems. Simulation 2013, 89, 234–248. [Google Scholar] [CrossRef]
  2. Weiland, P. Biogas production: Current state and perspectives. Appl. Microbiol. Biotechnol. 2010, 85, 849–860. [Google Scholar] [CrossRef] [PubMed]
  3. Kang, H. IEA Bioenergy Task 37: Korea Coutry Reports 2015; IEA Bioenergy: Paris, France, 2015. [Google Scholar]
  4. Kim, H.Y.; Park, S.Y.; Yoo, S.H. Public acceptability of introducing a biogas mandate in korea: A contingent valuation study. Sustainability 2016, 8, 1087. [Google Scholar] [CrossRef]
  5. Kim, Y.S.; Yoon, Y.M.; Kim, C.H.; Giersdorf, J. Status of biogas technologies and policies in south korea. Renew. Sustain. Energy Rev. 2012, 16, 3430–3438. [Google Scholar] [CrossRef]
  6. Poschl, M.; Ward, S.; Owende, P. Evaluation of energy efficiency of various biogas production and utilization pathways. Appl. Energy 2010, 87, 3305–3321. [Google Scholar] [CrossRef]
  7. Staniforth, J.; Ormerod, R.M. Implications for using biogas as a fuel source for solid oxide fuel cells: Internal dry reforming in a small tubular solid oxide fuel cell. Catal. Lett. 2002, 81, 19–23. [Google Scholar] [CrossRef]
  8. Porpatham, E.; Ramesh, A.; Nagalingam, B. Investigation on the effect of concentration of methane in biogas when used as a fuel for a spark ignition engine. Fuel 2008, 87, 1651–1659. [Google Scholar] [CrossRef]
  9. Somehsaraei, H.N.; Majoumerd, M.M.; Breuhaus, P.; Assadi, M. Performance analysis of a biogas-fueled micro gas turbine using a validated thermodynamic model. Appl. Therm. Eng. 2014, 66, 181–190. [Google Scholar] [CrossRef]
  10. Pilavachi, P.A. Mini- and micro-gas turbines for combined heat and power. Appl. Therm. Eng. 2002, 22, 2003–2014. [Google Scholar] [CrossRef]
  11. Chandra, R.; Vijay, V.K.; Subbarao, P.M.V.; Khura, T.K. Performance evaluation of a constant speed ic engine on cng, methane enriched biogas and biogas. Appl. Energy 2011, 88, 3969–3977. [Google Scholar] [CrossRef]
  12. Huang, H.Y.; Li, J.; He, Z.H.; Zeng, T.; Kobayashi, N.; Kubota, M. Performance analysis of a mcfc/mgt hybrid power system bi-fueled by city gas and biogas. Energies 2015, 8, 5661–5677. [Google Scholar] [CrossRef]
  13. Kang, J.Y.; Kang, D.W.; Kim, T.S.; Hur, K.B. Comparative economic analysis of gas turbine-based power generation and combined heat and power systems using biogas fuel. Energy 2014, 67, 309–318. [Google Scholar] [CrossRef]
  14. Kang, J.Y.; Kang, D.W.; Kim, T.S.; Hur, K.B. Economic evaluation of biogas and natural gas co-firing in gas turbine combined heat and power systems. Appl. Therm. Eng. 2014, 70, 723–731. [Google Scholar] [CrossRef]
  15. Lantz, M. The economic performance of combined heat and power from biogas produced from manure in sweden—A comparison of different chp technologies. Appl. Energy 2012, 98, 502–511. [Google Scholar] [CrossRef]
  16. Bin Basrawi, M.F.; Yamada, T.; Nakanishi, K.; Katsumata, H. Analysis of the performances of biogas-fuelled micro gas turbine cogeneration systems (mgt-cgss) in middle- and small-scale sewage treatment plants: Comparison of performances and optimization of mgts with various electrical power outputs. Energy 2012, 38, 291–304. [Google Scholar] [CrossRef]
  17. Baral, S.; Kim, D.; Yun, E.; Kim, K.C. Energy, exergy and performance analysis of small-scale organic rankine cycle systems for electrical power generation applicable in rural areas of developing countries. Energies 2015, 8, 684–713. [Google Scholar] [CrossRef]
  18. Baral, S.; Kim, K.C. Thermodynamic modelling of the solar organic rankine cycle with selected organic working fluids for cogeneration. Distrib. Gener. Altern. Energy J. 2014, 29, 7–34. [Google Scholar] [CrossRef]
  19. Baral, S.; Kim, D.; Yun, E.; Kim, K.C. Experimental and thermoeconomic analysis of small-scale solar organic rankine cycle (sorc) system. Entropy 2015, 17, 2039–2061. [Google Scholar] [CrossRef]
  20. Sung, T.; Yun, E.; Kim, H.D.; Choi, J.H.; Chae, J.M.; Cho, Y.A.; Kim, K.C. Thermodynamic analysis on organic rankine cycle using exhaust heat of gas engine. J. Korean Inst. Gas 2015, 19, 66–73. [Google Scholar] [CrossRef]
  21. Sung, T.; Yun, E.; Choi, J.H.; Chae, J.M.; Cho, Y.A.; Kim, K.C. Design and thermodynamic analysis of hybrid tri-generation gas engine-organic rankine cycle. Trans. Korean Hydrog. New Energy Soc. 2015, 26, 79–87. [Google Scholar] [CrossRef]
  22. Sung, T.; Yoon, S.Y.; Kim, K.C. A mathematical model of hourly solar radiation in varying weather conditions for a dynamic simulation of the solar organic rankine cycle. Energies 2015, 8, 7058–7069. [Google Scholar] [CrossRef]
  23. Yun, E.; Park, H.; Yoon, S.Y.; Kim, K.C. Dual parallel organic rankine cycle (orc) system for high efficiency waste heat recovery in marine application. J. Mech. Sci. Technol. 2015, 29, 2509–2515. [Google Scholar] [CrossRef]
  24. Yun, E.; Kim, D.; Yoon, S.Y.; Kim, K.C. Experimental investigation of an organic rankine cycle with multiple expanders used in parallel. Appl. Energy 2015, 145, 246–254. [Google Scholar] [CrossRef]
  25. Schuster, A.; Karellas, S.; Kakaras, E.; Spliethoff, H. Energetic and economic investigation of organic rankine cycle applications. Appl. Therm. Eng. 2009, 29, 1809–1817. [Google Scholar] [CrossRef]
  26. Lee, J.H.; Kim, T.S. Analysis of design and part load performance of micro gas turbine/organic rankine cycle combined systems. J. Mech. Sci. Technol. 2006, 20, 1502–1513. [Google Scholar] [CrossRef]
  27. Ebrahimi, M.; Ahookhosh, K. Integrated energy-exergy optimization of a novel micro-cchp cycle based on mgt-orc and steam ejector refrigerator. Appl. Therm. Eng. 2016, 102, 1206–1218. [Google Scholar] [CrossRef]
  28. Yagli, H.; Koc, Y.; Koc, A.; Gorgulu, A.; Tandiroglu, A. Parametric optimization and exergetic analysis comparison of subcritical and supercritical organic rankine cycle (orc) for biogas fuelled combined heat and power (chp) engine exhaust gas waste heat. Energy 2016, 111, 923–932. [Google Scholar] [CrossRef]
  29. Lee, K.J.; Oh, J.S.; Kim, S.H.; Oh, S.G.; Lim, T.W.; Kim, J.S.; Lee, J.H.; Park, S.K.; Kim, M.E.; Kim, M.H. Performance analysis of hybrid sofc/gt/st system for marine power applications. J. Korean Soc. Mar. Eng. 2012, 36, 40–50. [Google Scholar] [CrossRef]
  30. Busan Environmental Corporation. Available online: http://www.bego.go.kr (accessed on 6 January 2017).
  31. Korea Institute of Machinery & Materials R & D. Available online: http://www.kimm.go.kr (accessed on 6 January 2017).
  32. Biogas Installation & Operation Manual. Available online: http://m.nier.go.kr (accessed on 6 January 2017).
Figure 1. Schematic diagram of a biogas-fuelled micro-gas turbine with a bottoming organic Rankine cycle power system.
Energies 10 00275 g001
Figure 2. Matlab/Simulink blocks for the MGT/ORC hybrid power system.
Energies 10 00275 g002
Figure 3. The effect of different sizes of the micro gas turbines on the required operating conditions. (a) The biogas capacity per day and the lower heating value of the biogas; (b) The electrical efficiency and the net heat rate of the MGT; (c) The mass flow rate and the outlet temperature for the streams in the MGT.
Energies 10 00275 g003
Figure 4. The effect of CH4 concentration on the performance of the micro gas turbine. (a) The required biogas capacity per day and the lower heating value of the biogas; (b) The electrical efficiency and the net heat rate of the MGT; (c) The mass rate and the outlet temperature for the streams in the MGT.
Energies 10 00275 g004
Figure 5. The effect of the turbine inlet temperature to the performance and operating conditions of organic Rankine cycle. (a) The power output and demand for the ORC components and thermal efficiency of the ORC; (b) The electrical efficiency of the MGT and the MGT with the ORC. The net heat rate of the MGT with the ORC; (c) The mass rate and the outlet temperature for the streams in the ORC.
Energies 10 00275 g005
Figure 6. Effect of the condenser outlet temperature of the cooling water on the performance and operating conditions of the organic Rankine cycle. (a) The power output and demand for the ORC components and thermal efficiency of the ORC; (b) The electrical efficiency of the MGT and the MGT with the ORC. The net heat rate of the MGT with the ORC; (c) The mass rate and the outlet temperature for the streams in the ORC.
Energies 10 00275 g006
Figure 7. The effect of the cooling water inlet temperature on the performance and operating conditions of the organic Rankine cycle. (a) The power output and demand for the ORC components and thermal efficiency of the ORC; (b) The electrical efficiency of the MGT and the MGT with the ORC. The net heat rate of the MGT with the ORC; (c) The mass rate and the outlet temperature for the streams in the ORC.
Energies 10 00275 g007aEnergies 10 00275 g007b
Figure 8. Annual operating results for MGT with biogas boiler system. (a) The power output of the MGT and the amount of the biogas used in the biogas boiler; (b) The electrical efficiency and the net heat rate of the MGT; (c) The mass rate and the outlet temperature for the streams in the MGT.
Energies 10 00275 g008aEnergies 10 00275 g008b
Figure 9. Annual operating results for MGT with bottoming ORC and biogas boiler system. (a) The power output of the MGT and the ORC and the amount of the biogas used in the biogas boiler; (b) The electrical efficiency of the MGT and the MGT with the ORC. The net heat rate of the MGT with the ORC; (c) The mass rate and the outlet temperature for the streams in the MGT and the ORC.
Energies 10 00275 g009
Figure 10. Annual operating results for MGT with bottoming ORC. (a) The power output of the MGT and the ORC, the amount of the biogas used in the biogas boiler and the amount of the heat transferred from the ORC condenser; (b) The electrical efficiency of the MGT and the MGT with the ORC. The net heat rate of the MGT with the ORC; (c) The mass rate and the outlet temperature for the streams in the MGT and the ORC.
Energies 10 00275 g010aEnergies 10 00275 g010b
Figure 11. Annual amount of generated electricity for case study.
Energies 10 00275 g011
Table 1. Specifications of the commercial micro gas turbines manufactured by Capstone Turbine Corporation.
ProductsPower Output (kW)Efficiency (%)Net Heat LHV (MJ/Kw)Exh. Temp. (°C)Exh. Gas (kg/s)
C2002003310.92801.3
C600S6003310.92804.0
C800S8003310.92805.3
C1000S10003310.92806.7
Table 2. Parameters of the micro gas turbine for lumped analysis.
ParametersUnitValue
Air compressor efficiency%78
Gas turbine inlet temperature°C950
Gas turbine pressure ratio 4.5
Gas turbine efficiency%85
Fuel feeder efficiency%60
Recuperator efficiency%88
Recuperator pressure drop (air side)%1
Combustor pressure drop%2
Recuperator pressure drop (gas side)%1
Gas turbine pressure drop%96
Ambient temperature°C20
Ambient pressurekPa101
Table 3. Characteristics and operating conditions of the sewage sludge and food waste treatment plant in Busan, Republic of Korea.
ParametersUnitValue
Sewage sludgetons/day100
Thickenerm3672 × 6
Anaerobic digesterm37000 × 6
Dehydratorm3/h40 × 3
Gas tankm36000 × 1
Desulfurizerm3/h800 × 2
Boilertons/h2.5 × 4
Food wastetons/day120
Hopperm370
Crusherm3/h7.5
Settling tankm36
Grinderm3/h9
Storage basinm3100
Transfer pumpm3/h30
Population coveragePeople1,094,000
Biogas productionm3/month105,954–718,748
Table 4. Biogas composition in sewage sludge and food waste treatment plants.
ComponentsUnitValue
Methane (CH4)%55–75
Carbon dioxide (CO2)%25–45
Hydrogen sulphide (H2S)ppm<50
Nitrogen (N2)%<1
Hydrogen (H2)%<1
Oxygen (O2)%<1
Table 5. Design point operating conditions of 200-kW ORC system.
ParametersUnitValue
Working fluid R245fa
Evaporation pressurekPa2090
Condensation pressurekPa220
Working fluid mass flow ratekg/s7.2
Degree of superheating°C5
Table 6. Parameters of organic Rankine cycle for lumped analysis.
ParametersUnitValue
Power outputkW150
Evaporator outlet temperature (gas side)°C150
Turbine inlet pressurekPa2000
Condenser outlet temperature°C50
Cooling water temperature°C30
Turbine isentropic efficiency%80
R245fa pump isentropic efficiency%85
Cooling water pump isentropic efficiency%85
Evaporator pressure drop%<1
Table 7. Tmperature of sewage sludge and food waste in Busan, Republic of Korea.
SeasonSpringSummerFallWinter
Temperature (°C)1525154
Table 8. Thermodynamic simulation results for MGT-ORC power system.
Turbine Inlet Pressure (bar)Turbine
Power Output (kW)
Thermal EfficiencyWorking Fluid
Flow Rate (kg/s)
Cooling Water
Mass Flow (kg/s)
Electrical
Efficiency
530.52.35.411.633.0
1078.35.94.911.034.3
15102.57.74.710.835.0
20118.08.84.610.635.4
25128.99.54.510.535.6
Condenser Outlet Temp. (°C)Turbine
Power Output (kW)
Thermal EfficiencyWorking Fluid
Mass Flow (kg/s)
Cooling Water
Mass Flow (kg/s)
Electrical
Efficiency
50118.08.84.610.635.4
60103.77.64.98.034.9
7089.46.55.25.434.5
8074.35.35.74.434.1
9059.24.16.23.733.7
Cooling Water
Temp. (°C)
Turbine
Power Output (kW)
Thermal EfficiencyWorking Fluid
Mass Flow (kg/s)
Cooling Water
Mass Flow (kg/s)
Electrical
Efficiency
25118.08.84.68.535.4
30118.08.84.610.635.4
35118.08.84.614.135.3
40118.08.84.621.235.2
45118.08.84.642.535.0
Table 9. Operating data of sewage sludge and food waste treatment plant.
2014.
Month
Biogas Production
(Nm3/Day)
Biogas Boiler
(Nm3/Day)
Air/Biogas
Temperature (°C)
119,23055395.0
213,90926045.8
3529038689.8
410,199490214.6
514,861408718.7
614,505226921.4
715,763199624.8
817,487243324.2
915,647279722.7
1019,542387217.9
1119,435520612.7
1220,64575163.5
Table 10. Parameters for calculation of the thermal load in the biogas digesters.
ParametersUnits1st Digester2nd Digester
Volumem37000 × 27000 × 2
Aream2Φ 22.8 × 29.5Φ 22.8 × 29.5
Wall areaWm2-K1.531.53
Roof areaWm2-K3.313.31
Base areaWm2-K0.630.63
Sludge specific heatkJ/kg-K1.01.0
Table 11. Thermal power demands for the MGT system with the ORC and heating digester.
2014.
Month
Air/Soil/Sludge
Temperature (°C)
Digester Thermal Power Demand (kW)Biogas Boiler
(kW)
ORC Condenser
(kW)
15.0400200200
25.82000200
39.8300100200
414.6400200200
518.7300100200
621.41800200
724.81500200
824.22000200
922.72200200
1017.9300100200
1112.7400200200
123.5600400200

