1. Introduction
The COREX process, an alternative iron-making technology, is independent on coking coal to meet the environmental and source requirements, and it has been successfully applied in China, India, South Africa and South Korea [
1,
2]. Two COREX-3000 processes, the melting rate of which aims to reach approximate 150 t/h, were introduced in 2007 and 2011 in China, respectively. However, for the sake of taking advantage of low iron costs, one of the COREX-3000 processes was entirely moved to XinJiang, a large region with abundant sources of low rank coal and iron ore.
The COREX process can be studied according to the investigations by Wu et al. [
3,
4]. It consists of two reactors: the prereduction shaft furnace and the melter gasifier. The raw materials, i.e., lump ore, pellet, coke and fluxes, are continuously charged into the shaft furnace, while large amounts of coke and lump coal are charged into the melter gasifier. The reducing gas at about 1223 K is introduced through the bustle and moves in a countercurrent direction to the top of the shaft furnace. Hot DRI produced by the shaft furnace is discharged at the top of the melter gasifier, and oxygen, which reacts with the coke and coal char (CC) to generating reducing gas and heat, is blown through the tuyeres. The recycling dust of this process, which contains abundant carbon and metallic iron, is ignited by oxygen injected through the oxygen coal lance. The combustion of the recycling dust generates reducing gas and releases a large amount of heat, which is important for controlling the temperature of the dome, and must be maintained above 1223 K to guarantee the reduction reaction in the pre-reduction furnace. However, the temperature of the reducing gas in the dome cannot be higher than 1323 K, otherwise, the coal ash would soften and bond the dust to block the generator gas nozzles.
Therefore, maintaining a stable temperature in the dome is of great importance, making studies on the combustion of the recycling dust interesting. Sun et al. [
5] analyzed the impact of operation parameters on the temperature in the dome mainly by regression analysis. Liu et al. [
6] investigated the pyrolysis process of lump coal in a COREX melter gasifier, however, combustion of the recycling dust was not reported in their work. Berger et al. [
7] investigated the combustion of the recycling dust in front of the dust burner using different numerical approaches, and their results showed that the temperature in this region is about 1174 K, which is lower than the practical data. Wu et al. [
8] studied combustion reaction using three-dimensional steady-state model. It indicated that the carbon in the recycling dust was completely consumed, and the highest temperature in this region can be above 3000 K. Du et al. [
9] discussed the inherent characteristics of the recycling dust using experimental data, and the combustion reaction process was studied through a three-dimensional steady state mathematical model.
Combustion of coal and other carbonaceous materials, such as biomass, under enriched oxygen atmospheres has been investigated by several researchers. Liu et al. [
10] investigated the co-combustion of biomass and bituminous coal under 100% and 80% oxygen atmospheres, and it was seen that the combustion performance of the blends was obviously improved by increasing the oxygen content. Gong et al. [
11] studied the effect of CeO
2 on combustion performance of acid-treated coal under an oxygen atmosphere, and it is more drastic compared with combustion under an air atmosphere. Nevertheless, work related to the combustion performance of the recycling dust under an enriched oxygen atmosphere and its kinetic analysis has never been reported.
The origin of carbon in the recycling dust (RD) was investigated by petrographic analysis in this work. Meanwhile, the micromorphology and microcrystalline structure of carbon in the recycling dust were studied using a scanning electron microscope (SEM) and X-ray diffraction (XRD) after acid treatment as well. The combustion characteristics of RD was analyzed by thermogravimetric analysis and the kinetic parameters were calculated using the distributed activation energy model (DAEM). It is expected that this research will be useful in understanding the combustion process of recycling dust and provided information required for design and operation of the dust burner.
3. Kinetic Model
Fractional conversion curves of all the samples were obtained using thermogravimetric analysis in the temperature programming progress, and the activation energy varied as the fractional conversion changed.
The distributed activation energy model (DAEM), originally developed by Vand [
20], was improved by Pitt [
21], Anthony [
22] and Miura [
23]. It is used to calculate the kinetic parameters during pyrolysis or combustion processes of biomass and coal and so on. Not only the average activation energy but also the variation trends during combustion processes can be obtained using this model. It assumes that a number of parallel and irreversible first order reactions that have different kinetic parameters occur simultaneously. The combustion of the experimental samples can be described using Equation (3) [
24]:
where
f(
E) is distribution curve of activation energy;
k0 is the frequency factor corresponding to activation energy, s
−1;
E is the activation energy, kJ/mol;
R is gas constant, 8.314 J/(mol·K); and
T is the absolute temperature, K.
The temperature (
T) during a combustion reaction is controlled by the constant heating rate β according to Equation (4):
Equation (3) can be rewritten as Equation (5) by combining Equations (3) and (4):
where
, and it changes profoundly with the activation energy at a given temperature.
The activation energy of combustion reaction is treated approximately by a step function, and the treatment approximates that a reaction with activation energy occurs at a specified temperature and heating rate. The approximation is given mathematically in Equation (6):
By integrating and applying natural logarithms, Equation (6) can be written as Equation (7):
As shown in Equation (7), the activation energy and frequency factor are determined from the slope and intercept of plots of versus at a given fractional conversion at different heating rates.
4. Results and Discussion
4.1. Petrographic Analysis
Petrographic analysis was used to distinguish unconsumed coal from unconsumed coke fines according to differential reflectance [
13,
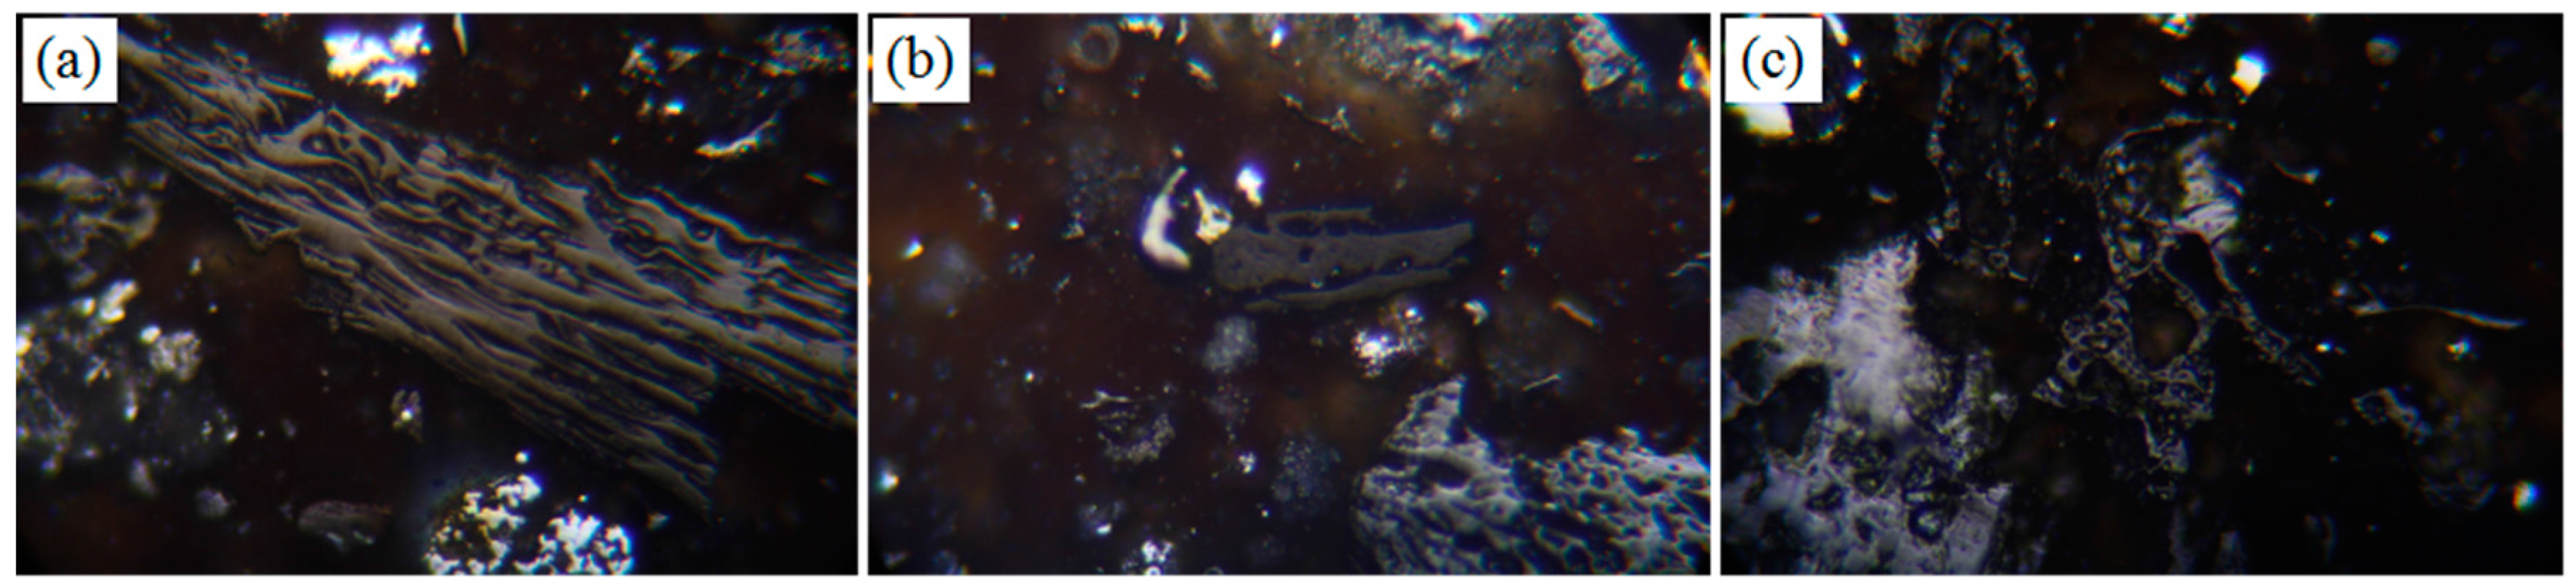
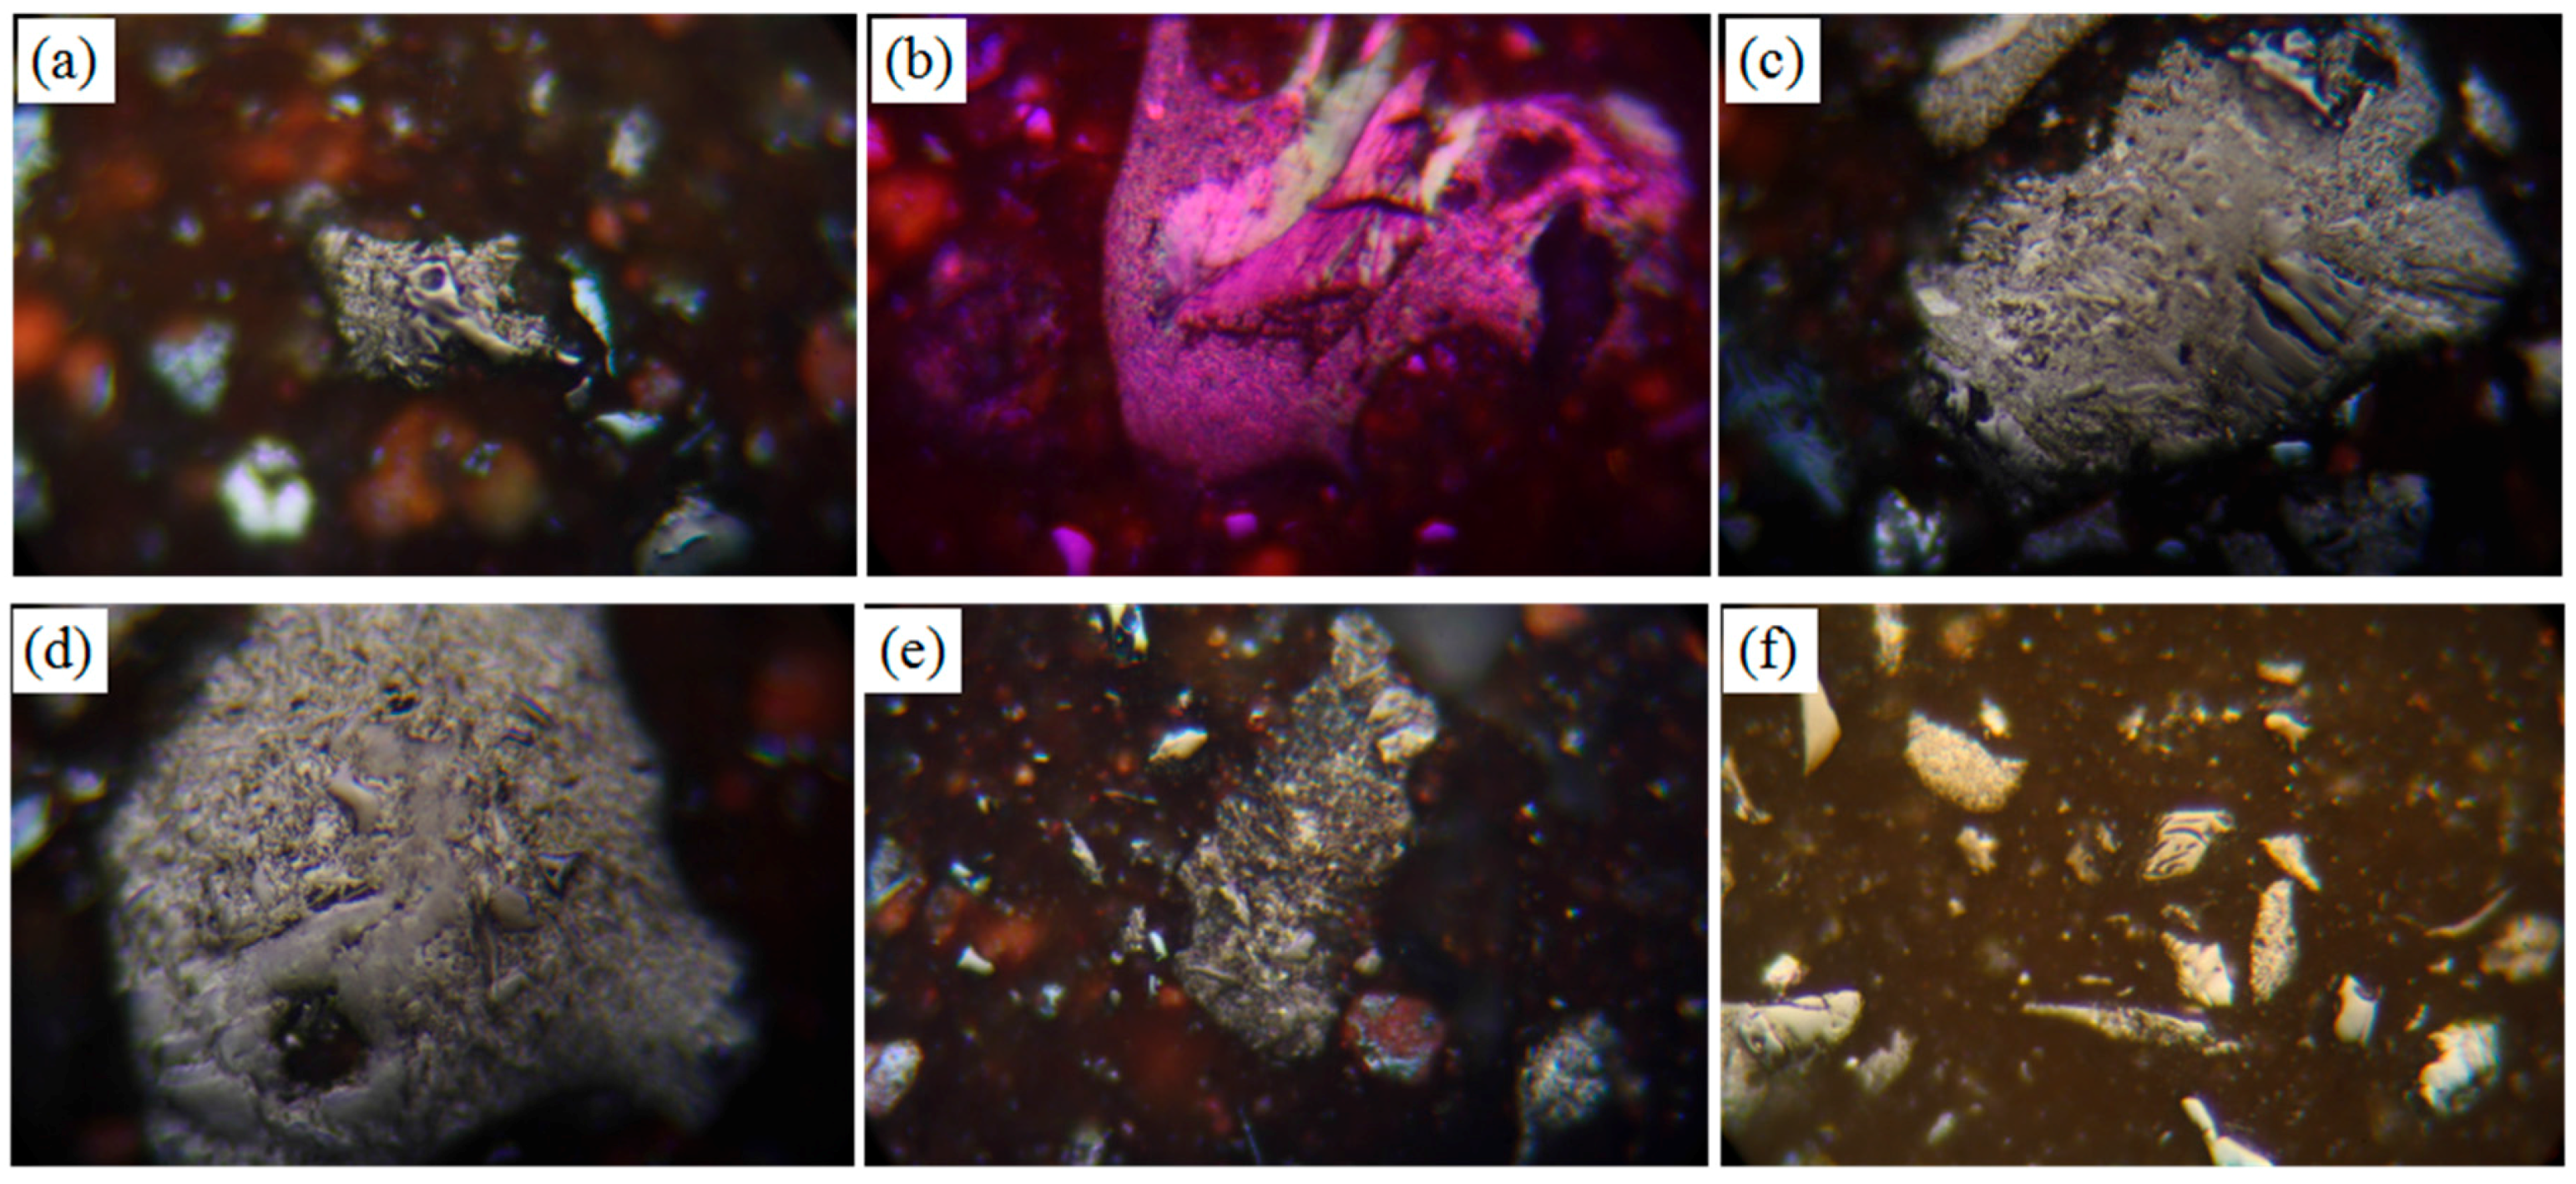
15]. Petrographic micrographs with a magnification of 480× are shown in
Figure 1 and
Figure 2. The results show that carbon in the RD mainly originates from unconsumed fine coke produced in the moving bed or hearth and unconsumed pulverized coal burnt in the dome. The microstructure of the unconsumed pulverized coal was found to be completely unconsumed coal (CUC), deformed coal (DC) and residue coal (RC) as shown in
Figure 1. However, the microstructure of unconsumed fine coke (
Figure 2) had several origins: granule inlay structure (GIS), flowing structure (FS), macro some (MS), block structure (BS), hemophilic silk carbon (HSC) and residue coke (RC).
The results of percentage of microstructure area ratio of different parts in the RD are shown in
Table 2. The data indicates that the carbonaceous materials include unconsumed fine coke and pulverized coal. The main structure types of unconsumed fine coke are granule inlay structures and residual coke, while completely unconsumed coal is the main structure type of unconsumed coal. According to the method proposed by Wu et al. [
17], the mass fraction of unconsumed fine coke and pulverized coal in the RD was calculated, and the weight percentage of unconsumed fine coke and pulverized coal are 19.34% and 3.16%, respectively.
4.2. Morphology of Carbonaceous Material of Samples
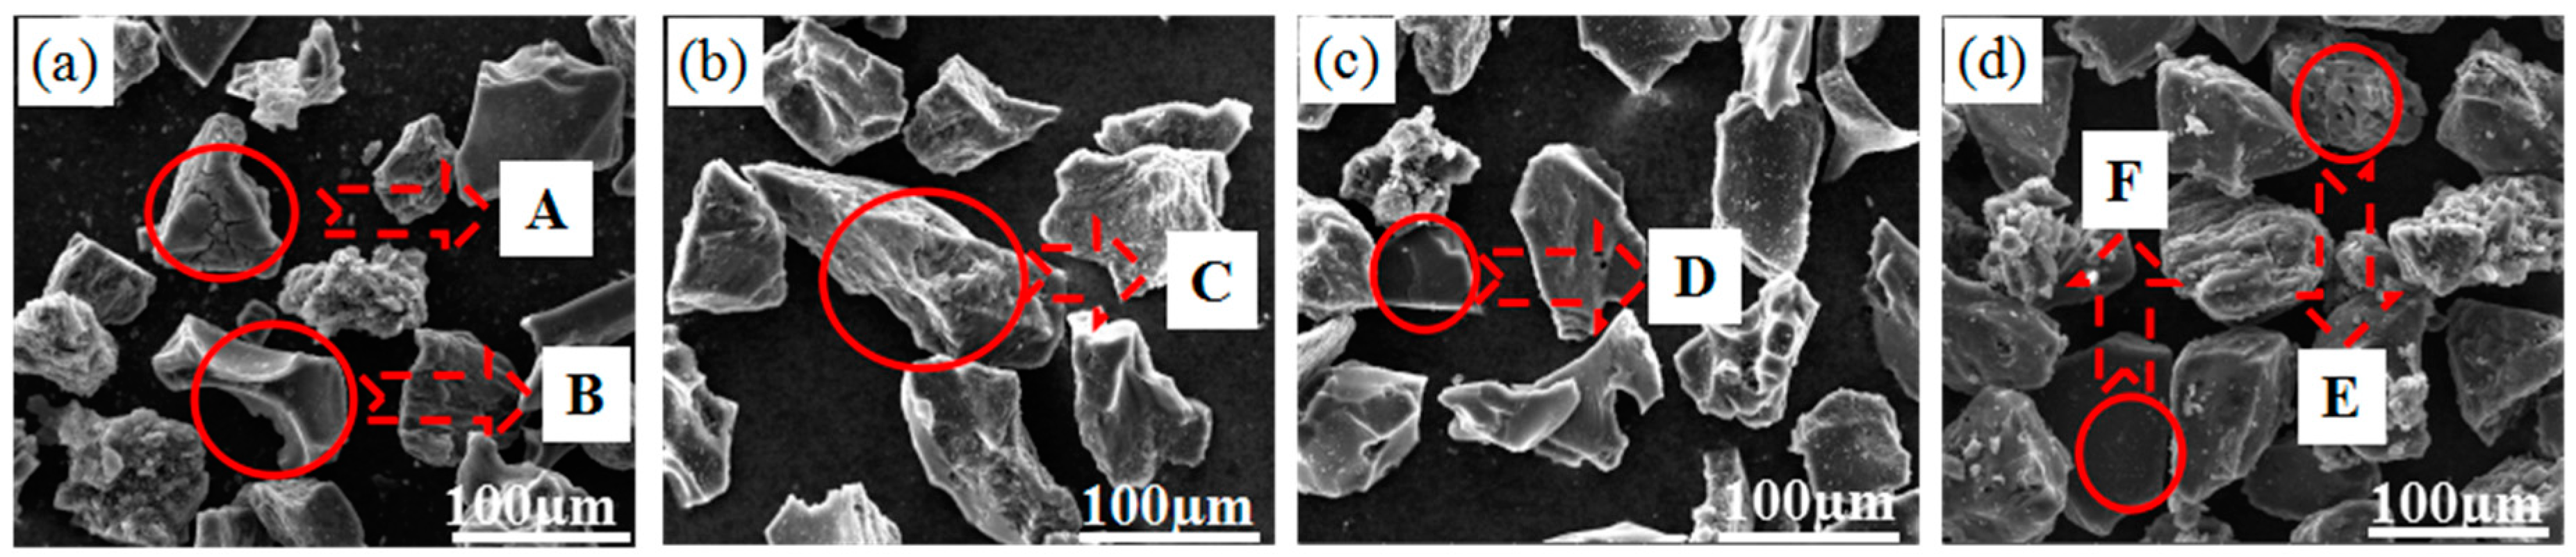
The micromorphology of carbon in the RD, C-1, C-2 and CC was characterized using a SEM, and the results are shown in
Figure 3.
Particles with both irregular and sharp edges are found in the RD under a magnification of 1000×, in addition, ablative structures of incompletely reacted carbon are observed as well. The micromorphology of CC is characterized by solid particles with irregular edges and small pores, and a small amount of CC displays a smooth surface. Samples C-1 and C-2 are observed to have different morphology. Sample C-1 tends to show irregular edges and a rough surface, while C-2 shows sharp edges and a smooth surface. The different morphology of carbon in the RD indicates the complex origin of the carbon, which agrees with the petrographic analysis results.
4.3. Micro Crystalline Structure of Carbonaceous Material of Samples
Although the micromorphology of samples could be obtained by SEM analysis, the structural parameters, which are of importance to explain difference of combustion profiles, could not be calculated. XRD is a well-established technique to determine the microcrystalline structural parameters of carbonaceous materials with good reliability [
25,
26,
27]. The proportion of crystalline carbon and amorphous carbon indicates the degree of ordering of the carbon, which can be investigated by the average stack height (
Lc). The average stacking height of carbon crystallites of carbonaceous material in this work is calculated using Scherrer’s equation:
where
is the wavelength of the X-ray source (Cu Kα = 0.154060 nm), β is the full width at half-maximum intensity
(FWHM) of the 002 reflection peak, and
is the 002 carbon peak position. The diffraction pattern of acid treated recycling dust and other samples are shown in
Figure 4.
All spectra display a clear (002) peak at about 25° of 2θ, and the 002 diffraction peak of CC presents a broad hump due to its turbostratic structure between graphite and an amorphous structure [
28]. The 002 peaks of cokes and carbon in the recycling dust are sharper and narrower compared with CC, and the positions are found to shift to larger 2θ values, indicating that the microcrystalline structures of the carbonaceous materials tend to be more ordered. Meanwhile, average stacking height structural parameter
Lc is calculated according to the XRD spectra and presented in
Table 3.
As shown in
Table 3, the smallest
FWHM and largest 2θ value results in the largest average stacking height
Lc of carbon in the RD, indicating that the carbon in the RD tends to be more ordered than that of C-1, C-2 and CC. Temperature is known to have a significant influence on the degree of graphitization of carbon, and a high temperature region of more than 3000 K can be formed in front of the dust burner due to the combustion of recycling dust [
8]. The RD samples go through the high temperature zone resulting in aromatic carbon lamellas that were stacked higher in the spatial arrangement, and the graphitic structure of the recycling dust is more ordered than that of coal and coke.
4.4. Thermogravimetric Analysis
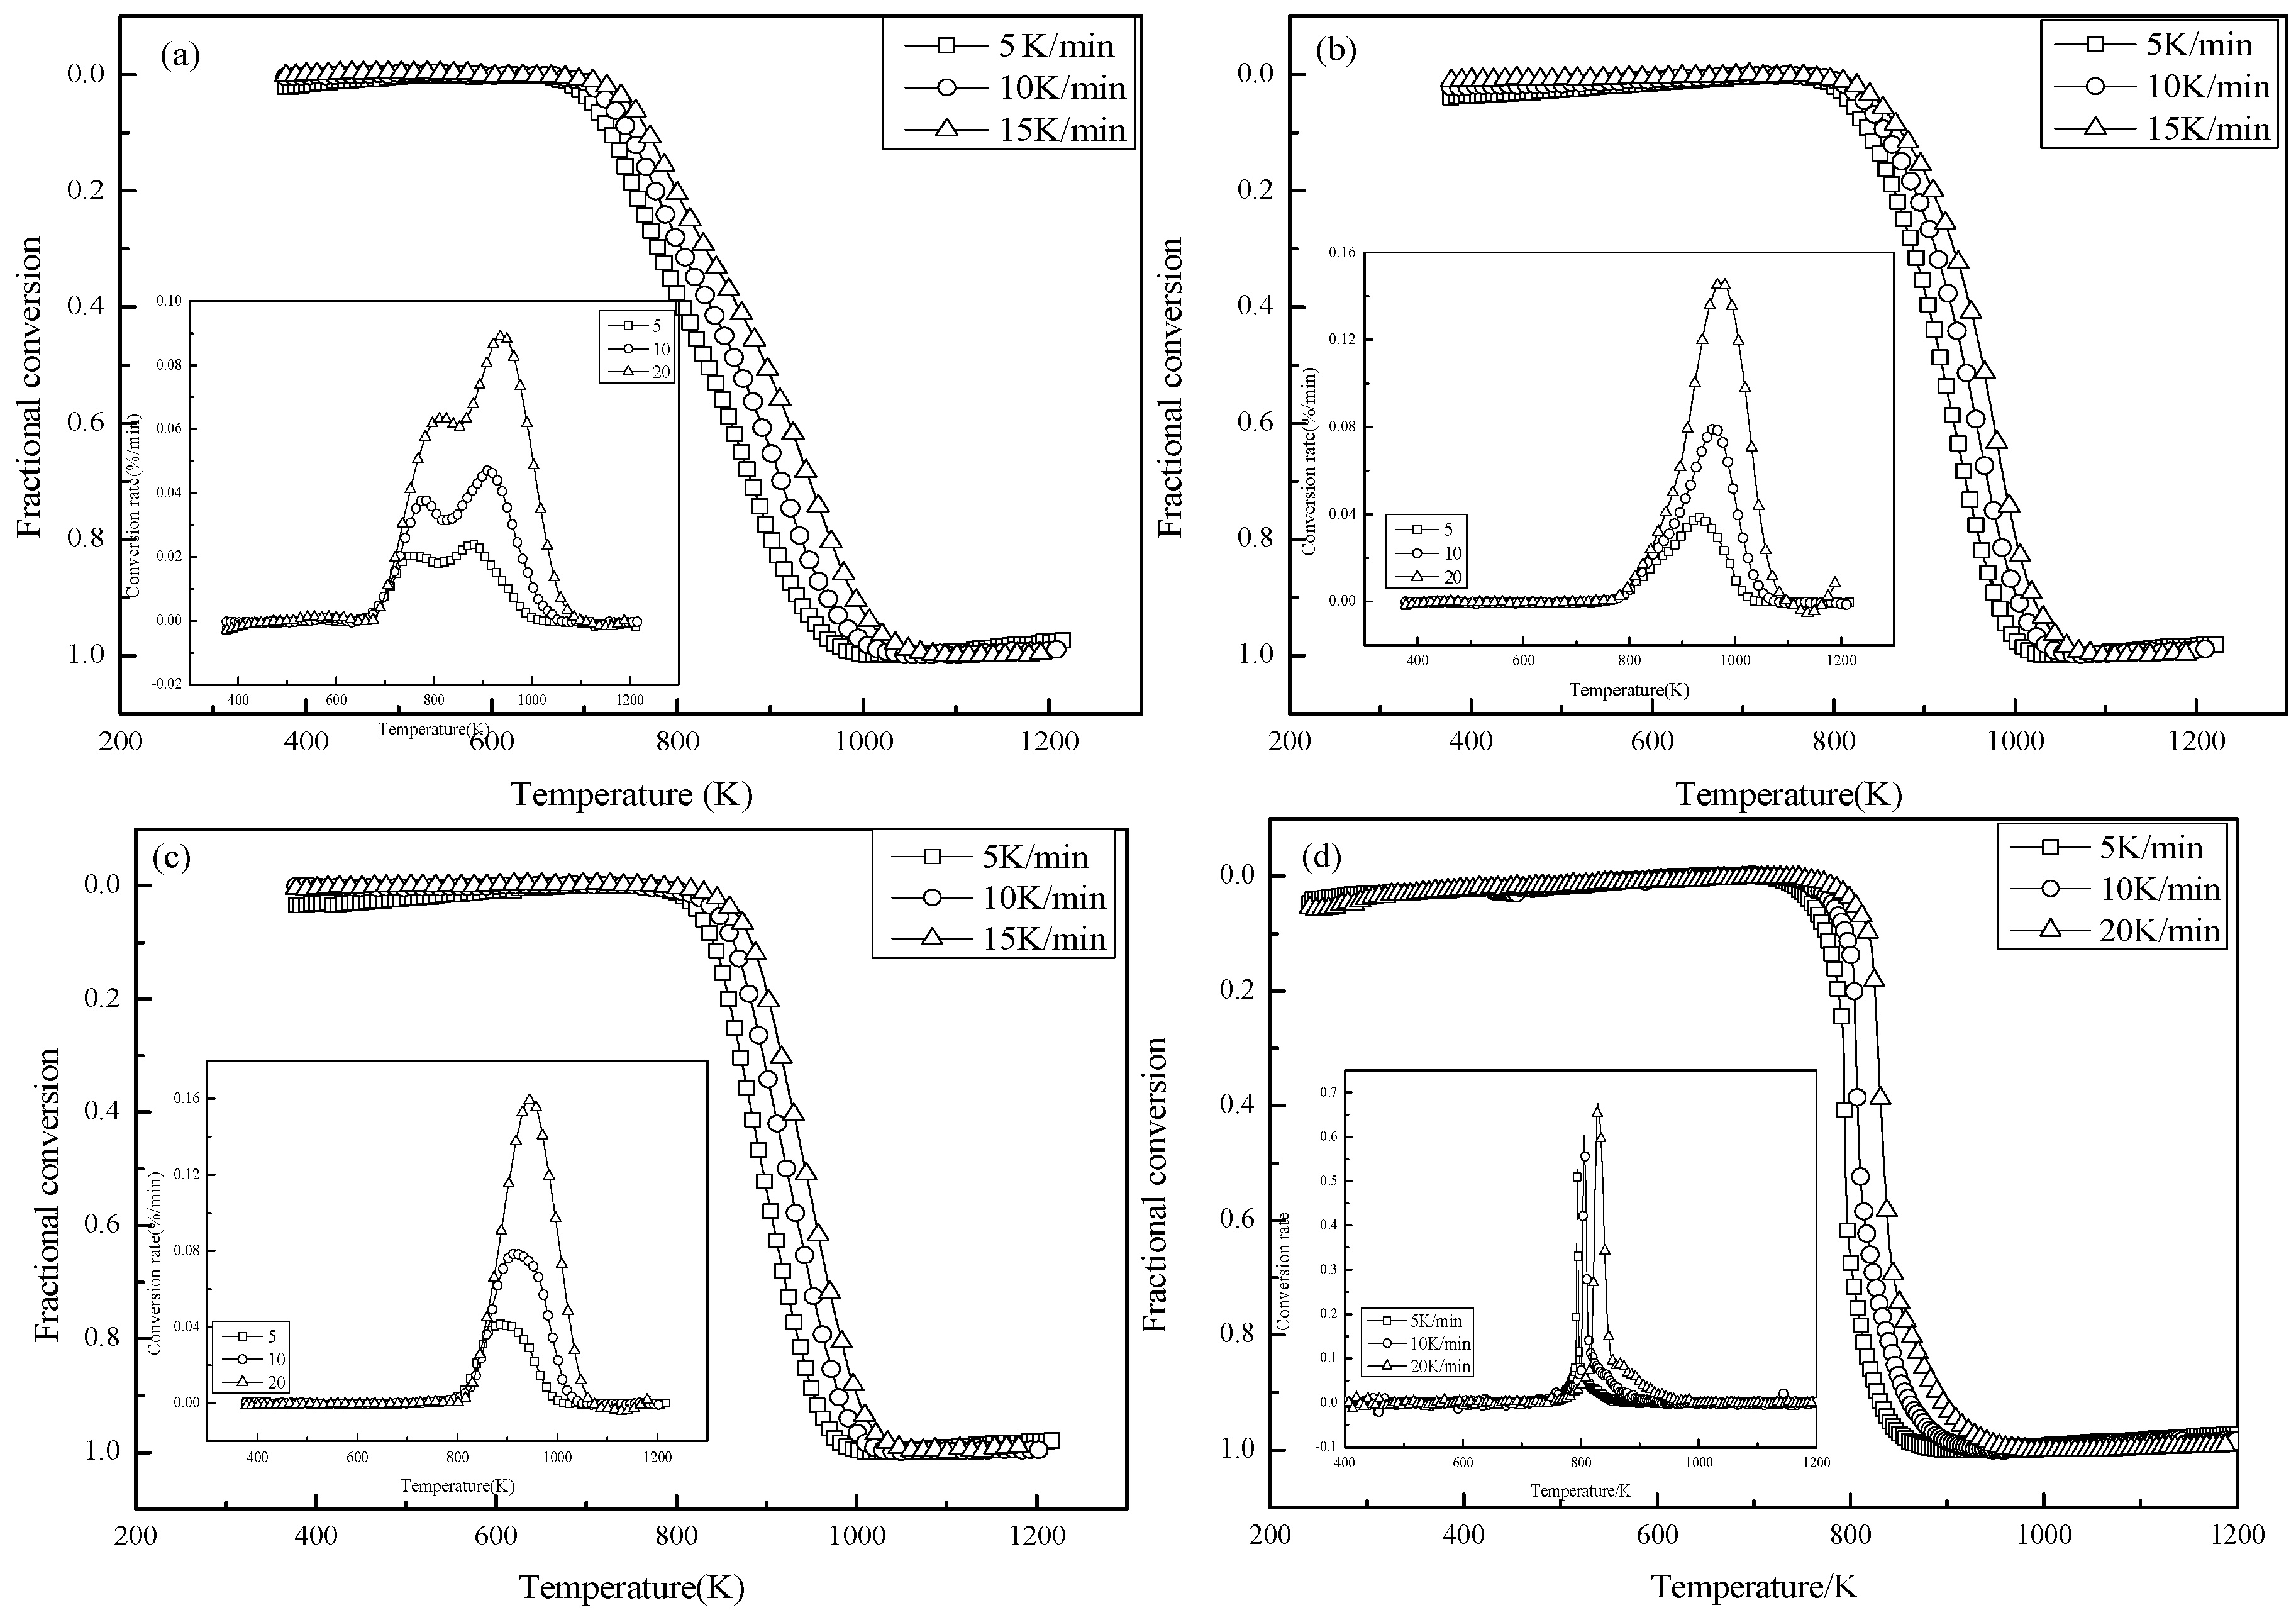
Fractional conversion curves and conversion rate curves of the RD, C-1, C-2 and CC during combustion process are recorded in time by the computer, and the results are shown in
Figure 5.
The combustion of RD samples is different from that of C-1, C-2 and CC, as shown in
Figure 5. There are two characteristic peaks at approximately 810 K and 940 K in the conversion rate curves of the RD sample, indicating that different carbonaceous materials burn in order during the combustion process. The carbonaceous materials in the recycling dust mainly consists of unconsumed CC and unconsumed coke fines, according to the petrographic analysis results. Therefore, the combustion process of the RD sample can be divided into four stages including combustion of volatile matter, CC, unconsumed coke fine and burnout process.
The combustion processes of C-1, C-2 and CC are similar to each other, and can be divided into three stages, including combustion of volatile matter, residue char and burnout process. The combustion temperature range of CC is the smallest, indicating a drastic weight loss reaction occurs due to the higher volatile matter content and smaller LC value. The carbonaceous material in the RD sample consists of unconsumed coal and coke fines according to the petrographic analysis. The specific surface area of unconsumed CC with more pores and smaller particle size is higher than that of the unconsumed coke fines. Therefore, the unconsumed pulverized coal burns first and unconsumed coke fines burns afterwards, and the combustion profiles show differences with the CC and coke samples indicating that the combustion mechanism of the recycling dust is different from that of C-1, C-2 and CC.
The characteristic combustion parameters of different samples are shown in
Table 4.
Ti of the RD is 699 K to 732 K at different heating rates and
Tb are 986 K to 1034 K indicating a larger reaction temperature range. The ignition temperatures of C-1 at the three heating rates are smaller than that of C-2, and
Tb of C-1 is 1006 K to 1057 K, which is a little higher than C-2. The reaction temperature range of C-1 is obviously narrower than that of C-2, indicating that combustion reaction of C-1 is more drastic due to less ordered micro crystalline structure.
Tb of CC is much smaller than that of C-1, C-2 and the RD, resulting smallest temperature range. The relatively narrow reaction temperature range and high conversion rate of CC, indicating a severe combustion reaction under enriched oxygen atmosphere due to higher volatile matter content and smaller carbon stack height.
Comprehensive combustive characteristic indexes (S) of all the samples were calculated according to Equation (1). The results show that comprehensive combustion characteristic index (S) of CC is one order of magnitude higher than that of the RD as well as C-1, and C-2. Because the volatile matter content of CC is about three times higher than that of the other samples, and the amorphous carbon ratio in CC is higher, so CC shows better combustion reactivity. The S of the RD is smallest among the samples, mainly due to its more ordered microcrystalline structure, which results in less active components. Combustibility of carbon is connected with degree of graphitization determined by ratio of aromatic and amorphous carbon, and larger LC value of RD indicates a higher degree of graphitization.
4.5. Kinetic Analysis
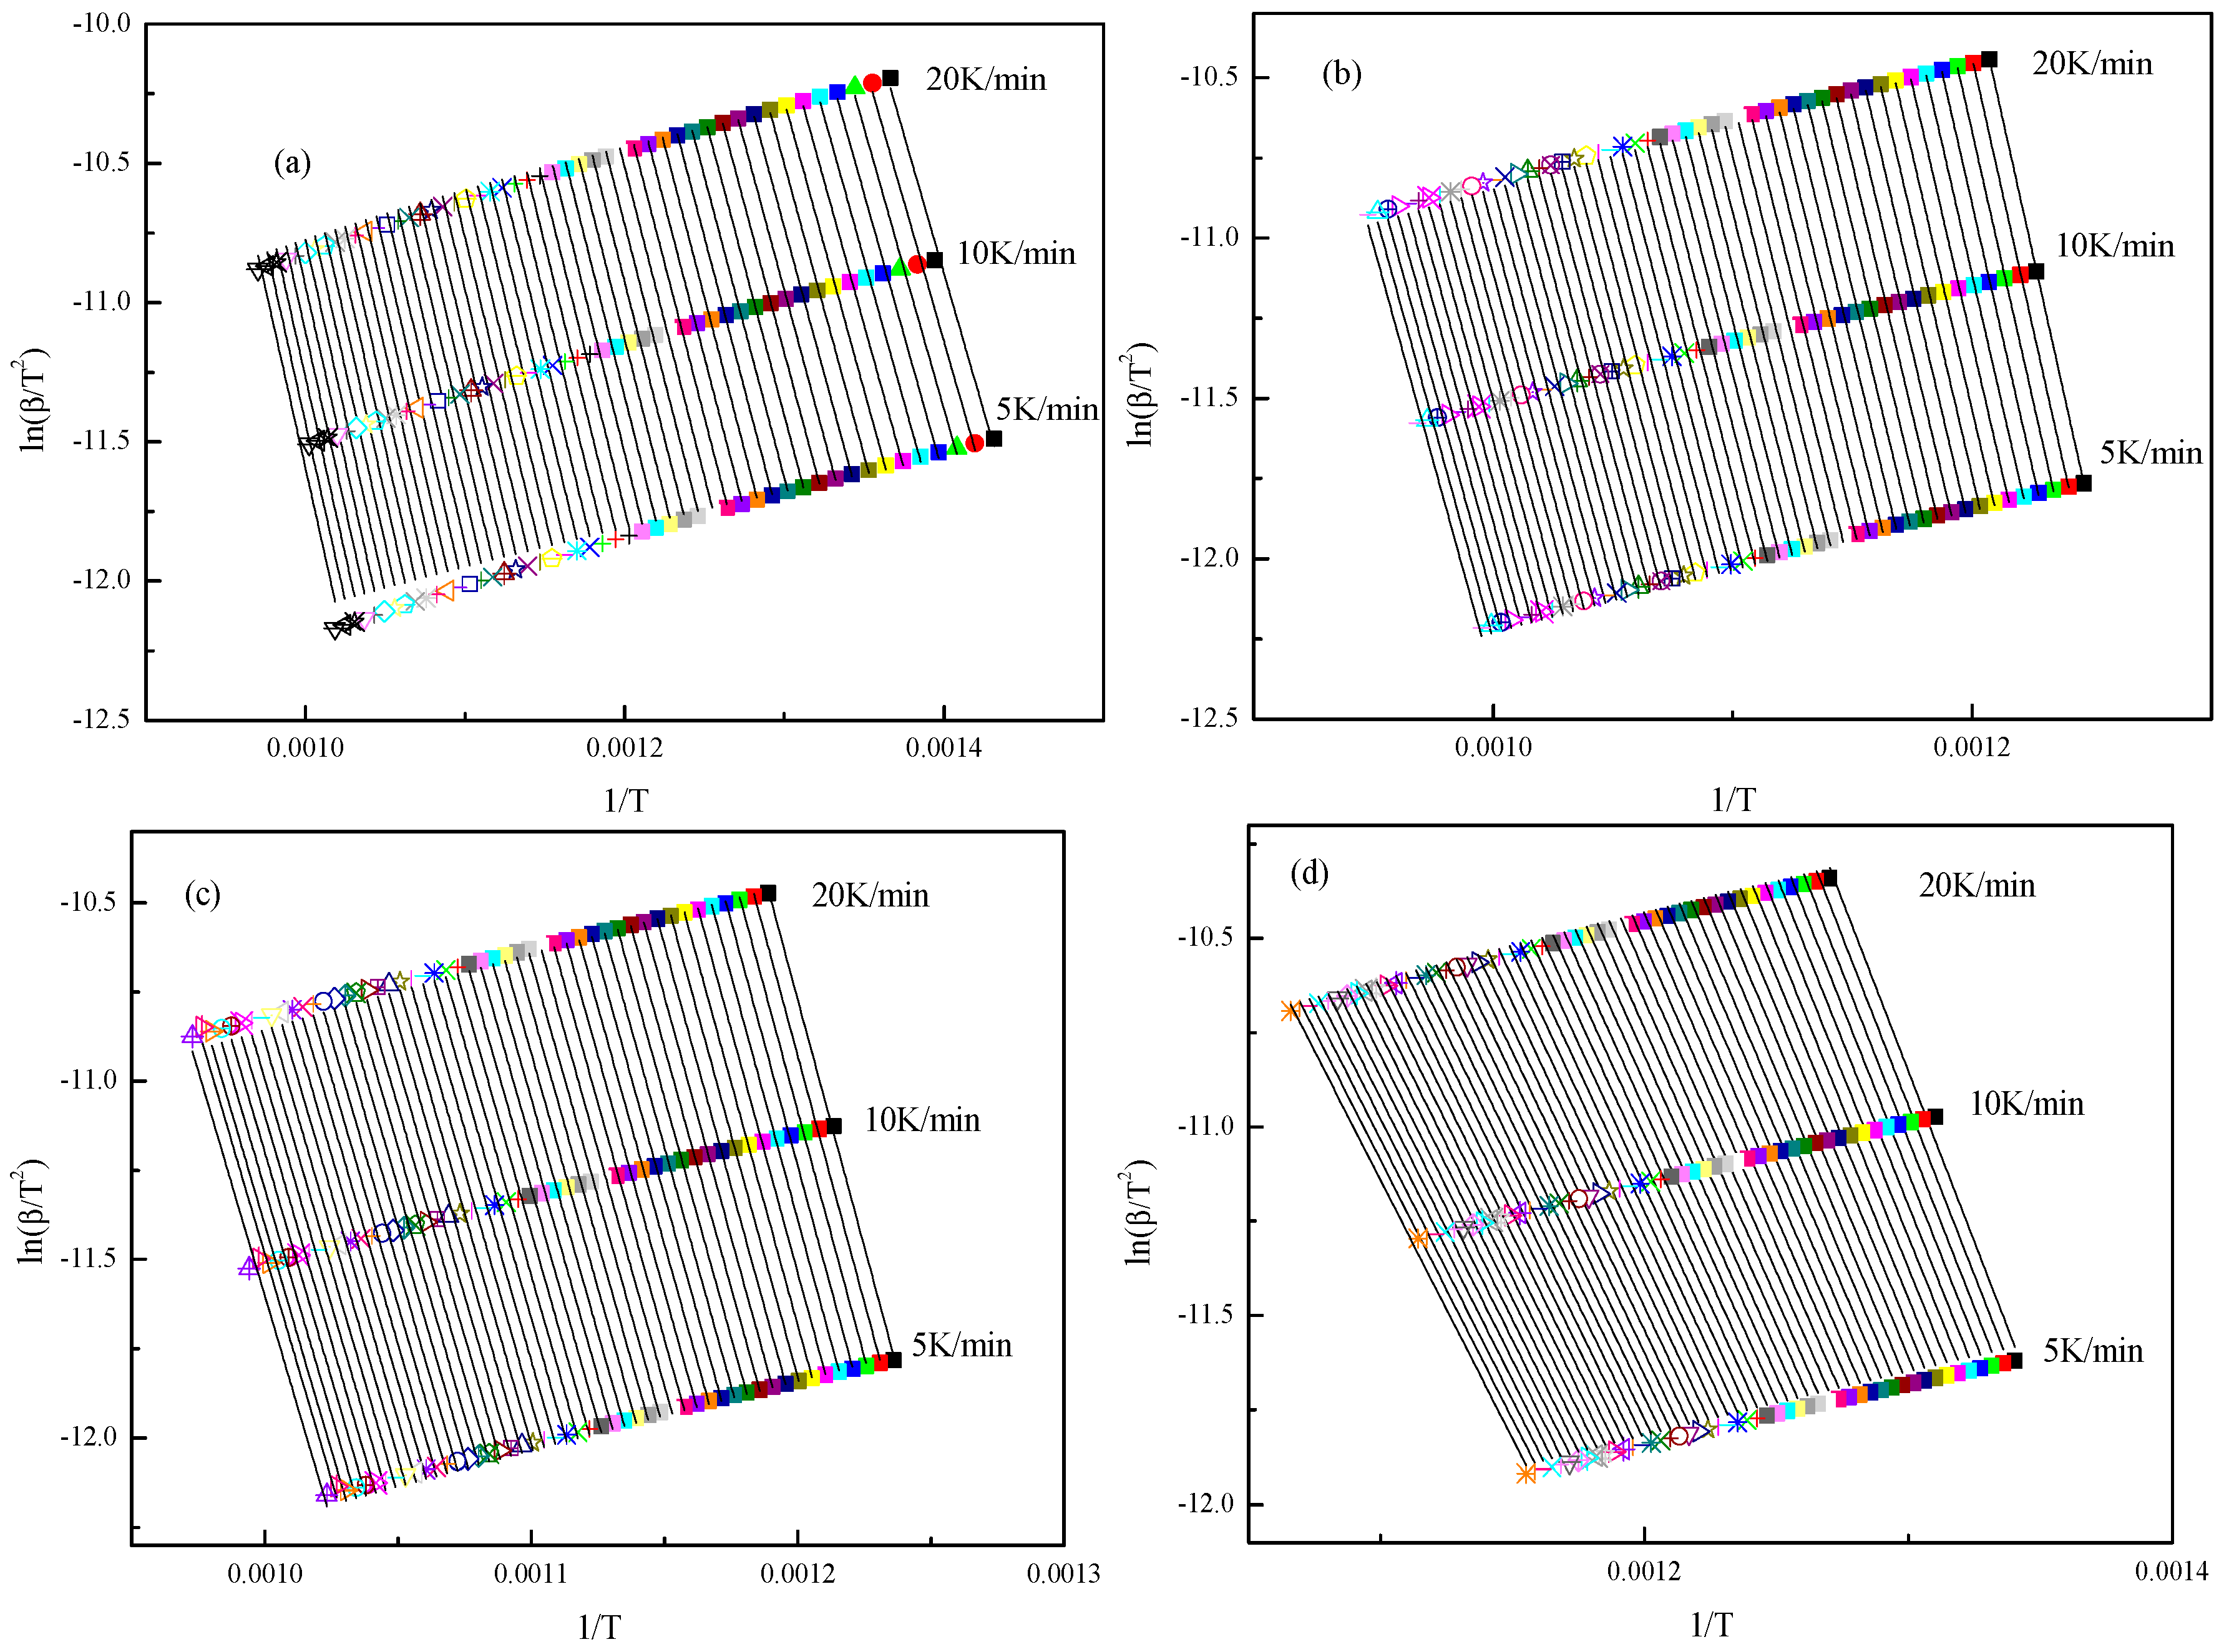
The conversion from 0.02 to 0.98 was selected to calculate the kinetic parameters with different fractional conversions at different heating rates. Activation energy and frequency factor corresponding to the fractional conversion are calculated by linear fitting, and the plots are shown in
Figure 6.
According to the plots, the results of activation energy and frequency factor for various carbonaceous material are obtained. The average activation energy of combustion process of the RD, C-1, C-2 and CC are 191.84 kJ/mol, 243.60 kJ/mol, 217.77 kJ/mol and 128.31 kJ/mol, and the corresponding frequency factors are observed to be in the order of 10
8, 10
13, 10
10 and 10
4 s
−1, respectively. The activation energy of CC ranges from 95.15 kJ/mol to 169.99 kJ/mol during combustion process with oxygen content ranging from 21% to 100% according to Zhang et al. [
29] using Flynn-Wall-Ozawa method. Activation energies reported in literature are lower than the results in this study. This could be attributed to the pyrolysis treatment used for CC in this study, which is treated at 1473 K for 30 min, and the more ordered carbon structures of C-1, C-2 and the RD.
It can be inferred that the average activation energy of the RD is higher than that of CC and lower than that of C-1 and C-2, and the corresponding frequency factor is much smaller than that of C-1 and C-2. Activation energy expresses the energy needed for activation of molecules, and the frequency factor stands for the effective collision chances for a molecule. Although the activation energy of the RD is smaller than that of C-1 and C-2, the frequency factor is much smaller, which is the main reason for the smaller comprehensive combustion characteristic index of RD compared to that of C-1 and C-2. The activation energy and frequency factor of CC are smaller than that of C-1 and C-2, and the comprehensive combustion characteristic index is larger. On the one hand, the volatile matter content of CC is higher than that of the RD, which benefits the combustion reactivity. On the other hand, the RD includes different carbonaceous materials, which influence the combustion reactions together during combustion process. The combustion mechanism of the RD is different from that of CC, C-1 and C-2, and there does not exist an exactly corresponding relationship between activation energy and comprehensive combustion characteristic index for the RD.
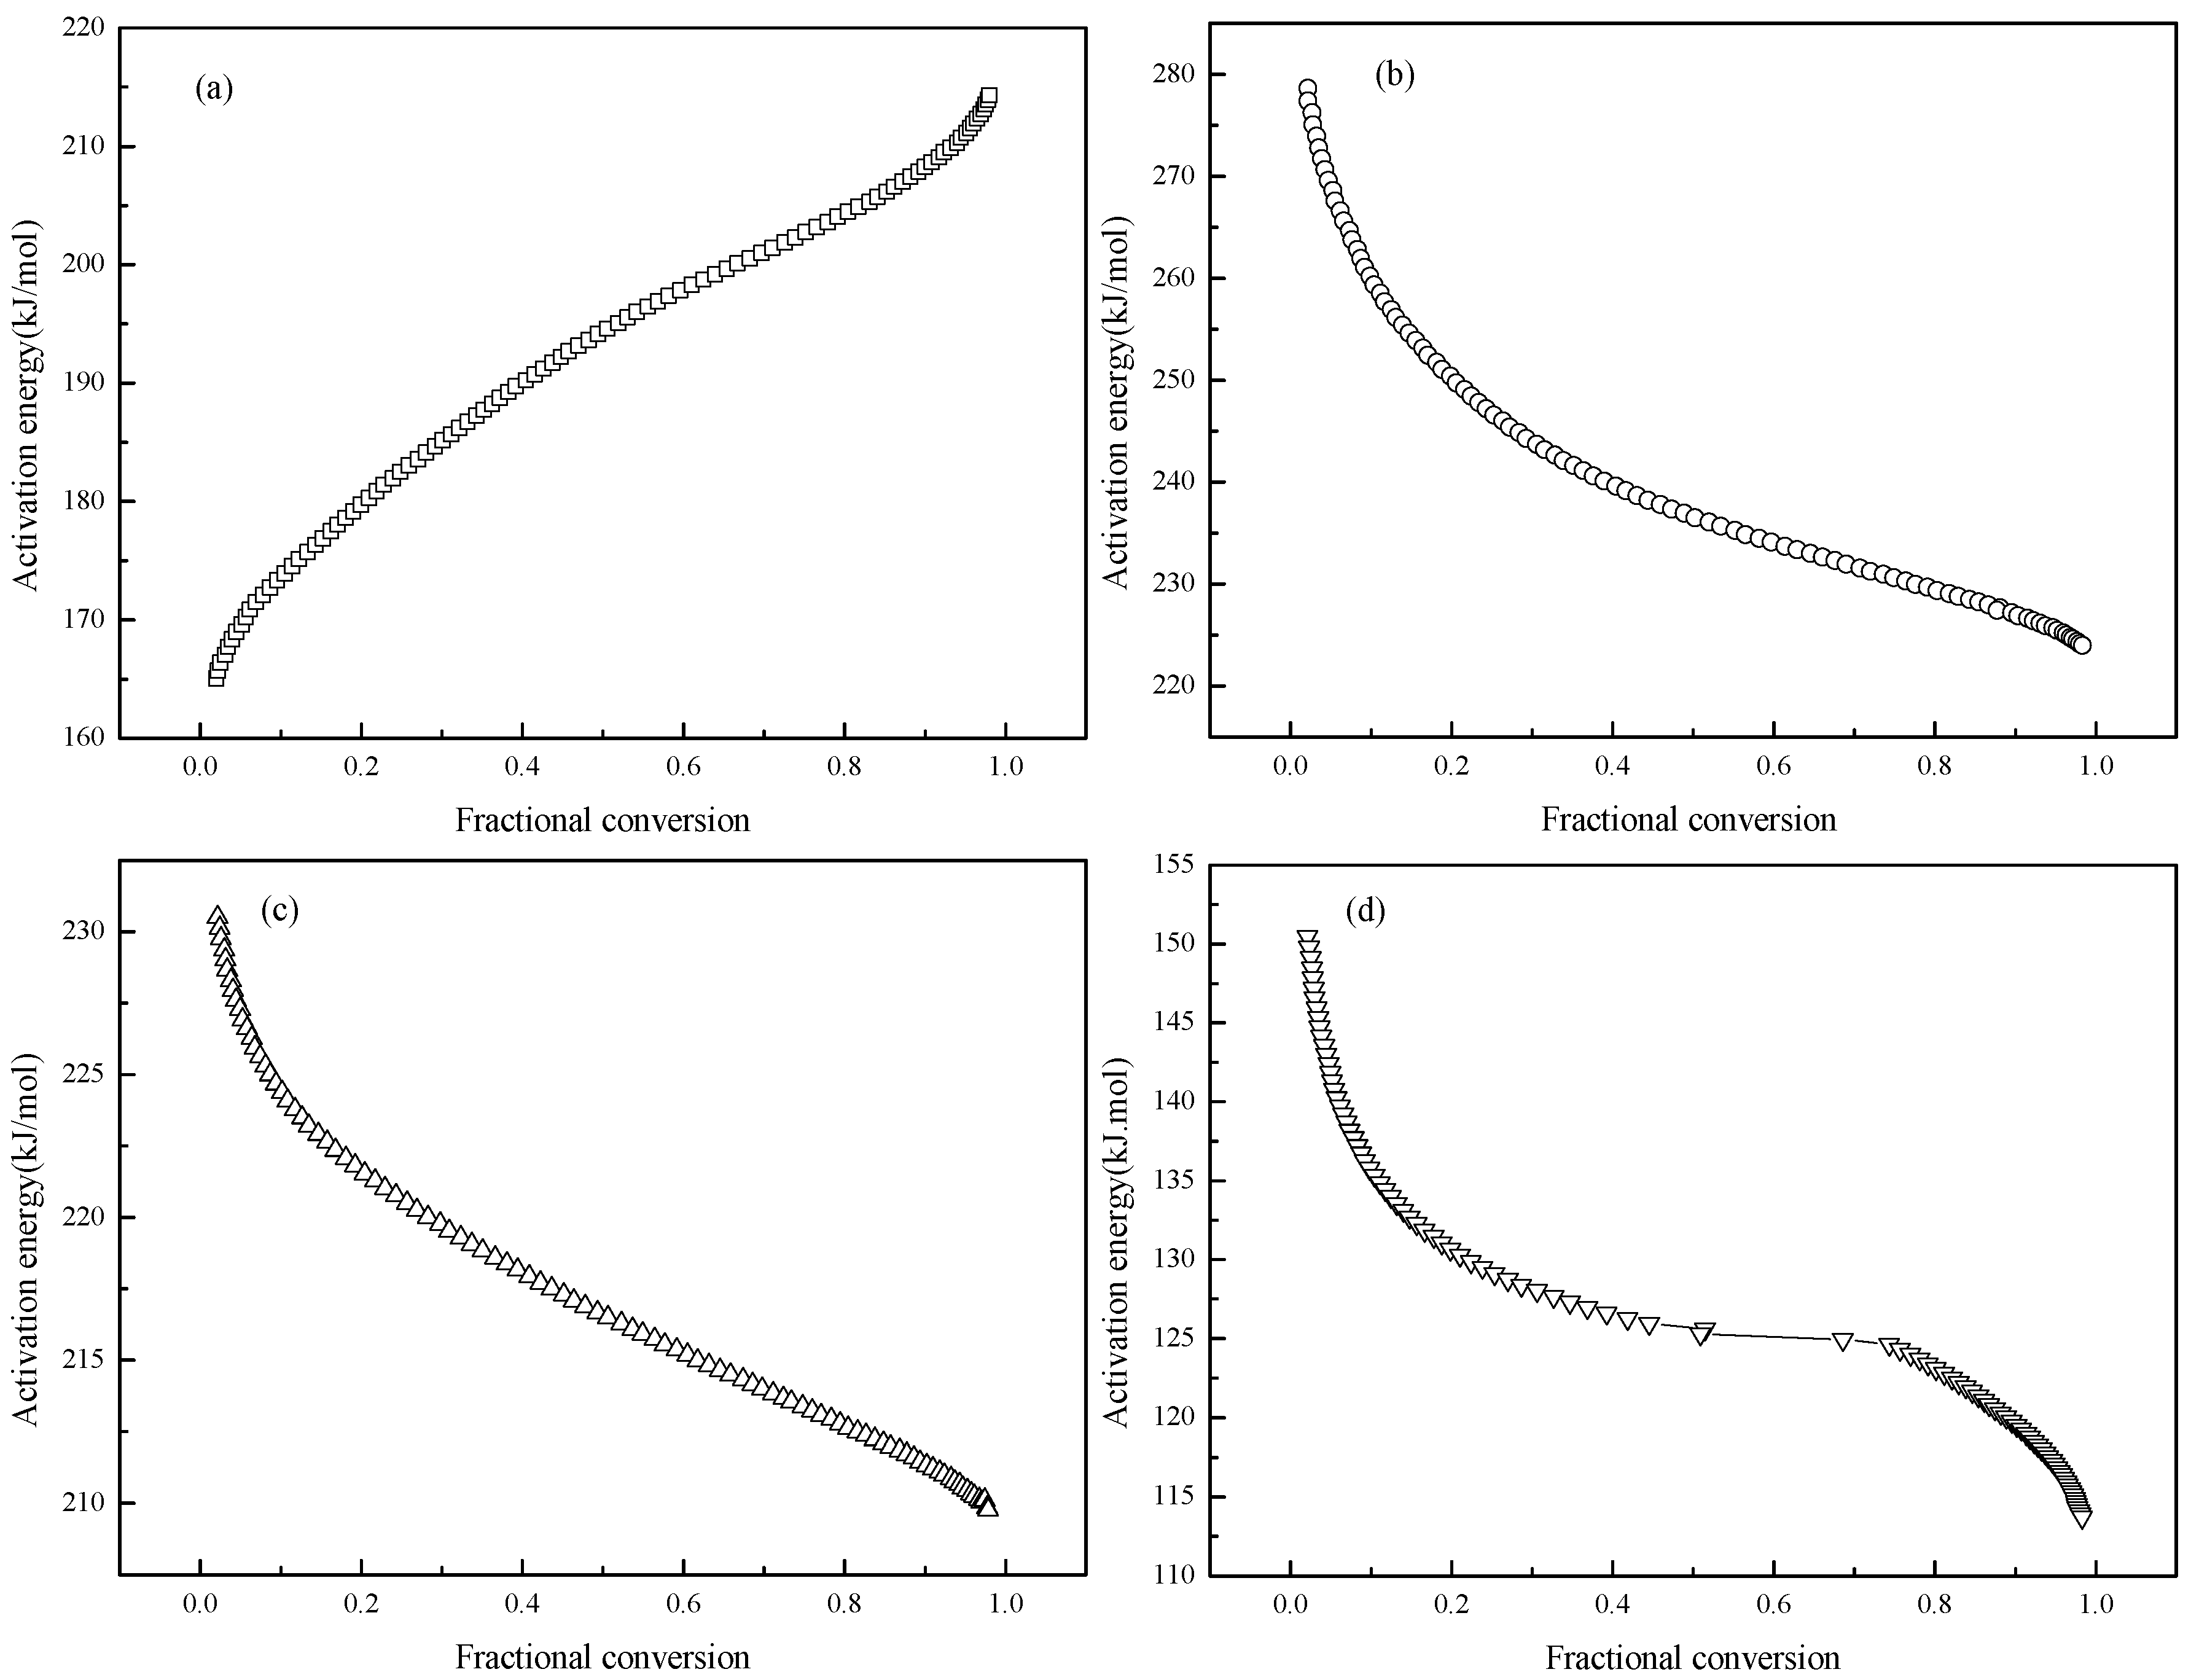
In addition to the average kinetic parameters, the distributed activation energy curves were shown in
Figure 7. Each reaction step of the conversion has a corresponding activation energy throughout the combustion process. The activation energy of the RD increases with increasing fractional conversion from 0.02 to 0.98, which is different from that of C-1, C-2 and CC. The activation energy of other samples tends to decrease with increasing fractional conversion, and there exists a transitory stage for CC when fractional conversion increases from 0.4 to 0.75. The various distributed activation energy curves indicate different mechanisms for carbonaceous materials from various origins.
At low temperature ranges, the combustion reaction of CC is controlled mainly by chemical reactions, while diffusion tends to control the combustion reaction with increasing temperature according to Wang et al. [
30]. The activation energy in the chemical reaction controlled process is higher, and it tends to decrease in the diffusion controlling process which appears at higher temperatures.
The combustion of CC, C-1 and C-2 are typical reactions controlled by chemical reactions in the low temperature range and by diffusion at a higher temperature range according to unreacted core model [
31]. Therefore, the activation energy of CC, C-1 and C-2 tends to decrease with increasing fractional conversion. However, RD samples consist of complex carbonaceous materials, which burn in order but not completely independently, and there exists an interaction effect between carbons of different origin. Carbonaceous material with high reactivity in the RD burns first, followed by carbon with low reactivity. Combustible components decrease with increasing fractional conversion, and the reaction difficulty tends to increase gradually, which is the main reason that the activation energy of RD increases with conversion increasing.
5. Conclusions
The carbonaceous material in the recycling dust originates from unconsumed CC and coke fines, and the mass ratios are about 3.16% and 19.34%, respectively. The more ordered carbon structure of carbonaceous materials in the recycling dust results in poor combustion reactivity, which can be seen through the comprehensive combustion characteristic index results. The combustion mechanism of the recycling dust is different from that of C-1, C-2 and CC, and there are two characteristic peaks in the conversion rate curves of the recycling dust at different heating rates. The kinetic parameters are calculated using DAEM, and the average activation energy of the recycling dust is 191.84 kJ/mol with a corresponding frequency factor on the order of 108 s−1. The activation energy of the recycling dust increases with increasing fractional conversion, however, the tendency for C-1, C-2 and CC is regularly the opposite. The different tendency indicates different combustion reaction mechanisms. Simulated calculation is one of the valid methods to provide design and optimization directions for complex reactors in recent years. The investigation of the combustion characteristics and mechanism of the recycling dust could provide theoretical support for determining the parameters to be used for simulated calculations of dust burners.


