1. Introduction
As the energy crisis and climate deterioration become increasingly serious problems, PHEVs have been regarded as one of the research focuses for how to reduce petroleum demand and exhaust emission. In order to improve the fuel economy of the vehicle, a wide range of optimal control methods has been proposed to solve the energy management problem of PHEVs. Examples include rule-based control [
1], deterministic dynamic programming [
2], stochastic dynamic programming [
3], the equivalent consumption minimization strategy (ECMS) [
4], Pontryagin’s minimum principle [
5] and model predictive control [
6]. Furthermore, many intelligent optimization algorithms have been used for solving the energy management control problem recently [
7,
8]. The control objectives of these optimal strategies for general hybrid electric vehicles (HEVs) are usually the performance of fuel and electricity consumption [
1,
4], drivability [
9] and emissions [
7,
10].
For PHEVs, recent studies have shown that the cost of the whole vehicle is highly sensitive to battery health. Compared with the conventional HEVs, the characteristics of PHEVs are the wide range of SOC changes and repeated charging/discharging of the battery. A large depth of discharge (DOD) and frequent use can accelerate the battery aging [
11]. It is generally known that the batteries with high capacity are usually expensive, and the costs of batteries occupy a large proportion of the total costs of vehicles. Because the commuter vehicle normally has to work for a long time, often more than 10 years, and the premature failure of battery will add an additional expenditure, the battery replacement cost is important to the vehicle economy. Accordingly, the equivalent cost of battery health degeneration must be considered in the long-term operation of the vehicle [
12]. Moreover, when the battery life is attenuated to a certain extent, the performance of the battery will be changed. This could lead to different results in the energy management and even may cause the pre-designed controller to fail to achieve the desired target [
13]. This indicates that if one wants to achieve economic feasibility for PHEVs, battery health cannot be ignored. Therefore, battery health-conscious energy management in PHEV is becoming a new hotspot. A life evaluation model of battery under different driving conditions is given by Lunz et al. [
14], in which the influence of different SOC on the battery’s capacity decline also has been studied. An optimization-oriented model integrating vehicle simulation, battery degradation dates and driving cycle data is developed by Shiau et al. [
15] for minimizing battery cycle life cost, fuel consumption and exhaust emissions. Additionally, in order to reduce the total daily consumption of PHEVs, a new convex programming is proposed by Hu et al. [
16] to optimize charging, on-road power management and battery degradation mitigation. In [
17] the state of battery health (SOH) is also taken as a state variable in the control problem, and two separate controllers, SOC controller and SOH controller, are designed to maintain SOC and SOH in the desired states. A hybrid energy storage system with an ultracapacitor is usually considered to prolong battery life. To extend the life of the battery, Akar et al. [
18] proposed an energy management control strategy based on fuzzy logic rules to control the hybrid energy storage system, which is equipped with multi-input converters. Additionally, with the consideration of the effect of temperature on battery health, the thermal management of the battery is taken into account in the energy management control strategy in [
19]. Reducing the damage to the health of the battery can be achieved by controlling the battery temperature during the operation of the vehicle. Additionally, in order to predict the dynamics of the battery cell more accurately, reduced electrochemical battery models are proposed. Based on these models, the optimization control strategies with the consideration of battery health are developed. The several representative methods are as follows: the charge pattern optimization for energy cost and battery longevity by Bashash et al. [
20] and the energy management with consideration of battery health on stochastic drive cycles by Moura et al. [
21]. A weighted ampere-hour throughput model based on the severity factor is built by Onori et al. [
22] to estimate the battery life, which is used in PHEV. On the basis of this model, an optimal control-based energy management strategy is presented by Tang et al. [
23] to minimize fuel consumption and the wear of the battery.
It is obvious that limiting the lifetime degradation of the battery will result in a negative impact on reducing the energy consumption, which means there is a balance between energy economy and battery health. In this paper, we mainly concentrate on the distribution of power between the engine and electric machines for a commuter plug-in hybrid vehicle with the consideration of energy consumption and battery health. Firstly, a semi-empirical model of battery health is given. This model is obtained by a curve fitting tool from experiential data. Next, the energy management problem is solved offline by SDP and PSO based on the real historical traffic data. The Pareto optimal set will be obtained while solving the multi-objective optimal problem with different weight coefficients between energy consumption and battery health via SDP. Then, PSO is used to find the weight coefficient, which is the best compromise between the two objectives to achieve the economy and find out the best control strategy ensuring the vehicle optimal economic performance. Furthermore, it should be noted that the obtained offline optimal control strategy including the weight coefficient and the control policy of the power-demand-split is not static constant, but a state-feedback type, namely mappings of battery SOC, power demand and road information, and then, in the online implementation, the control strategy is generated by quickly looking up these mappings according to the current system operating states.
The remainder of this paper is organized as follows. In
Section 2, the PHEV model is described, which includes the powertrain model, battery model and drive cycle model. In
Section 3, the optimal control problem is formulated and is solved. The simulation results and simulation analysis are given in
Section 4. Finally,
Section 5 summarizes the conclusions of this paper.
3. Optimal Control Problem Formulation and Its Solution
According to the objectives and the models described previously, the control-oriented model can be represented by:
where
x is the state variable, the battery SOC,
.
u is the control variable, the generator speed and the motor torque
.
w is the external disturbance, the average vehicle speed
, which has identical statistics in each segment. Additionally,
, where
are finite sets and
.
Moreover, with the consideration of the feature of stochastic dynamic programming, the battery dynamics equation can be written in discrete form as Equation (
20). Additionally, it should be noted that the discretization is based on a small distance
.
Due to the two control objectives, minimizing energy consumption and minimizing battery health damage, the cost function can be formed as:
where
is a discount factor whose value is between zero and one. Additionally, the cost functional
g consists of two parts, energy consumption cost
and the effective Ah-throughput
described as Equation (
22). Energy consumption includes the fuel cost and the electric cost, which are traded off by
.
where
is the coefficient that translates the electric cost to fuel cost at the same price.
is the weight that combines two objectives.
represents the target energy consumption when only the energy consumption is considered. To explain in detail,
is the optimal value, which is solved by the SDP algorithm with no consideration of battery health, in other words, the weight value
is zero. That is to say,
is the best value that can be reached in only energy consumption optimization, so it can be used for normalization. Additionally, in the same way,
is the target Ah-throughput with only the consideration of battery health.
is the fuel flow rate, which is shown in Equation (
7). Additionally, owing to the characteristic that the PHEV can be charged through an external power grid, electricity economy should also be taken into account in the control objectives besides the fuel economy. Electricity economy can be evaluated by the instantaneous power
, which can be described as:
In addition, the energy management satisfies the constraints on the states and control actions, which correspond to physical limits.
Furthermore, the policy iterations of the SDP and PSO algorithms are used for the optimal solution in this paper. When solving this multi-objective optimal problem via SDP, the Pareto set will be obtained by sweeping different weights between energy consumption and battery health. Additionally, in order to achieve the best economy, PSO is used for finding the weight coefficient that can be the best compromise between these two objectives. Specifically, the multi-objective optimization solution is obtained offline by the dynamic loop nest optimization of PSO and SDP based on the driving cycle model established in
Section 2.3 utilizing the real historical traffic data. Because the established driving cycle model of the commuter PHEV has statistical characteristics, the whole commuting route is divided into eight segments according to the same probabilistic characteristics. Consequently, the energy management strategy of the whole route is composed of different management control strategies of eight different segments. The optimal management control strategy for each segment, including the weight coefficient and the control policy, is obtained by PSO and SDP based on the driving cycle model corresponding to the segment. In each segment, SDP optimizes the control policy, and PSO optimizes the weight coefficient of the objective function, which is important for calculating the optimal management control strategy because the results of the SDP optimization will be different with different weight coefficients
. When the weight coefficient
, the result of SDP is the optimal management strategy considering only fuel consumption. In the same way, when
, only battery life is considered. These two results are contradictory, so in order to achieve the optimal result, the PSO algorithm is used to find the appropriate
to balance. The flowchart showing the entire optimization process with SDP and PSO is shown in
Figure 7, in which the specific SDP and PSO algorithms first are presented as follows.
The SDP problem solved by policy iteration is framed as a stochastic optimal problem with infinite horizon (
21) and (
22). In order to make the energy management problem suitable for computer calculations, the discretization of the state variable, control inputs and cost function are given in Equations (
19)–(
22). The policy iteration algorithm consists of two main steps, policy evaluation and policy improvement. The two steps are successive and repeated iteratively until they converge to the best policy. The policy iteration is given in detail as follows.
Firstly, an initial policy is guessed.
In the policy evaluation step, the cost function
of the given control policy
is calculated by:
where
I is the identity matrix.
and
are the probability and cost for the given policy
, which is defined by the following forms, respectively.
where
is the one-step transition probability from state
i to the next state
j and
is the cost of each stage, which can be calculated by the following equations.
where
D is the finite set of the stochastic disturbances with identical statistics.
represents the set of random disturbances, which can move the state from
i to
j by the control policy
. Additionally,
is the cost of moving the state from
i to
j by
.
Then, proceeding to the next step, the policy improvement step, a new control policy
for the stochastic control problem is obtained, which satisfies the following equations.
where:
In this paper, the PSO algorithm with the fitness function defined as (
21) and (
22) is used to choose the best tradeoff coefficient between two objectives. In the PSO algorithm, a group of random particles first is initialized. Then, the optimal result is searched iteratively, and in each iteration, particles update themselves constantly by tracking two extreme values, the individual extremum (
) and the global extremum (
). More concretely, through solving the SDP algorithm with the weight value
, which is represented by the current particle individual extremum, the best performance,
, is calculated by Equation (
22). Obviously,
is the minimum value of all
. The update operation is the core of the PSO algorithm, and the principles of velocity
update and position
update are presented as:
with:
with:
where
t represents the iteration step.
and
represent the velocity and position of the
i-th particle in the
t-th step.
are the acceleration factors, which usually are chosen as positive constants, and
are random numbers between zero and one.
,
and
,
are the maximum and the minimum of
and
. As the particles represent the weight coefficients in Equation (
22), the following settings are given:
,
,
,
. It should be noted that
is the inertia weight, which will be explained below.
In order to balance the global search ability and local improvement ability of particle swarm optimization, a dynamic inertia weight as Equation (
30) is used in this paper. When the fitness value is greater than the average fitness of all particles, the maximum inertia weight is selected to strengthen the global search capability. Once the fitness value is no longer large, the nonlinear dynamic inertia weight is selected according to the current fitness and the average fitness.
where
and
represent the maximum and the minimum of
, respectively. Typically,
and
.
f is the current value of the particle.
is the average value, and
is the minimum value of the current iteration step.
From
Figure 7, obviously,
is very important in the SDP iteration to obtain the optimal strategy, and Equation (
22) is used to calculate
. The particles that represent the different weights are updated by PSO, and SDP problems are solved with these particles, respectively. The optimal control policy
and optimal cost
are obtained, and
is also the individual extremum of the
i-th particle. A global extremum can be found by updating the particles to find the optimal compromise weight coefficient in each segment; the corresponding optimal policy solved by SDP is the final solution expected, the power-split. Accordingly, the weight coefficient
optimized offline by PSO is a parameter in each segment, but in the whole route, it is a mapping on the different road traffic segment. The final control policy optimized offline by SDP is a static state-feedback type on battery SOC in each segment, but in the whole route, it is a 2D-mapping on SOC and different road traffic segments. That is to say, the obtained energy management strategy in the whole route is optimized offline by PSO and SDP and is formed as mappings on the different road information, battery SOC and power demand based on the real historical road traffic data. These mappings will be embedded in the energy management control system of PHEV in actual operation, and the management control strategy is generated online by looking up the mappings according to the current system states such as SOC, power demand and road information.
4. Simulation Results
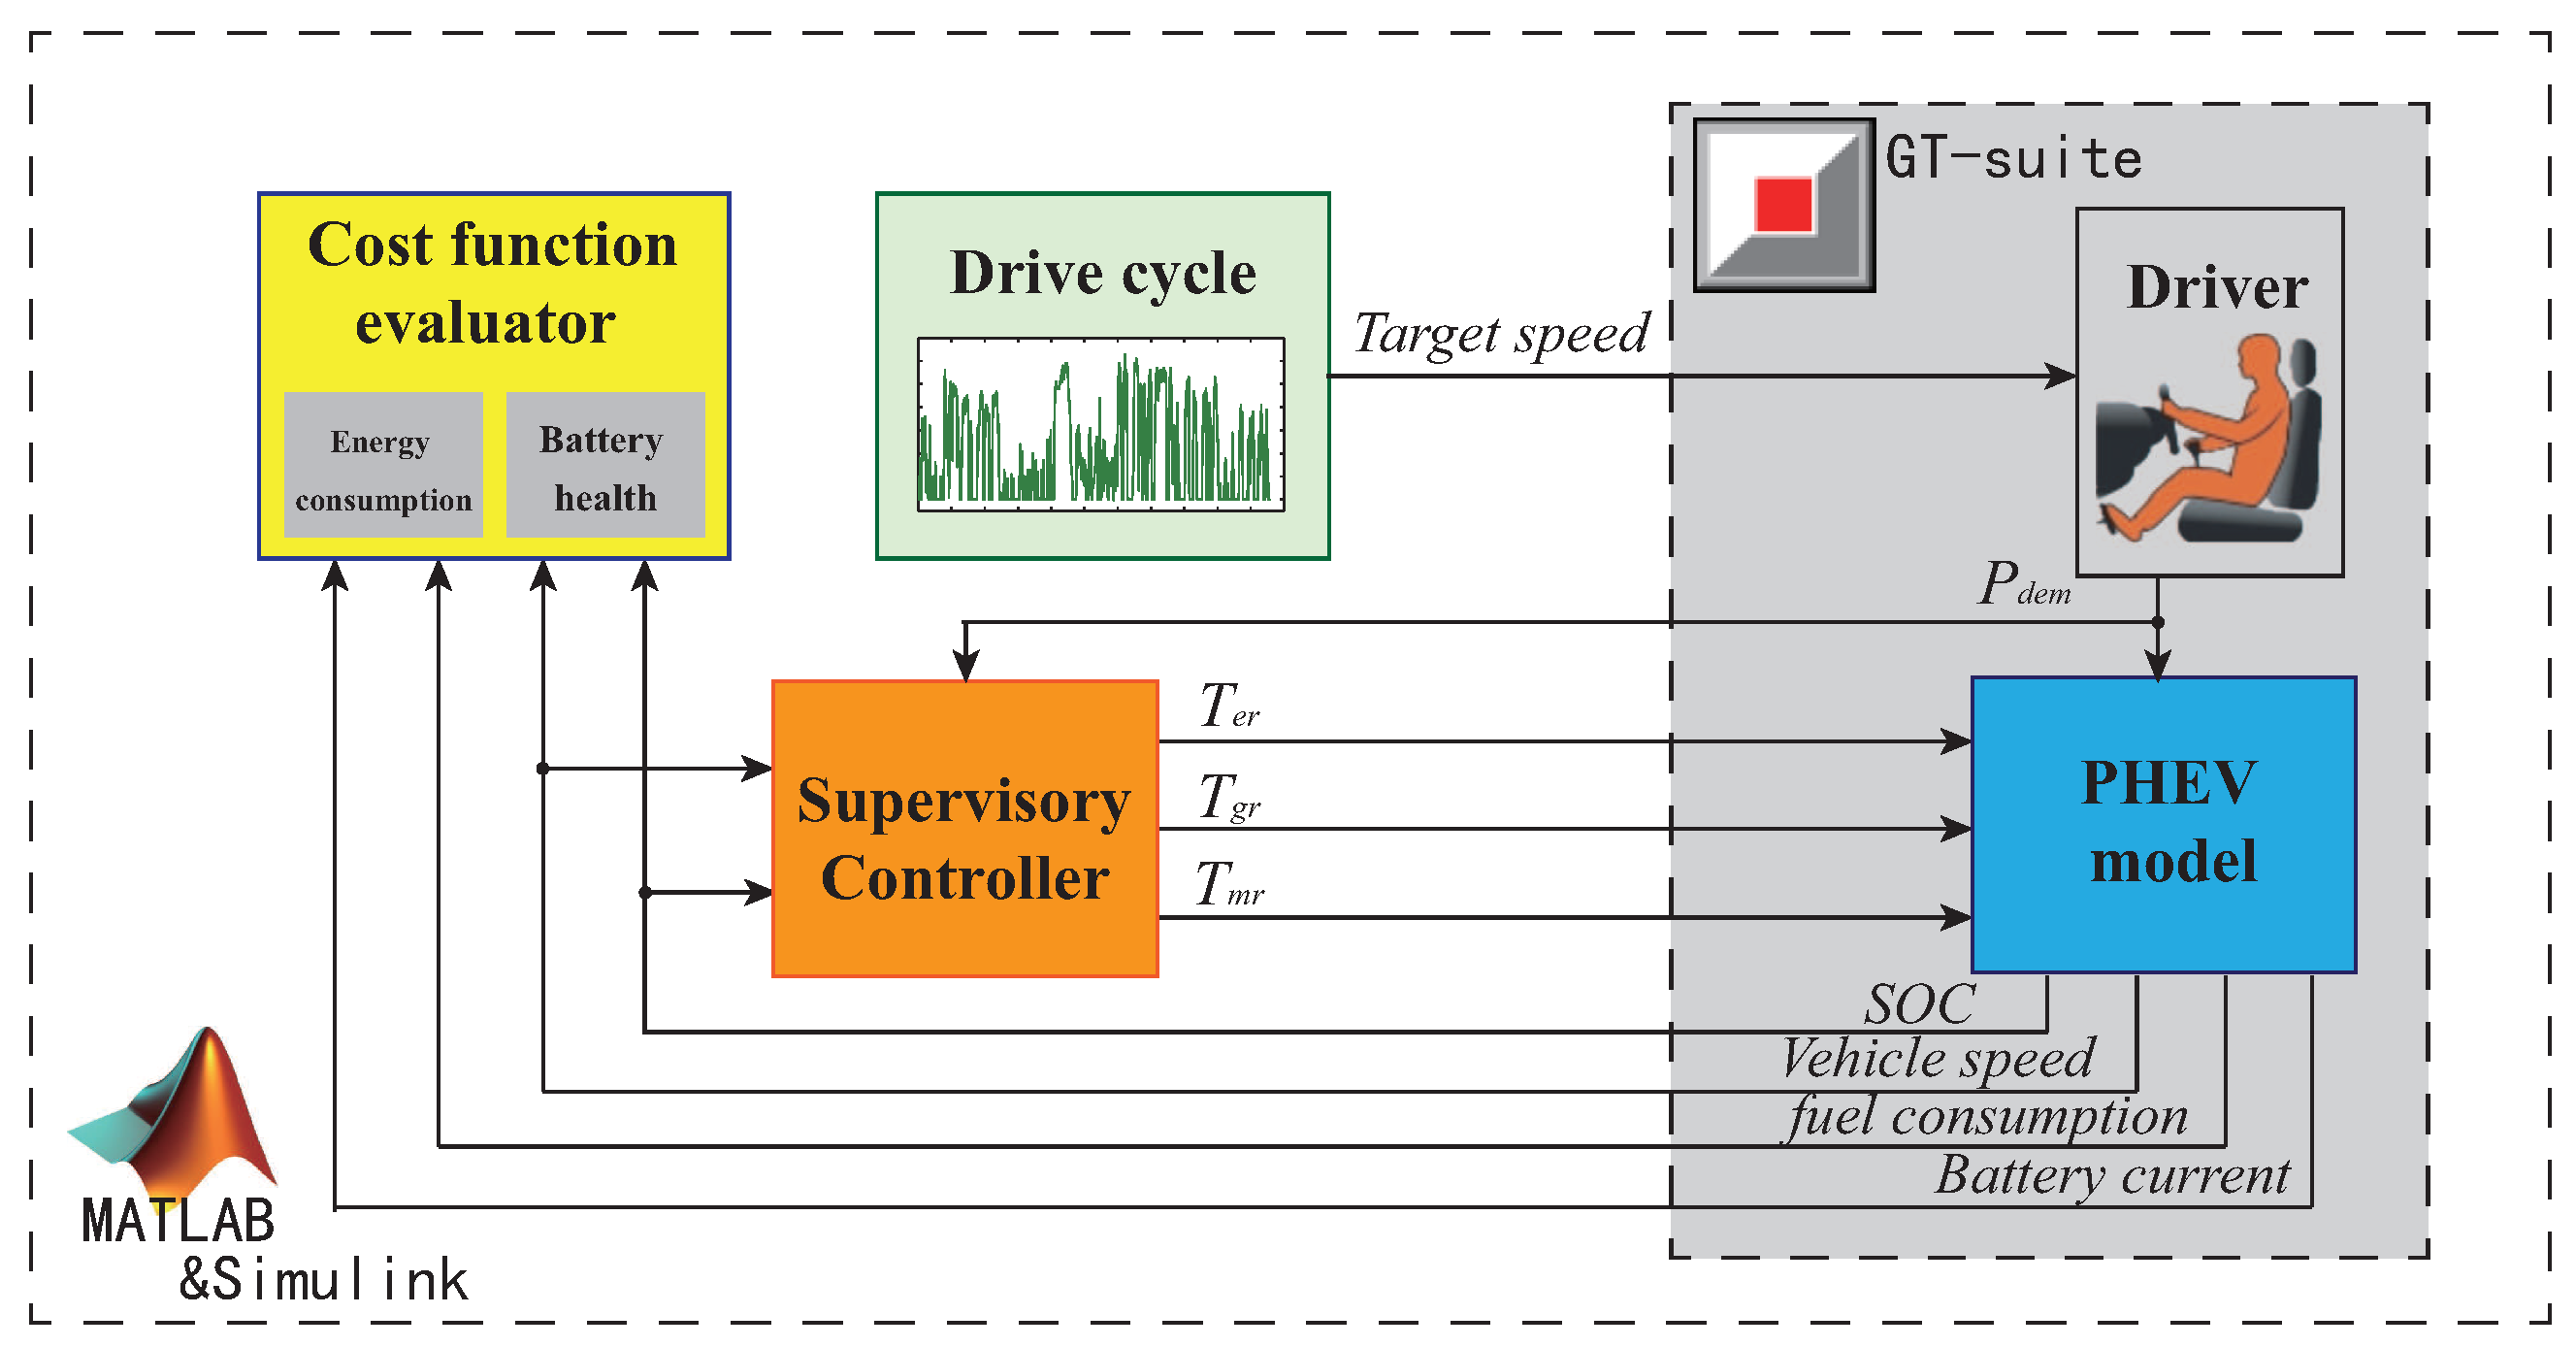
The GT-SUITE-based PHEV simulator is used to verify the effectiveness of the presented energy management strategy achieving the control objectives. The PHEV model described in
Section 2 is a control-oriented model, but the model in the GT-SUITE PHEV simulator is further detailed in order to simulate the real vehicle powertrain more realistically. The PHEV system with supervisory controller in the simulation is constructed as shown in
Figure 8. Additionally, the parameters and specifications of model components are the same as in
Table 1 [
24].
PHEVs, which are different from traditional HEVs, have a large SOC range when they work. In this simulation, the battery SOC range in the simulation is chosen as 0.3–0.9. Hence, the initial SOC of the vehicle each day is 0.9. In order to ensure the physical limits, in the real-time simulation of the proposed energy management strategy, the reasonable rules are joined into the supervisory controller besides the map, which are calculated by the SDP algorithm. Therefore, the supervisory controller consists of two parts: one is the control strategy calculated by the off-line algorithm, and the other is the reasonable rules. The control strategy is given by static maps () and (). Through the combination of the two parts, the required torques are obtained.
The driver model and PHEV model are provided by GT-SUITE. The ‘ControllerHEVehicle’ component, which can calculate the necessary tractive power for a target vehicle speed, is used to calculate the driving power required at the vehicle to match the driving cycle. The PHEV model is also given by [
24] in GT-SUITE. It is should be noted that the original model in [
24] is HEV. Therefore, in order to adapt to our research, some parameters have been modified. The major modifications are changing the initial SOC of the battery and the threshold SOC of regenerative braking.
The cost function evaluator, as a module for evaluating the performance of our supervisory controller, has two parts. One part is the energy consumption evaluator, which calculates the fuel consumption by Equation (
7) and electric consumption by Equation (
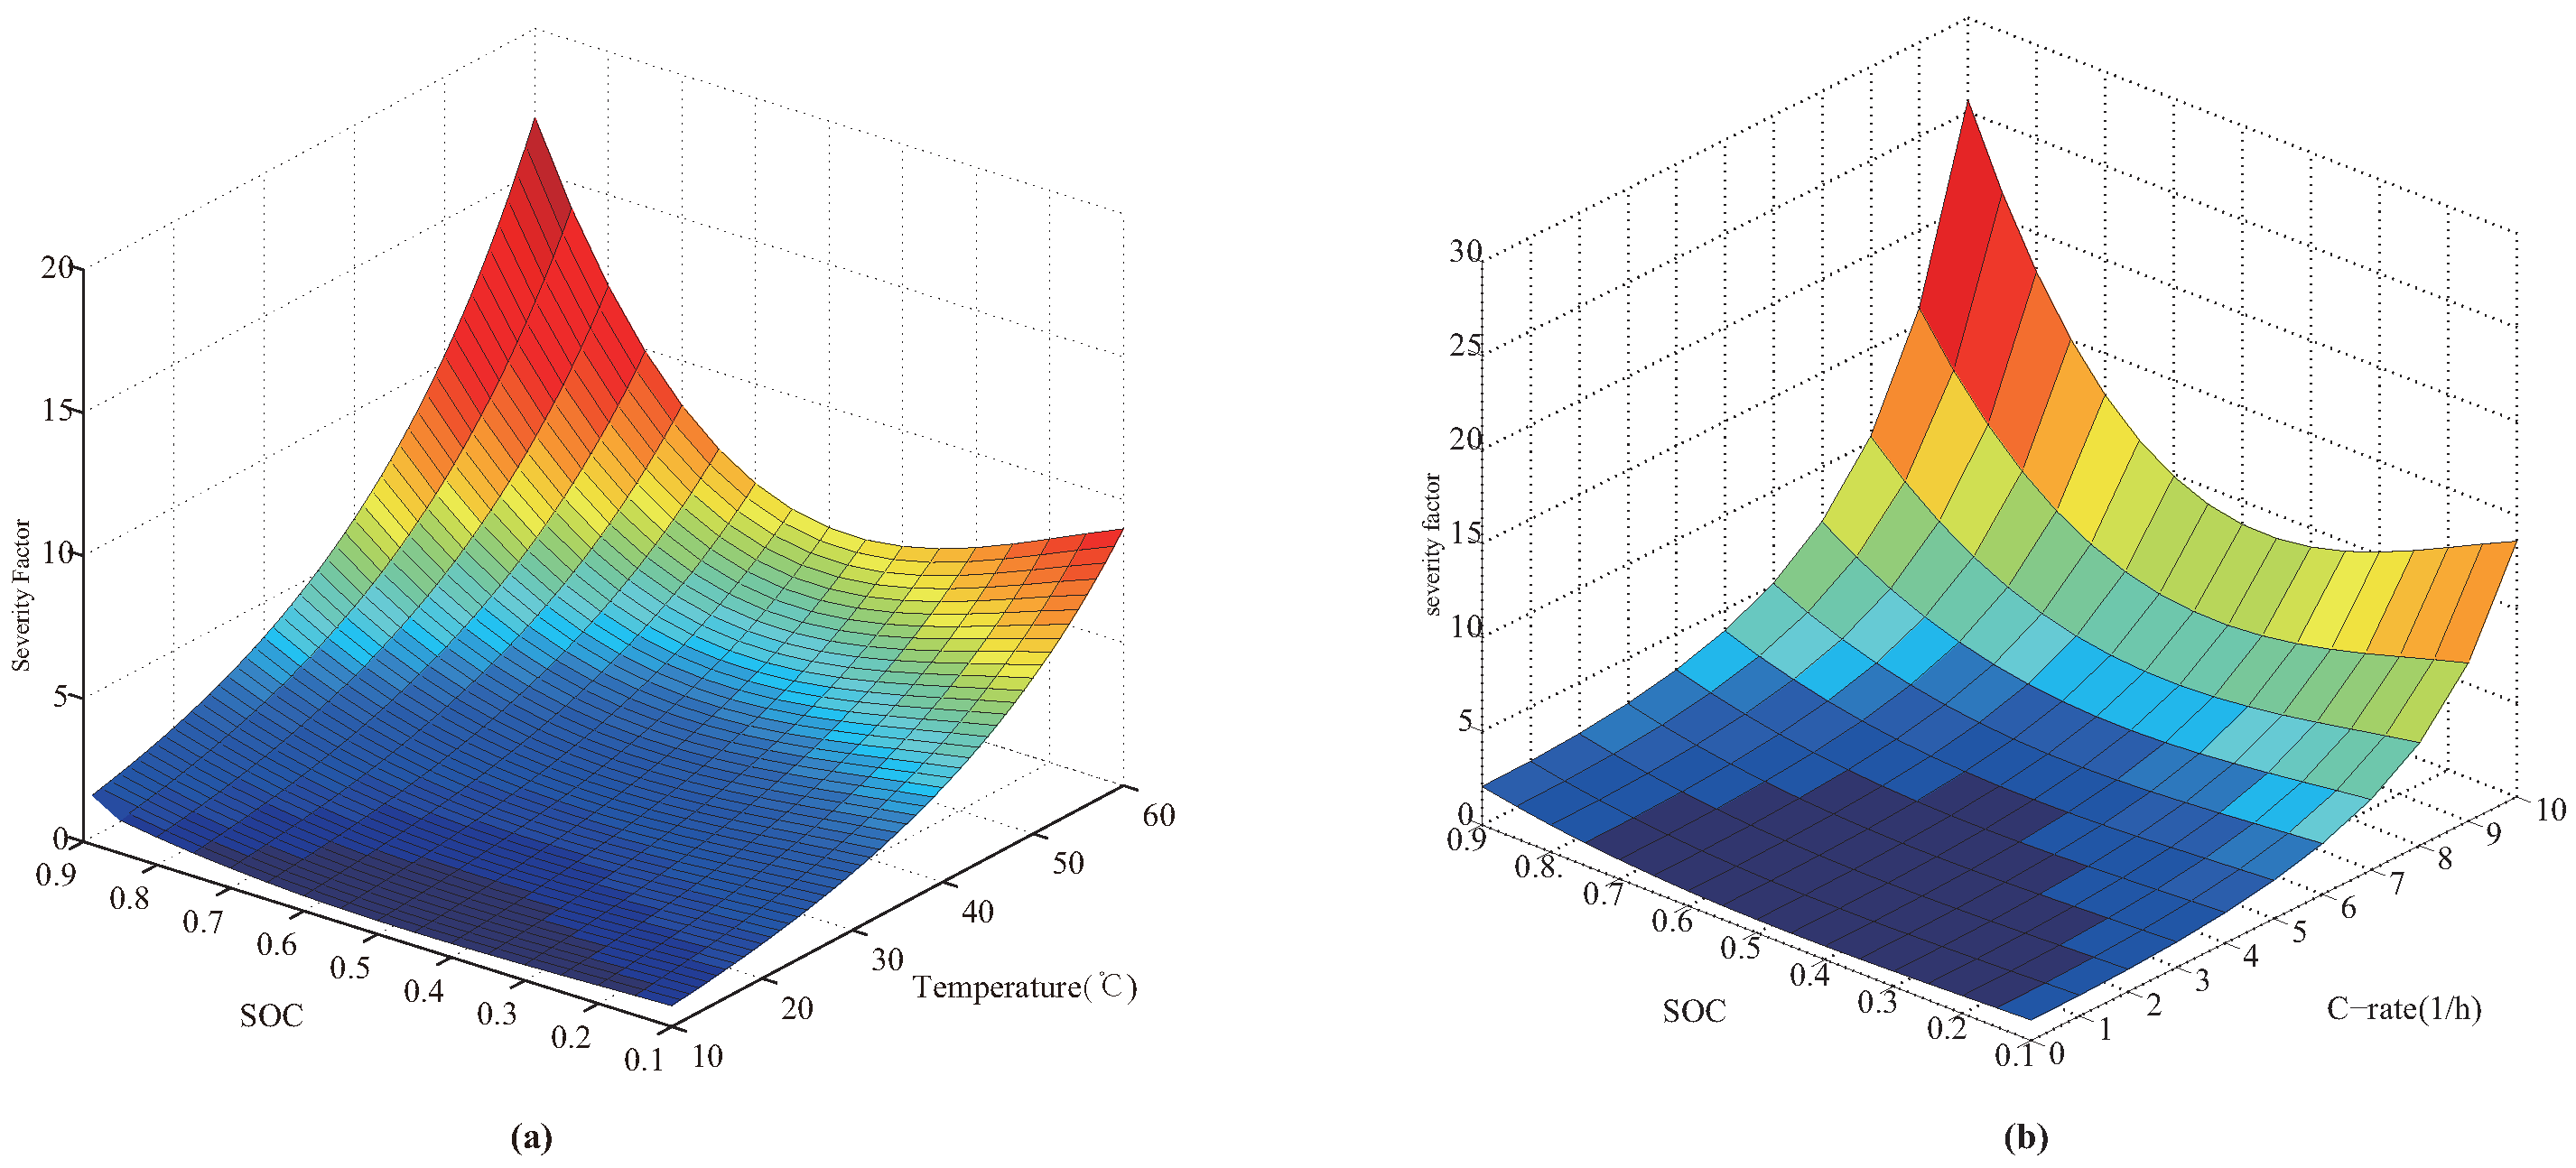
23). The other part is the battery health evaluator. For the sake of battery life evaluation, the semi-empirical battery life model is used. As introduced in
Section 2, the approximate severity factor map of SOC and C-rate is used to estimate the battery health in the off-line SDP algorithm in order to reduce the number of states. However, in the real-time simulation, we employ the more accurate severity factor map obtained from fitting the battery life experimental data to different temperatures and SOC, which is shown in
Figure 5. Therefore, SOC and
need to be obtained in the real-time simulation. SOC can be obtained directly by the PHEV model on GT-SUITE, and
can be calculated by Equations (
11)–(
13) with the value of
provided by GT-SUITE. Then, we use Equation (
15) to evaluate the decay of battery life quantitatively.
The drive cycle model provides the driver’s target speed and gives the target speed to the driver, which is simulated by GT-SUITE. The actual traffic routes [
3,
24] of 15 days introduced in
Section 2 are used in the simulation, and the route from home to office is divided into eight segments according to the stochastic consistent characteristics. The PHEV is considered to be charged once a day when parked at home. Therefore, the round trip from home to the workplace is chosen as the whole route of each day in the real-time simulation. It should be noted that the segments are divided according to the distance length from home. Therefore, the sectional strategies of the journey to work select 1∼8 segments in turn and select the 8∼1 segments strategies from work to home.
In the research, the simulation is divided into two parts. The first part is to calculate off-line the optimal control strategy by the SDP and PSO algorithm. Subsequently, the real-time simulation is carried out based on the strategy obtained on the GT-SUITE and MATLAB platform. Specifically, each segment optimal control policy can be obtained by the SDP and PSO algorithms shown in
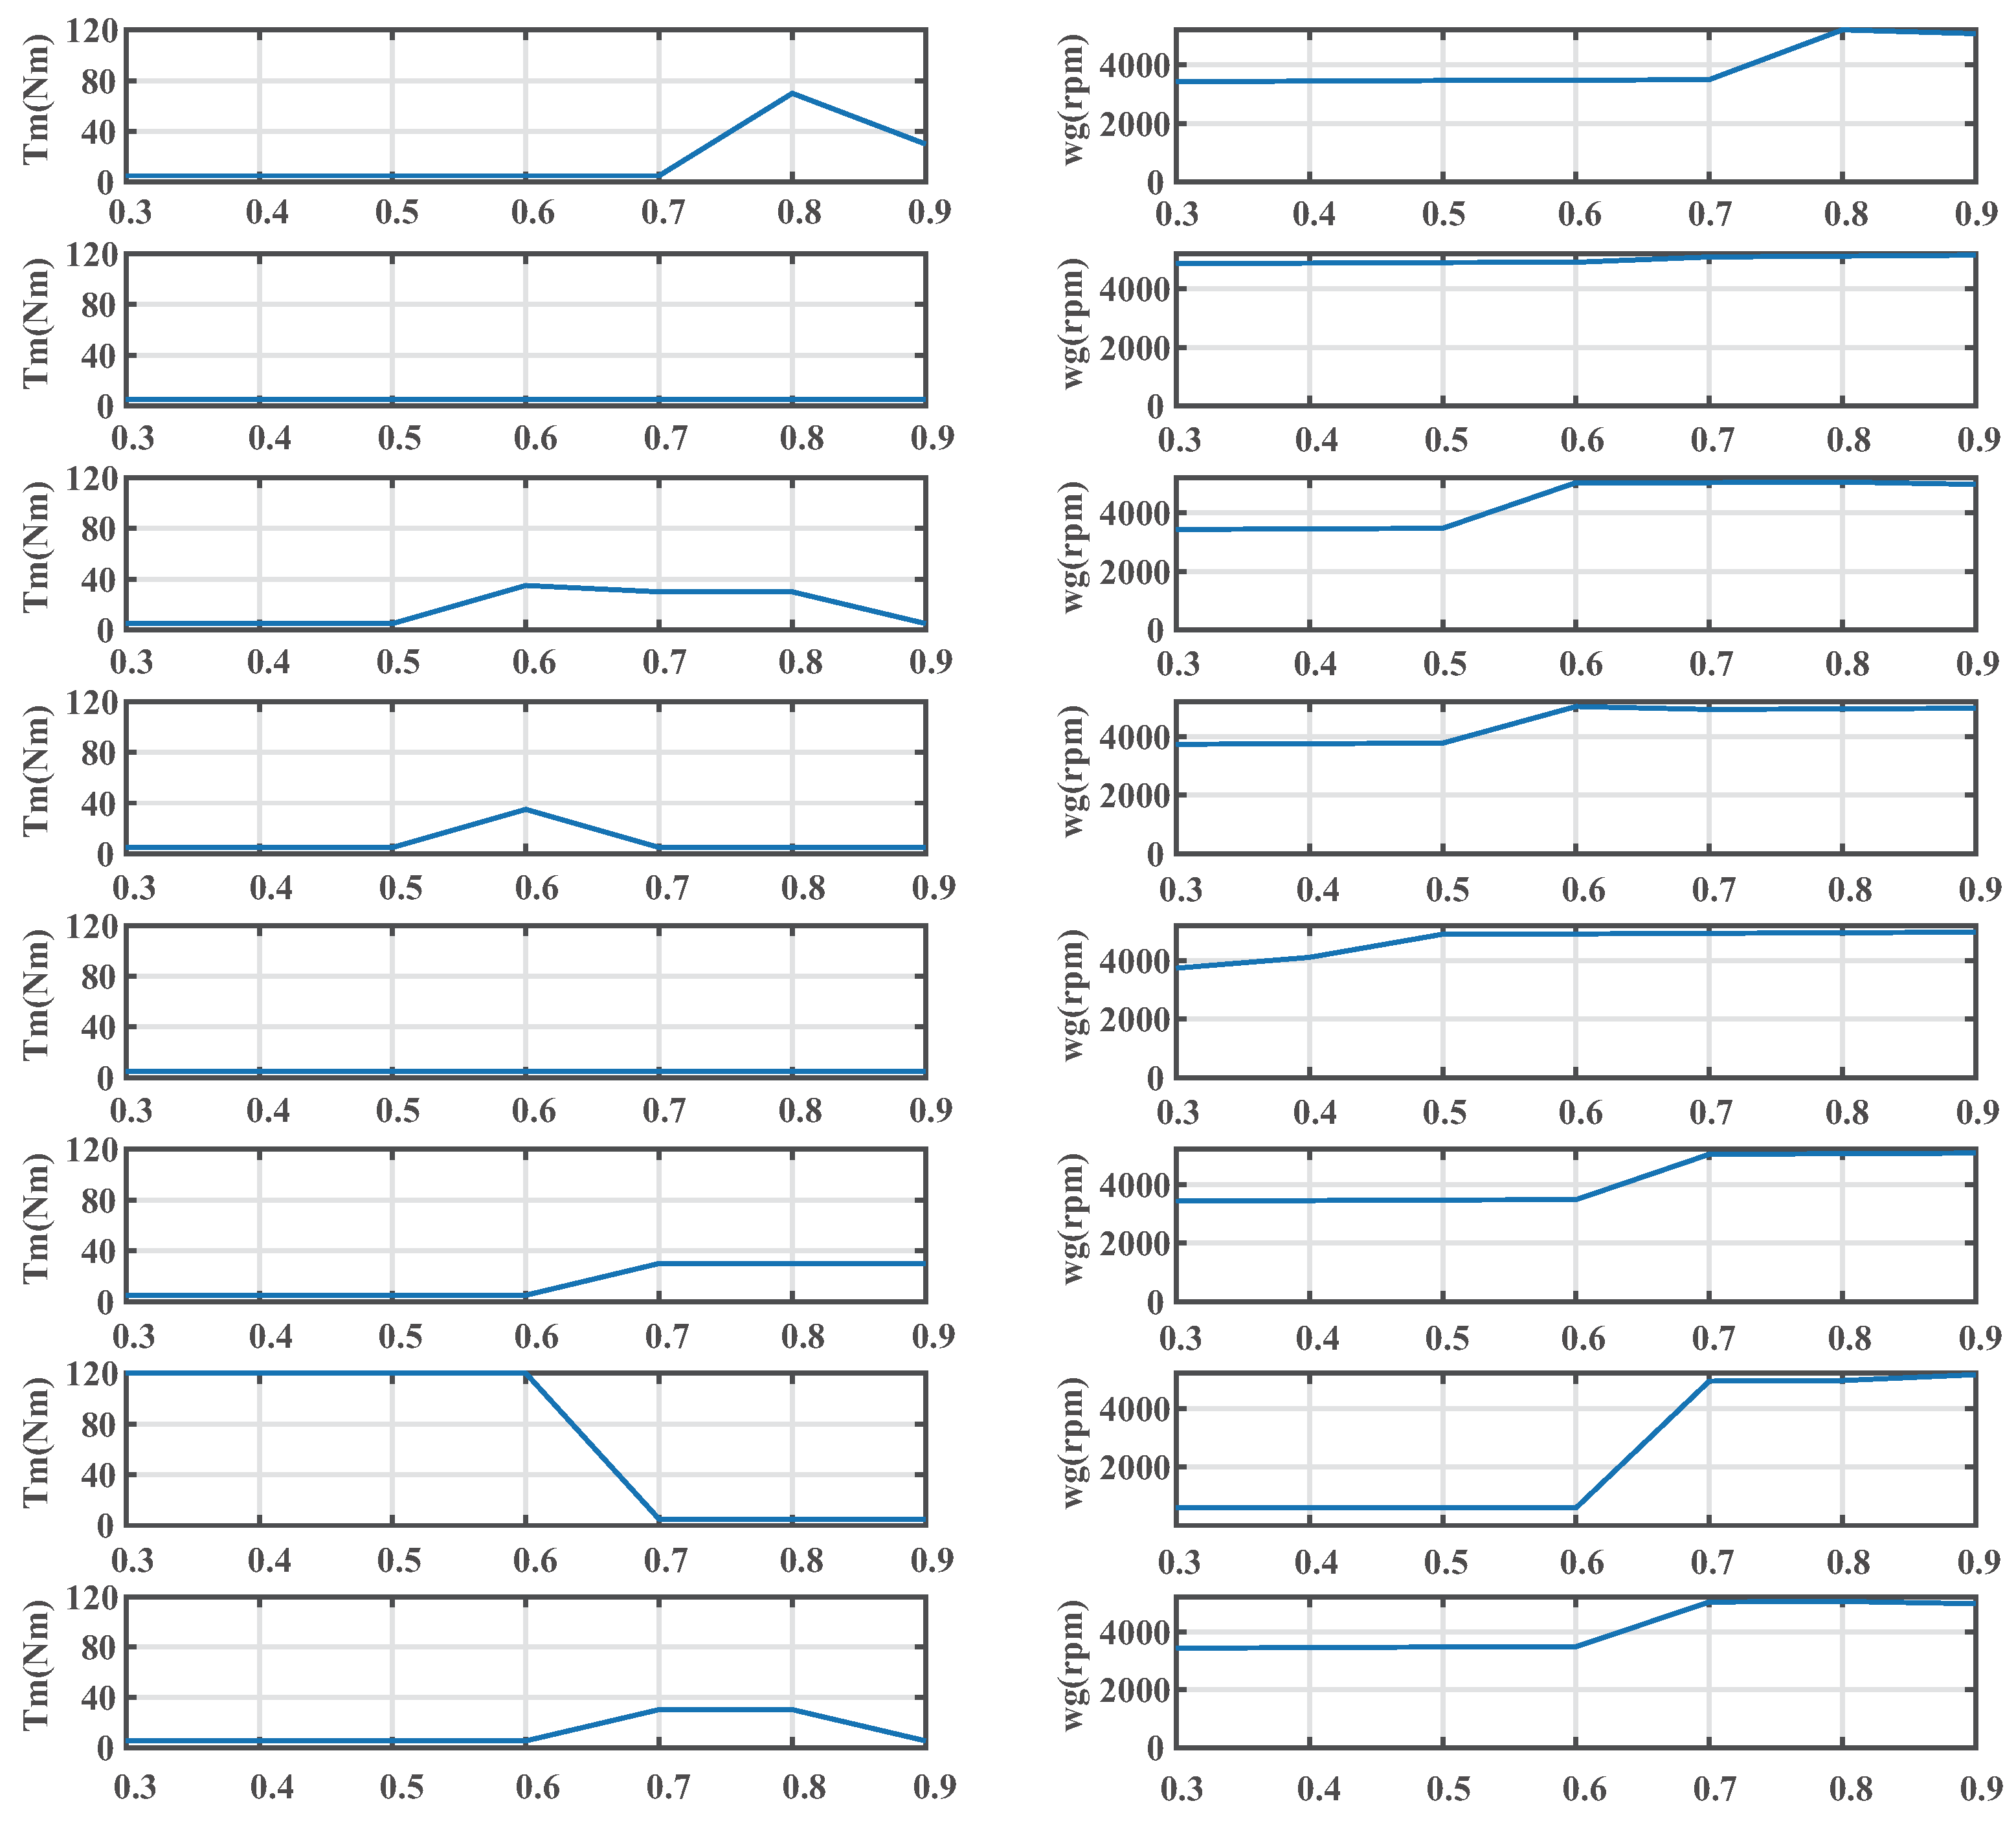
Figure 7. According to the eight statistical probability characteristics of commuting routes, the eight static maps (
) and (
) obtained for the whole route are shown in
Figure 9. In the implementation, for different segments and SOC, the corresponding control variables
and
can be obtained by looking up these maps according to the current system states. In addition, since these maps are obtained based on the different probability characteristics of each segment in the whole route, the generated real-time management control strategy by these mappings is feasible with respect to the real road traffic information in the actual operation. At the same time, the current management control strategy can be obtained merely by looking up maps, so there is no computational burden during real-time operation.
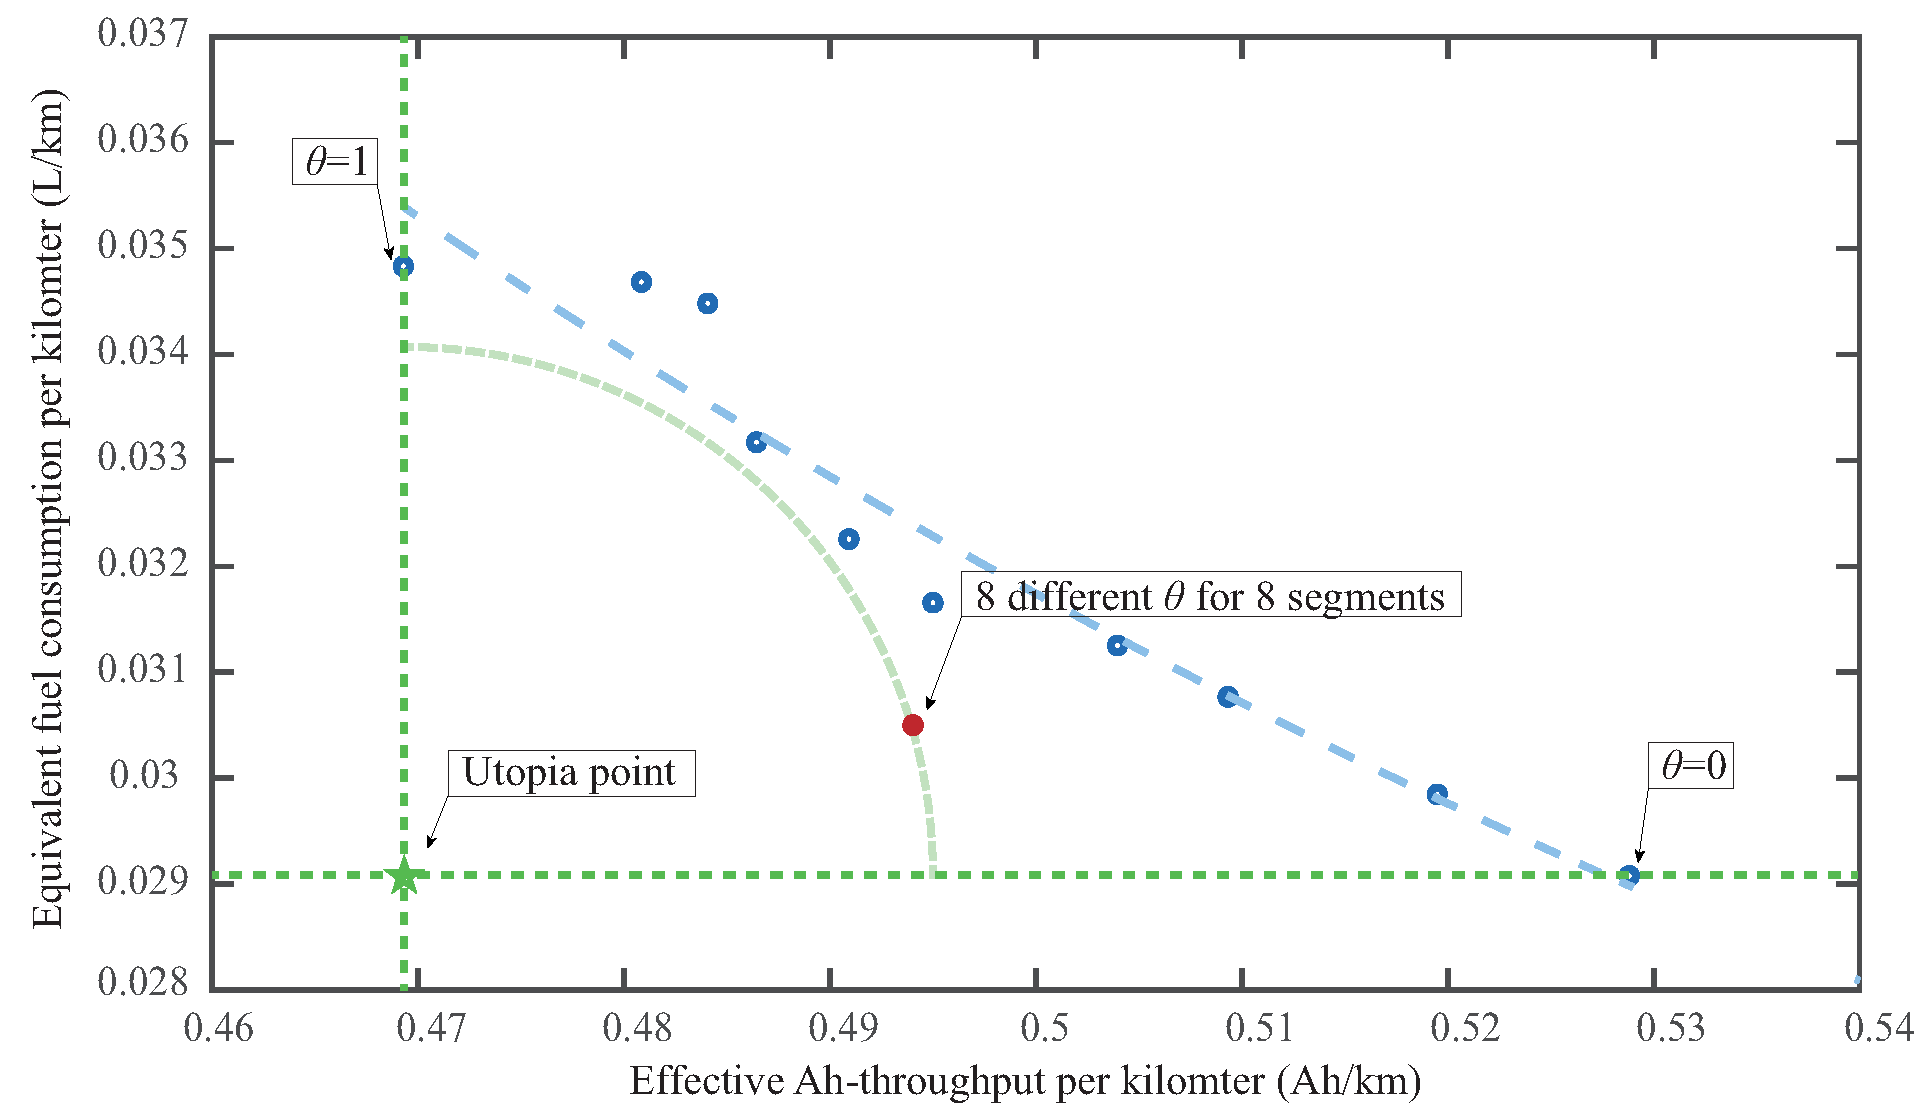
When solving the SDP algorithm with given fixed weight
in Equation (
22), a Pareto set will be obtained by sweeping weight
from 0 to 1. However, in our research, PSO is used for finding the weight coefficient that would be the best compromise between energy consumption and battery health. An optimal policy can be gained with eight different weight
for eight segments. The solutions are shown in
Figure 10. It explains that the optimization performance of using different weights of different segments is better than using the same weight of the whole route.
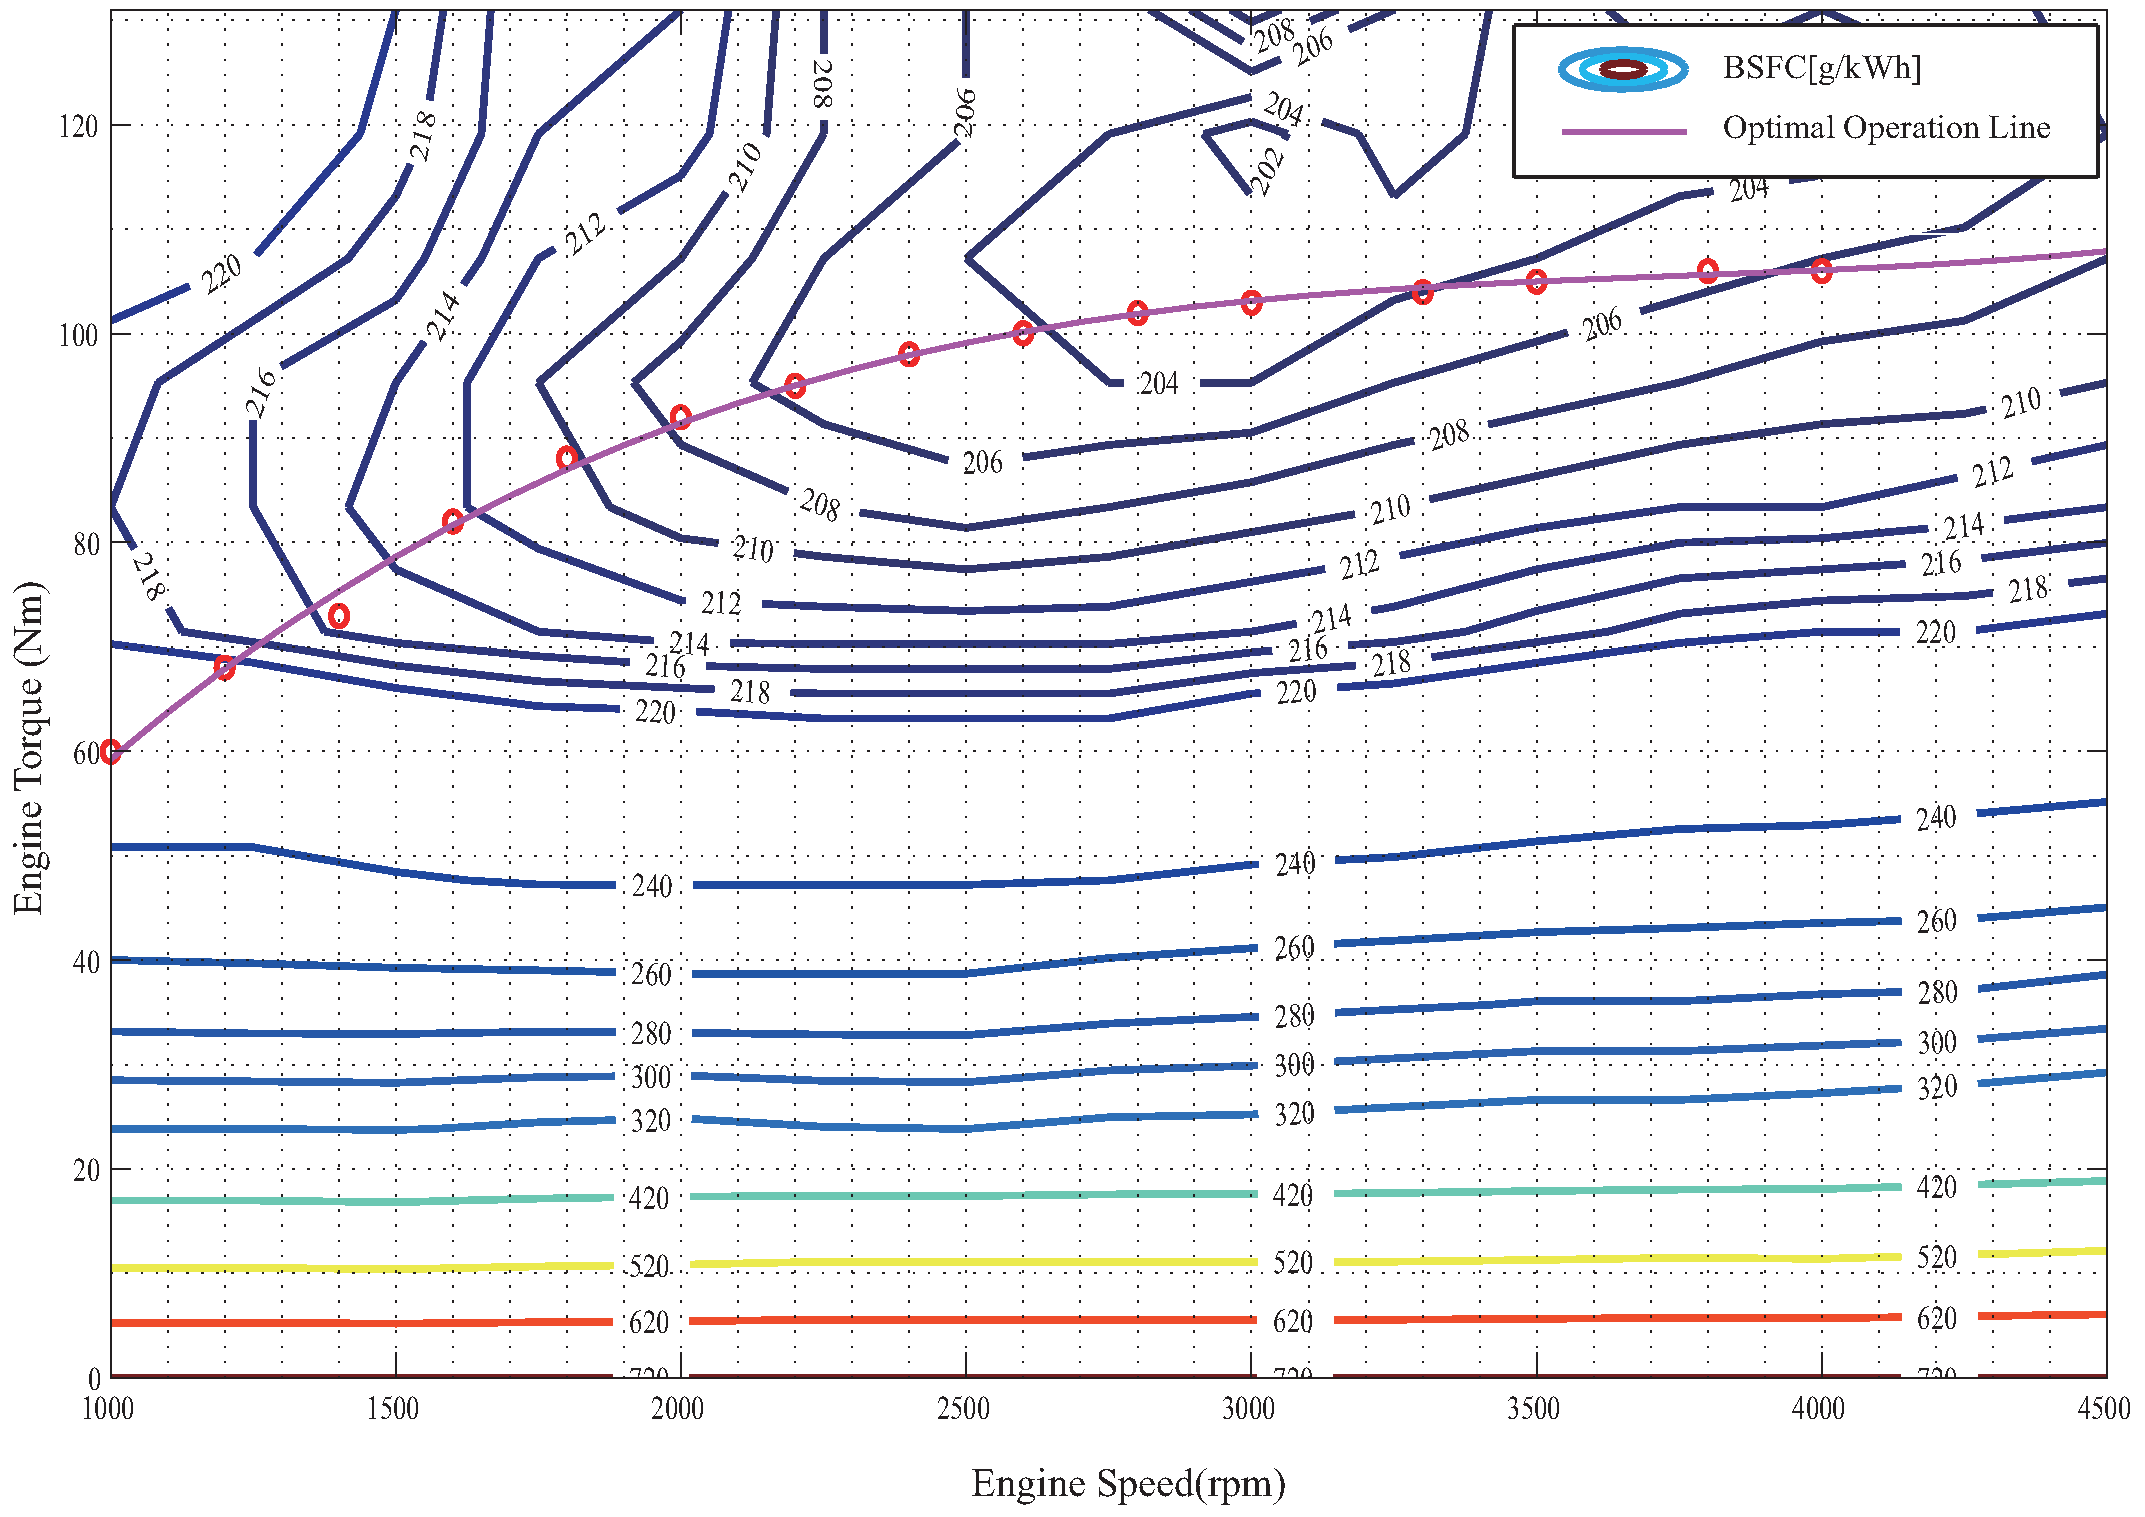
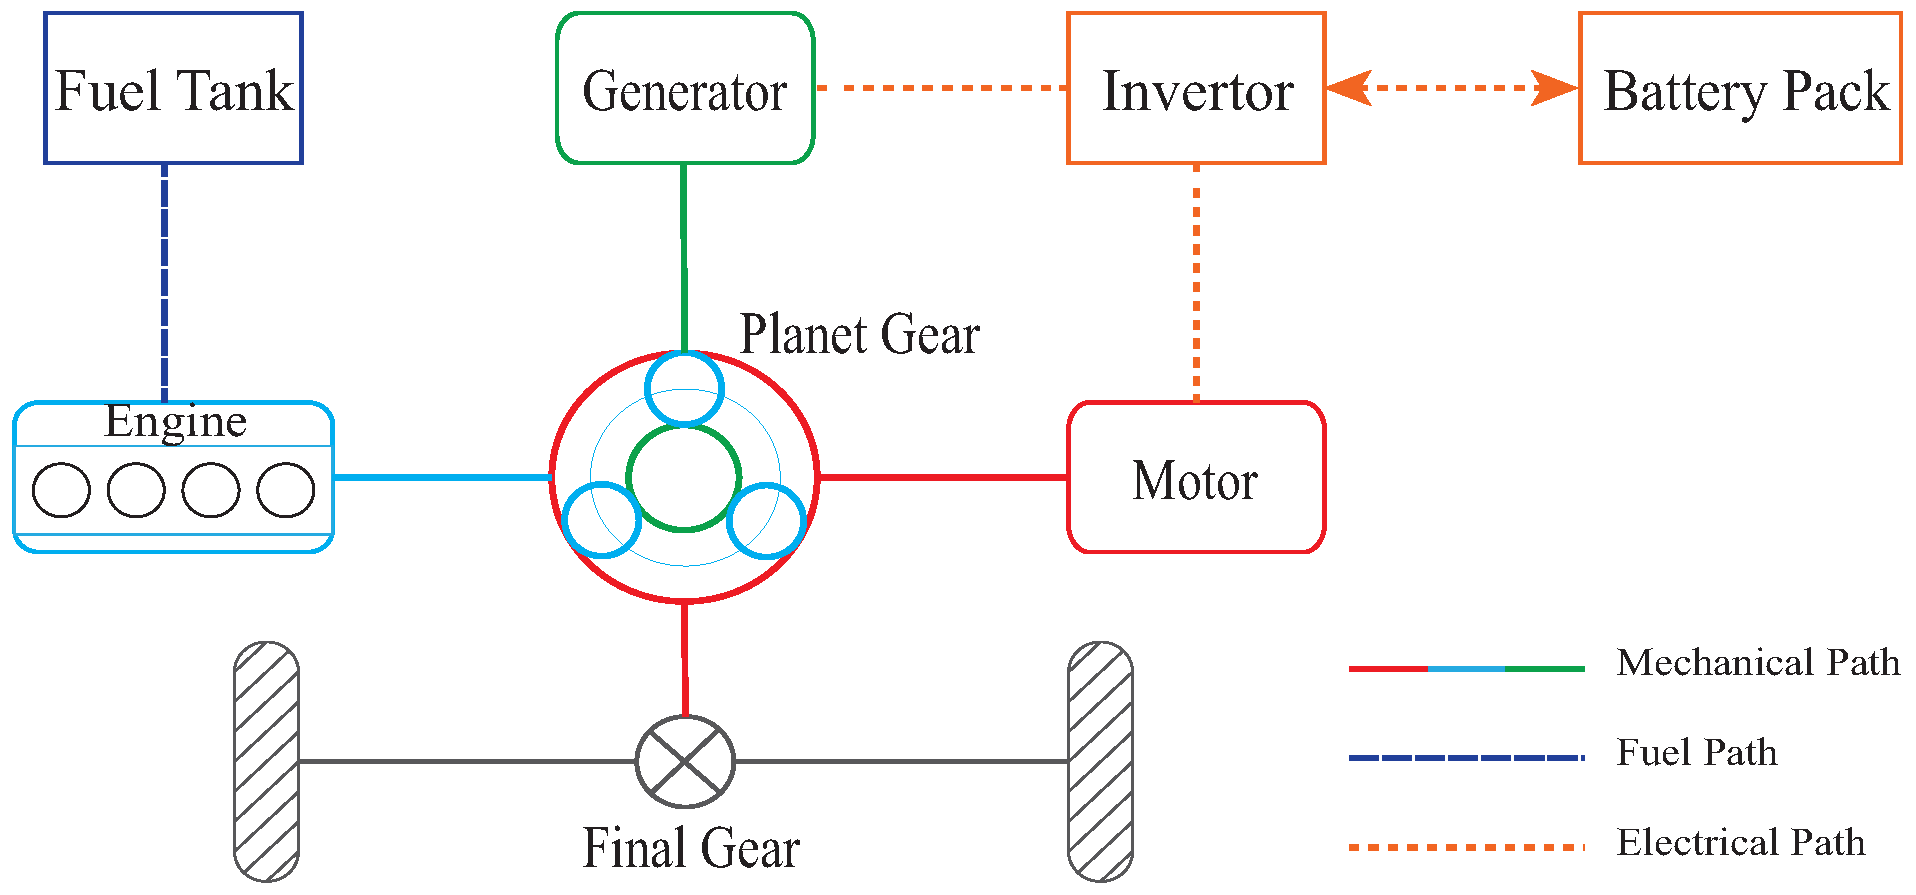
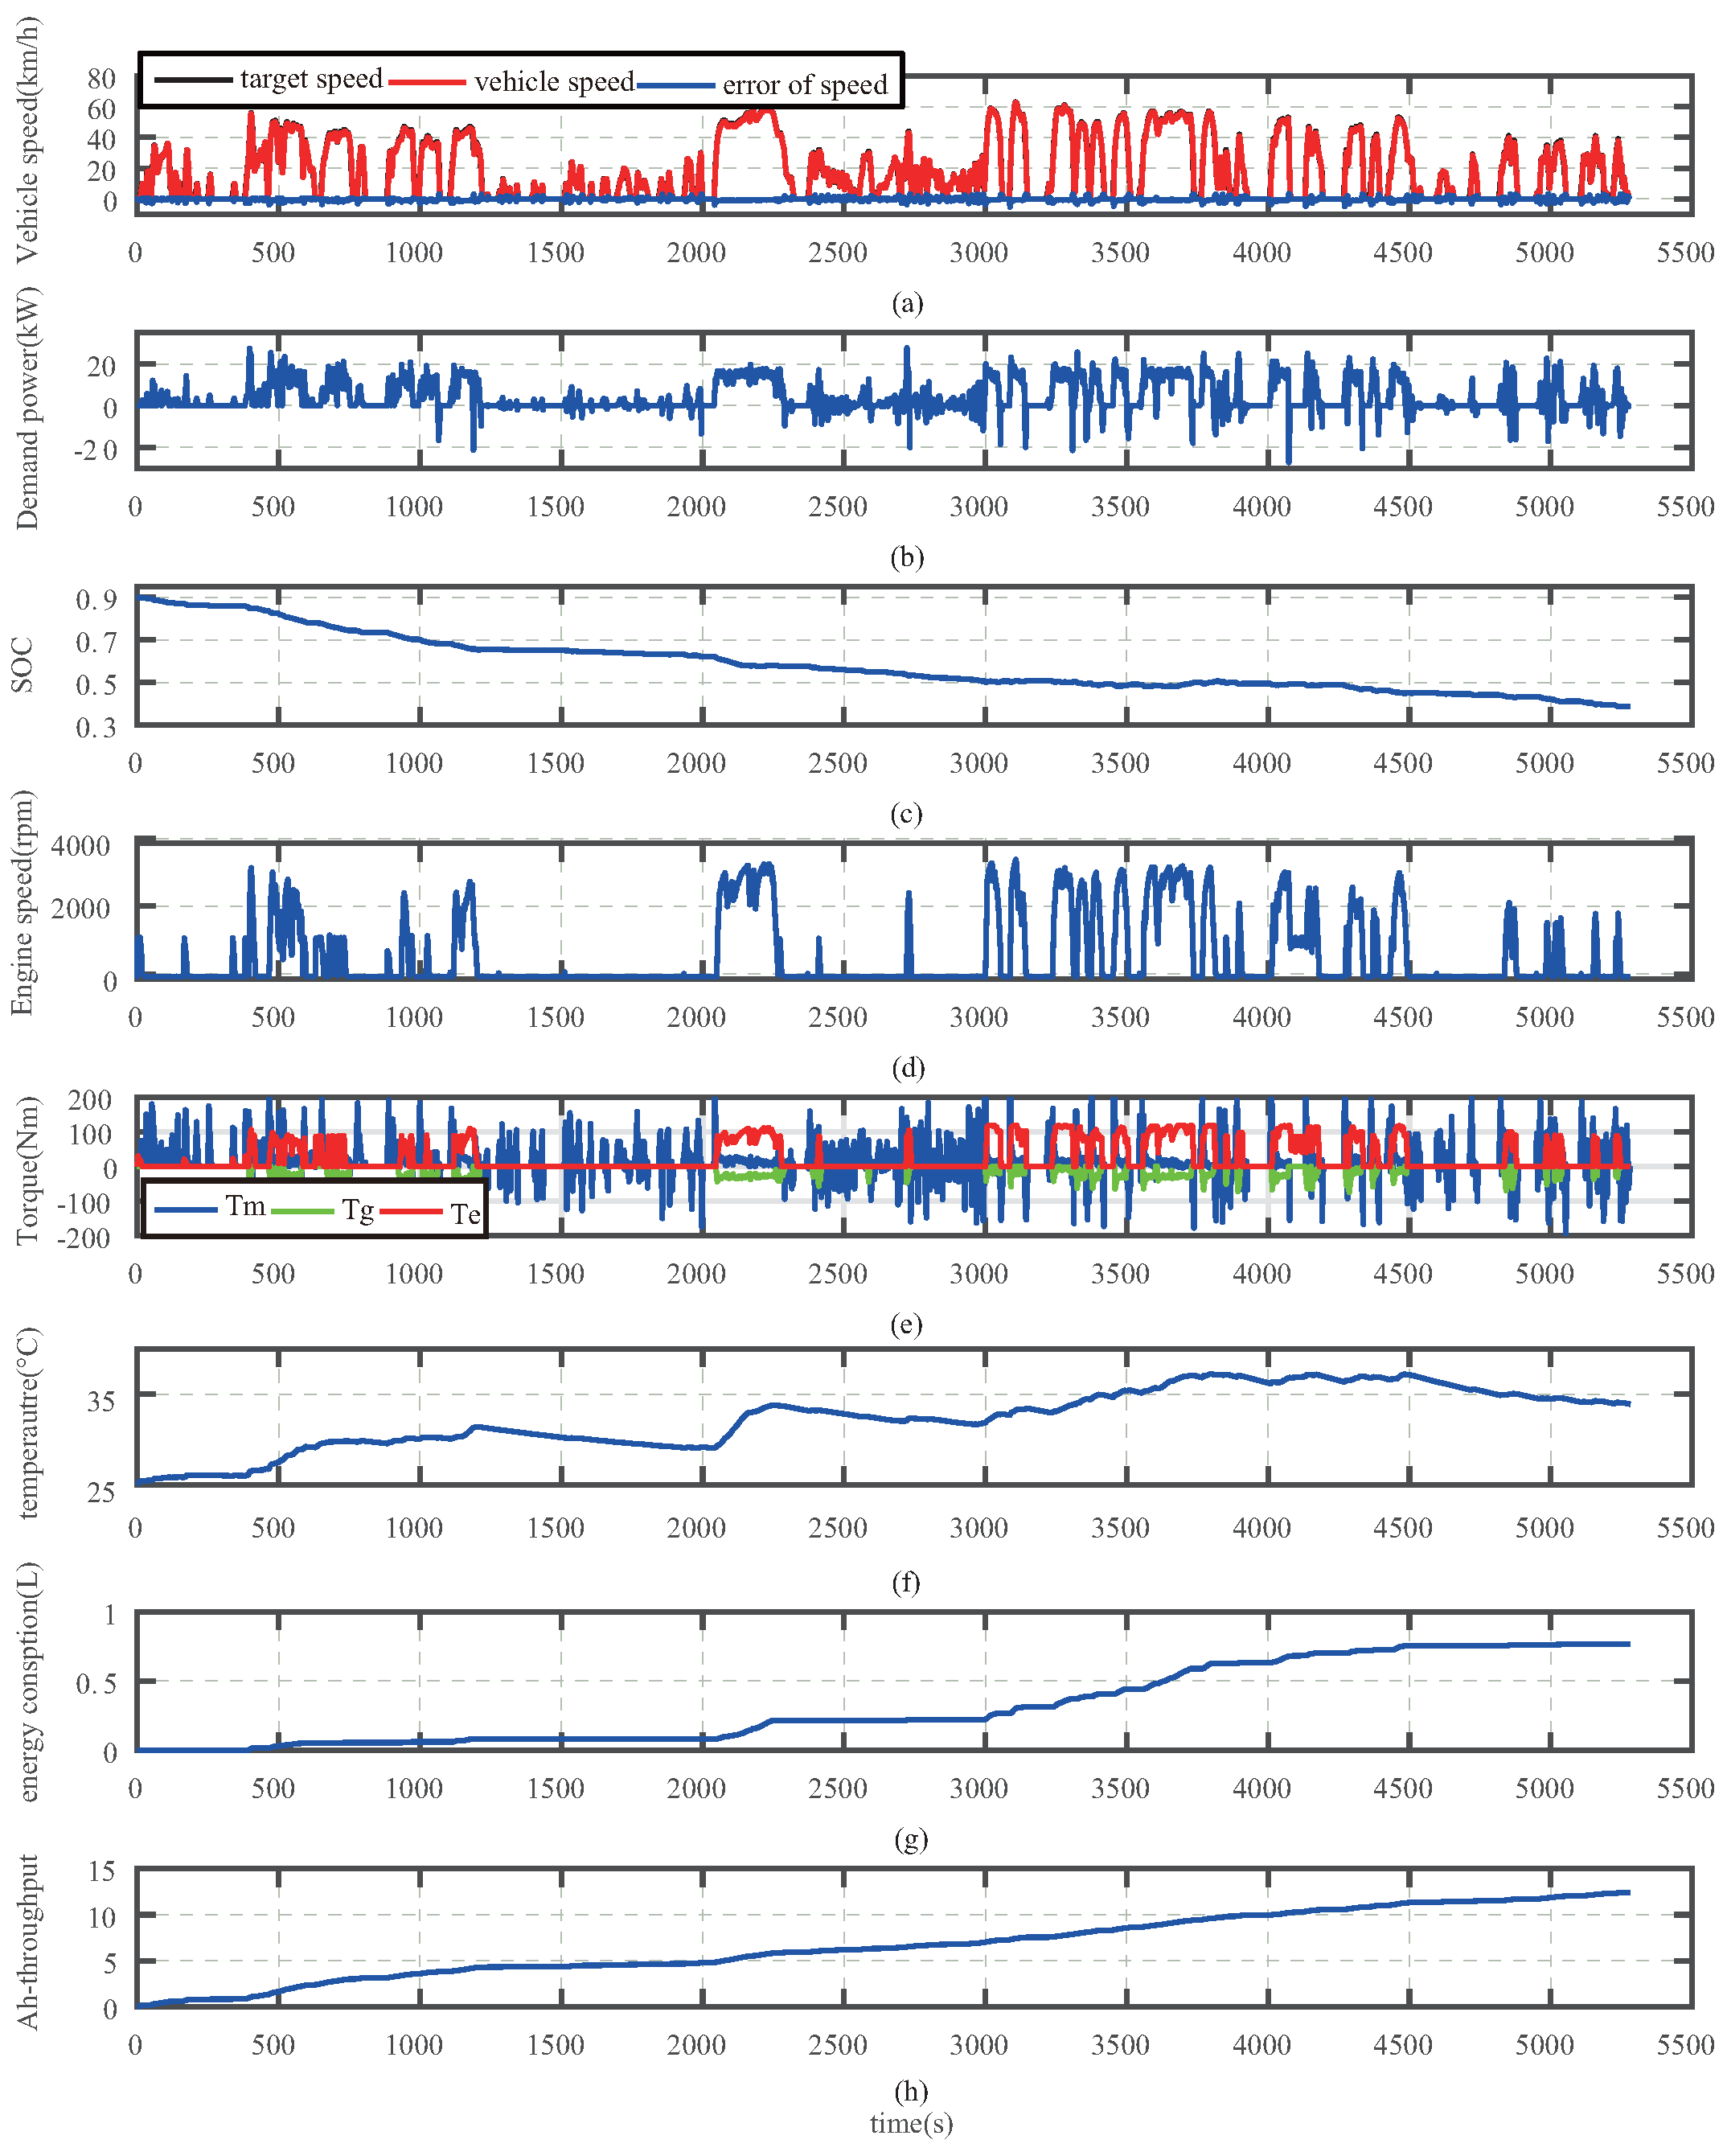
Figure 11 shows the result with the consideration of both energy consumption and battery life for the second week Monday speed profiled to demonstrate that the proposed energy management strategy can satisfy the vehicle power demand for drivability. Because of the planetary gear structure, the PHEV has several operating modes. The PHEV can be driven only by the motor when the speed is low and the battery capacity is adequate. Additionally, when the demanded power is great, customarily, the PHEV is driven at a high speed or in a climbing condition, and the vehicle is propelled jointly by the engine and motor. In that mode, the engine can work on the optimal operation line and recycle braking power to charge the battery.
Moreover, the simulation results of 15 days are listed in
Table 2 for three strategies, only energy consumption considered, only battery life considered and both energy consumption and battery life considered. More concretely, three different weight values
in Equation (
22) are chosen in order to demonstrate that the proposed strategy can largely reduce the battery life degradation without increasing fuel consumption too much. When the battery life is the only object to consider,
. Additionally, when energy consumption is the only object,
. Calculated by the particle swarm algorithm, eight different weight values
for eight segments are used in the case that both energy consumption and battery life are considered. The results shown in
Table 2 also demonstrate for the Pareto chart explanation of
Figure 10 that the optimization performance of using the optimized different weights of different segments is the best compromise.
In
Figure 11, it can be seen that the PHEV can work in pure electric mode for a longtime. Therefore, it has better fuel performance than the fuel vehicle and the traditional HEV. The battery capacity and the motor maximum power of the PHEV model used in this paper are much smaller. However, it is also shown that the one-hundred-kilometer fuel consumption is less than 3 L in
Table 2. The lesser average fuel consumption can reflect that PHEV is more dependent on battery performance than the traditional HEV. Hence, the considerations of battery health are essential.
According to the data in
Table 2, it is shown intuitively that fuel consumption inevitably increases as the battery health deterioration decreases. If only considering the battery health, the battery
is reduced by 8.5%, but the energy consumption is increased by 9.8% compared to energy consumption alone considered. This result has led to sacrificing greater energy consumption while improving battery health, which is clearly not conducive to the improved economic performance of the vehicle. However, the method proposed in this paper, which uses SDP and PSO calculating different weight values for different segments, can be a good solution to this problem. It can be seen that with the consideration of both energy consumption and battery life, battery life loss has been eased without too much energy consumption.
In this case, the simulation results show that the battery is reduced by 7.6%, while the energy consumption is only increased by 3.2%. Obviously, the proposed approach can increase the useful life of the vehicle’s battery, at the same time, as much as possible to reduce the energy consumption. Although the energy consumption still increases, it may increase the useful life of PHEV by nearly two years before the battery is damaged and then improve the whole vehicle’s economic performance.
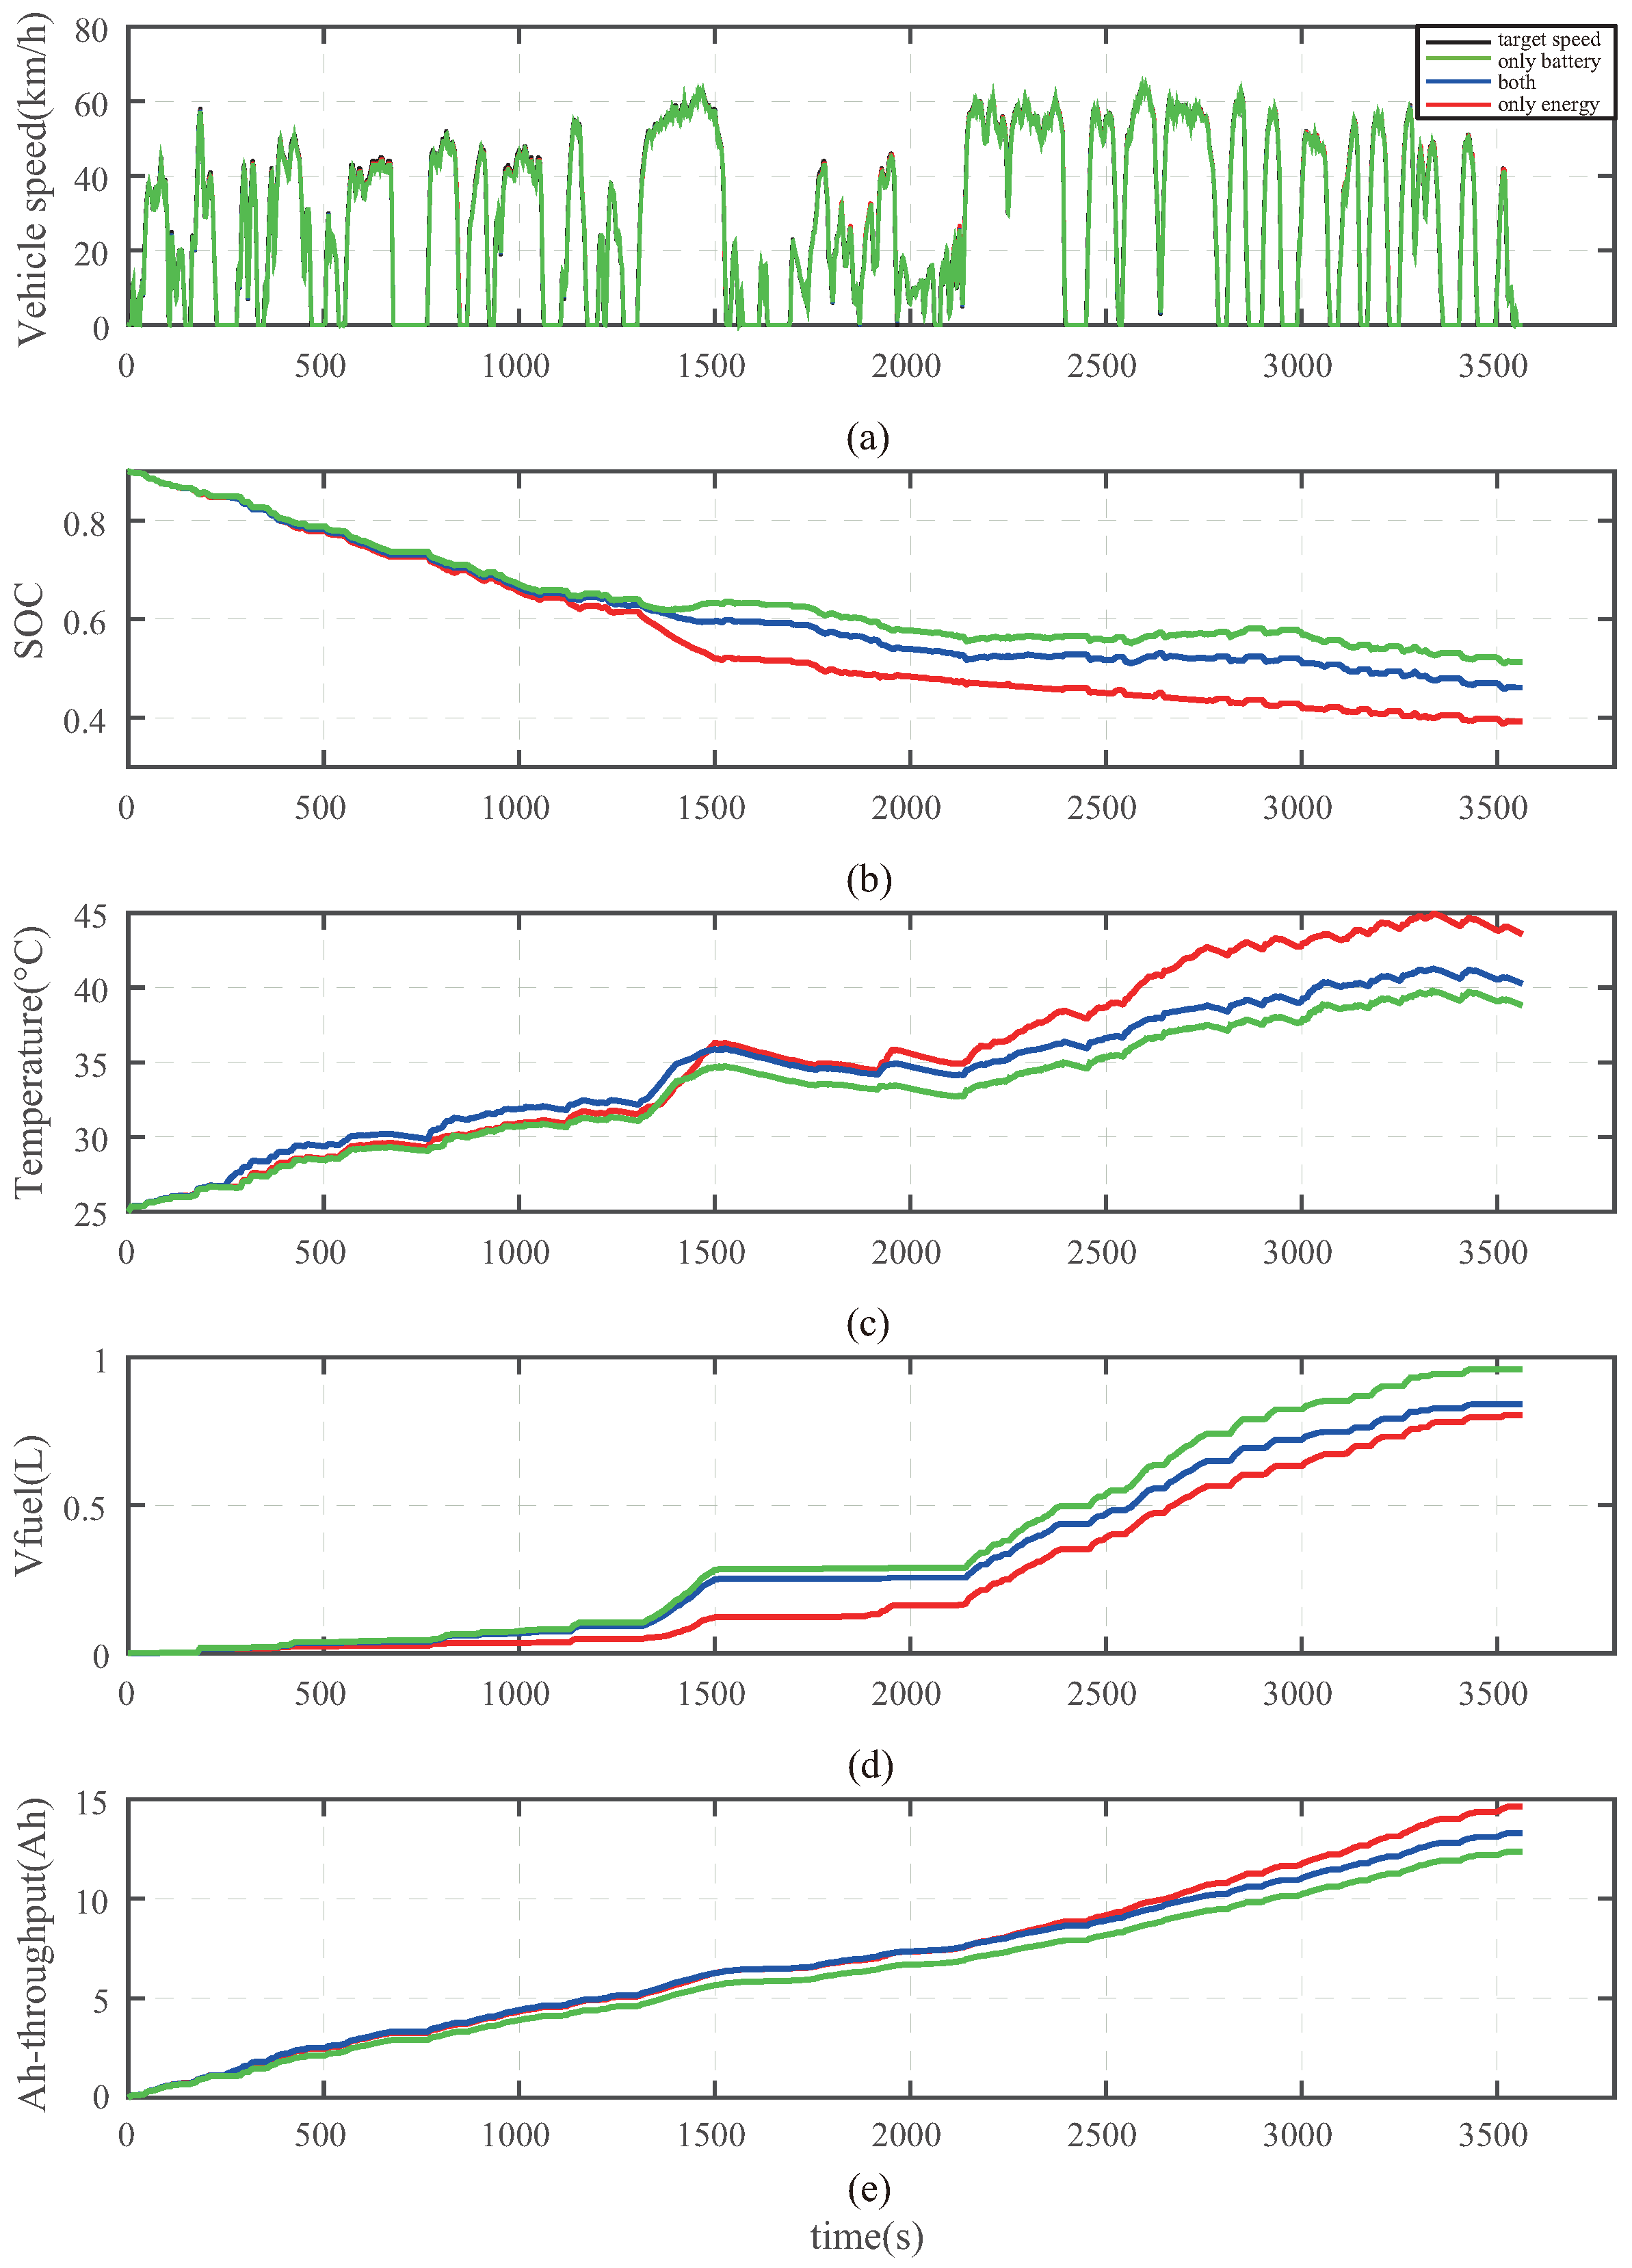
Figure 12 shows the comparison of the three cases in
Table 2 more clearly. The second week Thursday speed profile is taken as an example. In the three cases, SOC starts from 0.9 and gradually declines with a general trend. At the end of the day, SOC reaches a lower value to make full use of the stored energy in the batteries, which can be charged through the grid.
Figure 5 in
Section 2 shows that when SOC remains near 0.5, the speed of battery health decay is slowest. Thus, the energy management control strategies that consider battery life keep the battery SOC in a relatively better condition for a long time. At the same time, the temperature of the battery is also a major factor that affects battery life, as was introduced in
Section 2. Additionally, it is easy to identify that the battery temperature is controlled so as not to be too high with the consideration of battery health by observing the change of temperature in
Figure 12c. As the results shown in
Figure 12d,e, it can be seen that the consideration of battery life will increase the fuel consumption. However, in order to achieve a better performance with respect to the total cost, the policy of considering both energy consumption and the battery can reduce the battery degradation with a much smaller energy consumption increase.


