Article

An Improved Optimization Function for Maximizing User Comfort with Minimum Energy Consumption in Smart Homes

Computer Engineering Department, Jeju National University, Jeju 63243, Korea
*
Author to whom correspondence should be addressed.
Energies 2017, 10(11), 1818; https://doi.org/10.3390/en10111818
Submission received: 15 October 2017 / Revised: 2 November 2017 / Accepted: 7 November 2017 / Published: 9 November 2017

Abstract

:
In the smart home environment, efficient energy management is a challenging task. Solutions are needed to achieve a high occupant comfort level with minimum energy consumption. User comfort is measured in terms of three fundamental parameters: (a) thermal comfort, (b) visual comfort and (c) air quality. Temperature, illumination and CO 2 sensors are used to collect indoor contextual information. In this paper, we have proposed an improved optimization function to achieve maximum user comfort in the building environment with minimum energy consumption. A comprehensive formulation is done for energy optimization with detailed analysis. The Kalman filter algorithm is used to remove noise in sensor readings by predicting actual parameter values. For optimization, we have used genetic algorithm (GA) and particle swarm optimization (PSO) algorithms and performed comparative analysis with a baseline scheme on real data collected for a one-month duration in our lab’s indoor environment. Experimental results show that the proposed optimization function has achieved a 27.32 % and a 31.42 % reduction in energy consumption with PSO and GA, respectively. The user comfort index was also improved by 10 % i.e., from 0.86 to 0.96 . GA-based optimization results were better than PSO, as it has achieved almost the same user comfort with 4.19 % reduced energy consumption. Results show that the proposed optimization function gives better results than the baseline scheme in terms of user comfort and the amount of consumed energy. The proposed system can help with collecting the data about user preferences and energy consumption for long-term analysis and better decision making in the future for efficient resource utilization and overall profit maximization.

1. Introduction

Energy is one of the most precious resources, and its demand is increasing day-by-day. There are two possible solutions to meet the growing demand of energy: (1) produce more energy and explore alternate sources of energy production and (2) efficiently use existing resources to save maximum energy for other usages. The latter approach is more favorable, cost-effective and, thus, highly desirable. Inefficient utilization of energy leads to wastage of power. In order to complement efforts for new energy production, there is a strong need for efficient resource utilization. Various technologies and algorithms are harnessed to develop efficient solutions for optimal energy utilization.
The advent of Internet of Things (IoT) has revolutionized every aspect of human life. It offers many applications in various domains, e.g., health, security, transportation, manufacturing, etc. Smart homes with intelligent devices not only help with remote monitoring and control, but also help with optimal utilization of energy resources. Through IoT devices, we can collect data regarding the indoor environment, building occupancy and predict energy utilization using intelligent solutions. In a research survey conducted in South Korea [1], energy management was considered as the second most popular application area for IoT. Contextual information can easily be collected by IoT devices, and then, intelligent algorithms can be applied for optimal utilization of resources for maximizing user comfort with the minimum energy requirement. As per the statistics of Korean Energy Economic Institute shown in Figure 1, residential and commercial buildings in South Korea contribute towards 40 % of total energy consumption [2]. Therefore, minor achievement in energy efficiency will result in significant reduction in monthly billings as energy cost contributes heavily to the home user expenses. Hence, there is a strong need to build smart and intelligent energy management solutions that can accommodate environmental factor and user preferences together for optimal energy utilization. Various approaches are proposed in the literature based on artificial intelligence (AI) algorithms and mathematical models.
In the recent past, energy efficiency in smart buildings has attracted the attention of many researchers working in this field. Besides energy efficiency, user comfort is also an important concern, which is measured in terms of three fundamental parameters: (a) thermal comfort, (b) visual comfort and (c) air quality [3]. Smart home users describe their preference range for each individual parameter. At any time instant, values of these three parameters determine occupant comfort level while staying inside the building environment. Temperature level is used to indicate the thermal comfort in a building. An auxiliary heating or cooling system is applied to preserve the temperature in a comfortable range as specified by the user. The illumination level is used to indicate the visual comfort of occupants. The electrical lighting system is used to manage visual comfort [4]. CO 2 concentration is used as an index to measure air quality in the building environment [5]. Electric fans are used for ventilation to control air freshness and maintain desired air quality.
Several efforts are made to propose a solution that shall result in less energy consumption without compromising the user comfort index [4,6,7]. They have adapted a customized user comfort formula in a way that shall result in minimum energy consumption. In other words, they do not consider energy consumption as an integral part of their optimization objective function. In this paper, we have proposed an improved optimization function for efficient energy consumption with maximum user comfort in smart homes. We have developed a conceptual model for a smart energy management system that provides a base for our simulation model for indoor environment. Experiments are performed with real data in our indoor lab environment for a one-month duration, i.e., from 4 February to 6 March 2017 (31 days). For the implementation, we have used both genetic algorithm (GA) and particle swarm optimization (PSO) to evaluate the performance of our proposed optimization function. Experimental results with GA are better than PSO, and optimization results presented in this paper refer to GA results if not explicitly stated otherwise. Same experiments are also repeated without using the optimization scheme to realize the difference.
The rest of the paper is organized as follows. Section 1 presents a brief introduction to the subject matter of the paper. Related work is discussed in Section 2. In Section 3, we present the architecture of our proposed smart energy management system and its design. Problem formulation for the proposed optimization function is given is Section 4. A detailed discussion of the collected data, experimental setup, performance evaluation results and comparative analysis is presented in Section 5. Finally, we conclude this paper in Section 6 with an outlook toward our future work.

2. Related Work

Energy is one of the most precious and costly resources. Savings in energy utilization are desirable for both consumers and the energy service provider. Home users are interested in solutions for reduction in their monthly energy consumption to get savings in monthly electricity bills, but such a solution shall have low/no impact on their comfort. Energy service providers also feel pressure to meet the growing demands for more energy from users and industry. Similarly, green energy solutions are also explored all over the globe for maintaining a safe and healthy climate on Earth for all living beings.
Many solutions are developed for energy saving and optimal utilization in the literature [8,9,10]. One of the major issues with conventional solutions for energy optimization includes the problem of overshooting. which results in wastage of resources. The work in [11] presents an optimal fuzzy proportional integral derivative (PID) controller in order to overcome the overshoot of temperature. Other conventional controllers proposed in the literature included optimal control and adaptive control. However, these conventional controllers have their own disadvantages. They require an accurate model of the building, which is not possible in reality. Furthermore, such solutions are not user friendly, and there are many difficulties in monitoring and controlling the parameters caused by nonlinear features. A fuzzy controller optimized with the genetic algorithm for indoor environmental control is presented in [12]. They have divided the building into zones, and a central control system performs zone-level environmental monitoring using smart card units, which hold the default values for control variables.
Trivial systems do not consider environmental factors, which results in poor energy utilization. To overcome this limitation, predictive control approaches are proposed in [13,14]. For optimal heating/cooling, a data-driven approach based on neural networks (NN) has been proposed in [13] for steam load prediction in buildings. Based on the formulated model and weather forecasting data, future steam consumption is estimated. To improve the performance of electric water heating systems in smart homes, Bo Lin et al. have developed a model based on nonlinear autoregressive network with external input (NARX) using a neural network for electric water heaters to achieve the comfort requirement with minimum energy consumption [15]. A study on energy savings in building heating systems is presented in [14] by using the model predictive control (MPC) approach. They tried to model future building behavior in terms of the selected operation strategy together with weather and occupancy forecasts. The objective is to design a control strategy that minimizes the energy consumption while guaranteeing that all comfort requirements are met. Similarly, a multi-agent control system with intelligent optimization is presented in [16] for indoor energy and comfort management based on information fusion using weighted aggregation in order to achieve a high-level comfort index value with minimum power consumption.
There are two commonly-used modeling approaches for building energy systems, i.e., forward and inverse [17]. Forward modeling utilizes input data such as weather information, building material, size and structure in order to produce the operating schedule with estimated energy consumption. Numerous software packages are available based on forward modeling including the two most popular tools: DOE-2 [18] and EnergyPlus [19]. DOE-2 is a computer simulation program that can estimate energy usage and cost for both commercial and residential building given design and operational parameters information. A comprehensive performance analysis of DOE-2 and EnergyPlus can be found in [20]. On the other hand, the inverse modeling approach is based on a known mathematical relationship between the inputs (e.g., weather conditions, building structure, occupancy information) and output, i.e., energy consumption. The mathematical relation between inputs and outputs is generally derived using domain knowledge. With the advent of sensing technology, a new data-driven modeling approach is introduced based on various sensing data collections regarding indoor and outdoor environments. This approach can be viewed as a hybrid energy modeling where the forward component of the system is encoded in sensor data and the inverse component is statistically derived through various machine learning techniques. Generally, sensor-based energy modeling is preferred over traditional forward and inverse modeling. Many sensor-based studies can be found in the literature focusing on predicting current and future energy consumption using various machine learning techniques. Various statistical procedures are used to improve the prediction results of neural networks in building energy consumption [21]. To further improve the performance of traditional neural networks, a hybrid system based on genetic algorithms and an adaptive neuro-fuzzy system (GA-ANFIS) is proposed in [22]. User comfort is subjective, and it varies from person to person, depending on various domestic, geographic and environmental factors. A study is presented in [23] to understand the complex relationship among various factors contributing towards perceived user comfort in indoor environments. Achieving a high level of comfort causes an increase in energy demand. A simple methodology for the classification of indoor environmental quality is presented in [24] based on two indexes, i.e., the Environment Quality Index (EQI) and the Building Quality Index (BQI). Based on these two indexes, they classify the indoor environment on a scale of seven values. To meet the growing demands, alternate sources of energy productions are explored to promote green energy solutions, e.g., solar, wind, hydrogen etc. However, these renewable energy sources cannot fulfill the total energy demand. A hybrid energy management system based on an artificial neural network controller is presented in [25] for automated switching from renewable energy sources to conventional energy production depending on the energy demands.
Energy management in a building is an optimization problem. Several evolutionary algorithms are actively used for energy optimization in the building environment. For instance, the genetic algorithm (GA) and particle swarm optimization (PSO) are applied in many different ways to optimize energy consumption [26,27]. GA is used in [28] to optimize the controller parameters of the heating, ventilation, and air conditioning (HVAC) system to achieve optimal performance. This method has also been applied to the control problems of energy systems consisting of fuel cells, thermal storage and heat pumps [29]. The multi-objective genetic algorithm (MOGA) is used in [26] for the identification of the optimum pay-off characteristic between the occupant thermal discomfort and the energy cost of a building. The GA-based optimizer is used in [30] for thermo-economic optimization in urban residential buildings of Beijing to find the solution of the mixed integer and non-linear programming problem. Building design and structure also have a significant impact on energy consumption. To analyze the impact of building design parameters on energy consumption, a study is presented in [31]. They have proposed a multi-variable optimization scheme using GA to reduce residential building life cycle costs (LCC) through the selection of optimal building design parameters.
A PSO-based methodology for building energy performance optimization is presented in [32]. They have used EnergyPlus to simulate energy consumption inside the building. This system can suggest specifications for buildings to minimize their annual energy consumption. Another PSO-based hybrid power system is proposed in [33] for unit sizing of a stand-alone power generator in remote areas. A comprehensive review of optimized control systems for building energy and comfort management of smart sustainable buildings is presented in [34].
Many research efforts published in the literature are either focused on energy optimization or maximizing user comfort. Several efforts are made to propose a solution that shall result in less energy consumption without compromising the user comfort index [4,6,7]. They have developed a customized user comfort index formula and used it as a fitness function of their optimization algorithms. Their formula gave optimal values for indoor parameters within the user-desired range in a way that results in minimum energy consumption as optimal values are selected to cause the minimal change in current settings. We have revised this objective function for the optimization algorithm as given in Equation (13), which results in improved performance. Furthermore, we have used real data for the performance evaluation of modified system, whereas previously, experiments were done with simulated data. The system is designed to improve the occupants’ comfort index and energy efficiency, simultaneously. For optimization, we have selected two well-known optimization algorithms: genetic algorithm (GA) and particle swarm optimization (PSO). The proposed objective function given in Equation (13) is used as their fitness functions.

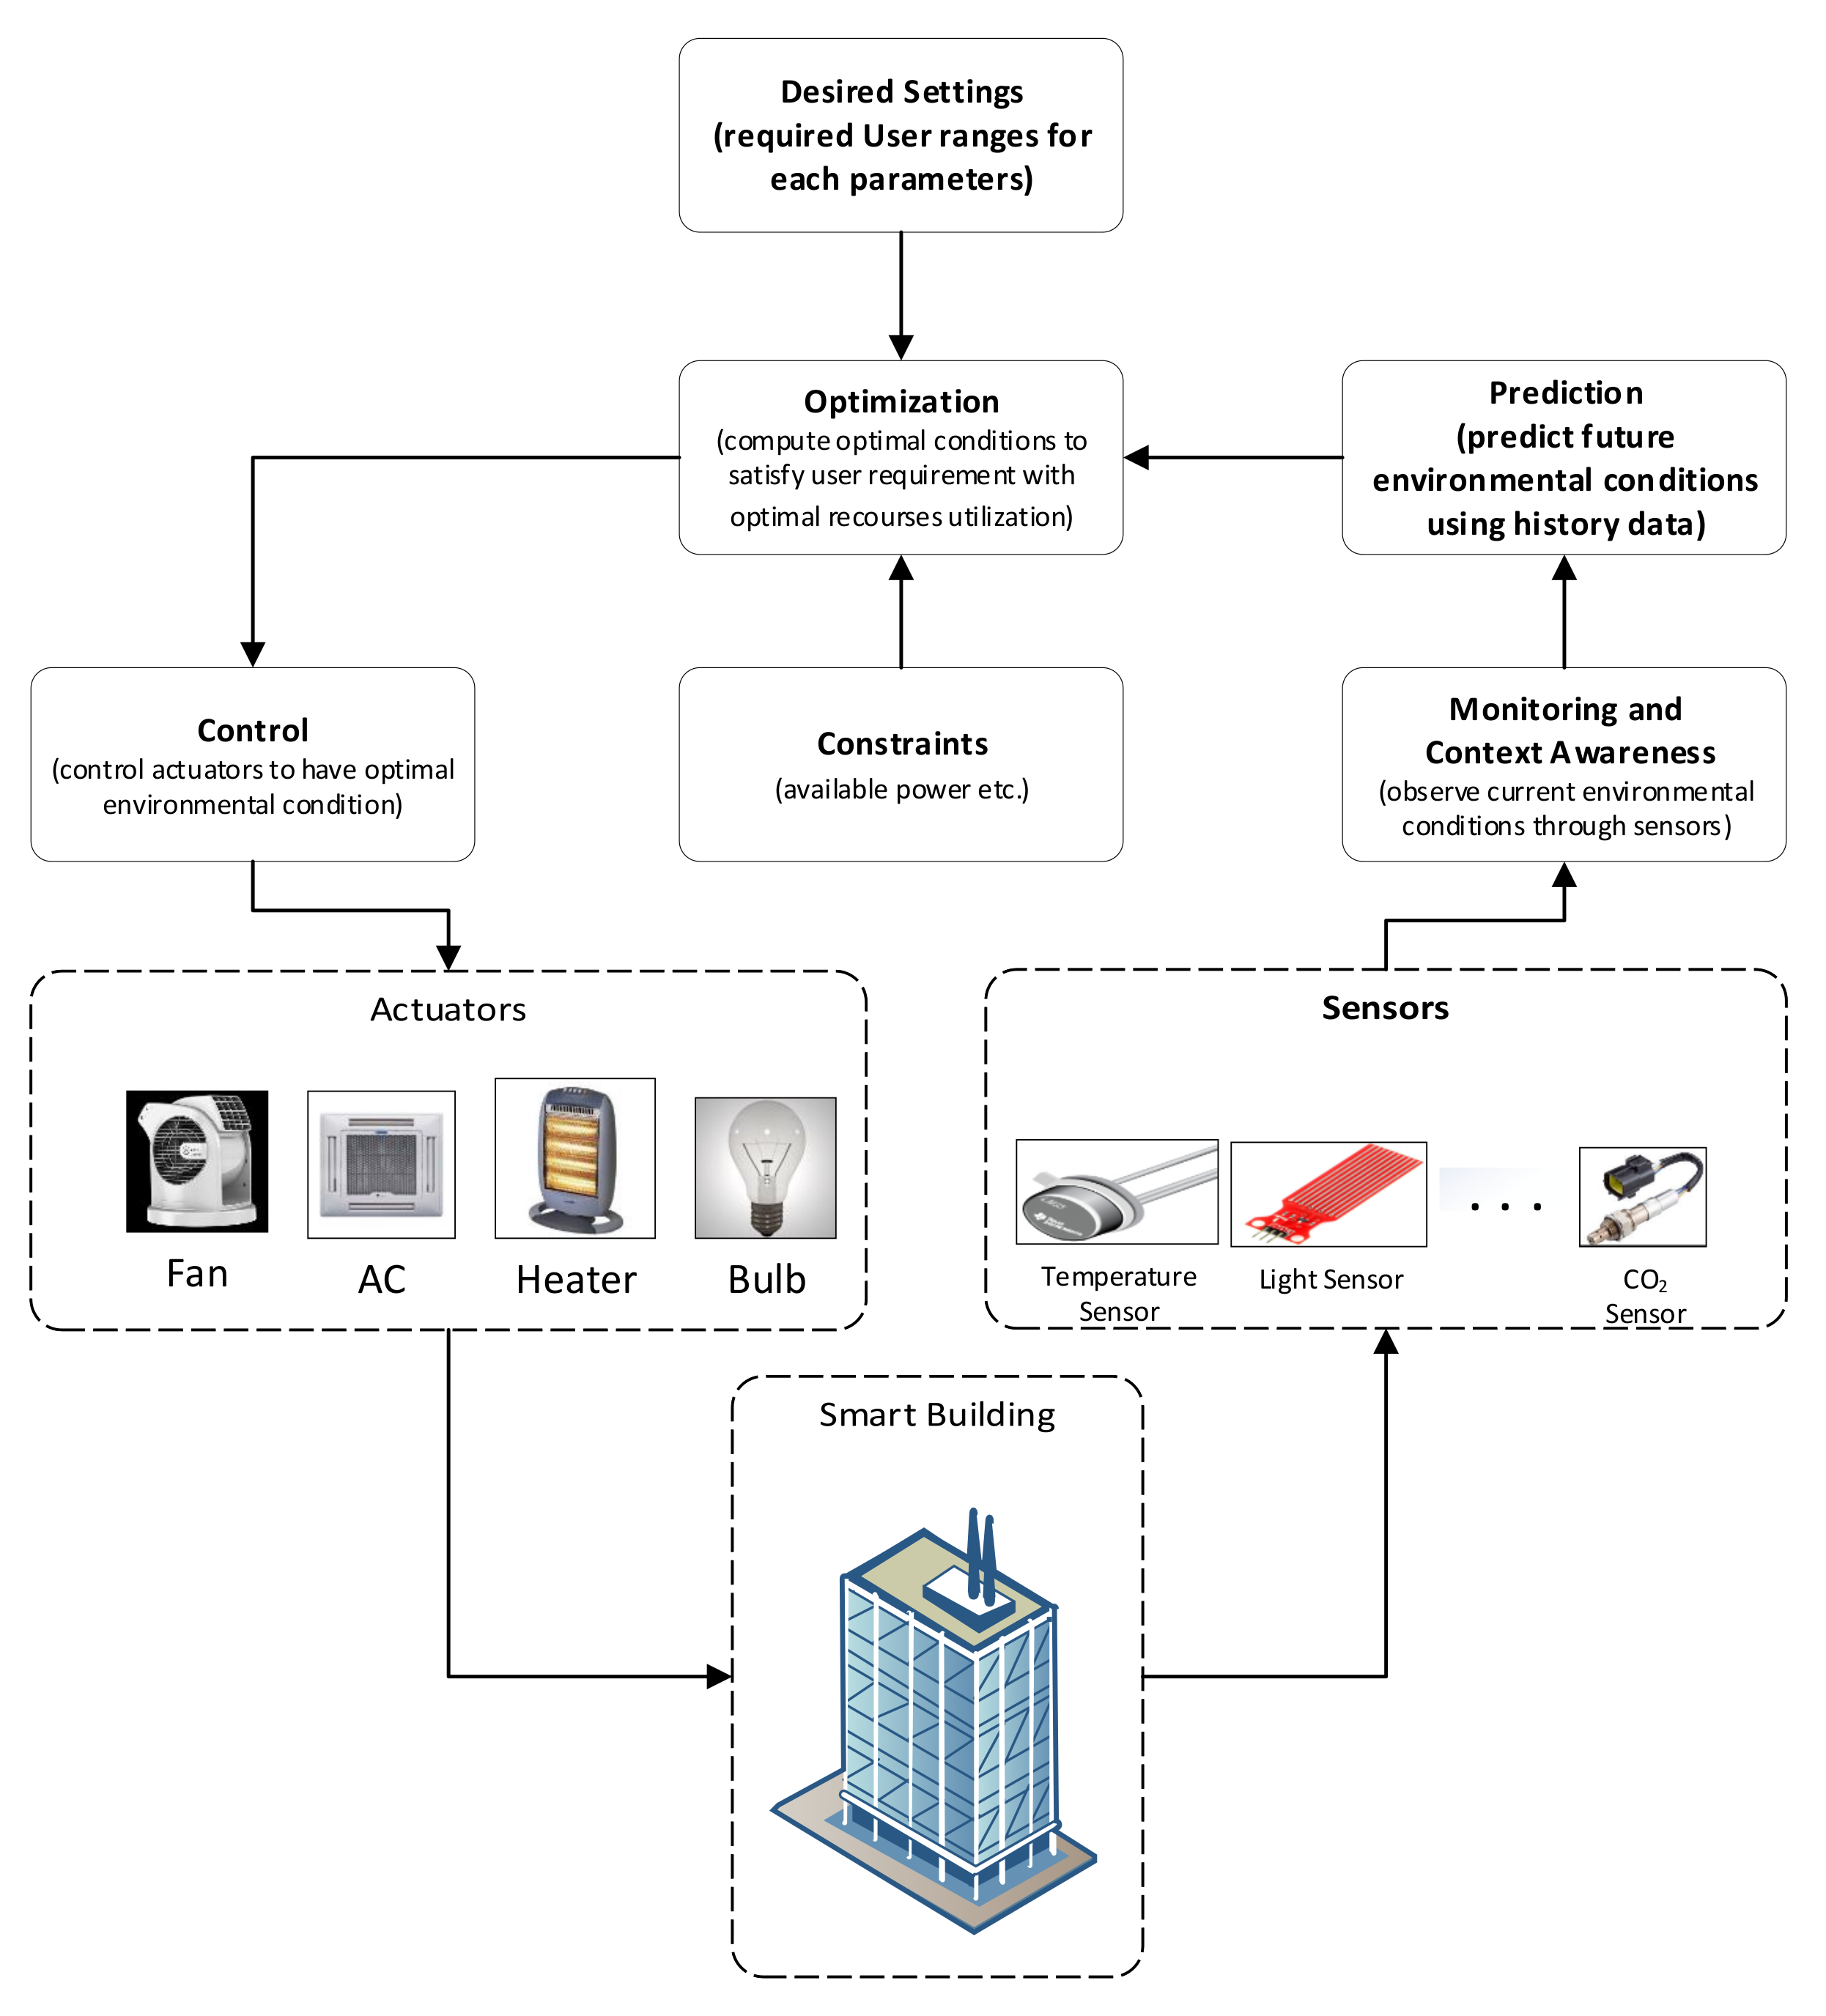
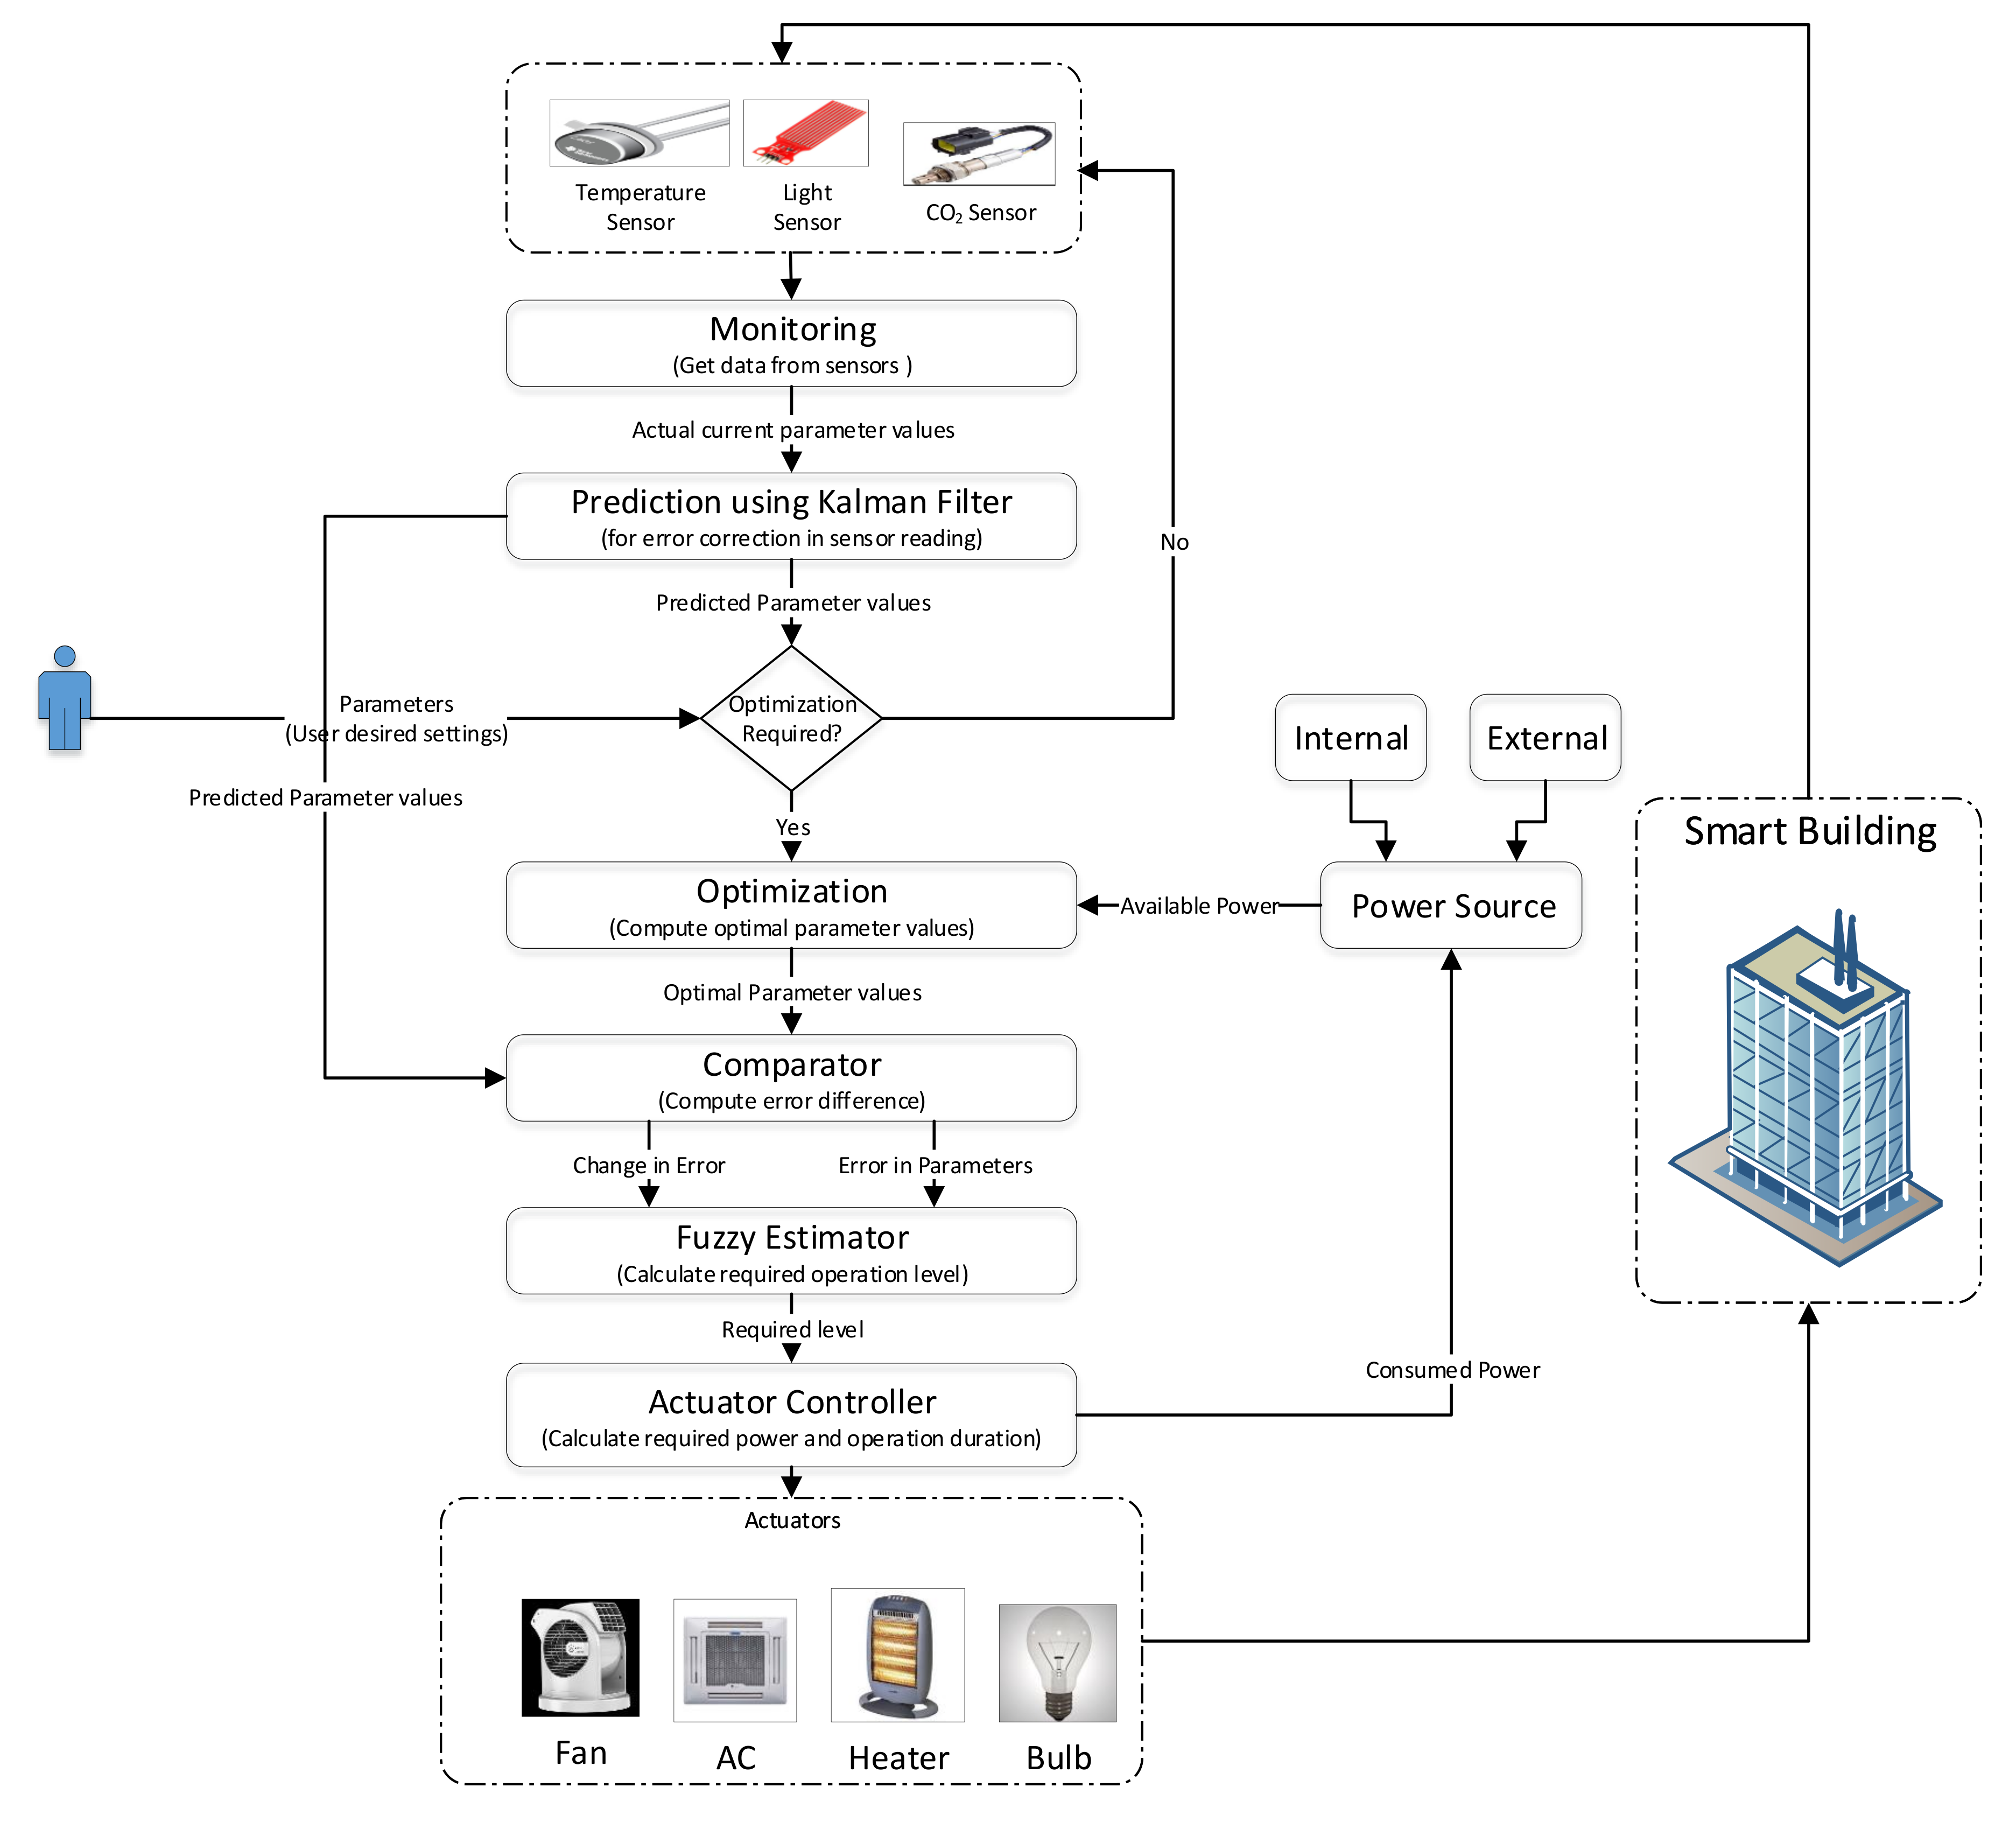
3. Proposed Conceptual Design for the Smart Energy Management System

We have developed a conceptual design for efficient energy management in the smart home environment as shown in Figure 2. We have a closed environment of interest, i.e., the smart home, which needs to be controlled by an IoT-based automated system for maintaining a comfortable environment as per the user needs and specification with efficient resource utilization. The whole process has four main steps. First, we monitor the indoor environment by collecting various data (e.g., temperature, illumination and air quality) through sensors. This gives us the current context of the indoor environment. Secondly, we apply a prediction algorithm to estimate future conditions using some historical data. This helps with adjusting/controlling the environment before it becomes worse for the users inside. Thirdly, we apply optimization techniques to compute optimal conditions by keeping in view the best settings for user needs and system constraints e.g., power. Finally, we adjust the actuator levels to control the indoor environment as per the optimized settings in order to achieve the maximum user comfort level. This helps with maintaining the best indoor conditions for the user with optimal recourse utilization.
The flowchart of the proposed system is shown in Figure 3. The process begins with reading current indoor parameter values (temperature, air quality and illumination level) from sensors inside the building. The Kalman filter algorithm is applied to remove error in sensor readings and to predict actual parameter values. Afterwords, in the optimization check, we see if any parameter value is outside the desired user range, then optimization is applied. For the optimization, we have used two algorithms—genetic algorithm (GA) and particle swarm optimization (PSO)—to compute optimal setting for each parameter in order to get the desired environmental condition inside the building. Finally, these parameters are passed to the actuator controller module in order to send the operation command to the respective controllers to adjust its operation level accordingly. The system has an internal database for storing collected data for comprehensive analysis of the system performance gain and resource savings. An interface is also provided to users in order to specify system parameters, e.g., desired (acceptable) ranges for temperature, illumination and air quality.

4. Problem Formulation for Optimization

Let us assume the current sensor readings for temperature, illumination and air quality are denoted as T c , L c , A c = t , l , a . Occupants specify the range of acceptable values for each parameters to express their preferences. Ranges for user-desired settings are given by user set points, i.e.,
U S P d = T d , L d , A d
where:
T d T m i n , T m a x ,
L d L m i n , L m a x
and:
A d A m i n , A m a x
This is based on the assumption that in the desired range, the max value actually specifies the user’s most desired settings, and the min value is the least acceptable value for the indoor parameters. If energy cost were not an issue, then the user would certainly like to have indoor parameters set to the maximum value. As setting indoor parameters to their maximum values will require high energy cost, therefore a tradeoff is required between energy consumption and user comfort. For the sake of brevity, we express the range length of each parameter as Δ T = T m a x T m i n , Δ L = L m a x L m i n and Δ A = A m a x A m i n .
Let us also assume that power consumption for per unit change in each parameter is estimated by P T , P L , P A for temperature, illumination and air quality, respectively. If we have no problem with power consumption, then we can simply set each parameter as per the user-desired setting, but in practice, we cannot afford this all the time. Therefore, we need to find some trade-off between user comfort and energy consumption. Table 1 presents a brief description of various notations used in this formulation. It is worth mentioning here that the formulation presented in the paper’s main text is valid for scenarios where heating is required (winter season). For cases (summer season) where cooling will be required, the equations will be modified slightly as explained in Appendix A.
Let our optimal parameters values be T o , L o , A o where the optimal value can be any value within the user-desired range. Thus, the total required energy for maintaining settings with optimal parameters will be:
E o = P T · T o T c + P L · L o L c + P A · A o A c
Above is the total required power for maintaining optimal settings. Similarly, we can calculate the possible minimum and maximum power consumption as below:
E m i n = P T · T m i n T c + P L · L m i n L c + P A · A m i n A c
E m a x = P T · T m a x T c + P L · L m a x L c + P A · A m a x A c
At stated earlier, we have two contradictory requirement, i.e., user comfort and energy consumption. Our objective to get the maximum gain in user comfort along with the maximum gain in energy savings (i.e., with low energy consumption). We can simply write our requirement in an abstract fashion as below:
M a x i m i z e α u c · G u c + α e s · G e s 0 , 1
where G u c is the gain in user comfort and G e s is the gain in energy savings. α u c and α e s define weights for user comfort and energy saving, respectively, and can be set as fixed or adaptive such that:
α u c + α e s = 1
User comfort gain can be formulated as:
G u c = X T , L , A β X × 1 X m a x X o Δ X 2 0 , 1
where β X X T , L , A defines the user preference for each parameter—temperature, illumination and air quality, respectively—such that:
β T + β L + β A = 1
Note: the β T , β L and β A values can be fixed or set adaptively as per the difference between current and desired parameter values.
From Equation (10), we can understand that G u c increases as optimal values for parameters get closer to the best desired values used (i.e., maximum), resulting in maximization of user comfort gain.
Next, we explore the second part of Equation (8). We know that gain in energy savings is inversely proportional to energy consumption, i.e., G e s 1 E c ( E c means consumed energy), i.e., higher energy consumption will result in lower gain in energy savings. We can formulate our gain in energy savings as below:
G e s = 1 E o E m i n Δ E 2 0 , 1
From the above equation, it can easily be deduced that G e s increases as energy required for maintaining the optimal setting ( E o ) gets close to the minimum possible energy consumption, i.e., as E o E m i n , the subtraction part in Equation (12) gets close to zero, resulting in the maximum gain in energy savings.
Using the previous formulation given in Equations (10) and (12), we can rewrite our optimization function from Equation (8) as below:
M a x i m i z e α u c · X T , L , A β X × 1 X m a x X o Δ X 2 + α e s · 1 E o E m i n Δ E 2
i.e., we want to get values for T o , L o , A o and E o such that our optimization function given in Equation (13) gets the maximum value. Higher values of T o , L o and A o will result in reducing the subtraction part in the first summation component, thus maximizing the user comfort, e.g., as T o T m a x , the subtraction part T m a x T o Δ T 2 0 , and we get the max of β T . The same holds true for L o and A o . However, higher values of T o , L o and A o will result in a loss in the energy component, i.e., higher values of T o , L o and A o will cause E o E m a x and, thus, E o E m i n Δ E 2 1 , which results in losing the gain in the energy component. Thus, Equation (13) ensures a balance between user comfort and energy consumption, which is our desired objective.
Constraints:
T c T m i n T o T m a x
0 L c L m i n L o L m a x
0 A c A m i n A o A m a x
0 E m i n E o E m a x

5. Experimental Results and Discussion

This section is dedicated to the detailed discussion of the experimental settings and results. For the sake of clarity, this section is divided into four subsections. First, we will discuss the data used in these experiments along with others necessary system parameters and settings. The second part is about our simulator implementation. In the third part, we present comprehensive performance evaluation results of our proposed scheme, which are further covered in three subsections (1) analysis of the prediction part, (2) analysis of the optimization part and (3) analysis of the actuators’ operations. Finally, a comparative analysis is performed in the fourth part of this section.

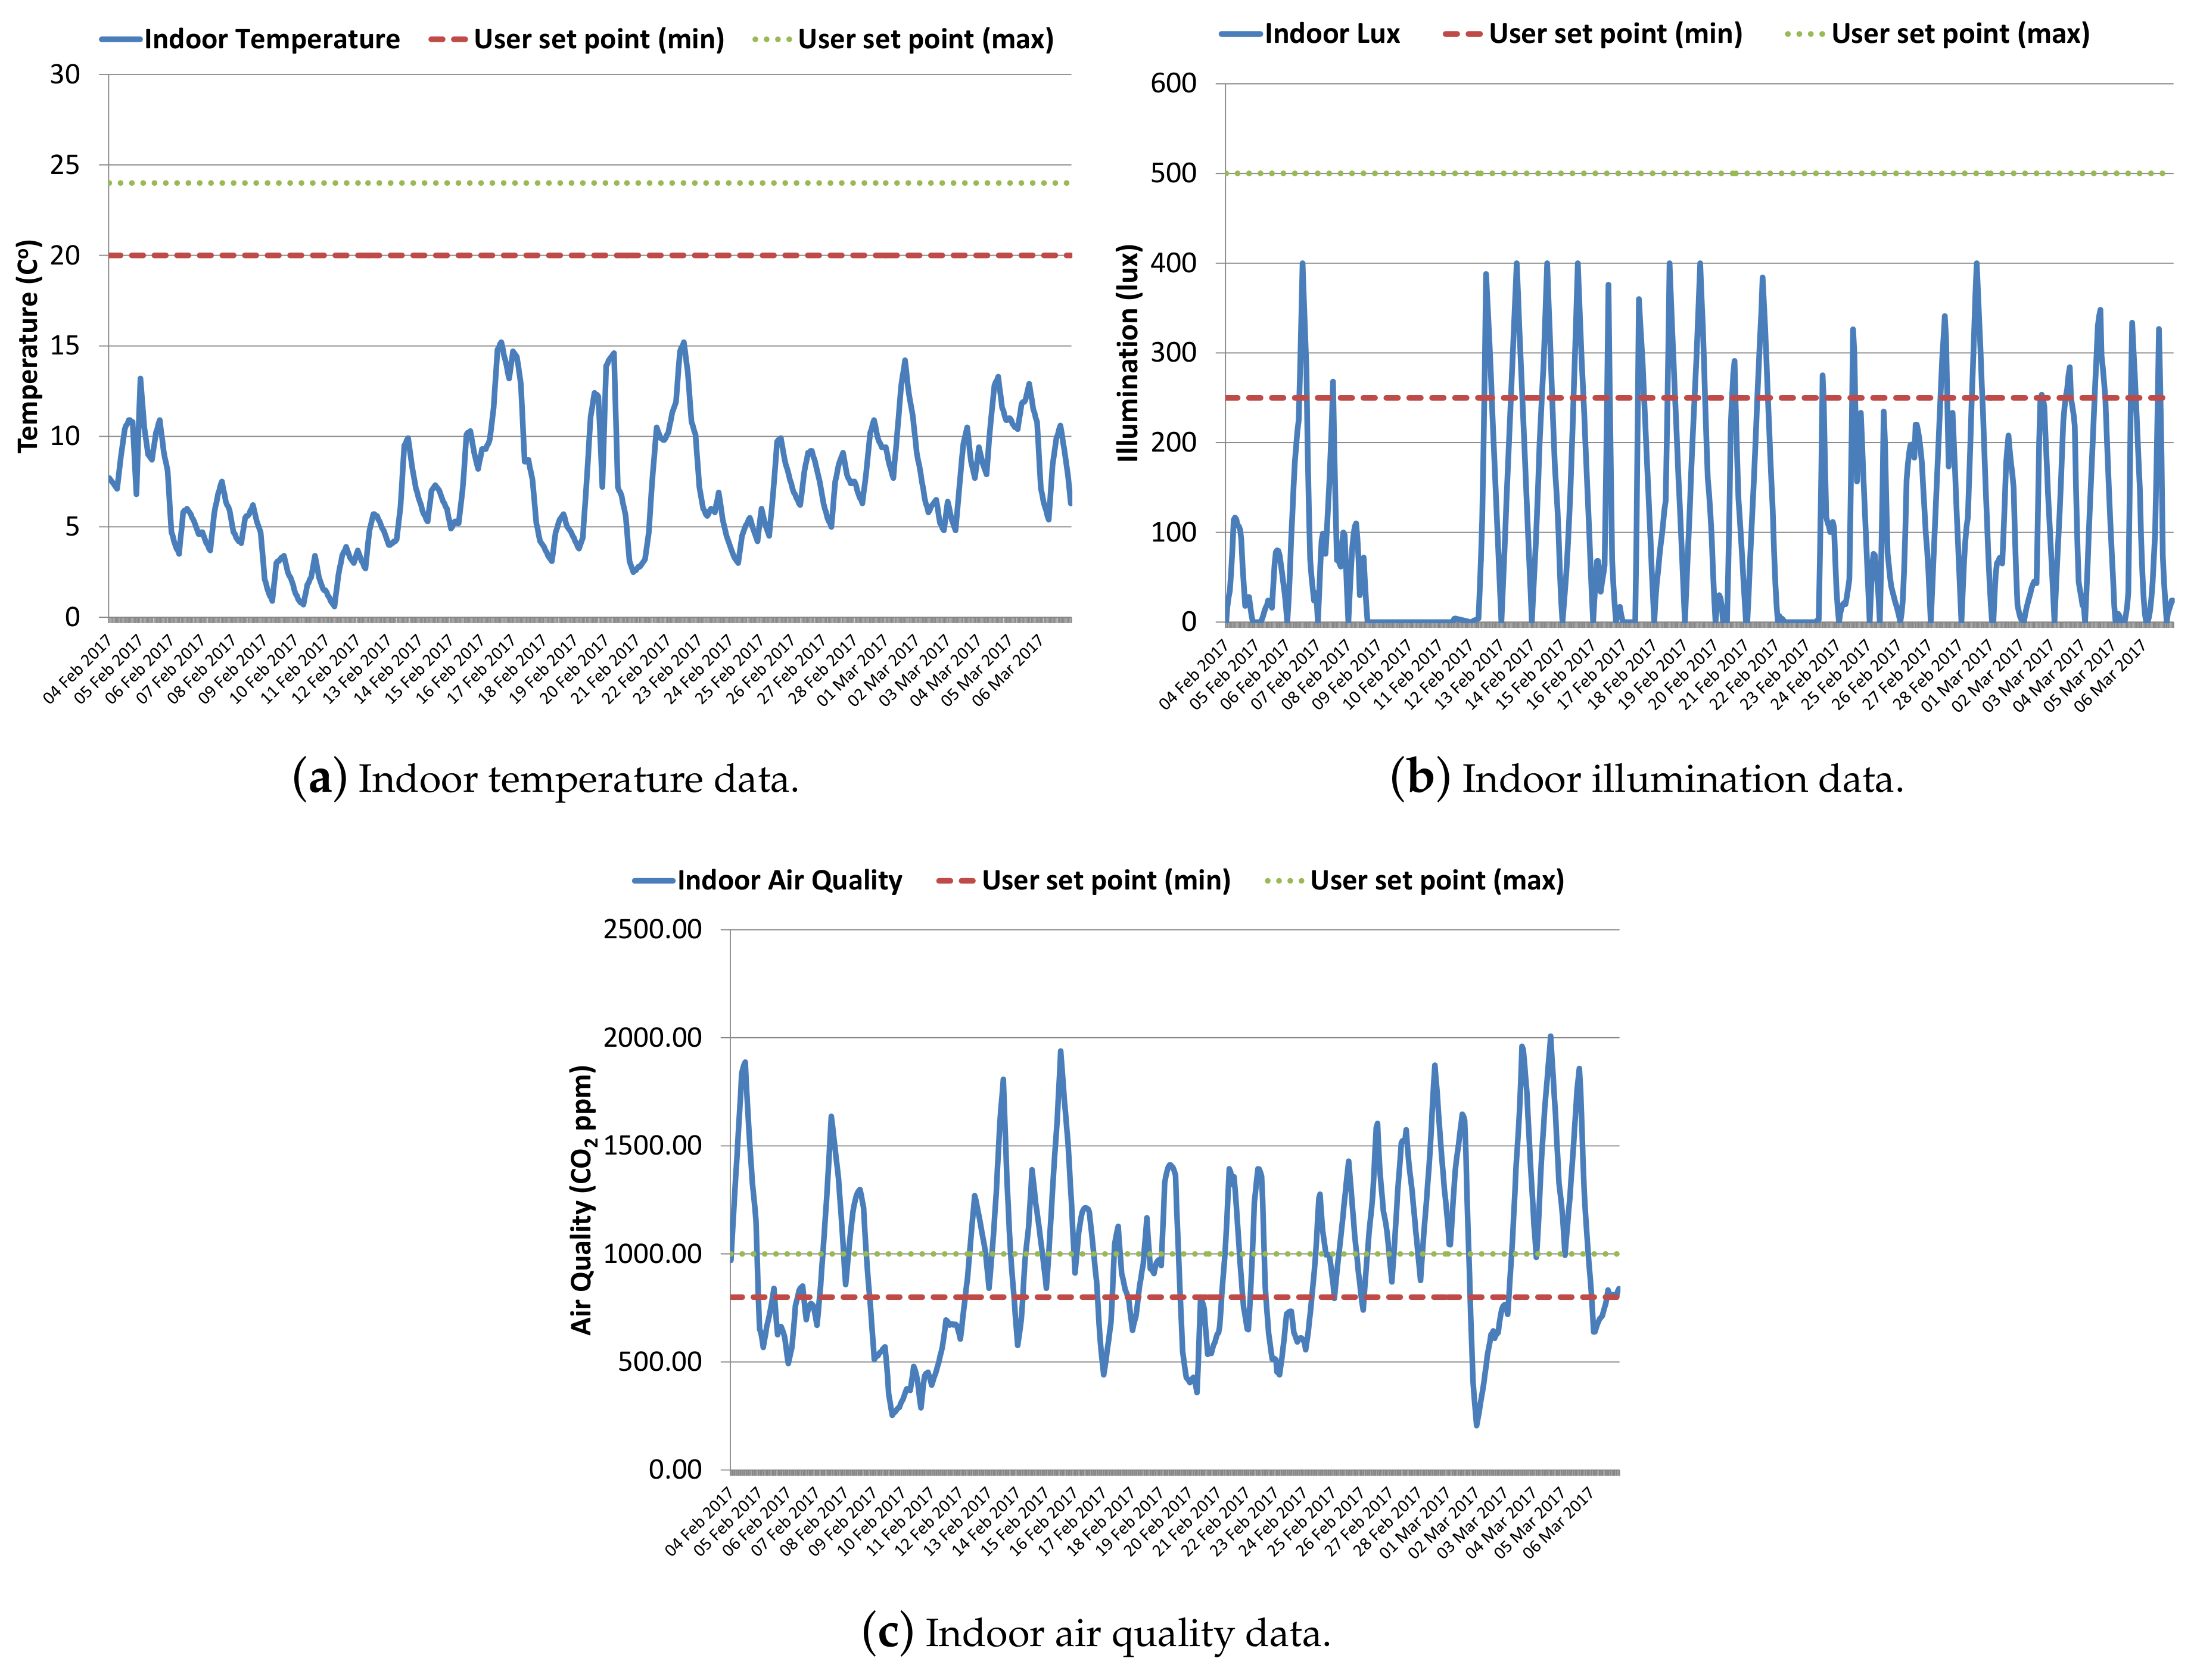
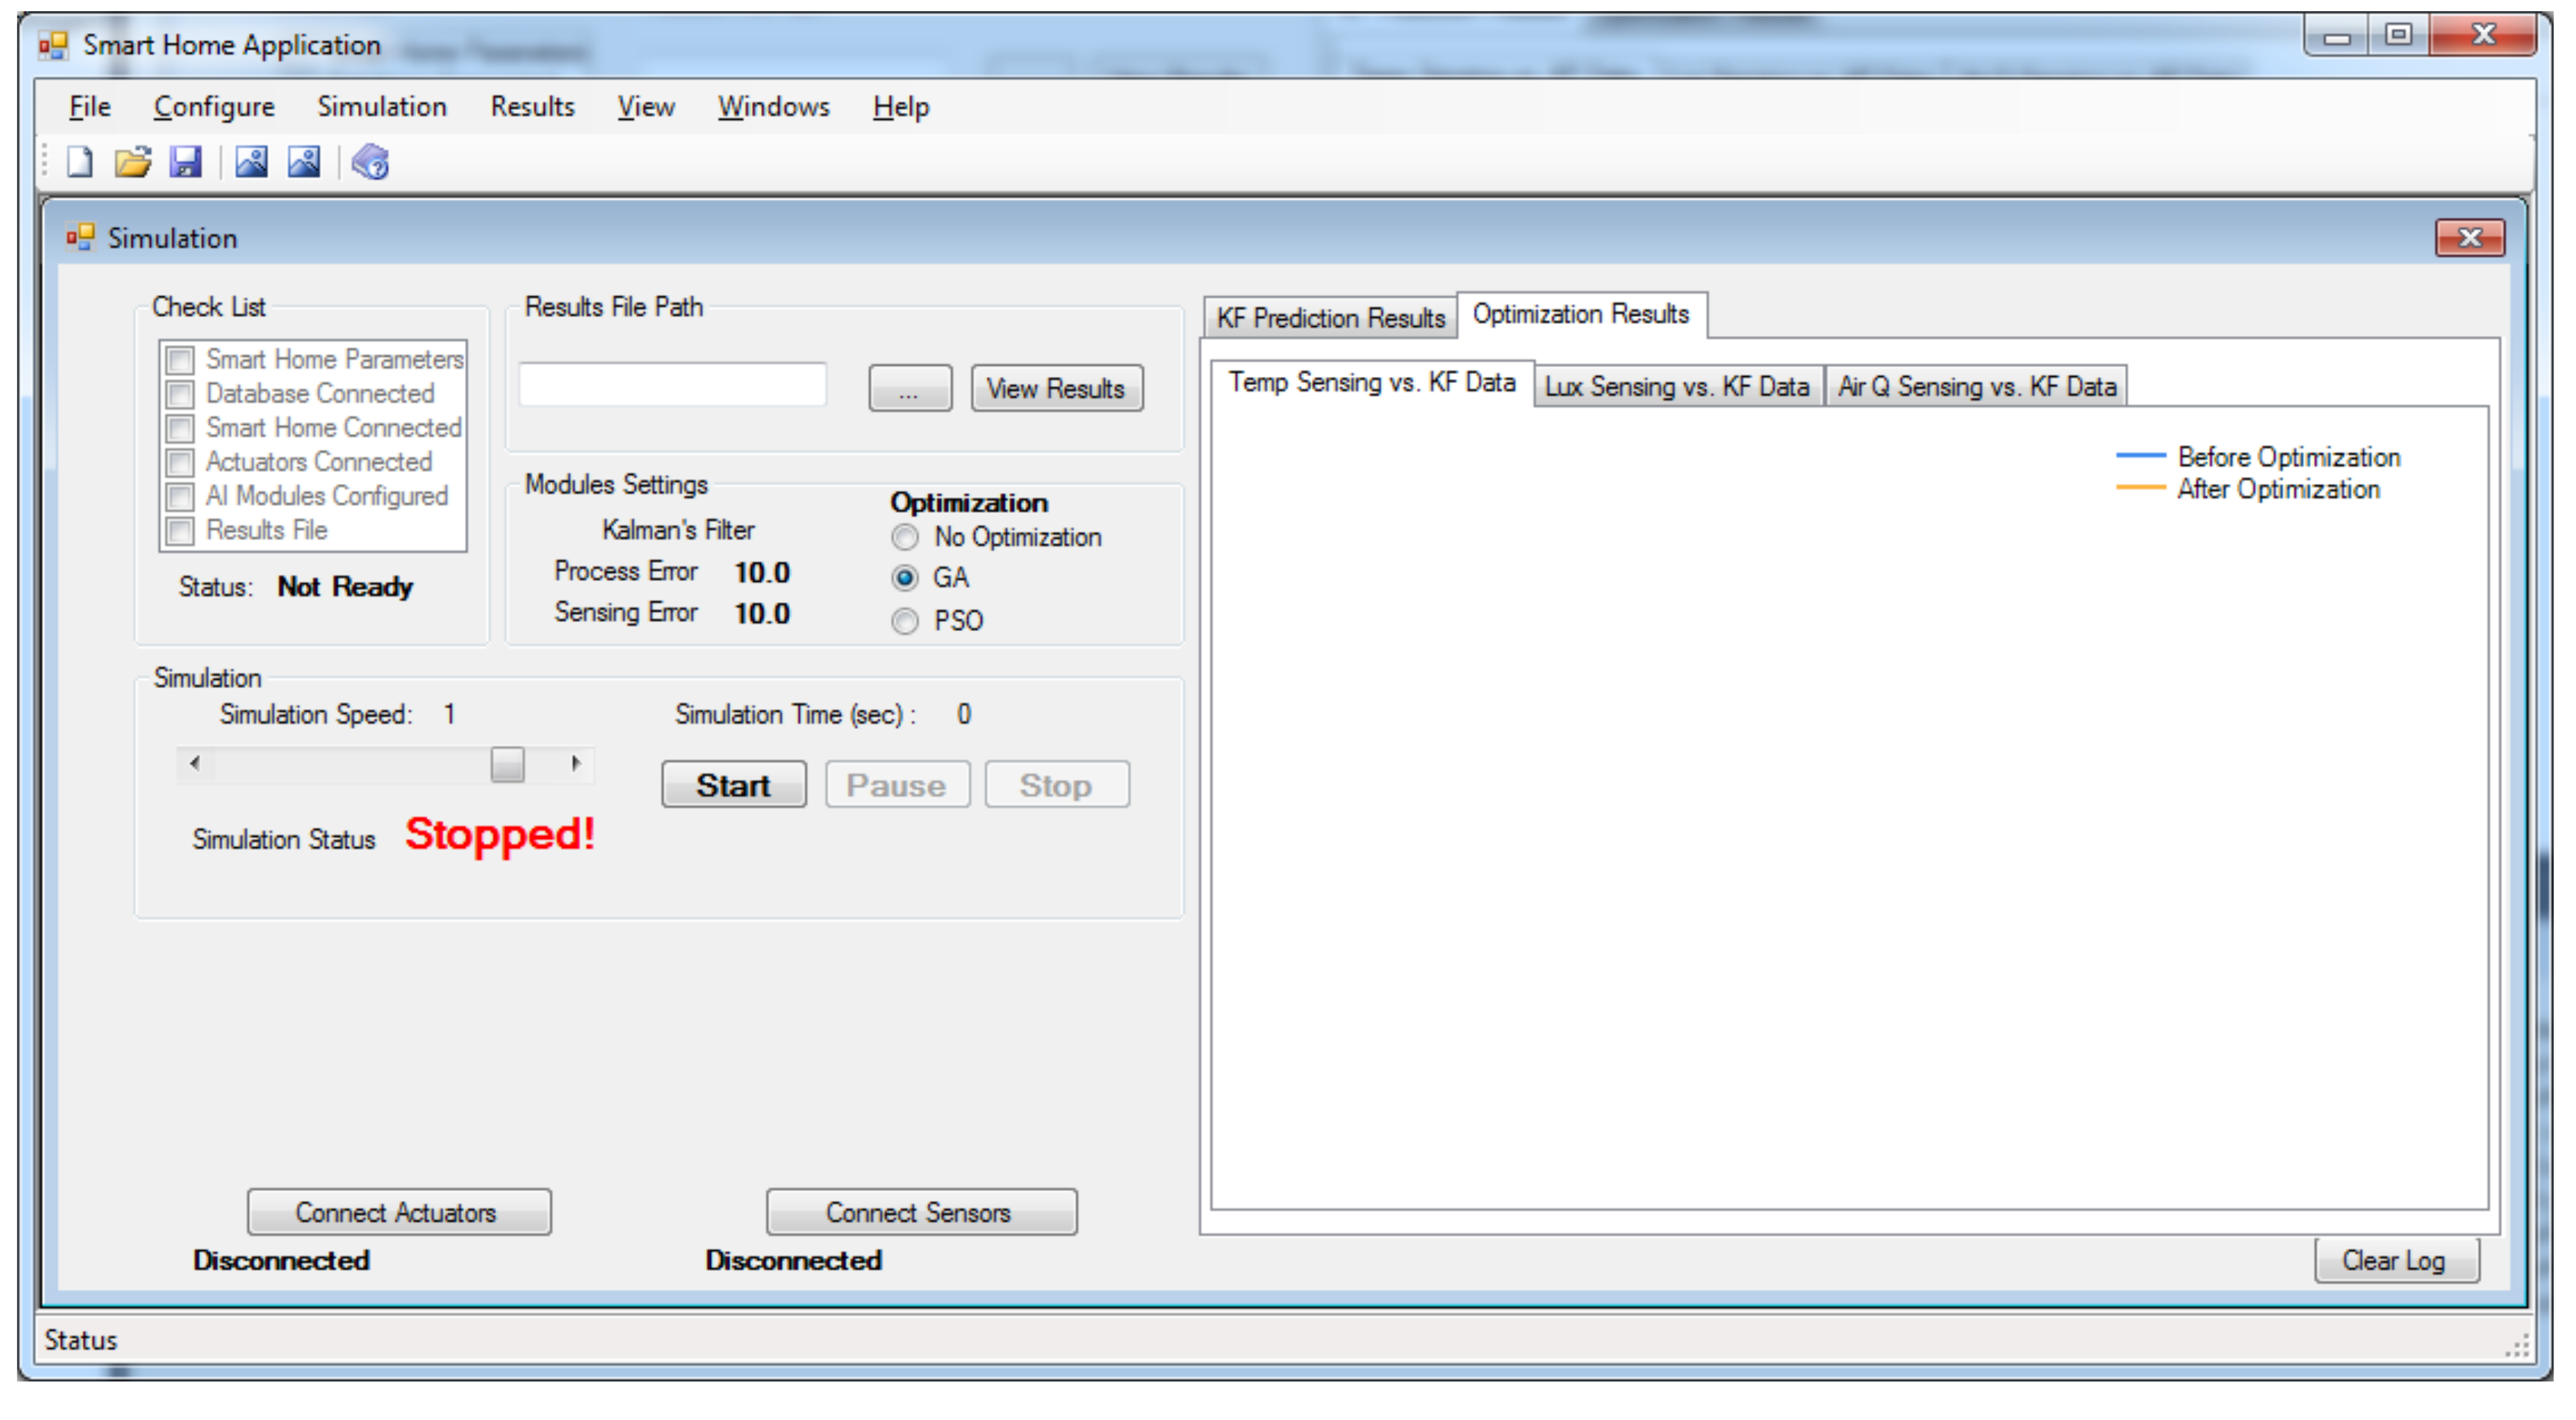
5.1. Experimental Setup

For these experiments, we have collected real data in our lab’s indoor environment for a one-month duration, i.e., from 4 February to 6 March 2017 (31 days). As discussed earlier, we are interested in controlling three indoor environmental parameters, i.e., temperature, illumination and air quality, according to user set points. Collected hourly data along with user set points are shown in Figure 4. These data were recorded in our lab’s indoor environment, consisting of two connected rooms of a total area of 80 m 2 . Each room has an inverter AC for heating and cooling, a multi-level exhaust fan for maintaining air quality and ON/OFF tube lights to maintain the desired illumination level.
Table 2 present a summary of data presented in Figure 4. Temperature values remain below 15 C as the data are collected for February and early March, which is the end of the winter season in Jeju. The user’s acceptable range for indoor temperature is 20 , 24 , so we need to operate heaters to adjust indoor temperature as per user set points. Cooling is not required in these experiments, as temperature never goes beyond user set points. The X-axis label indicates the day, but hourly data are plotted; and short cycles within the data indicate maximum and minimum temperature during the day and night time, respectively. Varying peaks in temperature data reflect the frequent variability in Jeju’s weather. The average value for indoor illumination data (i.e., 108.33 lux) indicates that we need to use auxiliary lighting most of the time to maintain indoor illumination within the user-desired range. User set points for illumination 250 , 500 are selected as per the standard recommendation for office lighting [35]. Short cycles with rising peaks in illumination data indicate maximum and minimum illumination during the day and night time. In Figure 4b, flat (near zero) values can be seen in illumination data from 9 to 11 February, which indicate cloudy weather outside resulting in low indoor illumination. Low temperature values for the same period also confirm cloudy/raining weather. Indoor air quality is measured in terms of CO 2 concentration. Repeated cycles within air quality data indicate the maximum and minimum CO 2 concentration during the day (mostly occupied) and night (less occupied), respectively. Varying peaks in indoor air quality data indicate the impact of outdoor weather and wind speed on the indoor environment. The typical concentration of CO 2 in the outdoor environment ranges from 300 to 500 ppm; thus, an acceptable range from 800 to 1000 is selected for indoor CO 2 concentration as per the American Society of Heating, Refrigeration, and Air Conditioning Engineers (ASHRAE) standard [36].

5.2. Implementation

Experiments are performed using a custom-built simulator based on indoor environment modeling by taking into consideration the impact of external environmental parameters and actuator operational level on indoor parameters. We have used a building environment emulator and an actuator emulator to interact with our smart energy management simulator. The smart energy management simulator was developed in Visual Studio C#. Figure 5 shows its main simulation interface window. Before starting the simulation process, this application needs several settings and the configuration as given in the check list. When the check list is ready, then the simulation can be initiated; otherwise, the appropriate error message will be displayed instructing the user to perform the necessary settings. Once the simulation is started, it obtains sensor reading data from the building environment emulator process via the Windows Communication Foundation (WCF) service. The Kalman filter algorithm is applied for error removal. Afterwards, optimization is performed to calculate the optimal parameter settings, which are then sent to the building actuator emulation process via the WCF service. For optimization, we have implemented two algorithms, i.e., GA and PSO. There is also a third option, no optimization scheme, which provides the baseline results for comparative analysis. A brief description of the three schemes is given below.

5.2.1. Genetic Algorithm

GA is an evolutionary search and optimization algorithm based on the principles of natural selection and genetics [37]. GA is commonly used to solve a wide range of optimization problems where the search space is too large. GA starts with an initial random population and gradually works towards the optimal solution, where each individual represents a solution of the problem to be solved. Each individual is called a chromosome and is composed of a predetermined number of genes. The steps of GA for indoor environment optimization are given below:
  • Initial random population of size S
  • Calculate the fitness of each individual using Equation (13)
  • Choose T best individuals
  • Perform single-point crossover with probability ρ among selected individuals to generate new solutions (offspring)
  • Perform mutation with rate μ
  • Calculate the fitness of new offspring using Equation (13)
  • Combine the populations of Steps (3) and (5)
  • Goto Step 2 until the required number of iterations
  • Return the best fitted chromosome as the optimal solution

5.2.2. Particle Swarm Optimization

The PSO algorithm was first described as a new modern heuristic algorithm in 1995 [38]. It is introduced as a stochastic operator-based, population-based and self-adaptive computer algorithm inspired by birds’ social behaviors. PSO has been used widely for various engineering applications and has turned out to be a powerful optimizer. The steps of the PSO algorithm for indoor environment optimization are given below:
  • Initialize
    • Randomly initialize particle positions
    • Randomly initialize particle velocities
  • Optimize
    • Calculate the fitness of each particle using Equation (13)
    • Find the global and local best particle
    • If the stopping condition is satisfied, then go to Step 3
    • Update each particle velocity and position vector using the global and local best particles
    • Go to Step 2
  • Return the best particle as the solution

5.2.3. No-Optimization Scheme

For the sake of comparison, we consider this scheme as a baseline approach for controlling the indoor environment. This approach has no optimization scheme and just selects the minimum acceptable values for each parameter in order to save the maximum energy, as this will result in the minimum operation of the actuators to consume less energy. Its working is fairly simple, i.e., the indoor environment is constantly monitored, and as soon as any parameters values are found outside user set points, then the corresponding actuator is operated to control that parameter. Intuitively, this approach will work fine, but the results are not as expected. As the objective of this approach was to save the maximum energy by making minimal changes to the indoor parameters, this is in fact counter productive. Results without optimization refer to the results of this scheme.

5.3. Proposed System Results Analysis

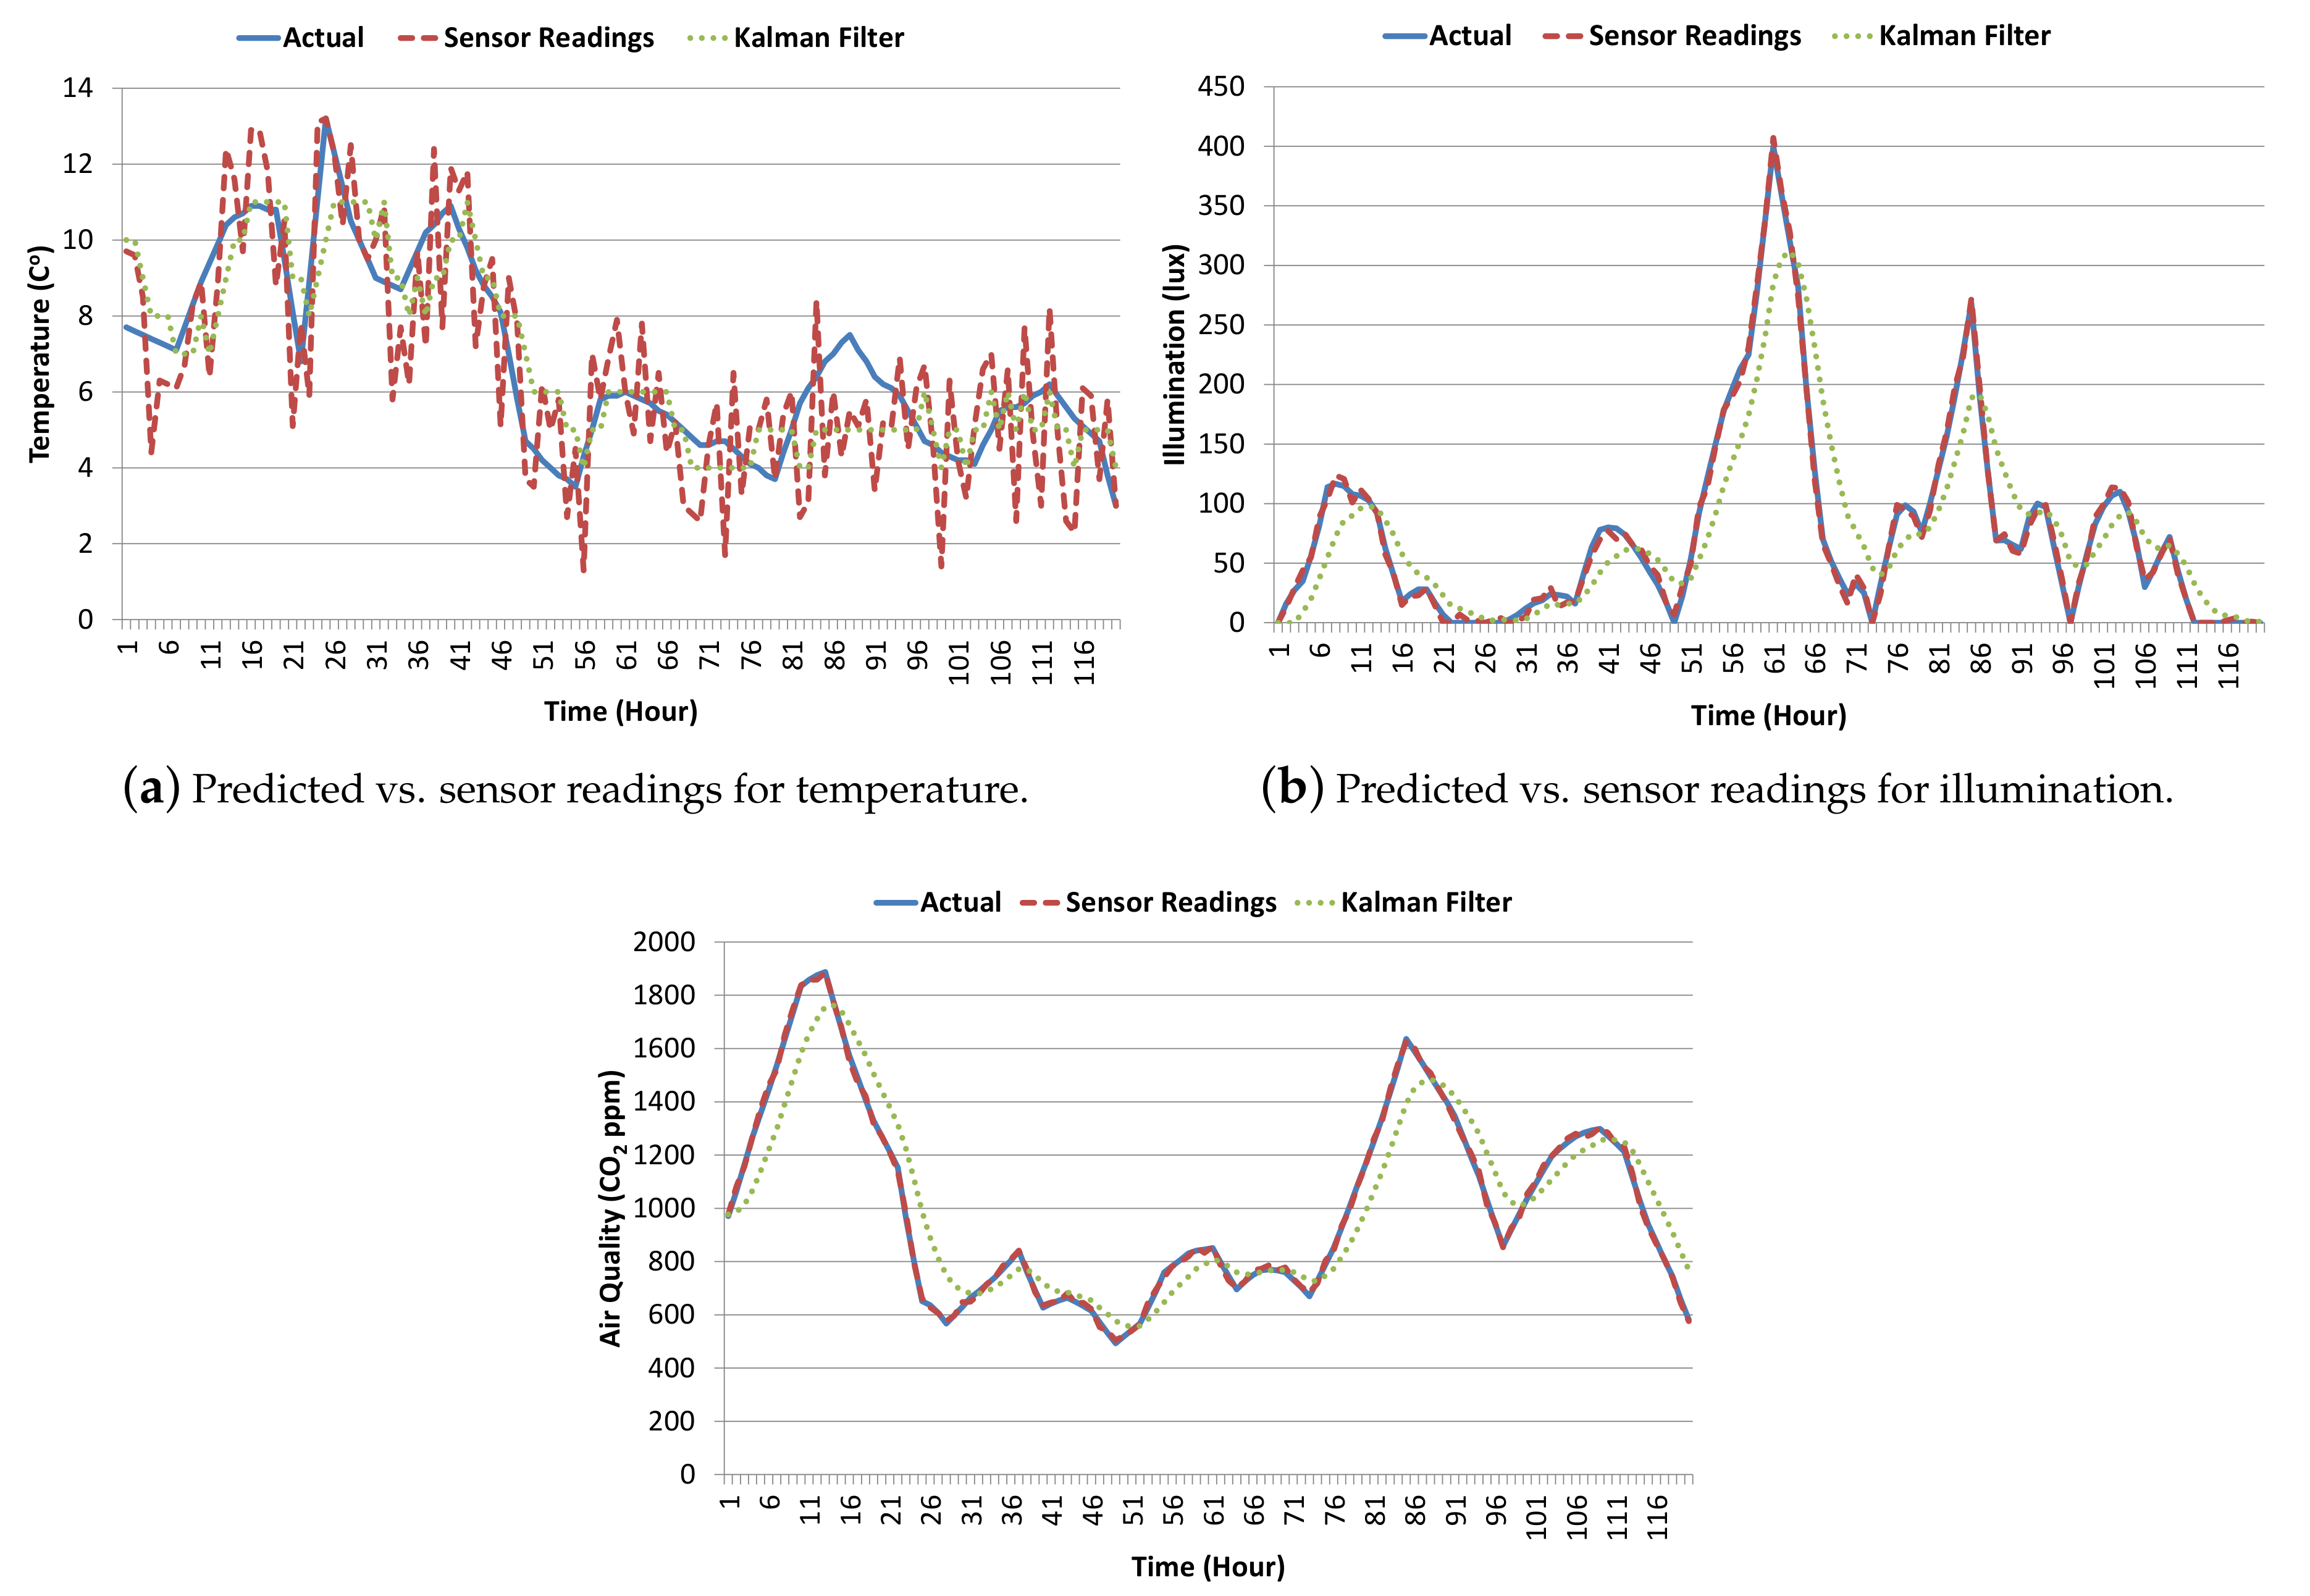
5.3.1. Analysis of the Prediction Part Based on the Kalman Filter

In this part, we have used a variation of the Kalman filter algorithm that is focused on producing a smoothing effect to remove error in sensor readings. Table 3 presents the parameter settings for the Kalman filter algorithm used for these experiments. The error factor is included in our model to factor out sensor calibration errors and the difference in sensor readings taken at different indoor locations. A relatively larger difference was observed in temperature readings when taken near the air conditioner (AC) compared to readings taken close to the corners.
Using the Kalman filter algorithm, our objective is to predict actual parameter values as shown in the results graph. Results show that the Kalman filter algorithm was able to remove error (noise) in the sensor readings and predict actual indoor environment parameter values as shown in Figure 6. For better visualization, we only show the first five days (120 h) of results in these figures.
In Figure 6a, the Kalman filter results deviate from actual temperature in the first 5 h, but later, it becomes stabilized and can accurately remove error in the temperature senor’s reading. The relative accuracy of the Kalman filter results is 1.31 in terms of root mean square error (RMSE) for whole data when compared to actual temperature. However, the RMSE for temperature sensor’s readings is relative high, i.e., 1.75 . However, in the illumination data, the mean absolute deviation (MAD) of the Kalman filter results in 0.65 for whole data, which is higher than MAD for the sensor’s readings, i.e., 0.19 when compared to actual data. Similarly, for air quality data, the MAD of the Kalman filter results is 0.11 for whole data, which is higher than MAD for the sensor’s readings, i.e., 0.01 when compared to actual data. However, in this case, the Kalman filter behaves like a predictor and nicely creates a smoothing effect in sensing data as shown in Figure 6b,c. This manifests the utility of the Kalman filter algorithm in our proposed system to accurately estimate the contextual environment from sensor readings.

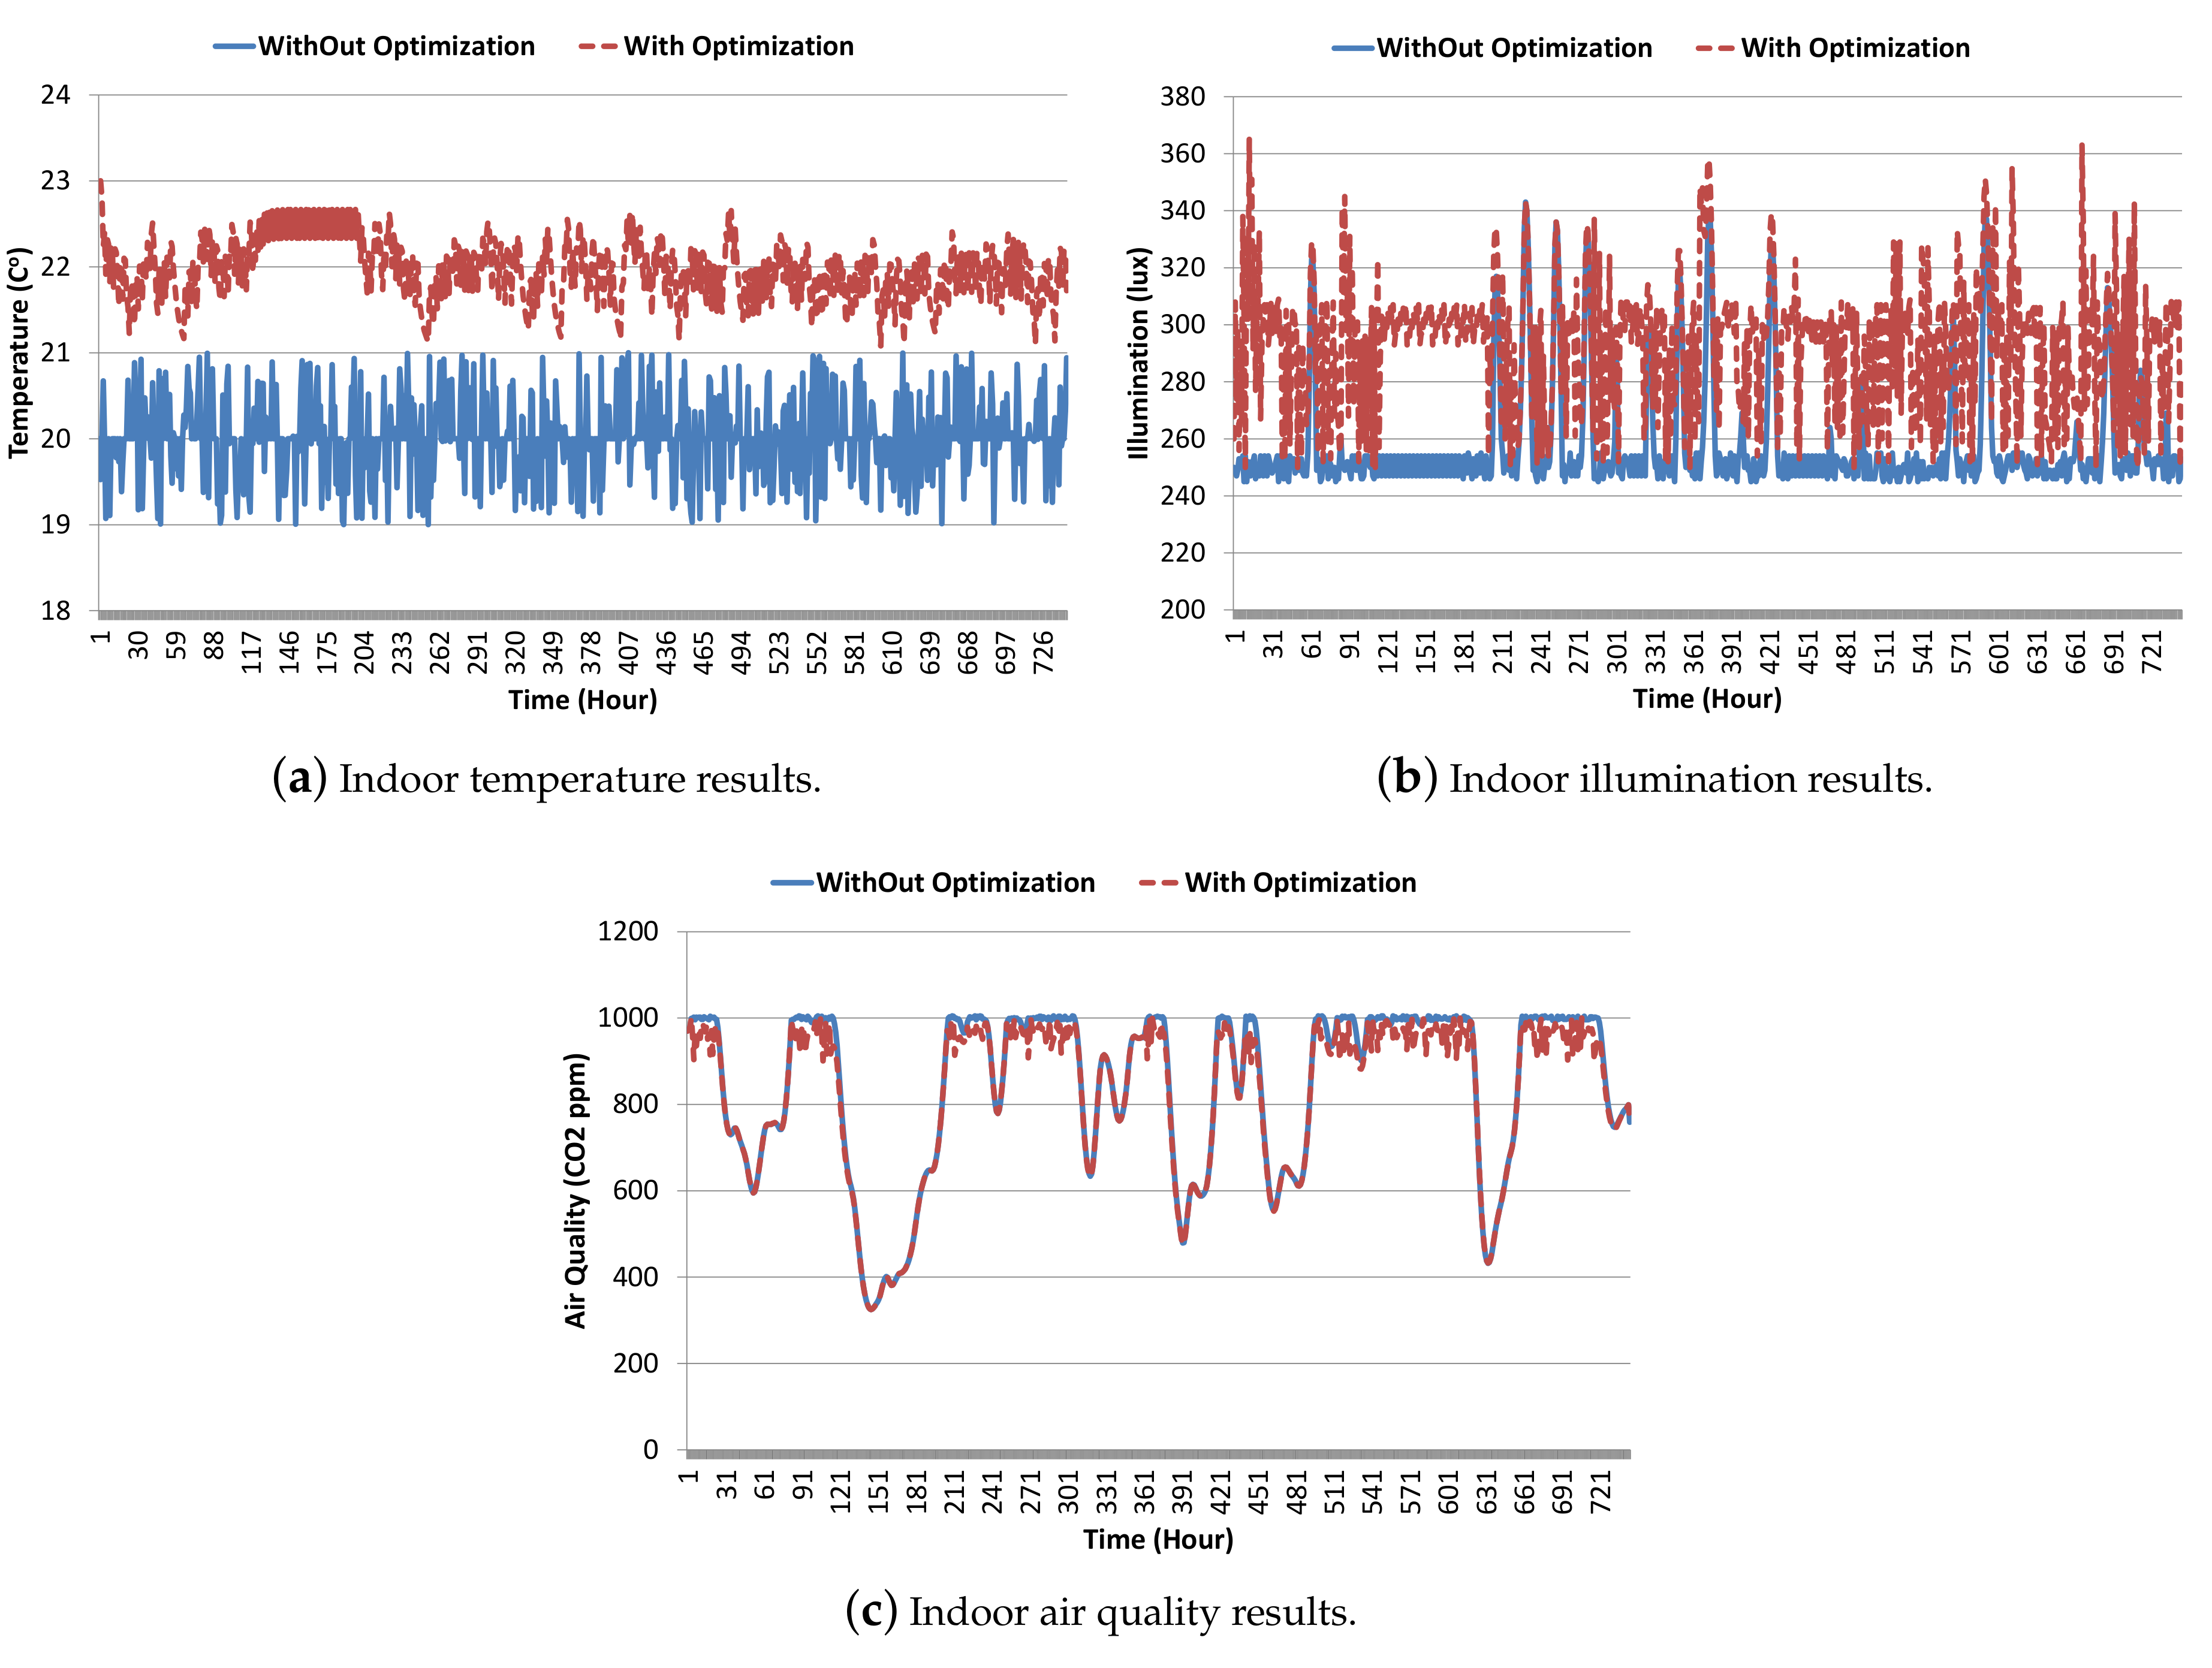
5.3.2. Analysis of the Optimization Part

Our proposed formulation for optimal resource utilization in the smart home environment has four parts as given in Equation (13). The contribution of each part to the overall optimization value is controlled by alpha and beta values, which can be fixed or set adaptively. However, these experiments were performed with fixed alpha and beta values as given in Table 4. We have collected energy consumption data for indoor parameter changes and have observed that the per unit change in indoor temperature requires 150 kWh (approx.) and the per unit level change in air quality and illumination requires approximately 30 kWh. In other words, the per unit temperature change requires five-times more power than the per unit level change in air quality and illumination. Therefore, we consider P T = 5 , P A = P L = 1 . This ratio may change depending on the indoor environment and actuator installation, but will have low impact on relative results as the same values are then used by all approaches. Moreover, sensor readings are taken every five minutes, then optimization is done if required. Actuator levels are set for a five-minute duration, and afterwards, this may be changed if new optimal parameters are calculated. In our simulation model, we consider external environment parameters to remain the same for a one-hour duration as per the recorded data.
The first part in our optimization formula controls the temperature level such that the maximum user comfort can be achieved. The second part is for maintaining the desired illumination level inside the building. Similarly, the third part is for maintaining the desired air quality inside the building. The formulation tries to get the maximum out of each of the three components, but it will result in increased energy consumption, i.e., loss in the fourth part of the optimization function, which is included for energy optimization. As stated earlier, each parameter value can be selected anywhere between the M i n , M a x range as given in Table 2. The optimization approach tries to find a balancing point in order to have minimum power consumption with maximum user comfort. Figure 7 presents the first five days (120 h) of results to show the impact of the optimization on the indoor environmental parameters of temperature, illumination and air quality, respectively. Actual data indicate the environmental parameter values before optimization. These results illustrate the impact of optimization on the indoor parameters, and we can easily extract the amount of change made in each parameter by comparing the corresponding actual and optimized values. For instance, in Figure 7a, the initial indoor temperature is 7.6 C and the corresponding optimal temperature was set to 23 C. The increase in indoor temperature can be seen from the second hour. Afterwards, a constant fluctuation in indoor temperature is observed, which is due to the cold external temperature, which pulls down the indoor temperature, whereas the optimization process pulls it up by keeping it within the user-desired range 20 , 24 . Similarly, in Figure 7b, initial indoor illumination is 0 lux (night time) and the corresponding optimal illumination was set to 260 lux. The increase in indoor illumination can be observed as being due to external day light and internal auxiliary lighting. Afterwards, a constant fluctuation in indoor illumination can be seen, which is attributed to the variation in external day light. The optimization process ensures indoor illumination to be inside the user-preferred settings, i.e., 250 , 500 . During Hours 60 to 65 (on 6 February), the actual and the optimized indoor illuminations are the same because the actual illumination is within the user-desired range, so the optimization is not required. In fact, 6 February was a clear sunny day in Jeju. Indoor air quality optimization is done when the indoor CO 2 level goes beyond user set points, i.e., greater than 1000 ppm, as shown in Figure 7c. Furthermore, we can observe cycles in indoor CO 2 depending upon indoor occupancy i.e., rise during day time and fall during night time. On 5 and 6 February, indoor air quality is good due to external high speed wind approaching 40 km/h approximately which helps in auto ventilation of indoor environment.

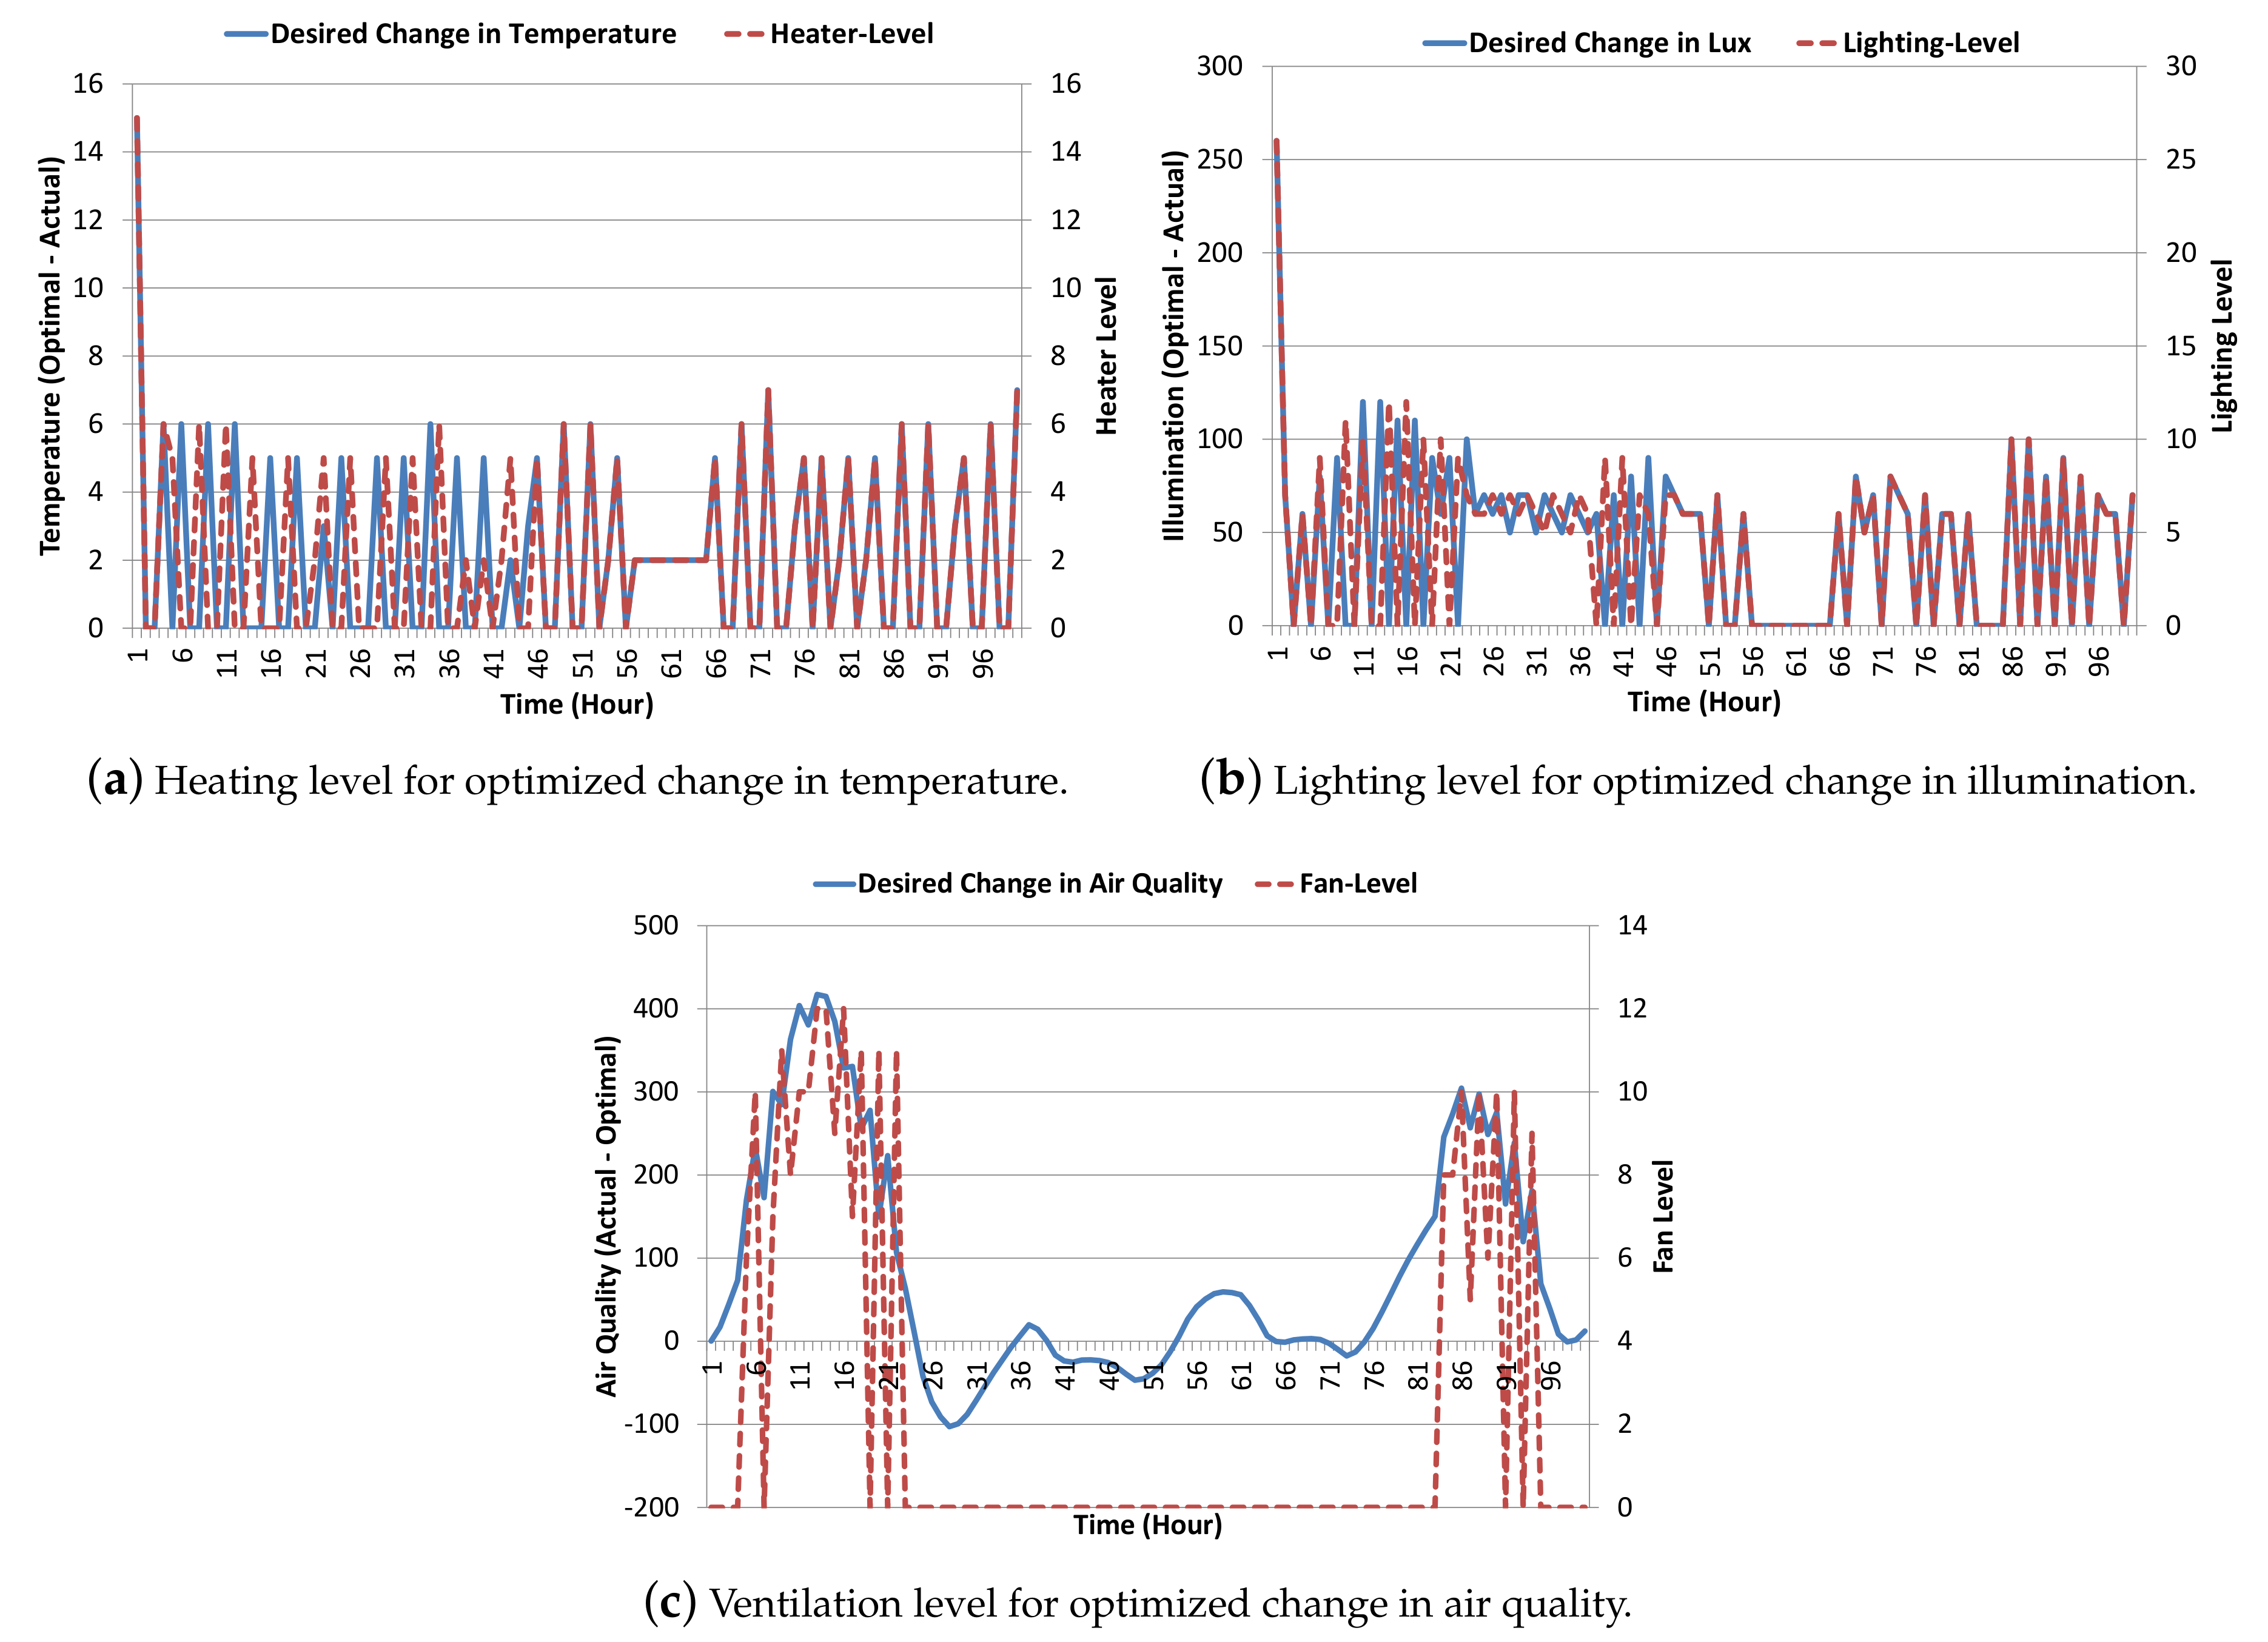
5.3.3. Analysis of the Actuators’ Operations

The optimization process results in the change in actual indoor parameters through necessary adjustment in the actuators’ operational level. The actuators’ operational level needs to be changed according to the desired change in the indoor parameters. Figure 8 shows the first four days of results (100 h) of the desired change in the indoor parameters along with the corresponding actuators’ operation levels for temperature, illumination and air quality, respectively. The desired change in the indoor parameters is plotted against the primary vertical axis, and the corresponding actuators level is plotted along the secondary vertical axis. The heater operation level reflects the desired change in temperature, i.e., for an increase of x °C in temperature, and the heater operation level needs to be set to x, as shown in Figure 8a. In the beginning, where a 15 °C change in temperature was required, the heater operation level was set to 15. Afterwards, a small change in the heater operational level is made along with the fluctuation in indoor temperature. Similarly, the lighting level reflects the desired proportional change in illumination, i.e., lighting operational level x indicates a 10 × x change in indoor illumination, as shown in Figure 8b. In the beginning, where a 260 change in illumination was required, the lighting operation level was set to 26. Afterwards, adjustment of the lighting operational level is made along with the fluctuation in indoor illumination. The fan operational level reflects ventilation desired for a proportional change in indoor CO 2 concentration, i.e., a unit rise in fan operational level results in a 50-ppm change in indoor CO 2 concentration, as shown in Figure 8c. During the second and third day when the indoor air quality is good (within the desired user set points), the fan actuator need not be operated. On the fourth day, adjustment of the fan operational level is made along with fluctuations in indoor air quality.

5.4. Comparative Analysis

Before presenting the power consumption and achieved user comfort level results, first, we look at how the two schemes perform in maintaining the desired indoor environment setting inside the building. Figure 9 shows the hourly results for 31 days indicating that both schemes nicely maintain the desired parameter level inside the building, i.e., all three parameters are within the desired user ranges for each of the three schemes.
No-optimization scheme makes minimal changes and keeps the indoor parameters on the boundary line with user set points. Indoor temperature without optimization fluctuates around the user’s least acceptable value, i.e., 20 °C, as shown in Figure 9a. However, variation in indoor temperature is observed with the optimization scheme. Similarly, the no-optimization scheme results for indoor illumination and air quality remain around 250 lux and 1000 ppm, respectively. Rising peaks in indoor illumination results for the no-optimization scheme in Figure 9b are due to external day light, as can be seen in the original data for indoor illumination given in Figure 4b. The difference in air quality results for both schemes can be seen at points where the indoor CO 2 concentration goes beyond 1000 ppm, as shown in Figure 9c. The no-optimization scheme results for indoor air quality stay just around 1000 ppm, whereas the optimization scheme tries to pull this back below 1000 ppm as much as is feasible.
Although there is no difference in either scheme as far as maintaining the desired environment inside the building is concerned, as both approaches seem to be satisfying user comfort, however, a great difference in the two schemes is revealed when quantified in terms of user comfort index and energy consumption. Next, we compare their performances in terms of resource utilization.
Through optimization, we tried to find a tradeoff between two contradictory requirements. We want to have low energy consumption, which compels us to operate actuators for a lesser duration, but this will result in degradation in achieving the user comfort level, i.e., maintaining the lowest acceptable setting, which is also not desirable. Our optimization formula helps us find the best optimal settings for indoor parameters and maintains a balance between energy consumption and user comfort gain. Figure 10a,b shows the results comparison in terms of user comfort gain and power consumption. This figure also includes the results obtained with PSO for the sake of comparison. A brief summary of the optimization schemes’ results is given in Table 5.
The no-optimization scheme target was to keep indoor parameters on the boundary line with user set points, but due to rapid fluctuations in the external environment, it failed to maintain the desired user settings all of the time. Particularly, temperature and indoor illumination results given in Figure 9a,b indicate that the no-optimization scheme’s performance deteriorated with respect to user set points. This results in degradation of the overall user comfort index for the no-optimization scheme, i.e., 0.87 (on avg.), as shown in Figure 10a. Furthermore, contrary to expectations, the no-optimization scheme also resulted in more energy consumption, as shown in Figure 10b. This is due to the fact that one or more actuating devices are operational all of the time, and the power consumption graph stayed around 20 kWh. Total energy consumption during 31 days for the no-optimization scheme was about 15.96 MWh, whereas PSO and GA resulted in 12.13 MWh and 11.63 MWh, respectively. Both optimization algorithms, PSO and GA, try to find optimal values for indoor parameters away from the boundary line of user set points, which results in higher instant energy consumption, as indicated by the peaks in Figure 10b. This strategy not only helps with maintaining the indoor environment as per the user-desired settings for a longer period of time, resulting in improved user comfort, as shown in Figure 10a, but also creates an automated duty cycling effect for actuating devices, allowing them to turn off and save energy. This phenomenon is reflected by the repeated cycles in the power consumption graph in Figure 10b for the PSO and GA results. Compared to GA, PSO stretches the optimal values for the indoor environment parameter a little longer and results in higher peaks for power consumption. However, higher peaks of energy consumption in PSO result in little to no improvement in the user comfort index (0.967) as compared to the GA results (0.964). In other words, we can say that GA outperforms the PSO algorithm, as GA can give almost the same user comfort index results as the PSO algorithm, but with relatively low energy consumption.

6. Conclusions and Future Work

This paper presents a detailed study of IoT application in a smart home for energy optimization. We have proposed an improved optimization function that ensures the maintenance of the desired environment inside the building as per the user-desired settings with optimal energy utilization. The Kalman filter algorithm is used to remove noise in sensor readings by predicting actual parameter values. A comprehensive formulation is done for energy optimization with detailed analysis. For the optimization, we have used the GA and PSO algorithms and performed a comparative analysis with a baseline scheme on data collected for a one-month duration in our lab’s indoor environment. Experimental results show that the proposed optimization schemes have achieved a 27.32 % and a 31.42 % reduction in energy consumption, by PSO and GA, respectively. The user comfort index was also improved by 10 % , i.e., from 0.86 to 0.96 . The GA-based optimization results were better than PSO, and it achieved almost the same user comfort with a 4.19 % reduced energy consumption. In this paper, our objective was to develop a smart energy management system that can maintain the desired environment in a smart home using IoT-based sensor data by controlling various actuators’ operation. The system is flexible enough to serve as a foundation for a complete system and includes various other sensor data, e.g., user occupancy, building design parameters, etc. In the future, we are looking forward to extending this work by performing a complete analysis of the proposed system for energy savings and the effect on the actuator ON/OFF sequence.

Acknowledgments

This work was supported by Institute for Information & communications Technology Promotion (IITP) grant funded by the Korea government (MSIT) (No.2017-0-00756, Development of interoperability and management technology of IoT system with heterogeneous ID mechanism), and this research was supported by the MSIT (Ministry of Science and ICT), Korea, under the ITRC (Information Technology Research Center) support program (IITP-2017-2014-0-00743) supervised by the IITP (Institute for Information & communications Technology Promotion), Any correspondence related to this paper should be addressed to Do-Hyeun Kim; [email protected].

Author Contributions

Israr Ullah designed the optimization scheme for energy efficiency in smart homes with maximization of user comfort, implemented the system, performed the experiments and did the paper writeup. DoHyeun Kim conceived of the overall idea of resource optimization in smart homes and supervised this work. Both authors contributed to this paper.

Conflicts of Interest

The authors declare no conflict of interest.

Appendix A. Modifications of the Equations for the Cooling Case

The formulation for maintaining temperature in a smart indoor environment is a little complex and therefore briefly explained here. In fact, there are two possible scenarios.
  • Case 1: When the current temperature is below the user-desired range, then heating will be required. The formulation for this scenario is covered in the paper’s main text. The constraint given in Expression (14) covers this case.
  • Case 2: When the current temperature is above the user-desired range, then cooling will be required. The formulation for this scenario will require minor adjustments in certain equations, which are given here.
    If T m a x T c , then cooling will be required, and we need to choose at optimal temperature T o through optimization where T o T c . The equation for total required energy for maintaining settings with optimal parameters will change as below:
    E o = P T · T c T o + P L · L o L c + P A · A o A c
    Above is the total required power for maintaining optimal settings where cooling is required for temperature. Similarly, calculations for possible minimum and maximum power consumption in this case will also change as below:
    E m i n = P T · T c T m a x + P L · L m i n L c + P A · A m i n A c
    E m a x = P T · T c T m i n + P L · L m a x L c + P A · A m a x A c
    The equation for the computation of user comfort gain will also change as below:
    G u c = β T × T m a x T o Δ T 2 + X L , A β X × 1 X m a x X o Δ X 2 0 , 1
    The constraint for the second case is given below:
    T m i n T o T m a x T c
    Note: when the current temperature is inside the desired user range, i.e., T m i n T c T m a x , then no optimization is required for temperature.

References

  1. Kim, S.; Kim, S. A multi-criteria approach toward discovering killer IoT application in Korea. Technol. Forecast. Soc. Chang. 2016, 102, 143–155. [Google Scholar] [CrossRef]
  2. Korea Energy Statistical Information System. Available online: http://www.kesis.net/main/mainEng.jsp (accessed on 9 October 2017).
  3. Dounis, A.I.; Caraiscos, C. Advanced control systems engineering for energy and comfort management in a building environment—A review. Renew. Sustain. Energy Rev. 2009, 13, 1246–1261. [Google Scholar] [CrossRef]
  4. Wang, Z.; Yang, R.; Wang, L. Multi-agent control system with intelligent optimization for smart and energy-efficient buildings. In Proceedings of the IECON 2010—36th Annual Conference on IEEE Industrial Electronics Society, Glendale, AZ, USA, 7–10 Novomber 2010; pp. 1144–1149. [Google Scholar]
  5. Emmerich, S.J.; Persily, A.K. State-of-the-Art Review of CO2 Demand Controlled Ventilation Technology and Application; Diane Publishing: Collingdale, PA, USA, 2003. [Google Scholar]
  6. Ali, S.; Kim, D. Optimized power control and comfort management in building environment. In Proceedings of the 2013 FTRA International Conference on Advanced IT, engineering and Management (FTRA AIM-13), Seoul, Korea, 21–23 Febuary 2013; pp. 145–146. [Google Scholar]
  7. Ali, S.; Kim, D.H. Effective and comfortable power control model using Kalman filter for building energy management. Wirel. Pers. Commun. 2013, 73, 1439–1453. [Google Scholar] [CrossRef]
  8. Levermore, G.J. Building Energy Management Systems: Applications to Low-Energy HVAC and Natural Ventilation Control; Taylor & Francis: Abingdon, UK, 2000. [Google Scholar]
  9. Benard, C.; Guerrier, B.; Rosset-Louerat, M. Optimal building energy management: Part 2—Control. J. Sol. Energy Eng. 1992, 114, 13–22. [Google Scholar] [CrossRef]
  10. Curtiss, P.S.; Kreider, J.; Shavit, G. Neural Networks Applied to Buildings—A Tutorial and Case Studies in Prediction and Adaptive Control; Technical Report; American Society of Heating, Refrigerating and Air-Conditioning Engineers: Atlanta, GA, USA, 1996. [Google Scholar]
  11. Tang, K.S.; Man, K.F.; Chen, G.; Kwong, S. An optimal fuzzy PID controller. IEEE Trans. Ind. Electr. 2001, 48, 757–765. [Google Scholar] [CrossRef]
  12. Kolokotsa, D.; Stavrakakis, G.; Kalaitzakis, K.; Agoris, D. Genetic algorithms optimized fuzzy controller for the indoor environmental management in buildings implemented using PLC and local operating networks. Eng. Appl. Artif. Intell. 2002, 15, 417–428. [Google Scholar] [CrossRef]
  13. Kusiak, A.; Li, M.; Zhang, Z. A data-driven approach for steam load prediction in buildings. Appl. Energy 2010, 87, 925–933. [Google Scholar] [CrossRef]
  14. Širokỳ, J.; Oldewurtel, F.; Cigler, J.; Prívara, S. Experimental analysis of model predictive control for an energy efficient building heating system. Appl. Energy 2011, 88, 3079–3087. [Google Scholar] [CrossRef]
  15. Lin, B.; Li, S.; Xiao, Y. Optimal and learning-based demand response mechanism for electric water heater system. Energies 2017, 10, 1722. [Google Scholar] [CrossRef]
  16. Wang, Z.; Wang, L.; Dounis, A.I.; Yang, R. Multi-agent control system with information fusion based comfort model for smart buildings. Appl. Energy 2012, 99, 247–254. [Google Scholar] [CrossRef]
  17. Edwards, R.E.; New, J.; Parker, L.E. Predicting future hourly residential electrical consumption: A machine learning case study. Energy Build. 2012, 49, 591–603. [Google Scholar] [CrossRef]
  18. Winkelmann, F.; Birdsall, B.; Buhl, W.; Ellington, K.; Erdem, A.; Hirsch, J.; Gates, S. DOE-2 Supplement: Version 2.1E; Technical Report; Lawrence Berkeley Lab.: Berkeley, CA, USA; Hirsch (James J.) and Associates: Camarillo, CA, USA, 1993. [Google Scholar]
  19. Crawley, D.B.; Lawrie, L.K.; Winkelmann, F.C.; Buhl, W.F.; Huang, Y.J.; Pedersen, C.O.; Strand, R.K.; Liesen, R.J.; Fisher, D.E.; Witte, M.J.; et al. EnergyPlus: Creating a new-generation building energy simulation program. Energy Build. 2001, 33, 319–331. [Google Scholar] [CrossRef]
  20. Crawley, D.B.; Hand, J.W.; Kummert, M.; Griffith, B.T. Contrasting the capabilities of building energy performance simulation programs. Build. Environ. 2008, 43, 661–673. [Google Scholar] [CrossRef] [Green Version]
  21. Karatasou, S.; Santamouris, M.; Geros, V. Modeling and predicting building’s energy use with artificial neural networks: Methods and results. Energy Build. 2006, 38, 949–958. [Google Scholar] [CrossRef]
  22. Li, K.; Su, H.; Chu, J. Forecasting building energy consumption using neural networks and hybrid neuro-fuzzy system: A comparative study. Energy Build. 2011, 43, 2893–2899. [Google Scholar] [CrossRef]
  23. Bluyssen, P.M.; Aries, M.; van Dommelen, P. Comfort of workers in office buildings: The European HOPE project. Build. Environ. 2011, 46, 280–288. [Google Scholar] [CrossRef]
  24. Marino, C.; Nucara, A.; Pietrafesa, M. Proposal of comfort classification indexes suitable for both single environments and whole buildings. Build. Environ. 2012, 57, 58–67. [Google Scholar] [CrossRef]
  25. Yumurtaci, R. Role of energy management in hybrid renewable energy systems: Case study-based analysis considering varying seasonal conditions. Turk. J. Electr. Eng. Comput. Sci. 2013, 21, 1077–1091. [Google Scholar] [CrossRef]
  26. Wright, J.A.; Loosemore, H.A.; Farmani, R. Optimization of building thermal design and control by multi-criterion genetic algorithm. Energy Build. 2002, 34, 959–972. [Google Scholar] [CrossRef]
  27. Abido, M. Optimal design of power-system stabilizers using particle swarm optimization. IEEE Trans. Energy Convers. 2002, 17, 406–413. [Google Scholar] [CrossRef]
  28. Huang, W.; Lam, H. Using genetic algorithms to optimize controller parameters for HVAC systems. Energy Build. 1997, 26, 277–282. [Google Scholar] [CrossRef]
  29. Obara, S.; Kudo, K. Multiple-purpose operational planning of fuel cell and heat pump compound system using genetic algorithm. Trans. Soc. Heat. Air Cond. Sanit. Eng. Japan 2003, 65–76. [Google Scholar]
  30. Li, H.; Nalim, R.; Haldi, P.A. Thermal-economic optimization of a distributed multi-generation energy system—A case study of Beijing. Appl. Therm. Eng. 2006, 26, 709–719. [Google Scholar] [CrossRef]
  31. Ferdyn-Grygierek, J.; Grygierek, K. Multi-variable optimization of building thermal design using genetic algorithms. Energies 2017, 10, 1570. [Google Scholar] [CrossRef]
  32. Delgarm, N.; Sajadi, B.; Kowsary, F.; Delgarm, S. Multi-objective optimization of the building energy performance: A simulation-based approach by means of particle swarm optimization (PSO). Appl. Energy 2016, 170, 293–303. [Google Scholar] [CrossRef]
  33. Hakimi, S.; Tafreshi, S.M.; Kashefi, A. Unit sizing of a stand-alone hybrid power system using particle swarm optimization (PSO). In Proceedings of the 2007 IEEE International Conference on Automation and Logistics, Jinan, China, 18–21 August 2007; pp. 3107–3112. [Google Scholar]
  34. Shaikh, P.H.; Nor, N.B.M.; Nallagownden, P.; Elamvazuthi, I.; Ibrahim, T. A review on optimized control systems for building energy and comfort management of smart sustainable buildings. Renew. Sustain. Energy Rev. 2014, 34, 409–429. [Google Scholar] [CrossRef]
  35. United States Department of Labor. Safety and health regulations for construction. In 29 Code of Federal Regulation, Part 1926; Occupational Safety and Health Administration, United States Department of Labor: Washington, DC, USA, 2003. [Google Scholar]
  36. ASHRAE. Standard 62.1—2016 Ventilation for Acceptable Indoor Air Quality; American Society of Heating, Refrigerating and Air-Conditioning Engineers: Atlanta, GA, USA, 2016. [Google Scholar]
  37. Holland, J.H. Adaptation in Natural and Artificial Systems: An Introductory Analysis with Applications to Biology, Control, and Artificial Intelligence; MIT Press: Cambridge, MA, USA, 1992. [Google Scholar]
  38. Kennedy, J.; Eberhart, R.C. Particle swarm optimization. In Proceedings of the IEEE International Conference on Neural Networks, Perth, WA, Australia, 27 November–1 December 1995. [Google Scholar]
Figure 1. Sector-wise energy consumption in South Korea [2].
Energies 10 01818 g001
Figure 2. Smart energy management system: conceptual design.
Energies 10 01818 g002
Figure 3. System flow diagram for the smart energy management system.
Energies 10 01818 g003
Figure 4. Collected hourly data along with user set points for 31 days (744 h).
Energies 10 01818 g004
Figure 5. Smart energy management system application main window.
Energies 10 01818 g005
Figure 6. Kalman filter predictions vs. sensor readings: first five days (120 h) of results.
Energies 10 01818 g006
Figure 7. Optimized vs. actual indoor parameters: first five days (120 h) of results.
Energies 10 01818 g007
Figure 8. Change in actuators’ level for the optimized change in the indoor parameters: first four days (100 h) of results.
Energies 10 01818 g008
Figure 9. Optimization vs. no-optimization scheme: 31 days (744 h) of results.
Energies 10 01818 g009
Figure 10. Results comparison of GA, PSO and the no-optimization scheme: first five days (125 h) of results.
Energies 10 01818 g010
Table 1. Description of notations used in the formulation.
NotationDescription
T c Current temperature (°C).
L c Current illumination (lux).
A c Current air quality (ppm).
T o Optimal temperature (°C).
L o Optimal illumination (lux).
A o Optimal air quality (ppm).
U S P d Desired user set points.
T d User-desired temperature range.
L d User-desired illumination range.
A d User-desired air quality range.
P T Required power for per unit change in temperature (kWh).
P L Required power for per unit level change in illumination (kWh).
P A Required power for per unit level change in air quality (kWh).
E o Required energy for optimal change in indoor parameters (kWh).
G u c Gain in user comfort.
G e s Gain in energy savings.
α u c , α e s User preference for comfort and energy savings.
β T , β L , β A User preference for temperature, illumination and air quality.
Table 2. Data summary with user set points.
ParameterMaxMinAvg.User Set Points
Temperature15.200.607.19[20, 24]
Illumination400.000.00108.33[250, 500]
Air Quality2007.27205.91982.19[800, 1000]
Table 3. Parameter settings for the analysis of Kalman’s filter algorithm.
ParameterValues/Range
Process noise covariance matrix (Q)1
Sensing noise covariance matrix (R)10
Error in temperature sensor reading±3
Error in illumination sensor reading±10
Error in CO 2 sensor reading±20
Table 4. Parameter settings for the optimization algorithm.
ParameterValues/Range
α u c 0.5
α e s 0.5
β 1 0.4
β 2 0.3
β 3 0.3
P T 5
P L 1
P A 1
Table 5. Optimization schemes’ result summary.
Optimization SchemeUser Comfort Index (avg.)Total Power Consumption (kWh)
No-optimization scheme0.8715,969
Particle Swarm Optimization (PSO)0.96712,130
Genetic Algorithm (GA)0.96411,632

