Review

Analysis of Determinants of the Impact and the Grid Capability to Evaluate and Improve Grid Resilience from Extreme Weather Event

1
Department of Energy Systems Research, Ajou University, Suwon 16499, Korea
2
Korea Electric Power Research Institute, Daejeon 34056, Korea
*
Author to whom correspondence should be addressed.
Energies 2017, 10(11), 1779; https://doi.org/10.3390/en10111779
Submission received: 11 September 2017 / Revised: 28 October 2017 / Accepted: 30 October 2017 / Published: 5 November 2017
(This article belongs to the Section F: Electrical Engineering)

Abstract

:
Concerns about the power outages caused by extreme weather events have led the study of grid resilience. Among the grid resilience studies, this paper presents an overview to evaluate and improve grid resilience through the analysis of determinants of the impact and the grid capability. The impact is determined by the extreme weather events, grid exposure, and grid vulnerability. Whereas, the determinants of the grid capability are physical durability, operational versatility, and rehabilitation capacity. Conceptual knowledge for quantifying the impact and the grid capability is also presented. Then, some improvement strategies to reduce the impact and to improve the grid capability based on their determinants are discussed. The study of the impact and the grid capability provides a preliminary guideline to plan appropriate grid resilience improvement strategies.

1. Introduction

In recent years, the need for studying grid resilience has increased due to the rise of the severity and frequency of power outages caused by extreme weather events [1,2,3,4,5,6]. Based on the survey by the U.S. Energy Information Administration in 2012, the observed outages to the bulk electric system from 1992–2012 in the United States shows the significant increase of the outages caused by weather-related events [7]. Furthermore, the occurrence of severe weather events will increase in the future [8,9,10] so that this makes the resilient grid more important in many countries. For example, United States has placed an added emphasis on research and development (R and D) to enhance resilience to climate change and extreme weather. They are also inviting other organizations to join in developing and implementing a resilient grid R and D plan [11].
Power system performance is often evaluated by power system reliability indices. Power system reliability has been studied for a long time and is well developed. The indices used in power system reliability are the System Average Interruption Duration Index (SAIDI), the System Average Interruption Frequency Index (SAIFI), the Customer Average Interruption Duration Index (CAIDI), the Customer Average Interruption Frequency Index (CAIFI), etc. However, these indices do not adequately represent the system performance related to the major disruptions caused by extreme weather events [12]. Power system reliability considers only the high-probability low-impact disturbances and the grid operates passively. The recovery is only limited to the affected point and the system capability is restricted when wider and longer strikes occur. Therefore, a new study which encompasses the power system reliability study is required to deal with the impact caused by the extreme weather events, which is called grid resilience [5].
In [13], resilience is described as the system ability to prepare for changing conditions, adapt to it, and withstand and recover as quickly as possible from disruptions. Whereas, the Intergovernmental Panel on Climate Change (IPCC) [14] and U.K. Cabinet Office [15] defined resilience as the ability of assets, components, networks, or systems to anticipate, absorb, accommodate, and recover from disruptions. The disruption events described by this literature vary from the weather-related event, human error, cyber-attacks, terrorist attacks, etc. A separated study for each event is required to assess grid resilience caused by different disruption events. In this paper, the extreme weather event is only considered since the weather-related event is, statistically, a major cause of power system blackouts [4,7]. An extreme weather event is defined as a weather event when the intensity of the weather is above the upper threshold or below the lower threshold of the historical weather intensity in one period of observation [14,16]. Therefore, grid resilience can be defined as the grid ability to withstand the effects caused by extreme weather, adapt to the disrupted condition, and recover from the damaged state.
The objective of the grid resilience study is to minimize the impacts (i.e., power outages) caused by an extreme weather event. One way to achieve this is by improving the grid capability to deal with those impacts. This paper presents the study of the impact and the grid capability in a grid resilience study. The impact is analyzed through its determinants, which are the intensity of an extreme weather event, grid exposure, and grid vulnerability. The intensity of the extreme weather indicates the severity of the weather, the grid exposure represents a number of unprotected parts of the grid, and grid vulnerability expresses the strength of the grid, whereas the grid capability is analyzed based on its physical durability, operational versatility, and rehabilitation capacity. Physical durability represents how much the grid can withstand the initial attack, operational versatility represents how flexible the grid can adapt to the damage, and rehabilitation capacity represents the ability of the grid to restore to the pre-event condition.
This paper discusses the assessment and the improvement of the grid resilience through the analysis of the impact and the grid capability. The analysis of the impact and the grid capability can be applied to both transmission and distribution grids since it provides a general assessment procedure and broader enhancement examples. The assessment of grid resilience is required to ensure appropriate actions to improve grid resilience. It also gives information to concerned parties regarding the existing condition of the grid so that it will provide early awareness about the impact caused by an upcoming extreme weather event, whereas improvement of grid resilience is intended to minimize the impact caused by an extreme weather event and to optimize the capability of the grid. Improvement studies must also consider the cost/benefit analysis so that the investment to the grid resilience program offers a decent benefit [17].
The remainder of this paper is organized as follows. Section 2 discusses the grid resilience determinant of the severity of the impact and the grid capability. Section 3 discusses grid resilience assessment through further investigation on the determinant of the impact and the grid capability. In Section 4, various grid resilience improvement strategies are presented and classified based on these determinants. Finally, the conclusion is presented in Section 5.

2. Determinants of the Impact and the Grid Capability
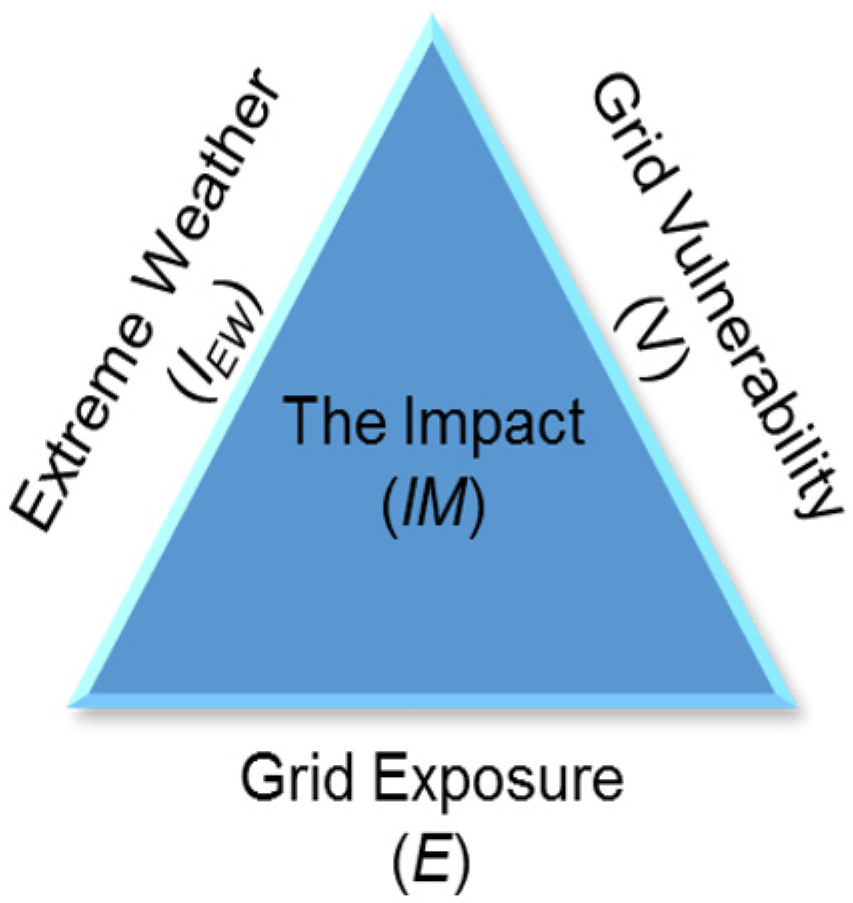
Main differences of grid resilience study with grid reliability study are the type of the impacts caused by uncommon disruptions and the grid capability which requires more active actions to bring back the grid to its normal functionalities. Therefore, in this paper, the assessment and the improvement of grid resilience are analyzed through the impact it suffers and the grid capability it possesses. The analysis of the impact and the grid capability is assessed through their determinants to provide a more detailed examination.

2.1. The Impact

The grid condition is evaluated based on its functionality which is the grid ability to provide a reliable and good quality of power supply (in MW) to serve its customers. The impact is considered as the loss of grid functionality. The extreme impact is defined as highly significant and long-lasting functionality loss to the grid [14]. It is very likely caused by an extreme event such as extreme weather even though an extreme impact may also occur due to a common failure and cascading effect. The amount of impact is a direct and straightforward indicator to evaluate grid resilience. It can be quantified as loss of grid capacity in MW or number of customer affected. These values can be transformed into the amount of economical loss (i.e., in million dollars) [18].
The impact evaluation is based on disaster risk assessment. It is determined by the intensity of the extreme weather events, the grid exposure, and the grid vulnerability [14,19,20]. The IPCC [14], in their special report, summarized that the severity of the impact of extreme weather relies upon the level of grid vulnerability and exposure to that event. On the other hand, Wisner et al. [19] introduced the Pressure and Release (PAR) model as a simple tool for showing how the impact occurs when a hazard (such as extreme weather) affects a vulnerable system, while grid exposure is not considered in their model. The extreme weather is considered as an external factor, while the vulnerability is considered as an internal factor. The “pressure” idea is related to the increasing amount of these two factors which will increase the impact, and the “release” idea is related to how a reduction can be made by decreasing the amount of those factors. However, neglecting the grid exposure in the evaluation of the impact in grid resilience study is not appropriate because the grid may be located in different geographical areas and the exposure to the extreme weather is different between one area and the other. Furthermore, Crichton [20] explained that the probability of the impact depends on three elements: hazards, exposure, and vulnerability. These elements can be illustrated in the form of a triangle as shown in Figure 1. The figure shows that the size of the impact (the area of the triangle) is determined by the size of each element (sides of the triangle). If any side of the triangle is zero, then the area is also zero, which means that no impact occurs.
These determinants are applied to quantify the loss of grid functionality. Therefore, the impact in grid resilience study is defined by the following equation:
I M = I E W × E × V
where IM is the impact caused by an extreme weather and can be presented in a number of affected grid functionality (in MW), a number of affected customers, or in the percentage of the functionality loss with respect to its pre-event condition. I E W is the intensity of extreme weather events and presented in weather’s respected scale such as wind speed (m/s), temperature (°C), earthquake (Richter), or flood or inundation (m). It is defined as the highest (or lowest) intensity of weather that the occurrence is very rare in the historical data. E is the grid exposure which means the amount of the grid that exposed to the extreme weather presenting in supply capacity of the grid, number of customers, or the percentage of the grid existing in the area where the extreme weather occurs. V is the grid vulnerability, which represents the conditional probability of the damaged grid given an extreme weather intensity (i.e., percentage per °C). A further description of grid vulnerability is given in Section 3.1.3.
Identifying the grid exposure and the grid vulnerability is a prerequisite to determining how extreme weather events transform into the impact. For example, the intensity of an extreme weather event might be high, but the impact will be minimal if the grid exposure and the grid vulnerability are low. The occurrence of the extreme weather events cannot be avoided and their intensity cannot be controlled. However, the impact that caused by them can be minimized through the management of the grid exposure and the grid vulnerability.

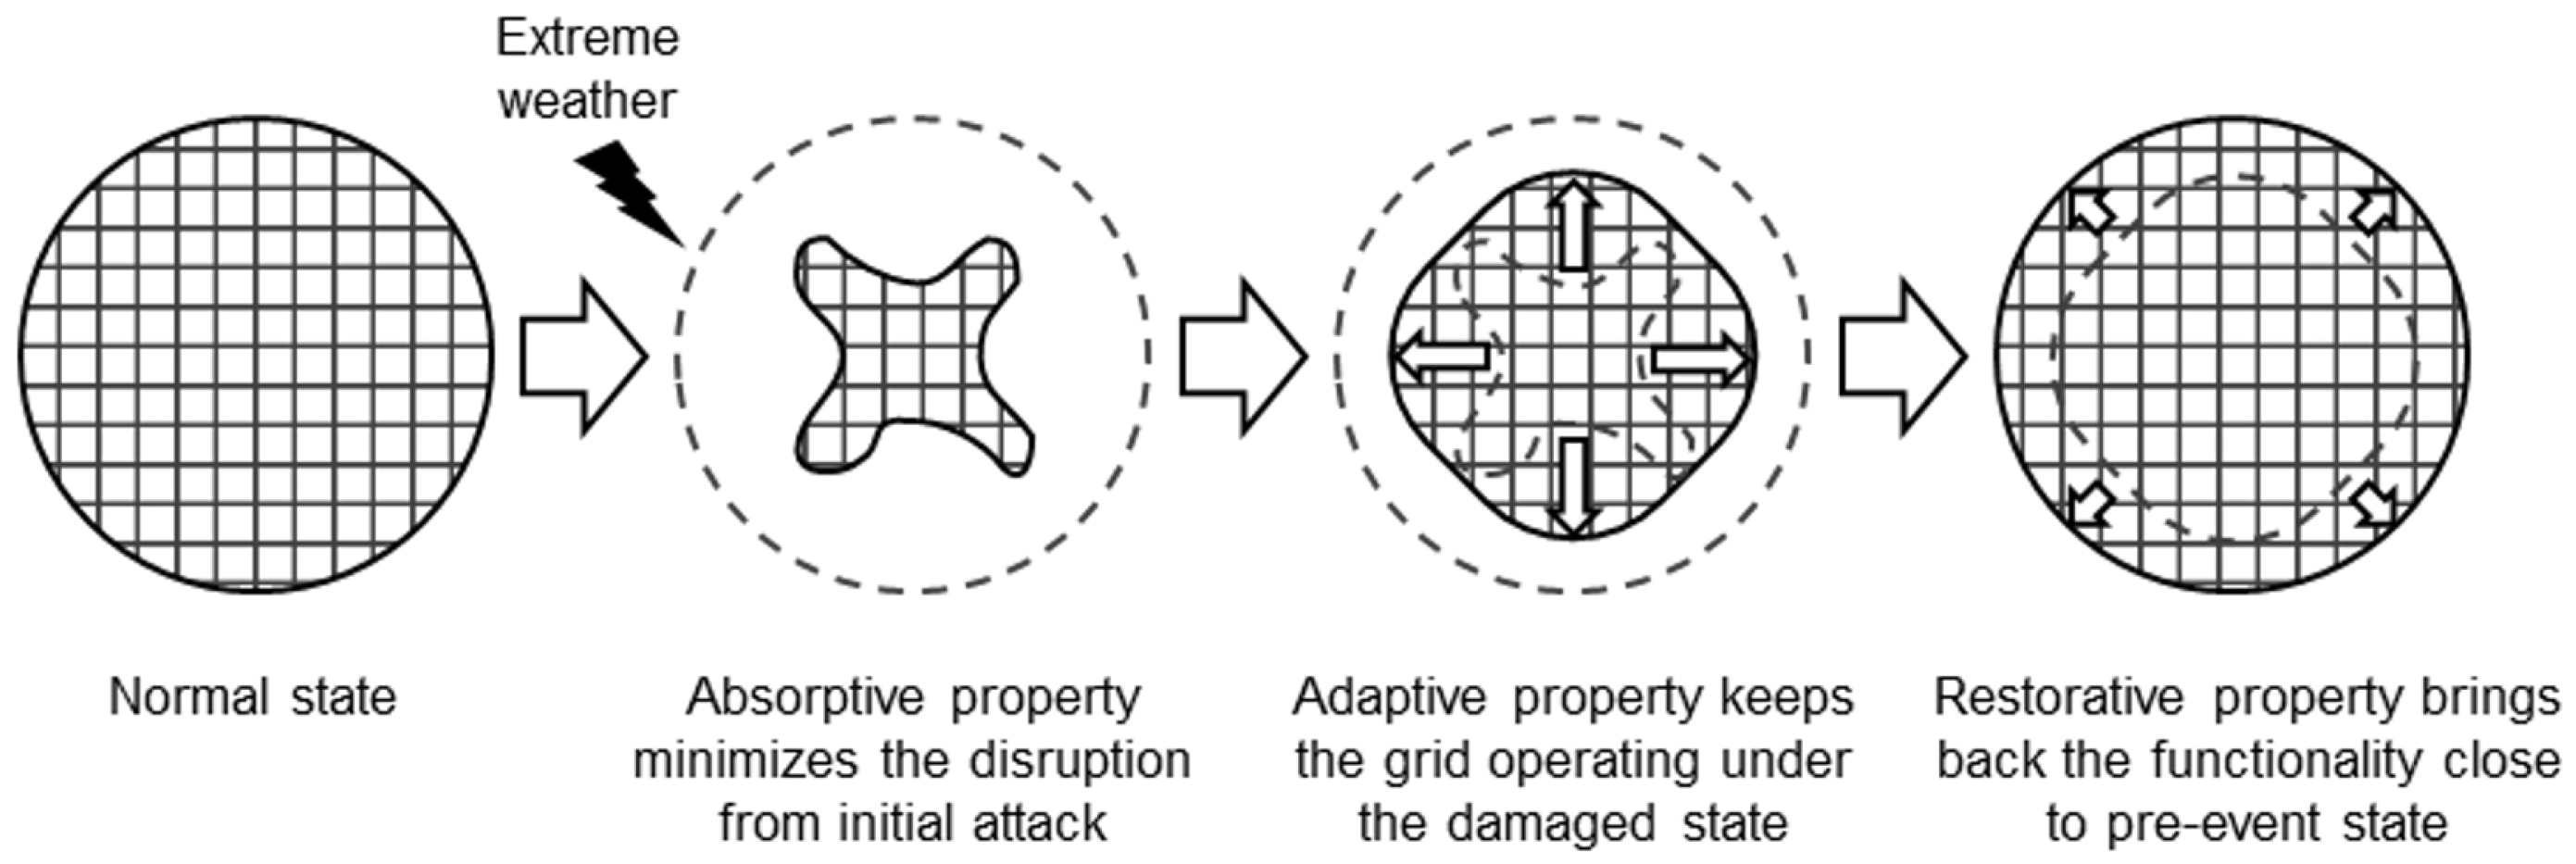
2.2. The Grid Capability

Even though the probability of extreme weather events is low, its occurrence causes an extensive and massive impact, historically. The passive operation of the grid when extreme weather events occur, which only relies on the grid protection, is not sufficient to maintain the grid functionalities because of the wide-spread and long-duration impact [6]. Therefore, a grid must pose a decent capability to respond to extreme weather events so that it becomes resilient. More active operations are required to deal with extreme weather events, such as strengthening physical structures, system reconfiguration, providing alternative (back-up) power supply, deployment of the repair crews, etc.
The active operations must be able to maintain grid functionality as much as possible. This includes the ability to resist or withstand an extreme weather event for a longer period and to adapt and recover from the impact in a shorter period. Since time plays a crucial role in grid resilience, the grid must be capable of taking actions before, during, and after the impact. Proag [21], Hosseini et al. [22], and Francis and Bekera [23] described three properties that a grid must have to be resilient as following:
(1)
Absorptive, which is the ability of the grid to minimize the disruption from the initial attack.
(2)
Adaptive, which is the ability of the grid to keep operating under the damaged state.
(3)
Restorative, which is the ability of the grid to restore to full functionality after the attack.
Figure 2 shows the illustration of these properties. The square-shaded area represents the functional grid. An extreme weather attack reduces the grid functionality, which is the amount of reduction that depends on the grid’s absorptive property. Then, the grid’s adaptive property tries to accommodate the service using the remaining resources as much as possible. Lastly, the restorative property is required to bring back the functionality closer to the pre-event condition.
The implementation of these properties can be seen in the grid capability. The grid capability before the event and the absorptive property is presented in the physical durability. The grid capability during the event and the adaptive property is presented in the operational versatility. Lastly, the restorative property after the event is presented in the rehabilitation capacity. Even though the assessment of each determinant has been studied in many literatures, it is required to provide an integrated measure that considers these three aspects. Therefore, the grid capability can be described by the following equation:
C G = [ P + O + R ] t S t E
where C G is the grid capability to supply a reliable power to the customers and can be presented in a number of unaffected grid capacity (in MW), a number of unaffected customers, or in the percentage of the unaffected grid functionality with respect to its pre-event condition. P is the physical durability which is the number of remaining functionality on initial attack because of the hardiness of the grid. O is the operational versatility which is the amount of grid that back to functional after a short-term restoration. R is the rehabilitation capacity which is the amount of grid that is restored after the attack. P, O, and R are presented in MW, number of customer, or in their percentage with respect to the pre-event condition, whereas t S indicates the start of the event when the extreme event attacks and t E indicates the end period of evaluation.
The grid capability is illustrated in Figure 3. As an example, the grid’s physical durability can maintain 40% of grid supply when there is initial attack by extreme weather. With a particular operational versatility, the partly malfunction grid can adapt and recover its service up to 70%, and full restoration can bring grid functionality back to 90%. In this illustration, the grid capability is only able to restore the grid functionality up to 90% within a period of evaluation. There is 10% shortage of the grid functionality which cannot be restored within this period. The amount of grid functionality restoration is proportional to the grid capability, which means the higher the designed grid capability, the higher the amount of restoration achieved. The grid resilience improvement strategies are applied so that the grid functionality can be restored as close as possible to its pre-event state within a required timeframe.

3. Grid Resilience Assessment

There are some indices that have been used in the literature to express grid resilience. Loss of Load Expectation (LOLE) and Loss of Load Frequency (LOLF) were used as indices in [24,25,26]. The other indices that are also commonly used to express grid resilience are Expected Energy Not Supplied (EENS) [27,28] and the amount of load shedding [29,30]. These indices measure grid resilience in terms of the impact. A lower index is associated with a higher resilience. However, the concept of grid resilience is the ability of the grid to bounce back from the abnormal condition to its normal state as quickly as possible [22,31,32]. Therefore, presenting only the impact without the grid capability is not sufficient to evaluate grid resilience. To include the grid capability into consideration, the grid resilience is expressed by the following equation:
R e s = C G / I M
where Res is grid resilience (dimensionless). C G is the grid capability as explained in Equation (1), and IM is the impact caused by an extreme weather event as discussed based in Equation (2).
This equation is able to show that grid resilience is improved when the grid capability is increased, the impact is decreased, or both are applied. Therefore, by evaluating each determinant of the impact and the grid capability, it will be easier to evaluate the grid resilience. Then, the grid resilience improvement strategies can be prepared and planned based on the assessment results.

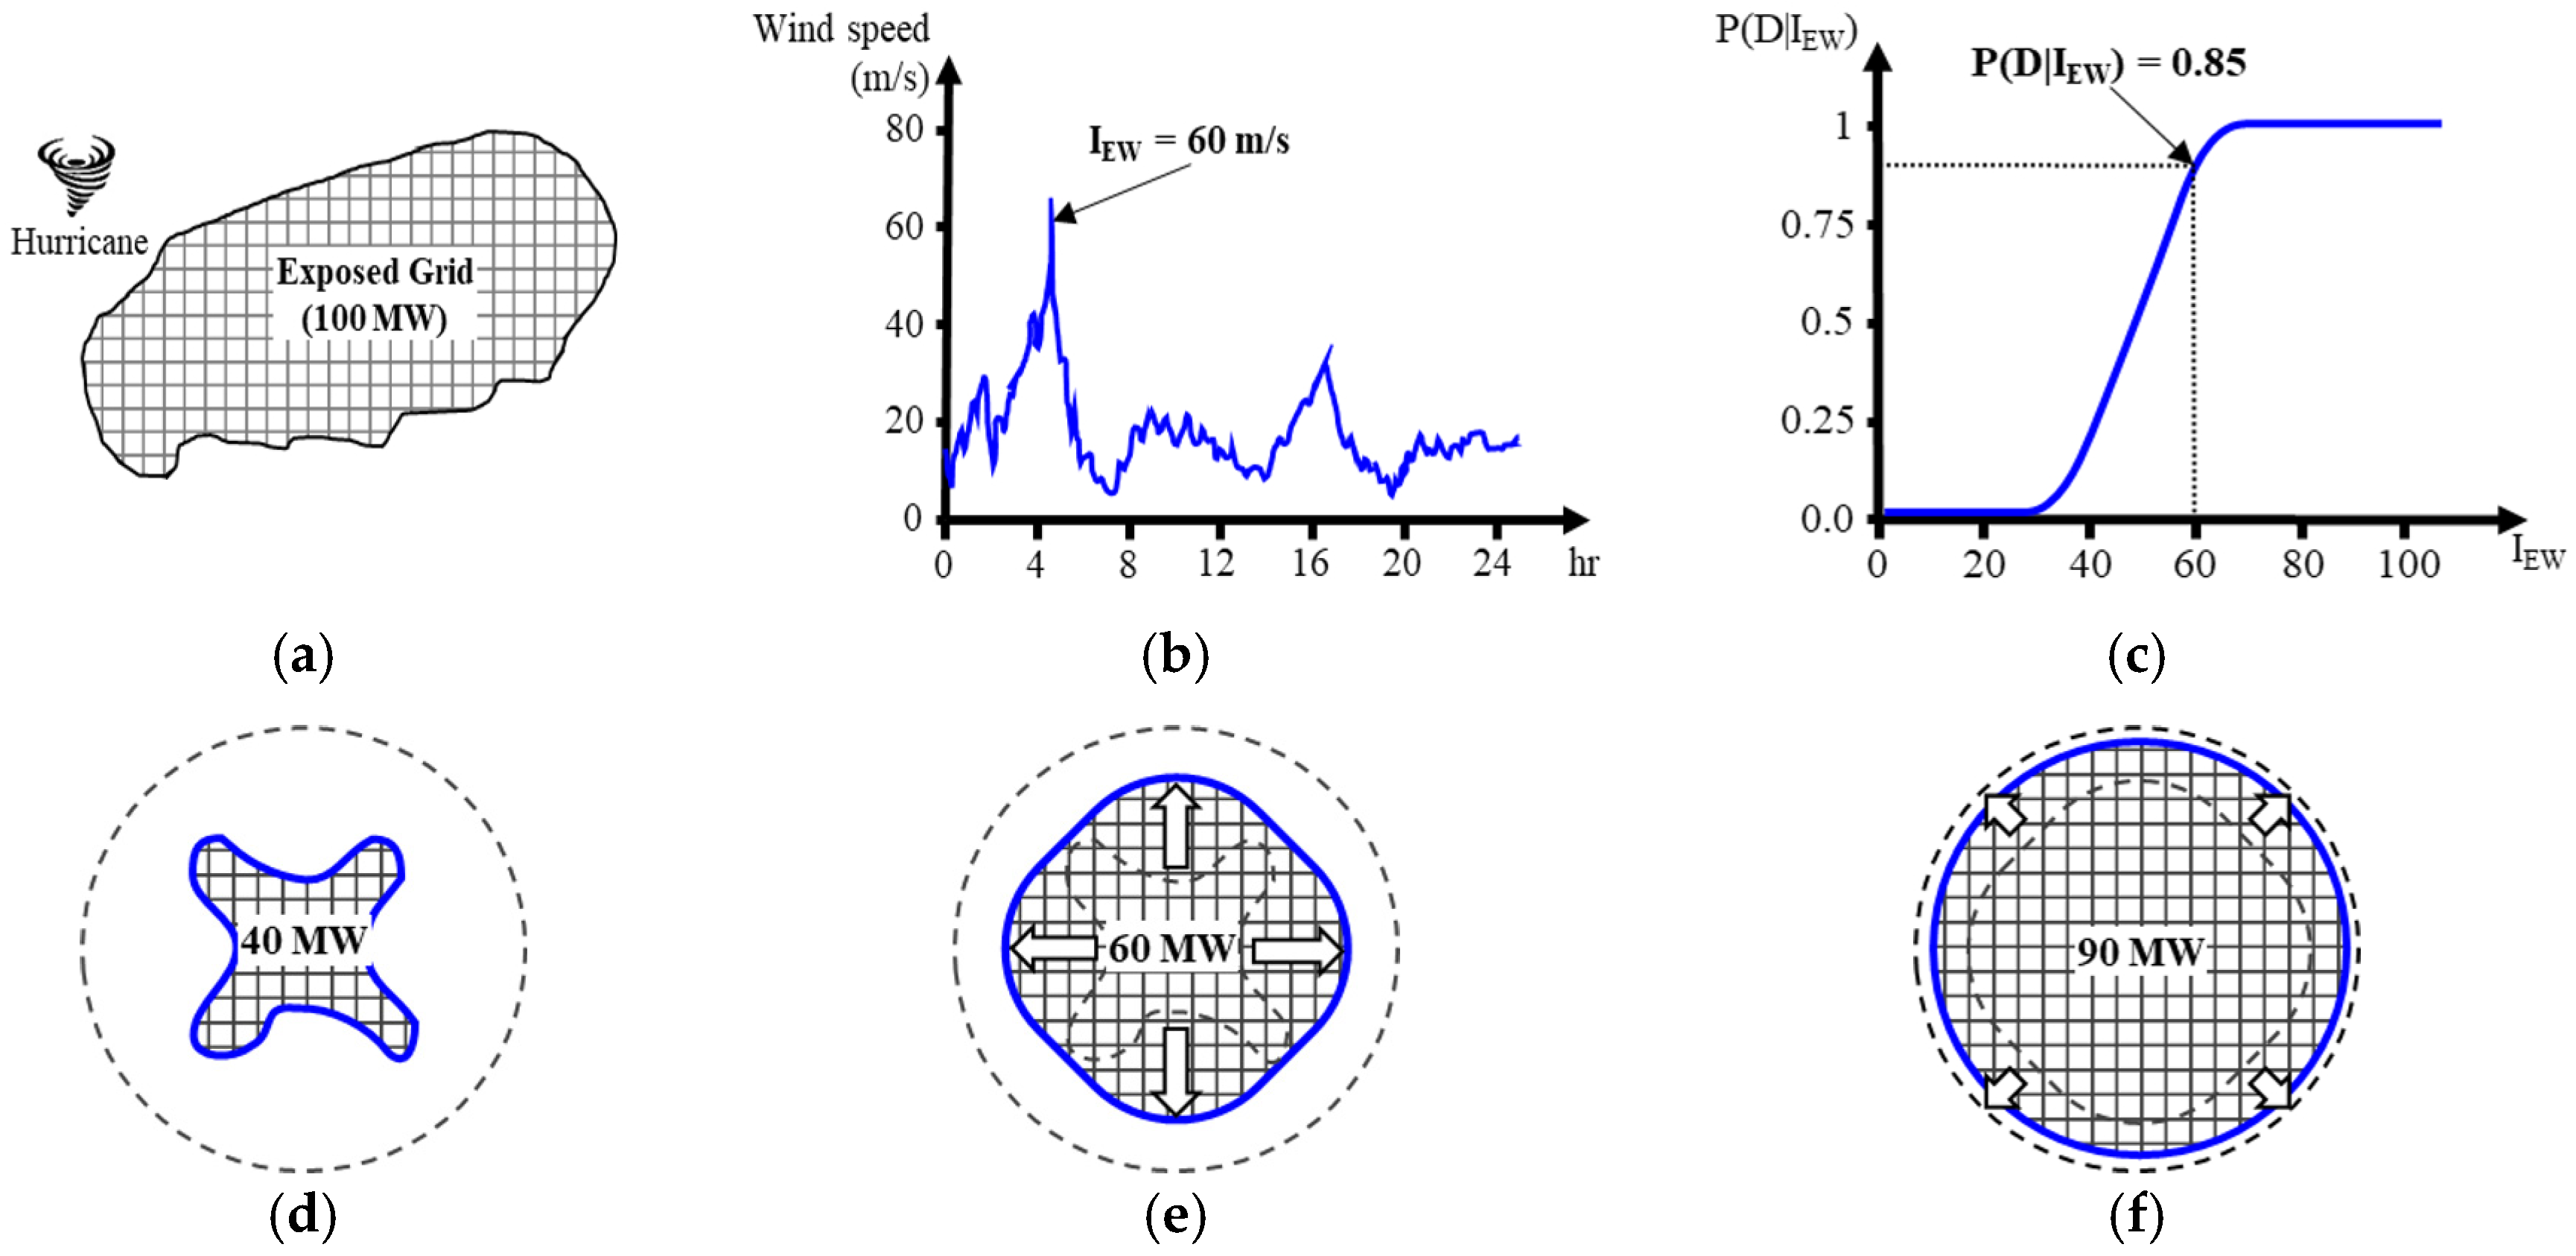
3.1. Assessment of the Impact Determinants

3.1.1. Extreme Weather Events

The effects of the extreme weather events on power systems have been studied in many studies. Abi-Samra [33] and Abi-Samra and Malcolm [34] noted some of the extreme weather which often attacks the electrical power grid. Those include flooding, wind storms, tropical storms, and heat wave and dry spells. The intensity of each extreme weather event can be measured by its respective parameters. Kenward and Raja [35] reported that power outages in the United States from 2003–2012 were caused by general storms (59%), cold weather and ice storms (18%), tropical storms (18%), tornadoes (3%), and extreme heat (2%).
Extreme weather events severity is classified by their intensity, duration, and the affected area. The historical data and extreme weather forecasting are important to determine the impact. This information is mapped on the grid infrastructure to evaluate the grid vulnerability, which will be useful to assess the potential impact. As previously mentioned, the severity of the extreme weather events cannot be controlled. However, with the information of its occurrence probability, actions can be taken to minimize the impact such as by minimizing the grid exposure or enhancing the grid capability.
Extreme weather events such as storms and hurricanes are usually measured by their contained-wind speed. The Beaufort Wind Force Scale is used to measure the storms [36]. Beaufort classified the storms into 13 force scale (0–12) based on the wind speed. Force scale “0” represents calm winds when the speed is less than 0.3 m/s, and force scale “12” represents hurricane forces when the speed is over and including 32.7 m/s. This scale is extended in the Saffir-Simpson Hurricane Wind Scale, which is particularly purposed to categorize hurricanes [37,38]. It starts from category 1, with minimum wind speeds of 33 m/s, up to category 5, with the wind speeds over and including 70 m/s. Other measurements are the Richter Scale for earthquakes [39], the level of inundation for flooding [40], tornadoes which are rated based on the Enhanced Fujita (EF) Scale [41], and degrees Fahrenheit or Celsius for heat/cold temperature [42].
There are two criteria to determine the extreme weather. The first criterion is that the weather intensity rarely occurs in a certain period, and the second one is that the weather intensity exceeds the upper or lower bounds of historical data. The upper and lower threshold can be determined through statistical analysis [43]. For instance, the occurrence of wind speeds above 35 m/s is only 2%, which is observed over ten years. Hence, if the upper threshold is selected as 2%, the wind speed above 35 m/s is considered as an extreme weather event.

3.1.2. Grid Exposure

The grid exposure is defined as the amount of uncovered or unprotected parts of the grid that are exposed to extreme weather events. Identifying the grid exposure is important in the impact assessment [44]. It determines the spatial aspect of the impact. The grid will be affected by extreme weather only when it is exposed to the extreme weather [45]. Even though the intensity of the weather is significant, its impact will be minimal if extreme weather occurs far from the grid. The more parts of the grid that are exposed to the hazardous area, the more extensive the impact.
Assessing grid exposure includes accounting for the number of exposed components, the length of the lines, the area of a region, or the site location [46]. Then these numbers are converted to the amount of grid capacity (in MW) or number of customers. This method may be effective if the required data is neatly available and provided by the grid operator. Otherwise, some methods that have been used by other disciplines can be applied to assess the exposure of the electrical power grid. Schlögl and Laaha [47] assessed the exposure of the road networks to precipitation and high/low temperature. They used the weather parameters recorded by the station in the observed area, defined the extreme values by using Fisher-Tippet-Gnedenko theorem and then refined the road networks where the extreme weather occurs. In this method, secondary data such as precipitation information from the weather agency can be used to obtain the amount of the exposed grid. Barben [48] assessed the grid exposure by considering the geographical information of the grid. This information is segmented in accordance with the occurrence of the extreme weather events. Then, the amount of grid exposure is calculated based on each segment. This procedure will be effective to evaluate the grid exposure for a large-sized grid.

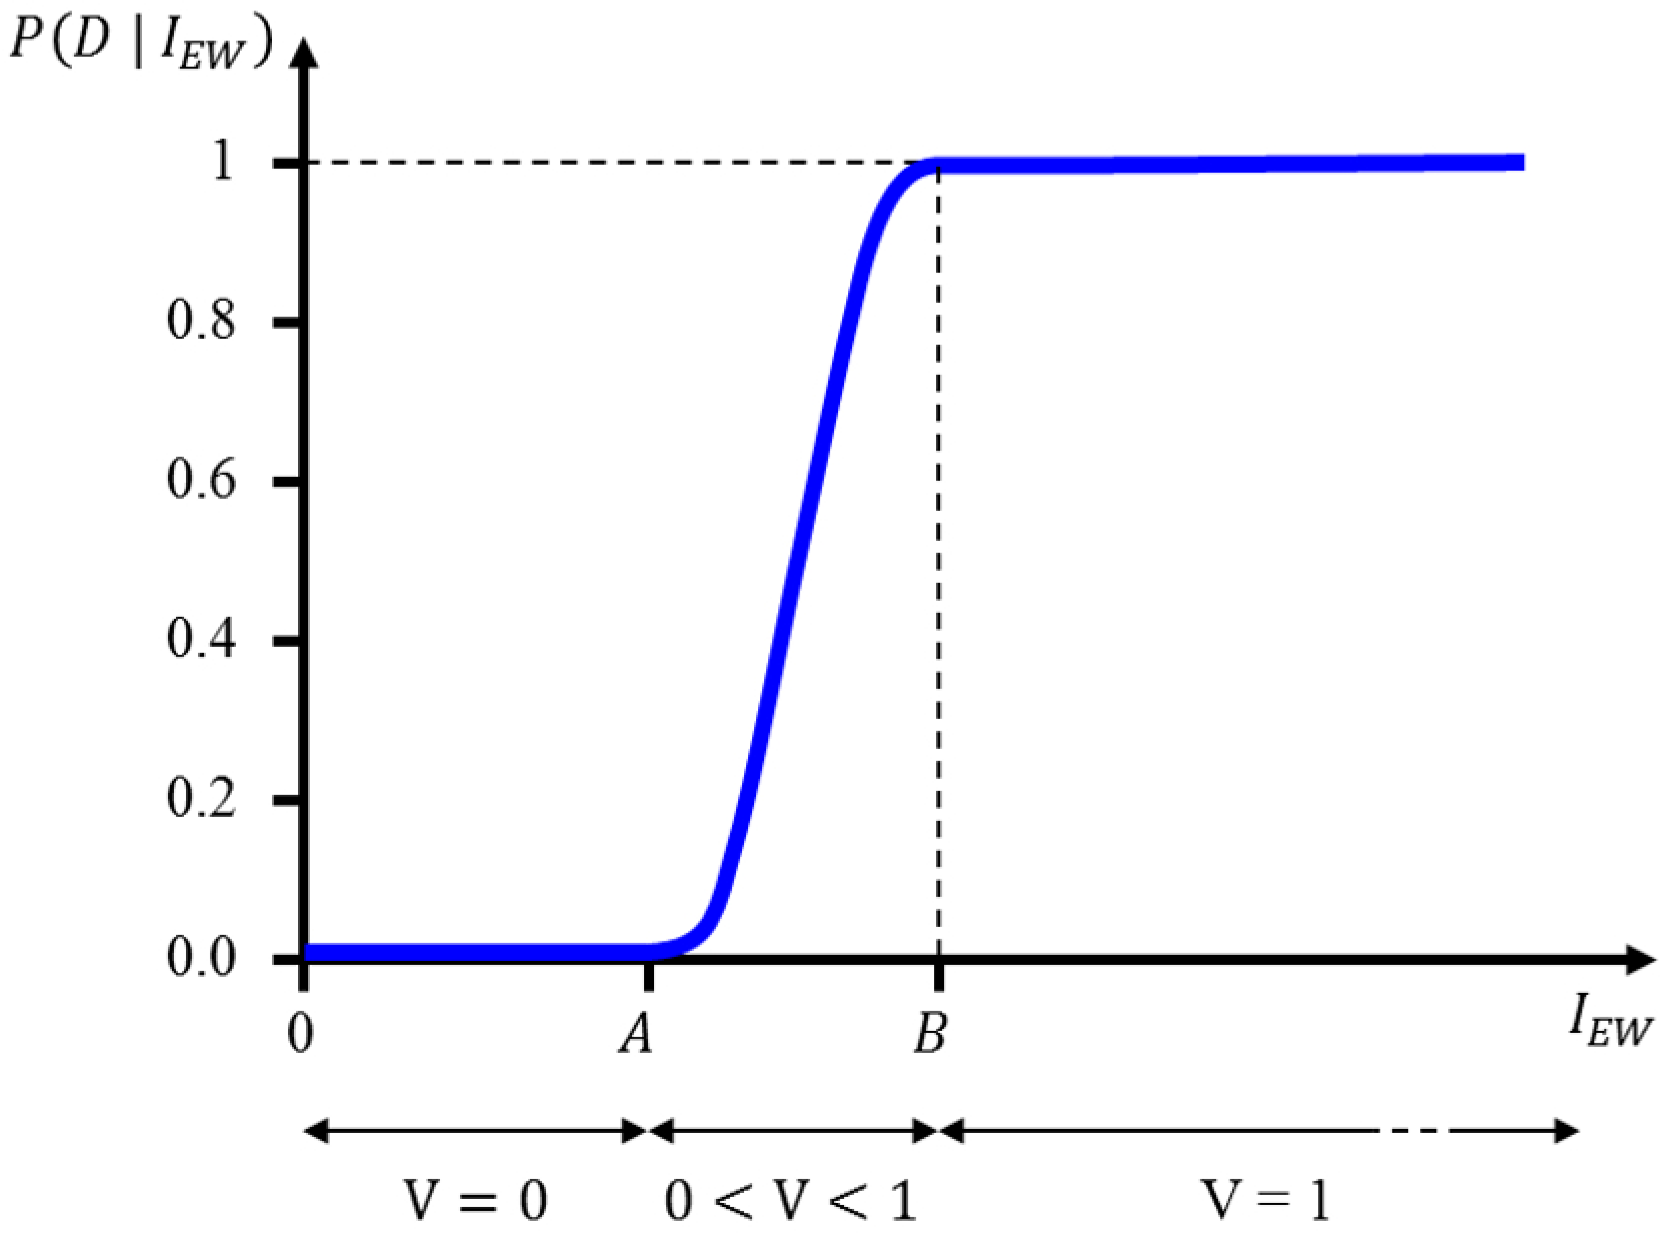
3.1.3. Grid Vulnerability

The general concepts of vulnerability for societies and infrastructure were described by Birkmann [49], Hellström [50], Adger [51], and Ciurean et al. [52], which can also be applied to power systems. In [49], the grid vulnerability was assessed without considering the type and the intensity of extreme weather, which is different from the perspective proposed in [50]. In this literature, the vulnerability assessment cannot be performed without recognizing the type and the intensity of the hazards. In [51] and [52], it is also stated that the grid vulnerability has a strong relationship with the external stress such as extreme weather events. The grid vulnerability is an essential determinant to assess the level of a resilience since it shows the condition of the grid with respect to the extreme weather or disaster. The grid vulnerability shows how the grid or its components perform corresponding to the intensity of extreme weather events. Grid vulnerability is evaluated when it is exposed to the extreme weather events. It determines the level of the damage to the grid. A more vulnerable grid will likely have a worse impact than a less vulnerable grid. Identification of the grid vulnerability is a first step to mitigating the impact caused by the extreme weather events.
An approach by Reed et al. [53] is extended to calculate the grid vulnerability. The grid vulnerability is defined as a conditional probability of the damaged grid given the intensity of an extreme weather event. It can be mathematically expressed by the following equation:
V = P ( D |   I E W )
where V is grid vulnerability (%), and P ( D |   I E W ) is a conditional cumulative probability of damage (D) given the intensity of extreme weather event ( I E W ), which is also called the grid fragility in some literatures.
Grid vulnerability is determined by the damage corresponding to the intensity of the extreme weather event. The study of the vulnerability is a complex and stochastic process [54,55,56]. It requires a detailed testing and analysis to obtain the degree of vulnerability. Graph theory analysis was used by [57,58,59,60,61,62,63,64,65,66] to calculate the vulnerability of the grid topology. However, from the point of view of the power system, the important thing is the result of the vulnerability analysis, which is generally easy to understand through a vulnerability curve [67,68,69]. Figure 4 shows an example of typical vulnerability curve. The grid is usually designed to operate under a certain condition of the weather (point “A”) where the probability of the damage given the condition I E W A is close to zero. It may still be able to operate beyond its designed condition (between point “A” and point “B”) with some probability to collapse until it reaches the maximum tolerable intensity (point “B”) where the probability of the damage given the condition is one.

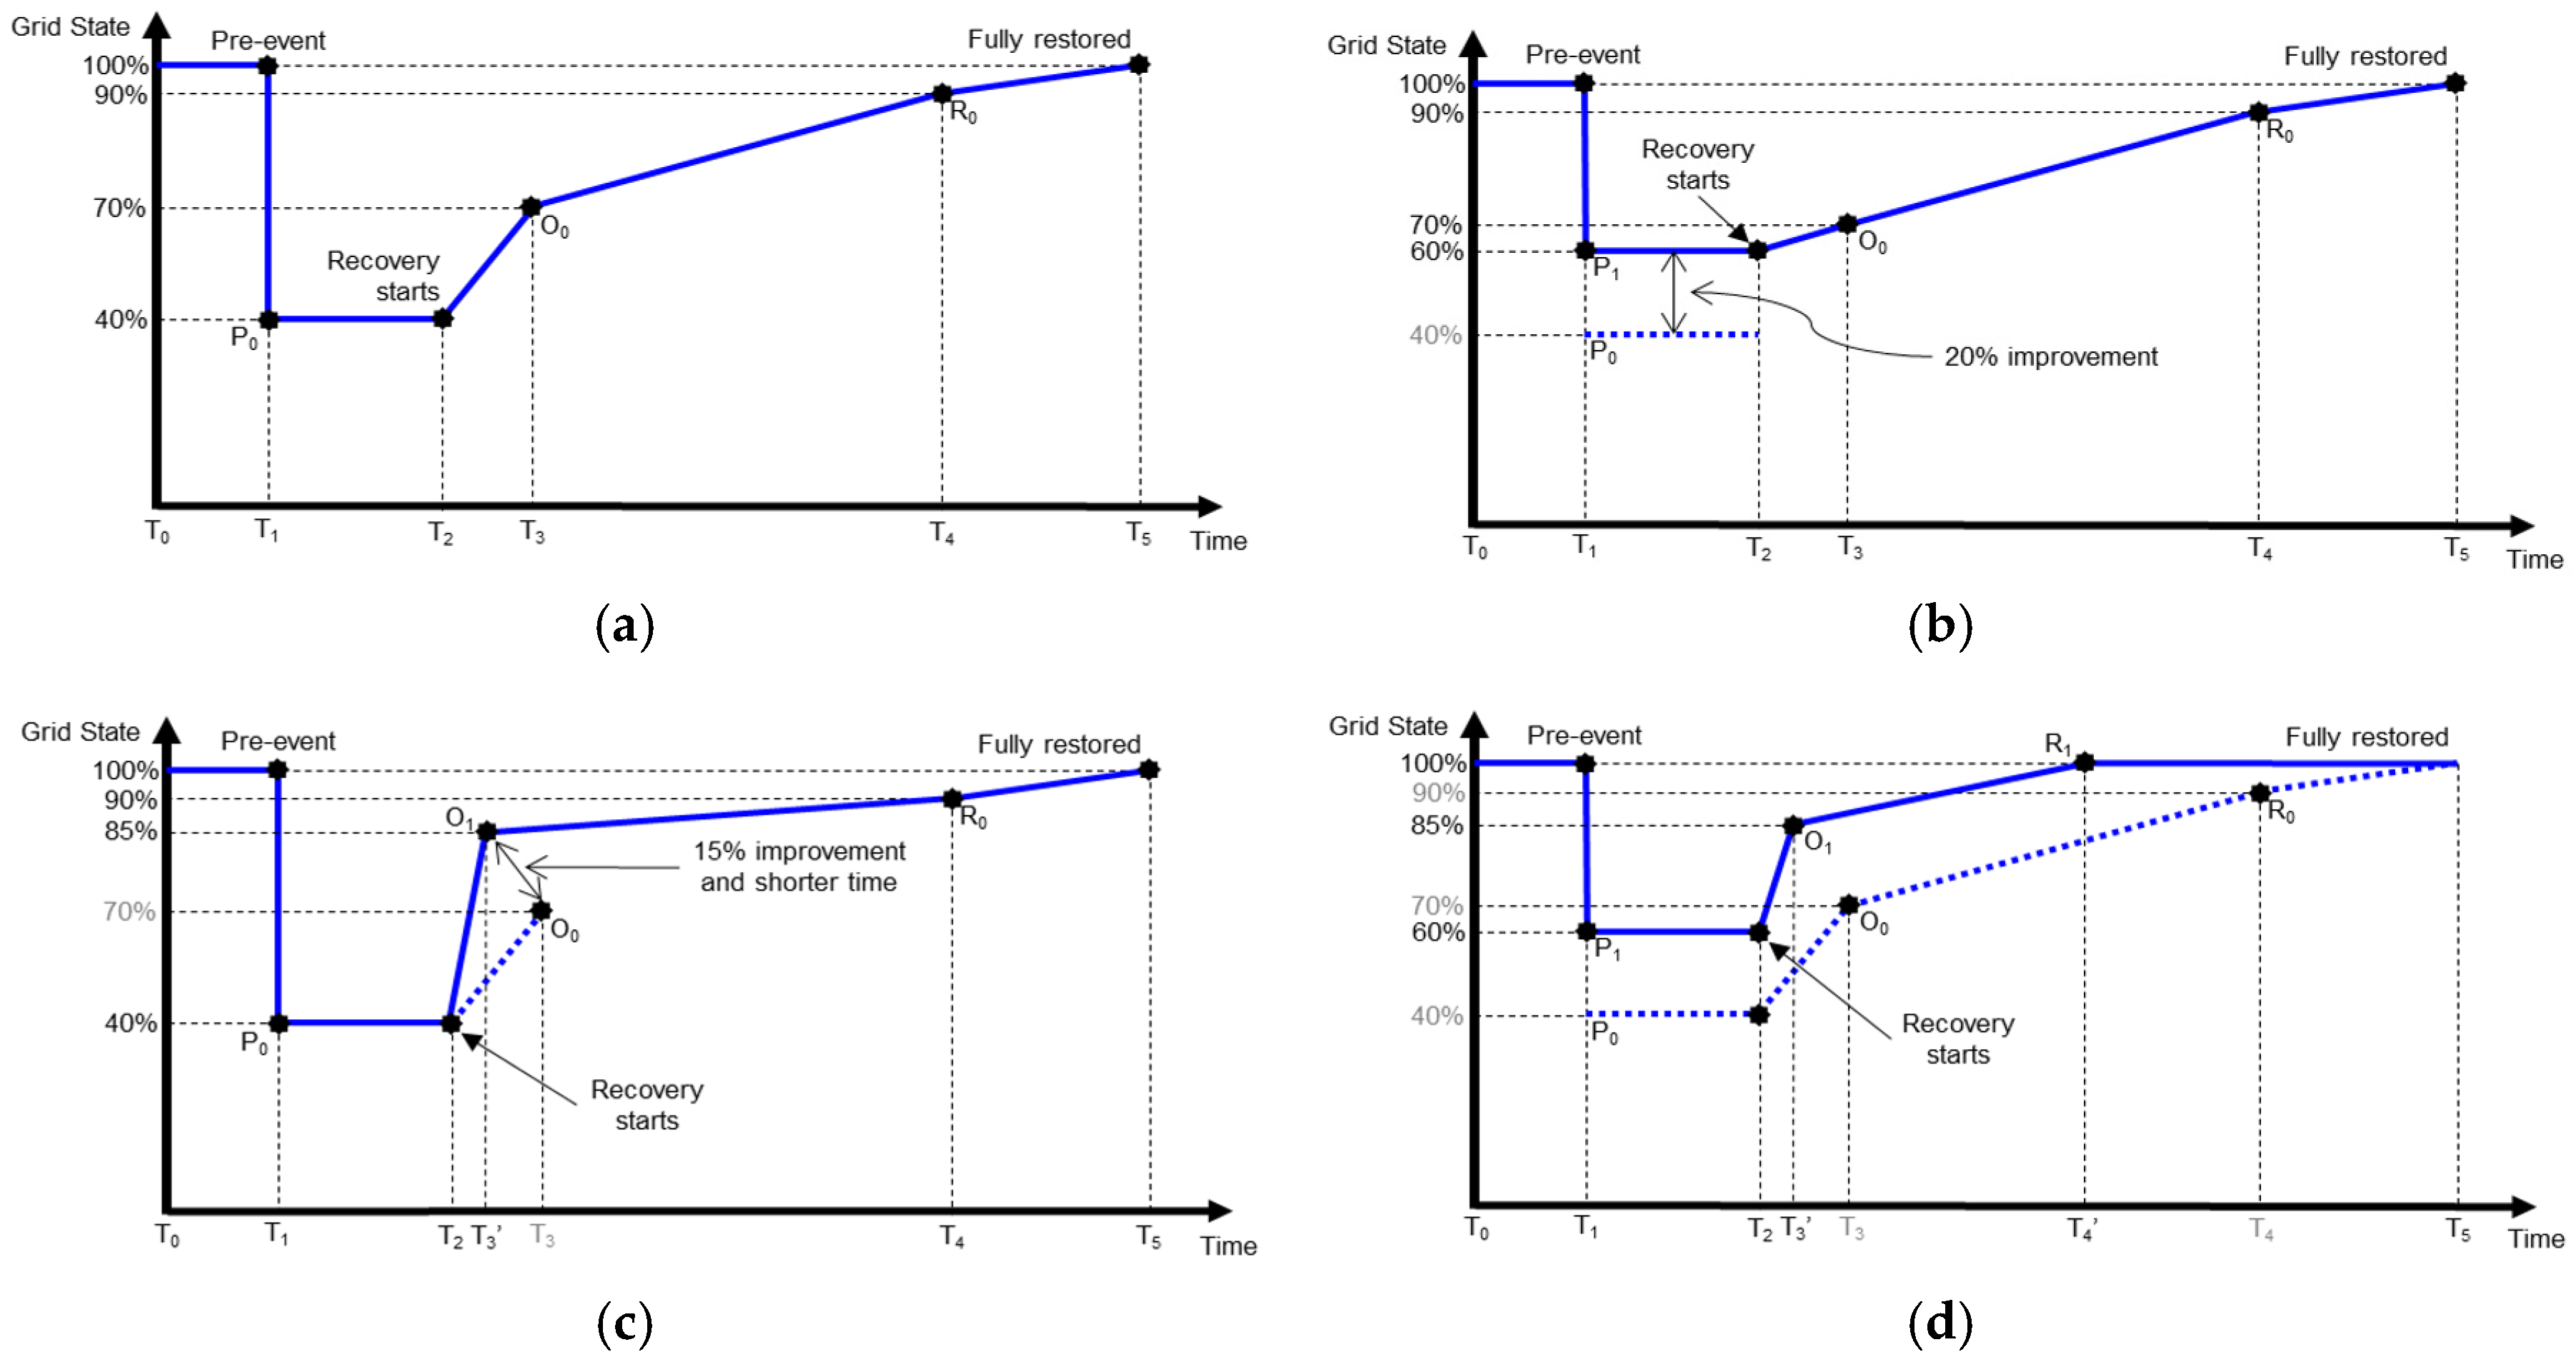
3.2. Assessment of the Grid Capability Determinants

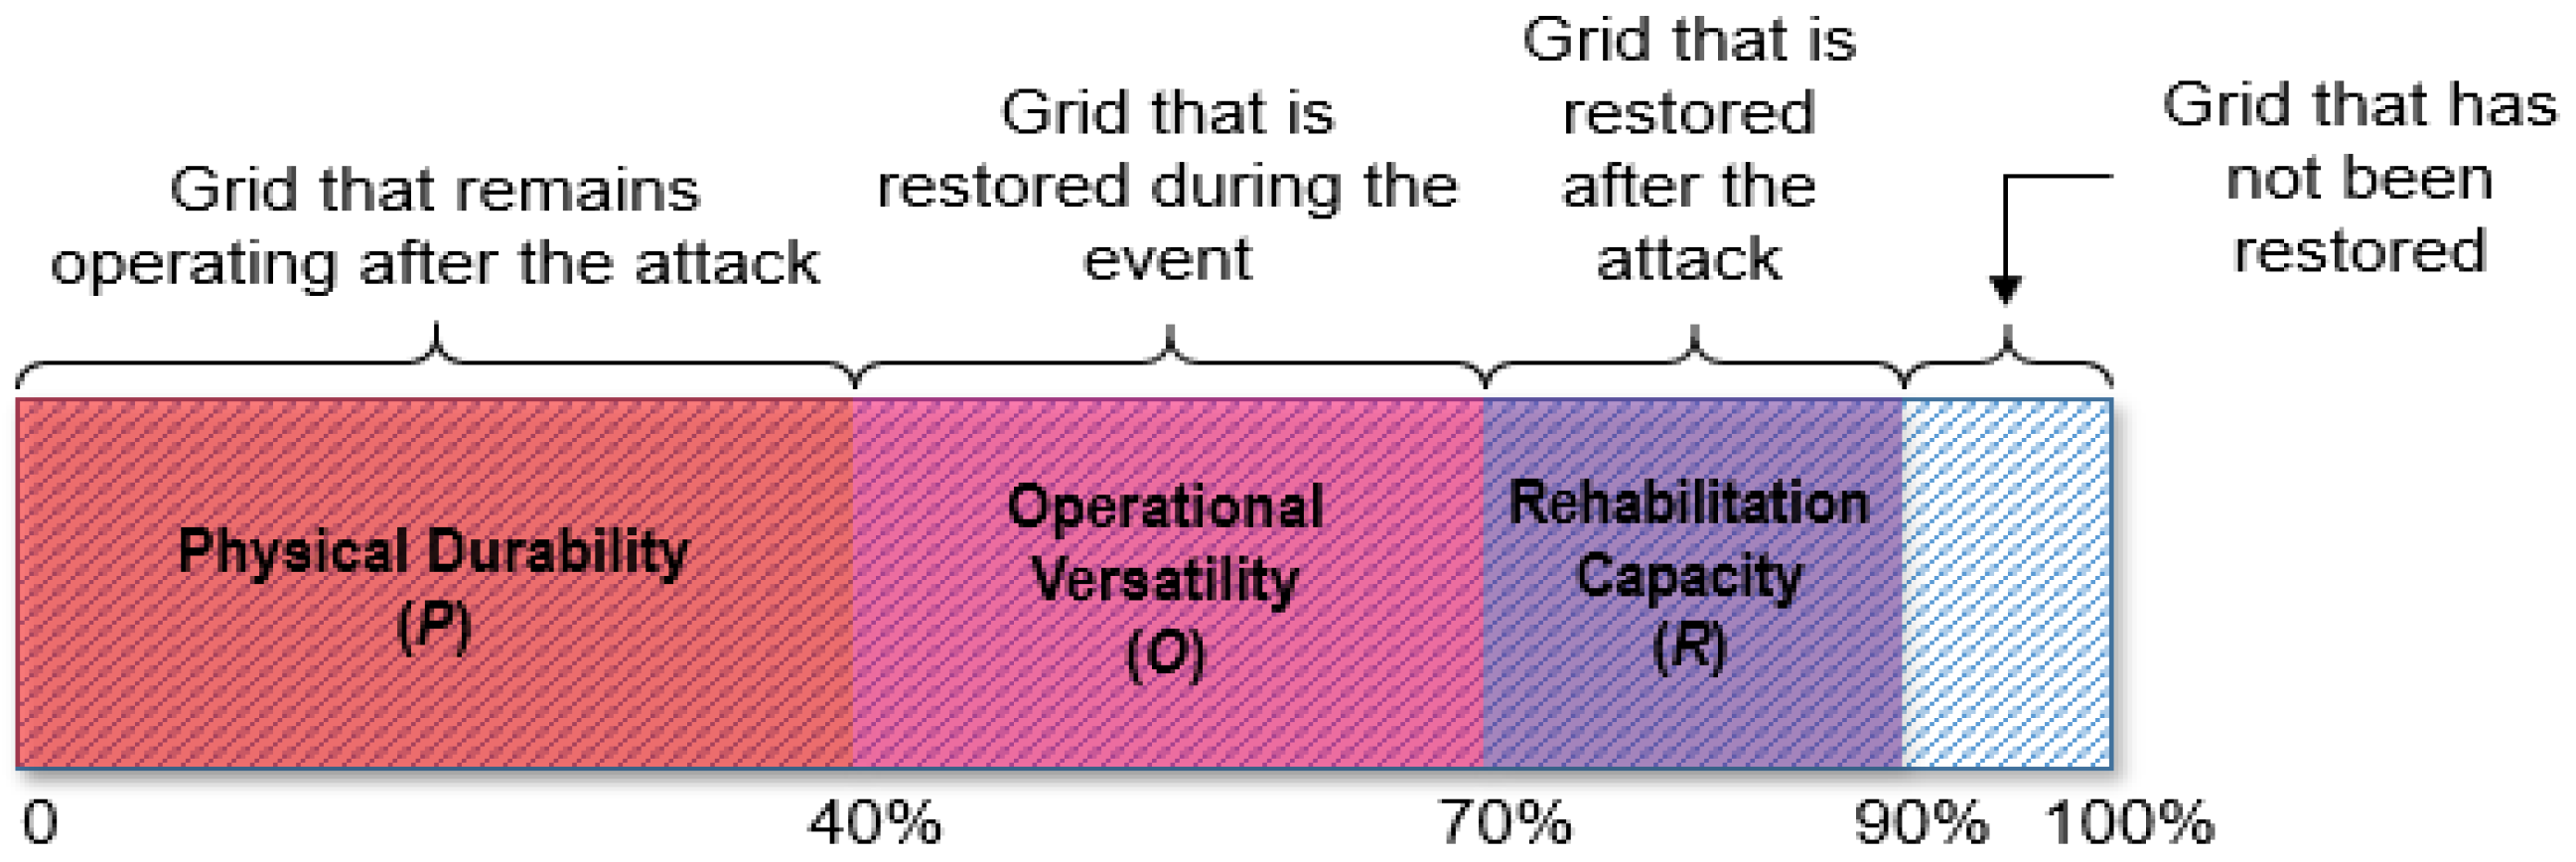
3.2.1. Physical Durability

Physical durability is a fixed property of the grid and acts as the first border when extreme weather events attack. It is related to the pre-design grid’s physical characteristic and topology [70]. The grid has to be designed by considering the worst case of forecasted extreme weather events. The grid’s physical durability is determined by a number of grids that remain operating after the initial strike. A stronger physical durability of the grid is indicated with a higher amount of the grid remaining functioning when it is attacked by extreme weather.
The assessment of the grid’s physical durability has been studied by many researchers. Bhave et al. [71] studied the robustness of grid infrastructure against centrality-based targeted attacks using graph theory analysis. A similar approach was used to evaluate the robustness of the European power grids by Solé et al. [72]. Chopade and Bikdash [73] proposed a method to assess the amount of loss of supply through topology’s centrality. A developed model of graph theory was proposed by Chen et al. [64] where they used a weighted version of the graph theory, and the result is shown by the amount of load shedding. Bagchi et al. [74] modelled the damaged distribution networks due to a fire attack and calculated the output in loss of load index. The outcome of the assessment presented by different methods by those literature suggests the similar quantity which is the amount of unaffected supply or number of customers. The approaches which are proposed by these studies can be used to determine the grid’s physical durability in term of expected number of unaffected grid capacity or the number of customers.

3.2.2. Operational Versatility

When the intensity of extreme weather events exceeds the limit of the grid’s physical durability, the grid will rely on its operational versatility to maintain its power supply to the customers [70]. Operational versatility is the ability of the grid to bring back the supply to the load as quickly as possible, especially those are considered as critical loads. It is considered as a short-term restoration capability of the grid. It includes the capability to optimize the grid topology configuration, to provide temporary solutions, and to repair the broken parts with the pre-prepared spare parts.
The operational versatility of the grid can be quantified by considering the amount of power they can recover after the first strike of extreme weather. Some methodologies to quantify the amount of restored power through operational capabilities have been conducted. Ancona [75] reviewed several techniques and guidelines to restore the power grid after a major failure. Arif et al. [76] presented a transmission system restoration algorithm by optimizing the repair crew routes and schedule and calculated the restored MW at each time step. The other methods were proposed by Chen et al. [77] through a sequential service restoration and by Gholami and Aminifar [78] through two-stage hierarchical approaches. It is shown that even though the methods used for the restoration are different, but the outcome of the operational versatility is uniform, which is the amount of restored load or customers. On the other hand, Gao et al. [79] calculated the available energy in kWh for power restoration on critical loads by using microgrids, but it can also be transformed into the amount of restored load or customers.
It can be seen that grid response requires external actions to take place during disruptions. For example, the crews have to visit the damaged location to provide backup power or rebuild the distribution pole or substation. Furthermore, the operators must be able to make the decision to reconfigure the topology of the grid. Hence, grid operational versatility is evaluated based on the amount of power (in kW or MW) or the number of customers it can restore within a relatively short period of time.

3.2.3. Rehabilitation Capacity

Rehabilitation capacity must satisfy two criteria. The first one is the ability to restore to its pre-event condition fully, and the second one is the ability of the grid to cope with similar or more extreme weather events in the future. It covers the total restoration of the grid infrastructure and the reinforcement plan based on the lessons learned from the previous disruptions. It is considered as long-term and continuous actions of improvement [27,80].
The total restoration of grid infrastructure includes repairing or rebuilding the damaged parts of the grid and replacement of the components, whereas the reinforcement includes the maintenance of the components, strengthening the components, building the physical protection for the components, relocating the facilities, and developing a new system for redundant purposes. Hence, grid rehabilitation capability can be quantified by the amount of restored or available power provided by these actions.
Putting all of the determinants together, a simplified demonstration for the grid resilience assessment is presented in Figure 5. One utility grid has the total capacity of 100 MW and all are exposed to a hurricane with the contained-wind speed of 60 m/s (Figure 5a,b). The vulnerability of the grid given in this intensity of the hurricane is 0.85 (Figure 5c). Hence, the estimation of the impact can be calculated as 85 MW. On the other hand, the physical durability of the grid can withstand the attack and maintain the grid functionality up to 40 MW (Figure 5d), the operational versatility of the grid can restore the functionality up to 60 MW (Figure 5e), and the long-term restoration through adaptation capacity can bring back its functionality up to 90 MW (Figure 5f). Therefore, the resilience index of this grid can be calculated as 1.06.

4. Grid Resilience Improvement

As described in the previous section, determinants of the impact are the extreme weather events, the grid exposure, and the grid vulnerability, whereas determinants of the grid capability are the grid’s physical durability, the grid operational versatility, and the grid rehabilitation capacity. Some literature which proposes the methodologies to improve grid resilience does not explicitly explain the detail in which the determinant is improved. The questions include why one improvement method is better than the others, how is the method suitable to be implemented in our grid, and which improvement methods should be selected among all alternatives. To answer these questions, we need to evaluate each determinant of the impact and the grid capability, and then prioritize grid resilience improvement strategies.
The extreme weather events are natural phenomena that humans cannot control. The extreme weather intensity and duration is not able to be reduced by the grid resilience improvement strategy, but their impact can be minimized by reducing the grid exposure and the grid vulnerability, whereas actions which are taken to reduce grid exposure and grid vulnerability are included in the actions taken to improve the grid capability. Therefore, the improvement strategies can be applied on three determinants: physical durability, operational versatility, and rehabilitation capacity.

4.1. Improving Physical Durability

Physical durability is related to the structural properties of the grid. These properties include age, structural robustness, and the material of the grid’s physical aspects. The process to improve physical durability is called a hardening program. Some hardening programs are as follows:
  • Vegetation management: this is done by trimming the trees around transmission and distribution lines to minimize the airborne debris that touching the lines and cause a short circuit and to avoid trees falling into the poles or lines [81,82,83].
  • Underground cable utilization: this reduces line exposure from above-ground disruption [4,83,84].
  • Lines rerouting: this reduces lines exposure by avoiding the area where extreme weather events may occur with high probability [17,84].
  • Elevated substation: this reduces substation exposure from flooding by elevating the substation above the inundation limit [84].
  • Water barrier instalment: this prevents substation inundated by flooding [17,84].
  • Substation relocation: this moves the substation to a more secure area (low probability of extreme weather events).
  • Utilization of sensors technology: this provides enough time to prepare the prevention action as early as possible when extreme weather events are coming [85].
  • Equipment and component revitalization: this is to maintain equipment physical properties and functionalities [84]. Equipment physical properties and functionalities decrease with age. Even though the equipment was designed to withstand certain disruptions, it will decrease after being used close to its lifetime [55].
  • Pole upgrading and strengthening: this is done by changing poles with stronger materials and providing additional supports for poles, such as guy wires [83,84].
  • Application of hydrophobic coating: this helps components to shed precipitation, mitigate water damage, and facilitate ice removal [85].
  • Building earthquake-resistant substation: the design of earthquake-resistant buildings has been developed, and it can be applied to the design the substations located where a high probability of earthquakes occurs.
  • Routine maintenance: this maintains the physical structure and functionalities of equipment [4].

4.2. Improving Operational Versatility

Operational versatility is the ability of the grid to restore its capacity within the short-term period. It is the combination of grid internal and external ability. Internal ability refers to the system design and topology configuration, while external ability refers to the management and operator capability. Some operational capabilities are as following:
  • Network redundancy: this provides several alternative lines to supply electricity to the area having a high probability of extreme weather occurrence. Although one line is damaged, it can still supply the power through the alternative lines.
  • Distributed Energy Resource (DER) generations and microgrids: they provide the option to self-supplies local area when their feeder is disrupted [4,86,87,88].
  • Spare parts management: spare parts have to be ready to use by forecasting the upcoming events, and this will make it easy to deploy during the disruption [89,90].
  • Providing portable backup generator and mobile transformers or substation: it maintains the electricity supply to the critical customer for given period until restored [84,89].
  • Repair crew management: this includes the arrangement of shift schedule that has enough manpower to solve disruptions during the events, as well as the tools used for repair and replacement [76,91].

4.3. Improving Grid Rehabilitation Capacity

Rehabilitation capacity is considered as the after-event capability and long-term recovery. It is related to the planning management based on the lessons learned from the previous disruptions. Some rehabilitation programs are as following:
  • Utilization of extreme weather event logging database: this is the most important to improve grid rehabilitation capacity [85,92]. It contains all the records of the previous event, including the remedy strategies so that it can be used to forecast the future disruptions and analyze the effectiveness and efficiency of remedial actions to be taken by simulations.
  • Modification of the system to be resilient: it is done based on the lesson learned from previous disruptions.
  • Review and revise design standards, construction guidelines, and maintenance procedure: since extreme weather events tend to increase in the future, some of standards, guidelines, and procedures need to be upgraded to accommodate those situations [83].
A different implementation of the enhancement strategies for each determinant will result in diverse improvement. Figure 6 illustrates the different implementations of enhancement strategies. In Figure 6a, the grid state transition before the implementation of enhancement strategies is shown. This indicates that the physical durability (P0) can only withstand at 40% and the grid state will remain constant until some recovery actions are taken at time T2. Operational versatility (O0) can recover up to 70% at time T3, rehabilitation capability (R0) can restore up to 90% at time T4, and full restoration will require more efforts and time to be completed at time T5.
Figure 6b,c show the implementation of enhancement strategies on physical durability and operational versatility, respectively. In Figure 6b, enhancement strategies are applied to improve the grid’s physical durability to 60% (P1) while the operational versatility remains unchanged, whereas in Figure 6c, the grid operational versatility is improved to 85% (O1) and the physical durability is left untouched. Hence, the selection of the enhancement strategies depends on the requirement whether it needs an uninterrupted supply as much as possible (higher physical durability) or whether it allows interruption, but with higher and faster recovery (better operational versatility). It is also worth noting that the distance between T1 and T2 depends on the starting time of the operator to deploy restoration actions, which is also part of the operational versatility.
Figure 6d shows the implementation of enhancement strategies on all determinants. The physical durability is improved to 60% (P1), operational versatility is improved to 85% (O1), and rehabilitation is able to restore the grid to 100% (R1) of its pre-event state. It can be seen that by doing this, the grid can reach full restoration rapidly so that the total impact is minimum. However, implementation of the enhancement strategies on all determinants will require more resources and very costly. There are many potential strategies to improve grid resilience as presented above. Case by case analysis is required in order to decide which implementation strategies to be applied to a particular power system grid. One strategy may seem appropriate for a certain grid but not for others due to some reasons such as geographical condition, the likelihood of the extreme weather events, the resources of the grid operator, cost, and etc. Moreover, one action may reduce grid exposure and at the same time, it also reduces the grid operational versatility. For example, the implementation of the underground cables may reduce the grid exposure to the storms, but it will cause a longer time to restore if there is a flood in that area.
In addition, there are also two major aspects that need to be considered such as customer criticality and the implementation cost [93]. The assessment of the system criticality requires participation from stakeholders and decision makers. A list of the critical and essential loads must be prepared and included in the grid resilience study. After that, then the cost-benefit analysis has to be made before the execution of the improvement strategies.

5. Conclusions

This paper introduces the determinants of the impact and the grid capability to provide insight into the grid resilience assessment and improvement. A detailed observation of which implementation strategies are appropriate can be seen by segmenting and assessing the impact and the grid capability into their determinants. The impact is determined by the extreme weather event intensity, the grid exposure, and the grid vulnerability, while the grid capability is composed of physical durability, operational versatility, and rehabilitation capacity. Each determinant is used to evaluate grid resilience.
The assessment of determinant of the impact and the grid capability helps to manage, prioritize, and plan grid resilience improvement strategies. The assessment result can be used for further analysis to decide the proper strategies to be implemented by including the grid geographical location, customer criticality level, and the operator resources into considerations. Some improvement strategies are also introduced to improve each determinant in this paper as preliminary guidelines for the grid resilience improvement plan.

Acknowledgments

This work was supported by the Korea Institute of Energy Technology Evaluation and Planning (KETEP) and the Ministry of Trade, Industry and Energy (MOTIE) of the Republic of Korea (No. 20141010501870 and No. 20174030201660).

Author Contributions

Fauzan Hanif Jufri performed the research and wrote the paper; Jun-Sung Kim contributed to improve the technical value of the paper; Jaesung Jung provided the academic assistance and is the advisor of the research.

Conflicts of Interest

The authors declare no conflict of interest.

References

  1. Abi-samra, N.C. One Year Later: Superstorm Sandy Underscores Need for a Resilient Grid. Available online: https://spectrum.ieee.org/energy/the-smarter-grid/one-year-later-superstorm-sandy-underscores-need-for-a-resilient-grid (accessed on 8 January 2017).
  2. Ton, D. DOE Microgrid Program Microgrid Controllers. Available online: https://www.ll.mit.edu/mission/engineering/Symposium/2017/1-MDCS-KEYNOTE-DOE-Microgrid-Program-Microgrid-Controllers.pdf (accessed on 22 February 2017).
  3. Chaudry, M.; Ekins, P.; Ramachandran, K.; Shakoor, A.; Skea, J.; Strbac, G.; Wang, X.; Whitaker, J. Building a Resilient UK Energy System. Available online: http://www.ukerc.ac.uk/support/tiki-download_file.php?fileId=618 (accessed on 12 January 2017).
  4. Campbell, R.J. Weather-Related Power Outages and Electric System Resiliency; Congressional Research Service: Washington, DC, USA, 2012. [Google Scholar]
  5. Venkata, S.S.M.; Hatziargyriou, N. Grid Resilience: Elasticity Is Needed When Facing Catastrophes. IEEE Power Energy Mag. 2015, 13, 16–23. [Google Scholar] [CrossRef]
  6. Panteli, M.; Mancarella, P. The Grid: Stronger, Bigger, Smarter? IEEE Power Energy Mag. 2015, 13, 58–66. [Google Scholar] [CrossRef]
  7. Economic Benefits of Increasing Electric Grid Resilience To Weather Outages. Available online: https://energy.gov/downloads/economic-benefits-increasing-electric-grid-resilience-weather-outages (accessed on 22 February 2017).
  8. Simpson, M.J. Global Climate Change Impacts in the United States. J. Environ. Qual. 2011, 40, 279. [Google Scholar] [CrossRef]
  9. Lerner-Lam, A. Assessing global exposure to natural hazards: Progress and future trends. Environ. Hazards 2007, 7, 10–19. [Google Scholar] [CrossRef]
  10. Kezunovic, M.; Dobson, I.; Dong, Y. Impact of Extreme Weather on Power System Blackouts and Forced Outages: New Challenges. In Proceedings of the 7th Balkan Power Conference, Laboratory of Energy Policy, University of Ljubljana, Šibenik, Croatia, 10–12 September 2008; pp. 1–5. [Google Scholar]
  11. Ton, D.T.; Wang, W.P. A More Resilient Grid. IEEE Power Energy Mag. 2015, 13, 26–34. [Google Scholar] [CrossRef]
  12. IEEE Std 1366TM-2012—IEEE Guide for Electric Power Distribution Reliability Indices. Available online: http://ieeexplore.ieee.org/stamp/stamp.jsp?tp=&arnumber=6329910 (accessed on 22 February 2017).
  13. Presidential Policy Directive 21—Critical Infrastructure Security and Resilience. Available online: https://obamawhitehouse.archives.gov/the-press-office/2013/02/12/presidential-policy-directive-critical-infrastructure-security-and-resil (accessed on 3 February 2017).
  14. Intergovernmental Panel on Climate Change (IPCC); Field, C.B.; Barros, V.; Stocker, T.F.; Qin, D.; Dokken, D.J.; Ebi, K.L.; Mastrandrea, M.D.; Mach, K.J.; Plattner, G.-K.; et al. Managing the Risks of Extreme Events and Disasters to Advance Climate Change Adaptation; Cambridge University Press: Cambridge, UK; New York, NY, USA, 2012. [Google Scholar]
  15. Keeping the Country Running: Natural Hazards and Infrastructure. Available online: https://www.gov.uk/government/publications/keeping-the-country-running-natural-hazards-and-infrastructure (accessed on 22 February 2017).
  16. Hov, Ø.; Cubasch, U.; Fischer, E.; Höppe, P.; Iversen, T.; Kvamstø, N.G.; Kundzewicz, Z.W.; Rezacova, D.; Rios, D.; Santos, F.D.; et al. Extreme Weather Events in Europe: Preparing for Climate Change Adaptation; Norwegian Meteorological Institute: Oslo, Norway, 2013.
  17. Chang, M. Making the Grid More Resilient within Reason; Synapse Energy Economics, Inc.: Cambridge, MA, USA, 2014. [Google Scholar]
  18. Watson, J.P.; Guttromson, R.; Silva-Monroy, C.; Jeffers, R.; Jones, K.; Ellison, J.; Rath, C.; Gearhart, J.; Jones, D.; Corbet, T.; et al. Conceptual Framework for Developing Resilience Metrics for the Electricity, Oil, and Gas Sectors in the United States; Sandia National Laboratoories: Albuquerque, NM, USA; Livermore, CA, USA, 2015.
  19. Wisner, B.; Blaikie, P.; Cannon, T.; Davis, I. AT RISK; Taylor & Francis: Abingdon, UK, 1994; Volume 24, ISBN 978-0-203-44423-8. [Google Scholar]
  20. Crichton, D. The risk triangle. In J. Ingleton (ed). Natural Disaster Management; Tudor Rose: London, UK, 1999; pp. 102–103. ISBN 0-9536140-1-8. [Google Scholar]
  21. Proag, V. Assessing and Measuring Resilience. Procedia Econ. Financ. 2014, 18, 222–229. [Google Scholar] [CrossRef]
  22. Hosseini, S.; Barker, K.; Ramirez-Marquez, J.E. A review of definitions and measures of system resilience. Reliab. Eng. Syst. Saf. 2016, 145, 47–61. [Google Scholar] [CrossRef]
  23. Francis, R.; Bekera, B. A metric and frameworks for resilience analysis of engineered and infrastructure systems. Reliab. Eng. Syst. Saf. 2014, 121, 90–103. [Google Scholar] [CrossRef]
  24. Panteli, M.; Mancarella, P.; Wilkinson, S.; Dawson, R.; Pickering, C. Assessment of the resilience of transmission networks to extreme wind events. In Proceedings of the 2015 IEEE Eindhoven PowerTech, Eindhoven, The Netherlands, 29 June–2 July 2015. [Google Scholar] [CrossRef]
  25. Panteli, M.; Mancarella, P. Modeling and Evaluating the Resilience of Critical Electrical Power Infrastructure to Extreme Weather Events. IEEE Syst. J. 2017, 11, 1733–1742. [Google Scholar] [CrossRef]
  26. Wang, B.; Zhou, Y.; Mancarella, P.; Panteli, M. Assessing the impacts of extreme temperatures and water availability on the resilience of the GB power system. In Proceedings of the 2016 IEEE International Conference on Power System Technology (POWERCON), Wollongong, Australia, 28 September–1 October 2016; pp. 1–6. [Google Scholar] [CrossRef]
  27. Panteli, M.; Pickering, C.; Wilkinson, S.; Dawson, R.; Mancarella, P. Power System Resilience to Extreme Weather: Fragility Modeling, Probabilistic Impact Assessment, and Adaptation Measures. IEEE Trans. Power Syst. 2017, 32, 3747–3757. [Google Scholar] [CrossRef]
  28. Cadini, F.; Agliardi, G.L.; Zio, E. A modeling and simulation framework for the reliability/availability assessment of a power transmission grid subject to cascading failures under extreme weather conditions. Appl. Energy 2017, 185, 267–279. [Google Scholar] [CrossRef]
  29. Penkey, P.; Alla, M.; Johnson, B.K.; McJunkin, T.R. Improving transmission system resilience using an automation controller and Distributed Resources. In Proceedings of the 2016 Resilience Week (RWS), Chicago, IL, USA, 16–18 August 2016; pp. 89–94. [Google Scholar] [CrossRef]
  30. Ma, S.; Chen, B.; Wang, Z. Resilience Enhancement Strategy for Distribution Systems under Extreme Weather Events. IEEE Trans. Smart Grid 2016. [Google Scholar] [CrossRef]
  31. Henry, D.; Emmanuel Ramirez-Marquez, J. Generic metrics and quantitative approaches for system resilience as a function of time. Reliab. Eng. Syst. Saf. 2012, 99, 114–122. [Google Scholar] [CrossRef]
  32. Ayyub, B.M. Systems resilience for multihazard environments: Definition, metrics, and valuation for decision making. Risk Anal. 2014, 34, 340–355. [Google Scholar] [CrossRef] [PubMed]
  33. Abi-Samra, N.C. Sample Effects of extreme weather on power systems and components, part I: Sample effects on distribution systems. In Proceedings of the 2010 IEEE Power and Energy Society General Meeting, Providence, RI, USA, 25–29 July 2010; pp. 1–3. [Google Scholar] [CrossRef]
  34. Abi-Samra, N.C.; Malcolm, W.P. Extreme weather effects on power systems. In Proceedings of the 2010 IEEE Power and Energy Society General Meeting, Detroit, MI, USA, 24–29 July 2011; pp. 1–5. [Google Scholar] [CrossRef]
  35. Kenward, A.; Raja, U. Blackout: Extreme Weather, Climate Change and Power Outages; Climate Central: Princeton, NJ, USA, 2014. [Google Scholar]
  36. Fact sheet 6—The Beaufort Scale. Available online: https://www.metoffice.gov.uk/binaries/content/assets/mohippo/pdf/b/7/fact_sheet_no._6.pdf (accessed on 22 February 2017).
  37. Park, Y.J.; Glagola, C.R.; Gurley, K.R.; Son, K. Performance assessment of the Florida electric-power network system against hurricanes. Nat. Hazards Rev. 2014, 15, 1–7. [Google Scholar] [CrossRef]
  38. Saffir-Simpson Hurricane Wind Scale. Available online: http://www.nhc.noaa.gov/aboutsshws.php (accessed on 9 February 2017).
  39. Spence, W.; Sipkin, S.A.; Choy, G.L. Measuring the Size of an Earthquake. Available online: https://earthquake.usgs.gov/learn/topics/measure.php (accessed on 30 March 2017).
  40. Floods, The Awesome Power. Available online: http://www.nws.noaa.gov/floodsafety/resources/FloodsTheAwesomePower_NSC.pdf (accessed on 22 February 2017).
  41. National Weather Service. Thunderstorms, Tornadoes, Lightning: Nature’ s Most Violent Storms. Available online: https://www.weather.gov/media/owlie/ttl6-10.pdf (accessed on 22 February 2017).
  42. National Weather Service NWS Heat Safety Safety Home Page. Available online: http://www.nws.noaa.gov/om/heat/heat_index.shtml (accessed on 14 August 2017).
  43. Coles, S. An Introduction to Statistical Modeling of Extreme Values, 1st ed.; Springer: London, UK, 2001. [Google Scholar]
  44. Bouwer, L.M. Projections of Future Extreme Weather Losses Under Changes in Climate and Exposure. Risk Anal. 2013, 33, 915–930. [Google Scholar] [CrossRef] [PubMed]
  45. Component of Risk: Exposure. Available online: http://www.preventionweb.net/risk/exposure (accessed on 22 February 2017).
  46. Han, S.R.; Guikema, S.D.; Quiring, S.M. Improving the predictive accuracy of hurricane power outage forecasts using generalized additive models. Risk Anal. 2009, 29, 1443–1453. [Google Scholar] [CrossRef] [PubMed]
  47. Schlögl, M.; Laaha, G. Extreme weather exposure identification for road networks—A comparative assessment of statistical methods. Nat. Hazards Earth Syst. Sci. 2017, 17, 515–531. [Google Scholar] [CrossRef]
  48. Barben, R. Vulnerability Assessment of Electric Power Supply under Extreme Weather Conditions. Ph.D. Thesis, École Polytechnique Fédérale de Lausanne, Lausanne, Switzerland, 9 December 2010. [Google Scholar]
  49. Birkmann, J. Measuring vulnerability to promote disaster-resilient societies: Conceptual frameworks and definitions. In Measuring Vulnerability to Natural Hazards: Towards Disaster Resilient Societies; United Nations University: Tokyo, Japan, 2006; ISBN 92-808-1135-5. [Google Scholar]
  50. Hellström, T. Critical infrastructure and systemic vulnerability: Towards a planning framework. Saf. Sci. 2007, 45, 415–430. [Google Scholar] [CrossRef]
  51. Adger, W.N. Vulnerability. Glob. Environ. Chang. 2006, 16, 268–281. [Google Scholar] [CrossRef]
  52. Ciurean, R.L.; Schroter, D.; Glade, T. Conceptual Frameworks of Vulnerability Assessments for Natural Disasters Reduction. In Approaches to Disaster Management—Examining the Implications of Hazards, Emergencies and Disasters; InTech: London, UK, 2013; pp. 3–32. ISBN 978-953-51-1093-4. [Google Scholar]
  53. Reed, D.A.; Kapur, K.C.; Christie, R.D. Methodology for assessing the resilience of networked infrastructure. IEEE Syst. J. 2009, 3, 174–180. [Google Scholar] [CrossRef]
  54. Van de Lindt, J.; Taggart, M. Fragility Analysis Methodology for Performance-Based Analysis of Wood-Frame Buildings for Flood. Nat. Hazards Rev. 2009, 10, 113–123. [Google Scholar] [CrossRef]
  55. Shafieezadeh, A.; Onyewuchi, U.P.; Begovic, M.M.; Desroches, R. Age-dependent fragility models of utility wood poles in power distribution networks against extreme wind hazards. IEEE Trans. Power Deliv. 2014, 29, 131–139. [Google Scholar] [CrossRef]
  56. Zareei, S.A.; Hosseini, M.; Ghafory-Ashtiany, M. Seismic failure probability of a 400 kV power transformer using analytical fragility curves. Eng. Fail. Anal. 2016, 70, 273–289. [Google Scholar] [CrossRef]
  57. Dai, Y.; Chen, G.; Dong, Z.; Xue, Y.; Hill, D.J.; Zhao, Y. An improved framework for power grid vulnerability analysis considering critical system features. Phys. A Stat. Mech. Its Appl. 2014, 395, 405–415. [Google Scholar] [CrossRef]
  58. Johansson, J.; Hassel, H. An approach for modelling interdependent infrastructures in the context of vulnerability analysis. Reliab. Eng. Syst. Saf. 2010, 95, 1335–1344. [Google Scholar] [CrossRef]
  59. Kim, D.H.; Eisenberg, D.A.; Chun, Y.H.; Park, J. Network topology and resilience analysis of South Korean power grid. Phys. A Stat. Mech. Its Appl. 2017, 465, 13–24. [Google Scholar] [CrossRef]
  60. Motter, A.E.; Lai, Y.C. Cascade-based attacks on complex networks. Phys. Rev. E 2002, 66, 2–5. [Google Scholar] [CrossRef] [PubMed]
  61. Wang, K.; Zhang, B.H.; Zhang, Z.; Yin, X.G.; Wang, B. An electrical betweenness approach for vulnerability assessment of power grids considering the capacity of generators and load. Phys. A Stat. Mech. Its Appl. 2011, 390, 4692–4701. [Google Scholar] [CrossRef]
  62. Song, C.-S.; Park, C.-H.; Yoon, M.-H.; Jang, G.-S. Implementation of PTDFs and LODFs for Power System Security. J. Int. Counc. Electr. Eng. 2011, 1, 49–53. [Google Scholar] [CrossRef]
  63. Alenazi, M.J.F.; Sterbenz, J.P.G. Evaluation and improvement of network resilience against attacks using graph spectral metrics. In Proceedings of the 2015 Resilience Week (RWS), Philadelphia, PA, USA, 18–20 August 2015; pp. 206–211. [Google Scholar] [CrossRef]
  64. Chen, G.; Dong, Z.Y.; Hill, D.J.; Zhang, G.H.; Hua, K.Q. Attack structural vulnerability of power grids: A hybrid approach based on complex networks. Phys. A Stat. Mech. Its Appl. 2010, 389, 595–603. [Google Scholar] [CrossRef]
  65. Guo, J.; Han, Y.; Guo, C.; Lou, F.; Wang, Y. Modeling and Vulnerability Analysis of Cyber-Physical Power Systems Considering Network Topology and Power Flow Properties. Energies 2017, 10, 87. [Google Scholar] [CrossRef]
  66. Wang, Z.; He, J.; Nechifor, A.; Zhang, D.; Crossley, P. Identification of Critical Transmission Lines in Complex Power Networks. Energies 2017, 10, 1294. [Google Scholar] [CrossRef]
  67. Romieu, E.; Welle, T.; Schneiderbauer, S.; Pelling, M.; Vinchon, C. Vulnerability assessment within climate change and natural hazard contexts: Revealing gaps and synergies through coastal applications. Sustain. Sci. 2010, 5, 159–170. [Google Scholar] [CrossRef]
  68. Solheim, Ø.R.; Kjølle, G. Wind dependent failure rates for overhead transmission lines using reanalysis data and a Bayesian updating scheme. In Proceedings of the 2016 International Conference on Probabilistic Methods Applied to Power Systems (PMAPS), Beijing, China, 16–18 October 2016; pp. 1–7. [Google Scholar] [CrossRef]
  69. Papathoma-Köhle, M.; Zischg, A.; Fuchs, S.; Glade, T.; Keiler, M. Loss estimation for landslides in mountain areas – An integrated toolbox for vulnerability assessment and damage documentation. Environ. Model. Softw. 2015, 63, 156–169. [Google Scholar] [CrossRef]
  70. Gao, J.; Liu, X.; Li, D.; Havlin, S. Recent progress on the resilience of complex networks. Energies 2015, 8, 12187–12210. [Google Scholar] [CrossRef]
  71. Bhave, A.S.; Crow, M.L.; Cetinkaya, E.K. Robustness of power grid topologies against centrality-based attacks. In Proceedings of the 2016 Resilience Week (RWS), Chicago, IL, USA, 16–18 August 2016; pp. 115–118. [Google Scholar] [CrossRef]
  72. Solé, R.V.; Rosas-Casals, M.; Corominas-Murtra, B.; Valverde, S. Robustness of the European power grids under intentional attack. Phys. Rev. E 2008, 77, 1–7. [Google Scholar] [CrossRef] [PubMed]
  73. Chopade, P.; Bikdash, M. New centrality measures for assessing smart grid vulnerabilities and predicting brownouts and blackouts. Int. J. Crit. Infrastruct. Prot. 2016, 12, 29–45. [Google Scholar] [CrossRef]
  74. Bagchi, A.; Sprintson, A.; Singh, C. Modeling the impact of fire spread on an electrical distribution network. Electr. Power Syst. Res. 2013, 100, 15–24. [Google Scholar] [CrossRef]
  75. Ancona, J.J. A Framework For Power System Restoration Following a Major Power Failure. IEEE Trans. Power Syst. 1995, 10, 1480–1485. [Google Scholar] [CrossRef]
  76. Arif, A.; Ma, S.; Wang, Z. Optimization of transmission system repair and restoration with crew routing. In Proceedings of the 2016 North American Power Symposium (NAPS), Denver, CO, USA, 18–20 September 2016. [Google Scholar] [CrossRef]
  77. Chen, B.; Chen, C.; Wang, J.; Butler-Purry, K.L. Sequential Service Restoration for Unbalanced Distribution Systems and Microgrids. IEEE Trans. Power Syst. 2017, 8950. [Google Scholar] [CrossRef]
  78. Gholami, A.; Aminifar, F. A Hierarchical Response-Based Approach to the Load Restoration Problem. IEEE Trans. Smart Grid 2017, 8, 1700–1709. [Google Scholar] [CrossRef]
  79. Gao, H.; Chen, Y.; Xu, Y.; Liu, C.C. Resilience-Oriented Critical Load Restoration Using Microgrids in Distribution Systems. IEEE Trans. Smart Grid 2016, 7, 2837–2848. [Google Scholar] [CrossRef]
  80. Kwasinski, A. Quantitative Model and Metrics of Electrical Grids’ Resilience Evaluated at a Power Distribution Level. Energies 2016, 9, 93. [Google Scholar] [CrossRef]
  81. Kuntz, P.A.; Christie, R.D.; Venkata, S.S. Optimal vegetation maintenance scheduling of overhead electric power distribution systems. IEEE Trans. Power Deliv. 2002, 17, 1164–1169. [Google Scholar] [CrossRef]
  82. Zahodiakin, P. Making distribution grids stronger, more resilient. EPRI J. 2016, 4, 4–8. [Google Scholar]
  83. Edison Electric Institute Before and After the Storm-Update: A Compilation of Recent Studies, Programs and Policies Related to Storm Hardening and Resiliency; Edison Electric Institute: Washington, DC, USA, 2014.
  84. Hoffman, P.; Bryan, W.; Farber-DeAnda, M.; Cleaver, M.; Lewandowski, C.; Young, K. Hardening and Resiliency, U.S. Energy Industry Response to Recent Hurricane Seasons. Available online: https://www.oe.netl.doe.gov/docs/HR-Report-final-081710.pdf (accessed on 22 February 2017).
  85. McGranaghan, M.; Olearczyk, M.; Gellings, C. Enhancing Distribution Resiliency: Opportunities for Applying Innovative Technologies. Available online: http://www.epri.com/abstracts/Pages/ProductAbstract.aspx?ProductId=000000000001026889 (accessed on 18 February 2017).
  86. Dehghanpour, K.; Colson, C.; Nehrir, H. A Survey on Smart Agent-Based Microgrids for Resilient/Self-Healing Grids. Energies 2017, 10, 620. [Google Scholar] [CrossRef]
  87. Cuadra, L.; Pino, M.; Nieto-Borge, J.; Salcedo-Sanz, S. Optimizing the Structure of Distribution Smart Grids with Renewable Generation against Abnormal Conditions: A Complex Networks Approach with Evolutionary Algorithms. Energies 2017, 10, 1097. [Google Scholar] [CrossRef]
  88. Yamagata, Y.; Murakami, D.; Minami, K.; Arizumi, N.; Kuroda, S.; Tanjo, T.; Maruyama, H. Electricity Self-Sufficient Community Clustering for Energy Resilience. Energies 2016, 9, 543. [Google Scholar] [CrossRef]
  89. Davis, G.; Snyder, A.F.; Mader, J. The future of Distribution System Resiliency. In Proceedings of the 2014 Clemson University Power Systems Conference (PSC), Clemson, SC, USA, 11–14 March 2014. [Google Scholar] [CrossRef]
  90. Davis, C.; Keilis-Borok, V.; Molchan, G.; Shebalin, P.; Lahr, P.; Plumb, C. Earthquake prediction and disaster preparedness: interactive analysis. Nat. Hazards Rev. 2010, 11, 173–184. [Google Scholar] [CrossRef]
  91. Britton, N.R.; Clark, G.J. From Response to Resilience: Emergency Management Reform in New Zealand. Nat. Hazards Rev. 2000, 1, 145–150. [Google Scholar] [CrossRef]
  92. Davidson, R.; Liu, H.; Sarpong, I.; Sparks, P.; Rosowsky, D. Electric Power Distribution System Performance in Carolina Hurricanes. Nat. Hazards Rev. 2003, 4, 36–45. [Google Scholar] [CrossRef]
  93. Ciapessoni, E.; Cirio, D.; Massucco, S.; Morini, A.; Pitto, A.; Silvestro, F. Risk-Based Dynamic Security Assessment for Power System Operation and Operational Planning. Energies 2017, 10, 475. [Google Scholar] [CrossRef]
Figure 1. Illustration of the relationship between determinants of the impact. The size of the impact (IM) is determined by the intensity of the extreme weather event (IEW), the grid exposure (E), and the grid vulnerability (V).
Energies 10 01779 g001
Figure 2. Three resilient properties of the grid.
Energies 10 01779 g002
Figure 3. Determinants of the grid capability.
Energies 10 01779 g003
Figure 4. Vulnerability curve.
Energies 10 01779 g004
Figure 5. Simplified illustration of the grid resilience assessment. (a) Grid exposure; (b) wind speed profile; (c) grid vulnerability curve; (d) physical durability; (e) operational versatility; and (f) rehabilitation capacity.
Energies 10 01779 g005
Figure 6. Illustration of grid state transition for different implementation of enhancement strategies. (a) Grid state transition before implementation of the enhancement strategies; (b) grid state transition with enhancement on the physical durability; (c) grid state transition with enhancement on the operational versatility; and (d) grid state transition with enhancement on all determinants.
Energies 10 01779 g006

