1. Introduction
Consumer society habits acquired throughout years of economic growth and urban development have led to an increased volume of produced municipal solid waste (MSW) [
1]. In 2015 the worldwide MSW generation was approximately 1300 million tons per year, with predictions dictating an annual growth rate of 4 to 5.6% in developed countries and 2 to 3% in underdeveloped ones [
2,
3]. By the year of 2025 MSW should amount to an astonishing quantity of 2600 million tons per year, doubling its amount in a mere 10-year period. Such indicators come from assuming a current daily consumption of 1.2 kg of MSW per capita, increasing to an estimated 1.42 kg per capita by the year of 2025 [
2].
Regarding the global primary energy demands, fossil fuels still take the lead in energetic dependency with nearly an 86% share by 2016, while nuclear-hydroelectric and renewables have barely an 11% and 3% share, respectively [
4]. Given the threats associated with the reliance on quickly depleting fossil fuels and the severe environmental issues related to the greenhouse gas emissions that accrue, it is therefore time to rethink energy policies [
5]. For instance, major companies such as Volvo took a stand towards reducing the carbon footprint, committing to pull the plug on gas fueled engines and replace them with fully electric or hybrid technology from 2019 onwards [
6]. Thus, a set of changes to reduce the consumption of non-renewables aiming at better energy infrastructure and climate change prospects have been observed.
Waste-to-energy (WtE) conversion methods offer an alluring solution not only to the ongoing energy problem, but also in waste disposal, by reducing the volume of landfilled waste and increasing the recycling rates [
7]. Here, MSW can be an important part of the equation as a huge and perpetual energy source due to its endless abundance generated by populations on a daily basis. Waste incineration was initially introduced as a potential solution, however, the high associated costs, tight air pollution regulations and ash disposal challenges made room for more viable alternatives [
8]. Gasification is a thermo-chemical process that converts carbon-based feedstocks into a highly energetic and combustible gas mixture known as syngas [
9]. Recent reports not only indicate waste gasification as feasible, but also capable of treating MSW with fewer emissions than other treatment methods [
10,
11]. Such assertions have made gasification a rather attractive WtE method from an economic and energetic point of view, meeting the World’s current growing demands for a more efficient and cleaner energy.
Niu et al. [
12] developed a comprehensive process model to simulate the thermodynamic performance of MSW gasification in a bubbling fluidized bed reactor. The authors varied an operating parameter, namely the gasification temperature, and analyzed the effect on the reactor efficiency and syngas composition. Results showed that increased temperatures, no higher than 900 °C, favored the gasification efficiency by improving the performance and combustibility of the syngas.
Begum et al. [
13] corroborated the results of Niu and colleagues [
12] regarding the gasification temperature effect on gasification performance, and improved the approach by implementing a model validation process by comparison with experimental data retrieved from the literature, furtherly extending the gasification model to other biomass related feedstocks.
Effects of MSW particle size at different operating temperatures and their direct influence on the syngas yield and composition were studied by Luo et al. [
14]. Gasification runs showed that smaller particles resulted in improved gas efficiency, and higher temperatures enhanced the syngas yield, reducing the char and tar appearance.
Reactor hydrodynamics with respect to waste gasification are seldom mentioned, regardless of their crucial importance, as it strongly influences all the fundamental properties within the gasification system. On this subject, Arena et al. [
15] discussed the key role of hydrodynamics and how it strongly affects the quality of the fluidization, by highlighting its dominance in all physical and chemical processes occurring during the gasification process. Heat transfer, gas and solids mixing, temperature distribution, residence time, and particles size and density are some of the main features dealt.
Couto et al. [
16] assessed the potential of Portuguese MSW by applying an extensively validated numerical model to the steam gasification approach. The authors evaluated the results by comparison with data previously obtained for Portuguese biomass feedstock gasification. Numerical and experimental results were found to be in good agreement. The conclusions showed that MSW syngas presented inferior yields when compared to biomass products. Nonetheless, the study presented the economic benefits regarding the current municipal waste logistic infrastructure, currently inexistent for biomass resources, enhancing the resourceful characteristics of MSW as an easily accessible feedstock.
The research group succeeded in demonstrating, through several published works, the constant ongoing evolution of the mathematical model, starting its first application on biomass substrates [
17,
18], followed the inclusion of various gasification agents and the upgrade to deal with the intrinsic heterogeneity of MSW [
16,
19,
20,
21]. Here, within the developed mathematical model, complex phenomena like hydrodynamics were included and considered, however the authors did not provide a deep analysis concerning this particular subject.
There are, to the best of our knowledge, limited studies on CFD simulation concerning the hydrodynamics of MSW gasification in pilot scale fluidized bed reactors. This analysis focuses in presenting useful data on this matter and emphasizes the promising usage of MSW in gasification. Thereby, the main purpose of this work is to present a 2-D multiphase model dealing with MSW gasification, using an Eulerian-Eulerian approach within the ANSYS FLUENT framework, coupled with UDFs applied to improve the reactor hydrodynamic behavior. The mathematical model validation was assessed by comparison to experimental results. A grid resolution analysis was developed in order to reach a proper solution respecting its certainty and computational cost. Hydrodynamics within the fluidized bed was modeled with special care, taking detail on solids mixing/segregation phenomena and heat transfer, herewith relating different operating variables and bed conditions.
2. MSW: A Portuguese Case Scenario
Portugal has made considerable progress in what comes to waste management performance. By the end of the last century Portugal still used dump disposal as the dominant treatment method [
22]. Implementation of waste management measures led to a trendy landfill disposal reduction over the years, setting up goals for waste reuse, recycling and recovery. With various measures applied over the last twenty years Portugal has managed to increase the proportion of waste selectively collected from 1.1% to 13.6% [
23].
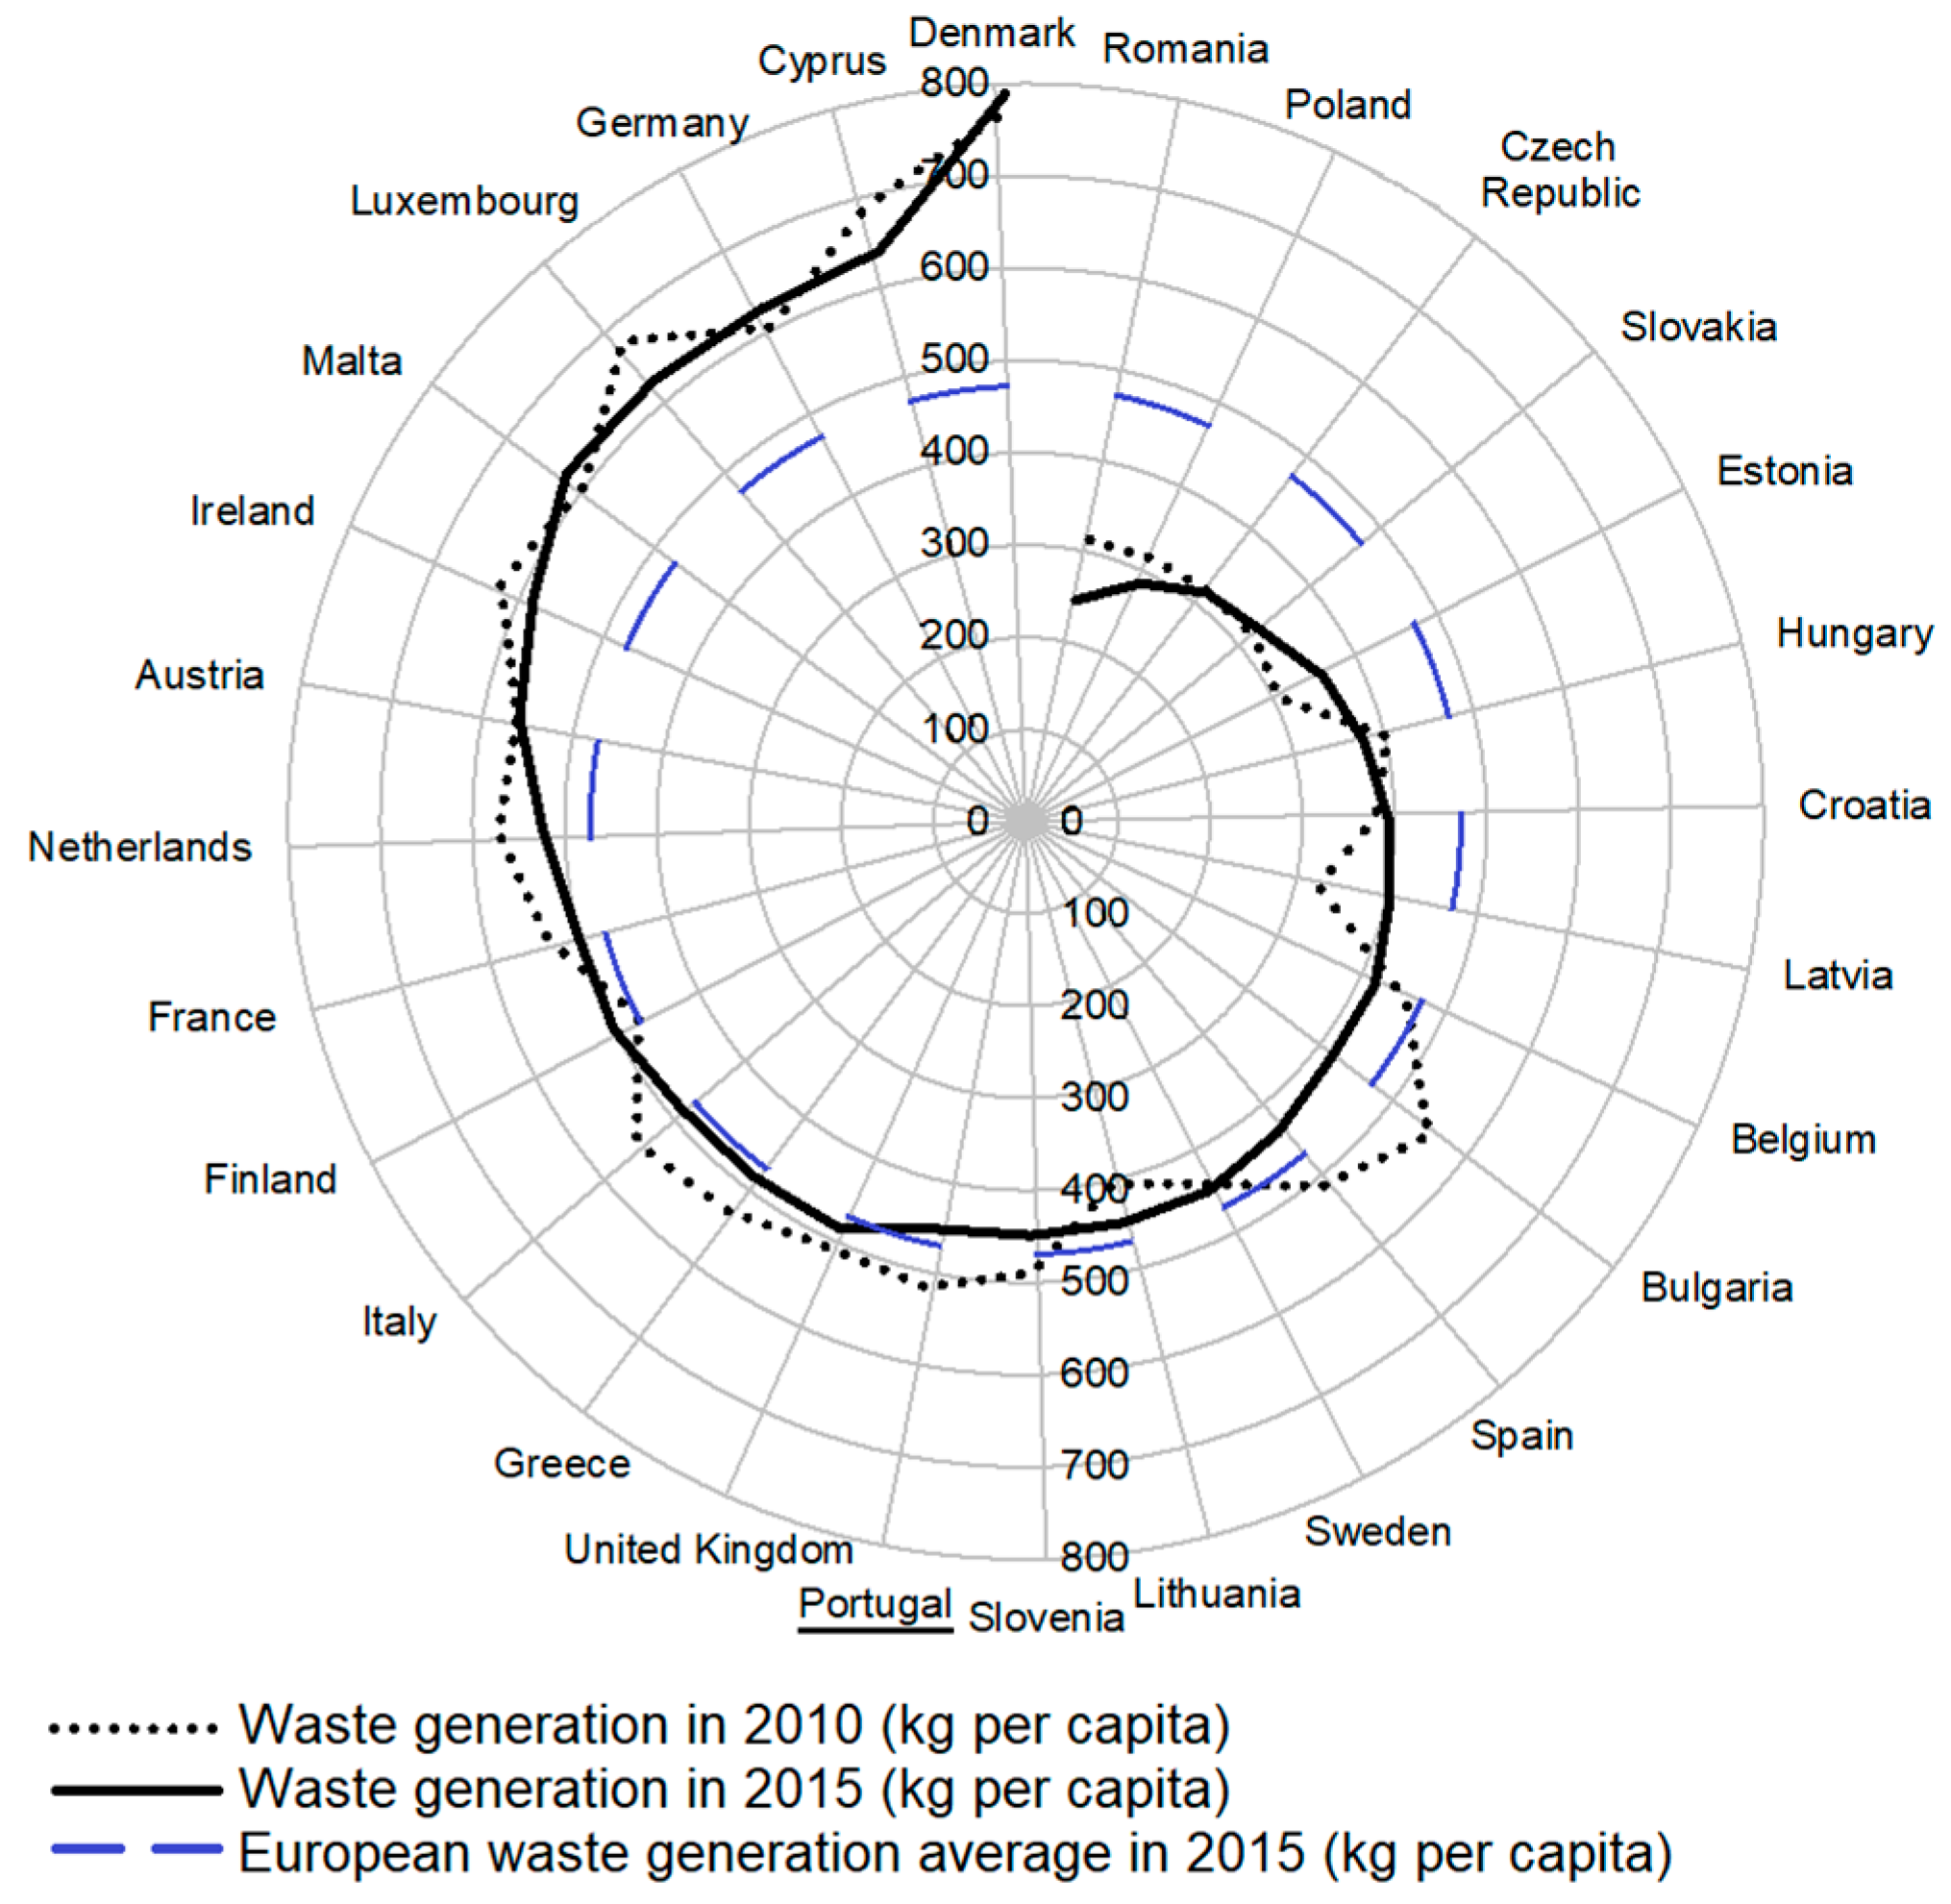
Figure 1 places Portugal in the European Union scenario, accounting the total amount of waste generated (kg per capita) together with other 27 European countries, in the years 2010 and 2015. Statistics show that the MSW produced varied from 789 kg per capita in Denmark, to 247 kg per capita in Romania, with Portugal accounting 452 kg per capita. These variations are related not only with consumer habits and economic wealth, as richer countries tend to show increased consumption demands, but also with waste treatment and disposal measures lying within each member state [
24]. From 2010 to 2015, Portugal and other 14 out of 28 countries cut back their waste production, with Bulgaria showing the largest reduction with an annual average decrease of 2.5% [
24]. Also, 15 of the 28 nations showed, in 2015, a waste generation rate sitting below the European average, Portugal included.
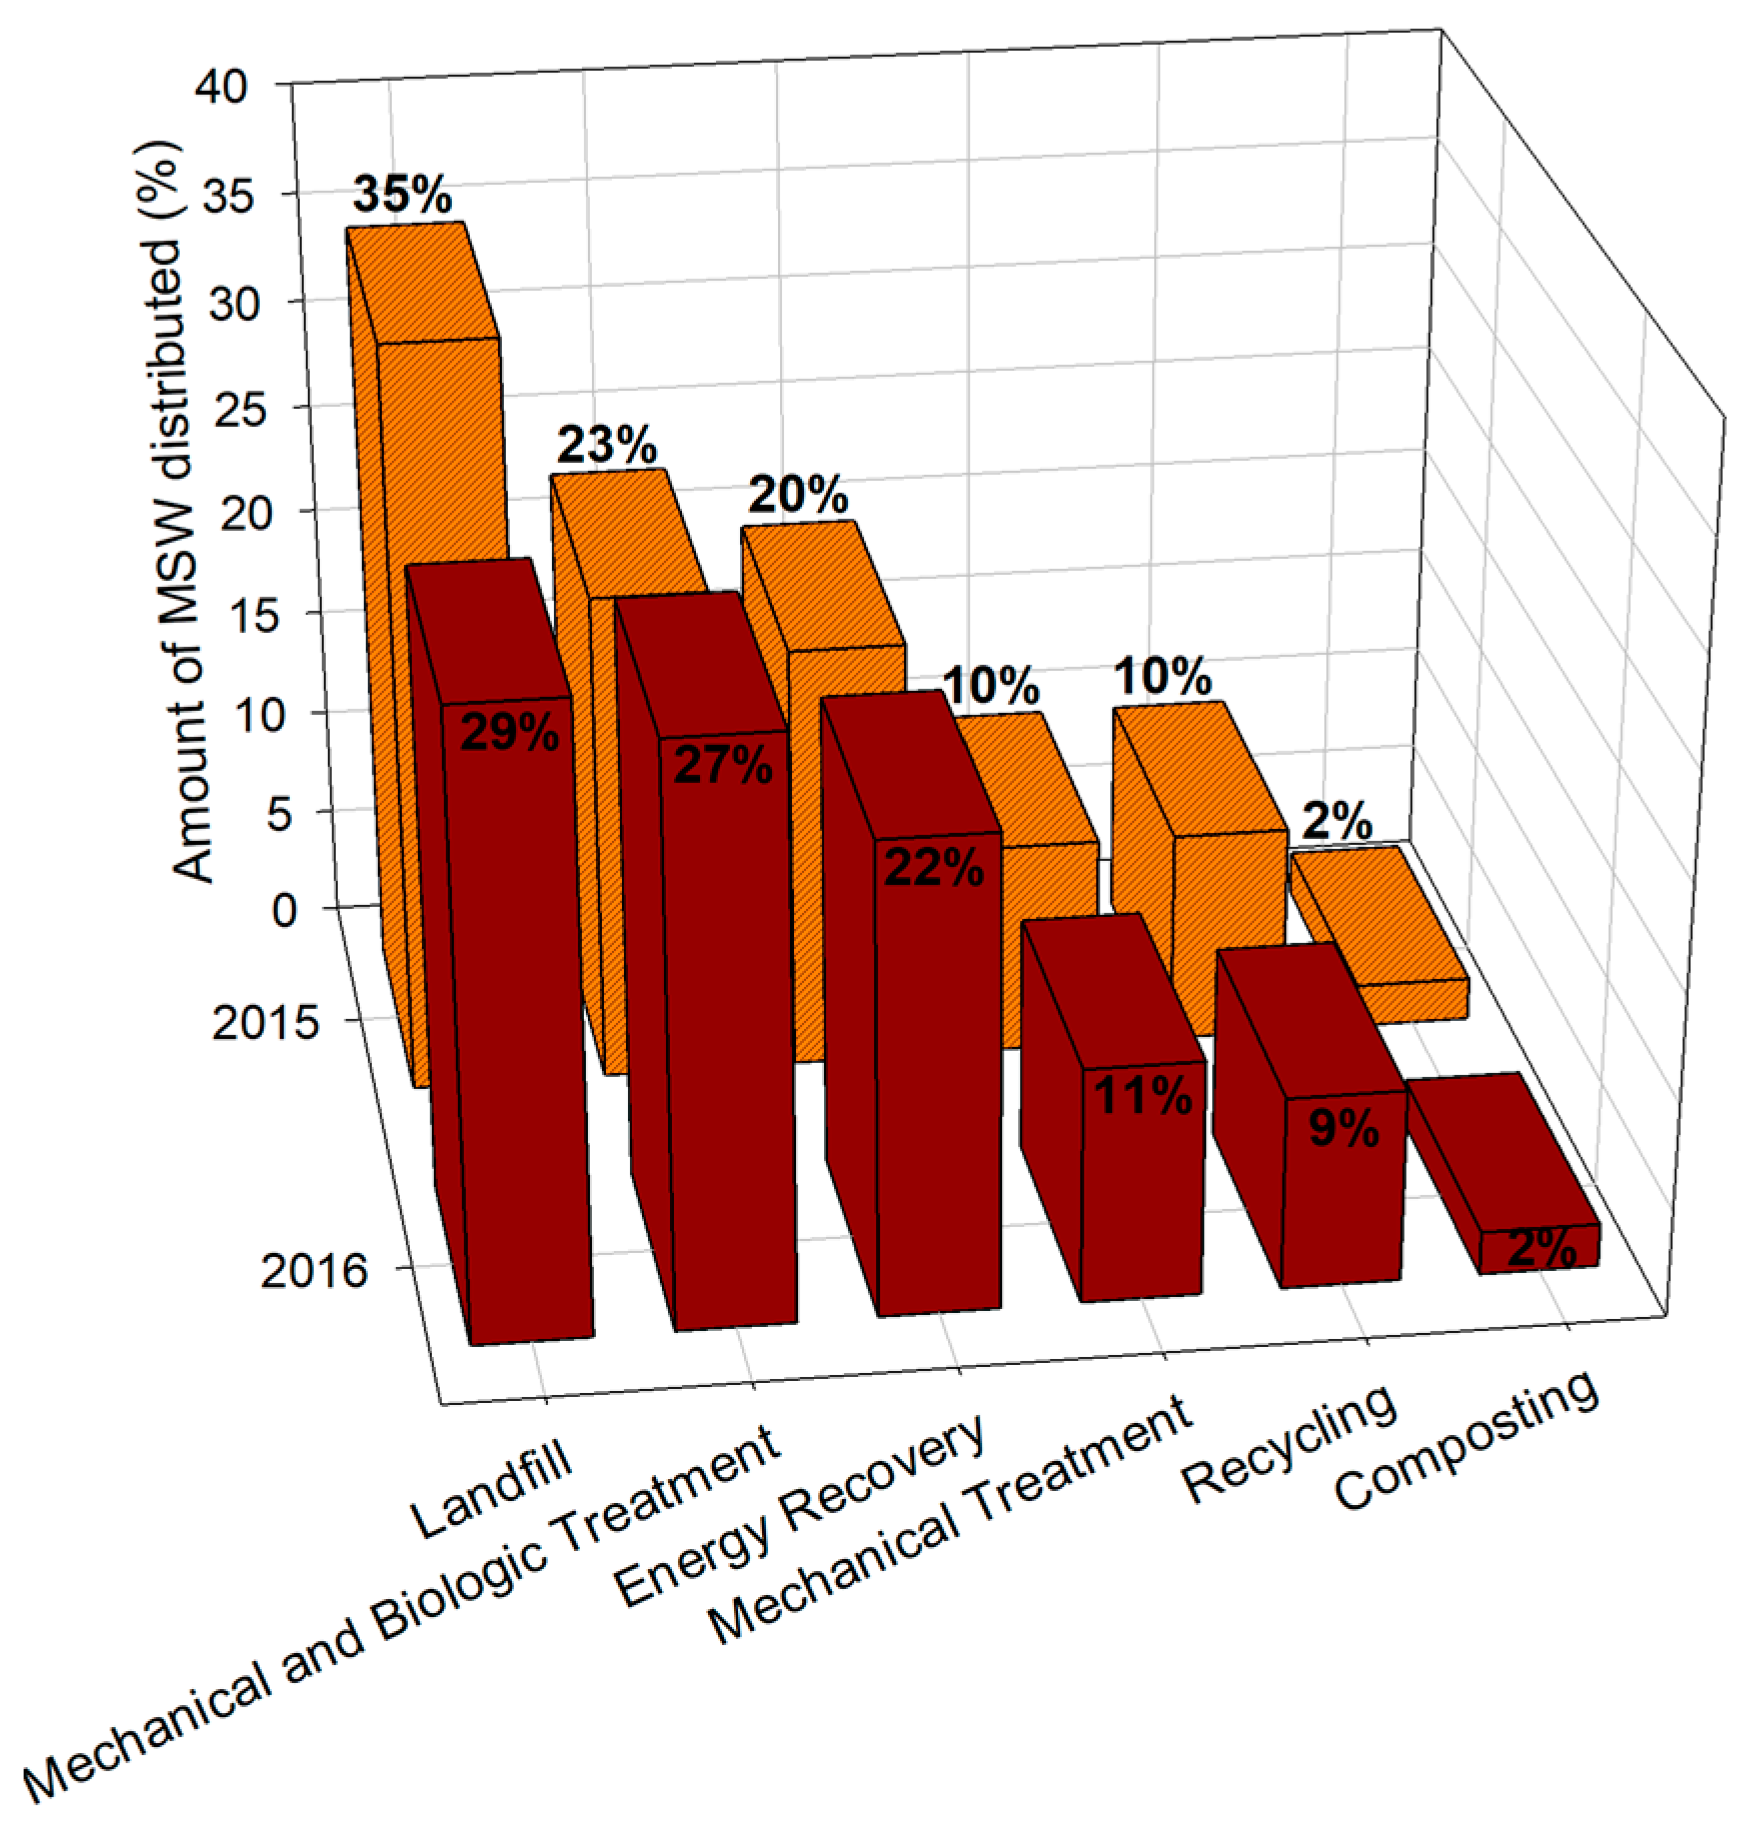
Current distribution regarding the Portuguese waste treatment management is depicted in
Figure 2. MSW produced in Portugal during 2016 was still mainly direct towards landfill disposal (29%), followed by mechanical and biological treatment (27%), energy recovery (22%), mechanical treatment (10%), recycling (10%), and composting (2%). In 2016, the total amount of MSW sent to landfills dropped, confirming the reduction trends and allowing a decrease of 41% compared to numbers recorded in 1995 [
25]. The introduction of new treatment and recovery facilities allowed for a direct landfill disposal reduction and an amount increase on recovered recyclable waste [
25]. However, from 2015 to 2016 a slight increase of 3% on the total amount of waste generated was detected, which may hamper the achievement of the defined goals for 2020, integrated in the National Waste Management Plans (PERSU 2020). PERSU 2020 holds as main concerns: 50% waste recycling increase by phasing out direct landfill up to 35% until 2020; support the efficiency increase of MSW management systems and infrastructures; and setting a minimum of 45 kg per capita of waste selectively collected [
23]. The achievement of these committed targets is now dependent on the optimization of the existing mechanical and biological waste treatment units, and in a social responsibility pointing towards ecological habits [
26].
Implementation of WtE methods offers a helping hand in achieving the 2020 targets. Thermo-chemical waste conversion technologies include incineration, pyrolysis and gasification. Gasification and pyrolysis make use of a controlled environment to convert waste into valuable commercial products such as syngas, a by-product that once purified can be used as a feedstock for petro-chemicals and other applications [
27], whereas incineration simply burns waste to create heat and produce electricity. Also, negative environmental impacts are frequently associated to this method, making incineration into a less feasible WtE process [
27]. Thus, gasification and pyrolysis deliver better prospects in waste recovering than incineration [
27]. Gasification in particular takes a further step within the thermal decomposition processes, being very cost competitive in comparison with incineration, aside from offering better environmental performance [
28]. Portugal relies mostly on incineration as the primary thermo-chemical energy recovery method, while other European countries such as Sweden, Denmark and the Netherlands already have high contributions from waste gasification [
29]. In an economic point of view, by turning waste into a resourceful feedstock gasification applied to MSW conversion can reduce the municipal waste management costs and provide a source of income [
27]. In this manner, gasification appears as an increasingly attractive and clean solution to treat MSW, becoming a valuable option to achieve the established environmental goals.
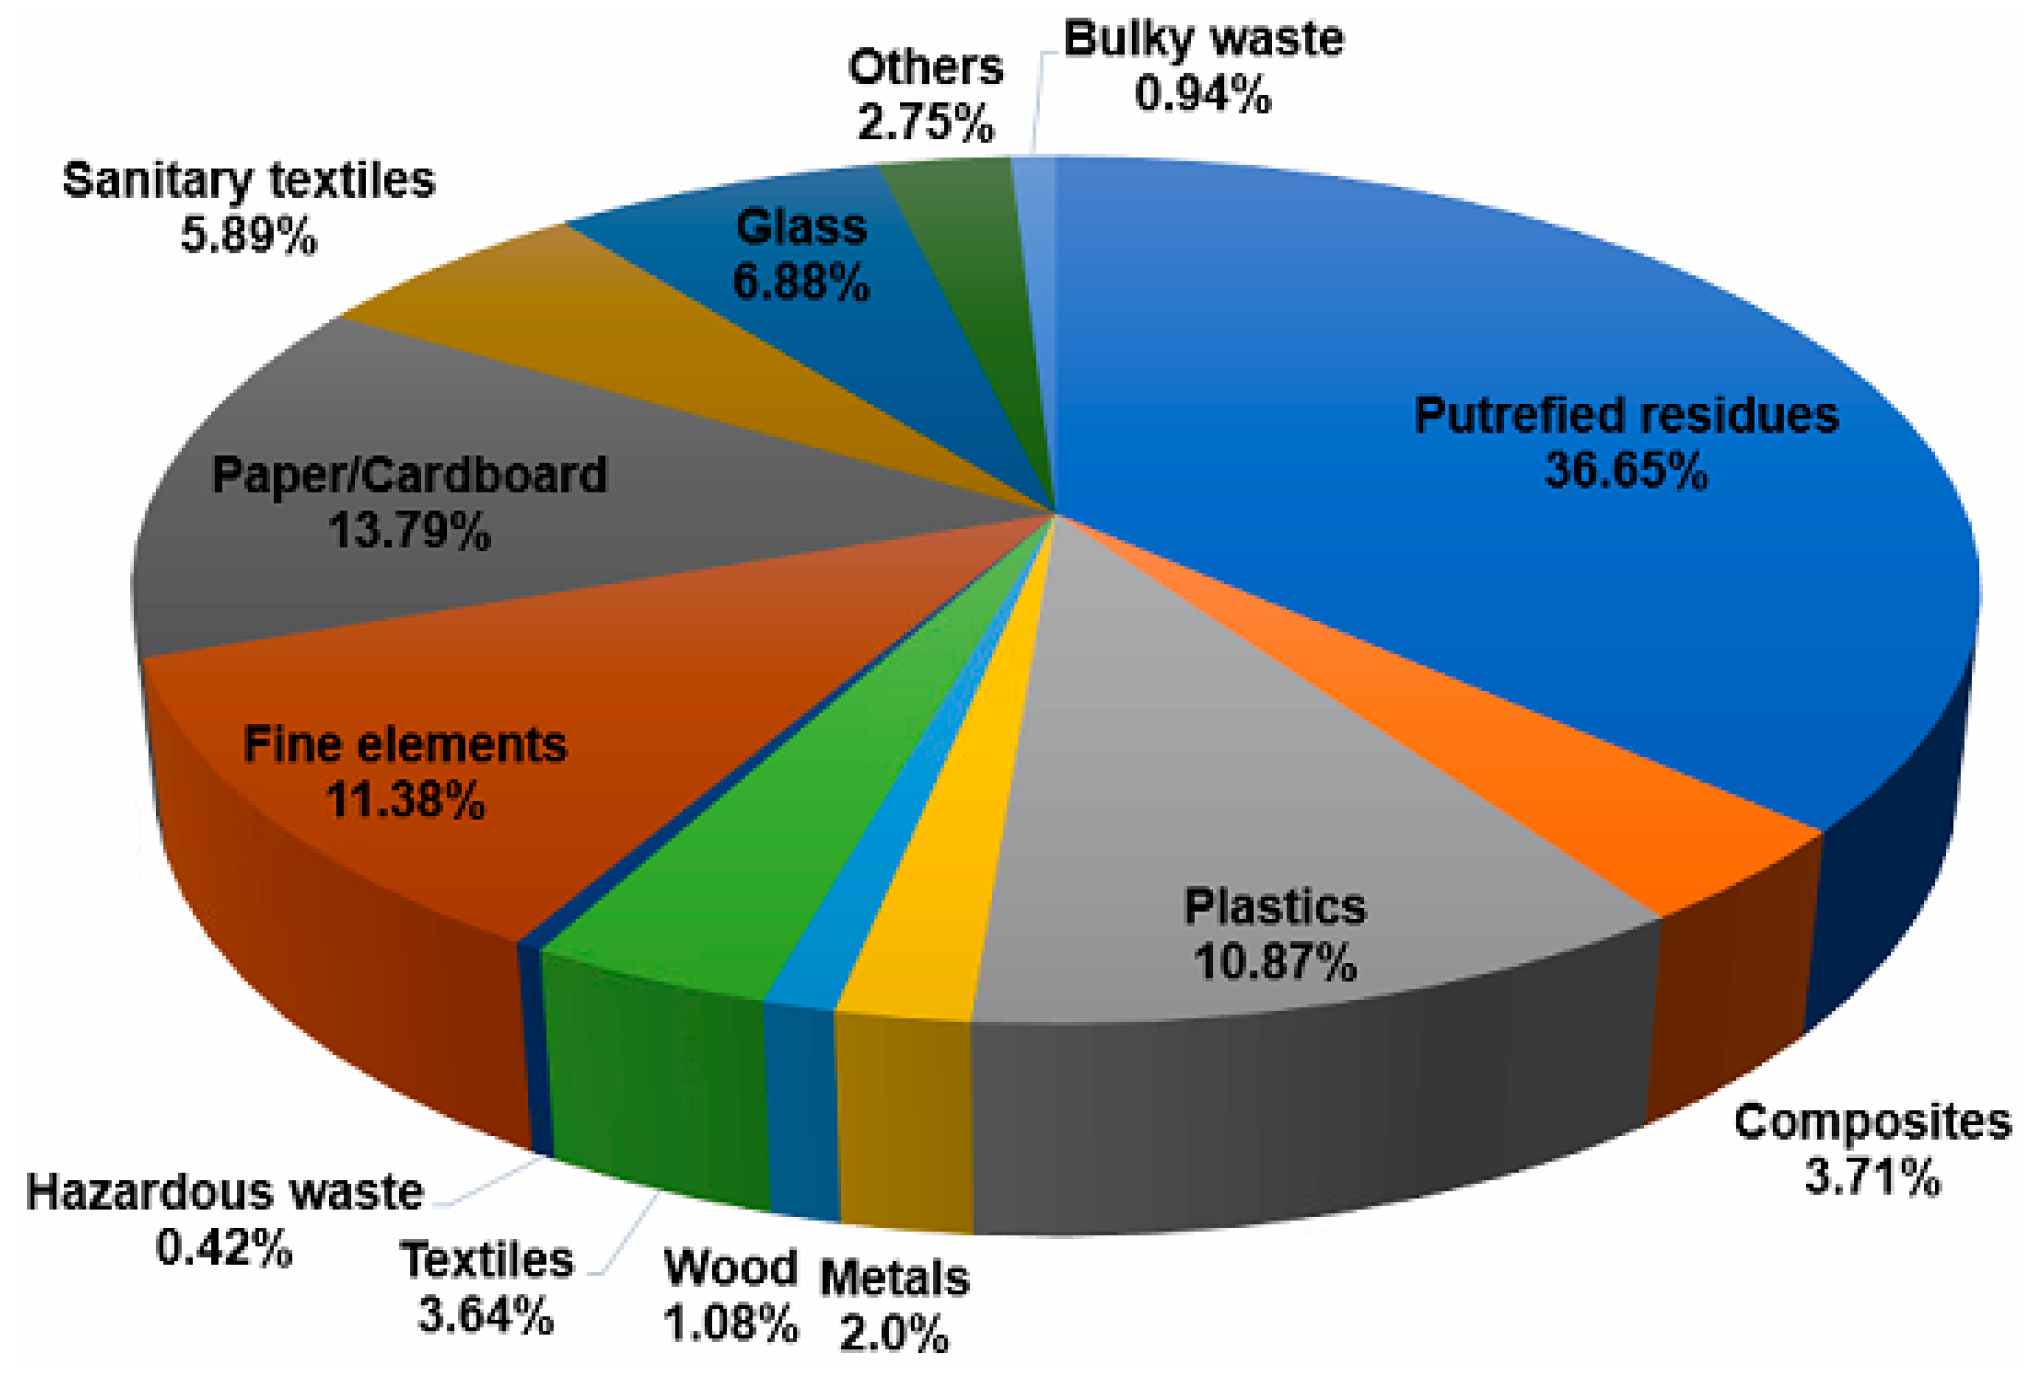
Waste composition analysis is an important step to evaluate the potential for valorization [
26]. MSW physical composition in mainland Portugal by the year of 2015 is presented in
Figure 3. In this study, the MSW used [
16] was collected from Northern Portugal.
Table 1 shows the average physical characteristics of the MSW considered. Both waste samples agree specially in the main composers, putrefied residues, paper/cardboard, textiles, fine elements, plastics and glass. Remaining composition differences seen are due to the fact that MSW physical composition is strongly dependent on the collection region and season, as they tend to vary with the consumption habits [
26].
5. Results and Discussion
5.1. Model Validation
A validation process must be assessed in order to ensure that the right predictions are being made by the previously described mathematical model. For that purpose, a serious of considerations must be endorsed. The mathematical model was already extensively validated for biomass substrates, concerning their syngas compositions, by means of experimental gasification runs in the previously described 250 kW
th pilot scale fluidized bed reactor [
17,
18]. In order to minimize deviations between experimental and numerical data, UDFs were included to improve the reactor hydrodynamics and corresponding validation was accomplished with fluidization curves gathered from experimental gasification runs from a 75 kW
th pilot scale fluidized bed reactor. These routines implement a set of polynomial equations designed to enhance the standard drag model and heat transfer phenomena features within the applied mathematical model. The drag model and heat transfer adjustments are fulfilled by optimizing the default drag coefficients and gas-solid thermal conductivity parameters within their governing equations, allowing customizing these general correlations to fit our particular modeling needs and to better agree with the experimental setup, regarding boundary conditions and material properties. Thus, the tuned routines provide a more accurate and predictable fitting procedure able to generate a more realistic behavior in different scaled reactors.
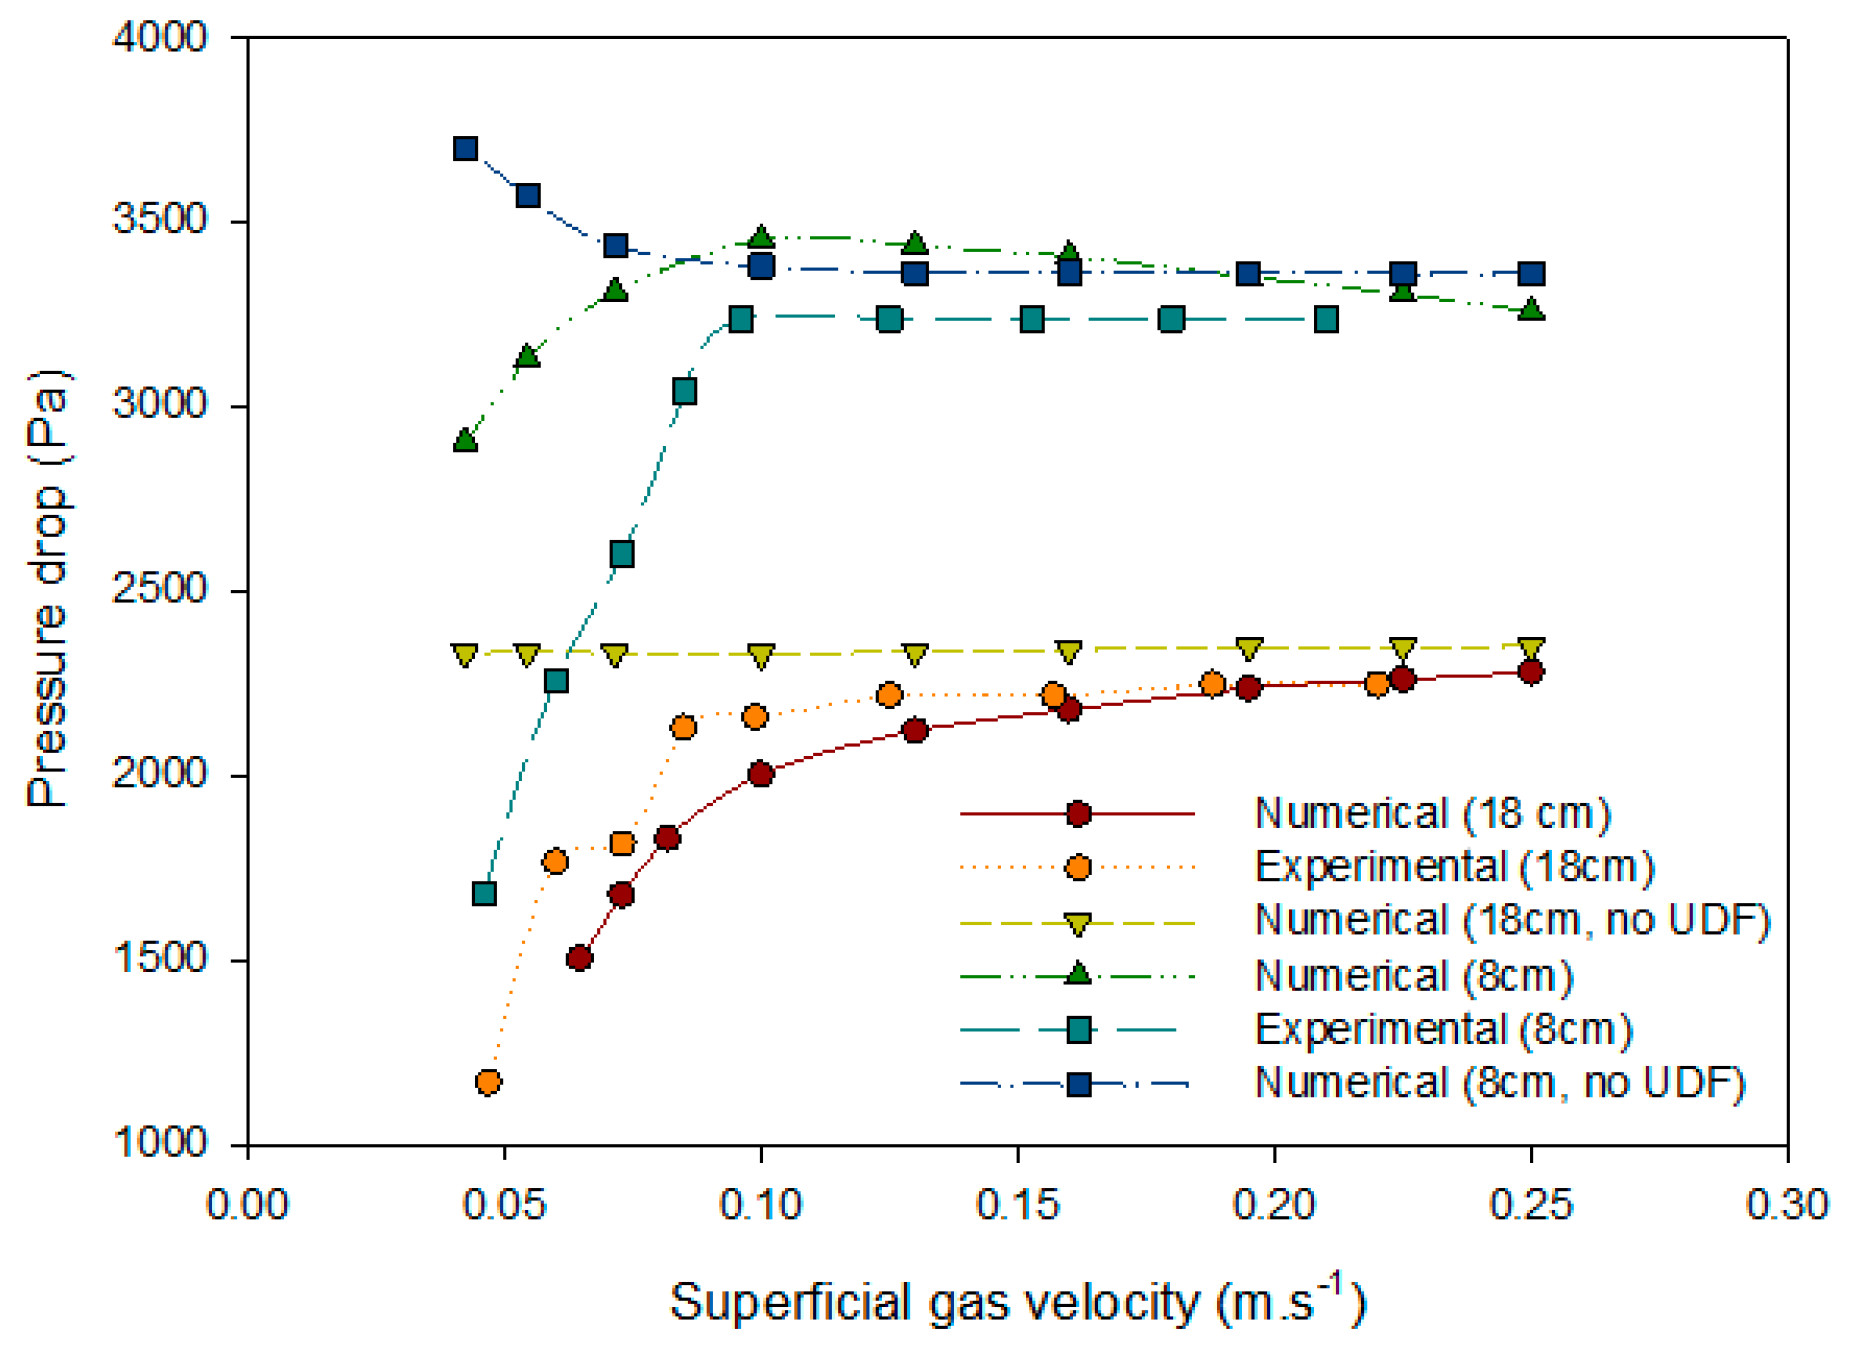
Figure 6 shows the deviation between the experimental and the numerical fluidization curves retrieved at two different bed heights (8 and 18 cm). Experimental and numerical results without UDFs inclusion are also depicted for the 8 and 18 cm curves. Results made clear that without the use of UDFs routines, the fluidization curves show higher deviations from the experimental results. Once the improvements were established, deviations were within good acceptance and the model was capable of predicting the curves slope behavior with good agreement, turning the fluidization process much more perceptible and closer to a more righteous scenario. A similar strategy was successfully applied to biomass gasification in the 250 kW
th reactor, again the experimental and the numerical results presented inferior deviations once the UDFs routines were implemented. Indeed, a better agreement between experimental and numerical results for the syngas composition was found with a 15–30% range error deviation decrease for species composition regarding former validations using biomass and MSW [
17,
20].
One occurrence to note is that, regarding the hydrodynamics alone, when no chemical reactions are being considered, biomass and MSW substrates physical characteristics come close, with most of interactions within the fluidized bed being conserved. Critical differences are mainly related with heat exchange because MSW has a high moisture content. To take into account such differences and to evaluate the adequacy of the developed hydrodynamics model, the chemical reactions are included and further validation was accomplished with syngas runs.
5.2. Time-Mean Volume Fraction and Solid Particles Velocity Profiles
The mathematical model once validated, MSW and dolomite simulation runs were accomplished by handling the solids within the simulation setup. Mean volume fraction profiles compared together with the velocity vectors, give an insightful view of the reactor’s hydrodynamics by depicting the solids distribution and movement within the fluidized bed. MSW and dolomite interplay was implemented by means of a UDFs concerning drag and heat transfer.
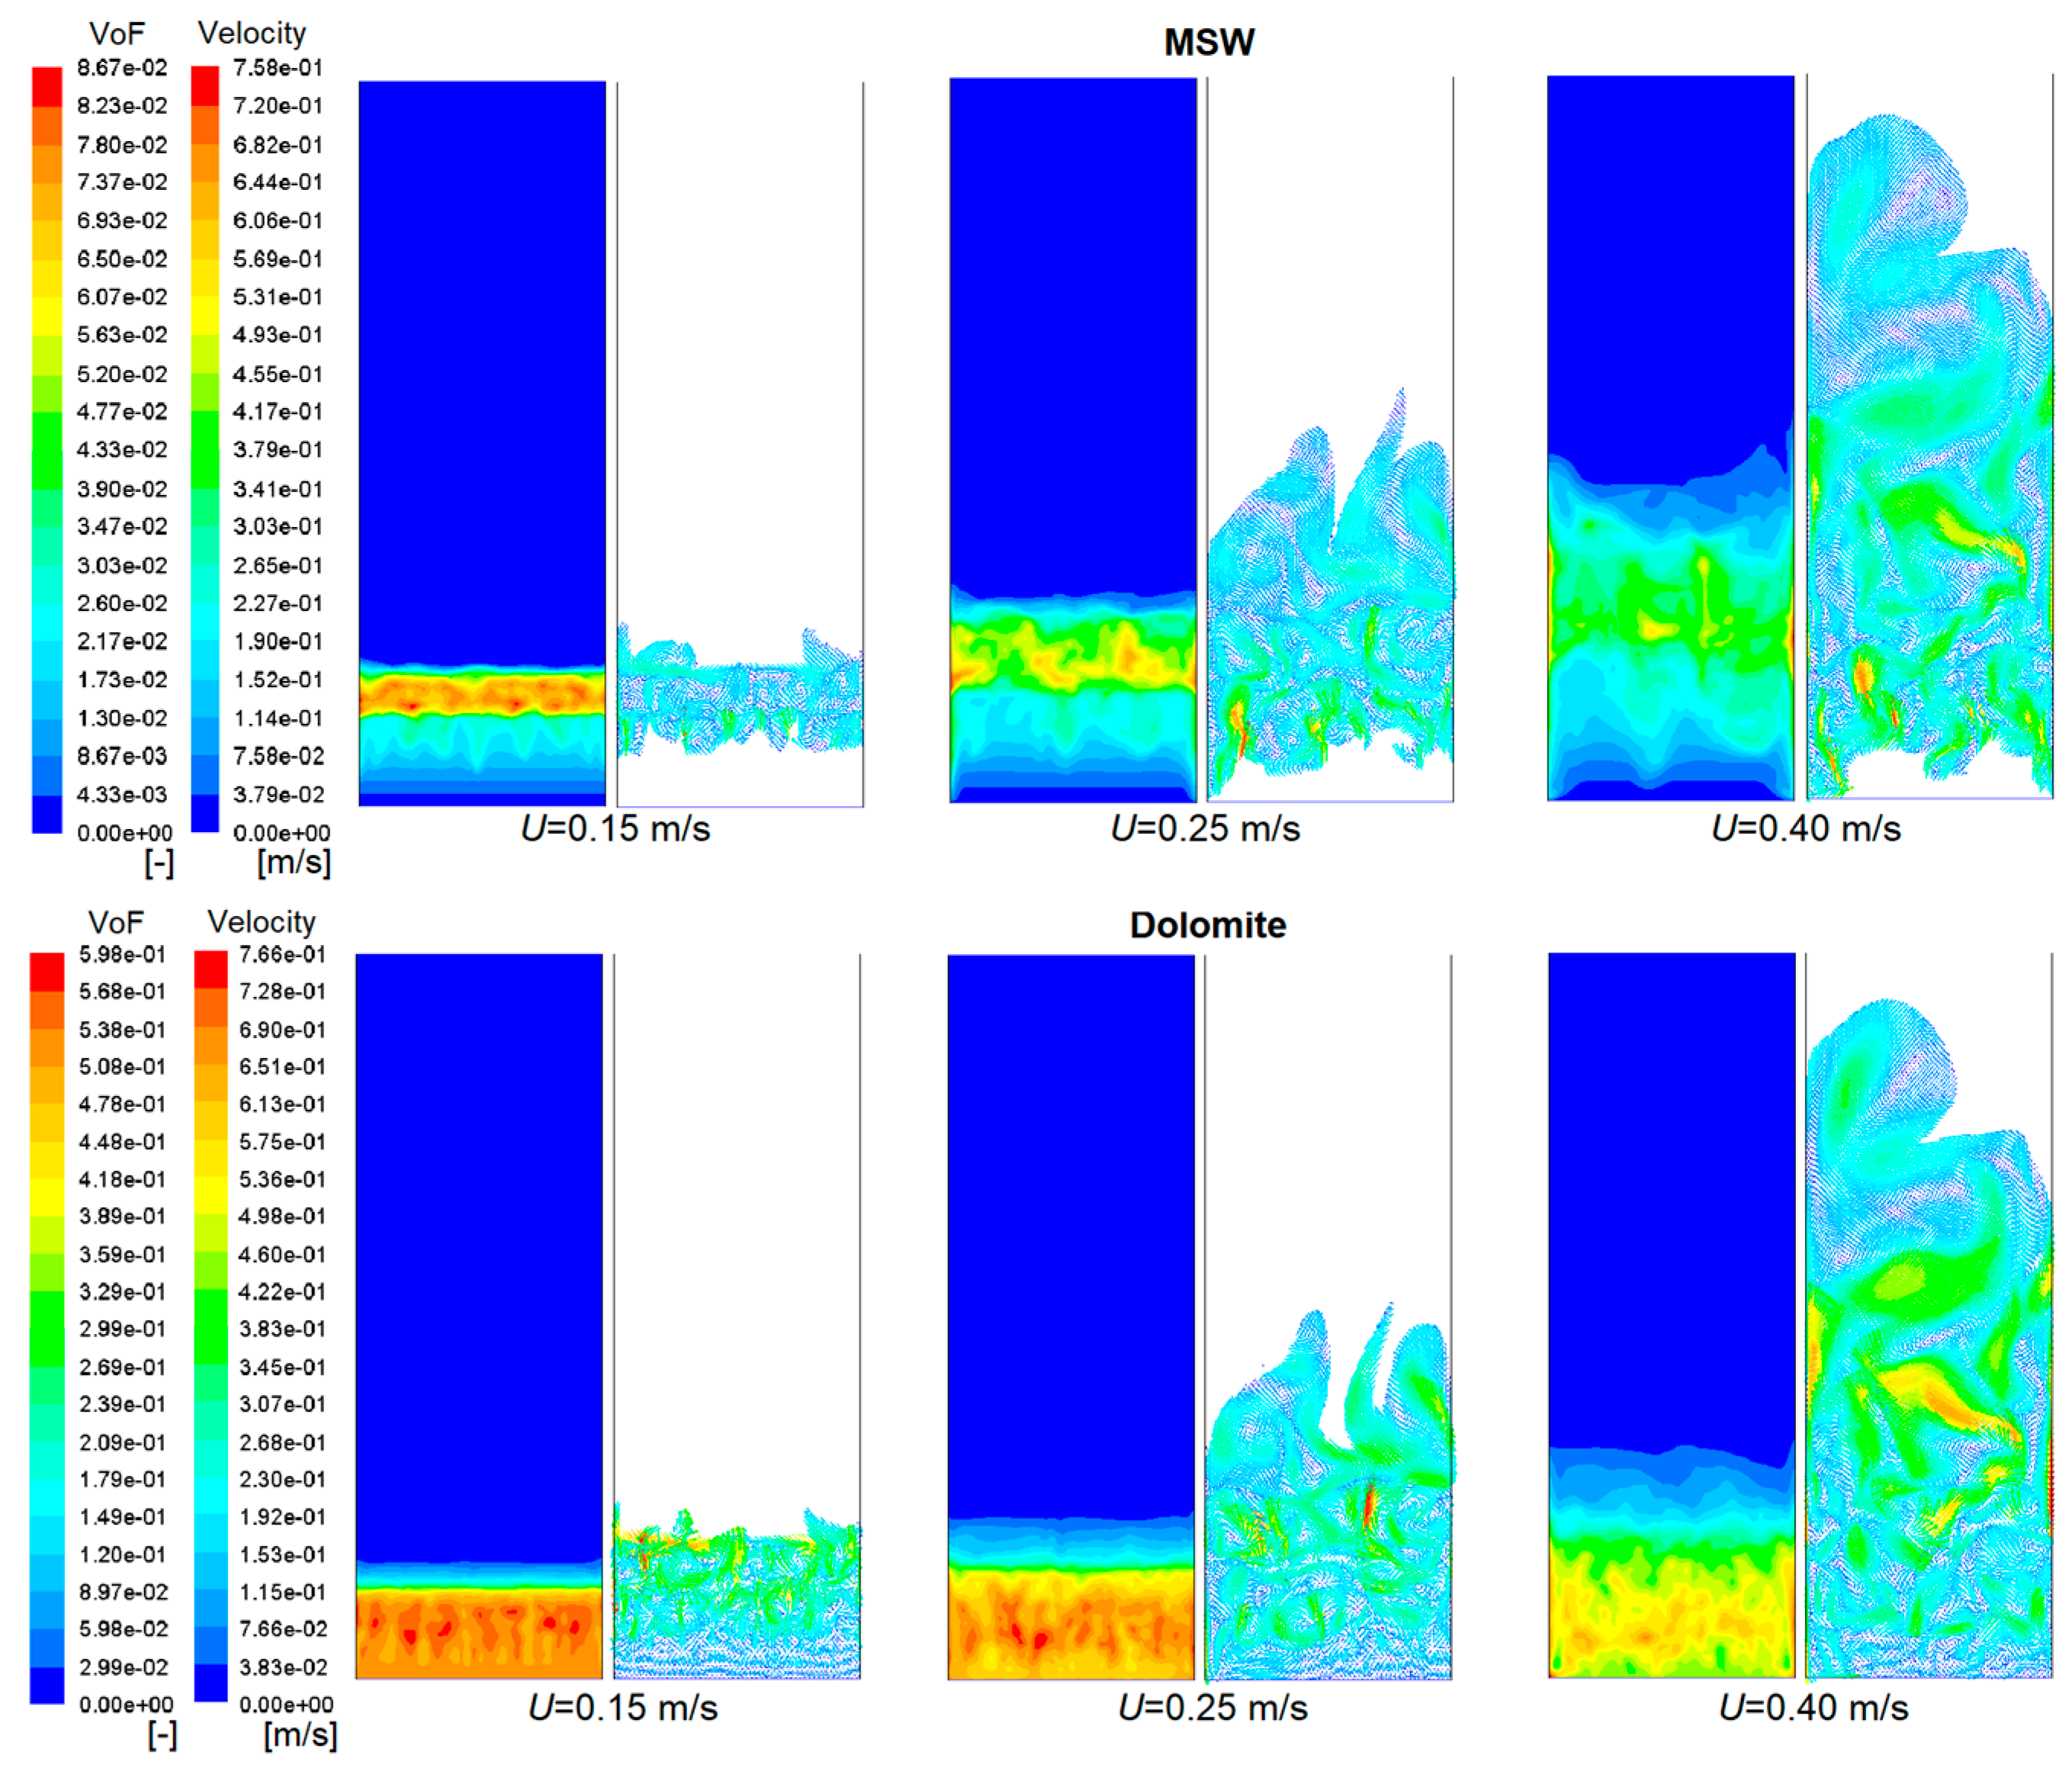
Figure 7 presents the pair comparison between MSW and dolomite mean volume fraction contours and the velocity vector profiles at three different superficial gas velocities 0.15, 0.25 and 0.40 m/s, at the simulation time of 3 s. Dolomite, as the inert bed material, is present in a considerably larger amount, while MSW in present in smaller quantities, like in a real gasification process where only a small amount of MSW is continuously fed into the reactor. Solids occupy distinct regions within the bed, dolomite gathers at the bottom of the reactor (the heaviest), and MSW migrates to the bed top due to the up-flow gas (the lightest). Solid particles motion within the fluidized bed is induced by the gas bubbles flow, as the superficial gas velocity increases, bubbles size enlarges, carrying more solid particles within, causing the bed height to increase [
38]. Additionally, the inlet gas velocity increase will promote the mixing between the solids species involved [
31]. The gas velocity effect over mixing is considered in the next sub section. This bed expansion and particles velocity increase is rather pronounced from 0.15 to 0.40 m/s. MSW and dolomite vector velocity profiles depict a clear particles velocity and turbulence increase, showing vigorous solids movements. Yellow and red colored vectors become more intense and cover larger bed regions as the inlet velocity comes increased. MSW shows no velocity vectors presence near the bed bottom, emphasizing the MSW tendentious presence at higher bed regions. However, higher velocities were measured at the upper and middle bed regions, as solid particles are allowed to move more freely at higher regions, than at lower regions where entrapment may occur [
38]. The velocity vectors and the solids distribution along the bed height are in good agreement to the literature [
38].
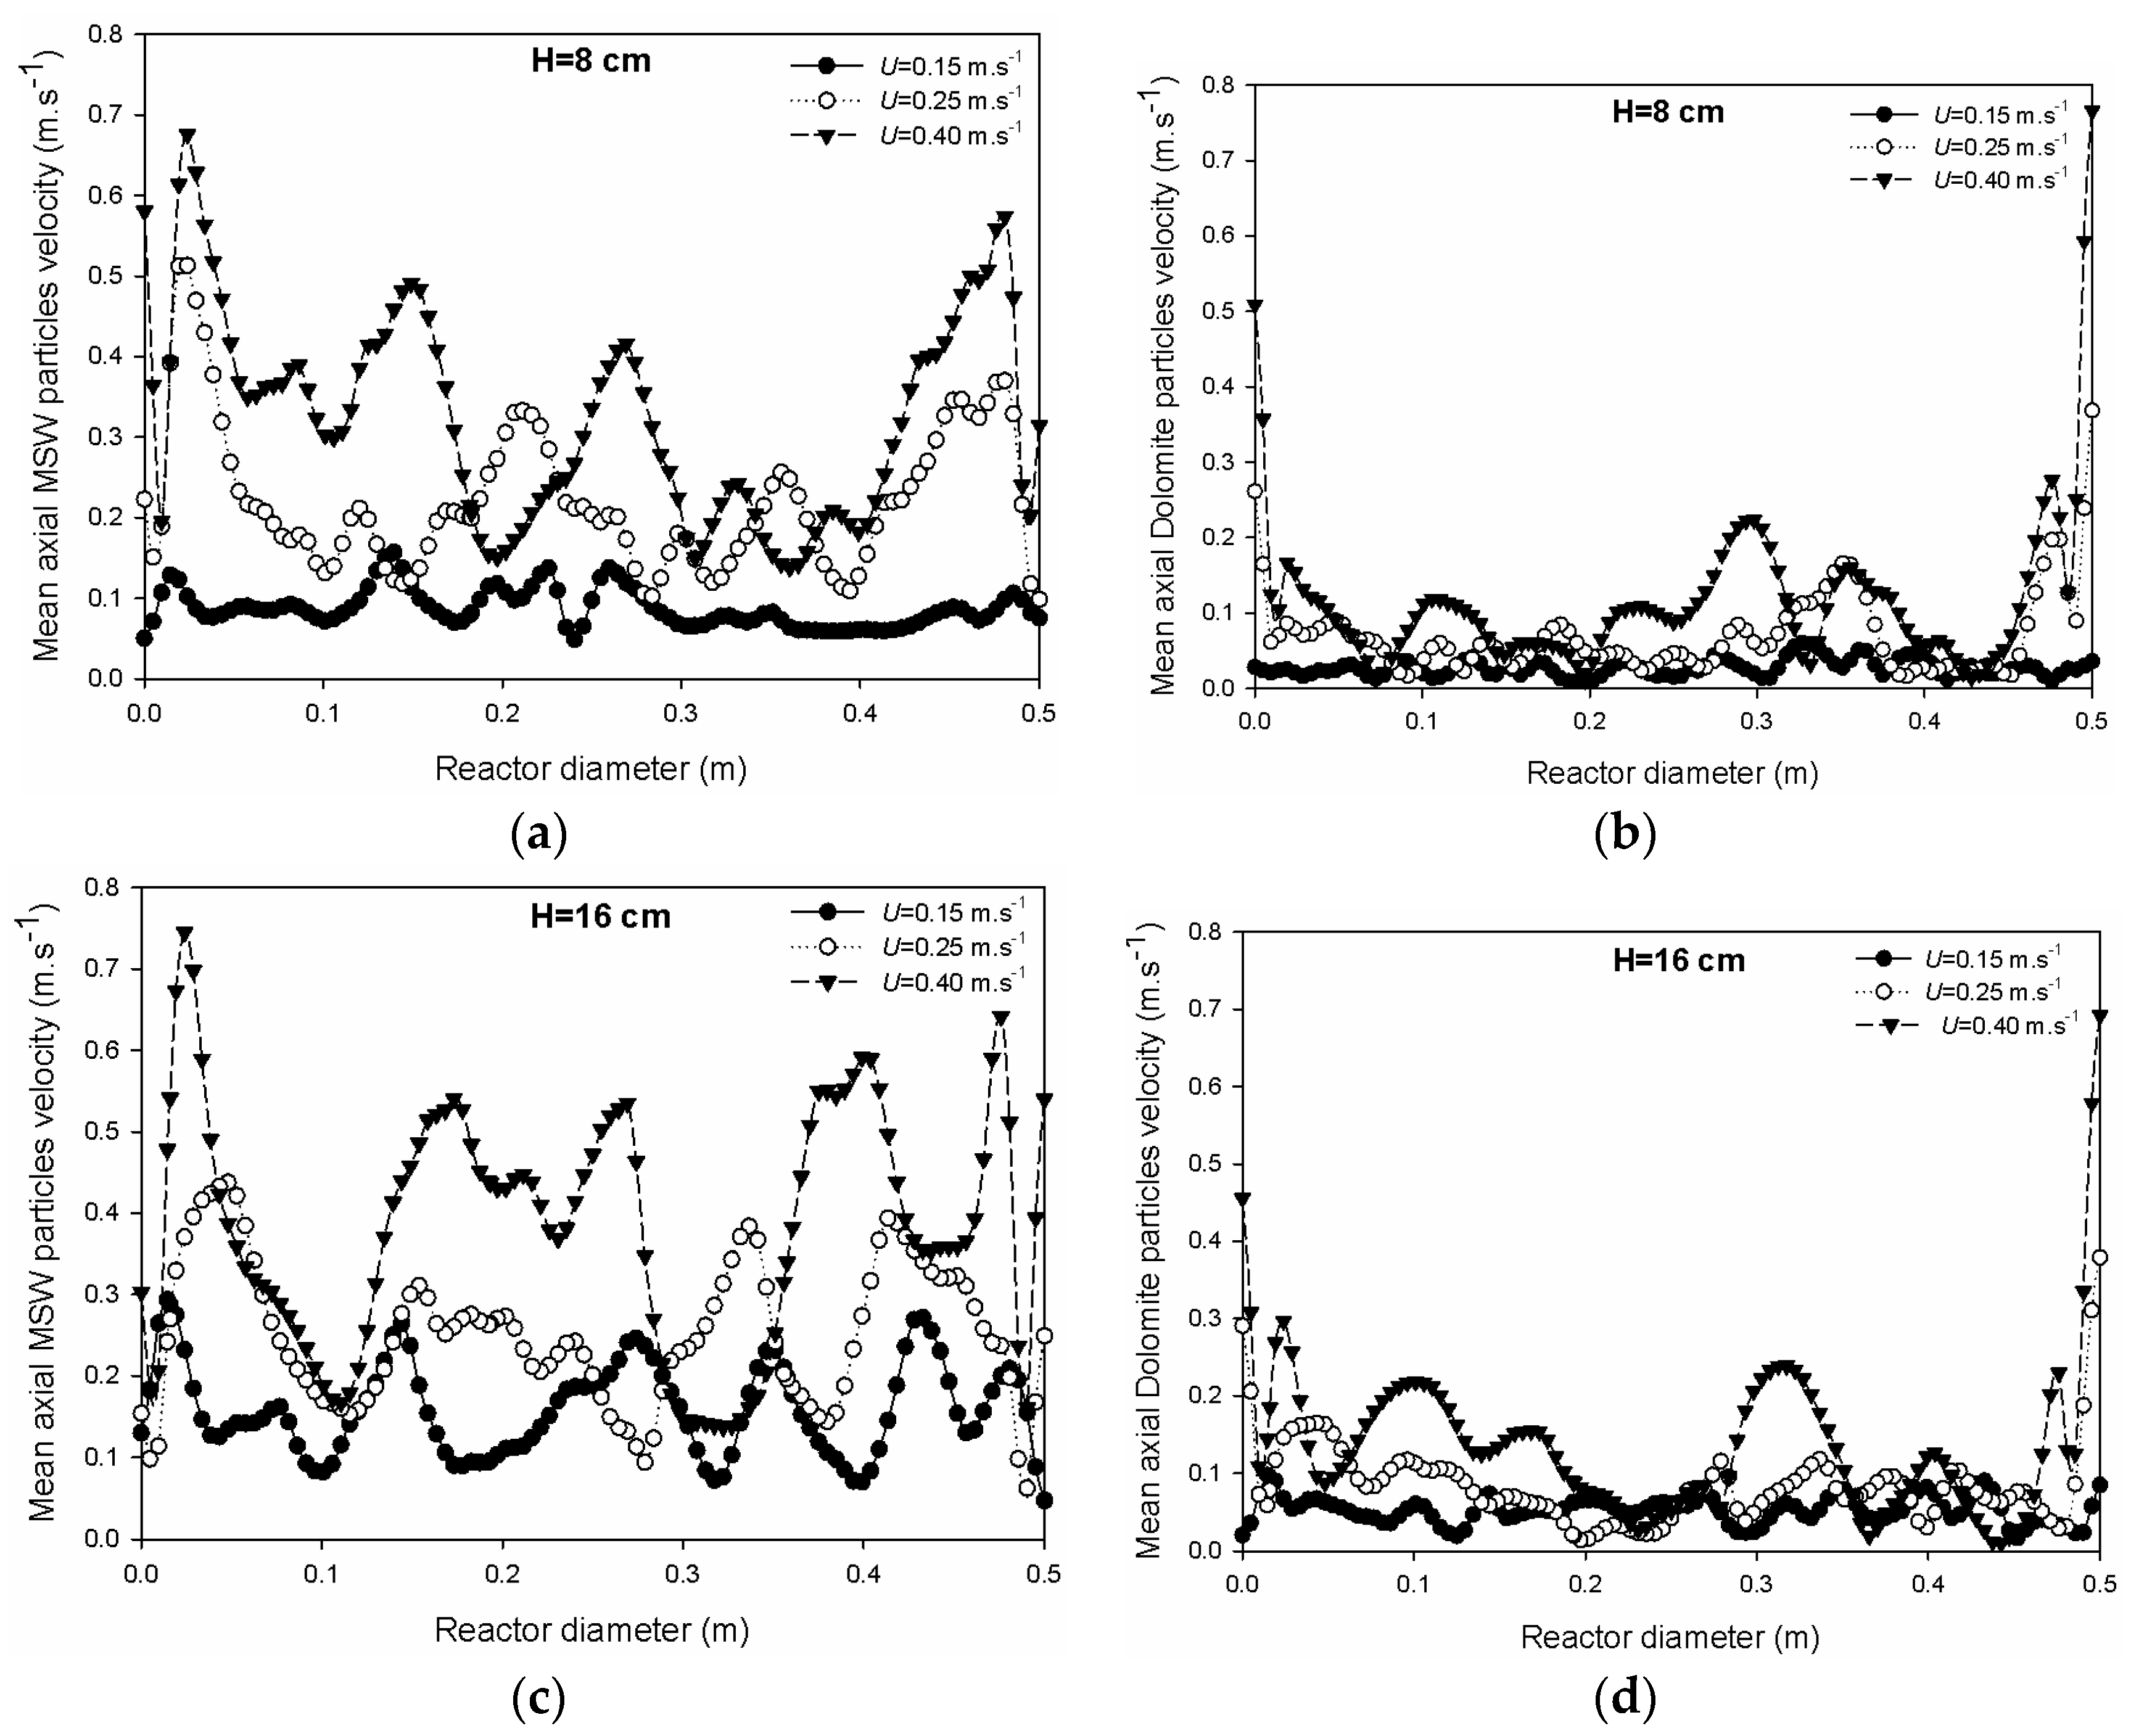
The simulated time-mean axial (or lateral) MSW and dolomite particles velocity at three different superficial gas velocities (0.15, 0.25 and 0.40 m/s), gathered at two distinct bed heights (8 and 16 cm) are shown in
Figure 8a–d. Lateral velocity results showed that MSW particles revealed a generalized increased axial velocity at both bed heights, particularly in the center bed regions, when compared to dolomite particles. MSW due to being the lighter component showed increased axial velocity, while the heavier dolomite revealed inferior axial movement [
39]. However, a high reaching peak can be seen for both dolomite profiles (8 and 16 cm) in the right near wall region about 0.50 m (
Figure 8b,d). Such an effect may be due to a lateral acceleration induced by bubbles over the dolomite particles towards the wall region [
39]. Indeed, as the inlet velocity is increased, higher axial velocity is measured in the near wall regions. The gas flow increase within the fluidized bed will confer more kinetic energy into the solid particles, increasing the turbulence effect, and in turn, the lateral solids dispersion, which may be compelling the solid particles to move towards the reactor’s walls increasing the axial near wall velocity [
39]. Concerning the bed height, the profiles showed a higher particle velocity at 16 cm height than at 8 cm height. Similar conclusions were reached from the velocity vectors regarding the solids increased velocities in higher bed regions, due to more interparticle space and freedom to move, and also higher bubble rise and collapse movements [
38]. Moreover, the axial particle velocities were found to increase with the superficial gas velocity, which is consistent with previous observations from the velocity vector profiles. The higher the superficial gas velocity is, the higher the drag force exerted upon the solid particles will be, leading to an increased particles velocity. However, some peaks from the 0.25 m/s profile are seen to surpass the 0.40 m/s profile, this may be given to the particles collisions and chaotic flow induced by greater velocities, casting solid particles into lateral opposing directions resulting in reduced axial velocity [
39].
5.3. Mixing and Segregation Phenomena
When a binary mixture is submitted to a fluidization process, the solid particles enclosed tend to separate or join accordingly to their individual physical characteristics, either being their size or density. Segregation occurs when the particles size or density ratio is larger. Mixing on the other hand, is the opposite effect of segregation, occurring when the particles size or density ratio is lower. Mixing and segregation phenomena retain crucial importance for both industrial applications and theoretical studies. Good mixing is generally required in gas-solid contact reactors, while segregation is usually desirable for applications in which solids should be separated according to their size or density. In fluidized bed studies segregation weakens the fluidization performance by creating an unbalanced solids distribution.
In this work, a binary mixture of dolomite and MSW was studied regarding the particle size ratio, in which three different MSW particles sizes (2, 5 and 8 mm) were applied. The effects of superficial gas velocity on mixing were also investigated, whereupon three different inlet velocities were carried (0.15, 0.25 and 0.4 m/s). Lastly, the binary mixture segregation profile was evaluated along the bed height and diameter so to determine the axial and longitudinal solids distribution. Mixing and segregation index values were retrieved to evaluate the quality of the mixture for each case. Indexes were gathered accordingly to the standard deviation approach described in
Section 4.7.
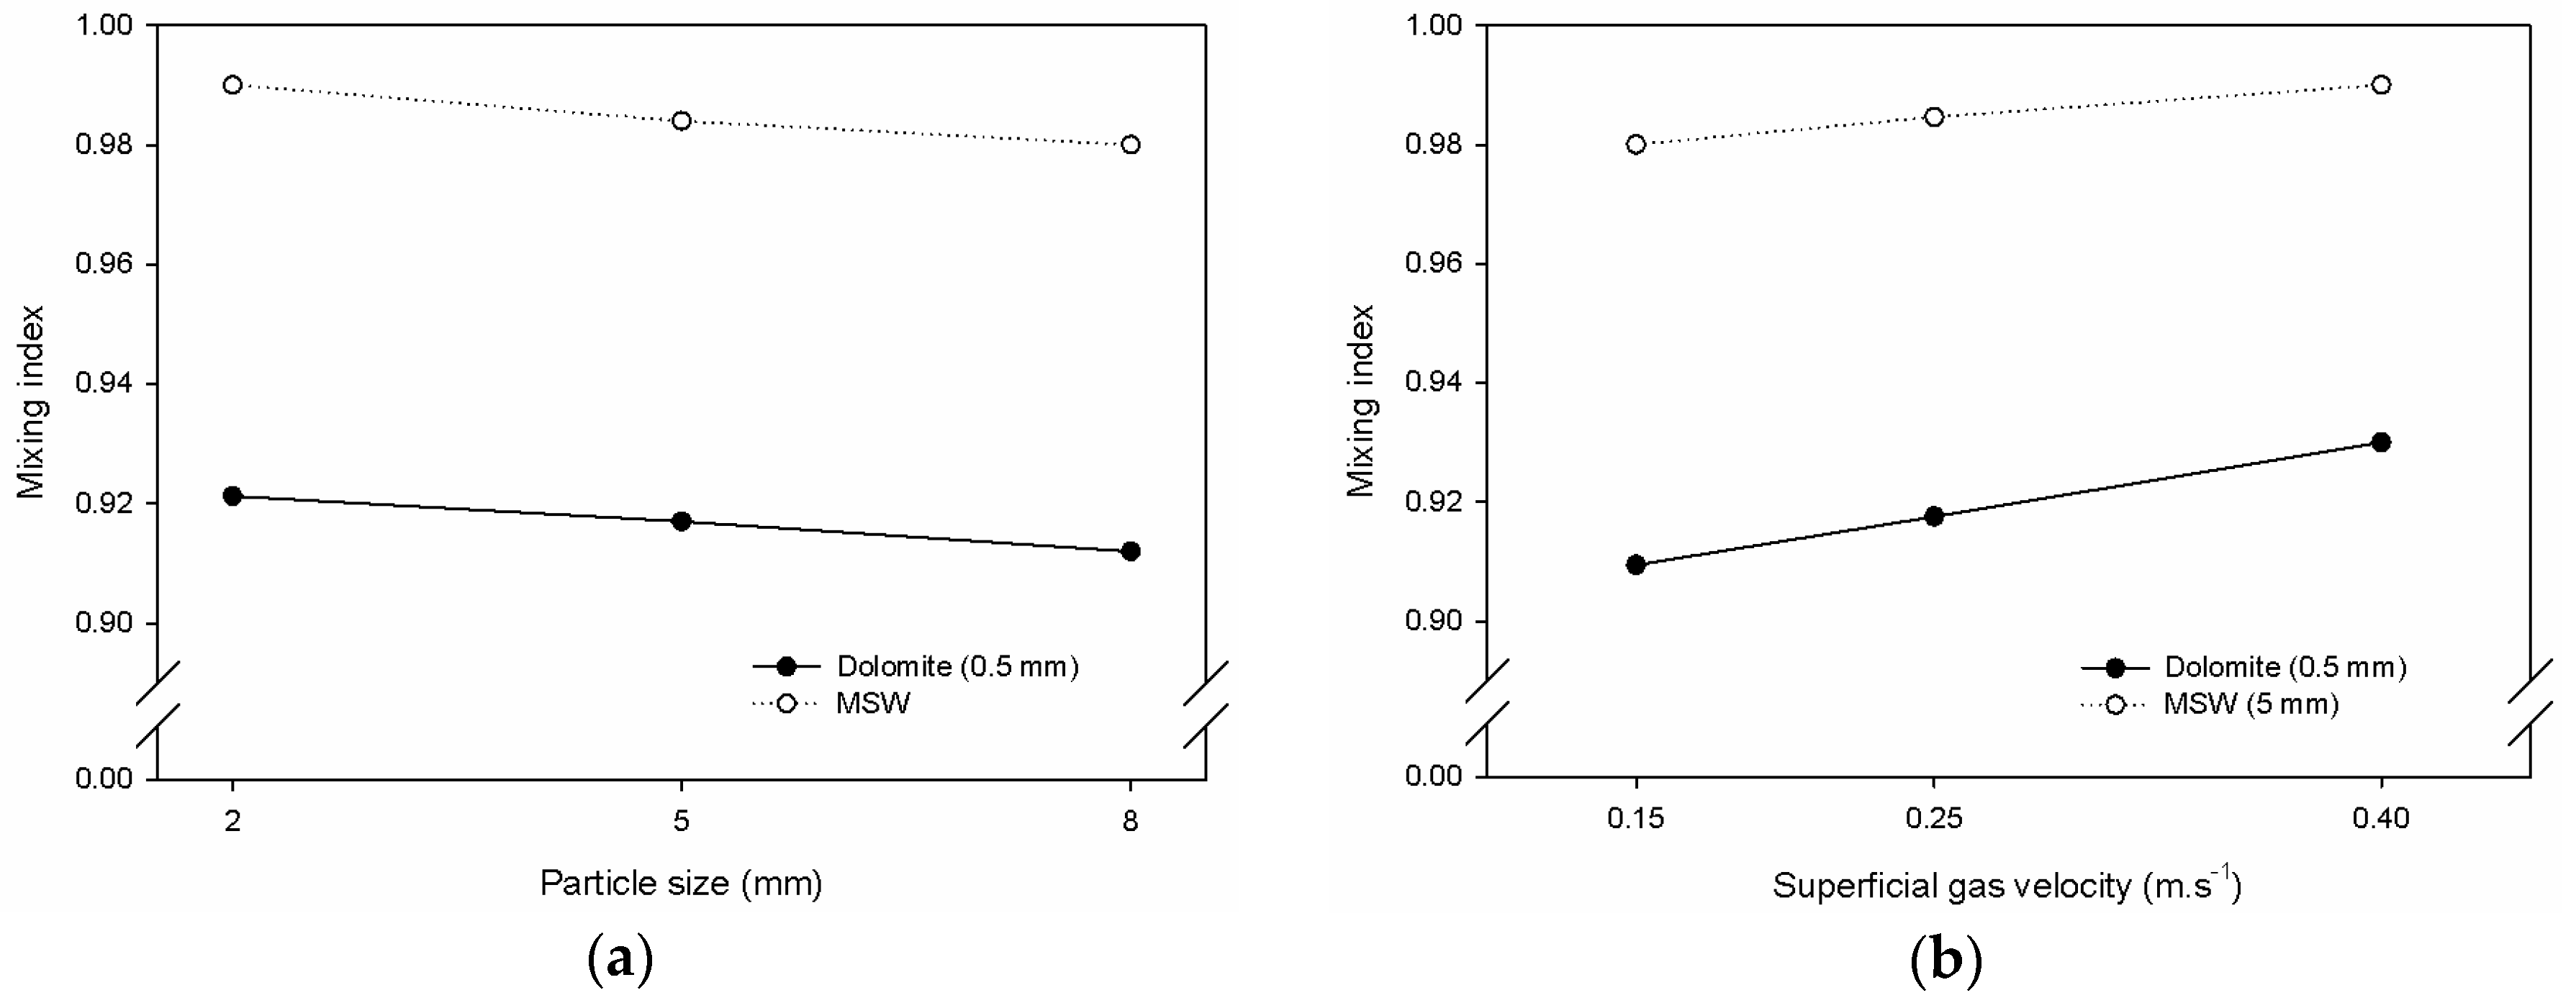
The MSW particle size effect on the mixture is shown in
Figure 9a. For this analysis, the operating conditions were settled for a superficial gas velocity of 0.25 m/s, simulation time 3 s, and temperature 873 K. Results present two distribution lines for each solid specie (dolomite and MSW) with both pointing out a clear particle size effect on the fluidization. Besides the size, the particles density also has effect on the mixture, once the dolomite density is placed at 2870 kg/m
3, and MSW at 247 kg/m
3 (
Table 2). The quality of the mixture estimated by the indexes will therefore also comprise the density effect, however, as we merely have two solid species to consider, only the MSW particles sizes were varied in this study. The mixture composed of smaller MSW particles (2 mm) shows a mixing index closer to one (M = 1, fully mixed), while the mixture composed of the larger particle presents the lowest mixing index measured. As the smaller MSW particles (2 mm), are the closest in size to the dolomite particles (0.5 mm), the mixing quality is the nearest to achieve a fully mixed state. Opposing, the larger particles (5 and 8 mm), show a gradual mixing index decrease, given to the larger dolomite-MSW particle size ratio, in which the 8 mm case shows the lowest mixing quality by being the most distant from one. Despite following the same trends, the two distribution lines present slightly different mixing indexes for each solid specie in the same mixture, with MSW showing superior mixing in all situations (
Figure 9a,b).
Previous studies found in the literature consider that superficial gas velocity has direct effect over the solids distribution along the bed, mentioning that, the greater the fluidization velocity is, the better the particle mixing will be [
38]. The superficial gas velocity effect on the mixing is presented in
Figure 9b. Three different superficial velocities were set for this study (0.15, 0.25 and 0.4 m/s), MSW particle size was kept at 5 mm, and operating temperature at 873 K. Results confirm the assumptions found in the literature, higher superficial gas velocity (0.4 m/s) showed better mixing index, while for lower superficial gas velocities (0.15 and 0.25 m/s), mixing index weakens. The operating temperature was also assessed regarding its effect over the mixing and segregation phenomena. For these simulation runs the operating temperature was varied (873, 973 and 1073 K), however, it was found to have very little effect on the gas and solids mixing. Same considerations were drawn by studies reported in the literature [
40].
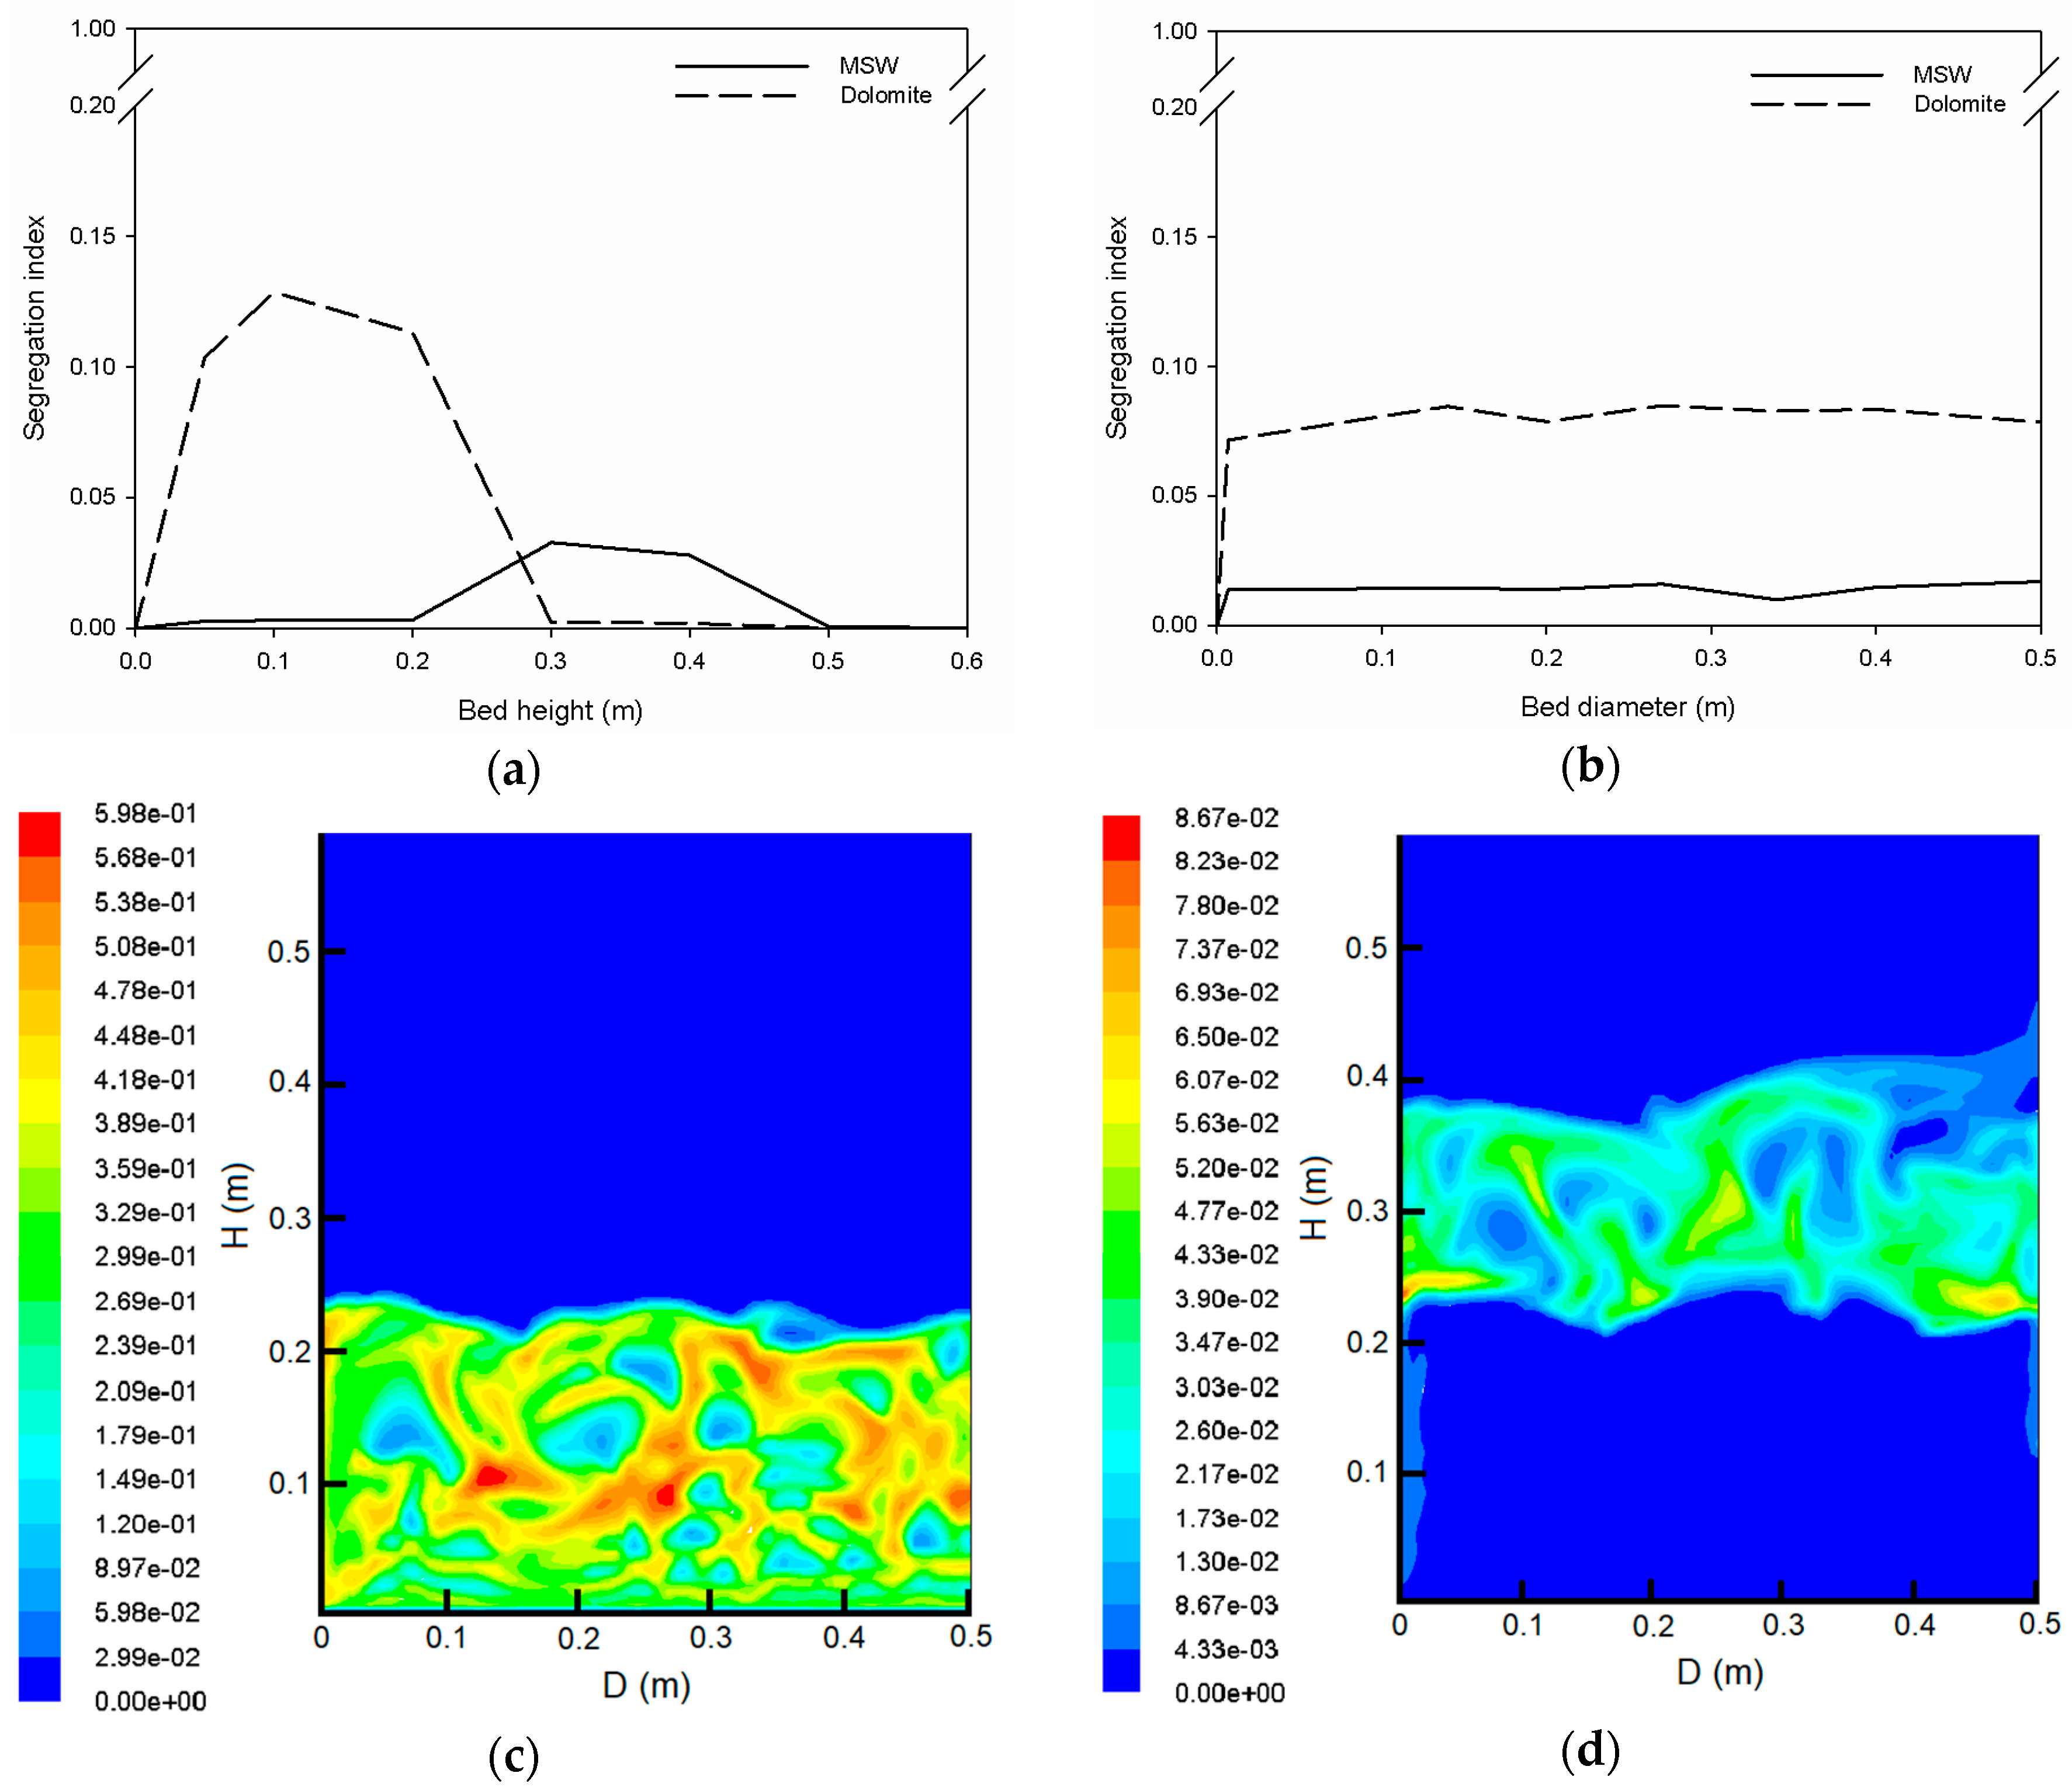
Figure 10a,b shows the solids segregation along the bed height and bed diameter, respectively. Alongside, scaled instantaneous dolomite and MSW volume fraction contours give a perspective of the solids distribution (
Figure 10c,d). Instantaneous solids volume fractions meet the same assumptions drawn from the mean volume fraction contours in
Section 5.2, with dolomite migrating at the bottom (heavier), and MSW congregating in the top of the bed (lighter). Simulations were conducted at a superficial gas velocity of 0.25 m/s, MSW particle size of 5 mm, and operating temperature 873 K. From a general view at the segregation indexes, one can see that dolomite shows increased segregation compared to MSW. Regarding the segregation effect along the bed height, dolomite shows a progressive segregation rise from bottom to top, meeting its maximum around 0.1 m height. This same maximum coincides with the highest solid concentration (red colored) given by the dolomite volume fraction contour at 0.1 m height (
Figure 10c). As for MSW, segregation is only noticeable at 0.2 m height onwards.
Once more, the 0.3 m height segregation maximum detected for the MSW is consistent with the yellow stains seen in the volume fraction contour (
Figure 10d). The spatial arrangement of the segregation indexes along the bed height concur with the solids distribution along the bed, with dolomite presenting segregation merely at the bottom, and MSW at the high near surface region. Regarding the bed diameter direction (
Figure 10b), both dolomite and MSW show a more constant profile without noticeable changes. Notwithstanding, on the dolomite profile two small peaks can be distinguished and directly associated with the increased dolomite concentration shown by the volume fraction contour at about 0.15 and 0.25 m width (
Figure 10c). Concerning the MSW profile, a subtle segregation decrease between 0.3 and 0.4 m width is consistent with the gas bubble depicted in the volume fraction contour, measuring little solid presence.
As dolomite and MSW have different sizes and densities, the drag force acting on the particles is different, leading particles to gain different velocities within the bed, and so, particle segregation progresses. Overall, the bed showed a naturally good mixing behavior, once the mixing indexes were always very close to one, even for higher particle size ratio mixtures, and the segregation indexes always very close to zero.
5.4. Solid Phases Static Temperature Distribution
As the simulation time progresses the temperature distribution within the fluidized bed constantly develops until a thermal equilibrium is achieved, fluctuating around a constant value. The static temperature contours distribution is presented in
Figure 11a for the three-size MSW particles ratio (2, 5 and 8 mm).
The MSW-dolomite heat transfer performance study was established by setting the following initial temperatures: 373 K for MSW, 823 K for dolomite, 773 K for the air flux, and 873 K for the heated reactor walls. Remaining operating conditions, superficial gas velocity and simulation time were set to 0.25 m/s and 50 s, respectively. The static temperature contours depict the heat transfer dependency on the MSW particles size in the binary mixture. Smaller MSW particles (2 mm) show increased heat transfer when compared with larger MSW particles (5 and 8 mm). This heat transfer inequality is especially prominent at 0.4 s, here the bed region still shows a light green color for 5 and 8 mm MSW particles, while a bright yellow color is seen for 2 mm MSW. Such behavior confirms that, higher the MSW-dolomite mixture size ratio, slower is the temperature increase. The two solids start to reach the thermal equilibrium around the 3 s of simulation time, at this period, identical temperature distribution is found for the three MSW size ratios contours. In the first stages of the fluidization process, the MSW temperature promptly increases as the heat is transferred from the hot dolomite (firstly at 823 K) to MSW particles (firstly at 373 K). In opposition to the MSW particles temperature increase, the dolomite temperature will gradually decrease until the heat transfer between the two species reaches the thermal equilibrium. Yet, the dolomite temperature does not lower significantly from the dolomite-to-MSW heat transference, which is justifiable by the low amount of MSW present in the binary mixture. The temperature increase within the fluidized bed will also be favored throughout the fluidization process by the heated air inflow and the heated reactor walls, shown by the orange red color in the near wall regions. The static temperature contours presented at 2 and 3 s of simulation time show some small low temperature smudges, which may result from conduction and convection effects from the solid-gas interphase, with the air temperature decreasing due to the solids temperature rise at the bed. In addition, this unevenly distributed heat was found to be due to poor convective heat transfer at the solids-gas interphase [
41].
The static temperature variation for the three MSW sizes (2, 5 and 8 mm) at the three operating temperatures tested (873, 973 and 1073 K) is shown along the 50 s simulation time in
Figure 11b. Results show that larger MSW particles take more time to increase their temperature within the fluidized bed throughout the fluidization process, as previously seen in the static temperature contours. The zoom in into the first 4 s of simulation time confirms the faster temperature increase for the 2 mm MSW particles, while 8 mm particle shows the slowest increase of the three particles set. This close heat transfer variation is shown for the 873 K alone, once the 973 and 1073 K showed identical distribution rates, but at higher temperatures. Most of the heat transference within the fluidized bed occurs in the first stages of the simulation time, with the MSW requiring around 2 to 3 s to obtain 90% of the final temperature. Such is given to the good mixing behavior and the high heat transference rates attributed to the fluidized beds, allowing the solids to achieve high temperatures very quickly. In this system, it was seen that MSW has about 3 s of residence time, when operated at a superficial gas velocity of 0.25 m/s. Temperature variations between the three MSW size ratios cease after 4 s of simulation time, once the thermal equilibrium is established. The static temperature contours, and the particles heat transfer performance along simulation time go accordingly with previous results found in the literature [
38].


