Article

Probabilistic Optimal Power Dispatch in Multi-Carrier Networked Microgrids under Uncertainties

1
Department of Electrical Engineering, Faculty of Electrical Engineering, Science and Research Branch, Islamic Azad University, Tehran 1477893855, Iran
2
Department of Electrical Engineering, Faculty of Electrical Engineering, Iran University of Science and Technology, Tehran 1684613114, Iran
3
Department of Electrical Engineering, Faculty of Electrical Engineering, Sharif University of Technology, Tehran PO Box 1136511155, Iran
*
Author to whom correspondence should be addressed.
Energies 2017, 10(11), 1770; https://doi.org/10.3390/en10111770
Submission received: 6 September 2017 / Revised: 2 October 2017 / Accepted: 3 October 2017 / Published: 3 November 2017
(This article belongs to the Section F: Electrical Engineering)

Abstract

:
A microgrid (MG) is a small-scale version of the power system which makes possible the integration of renewable resources as well as achieving maximum demand side management (DSM) utilization. The future power system will be faced with severe uncertainties owing to penetration of renewable resources. Consequently, the uncertainty assessment of system performance is essential. The conventional energy scheduling in an MG may not be suitable for active distribution networks. Hence, this study focuses on the probabilistic analysis of optimal power dispatch considering economic aspects in a multi-carrier networked microgrid. The aim is to study the impact of uncertain behavior of loads, renewable resources, and electricity market on the optimal management of a multi-carrier networked microgrid. Furthermore, a novel time-based demand side management is proposed in order to reshape the load curve, as well as preventing the excessive use of energy in peak hours. The optimization model is formulated as a mixed integer nonlinear program (MINLP) and is solved using MATLAB and GAMS software. Results show that the energy sharing capability between MCMGs and MCMGs and the main grids as well as utilization of demand side management can decrease operating costs for smart distribution grids.

1. Introduction

The global demand for energy has been increasing in recent years, and a rapid escalation in fossil fuel prices has also been seen. An old-fashioned way of fulfilling multiple demands was to establish a new central generating plant, but that results in high capital costs and pollution. Today, microgrid (MG) as a savior solution which not only solves the old distribution network problems, but also deals with technical and nontechnical problems such as power quality, local reliability, power management, total network efficiency, and interconnections between networks [1].
In fact, MG as a small part of a power system, is a low voltage distribution network comprised of controllable/non-controllable loads and distributed energy resources (DERs) with clearly defined electrical and thermal boundaries; it acts as a single controllable entity with respect to the main grid [2]. MG can be in either grid-connected modes to operate cooperatively or in islanded modes. A key characteristic of an MG is its ability to disconnect and isolate itself from the utility with little or no outage to loads within the MG during a utility grid disturbance [3].
Studies have shown that connecting multiple MGs can improve the operation and reliability of the system [4,5]. The economic scheduling of generating units and storage elements to fulfill multi-carrier demands in each MG is a crucial task which can be handled by the distribution management system (DMS). This management is carried out using the microgrid central controller (MGCC) by receiving or sending signals to local controllers [6]. In multi-microgrids (MMGs), each MG is managed by its own MGCC, while these controllers are controlled by one main called the multi-microgrid central controller (MMGCC). This procedure simplifies energy management and manages the overall stability of MMGs by monitoring and analyzing the power quality of each MG to decide which one operates autonomously in island mode or interconnected to a distribution grid [7]. Moreover, MGs can operate as a backup system [8].
Today, optimal operation and planning problems are the main topics of research in MGs and, albeit rarely, MMGs [5,9,10]. Arefifar et al. have discussed the large-scale power distribution system as a number of MGs in order to facilitate the control strategy and operation infrastructure in future distribution systems based on IEEE Std 1547.4. [11]. Furthermore, the economic advantages of MMGs and its energy scheduling considering the uncertainty of electrical load has been studied [12]. The work in [13] studied optimal types, sizes, and locations of distributed generations (DGs) in an MG using the genetic algorithm method. One of the most important problems in MG is the management of available sources to satisfy demands [14]. Moreover, the capability to energy share between MGs, exclusively thermally demand sharing, is an important issue that has rarely been discussed in previous studies [15,16].
In the literature, different methods were used to solve the power dispatch problem [15,17]. For instance, [15] used an optimization model based on the mixed integer linear programming (MILP) in grid-connected mode of a thermally-networked microgrid (TNMG) whereas multi-objective optimization problem without taking into account sold and purchased energy has been considered for an economic dispatch (ED) problem [17]. The particle swarm optimization (PSO) method [18], Tabu search (TS), genetic algorithm (GA) [19], ant colony [20], game theory, new recurrent neural network [21], mesh adaptive direct search algorithm [22], and optimally-condition-decomposition (OCD) technique are commonly used methods in solving optimal dispatching problems. The optimal economic short-term management problem along with elastic and inelastic loads is studied in an MG [23]. The objective function is the minimization of the operation energy costs (include energy purchase costs and energy sales revenues) and sensitivity analysis is carried out by varying the maximum amount of power exchanged with the main grid.
However, some DERs have intermittent behavior due to their nature, and under this assumption, deterministic energy scheduling may be unrealistic and not useful [24,25]. Moreover, higher penetration of small scale energy resources (SSERs) such as wind and photovoltaic (PV) sources may fulfill demands, but it causes intermittencies in the grid. These uncertainties can cause challenges in operational and long- and medium-term system planning [12]. Hence, the probabilistic analysis is impossible to ignore due to the uncertain behavior of some SSERs and the energy consumers. The probabilistic tools for power system analysis have been studied and used in the literature [26,27,28].
Energy scheduling under the intermittent behaviors of renewable energy resources is studied in [28]. The uncertainty of renewable sources, e.g., wind speed and solar irradiance, was investigated in [29]. Furthermore, in [12], load uncertainty was modeled and studied. A new technique, based on the Beta probability distribution, for the generation of the aggregate demand patterns through the modelling of the energy consumption behavior of a group of residential consumers is presented [30]. Goodness of fit tests such as the Kolmogorov–Smirnov test and the average mean absolute percentage error are used for the evaluation of the proposed scenario generation. A simplified optimization problem formulated as a mixed integer linear programming (MILP) is modeled to enhance the management of the distributed energy sources in a real site islanded microgrid [31]. The results reveals that the optimization is robust enough against variations in the time step interval, timeframes and changes in system parameters. The assessment of power system uncertainties can be represented either probabilistically or possibilistically. Probabilistic methods are applicable when sufficient historical data about uncertain variables or their probability distribution function (PDF) is available. In [32], an analytical probabilistic-possibilistic tool for power flow uncertainty assessment was proposed to solve the system modeling problem with different variables (mixed of probabilistic and possibilistic). The probabilistic techniques have been used to assess the impact of a power system since the early seventies [33].
The probabilistic methods are divided into three categories: numerical, approximate, and analytical. Mount Carlo simulation (MCS), Latin hypercube sampling (LHS), PSO, and the imperialist competitive algorithm (ICA) are widely used as numerical methods to model uncertainties [34,35]. Approximate methods such as the point estimate method (PEM) and two-point estimate method (2PEM) were used in [36,37]. To burden the computational effort, analytical methods such as the combined Cumulants and Gram-Charlier expansion theory and the Cumulant-based method are widely used [38,39]. Mathematical models for the statistical behavior of load and renewable sources have been used in many studies. The Normal, Weibull, and Beta distribution functions have been used to model load, wind speed, and solar radiation behavior, respectively [6,12].
A novel standard classification of uncertainty handling methods along with the promising lines of future researches for decision making process is proposed [40]. According to the paper clarification, the uncertain parameters in power system studies are generally classified as technical and economical. In addition, the uncertainty modeling methods comprise probabilistic, possibilistic and hybrid possibilistic-probabilistic approaches, information gap decision theory, robust optimization (RO), and interval analysis. Based on the comprehensive classification, each method is suitable for a specific type of uncertainty and the possibility of using a new class of uncertain numbers called “Z-numbers” is investigated for the first time. An RO-based algorithm is proposed for day-ahead scheduling of multi-microgrids in grid-connected mode [41]. A deterministic uncertainty set (upper and lower bounds) is used in this formulation instead of using probability distribution of the uncertain data. The result reveals that the model is capable of providing guaranteed immunity against the worst-case scenario and remains tractable even for large systems.
Considering the aforementioned researches, the probabilistic energy scheduling of multiple energies within multi-microgrids has not been studied extensively in previous studies. As a consequence, this paper solves the optimal power dispatch problem considering uncertainties in loads for electrical and thermal types, electricity price, and the probabilistic modeling of generated power by renewable sources. One prominent solution to tackle the oscillations of renewable sources is utilization of energy storage elements and demand side management as the renewable sources complements. Hence, responsive and non-responsive loads are covered and a novel time-based demand side management model based on the final energy price (FEP) is proposed. The proposed model correlates the final energy price of responsive loads for multiple carriers with energy market price, energy purchase, and on-site generations. For each of the input variables, a specific PDF is considered and different scenarios are generated in MATLAB (R2011b, 7.13.0.0561) environment. Then, probabilistic energy scheduling problem as an MINLP model is solved for each of the generated scenarios in a 24-h interval, using GAMS (24.1.2) software. Input data such as load and energy price of each multi-carrier microgrid (MCMG) as well as generated power by renewable units are described in the form of PDF, and the results are shown in PDF or cumulative distribution function (CDF) forms in a specific interval. In the proposed structure, the energy generation at each MCMG, the purchased and sold energies by each MCMG, and the energy transactions between MCMGs and the main grid are analyzed based on operation and maintenance costs. Moreover, the network of heat between MCMGs is considered. Briefly, the main contributions and innovations of this paper are summarized as follows:
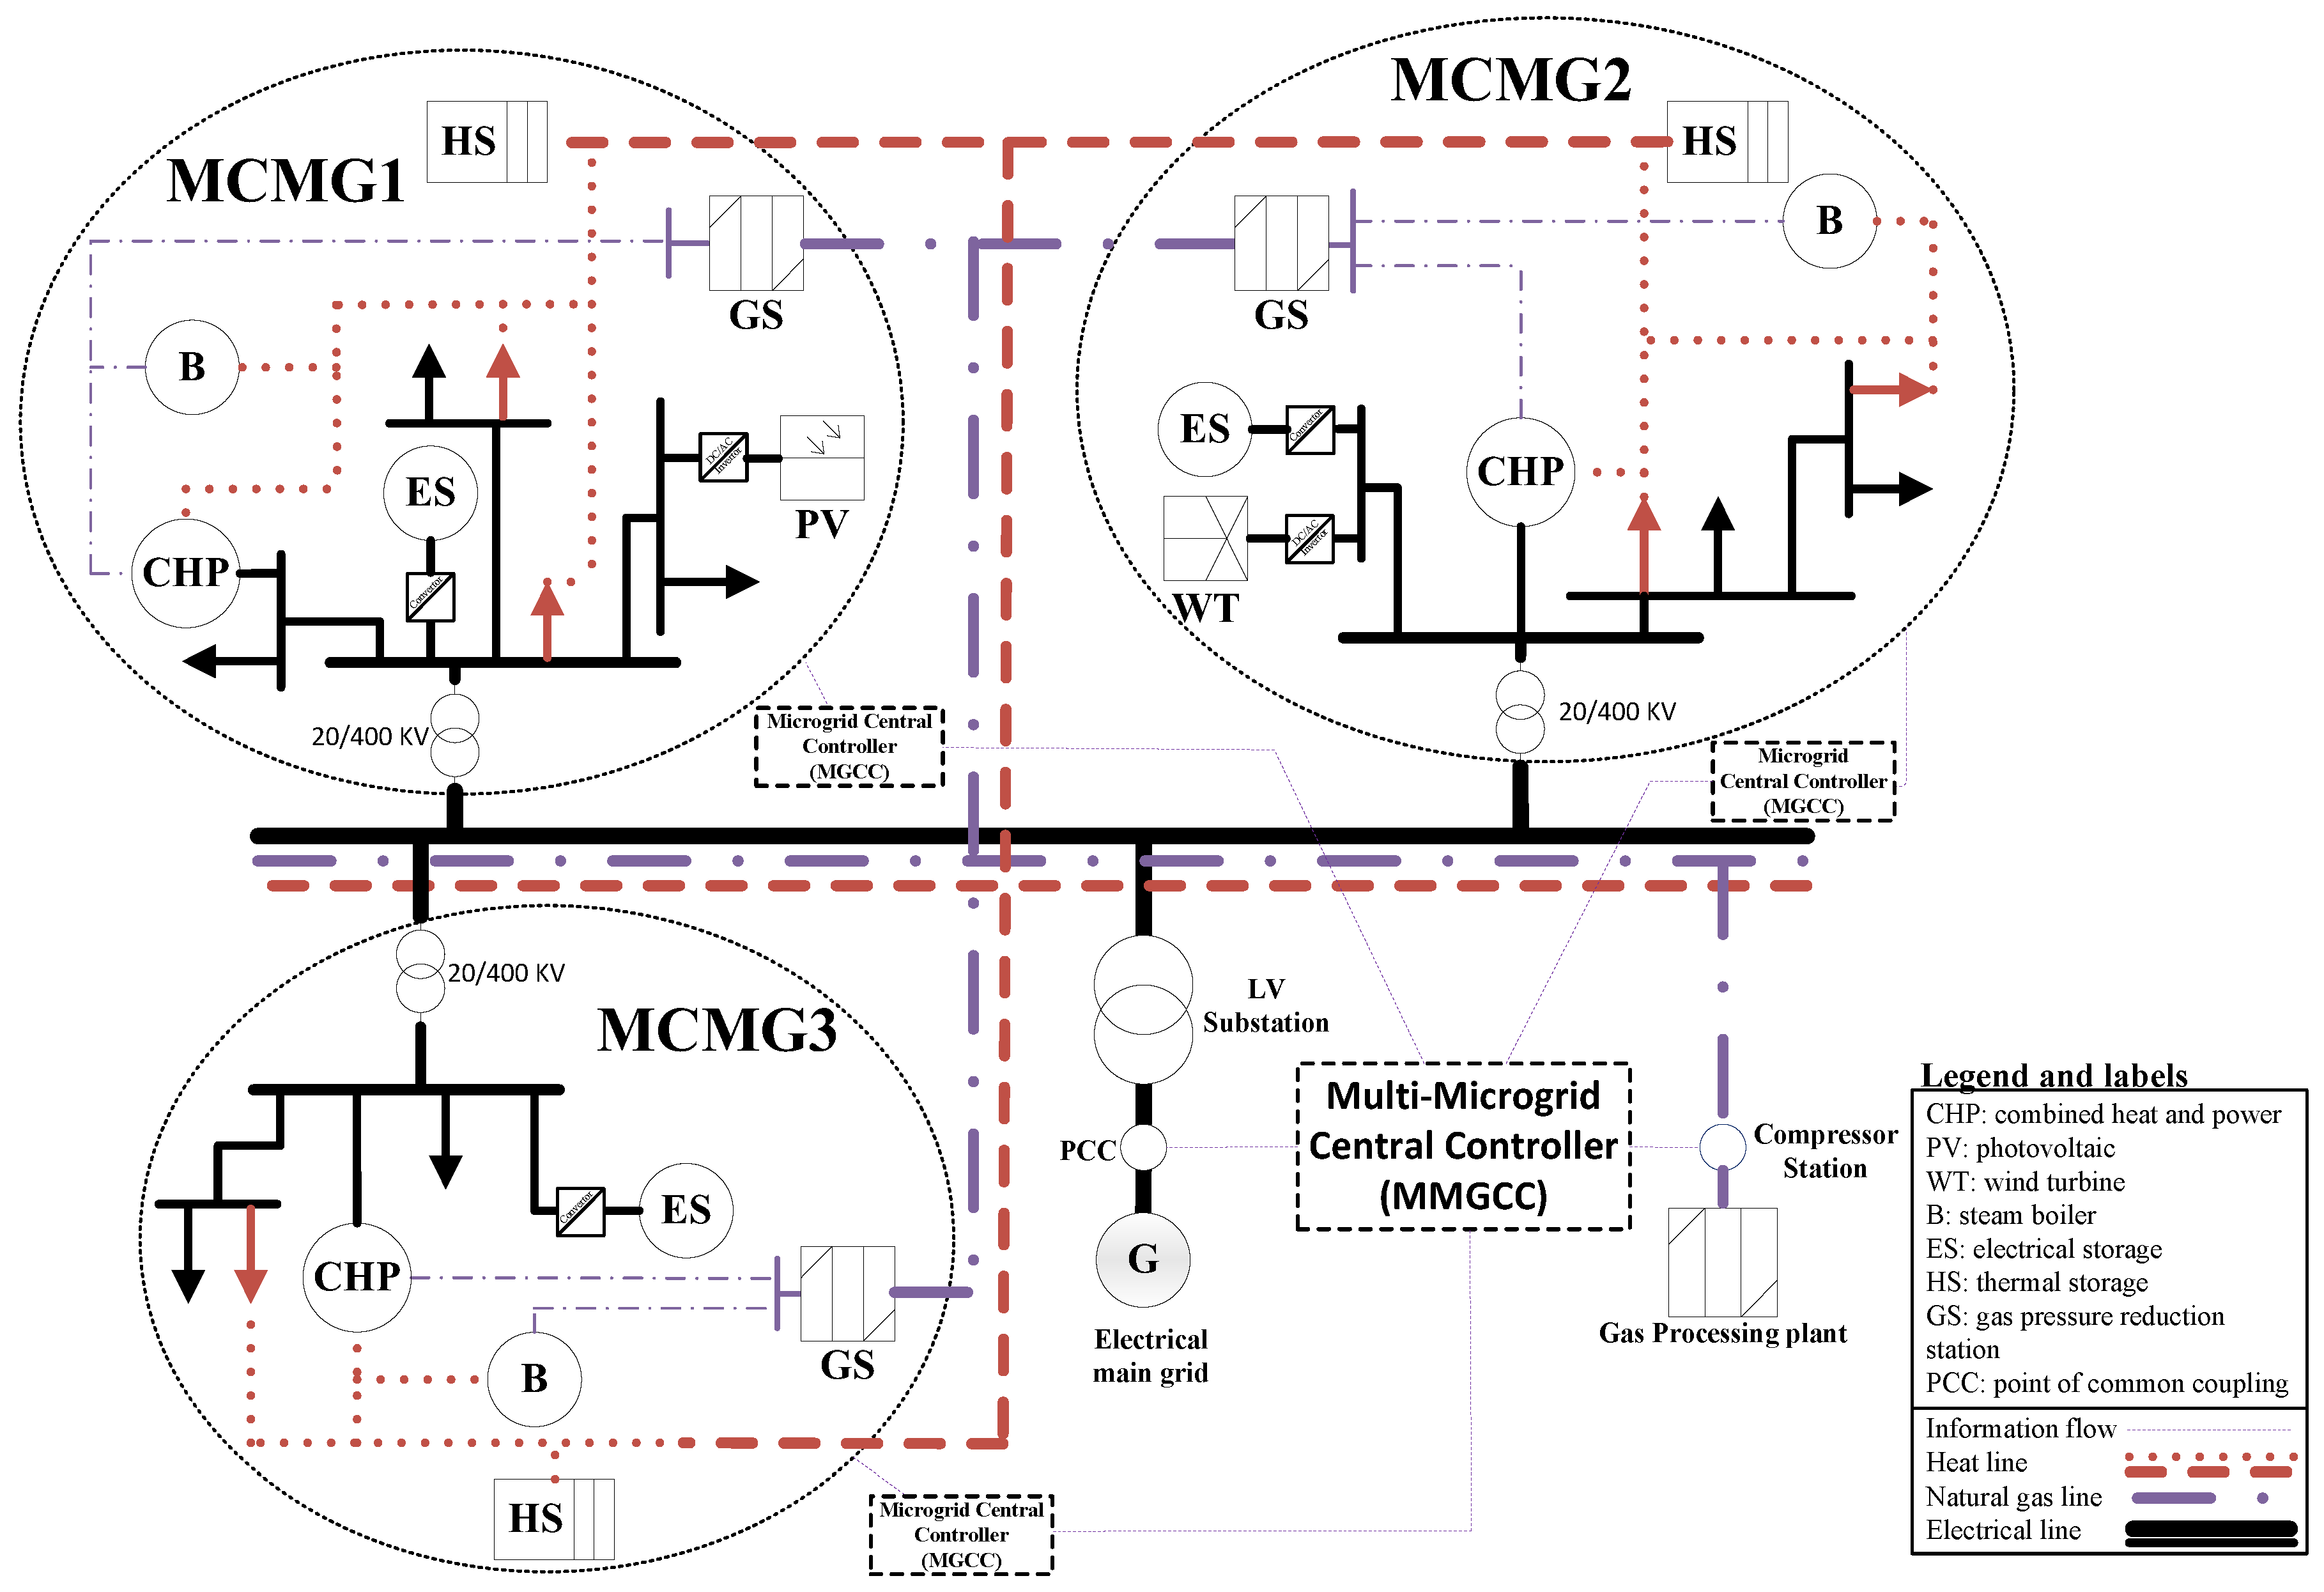
  • A network of MCMGs structure is taken into account for studying MCMG optimal scheduling to resolve prevalent disadvantage of conventional structures of MGs. The centralized energy scheduling of the MCNMG is managed by the MMGCC which aggregates signals from each MGCC to economically distribute the energies to the consumers.
  • Proposing a novel time-based demand side management model which correlates the final energy price of responsive loads for multiple carriers with energy market price, energy purchase, and on-site generations.
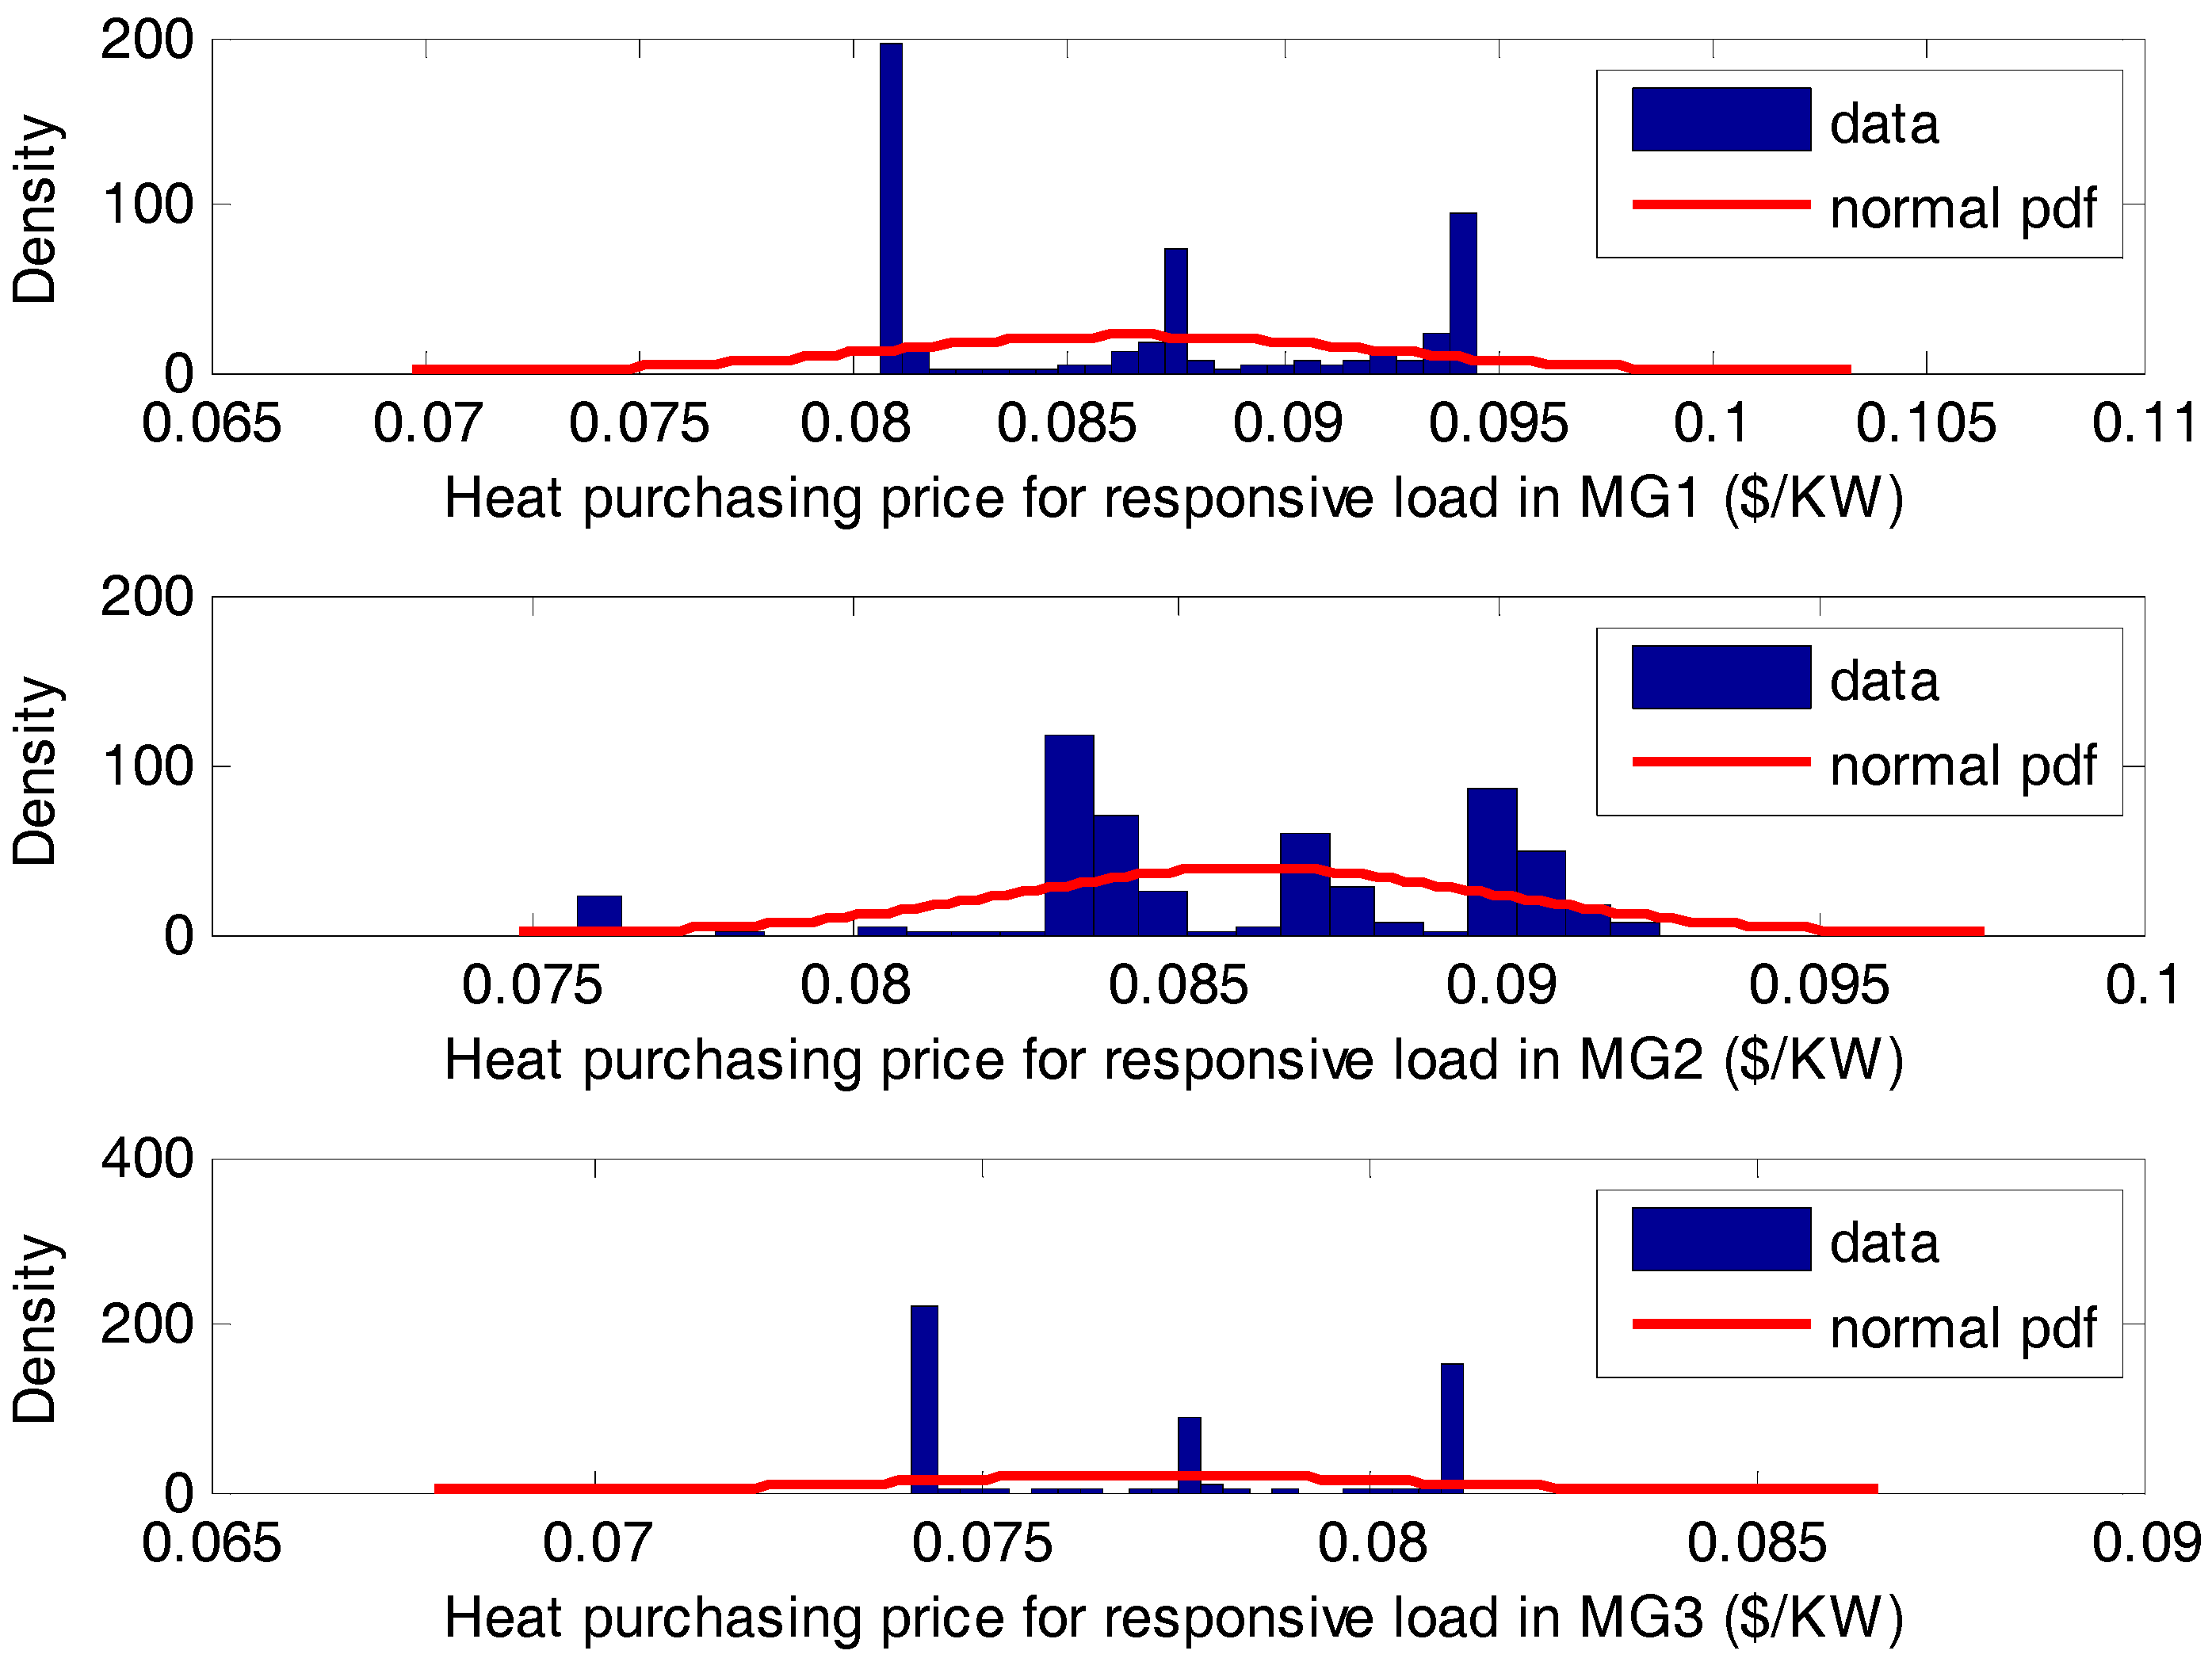
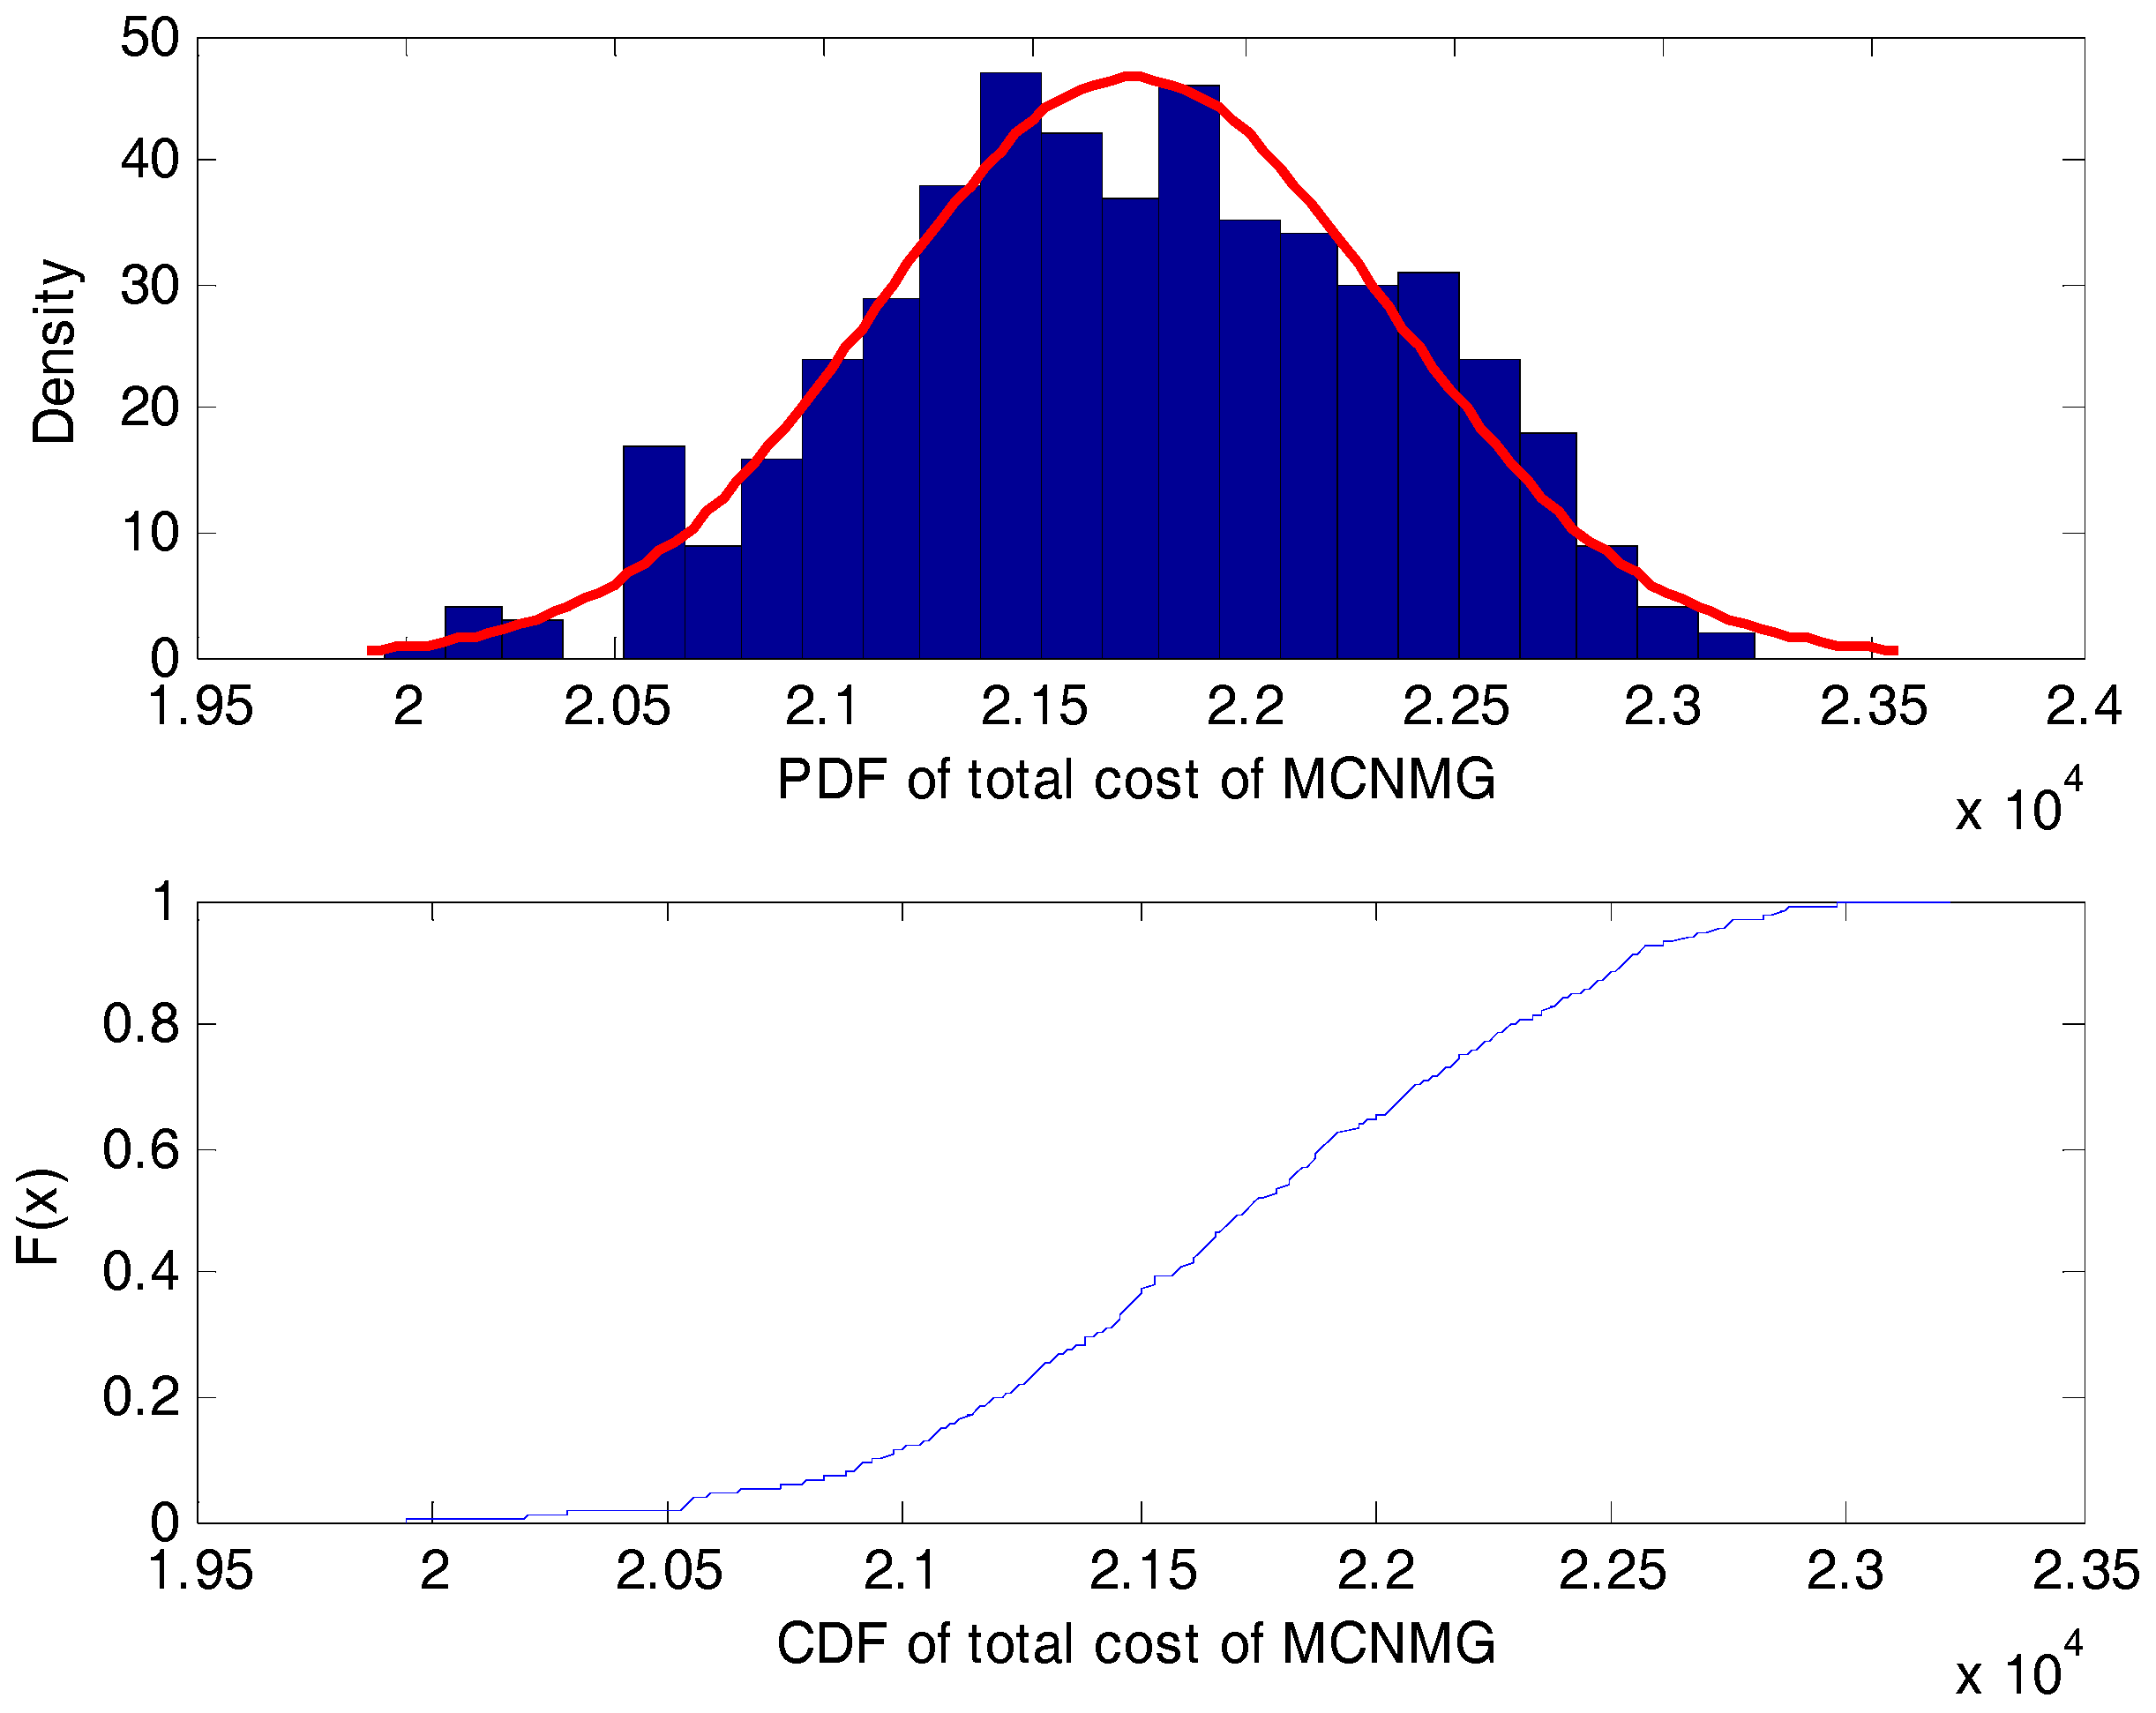
  • The proposed network is studied under uncertainties of electrical and thermal loads, electricity price, and RERs generations.

2. The Multi-Carrier Networked Microgrid (MCNMG) Structure

A multi-carrier microgrid (MCMG) is formed of a low- or medium-voltage electrical network together with networks of other energy carriers, including natural gas and heat. In this paper, a smart distribution network with multiple MCMGs called MCNMG, to fulfill multiple energy demands in a 24-h interval is modeled in Figure 1. The MCNMG is a network of interconnected MCMGs which are controlled by one main controller and these MCMGs can interchange energies to prevent the excess cost of the total network. Based on the figure, each MCMG consists of DERs and loads which are managed by their own MGCCs by receiving or sending signals to local controllers and sources. The data from each MGCC are aggregated by the main controller called multi-microgrid central controller (MMGCC) which simplifies the energy management of the MCNMG. DERs includes, PV, wind turbine (WT), boiler and combined heat and power (CHP) along with electrical and thermal storage elements. CHPs, boilers, and heat storages are used exclusively to supply heat in each MCMG. The proposed MCNMG is connected to the electrical main grid, which can purchase or sell electricity to/from the main grid, and also is connected to the natural gas main grid, where only purchasing is feasible. Moreover, the thermal energy interchange between adjacent MCMGs was considered and found to be conceivable. In addition to non-responsive loads, time-based responsive loads were also considered to smooth the load curves by shifting a share of load to off-peak intervals.

3. System Model

3.1. Probabilistic Modeling

Owing to the uncertainty of power systems, the appropriate probabilistic method needs to be implemented to deal with probabilistic data. Power systems face a variety of uncertainties, but the focus is mostly on uncertainties associated with load, wind, and solar power generation. This paper models the uncertainties related to loads, electricity price, WT and PV generation by implementing PDFs. In probabilistic calculations, input parameters and state variables are described by PDF, and the results from probabilistic analysis are presented in PDF and CDF forms.

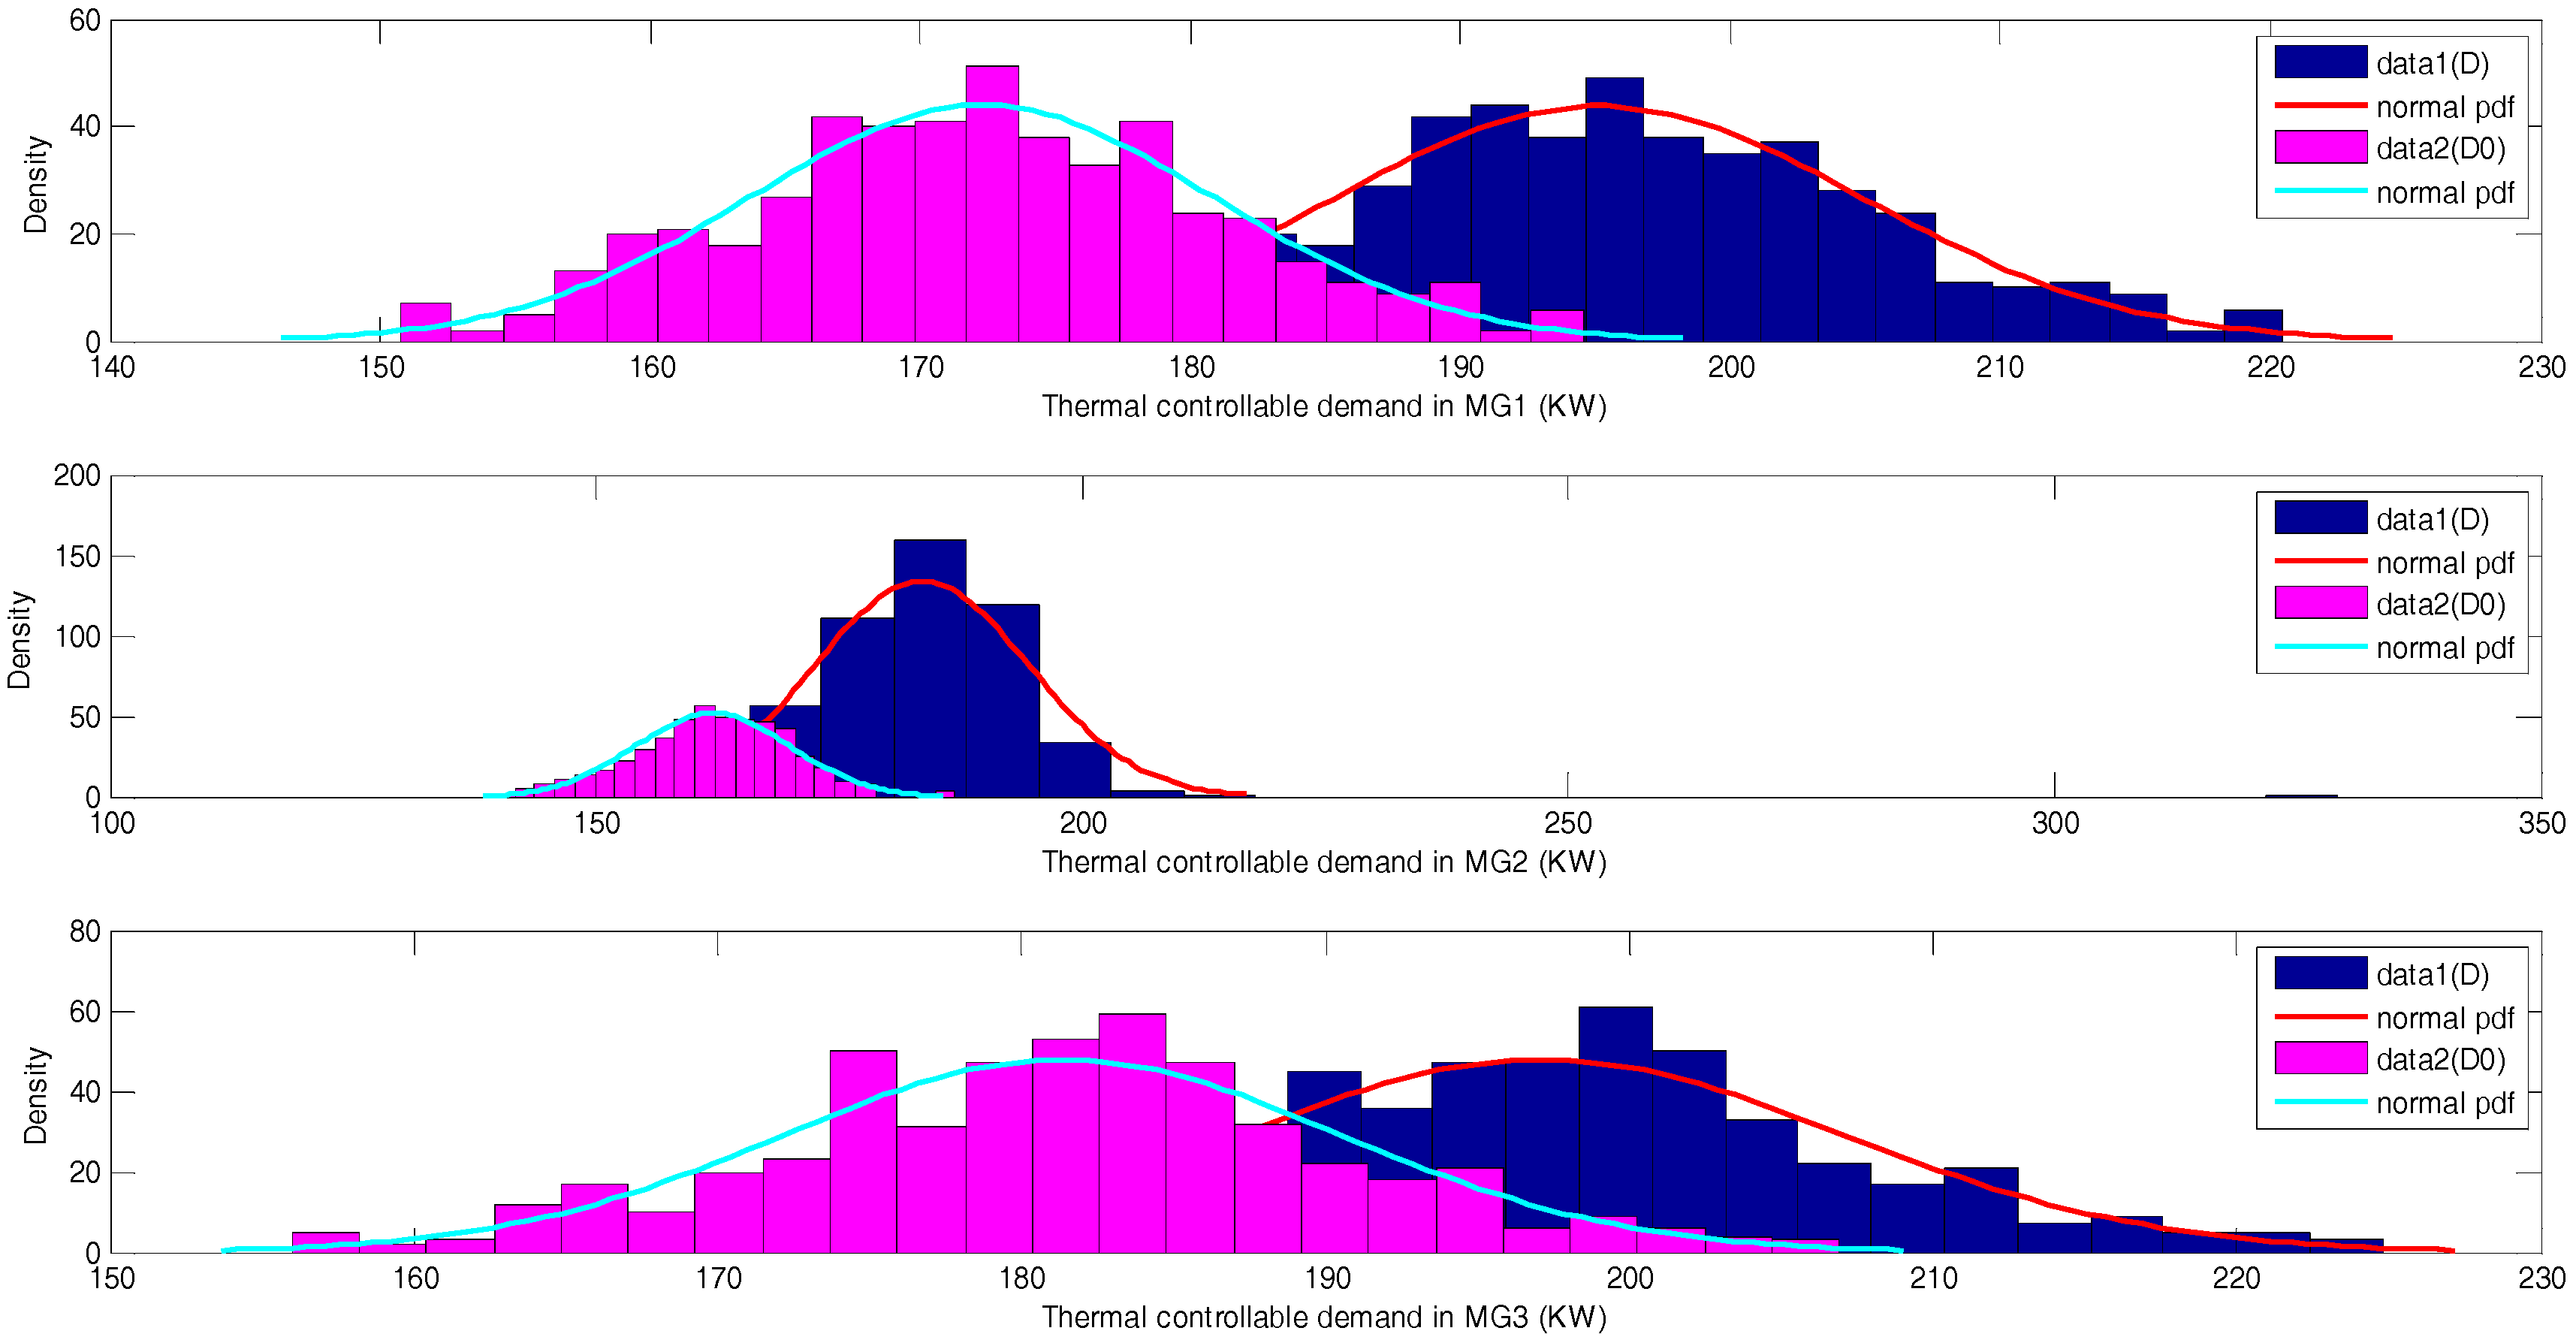
3.1.1. Modeling of Loads

Certainly, the load as the most obvious uncertain variable plays a crucial role in power system operation. Owing to variable nature of load, it is suitable to model the stochastic behavior of the load. The normal distribution is the most popular load distribution and is widely used [24]. In this study, the electrical and thermal loads are modeled using a normal distribution function with mean value equal to the base load at any study period and standard deviation (STD) equal to 5% of its mean as below:
f ( L t , l ) = 1 σ l × 2 π × exp ( ( L t , l μ l ) 2 2 σ l 2 )

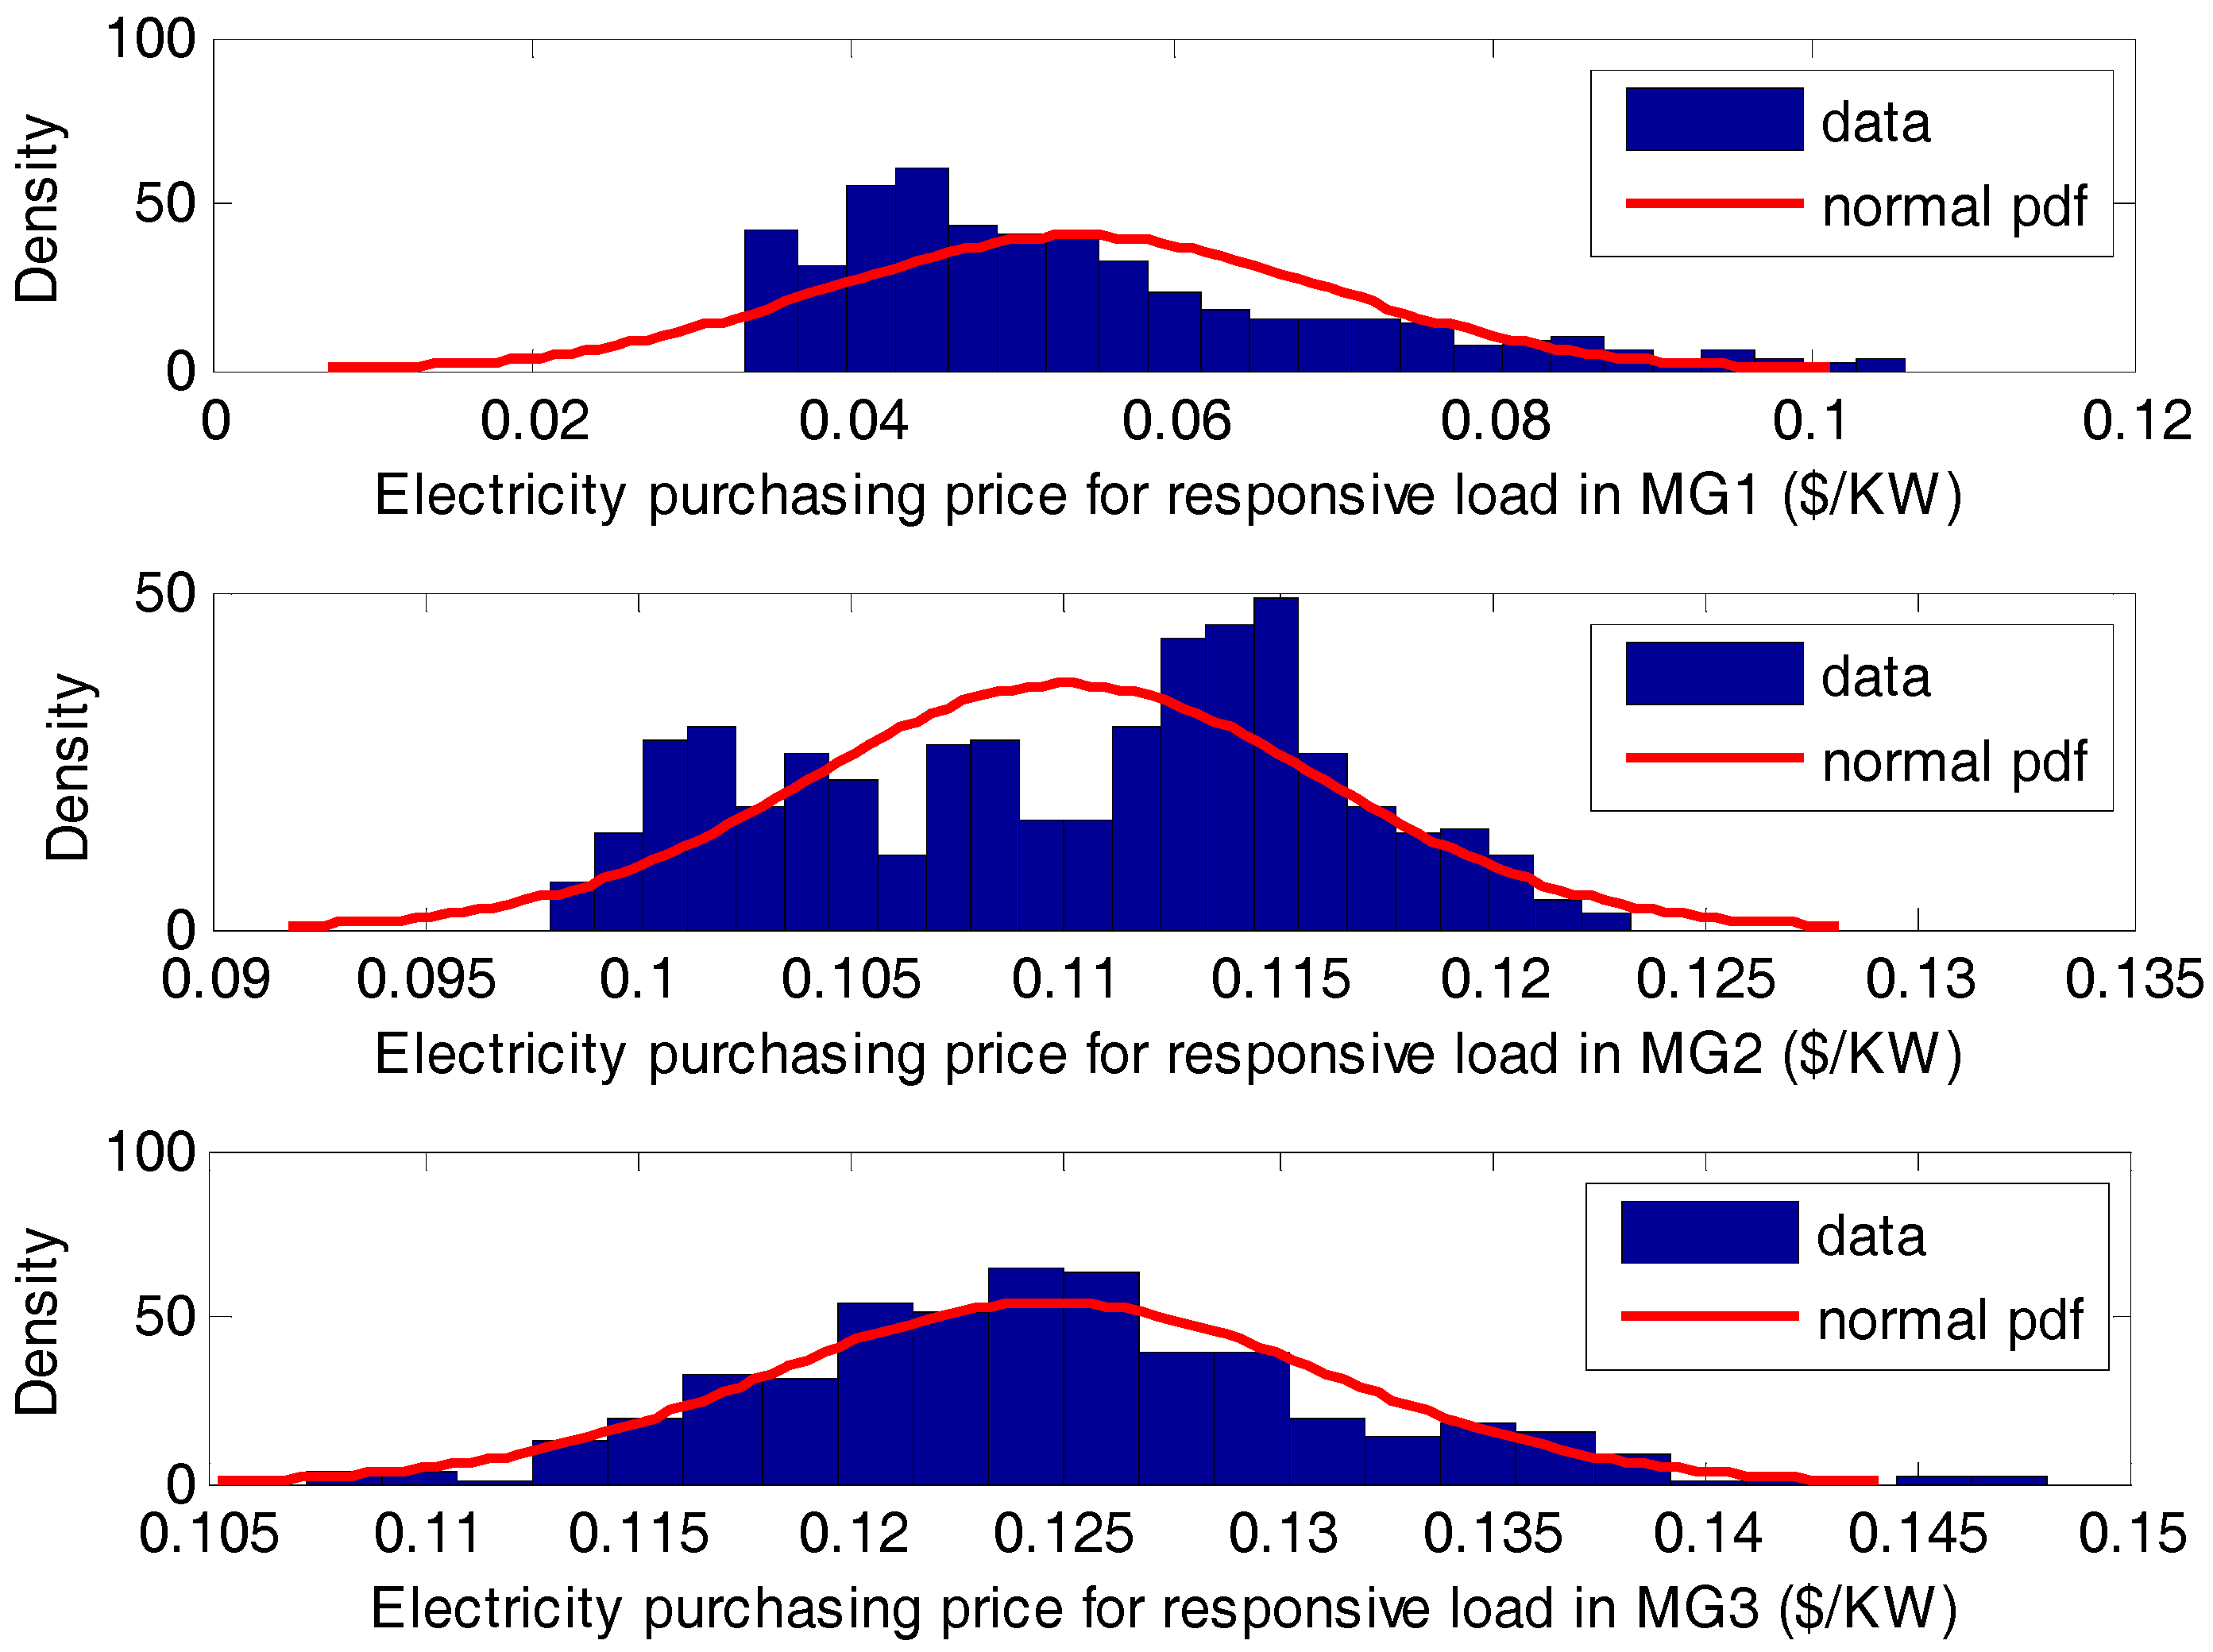
3.1.2. Modeling of Electricity Market

Due to random price swings of the electricity carrier, there is not an exact match of stochastic distribution to model it. In [42], An overview of different price forecasting methodologies for electricity price has been studied that revealed no superiority of one approach over another on a consistent basis. So the importance of testing various techniques has been studied to find the best distribution [43,44]. The statistical analysis in [44] shows that the lognormal distribution is most appropriate and the proposed bidding strategy verified the analysis. Hence, the lognormal distribution function with mean value equal to the base electricity price at given interval and standard deviation (STD) equal to 5% of its mean is employed to model electricity market price as below:
f c e ( π e , t ) = 1 π e , t × σ π × 2 π × exp ( ( ln ( π e , t ) μ π ) 2 2 σ π 2 )

3.1.3. Modeling of Renewable Generation

The generation outputs of renewable energy resources (RERs) depend on the primary sources such as wind speed, solar radiation, etc. As wind and solar radiation have a probabilistic nature, the output power rates of WT and PV are intermittent. Two PDFs are implemented to model the uncertainties related to WT and PV units.
In WT, wind is the primary energy with zero fuel cost. Wind speed varies every moment, which highlights the importance of a probability model. The Weibull probability distribution function (PDF) is regularly used as a proper model of wind speed behavior in each forecasted interval [18]. Weibull PDF is formulated as below:
f v ( v t ) = { ( β α ) × ( v t α ) β 1 × exp ( ( v t α ) β ) v t 0 0 o t h e r w i s e
The output power of the WT at any given interval is calculated using the WT power curve parameters as described by the following equation [45]:
R P w t ( v t ) = { 0 0 v t v c i o r v t v c o P r w t × v 2 t v c i 2 v r 2 v c i 2 v c i v t v r P r w t v r v t v c o
The generated power by a PV module varies according to the solar radiation at a specific location. In this paper, the solar radiation PDF is modeled through a beta distribution [46]. The beta distribution function is represented as:
f ( R t ) = Γ ( φ , ζ ) Γ ( φ ) × Γ ( ζ ) × R t ( φ 1 ) × ( 1 R t ) ζ
The PV’s output power as a function of radiation is stated as a radiation-power curve [46]:
R P p v ( R t ) = { P r p v × ( R t 2 R s t a d R c e ) 0 R t R c e P r p v × ( R t R s t a d ) R c e R t R S T A D P r p v R S T A D R t

3.2. Energy Storage Modeling

The flexibility of the network can be increased by embedding storages in proposed MCNMG in order to prevent wastage of energies in a way that surplus generated energies by DGs are stored at low prices and injected to the grid while the price is high. In [47], the benefits of energy storage element are studied exclusively. The energy storage modeling is formulated as follows:
M l ( t , m ) = S l ( t , m ) × E l ˙ ( t , m )
M l ( t , m ) = 1 η s l ( t , m ) × ( E l ( t , m ) E l ( t 1 , m ) E l , s t b )
η s l ( t , m ) = I l ( t , m ) × η l c h a r ( m ) + ( 1 I l ( t , m ) ) η l d i s c h a r ( m )
In order to obtain sustainable storage utilization, another equality constraint can be included in the problem formulation which requires that the storage energies at the end of the last period of the studied time interval are equal to the initial energies:
E l ( 1 , m ) = E l ( 24 , m )

3.3. Demand Side Management (DSM) Model

In future networks, customers will have the tendency to participate in energy supply. In other words, the program that enables loads to be cut or shifted to other hours is defined as DSM [48]. DSM programs are classified into two policies: based on price, and encouragement and penalty. With the first policy, demand changes based on energy prices in each interval. Thus, this method is considered in the presented paper. Since the energy prices in the input of MCMGs are specified by energy markets, the final energy prices (FEPs) of electrical and thermal controllable loads in the system output are determined based on input energy, equipment efficiency, and operation. These final prices are modeled in Equations (11) and (12), based on Figure 2.
ρ α ( t ) = i = 1 N P i ( t ) × π i ( t ) × η i , α η i , α + η i , β L α ( t ) + D α ( t ) + T α ( t ) + M α ( t )
ρ β ( t ) = i = 1 N P i ( t ) × π i ( t ) × η i , β η i , α + η i , β L β ( t ) + D β ( t ) + T β ( t ) + M β ( t )
Considering the final energy price of controllable loads, elasticity matrix that indicates the percentage of load shifting in proportion to the percentage of price changes, are shown in Equations (13) and (14). The diagonal elements of mentioned matrix are positive and the rest are negatives, i.e., by price increasing in an hour, responsive load is decreased at this moment and shift a share of load to other hours:
E L α ( t , t ) = ( e e α ( 1 , 1 )   e e α ( 24 , 1 ) e e α ( 1 , 24 ) e e α ( 24 , 24 ) )
e e α ( t , t ) = { t = t e e α ( t , t ) 0 t t e e α ( t , t ) < 0
Regarding the elasticity matrix definition, responsive load is defined as below:
D α ( t ) = D 0 , α ( t ) × [ 1 + t = 1 24 E L α ( t , t ) × ρ α ( t ) ρ 0 , α ( t ) ρ 0 , α ( t ) ]

4. Problem Description

The model is a non-linear problem. The purpose of MCNMG operation is to minimize cost function considering equality and inequality constraints.

4.1. Objective Function

The economic dispatch of MCNMG within 24 h is a nonlinear problem in which the OF includes purchased and sold power of various energies in addition to operation and maintenance (O&M) costs. Regarding presented problem definition in previous parts about MCNMG, the objective function for operation of proposed MCNMG at the given intervals is described precisely as below:
M I N :   O F = s t = 1 24 [ P e , t o t ( t , s ) × π e ( t , s ) + P g , t o t ( t , s ) × π g ( t ) T e , t o t ( t , s ) × ψ e , t o t ( t , s ) + m = 1 n m C O & M ( t , m , s ) ]
The OF defines the objective function which is the summation of purchased and sold energies and O&M costs. The OF equation details are given precisely as follows:
P p , t o t ( t , s ) = m = 1 n m P p ( t , m , s ) p { e , g }
T l , t o t ( t , s ) = m = 1 n m T l ( t , m , s ) l { e , h }
C O & M ( t , m , s ) = P o e c h p ( t , m , s ) × K O & M c h p ( m )   + P o h b o ( t , m , s ) × K O & M b o ( m )        + P o e t r a n s ( t , m , s ) × K O & M t r a n s ( m ) + R u P o e R u ( t , m , s ) × K O & M R P ( m )
P o e t r a n s ( t , m , s ) = P e ( t , m , s ) × η e t r a n s ( m )
P o l c h p ( t , m , s ) = P g ( t , m , s ) × η l c h p ( m ) × υ l c h p ( t , m , s )
P o h b o ( t , m , s ) = P g ( t , m , s ) × η h b o ( m ) × υ b o ( t , m , s )
P o R u ( t , m , s ) = R P R u ( t , m , s ) × η R u ( m )

4.2. Problem Constraints

4.2.1. Energy Balance Constraints

The total amount of non-responsive and responsive loads that are the summation of the whole available loads in each MCMGs are formulated as below:
L l , t o t ( t , s ) = s m = 1 n m L l ( t , m , s ) l { e , h }
D l , t o t ( t , s ) = s m = 1 n m D l ( t , m , s ) l { e , h }    
The energy balancing of electrical and thermal loads for each MCMG at any sample is modeled respectively, as follows:
L e ( t , m , s ) + D e ( t , m , s ) + T e ( t , m , s ) = P o e c h p ( t , m , s ) + P o e R u ( t , m , s ) + P o e t r a n s ( t , m , s ) M e ( t , m , s )
L h ( t , m , s ) + D h ( t , m , s ) + T h ( t , m , s ) P o h c h p ( t , m , s ) + P o h b o ( t , m , s ) M h ( t , m , s )
The thermal energy generation-consumption within the MCNMG must be balanced as formulated below:
m = 1 n m P h ( t , m , s ) = m = 1 n m T h ( t , m , s )
Responsive loads and its energy purchasing prices as called final energy prices (FEP) in each MCMGs are calculated and modeled as follows:
D l ( t , m , s ) = D 0 , l ( t , m , s ) + Δ d l ( t , m , s )
Δ d l ( t , m , s ) = D 0 , l ( t , m , s ) × t = 1 24 E L l ( t , t , m ) × Δ ρ l ( t , m , s ) ρ 0 , l ( t , m )
Δ ρ l ( t , m , s ) = ρ l ( t , m , s ) ρ 0 , l ( t , m )
ρ e ( t , m , s ) = ( p e ( t , m , s ) × π e ( t , s ) + p g ( t , m , s ) × υ c h p ( t , m , s ) × π g ( t ) × ( η e c h p ( m ) / η e c h p ( m ) + η h c h p ( m ) ) ) ( P o e t r a n s ( t , m , s ) + P o e R u ( t , m , s ) + P o e c h p ( t , m , s ) M e ( t , m , s ) )
ρ h ( t , m , s ) = ( p g ( t , m , s ) × υ b o ( t , m , s ) × π g ( t ) + ( p g ( t , m , s ) × υ c h p ( t , m , s ) × π g ( t ) × ( η h c h p ( m ) / η e c h p ( m ) + η h c h p ( m ) ) ) ) ( P o h c h p ( t , m , s ) + P o h b o ( t , m , s ) M h ( t , m , s ) )

4.2.2. Inequality Constraints

There are the following constraints to purchase and sell powers as below which defines the energy purchase and sales at the same time or sample is not reasonable:
{ i f P e ( t , m , s ) T e ( t , m , s ) 0 P e ( t , m , s ) 0 ,   T e ( t , m , s ) = 0 e l s e P e ( t , m , s ) T e ( t , m , s ) < 0 P e ( t , m , s ) = 0 ,   T e ( t , m , s ) 0
The upper and lower constraints are considered for capacity of each equipment and subjected as follows:
P o e c h p ( t , m , s ) _ P o e c h p ( t , m , s ) P o e c h p ( t , m , s ) ¯
P o h b o ( t , m , s ) _ P o h b o ( t , m , s ) P o h b o ( t , m , s ) ¯
P p , t o t ( t , s ) _ P p , t o t ( t , s ) P p , t o t ( t , s ) ¯
T e , t o t ( t , s ) _ T e , t o t ( t , s ) T e , t o t ( t , s ) ¯
P p ( t , m , s ) _ P p ( t , m , s ) P p ( t , m , s ) ¯
T l ( t , m , s ) _ T l ( t , m , s ) T l ( t , m , s ) ¯
E l ( t , m ) _ E l ( t , m ) E l ( t , m ) ¯
| M l ( t , m , s ) | M l ( t , m , s ) ¯
0 υ c h p ( t , m , s ) 1
0 υ b o ( t , m , s ) 1
υ c h p ( t , m , s ) + υ b o ( t , m , s ) = 1

5. Simulation Results and Discussion

In this paper, a smart distribution network with multiple MCMGs to fulfill multiple energy demands in a 24-h interval was modeled as shown in Figure 1. In the figure, the MCMGs are in interconnected mode to balance the supply-demand of the district heat network, and each MCMG is linked to the electric and natural gas main grid. So, MCMG can buy electric and natural gas energies from the main grid when the MCMG is unable to provide its own multiple demands from its sources. An MCMG with surplus electricity can sell its electricity to the main grid. The characteristics of MCNMG’s elements are stated in Table 1.
Owing to the intermittent behavior of some RESs, electricity prices, and load variations, this study was conducted based on uncertainty in input data. For every hour, to simulate the uncertainty behavior of the mentioned variables, 500 samples were considered, but the results are shown for only one hour of the day in PDF and CDF forms. The PDF function was applied for loads, electricity prices, wind speeds, and solar radiation; these input variables are defined as probabilistic variables. Based on the correlation between input and output variables, the output variables demonstrate probabilistic behavior. The electrical and thermal loads of each MCMG are illustrated in Figure 3. It should be mentioned that electricity purchasing and selling prices are considered equally in three steps, and the density for a specific hour is shown in Figure 4, whereas the natural gas purchasing price is permanently fixed at 0.07 dollars per hour.
To model the uncertainty of wind speed and solar irradiation, historically measured data for a given 24 h of the day in Kashan city, Iran, was used as practical data. The probabilistic modeling of both wind speed and solar irradiation and, consequently, the probabilistic modeling for WT and PV units are illustrated in Figure 5. In Table 2, the values of the parameters of the WT and PV units that were used in simulation are given.
The statistical analysis of generated power by units and energy storage elements of the MCNMG are described based on mean values for a specific hour in Table 3.
According to the results in Table 3, a big share of electricity demand in MCMG1 is supplied by PV and CHP and the extra electricity generation by PV is sold to the main grid. But the electricity demand in MCMG2 is mostly supplied by the main grid owing to no-cost energy generation of WT at this specific hour while boiler supplied the most share of the heat demand in the MCMG2. As the network is managed by the MMGCC to reduce the total cost of MCNMG, so the MCMG2 and more efficiently MCMG3 supply a big share of heat demand in MCMG1. It is evident in Table 3 that the boiler of MCMG2 and MCMG3 produced more heat to transfer heat to MCMG1.
Since the MCNMG is connected to the main grid and can trade energies, the PDFs of total purchased electricity and natural gas energies are displayed in Figure 6. The heat balance in each MCMG must be met according to the cooperative operation of the MCNMG. To be more specific, if the heat demand in one MCMG cannot be supplied by its sources, the adjacent MCMGs must meet the needy MCMG’s demand. The PDFs of received and transferred heat by each MCMG are depicted in Figure 7 and Figure 8, respectively. Comparing the following two figures shows that MCMG1 received the most heat energy from MCMG2 and MCMG3 due to the renewable generation in MCMG1 and the higher efficiencies of the other two MCMG’s boilers. A comparison of total thermal energy wastage after and before thermal energy exchange between MCMGs is shown in Table 4. It can be observed that the thermal energy wastage and, consequently, total costs are lower in case of interconnected MCNMG operation. It should be mentioned that the result may not seem remarkable, but it will surely be significant in a wide network.
Electrical and thermal controllable loads form 10% of total loads as observed in Figure 9 and Figure 10 in PDF forms, respectively. These responsive loads are encouraged or forced to shift their demands in peak intervals to off-peak intervals. The peak period for electrical load is considered from interval 15–22, whereas that of the thermal load is in intervals 1–7 and 23–24. As shown in Figure 9 and Figure 10, electrical and thermal responsive loads shift their demand to off-peak intervals, and customers participate as active loads.
The FEPs of electrical and thermal controllable loads were acquired and are depicted in Figure 11 and Figure 12, respectively. The base energy price of electrical controllable load was considered equal to 0.05 $/KWh for all given intervals, whereas that of the thermal controllable load was considered equal to 0.07 for intervals 1–7 and 23–24, 0.06 for intervals 8–18, and 0.05 for intervals 19–22. It can be seen that the final energy prices of electrical and thermal controllable loads are higher than their base prices. Therefore, customers are encouraged to shift their demand to less costly hours.
In Figure 13 the load factor (LF) of MCNMG is shown in PDF form. Moreover, responsive load participation as 10% and 30% of total load is simulated, and LF and total MCNMG cost are compared in Table 5. It is clear that LF is optimally increased, while the total cost of the network is lower in the case of higher participation of responsive load.
Finally, the PDF and CDF of total cost of the MCNMG are shown in Figure 14. The results show that the operation cost of the network is totally dependent on the probable behavior of the relevant variables and so taking into more uncertain variable would realize the results more effectively. In conclusion, probabilistic analysis of ED increases the complexity of the optimization process severely, but it gives a better insight to the dispatcher for evaluating the risk of change in a system’s total costs. Such results are more trustworthy from the energy operation management point of view.

6. Conclusions

In this paper, the optimal operation of an MCNMG for a 24-h period is proposed and discussed along with renewable power generation, loads and energy price uncertainties. Because of probabilistic behavior of input variables, the extracted results can be represented as random variables. Hence, the extracted results are defined in PDF and CDF forms. Statistical analyses for powers and costs are given. Results show that the cooperative operation of multiple MCMGs is more beneficial than a single one, while power sharing between MCMGs and the main grid in interconnected mode is considered. Moreover, the inclusion of demand-side participation in energy scheduling leads to lower operation costs at future distribution grids with the interconnected cooperation of MCMGs. The definition of a central controller for the MCNMG is introduced which aggregates signals from local MGCCs simplifies the energy management of the network and consequently guarantee for stable and efficient MCMG operation. Based on the results, output variables have caused a better and comprehensive vision for network experts to manage the marginal operation of the future network under uncertainties. This can guarantee the robust operation of future distribution grids under uncertainties.

Author Contributions

The main part of the paper is written, designated and analyzed by Vahid Amir while Shahram Jadid and Mehdi Ehsan were more of a consultant and corrected the paper to be written and performed properly for publications. Moreover, the proper modeling of the problem and the results have been checked by Shahram Jadid and Mehdi Ehsan.

Conflicts of Interest

The authors declare no conflict of interest.

Nomenclature

Indices/Sets
{ e , h } l Indices for carriers (electrical, heat).
{ e , g } p Indices for carriers (electrical, gas).
e Index for electricity carrier.
g Index for natural gas carrier.
h Index for heat carrier.
c h p Index for CHP.
b o Index for boiler.
t r a n s Index for transformer
p v Index for photovoltaic.
w t Index for wind turbine.
R u Index for renewable units.
t o t Index for total.
t Index for period.
0 Index for initial value.
α Index for carriers type.
m Index for microgrid No.
s Index for samples.
c h a r Index for charge rate in storage interface.
d i s c h a r Index for discharge rate in storage interface.
s t b Index for standby energy losses in energy storage.
O & M Index for operation and maintenance.
c i Index for wind turbine cut-in speed.
c o Index for wind turbine cut-out speed.
r Index for rated speed or power.
c e Index for a certain radiation point.
I Binary variable for energy charging or discharging mode in energy storage.
ρ Final energy price of responsive load ($/KWh).
s t a d Index for standard conditions.
Parameters and Constants
L non-responsive load (KWh).
D responsive load (KWh).
π Energy purchase price ($/KWh).
ψ Energy sales price ($/KWh).
η Energy efficiency of units.
K Maintenance coefficient.
E L Elasticity matrix.
e e Elasticity matrix element.
σ Standard deviation of the uncertain variable.
μ Mean value of the uncertain variable.
υ Wind speed (m/s).
R Solar radiation (W/m2).
α , β Shape and scale parameters of Weibull distribution function (w/m2).
φ , ζ Beta distribution shape factors (KW/m2).
Variables
T Transferred energy (KWh).
P Purchased energy (KWh).
P o Energy generation by each units (KWh).
P r Rated power (KW).
R P Renewable power generation (KWh).
M Storage charge and discharge ramp rate (KWh).
E State of charge in energy storages (KWh).
E ˙ Storage energy derivative (KWh).
S Storage coupling factor.
υ Dispatch factor (%).
C Cost ($).

References

  1. Joseph, A.; Shahidehpour, M. Battery storage systems in electric power systems. In Proceedings of the 2006 IEEE Power Engineering Society General Meeting, Montreal, QC, Canada, 18–22 June 2006; IEEE: Piscataway, NJ, USA, 2006; p. 8. [Google Scholar]
  2. Parhizi, S.; Lotfi, H.; Khodaei, A.; Bahramirad, S. State of the art in research on microgrids: A review. IEEE Access 2015, 3, 890–925. [Google Scholar] [CrossRef]
  3. Energy & Environmental Resources Group. U.S. Department of Energy DOE Microgrid Workshop Report; The Office of Electricity Delivery and Energy Reliability Smart Grid R&D Program: San Diego, CA, USA, 2011; pp. 1–32. [Google Scholar]
  4. Su, W.; Wang, J.; Zhang, K.; Huang, A.Q. Model predictive control-based power dispatch for distribution system considering plug-in electric vehicle uncertainty. Electr. Power Syst. Res. 2014, 106, 29–35. [Google Scholar] [CrossRef]
  5. Hussain, A.; Lee, J.-H.; Kim, J.-Y.; Kim, H.-M.; Song, N.-O. An Algorithm for Optimal Multi-Microgrid Operation Including Heat Network. In Proceedings of the 2015 IPEG, Daejon, Korea, 17 October 2015. [Google Scholar]
  6. Nikmehr, N.; Najafi-Ravadanegh, S. Probabilistic optimal power dispatch in multi-microgrids using heuristic algorithms. In Proceedings of the 2014 Smart Grid Conference (SGC), Tehran, Iran, 9–10 December 2014; IEEE: Piscataway, NJ, USA, 2014; pp. 1–6. [Google Scholar]
  7. Katiraei, F.; Iravani, R.; Hatziargyriou, N.; Dimeas, A. Microgrids management. IEEE Power Energy Mag. 2008, 6, 54–65. [Google Scholar] [CrossRef]
  8. Laaksonen, H.J. Protection principles for future microgrids. IEEE Trans. Power Electron. 2010, 25, 2910–2918. [Google Scholar] [CrossRef]
  9. Nikmehr, N.; Ravadanegh, S.N. Analysis of Reliability Indices in Next Generation Microgrids under Uncertainties of Load and Renewable Power Production. AUT J. Electr. Eng. 2016, 48, 41–51. [Google Scholar] [CrossRef]
  10. Guo, L.; Liu, W.; Cai, J.; Hong, B.; Wang, C. A two-stage optimal planning and design method for combined cooling, heat and power microgrid system. Energy Convers. Manag. 2013, 74, 433–445. [Google Scholar] [CrossRef]
  11. Arefifar, S.A.; Mohamed, Y.A.R.I.; El-Fouly, T.H.M. Optimum microgrid design for enhancing reliability and supply-security. IEEE Trans. Smart Grid 2013, 4, 1567–1575. [Google Scholar] [CrossRef]
  12. Nikmehr, N.; Ravadanegh, S.N. Optimal Power Dispatch of Multi-Microgrids at Future Smart Distribution Grids. IEEE Trans. Smart Grid 2015, 6, 1648–1657. [Google Scholar] [CrossRef]
  13. Teng, J.H.; Liu, Y.H.; Chen, C.Y.; Chen, C.F. Value-based distributed generator placements for service quality improvements. Int. J. Electr. Power Energy Syst. 2007, 29, 268–274. [Google Scholar] [CrossRef]
  14. Koutsopoulos, I.; Tassiulas, L. Challenges in demand load control for the smart grid. Netw. IEEE 2011, 25, 16–21. [Google Scholar] [CrossRef]
  15. Hussain, A.; Lee, J.-H.; Kim, H.-M. An Optimal Energy Management Strategy for Thermally Networked Microgrids in Grid-Connected Mode. Int. J. Smart Home 2016, 10, 239–258. [Google Scholar] [CrossRef]
  16. Song, N.-O.; Lee, J.-H.; Kim, H.-M. Optimal Electric and Heat Energy Management of Multi-Microgrids with Sequentially-Coordinated Operations. Energies 2016, 9, 473. [Google Scholar] [CrossRef]
  17. Mohamed, F.A.; Koivo, H.N. Online Management of MicroGrid with Battery Storage Using Multiobjective Optimization. In Proceedings of the 2007 International Conference on Power Engineering, Energy and Electrical Drives, Setubal, Portugal, 12–14 April 2007; pp. 231–236. [Google Scholar]
  18. Ravadanegh, S.N.; Farhudi, T.; Nikmehr, N.; Oskuee, M.R.J. Statistical analysis on results of optimal power sharing between linked microgrids. Int. J. Ambient Energy 2016. [Google Scholar] [CrossRef]
  19. Kinjyo, Y.; Asato, B.; Yona, A.; Senjyu, T.; Funabashi, T.; Kim, C.-H. Optimal Operation of Smart Grid with Fuel Cell in Isolated Islands. J. Int. Counc. Electr. Eng. 2012, 2, 423–429. [Google Scholar] [CrossRef]
  20. Esmat, A.; Magdy, A.; ElKhattam, W.; ElBakly, A.M. A novel Energy Management System using Ant Colony Optimization for micro-grids. In Proceedings of the 2013 3rd International Conference on Electric Power and Energy Conversion Systems, Istanbul, Turkey, 2–4 October 2013; pp. 1–6. [Google Scholar] [CrossRef]
  21. Urias, M.E.G.; Sanchez, E.N.; Ricalde, L.J. Electrical Microgrid Optimization via a New Recurrent Neural Network. IEEE Syst. J. 2015, 9, 945–953. [Google Scholar] [CrossRef]
  22. Mohamed, F.A.; Koivo, H.N. Multiobjective optimization using Mesh Adaptive Direct Search for power dispatch problem of microgrid. Int. J. Electr. Power Energy Syst. 2012, 42, 728–735. [Google Scholar] [CrossRef]
  23. Ferruzzi, G.; Graditi, G.; Rossi, F.; Russo, A. Optimal Operation of a Residential Microgrid: The Role of Demand Side Management. Intell. Ind. Syst. 2015, 1, 61–82. [Google Scholar] [CrossRef]
  24. Nikmehr, N.; Ravadanegh, S.N. Solving probabilistic load flow in smart distribution grids using heuristic methods. J. Renew. Sustain. Energy 2015, 7. [Google Scholar] [CrossRef]
  25. Huang, C.; Yue, D.; Deng, S.; Xie, J. Optimal scheduling of microgrid with multiple distributed resources using interval optimization. Energies 2017, 10. [Google Scholar] [CrossRef]
  26. Aien, M.; Fotuhi-Firuzabad, M.; Rashidinejad, M. Probabilistic optimal power flow in correlated hybrid wind-photovoltaic power systems. IEEE Trans. Smart Grid 2014, 5, 130–138. [Google Scholar] [CrossRef]
  27. Ravadanegh, S.N.; Nikmehr, N. Heuristic probabilistic power flow algorithm for microgrids operation and planning. IET Gener. Trans. Distrib. 2015, 9, 985–995. [Google Scholar] [CrossRef]
  28. Liang, H.; Zhuang, W. Stochastic modeling and optimization in a microgrid: A survey. Energies 2014, 7, 2027–2050. [Google Scholar] [CrossRef]
  29. Motevasel, M.; Seifi, A.R. Expert energy management of a micro-grid considering wind energy uncertainty. Energy Convers. Manag. 2014, 83, 58–72. [Google Scholar] [CrossRef]
  30. Napoli, R.; Sajjad, I.A.; Chicco, G. Probabilistic generation of time-coupled aggregate residential demand patterns. IET Gener. Trans. Distrib. 2015. [Google Scholar] [CrossRef]
  31. De Bosio, F.; Luna, A.C.; Ribeiro, L.A.D.S.; Graells, M.; Saavedra, O.R.; Guerrero, J.M. Analysis and improvement of the energy management of an isolated microgrid in Lencois island based on a linear optimization approach. In Proceedings of the ECCE 2016—IEEE Energy Conversion Congress and Exposition, Milwaukee, WI, USA, 18–22 September 2016. [Google Scholar]
  32. Aien, M.; Rashidinejad, M.; Fotuhi-Firuzabad, M. On Possibilistic and Probabilistic Uncertainty Assessment of Power Flow Problem: A Review and a New Approach. Renew. Sustain. Energy Rev. 2014, 37, 883–895. [Google Scholar] [CrossRef]
  33. Borkowska, B. Probabilistic Load Flow. IEEE Trans. Power Appar. Syst. 1974, PAS-93, 752–759. [Google Scholar] [CrossRef]
  34. Nikmehr, N.; Ravadanegh, S.N. A study on optimal power sharing in interconnected microgrids under uncertainty. Int. Trans. Electr. Energy Syst. 2016, 26, 208–232. [Google Scholar] [CrossRef]
  35. Stefopoulos, G.K.; Meliopoulos, A.P.; Cokkinides, G.J. Probabilistic power flow with non-conforming electric loads. Int.J. Electr. Power Energy Syst. 2005, 27, 627–634. [Google Scholar] [CrossRef]
  36. Baziar, A.; Kavousi-Fard, A. Considering uncertainty in the optimal energy management of renewable micro-grids including storage devices. Renew. Energy 2013, 59, 158–166. [Google Scholar] [CrossRef]
  37. Su, C.L. Probabilistic load-flow computation using point estimate method. IEEE Trans. Power Syst. 2005, 20, 1843–1851. [Google Scholar] [CrossRef]
  38. Zhang, P.; Lee, S.T. Probabilistic Load Flow Computation Using the Method of Combined Cumulants and Gram-Charlier Expansion. IEEE Trans. Power Syst. 2004, 19, 676–682. [Google Scholar] [CrossRef]
  39. Schellenberg, A.; Rosehart, W.; Aguado, J. Cumulant-based probabilistic optimal power flow (P-OPF) with Gaussian and Gamma distributions. IEEE Trans. Power Syst. 2005, 20, 773–781. [Google Scholar] [CrossRef]
  40. Soroudi, A.; Amraee, T. Decision making under uncertainty in energy systems: State of the art. Renew. Sustain. Energy Rev. 2013, 28, 376–384. [Google Scholar] [CrossRef]
  41. Hussain, A.; Bui, V.-H.; Kim, H.-M. Robust Optimization-Based Scheduling of Multi-Microgrids Considering Uncertainties. Energies 2016, 9, 278. [Google Scholar] [CrossRef]
  42. Aggarwal, S.K.; Saini, L.M.; Kumar, A. Electricity price forecasting in deregulated markets: A review and evaluation. Int. J. Electr. Power Energy Syst. 2009, 31, 13–22. [Google Scholar] [CrossRef]
  43. Kumbaroglu, G.; Madlener, R. Evaluation of economically optimal retrofit investment options for energy savings in buildings. Energy Build. 2012, 49, 327–334. [Google Scholar] [CrossRef]
  44. Sharma, K.; Bhakar, R.; Tiwari, H.P. Influence of price uncertainty modeling accuracy on bidding strategy of a multi-unit GenCo in electricity markets. Iran. J. Sci. Technol. Trans. Electr. Eng. 2014, 38, 191–203. [Google Scholar] [CrossRef]
  45. Prodan, I.; Zio, E. A model predictive control framework for reliable microgrid energy management. Int. J. Electr. Power Energy Syst. 2014, 61, 399–409. [Google Scholar] [CrossRef]
  46. Nikmehr, N.; Najafi-Ravadanegh, S. Optimal operation of distributed generations in micro-grids under uncertainties in load and renewable power generation using heuristic algorithm. IET Renew. Power Gener. 2015, 9, 982–990. [Google Scholar] [CrossRef]
  47. Bahramirad, S.; Reder, W.; Khodaei, A. Reliability-Constrained Optimal Sizing of Energy Storage System in a Microgrid. IEEE Trans. Smart Grid 2012, 3, 2056–2062. [Google Scholar] [CrossRef]
  48. Sheikhi, A.; Rayati, M.; Bahrami, S.; Ranjbar, A.M. Integrated demand side management game in smart energy hubs. IEEE Trans. Smart Grid 2015, 6, 675–683. [Google Scholar] [CrossRef]
Figure 1. Structure of MCNMG.
Energies 10 01770 g001
Figure 2. Diagram of correlation between input and output carriers and energy prices.
Energies 10 01770 g002
Figure 3. Load profile of MCMGs: Top: Electrical; Bottom: Thermal.
Energies 10 01770 g003
Figure 4. PDF of the electricity price.
Energies 10 01770 g004
Figure 5. Probabilistic modeling of the PV and WT primary input and generated electricity in MCNMG: (a) PV, (b) WT, (c) solar radiation, (d) wind speed.
Energies 10 01770 g005
Figure 6. PDF of the total purchased energy in MCNMG. Top: Electricity; Bottom: Natural gas.
Energies 10 01770 g006
Figure 7. PDF of received heat by each MCMG. Top: MCMG1; Middle: MCMG2, Bottom: MCMG3.
Energies 10 01770 g007
Figure 8. PDF of transferred heat by each MCMG. Top: MCMG1; Middle: MCMG2, Bottom: MCMG3.
Energies 10 01770 g008
Figure 9. PDF of electrical responsive load profile under TOU policy in MCNMG. Top: MCMG1; Middle: MCMG2, Bottom: MCMG3.
Energies 10 01770 g009
Figure 10. PDF of thermal responsive load profile under TOU policy in MCNMG. Top: MCMG1; Middle: MCMG2, Bottom: MCMG3.
Energies 10 01770 g010
Figure 11. PDF of final energy price of electrical responsive load. Top: MCMG1; Middle: MCMG2, Bottom: MCMG3.
Energies 10 01770 g011
Figure 12. PDF of the final energy price of thermal responsive load. Top: MCMG1; Middle: MCMG2, Bottom: MCMG3.
Energies 10 01770 g012
Figure 13. PDF of load factor.
Energies 10 01770 g013
Figure 14. Total cost of MCNMG. Top: PDF; Bottom: CDF.
Energies 10 01770 g014
Table 1. Technical specification of MCNMG’s elements.
ElementMCMG No.Maximum Capacity (KW)Efficiencies (%)Maintenance Coefficient ($/KWh)
el.th.
Transformer1500092-920.002
290-90
390-90
CHP111004040800.00587
21000403070
3900303060
Boiler11700-85850.001
21500-8787
31900-9090
PV1200095-95-
WT2100090-90-
Electrical storage1 to 31/90----
Heat storage1 to 390----
Storage Interface (char, disch)1 to 3−90/90--95, 90-
Table 2. Values of parameters in WT and PV.
WT P r w t = 1000   KW V c i = 2.5   m / s V r = 14   m / s
α = 10 β = 2 V c o = 25   m / s
PV P r p v = 2000   KW R c e = 150   w / m 2 R S T D = 1000   w / m 2
Table 3. Statistical analysis of powers and O & M costs.
MCMG No.Unit TypeMean Value of Power (KW)STD of Power (KW)Skewness of PowerTotal Mean Value of O&M Cost ($)Total STD of O & M Cost ($)Skewness of O & M Cost
MCMG1CHPe11000-95.729.60730.2331
h11004.19676 × 10−140.9570
Transformer73.2904149.2682.2309
PV844.965430.9720.2112
Boiler101.601209.7872.5186
Electrical storage45.416344.1210.0056
Heat storage54.17343.6273−0.4159
Sold electricity307.161325.4590.8876
MCMG2CHPe898.908297.075−2.6617181.0837.00013−0.4125
h674.181222.806−2.6617
Transformer693.105326.0292.1953
Boiler1410.3126.403−1.3977
WT11.0089.460230.5919
Electrical storage37.31243.7840.3744
Heat storage51.344644.252−0.2832
Sold electricity000
MCMG3CHPe00-121.1430.8530930.0336
h00-
Transformer1784.01113.948−0.1443
Boiler19000-
Electrical storage44.43244.53170.0480
Heat storage55.621543.3282−0.4857
Sold electricity000
Table 4. Total heat wastage.
Before Trade in MCNMGAfter Trade in MCNMG
MeanSTDSkewnessMeanSTDSkewness
Heat wastage (KW)67.59821.1384611.28436.461961.5405412.4334
Total cost ($)22,016.3606.951−0.365221,734.6608.727−0.1462
Table 5. Responsive load participation analysis.
Responsive Load Participation10% of Total Load30% of Total Load
MeanSTDSkewnessMeanSTDSkewness
LF0.8280940.0145232−0.46890.8350280.0148382−0.4308
Total cost ($)21876.3606.951−0.365221584.3622.571−0.3357

