Human Thermal Comfort and Heat Removal Efficiency for Ventilation Variants in Passenger Cars


Abstract
:1. Introduction
2. Numerical Simulation
2.1. Solver and Numerical Details of Solar Load
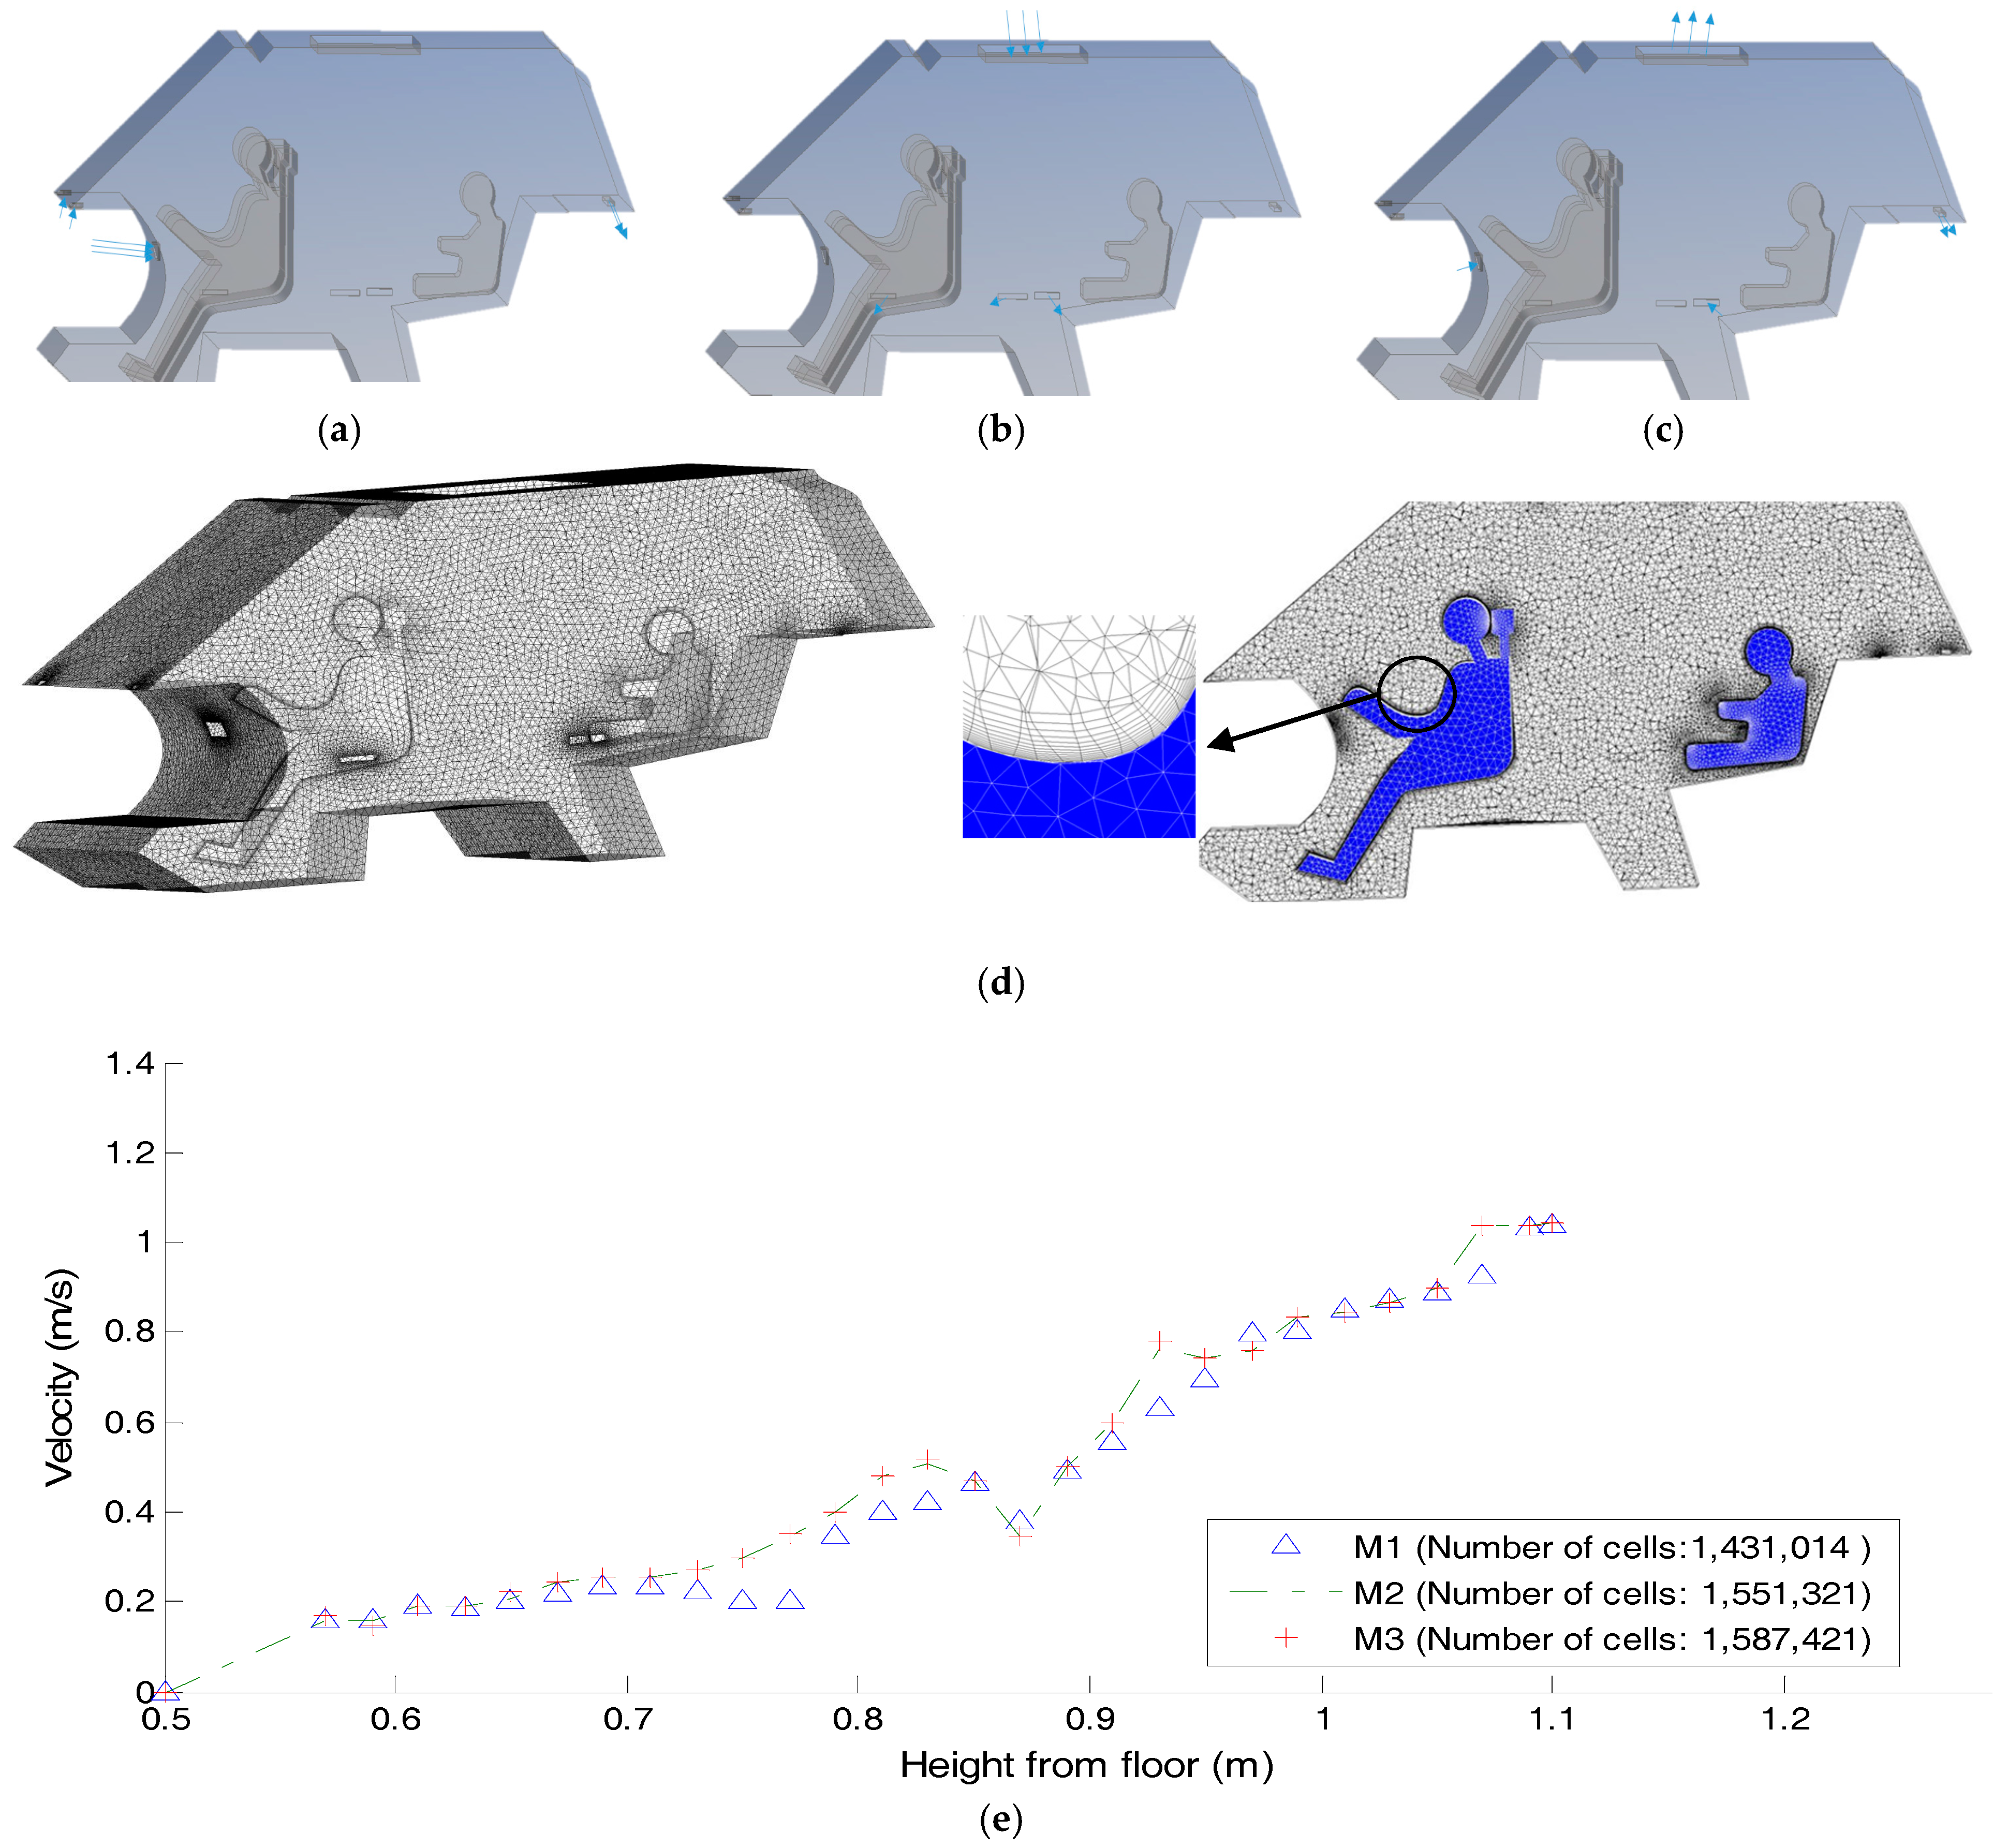
2.2. Cabin Geometry
2.3. Calculation Conditions
2.4. Heat Removal Efficiency
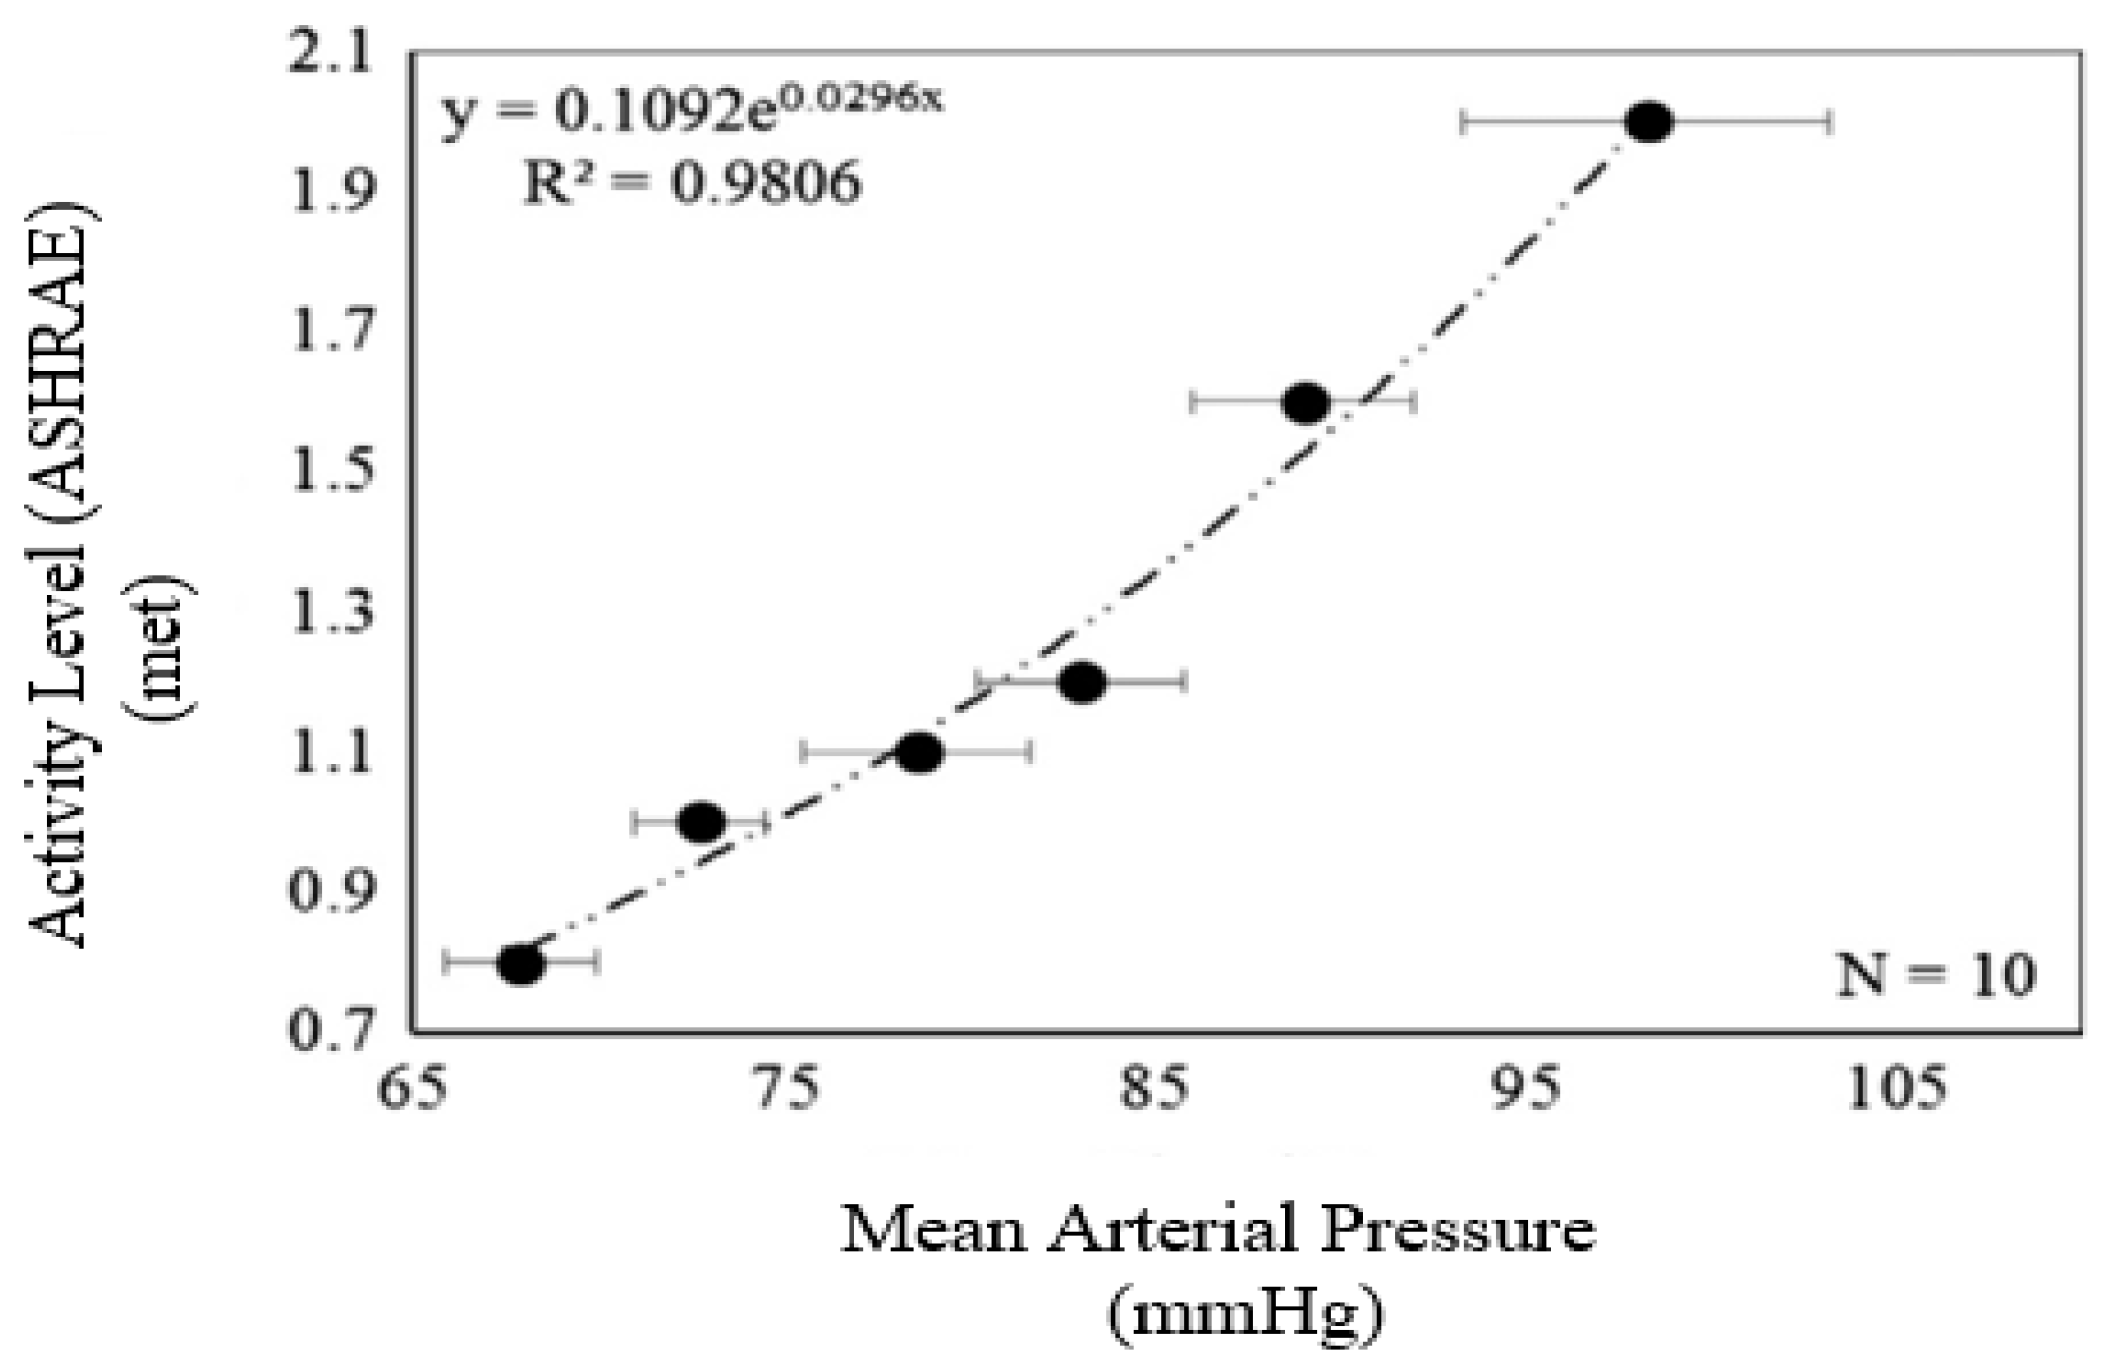
2.5. Fanger’s Thermal Comfort Model with Mean Blood Pressure as Biomarker
- W = Effective mechanical power (W/m2)
- pa = Water vapor partial pressure (Pa)
- ta = Air temperature (°C)
- Icl = Clothing insulation (m2 K/W)
- fcl = Clothing surface area factor
- hc = Convective heat transfer coefficient (W/m2 K)
- tcl = Clothing surface temperature (°C)
3. Results and Discussion
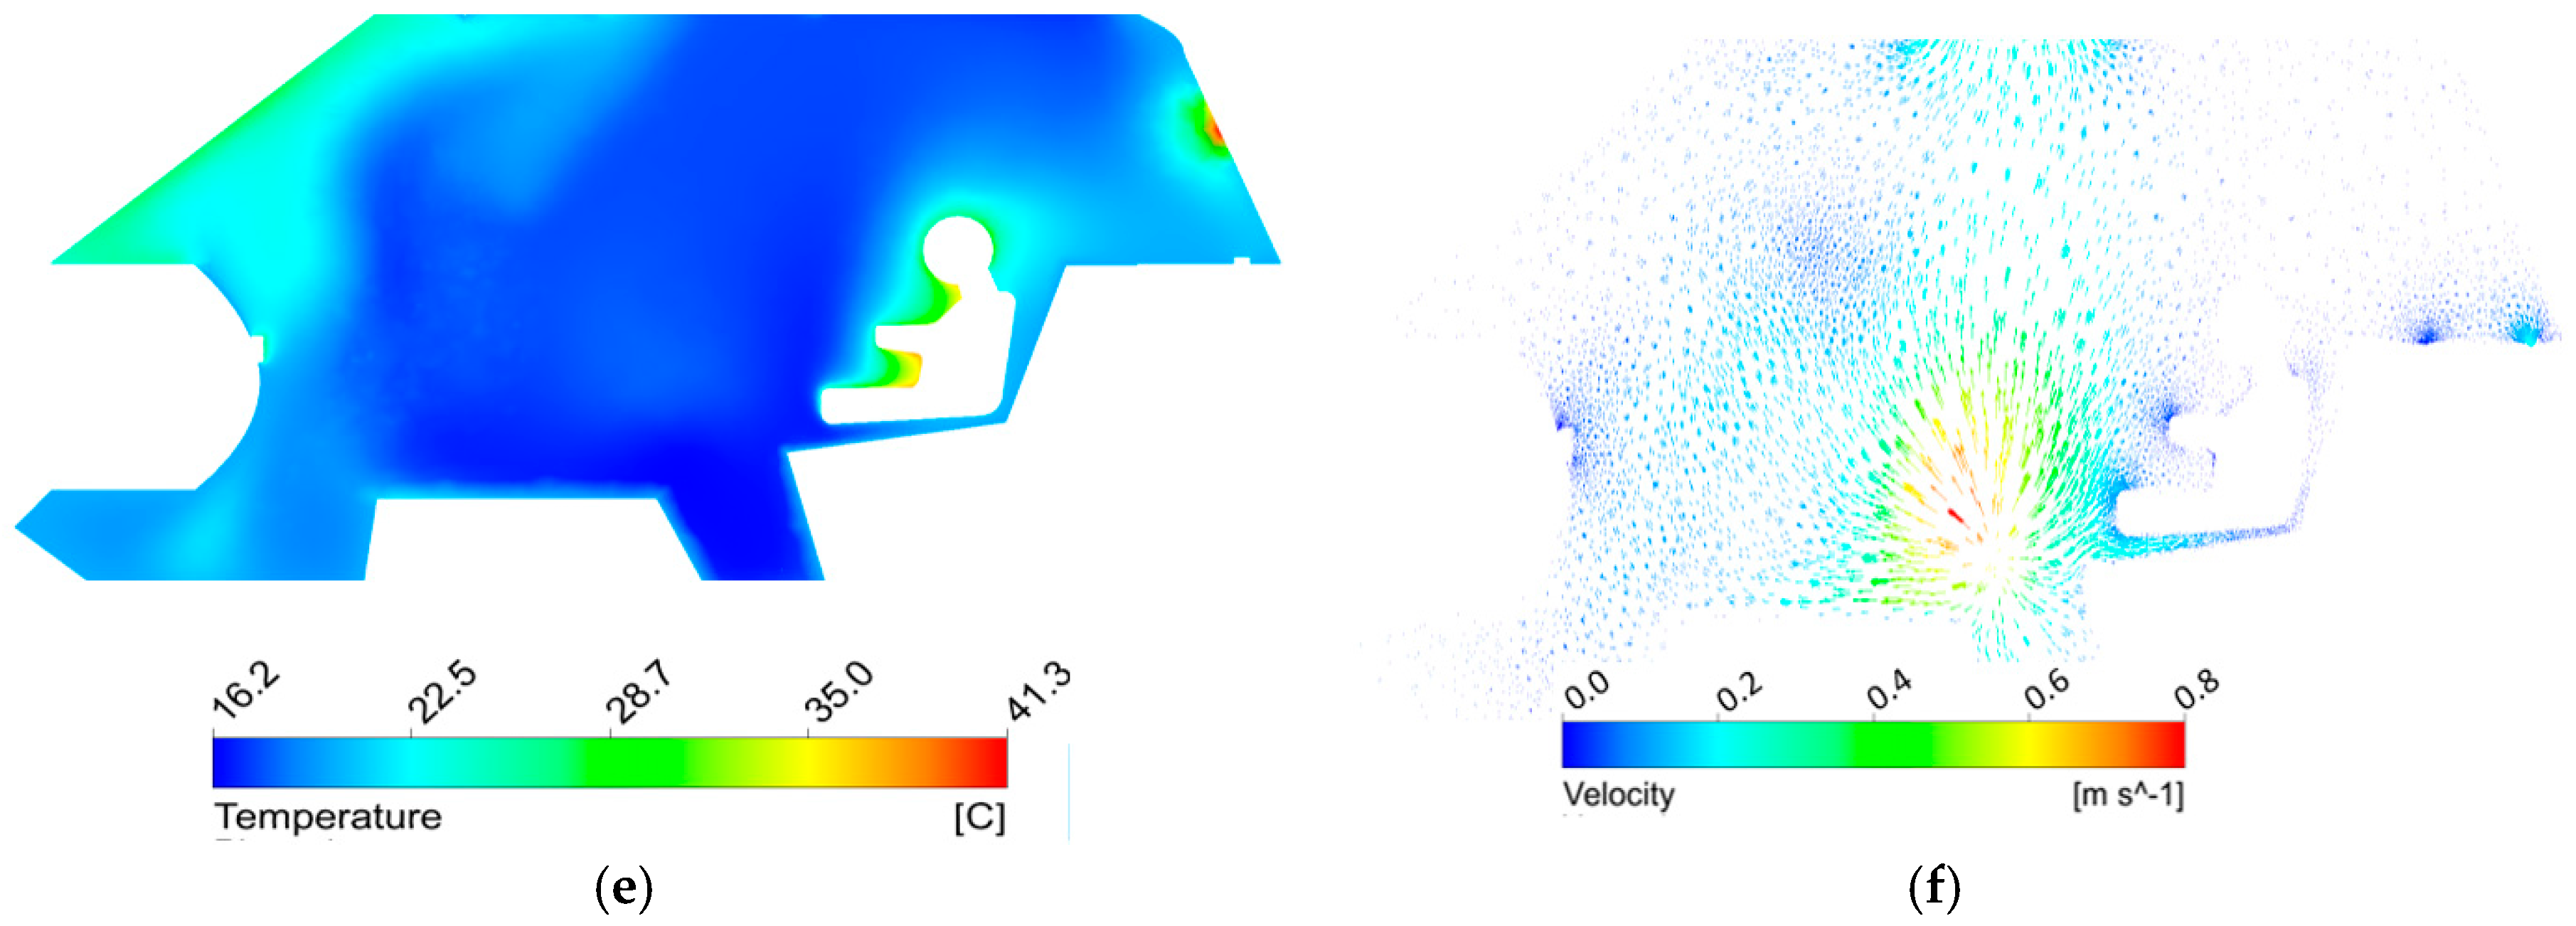
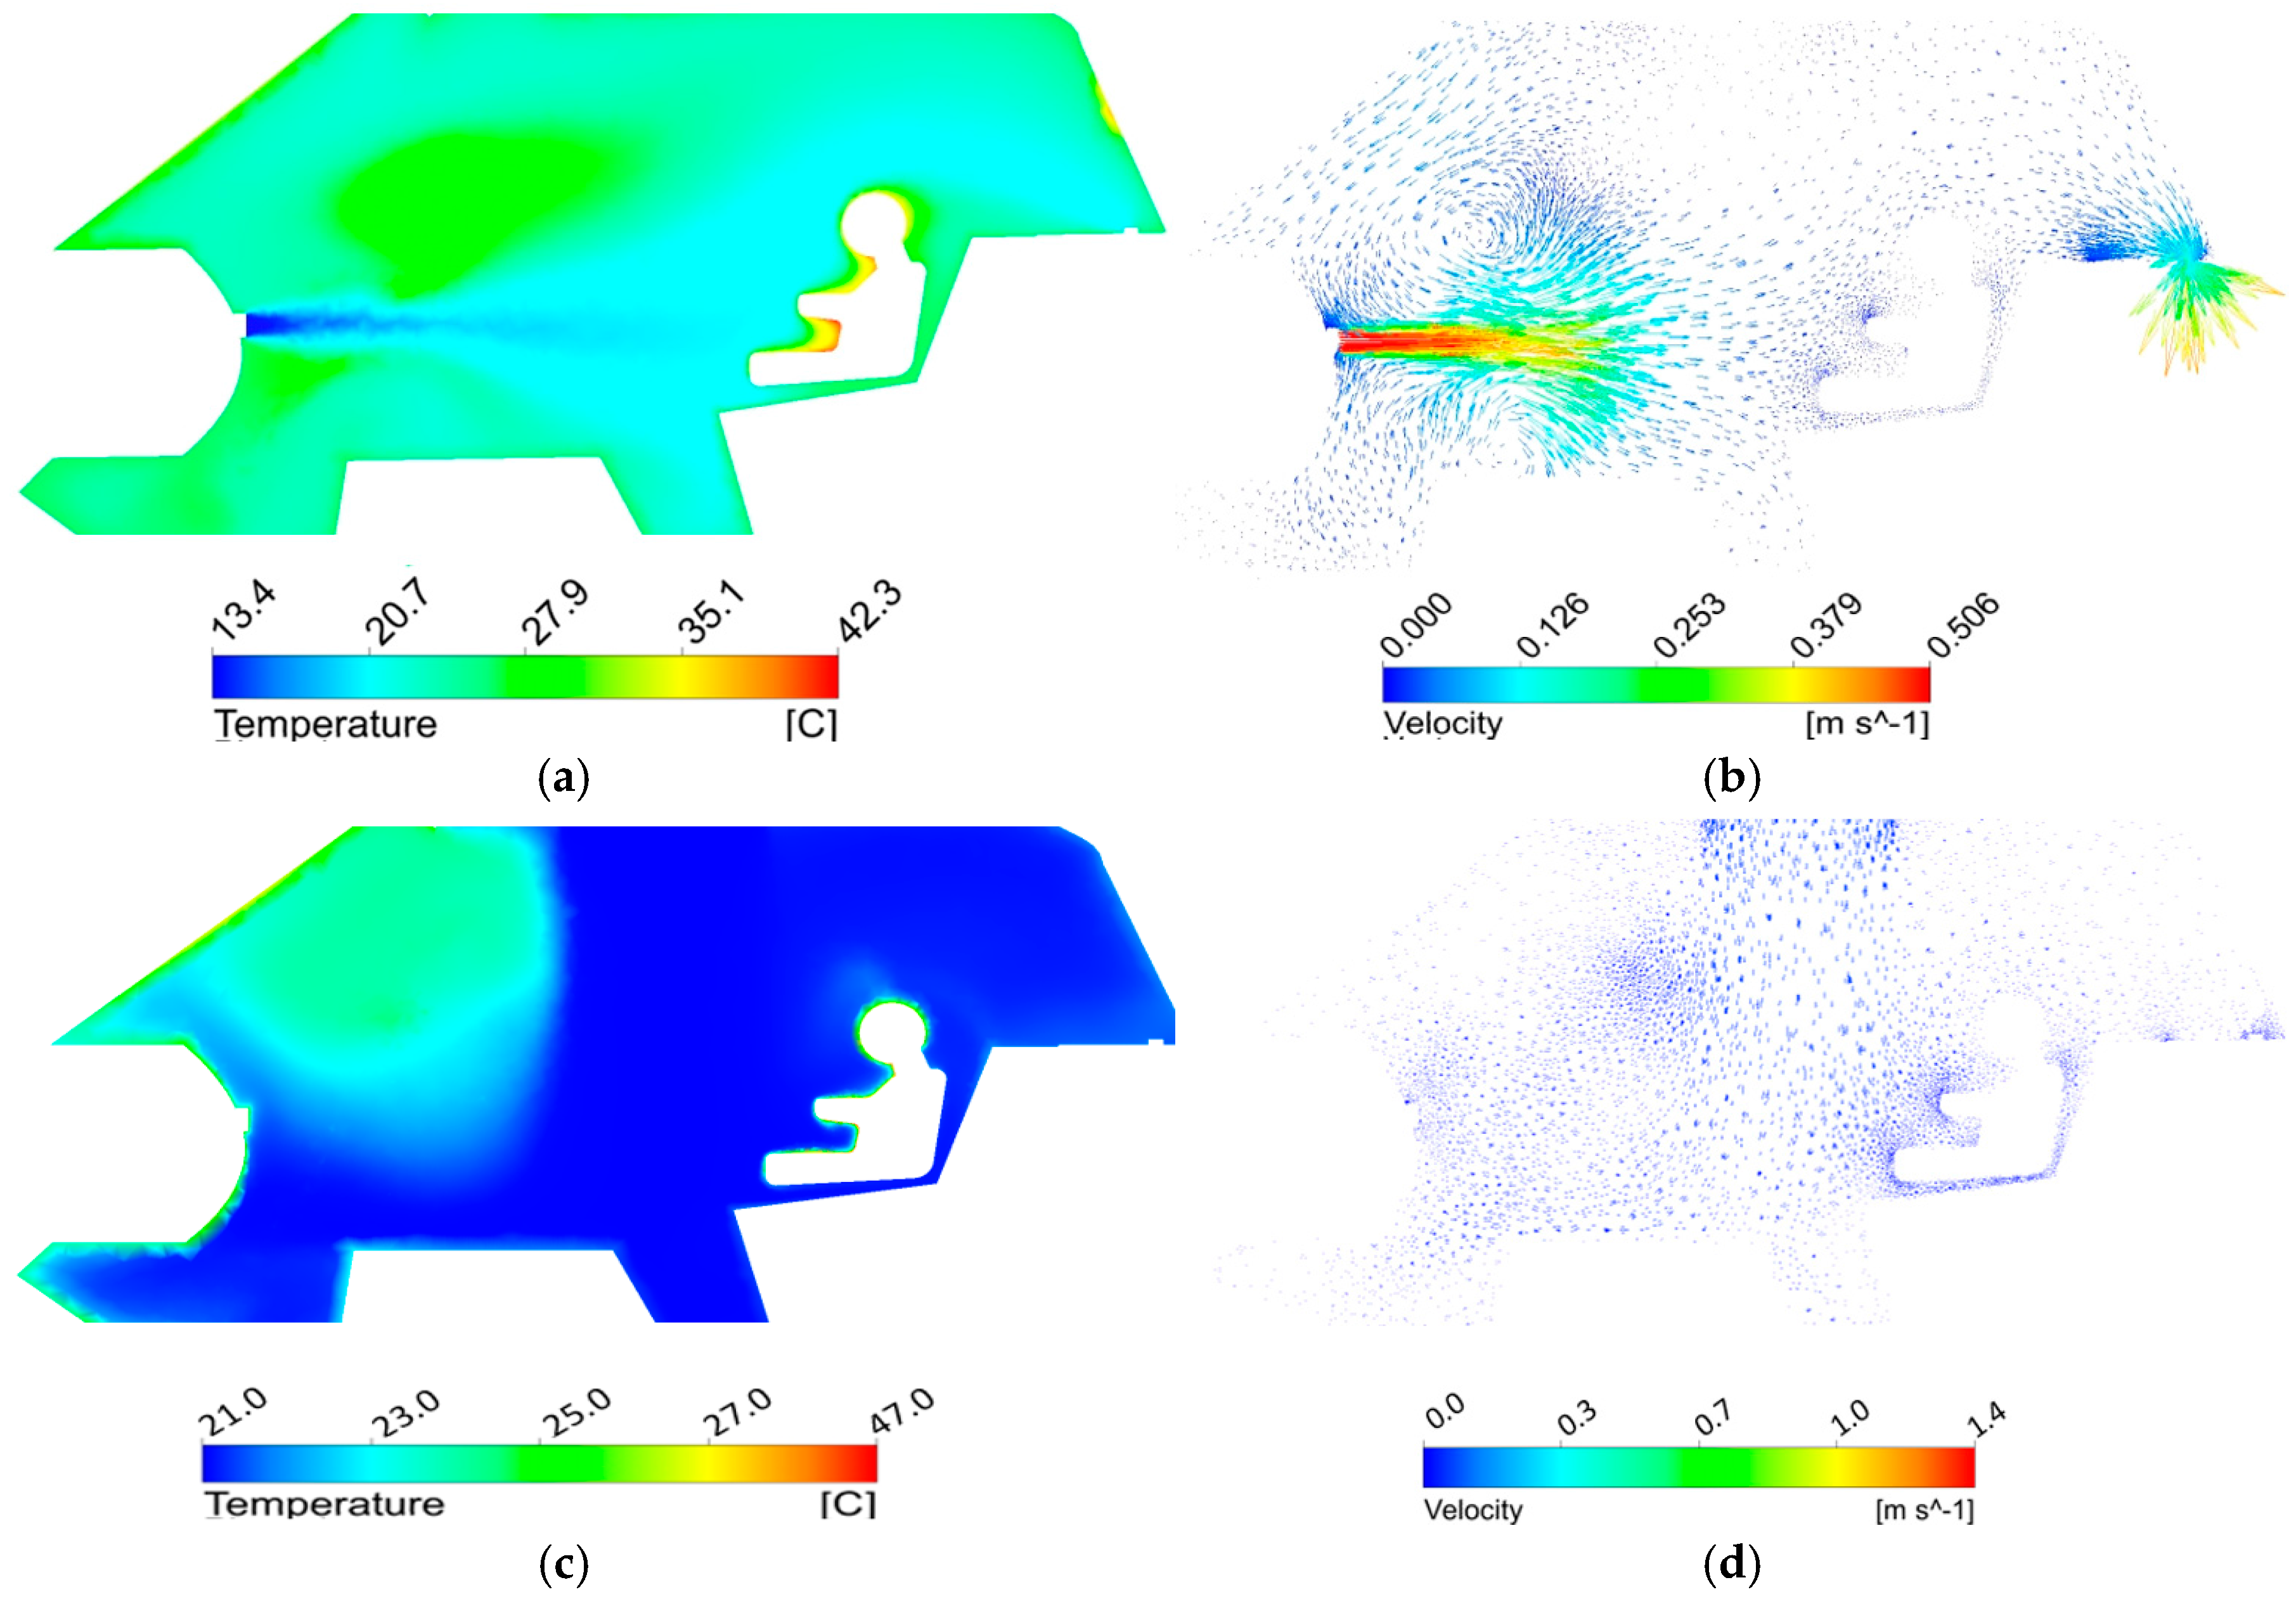
3.1. Computed Temperature and Velocity Flow Fields
3.2. Heat Removal Efficiency for Novel Schemes
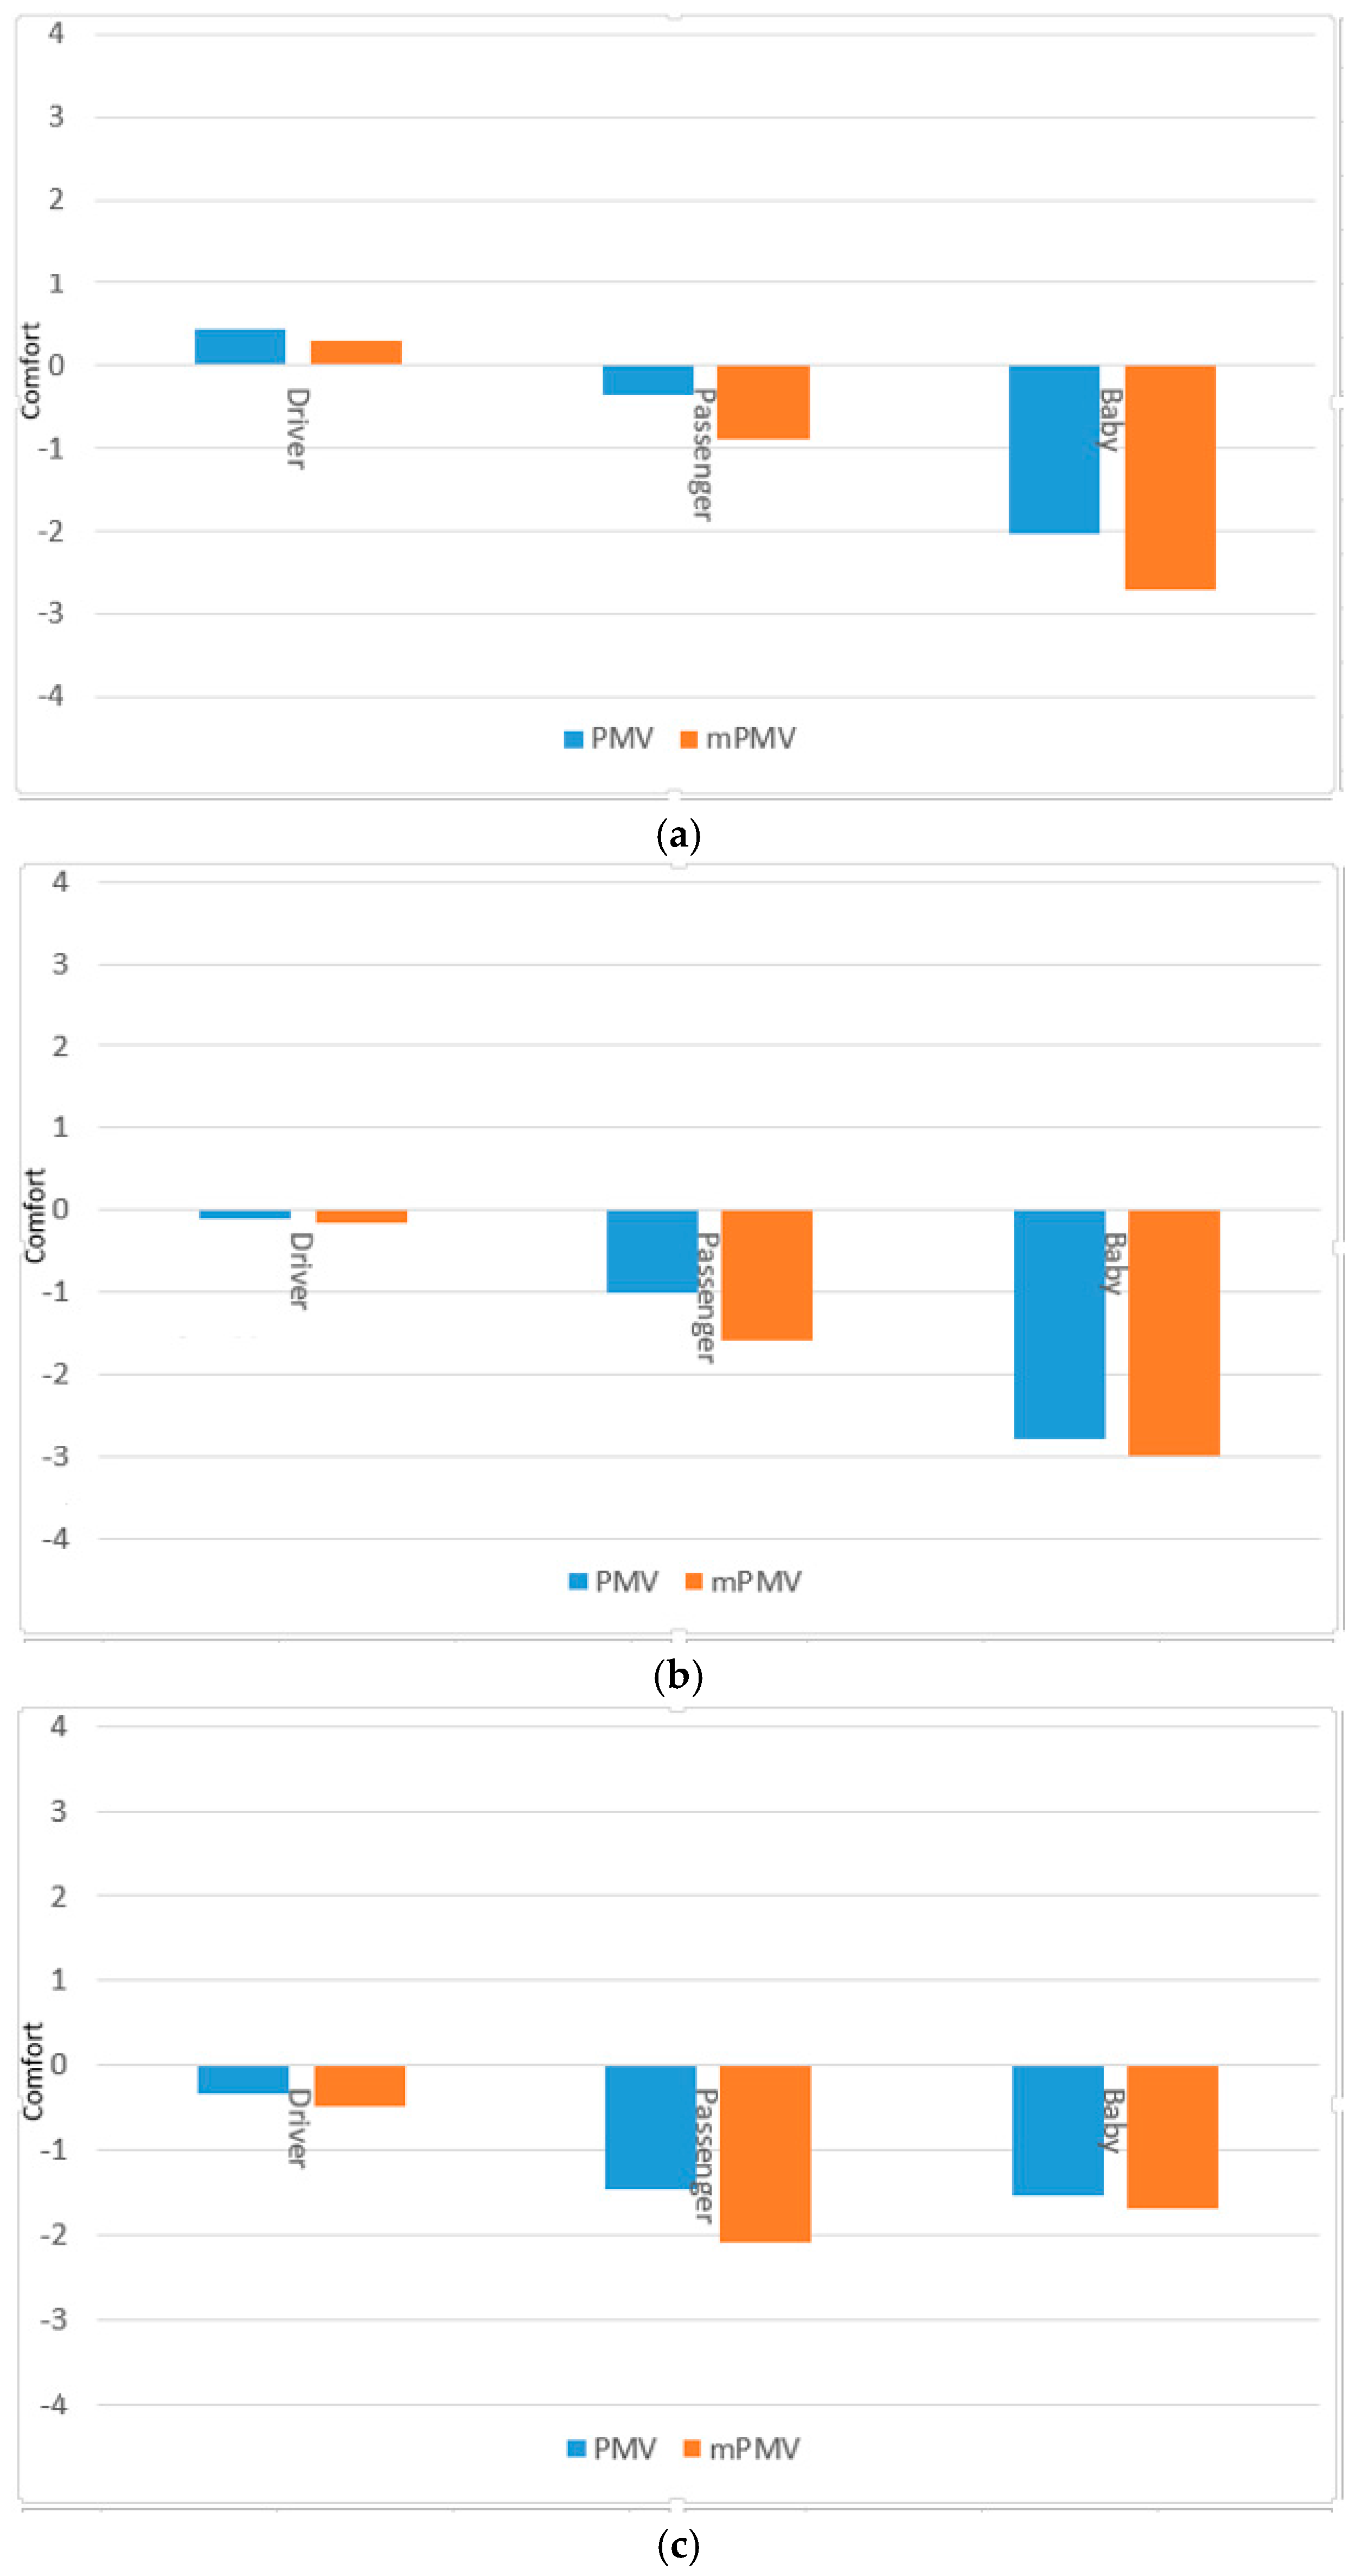
3.3. Comfort Predictions
4. Conclusions
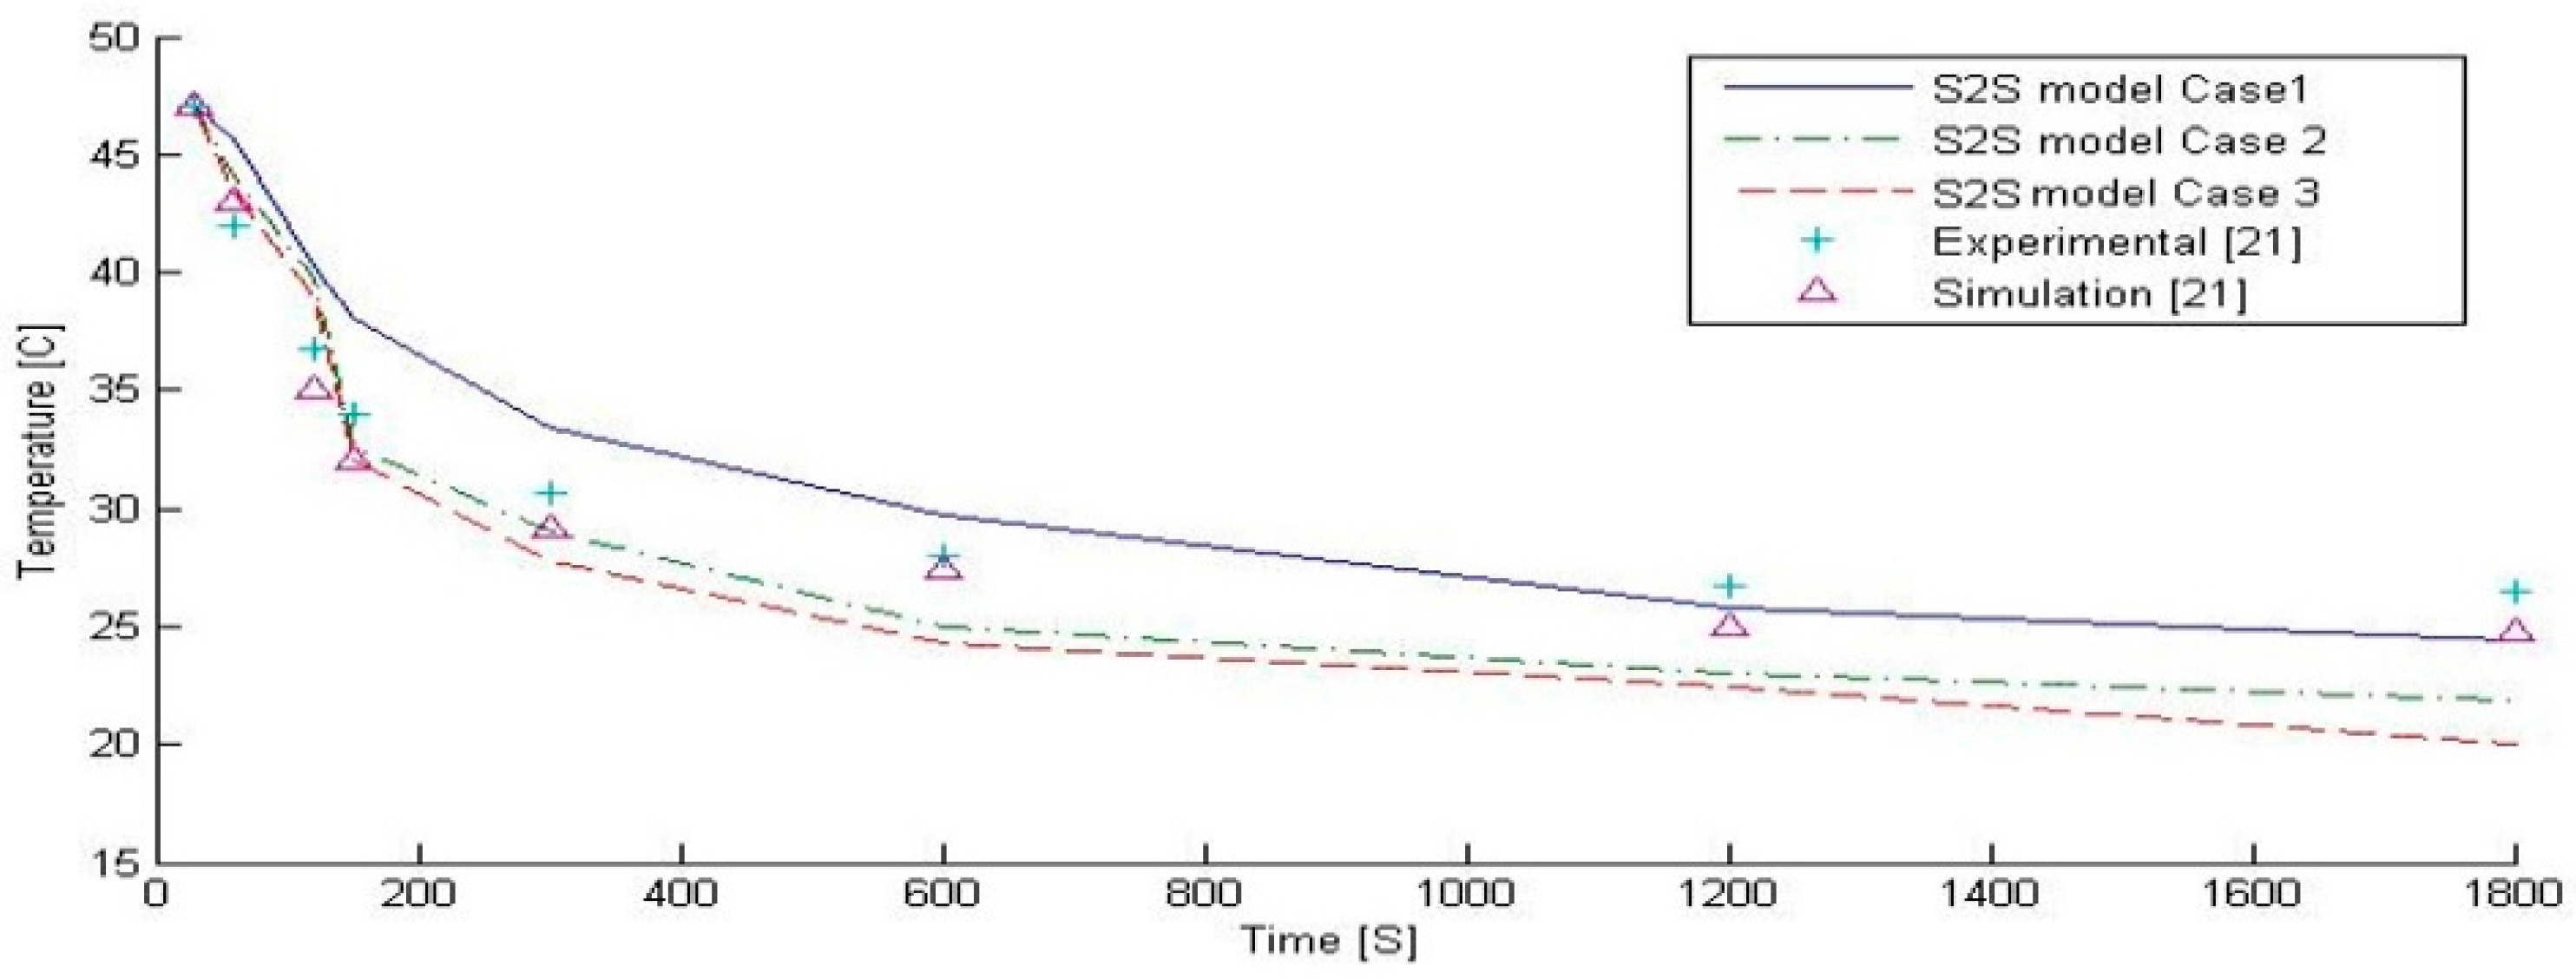
- The numerical predictions discussed above are based on the standard k–ε model, as well as surface-to-surface radiation model for transient conditions. The results of the numerical simulations showed that human thermal comfort in the passenger car cabin and energy efficiency is influenced by the applied ventilation variant.
- Modified Fanger’s model, which is developed by the estimation approach of activity level stated as per ASHRAE standard 55 provides results with 20% improvement for thermal sensation. Thermal comfort is predicted for each ventilation scheme for 30 min of cooling based on the length of majority of car trips.
- An effort has been made to numerically predict the comfort zone for a child in the rear compartment of the cabin. The estimated mean vote values from the standard Fanger’s and modified Fanger’s models for a child lie in a slightly uncomfortable zone; furthermore, a full-scale review is required for deriving a child’s comfort zone, as well as the possible reasons that can cause fatalities in infants.
- The alternative ventilation strategies were evaluated for HRE as well as the thermal comfort. For case 3, the airflow was more homogenous, and the predicted values for a child were within the comfort zone.
Author Contributions
Conflicts of Interest
Nomenclature
| A | Apparent solar irradiation (W/m2) |
| B | Atmospheric extinction coefficient (m) |
| β | Solar altitude |
| Edn | Normal direct irradiation |
| M | Metabolic rate (W/m2) |
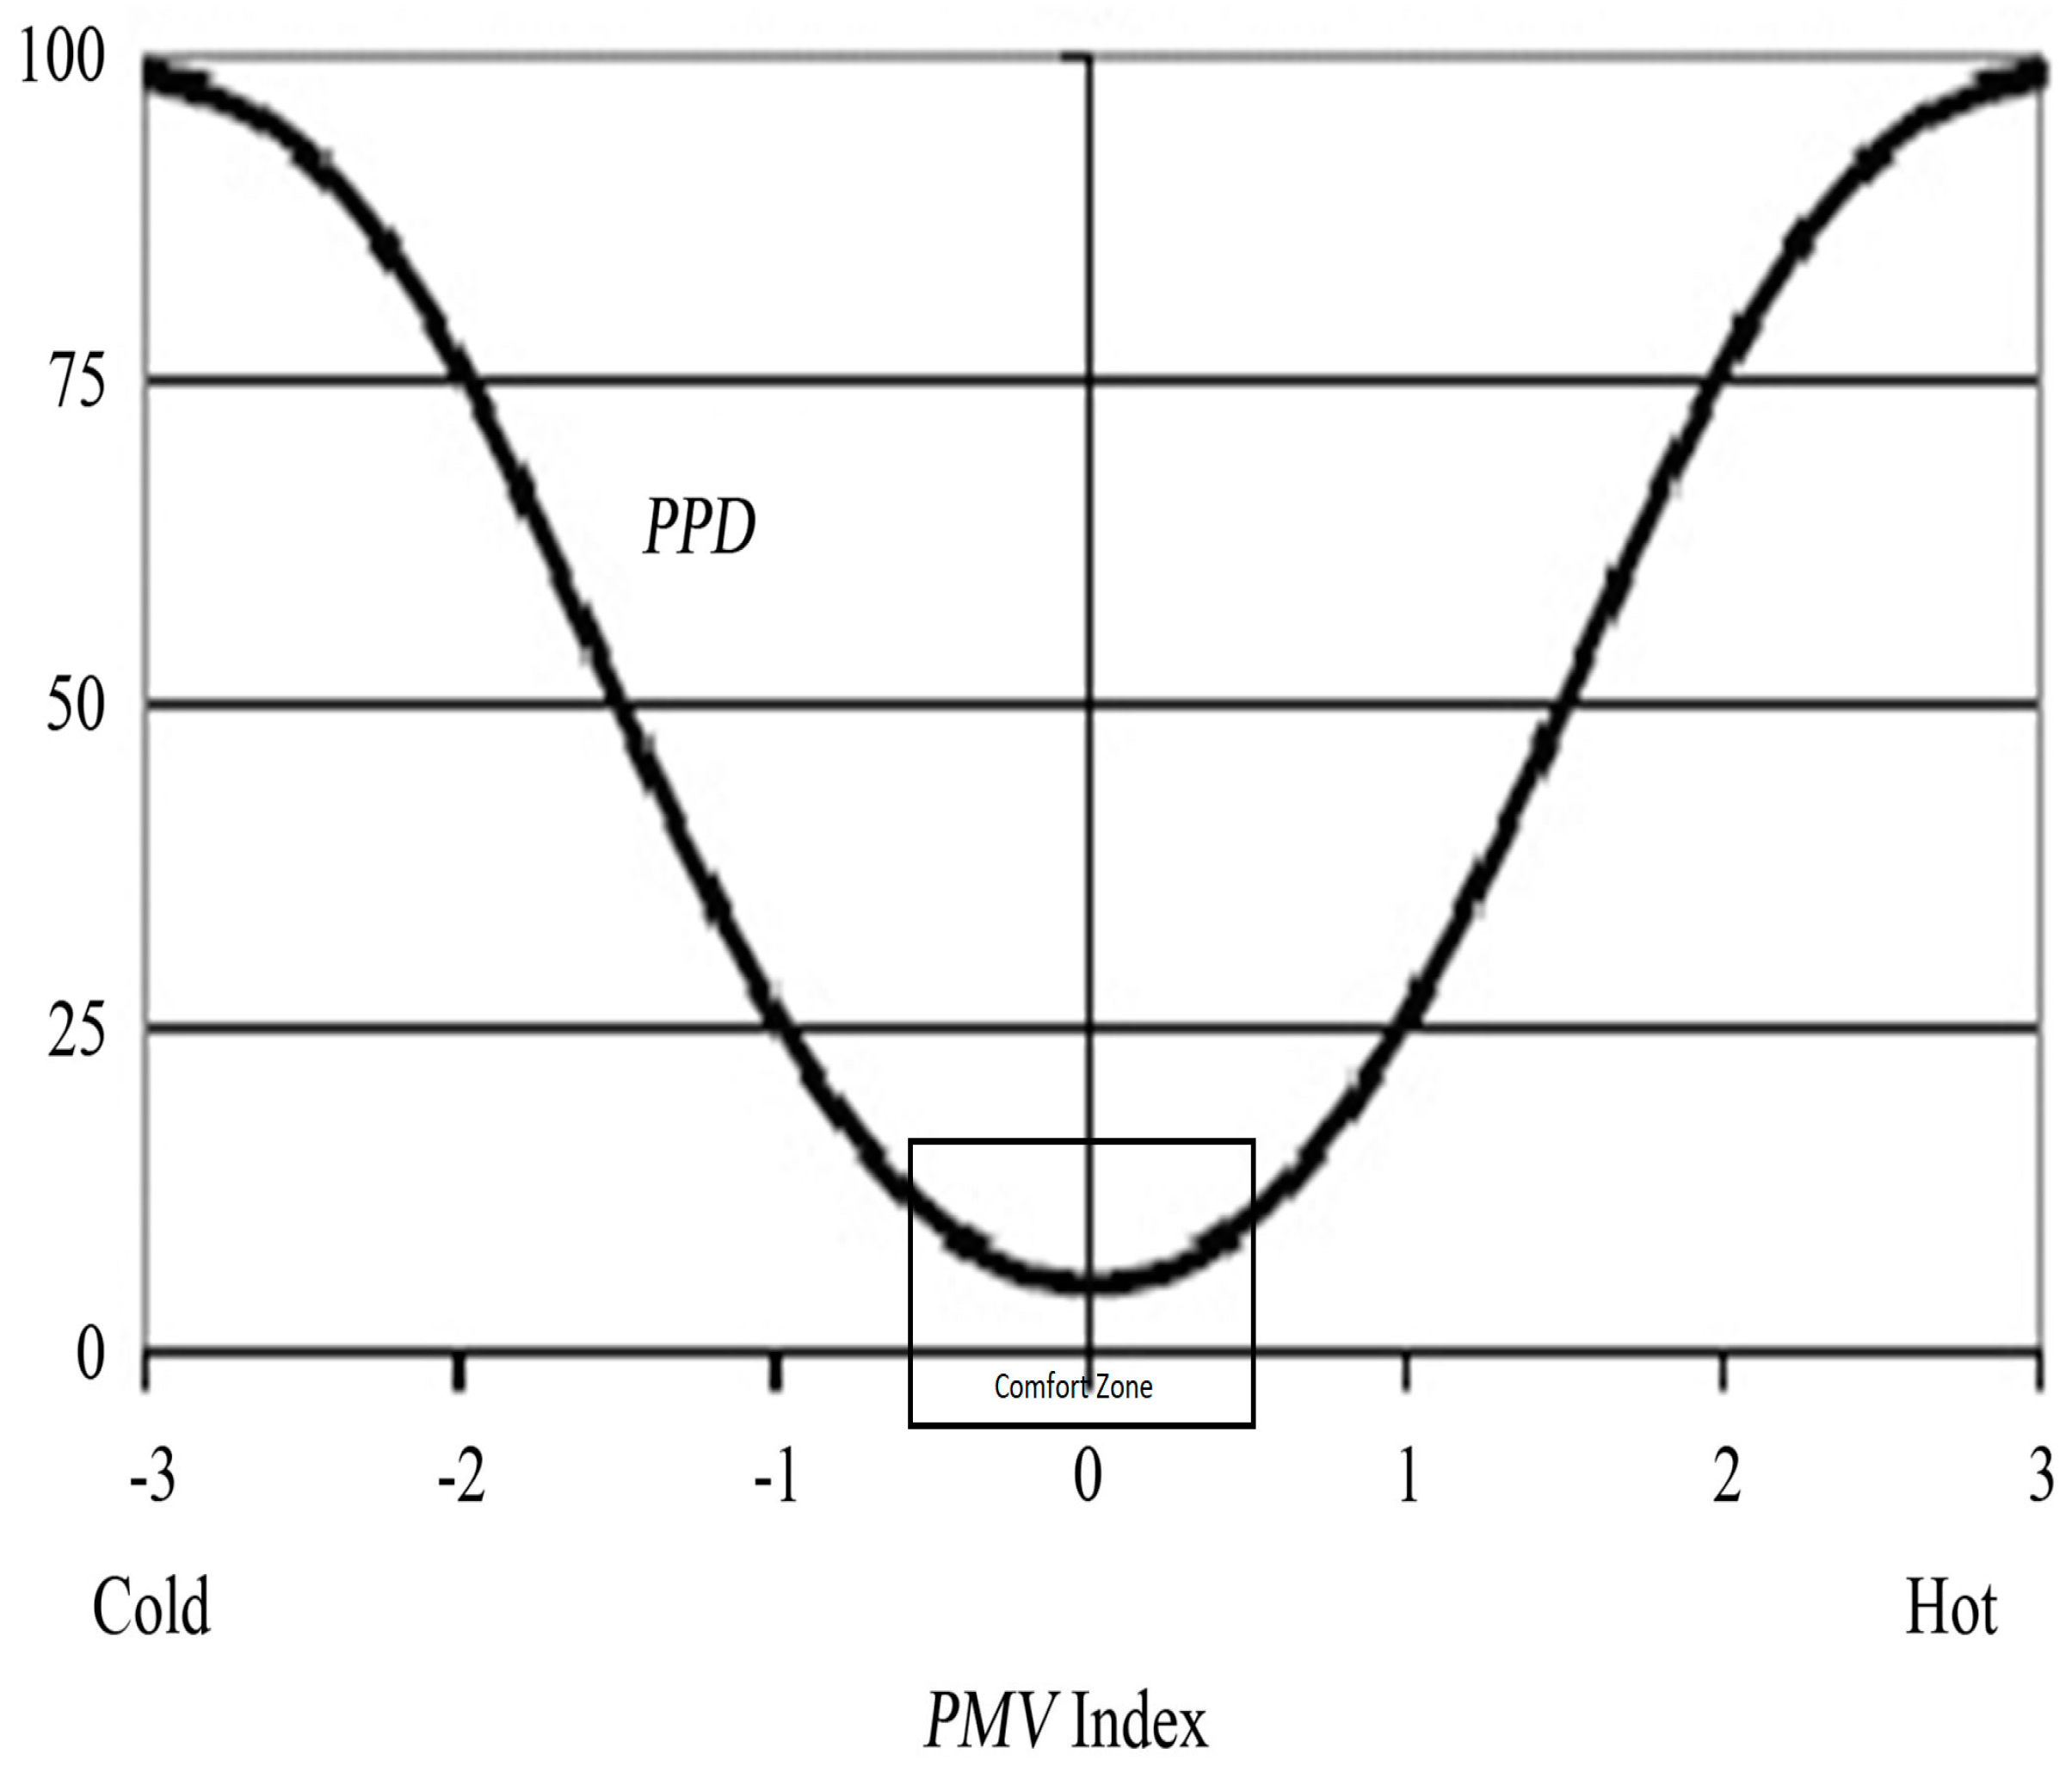
| PMV | Predicted mean vote |
| PPD | Predicted percentage dissatisfaction |
| HRE | Heat removal efficiency |
| MAP | Mean arterial pressure |
| S2S | Surface to surface |
| GID | Grid independent test |
| W | Effective mechanical power (W/m2) |
| pa | Water vapor partial pressure (Pa) |
| ta | Air temperature (°C) |
| Icl | Clothing insulation (m2 K/W) |
| tr | Mean radiant temperature (°C) |
| ti | Surface temperature of immediate surface i |
| Fp-i | View factor between the person and surface i |
| hc | Convective heat transfer coefficient (W/m2 K) |
| fcl | Clothing surface area factor |
| tcl | Clothing surface temperature (°C) |
| va | Relative air velocity (m/s) |
| tin | Inlet temperature (°C) |
| tcabin | Mean temperature of cabin (°C) |
| texit | Outlet temperature (°C) |
References
- American Society of Heating, Refrigerating and Air Conditioning Engineers (ASHRAE). ASHRAE Standard 55-2013 Thermal Environmental Conditions for Human Occupancy; Ashrae: New York, NY, USA, 2013. [Google Scholar]
- Aliahmadipour, M.; Abdolzadeh, M.; Lari, K. Air flow simulation of HVAC system in compartment of a passenger coach. Appl. Therm. Eng. 2017, 123, 973–990. [Google Scholar] [CrossRef]
- Fišer, J.; Jícha, M. Impact of air distribution system on quality of ventilation in small aircraft cabin. Build. Environ. 2013, 69, 171–182. [Google Scholar] [CrossRef]
- Suárez, C.; Iranzo, A.; Salva, J.; Tapia, E.; Barea, G.; Guerra, J. Parametric Investigation Using Computational Fluid Dynamics of the HVAC Air Distribution in a Railway Vehicle for Representative Weather and Operating Conditions. Energies 2017, 10, 1074. [Google Scholar] [CrossRef]
- Zhu, S.; Demokritou, P.; Spengler, J. Experimental and numerical investigation of micro-environmental conditions in public transportation buses. Build. Environ. 2010, 45, 2077–2088. [Google Scholar] [CrossRef]
- Fojtlín, M.; Fišer, J.; Pokorný, J.; Povalač, A.; Urbanec, T.; Jícha, M. An innovative HVAC control system: Implementation and testing in a vehicular cabin. J. Therm. Biol. 2017. [Google Scholar] [CrossRef]
- Shin, Y.; Im, G.; Yu, K.; Cho, H. Experimental study on the change in driver’s physiological signals in automobile HVAC system under Full load condition. Appl. Therm. Eng. 2017, 112, 1213–1222. [Google Scholar] [CrossRef]
- Alahmer, A.; Mayyas, A.; Mayyas, A.A.; Omar, M.A.; Shan, D. Vehicular thermal comfort models; A comprehensive review. Appl. Therm. Eng. 2011, 31, 995–1002. [Google Scholar] [CrossRef]
- Alahmer, A.; Omar, M. Vehicular Cabins’ Thermal Comfort Zones—Fanger and Berkley Modeling. Veh. Eng. 2013, 1, 19–32. [Google Scholar]
- Hepokoski, M.; Curran, A.; Schwenn, T. A Comparison of Physiology-Based Metrics to Environment-Based Metrics for Evaluating Thermal Comfort. SAE Tech. Pap. 2013. [Google Scholar] [CrossRef]
- Wan, J.W.; van der Kooi, J. Influence of the position of supply and exhaust openings on comfort in a passenger vehicle. Int. J. Veh. Des. 1991, 12, 588–597. [Google Scholar]
- Feldmann, D.; Wagner, C. New Results in Numerical and Experimental Fluid Mechanics VIII; Springer: Berlin, Germany, 2013; Volume 121. [Google Scholar]
- Pawar, S.; Gade, U.R.; Dixit, A.; Tadigadapa, S.B.; Jaybhay, S. Evaluation of Cabin Comfort in Air Conditioned Buses Using CFD. SAE Tech. Pap. 2014. [Google Scholar] [CrossRef]
- Vartires, A.; Dogeanu, A.; Danca, P. The human thermal comfort evaluation inside the passenger compartment. In Proceedings of the International Multidisciplinary Scientific GeoConferences (SGEM), Albena, Bulgaria, 18–24 June 2015; Volume 1, pp. 1113–1120. [Google Scholar]
- Foda, E.; Sirén, K. Evaluating the thermal comfort performance of heating systems using a thermal manikin with human thermoregulatory control. Indoor Built Environ. 2016, 25, 191–202. [Google Scholar] [CrossRef]
- Simion, M.; Socaciu, L.; Unguresan, P. Factors which Influence the Thermal Comfort Inside of Vehicles. Energy Procedia 2016, 85, 472–480. [Google Scholar] [CrossRef]
- Scutti, S. Hot Car Deaths Reach Record Numbers in July. CNN 3 August 2017. Available online: http://edition.cnn.com/2017/08/01/health/hot-car-deaths/index.html (accessed on 25 October 2017).
- ISO 7730:2005 Ergonomics of the Thermal Environment Analytical Determination and Interpretation of Thermal Comfort Using Calculation of the PMV and PPD Indices and Local Thermal Comfort Criteria; International Organization for Standardization: Vernier, Switzerland, 2005.
- ISO 14505-2:2006 Ergonomics of the Thermal Environment-Evaluation of Thermal Environments in Vehicles-Part 2: Determination of Equivalent Temperature; International Organization for Standardization: Vernier, Switzerland, 2006.
- Gilani, S.I.U.H.; Khan, M.H.; Ali, M. Revisiting Fanger’s thermal comfort model using mean blood pressure as a bio-marker: An experimental investigation. Appl. Therm. Eng. 2016, 109, 35–43. [Google Scholar] [CrossRef]
- Sevilgen, G.; Kilic, M. Investigation of transient cooling of an automobile cabin with a virtual manikin under solar radiation. Therm. Sci. 2013, 17, 397–406. [Google Scholar] [CrossRef]
- Fojtlín, M.; Pokorný, J.; Fišer, J.; Toma, R.; Tuhovþák, J. Impact of measurable physical phenomena on contact thermal comfort. EPJ Web Conf. 2017, 143. [Google Scholar] [CrossRef]
- Garcia-Souto, M.D.P.; Dabnichki, P. Core and local skin temperature: 3–24 months old toddlers and comparison to adults. Build. Environ. 2016, 104, 286–295. [Google Scholar] [CrossRef]
- Baskovic, U.Z.; Lorenz, M.; Butala, V. Adiabatic flow simulation in an air-conditioned vehicle passenger compartment. Int. J. Simul. Model. 2014, 13, 42–53. [Google Scholar] [CrossRef]
- Kliegman, R.M.; Stanton, B.M.D.; Geme, J.S.; Schor, N.F. Nelson Textbook of Pediatrics; Elsevier: Phialdelphia, PA, USA, 2015; p. 3408. [Google Scholar]
- Han, T.; Huang, L. A model for relating a thermal comfort scale to EHT comfort INDEX. SAE Tech. Pap. 2004. [Google Scholar] [CrossRef]


| Solar Load | Model |
|---|---|
| Solar radiation algorithm | Solar ray-tracing algorithm |
| Radiation model | S2S model with view factor |
| Solar irradiation | 875 W/m2 |
| Object | Material Name | Thermal Conductivity (W/m2 K) | Density (kg/m3) | Specific Heat (J/kg K) |
|---|---|---|---|---|
| Driver and passenger | Skin | 0.21 | 1000 | 3770 |
| Seat | Polyurethane foam | 0.05 | 70 | 1685.60 |
| Windshield/front & rear glass | Glass | 1.171 | 2529.5 | 754 |
| Rear & dash board | ABS plastic | 2.7 | 996.3 | 1480.6 |
| Case No. | Cabin Mean Temperature | Heat Removal Efficiency |
|---|---|---|
| Case 1 | 24.42 °C | 0.51 |
| Case 2 | 21.85 °C | 0.48 |
| Case 3 | 19.95 °C | 046 |
© 2017 by the authors. Licensee MDPI, Basel, Switzerland. This article is an open access article distributed under the terms and conditions of the Creative Commons Attribution (CC BY) license (http://creativecommons.org/licenses/by/4.0/).
Share and Cite
Khatoon, S.; Kim, M.-H. Human Thermal Comfort and Heat Removal Efficiency for Ventilation Variants in Passenger Cars. Energies 2017, 10, 1710. https://doi.org/10.3390/en10111710
Khatoon S, Kim M-H. Human Thermal Comfort and Heat Removal Efficiency for Ventilation Variants in Passenger Cars. Energies. 2017; 10(11):1710. https://doi.org/10.3390/en10111710
Chicago/Turabian StyleKhatoon, Saboora, and Man-Hoe Kim. 2017. "Human Thermal Comfort and Heat Removal Efficiency for Ventilation Variants in Passenger Cars" Energies 10, no. 11: 1710. https://doi.org/10.3390/en10111710