1. Introduction
The Finnish government has taken the initiative to increase renewable energy production, to satisfy half of the national power consumption by 2030 [
1]. Photo-Voltaic (PV) systems, one of the main sources of green energy, are inherently distributed and about 70% of their capacity in Europe is integrated into low voltage (LV) networks [
2]. Moreover, the feed-in tariff scheme introduced, will further increase PV penetration into the LV distribution system and the primary function of LV networks, i.e., electrical energy distribution, will therefore be reverted.
Reverse power flow is implicit during the high generation periods of PVs. Previously, various impact studies of the distributed generation (DG) on distribution network constraints have been conducted and the common problem, associated with PV hosting capacity enhancement, is voltage rise [
3,
4]. Unequal distribution of PV on different phases can introduce negative-sequence unbalance [
5]. Furthermore, Distribution Network Operators (DNOs) also have to critically review the loading constraints of the network—for instance, transformer loading and cable ampacity—before deciding on PV inclusion.
The PV hosting capacity is defined as the maximum penetration of PV that can be tolerated by the distribution systems without violating the constraints of the network [
6]. Hosting capacity identification of a particular distribution system helps utilities to make decisions related to PV inclusion in a timely and reliable manner. Various studies have been performed, utilizing different methods for maximizing PV penetration in distribution systems. The single line network simulation of distribution network was employed in [
7], where voltage profile violation was the deciding constraint of PV hosting capacity. This simplification of a three-phase network to a single line gives justifiable results for MV distribution networks but not for LV networks, where unbalanced phase loading and PV connections greatly affect the power quality constraints of the distribution network. In [
8], PV penetration maximization was simulated on a 9-bus feeder system, in which the PV were attached at the end of the network. This evaluation disregarded the distributed nature of PV and has limited application. Different scenarios were studied in [
9] for PV hosting capacity increment, while observing the limitations on voltage value and transformer capacity constraints. This case study only considered the extreme cases, i.e., integration of PV systems at the start and end of the feeder. Moreover, hosting capacity studies in the rural distribution networks, which were performed in [
10,
11], utilized the active and reactive power controls of the network and the enhancement of the voltage band with the on-load tap changer (OLTC). In addition, using the voltage control methods, Walling et al. [
2] defined the concept of a critical length of feeder that imposes restrictions on voltage value and cable thermal limits with an increasing PV penetration.
In the papers reviewed, the performance index utilized for the determination of PV hosting capacity was mainly voltage value criteria. In [
12,
13], thermal limits of conductors were taken to be one of the network constraints, while the transformer capacity was the performance factor considered in [
14,
15]. Moreover, voltage unbalance was used as a performance constraint in [
7,
16]. To model the unpredictability of the size and position of the load and PVs, Monte Carlo based studies of PV hosting capacity were performed in [
17,
18,
19,
20]. In [
17], different scenarios, like PV location, voltage regulator existence and power factor of PV inverter, were exploited to thoroughly measure their effects on the hosting capacity. The work was further extended in [
18] and the sensitivity of the hosting capacity to the feeder and PV system characteristics were analyzed and optimized control of all the actors in the distribution system was defined, to maximize PV penetration. In [
19,
20], same multi-scenario based hosting capacity evaluation was conducted for various regions, based on geography (rural and urban).
This study proposes a Monte Carlo (MC) based investigation of PV hosting capacity for various Finnish regional LV networks. Firstly, test networks were developed while considering the different loading profiles of the areas and the compliance of the network with the limiting constraints, like component ampacity and the standard, EN 50160 [
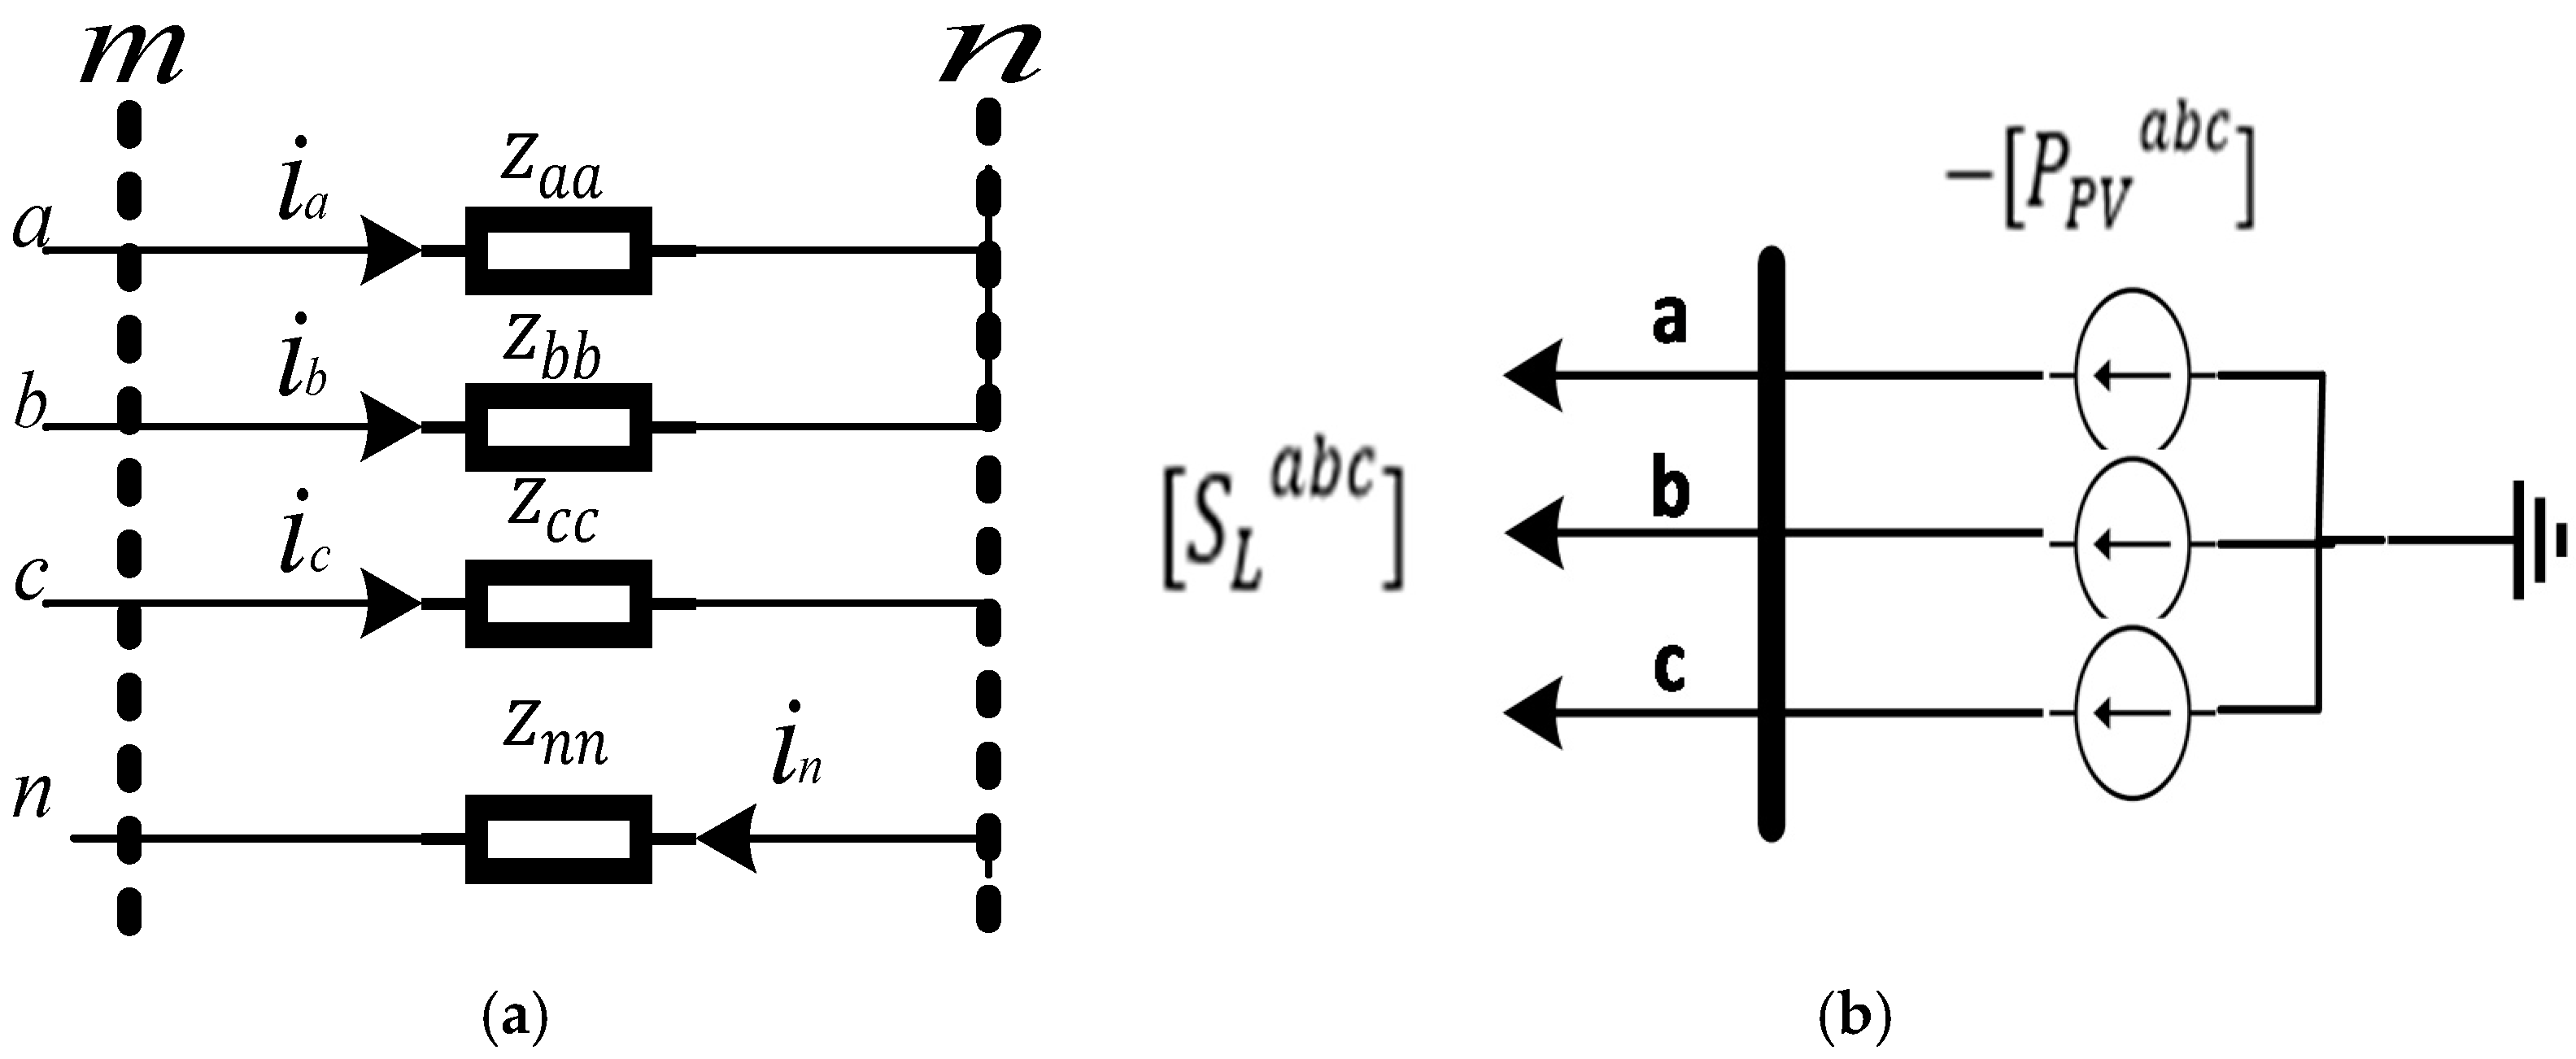
21], which allows ±10% voltage deviation from nominal, at the customer connection. For test network simulations, different LV network components were modelled. LV network components included: distribution transformer, cables, load and PV modules. In addition, the backward-forward sweep method that is utilized for load flow analysis to calculate the voltages and currents of nodes and branches, respectively, is briefly explained.
Secondly, the PV hosting capacity of each network was quantified, while adopting different connection schemes for PV, i.e., balanced and single-phase connections. Various limiting constraints were identified that will act as benchmarks for DNOs, while introducing new PV modules in the distribution systems and also aid in deciding on countermeasures to increase the hosting capacity of the networks.
Lastly, an on-load tap changer (OLTC) option for MV/LV transformer was utilized and its impact on the increment of hosting capacity was analyzed. A comparative study of the hosting capacity of PV in the LV network for different regions was conducted, with and without, OLTC reinforcement in the secondary substation. The simulated results show that the PV hosting capacity is dependent on the type of connection of PV among phases and the limiting constraints are highly dependent on the region, number of customers and capacity of network components. If a balanced feed-in of the PV is utilized, then there is substantial increase in hosting capacity with the employment of OLTC. However, hosting capacity is not greatly affected in the single-phase connections of PV, as negative sequence voltage unbalance is the limiting constraint in those cases.
4. Case Studies and Results
4.1. Test Network Simulations
This section describes how the test networks were created for the analysis. The idea was to model fully-loaded LV networks, the PV hosting capacity of which, is analyzed in
Section 4.2 and
Section 4.3. MC simulations were conducted for all three MV grid voltage changes, for defined geographical regions. The assumed component specifications of the LV grid are depicted in
Table 2 and
Table 3. The assumptions of various LV networks component parameters were based on the Finnish distribution system and the grids were fully loaded, to assume the worst-case scenario for the test network simulations. Formulated test networks, based on the MC simulations and compliance with the constraints, had different topologies, which are described in
Table 4 and
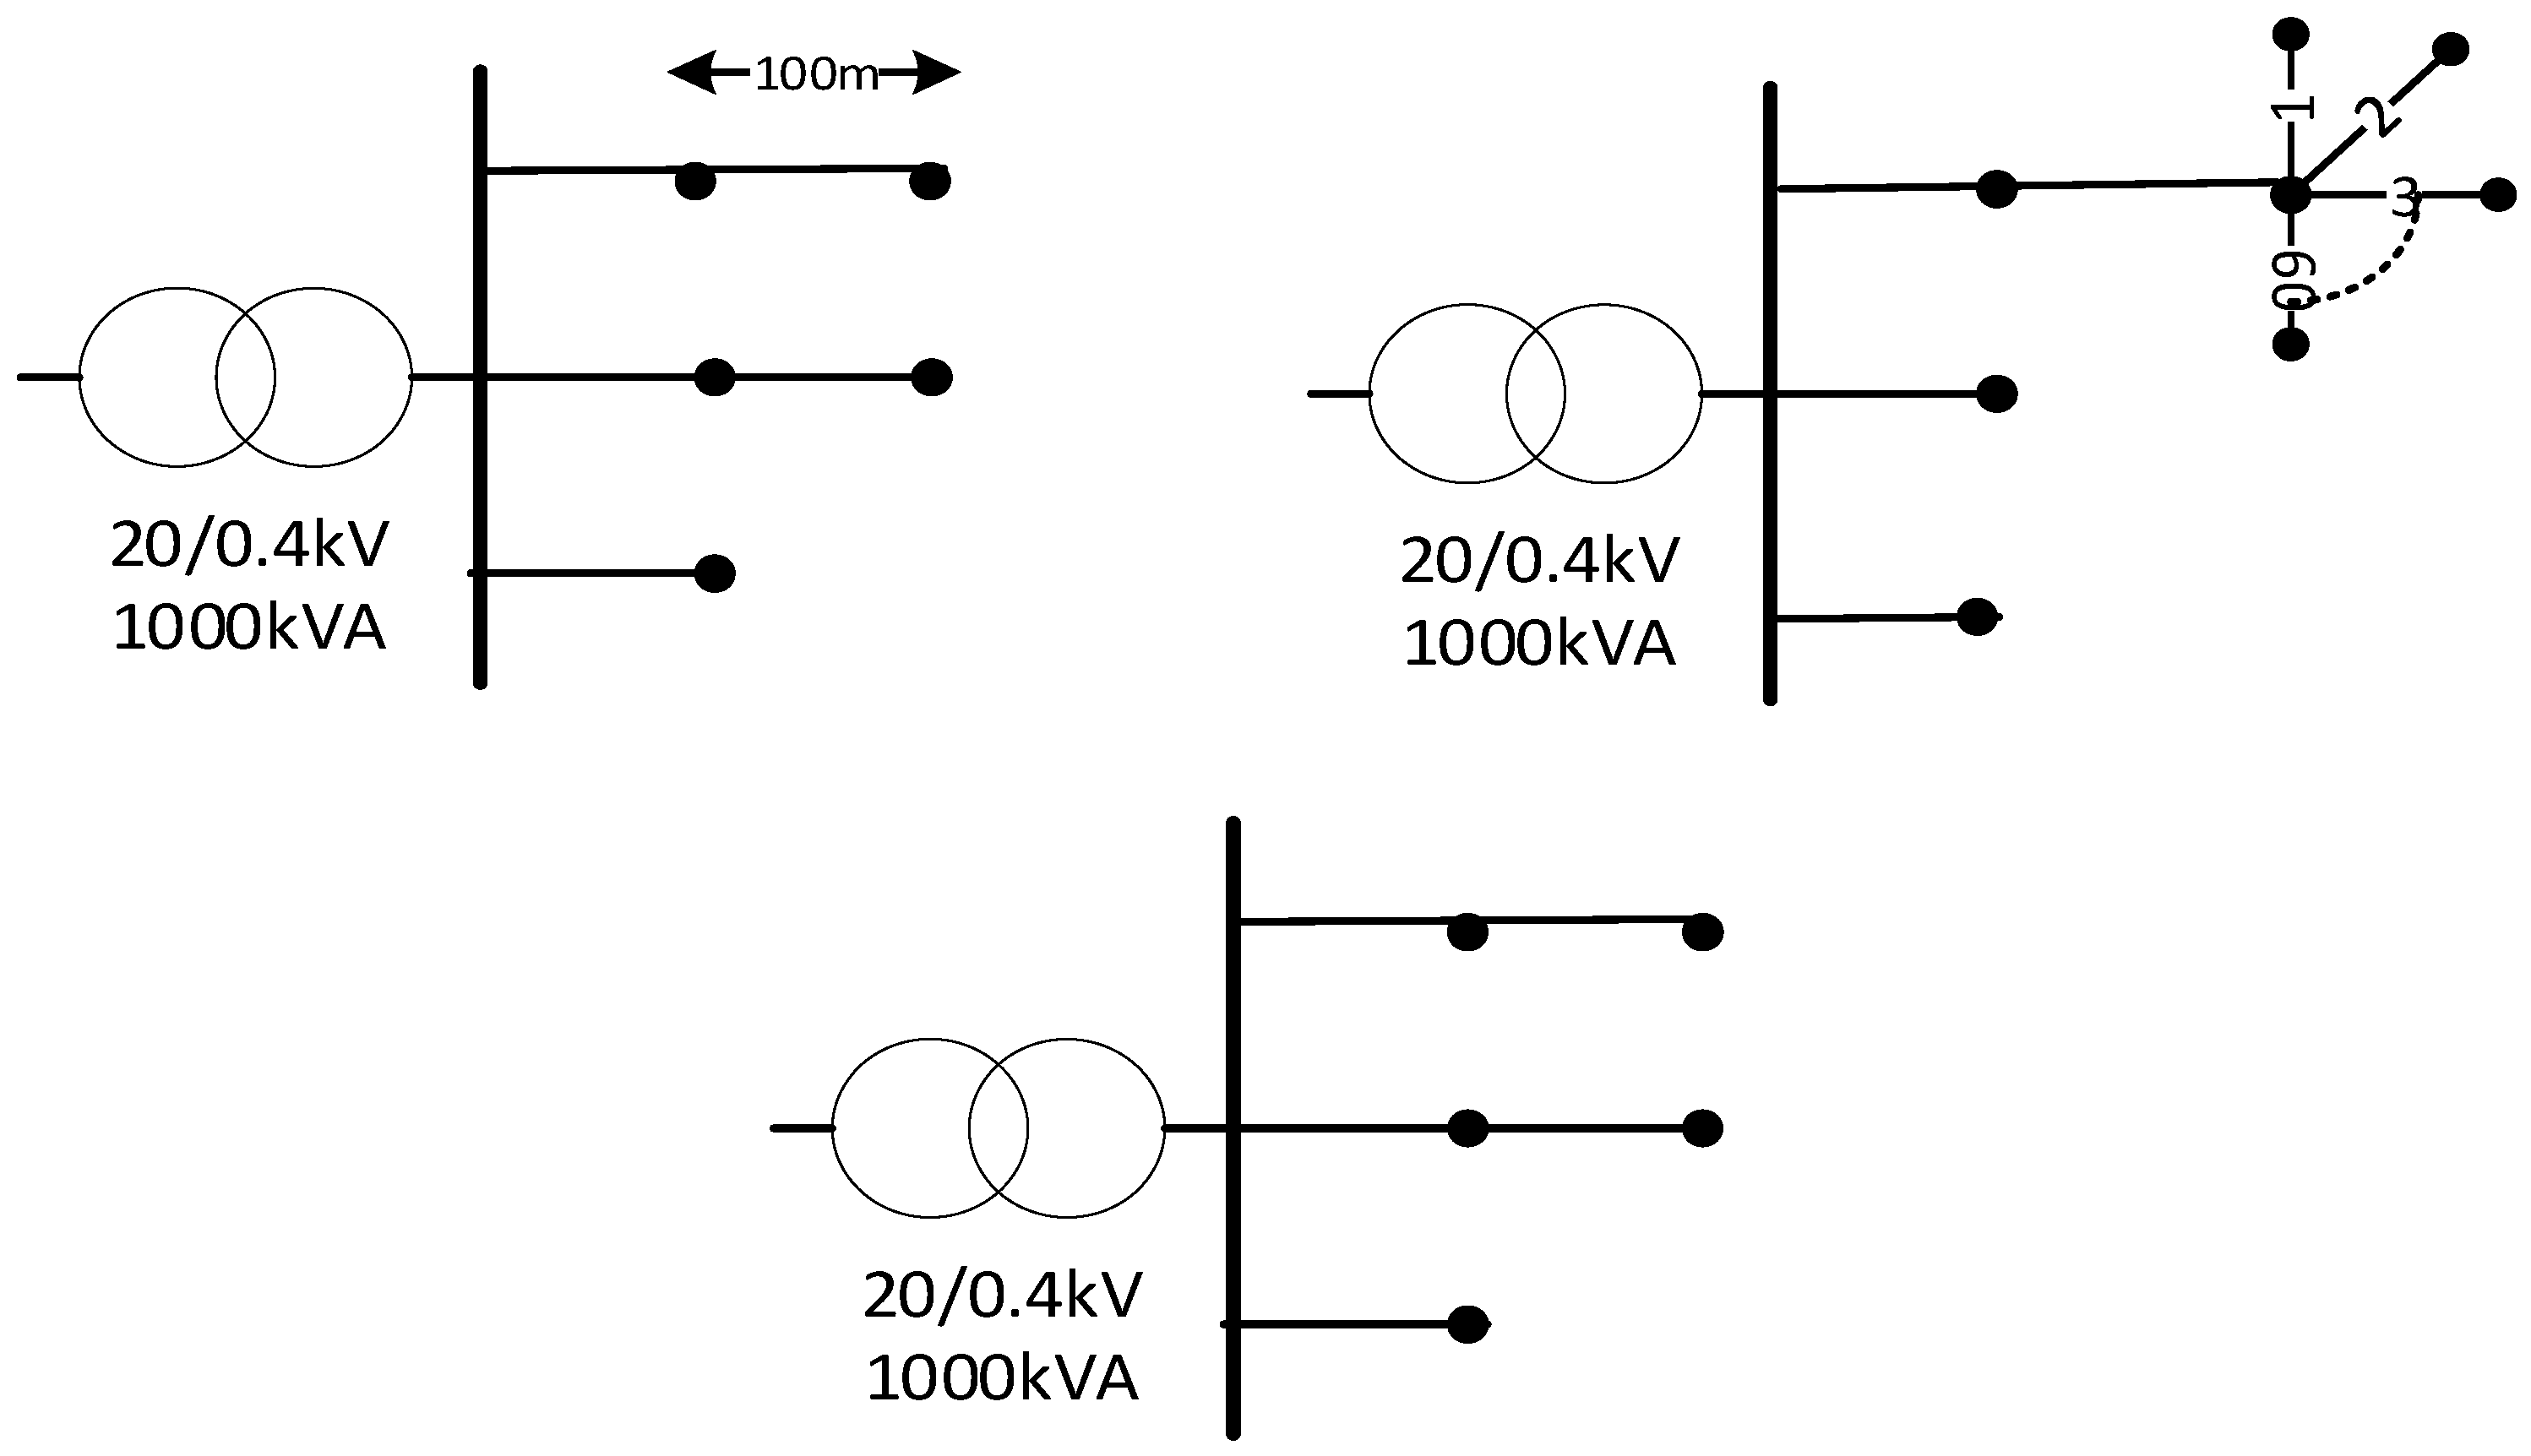
Table 5. The urban domestic networks are pictorially represented in
Figure 4.
In the PR region, customers were in close vicinity of the MV network, so the transformer size was small and the number of feeder and customers per node was restricted to one each. For −5% and 0% MV change cases, the lower voltage limit was the deciding factor in the network length. However, in the +5% MV rise scenario, the low voltage problem was mitigated, but extra nodes introduced a violated transformer loading capacity. Moreover, the low voltage problem was a secondary issue.
In the IN region, four customers could be added to the load node (cable box) of the feeder. To exploit the transformer ampacity, several feeders were added to the network. For −5% and 0% MV changes, the lower voltage band limits of the constructed grids were the deciding factor of network topology, while in the later scenario (nominal MV) transformer loading was the secondary issue to E2. E7 exceeded its nominal rating in the +5% MV rise case.
Lastly, in PU grid formulations, three different customer types were considered. The total number of customers per cable box, for the domestic scenario, were taken to be sixty and two parallel cables utilized. The resultant grids were quite small, due to a high population density. In the case of −5% drop, low voltage was the constraint restricting the grid size. For 0% and +5% MV change cases, the load current exceeding the cable ampacity was the primary limitation and transformer loading was the secondary concern, in case cables are upgraded. In public customer cases, for all the MV change scenarios, cable ampacity was the limiting factor. The grid formulated had a restriction of two nodes per feeder and each node had two big customers (office building) connected to it. In commercial areas, the grid formulation returned a two-feeder grid, with a node each. As in the public customer type simulation, E5 was the grid-size restricting constraint for the commercial customers. In all urban cases, the transformers were usually in the close proximity of the customer, especially in public and commercial cases.
4.2. Case 1: Network PV Hosting Capacities (Without OLTC)
Based on the type of PV connection in LV networks, two different sets of MC simulations were conducted—one for balanced feed-in (PVs are attached to all the three phases equally) and other for unbalanced feed-in (random single-phase connection). For domestic customers, a 1 kW PV system time series was utilized, while for public and commercial customers in urban areas, 30 kW and 150 kW installed capacities were used, respectively. The mean value of maximal PV hosting capacity, without limit violation in every set of MC simulations of a sample grid, was determined and is presented in
Table 6 and
Table 7.
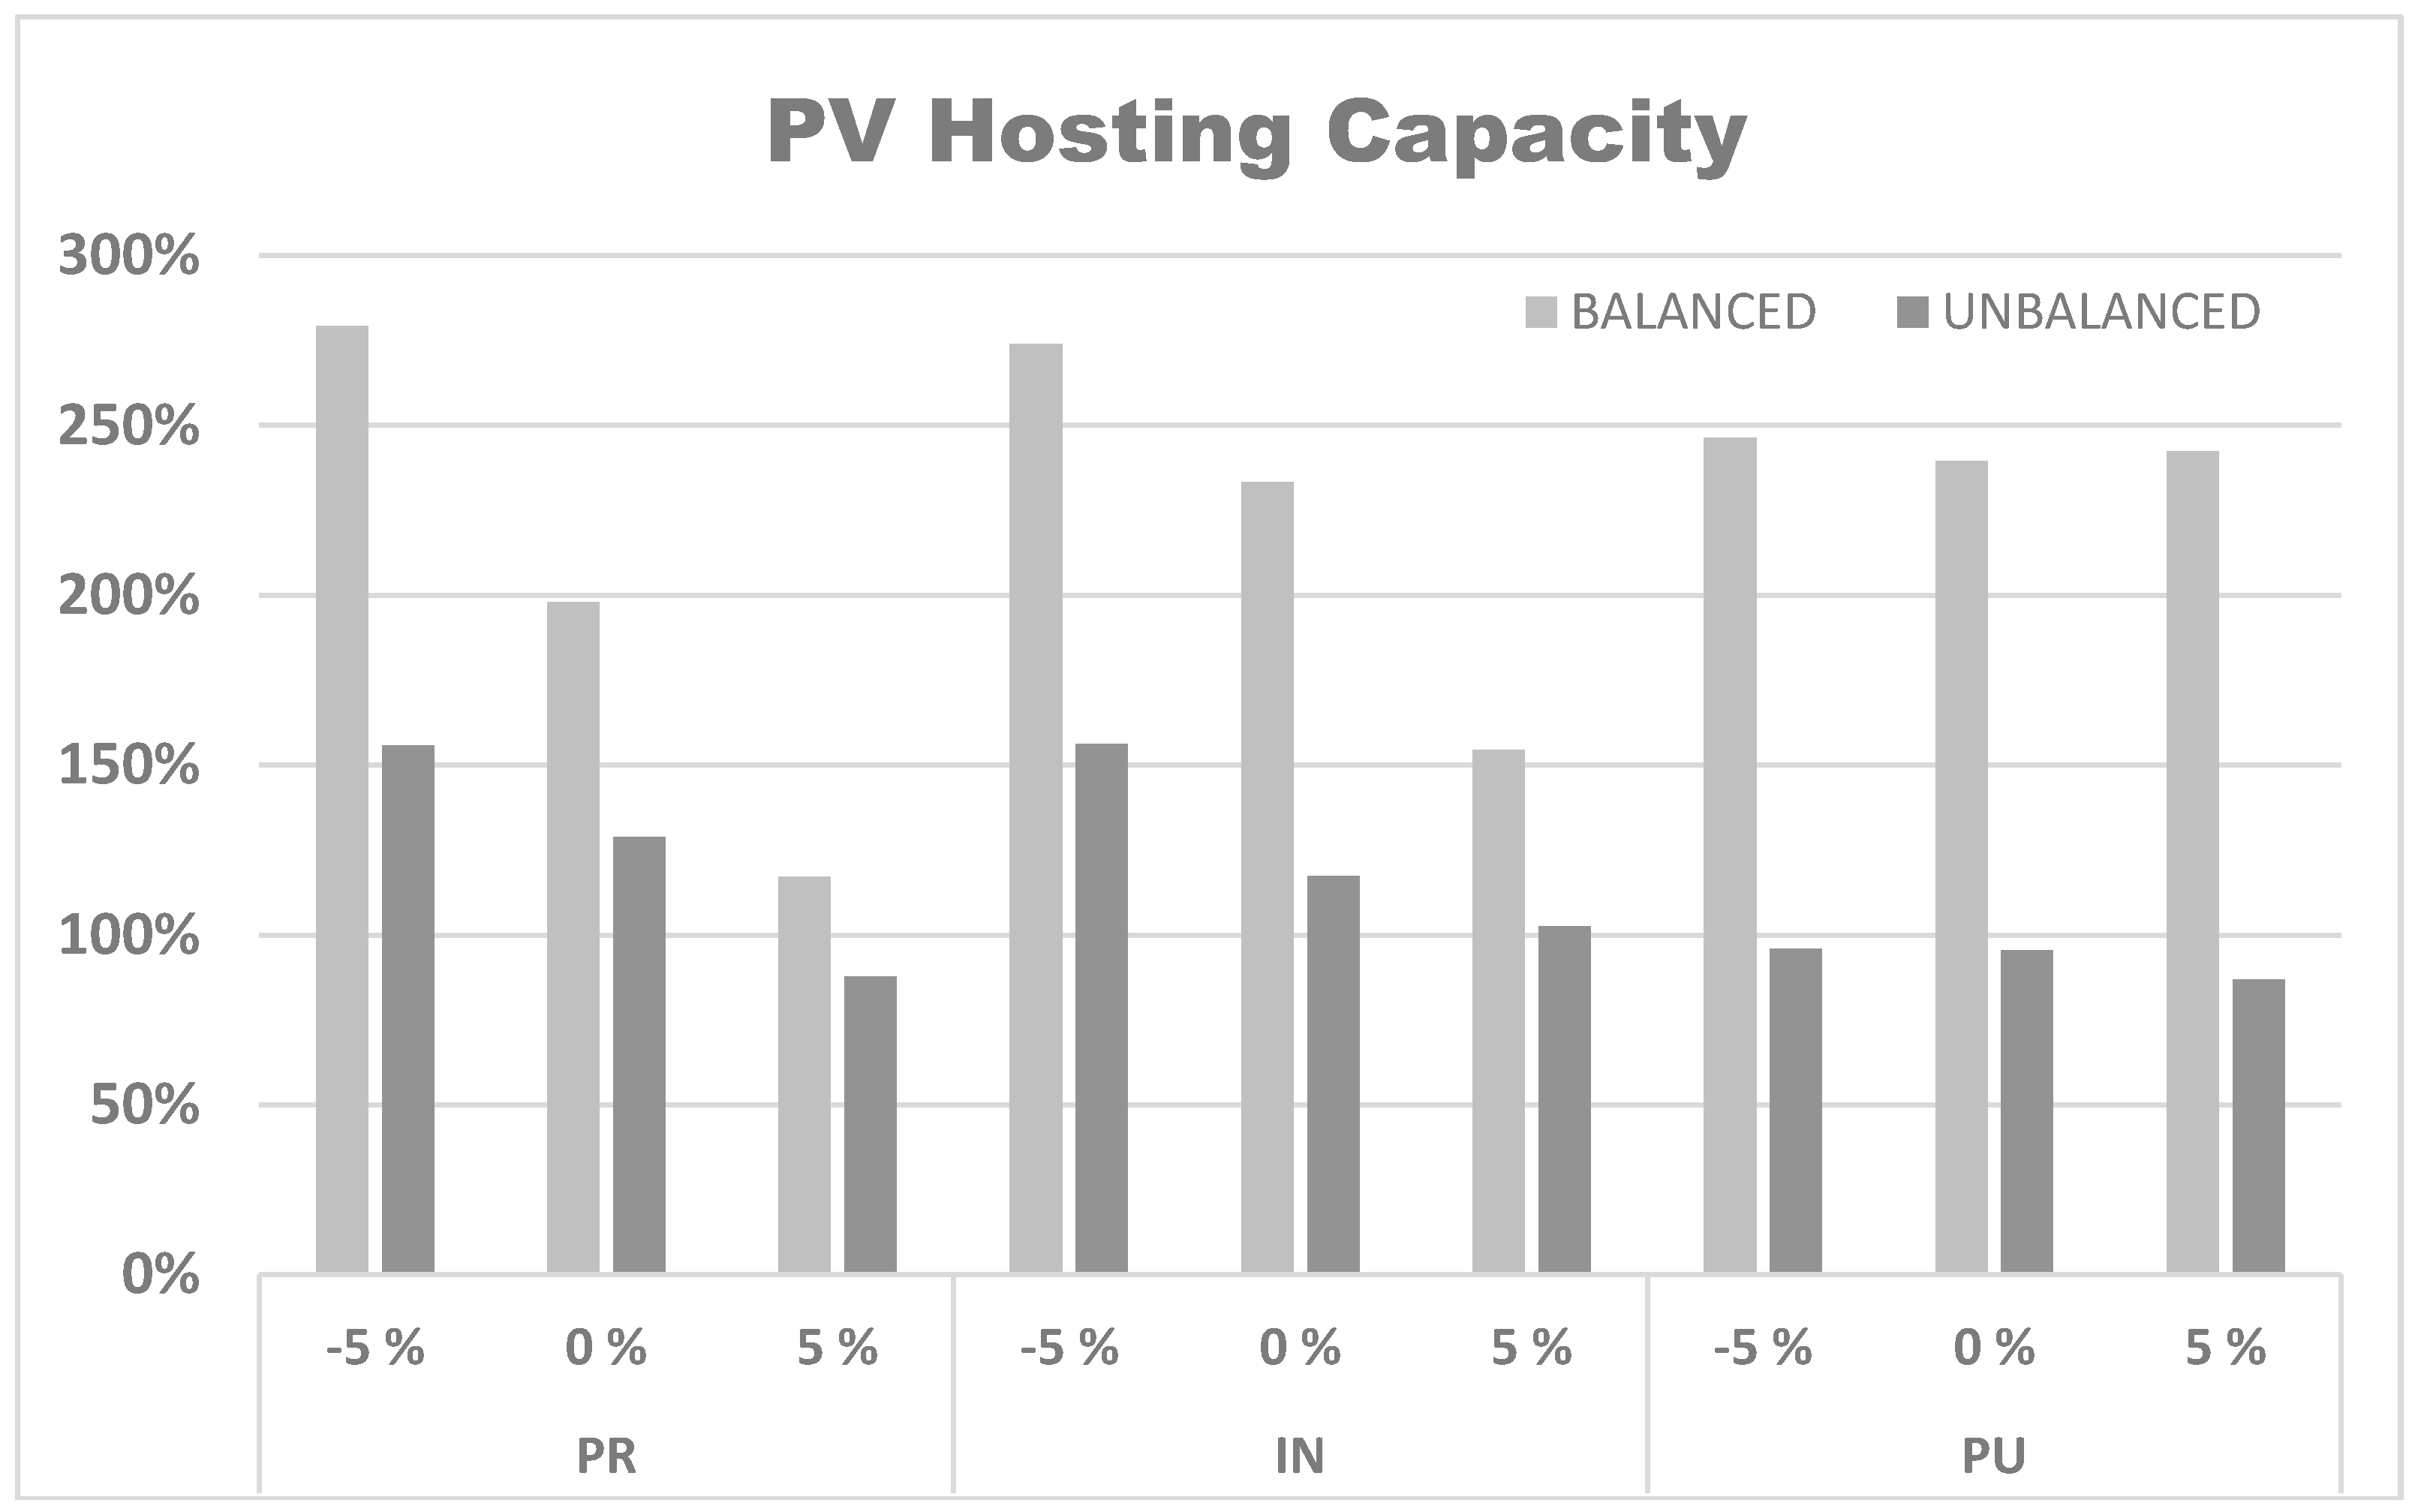
In the balanced feed-in scenario, the PR region transformer loading was exceeded for the −5% MV drop case. However, for the 0% and +5% MV change cases, the upper voltage limit violation was the primary constraint. In the IN region, the PV hosting capacities in the −5% and 0% MV changes, were predominantly limited by the transformer loading, as there were three feeders originating from the transformer in each case. For the +5% MV rise scenario, over-voltage was the deciding factor for the maximum PV hosting capacity of the network. The PU domestic region’s primary limiting constraint was the cable ampacity, due to a large customer density per node. If the network is reinforced; cables are upgraded and the transformer ampacity will be violated. The same trend of cable ampacity violation was prominent in public and commercial customers. In public and commercial customer cases, the customer density was not large, but the power demand by individual customers was quite large, relative to the domestic customers.
The single phase feed-in of PVs gives rise to the negative sequence unbalance that should be below the 2% level. Moreover, due to single phase connections, the transformer winding’s ampacity was also a limitation. The calculated PV hosting capacity in single phase connections was significantly lower than the balanced feed, as depicted by the bar graph in
Figure 5. In the PR area, the −5% MV drop case had a transformer capacity limitation, while for 0% voltage, unbalance was an issue; due to single phase PV introduction. The +5% MV case had a predominant limitation of an over-voltage limit violation. For the IN region, the constraints of
E3 (+5% MV rise case) and
E4 (−5% and 0% MV changes) were violated. The PU region had the largest reduction in hosting capacity, as compared to its balanced case. Primarily, negative sequence voltage unbalance, which resulted in secondary limit violation of neutral wire ampacity, was the limiting constraint in the −5% MV drop case and vice versa for the nominal MV case. Lastly, in the +5% MV rise case, a large number of PV connections, led to an over-voltage problem.
4.3. Case 2: PV Hosting Capacity (With OLTC)
The case 1 analysis showed that there were six occasions when the high voltage at the nodes was the primary limiting constraint for the LV network hosting capacity. The goal was to maximize the hosting capacity of the specific case networks. To mitigate this issue an active voltage control was applied that lowered the ratio of the secondary substation transformer, in the case of excess voltage at customer nodes. For this purpose, secondary substation, equipped with OLTC and PV hosting capacities, was again evaluated with varying ratios. The results indicated that it is not necessary to lower the transformer’s voltage ratio to −10% to achieve a maximum hosting capacity, as the limiting constraints change with increasing PV penetration into the system. The cases with the voltage rise limitation are:
Balanced cases:
PR (0% and +5% MV rise)
IN (+5% MV rise)
Single phase case:
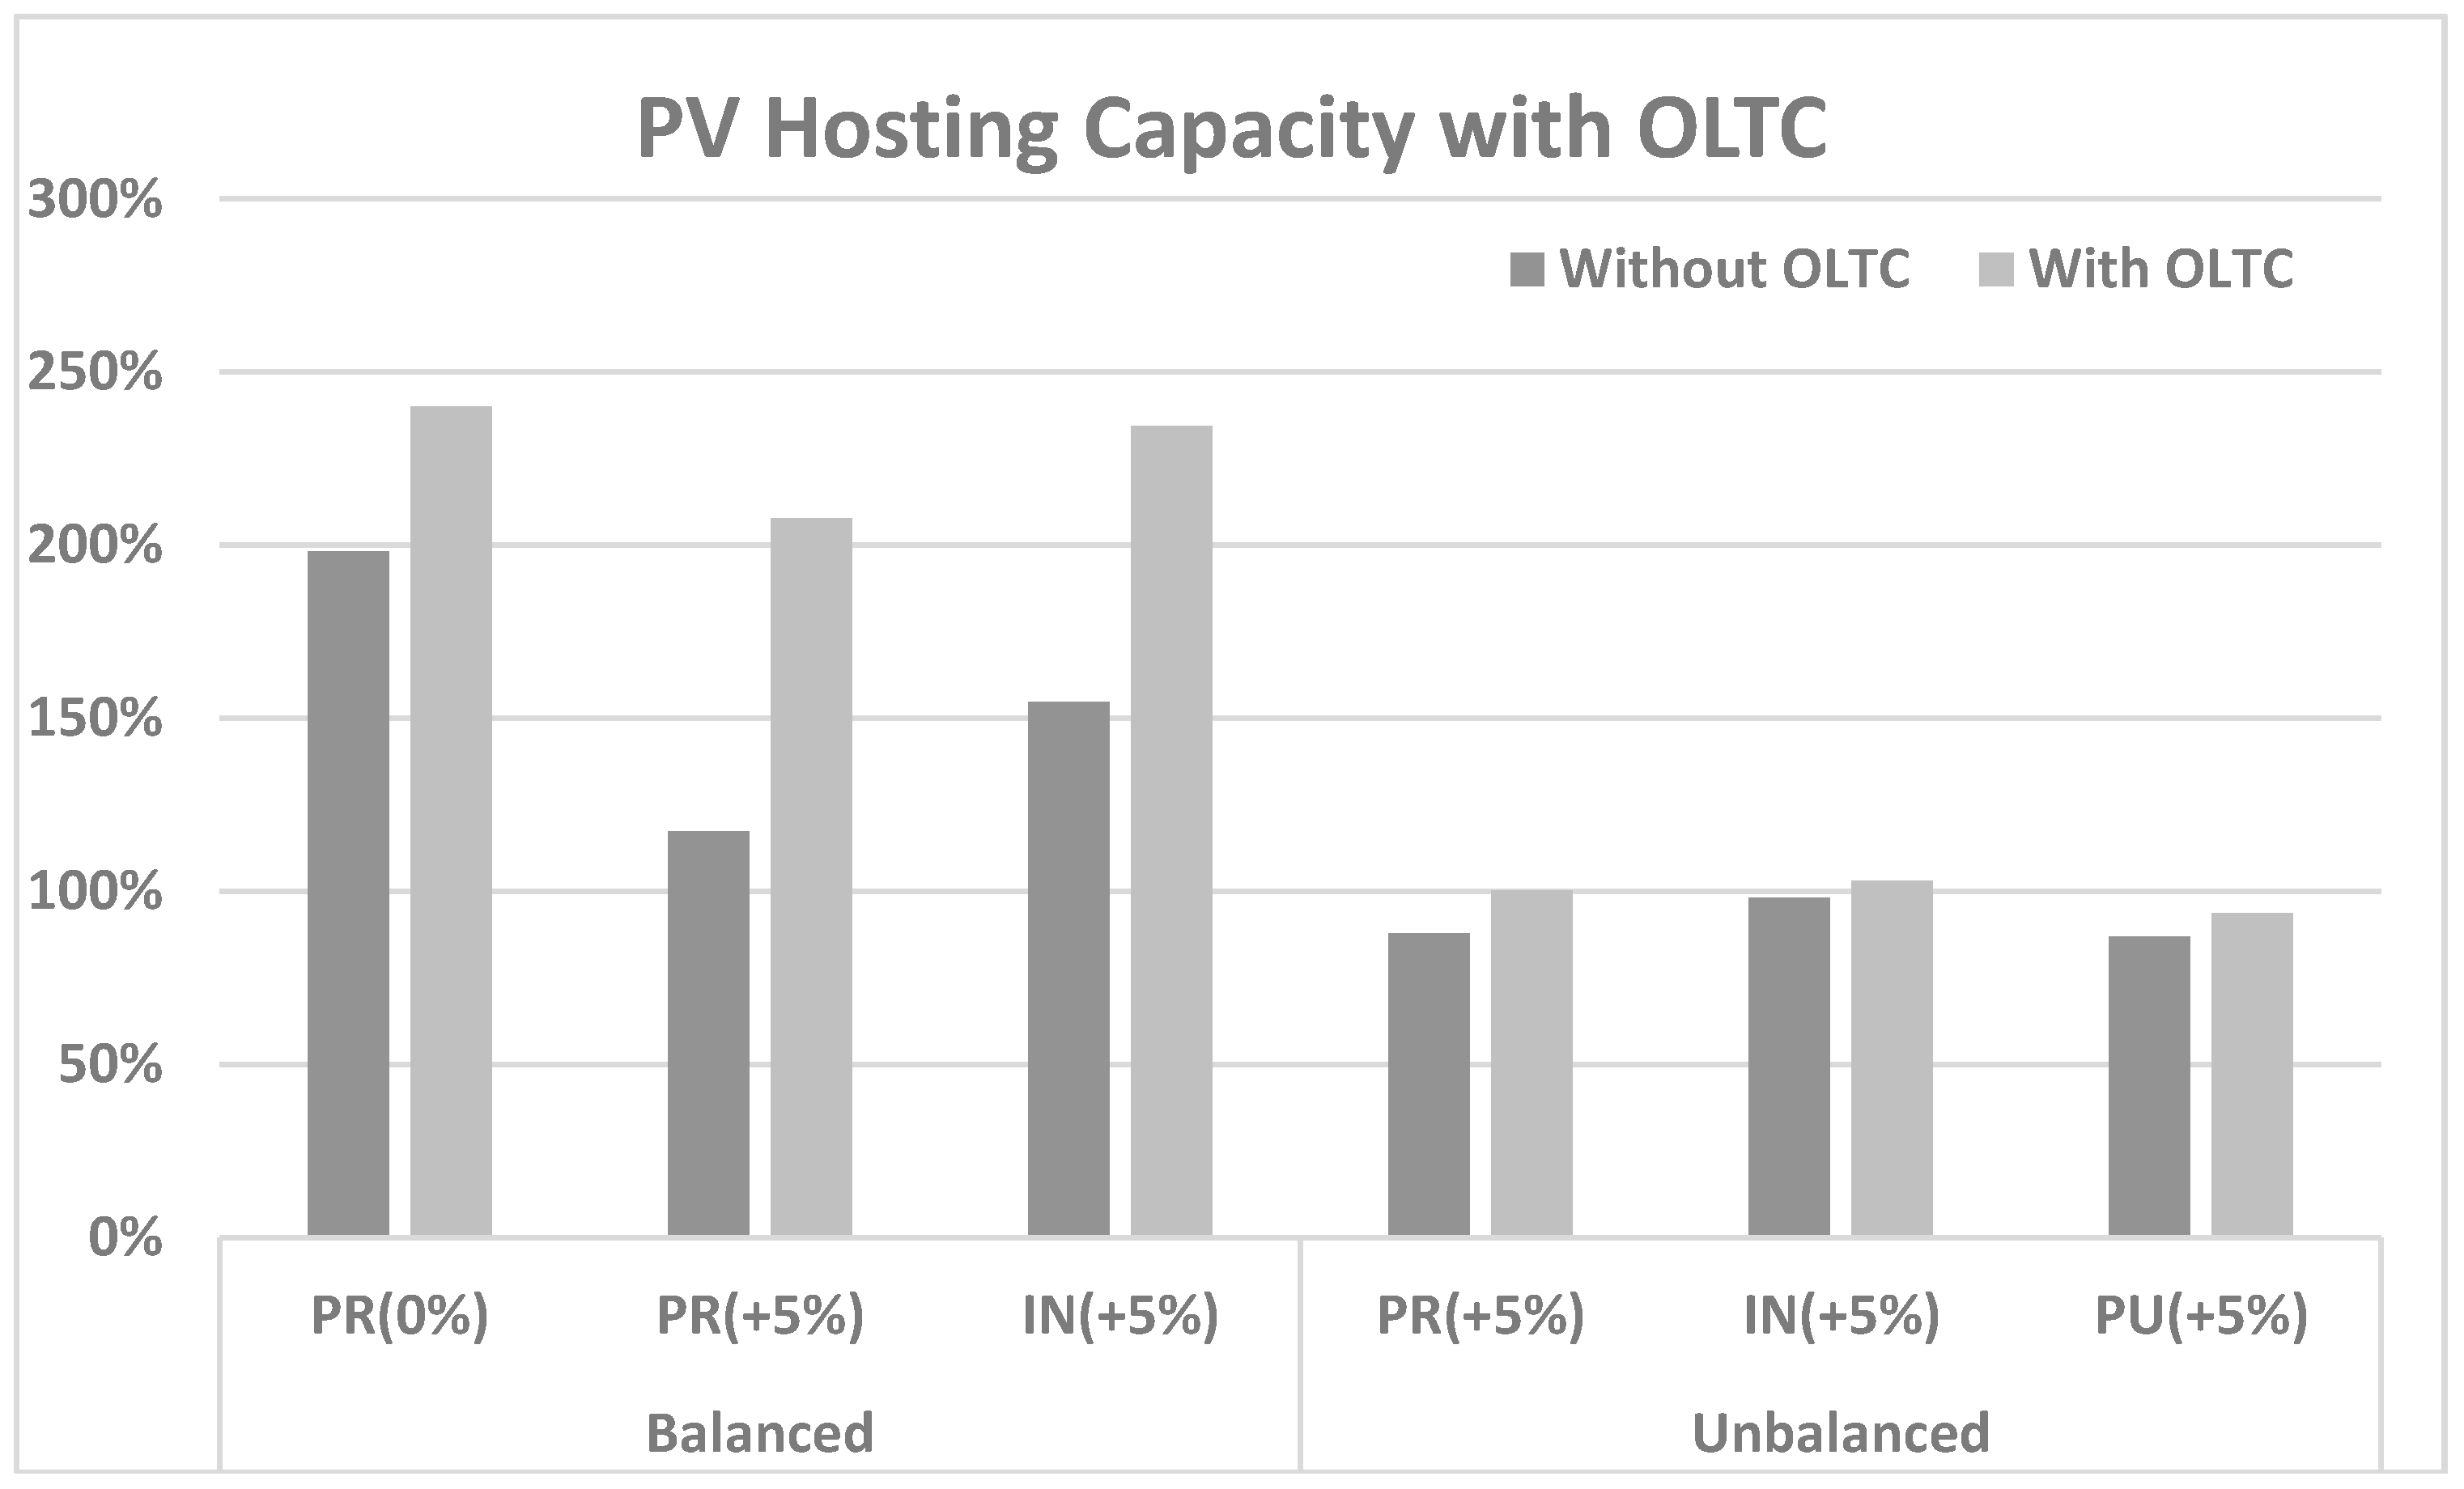
For all balanced feed-in cases, the limiting constraint changed from over-voltage (E3) to transformer loading (E7). In the 0% and +5% MV change cases, the hosting capacity increased by 17.5% and 43.5%, respectively. Meanwhile, for the IN +5% MV change scenario, the hosting capacity increased by 34% of the previous case value.
For the unbalanced cases, in the PR and IN scenarios of +5% MV change, the
HC limitation was modified to a negative sequence voltage unbalance (
E4) and the hosting capacities were increased by 12.5% and 4.5%, respectively. However, in the PU region, single phase feed-in scenario, the limiting constraints returned by MC simulations were
E6 and
E4. Nevertheless, the increment in hosting capacity was by 7.2%, as compared to the balanced feed-in. In all the single phase cases, at lower tap positions, the lower voltage level became the secondary limit, as the lower voltage limit was violated by phases with which the PVs were not attached.
Figure 6 presents a comparison of the hosting capacities, before and after, OLTC employment.
5. Discussion
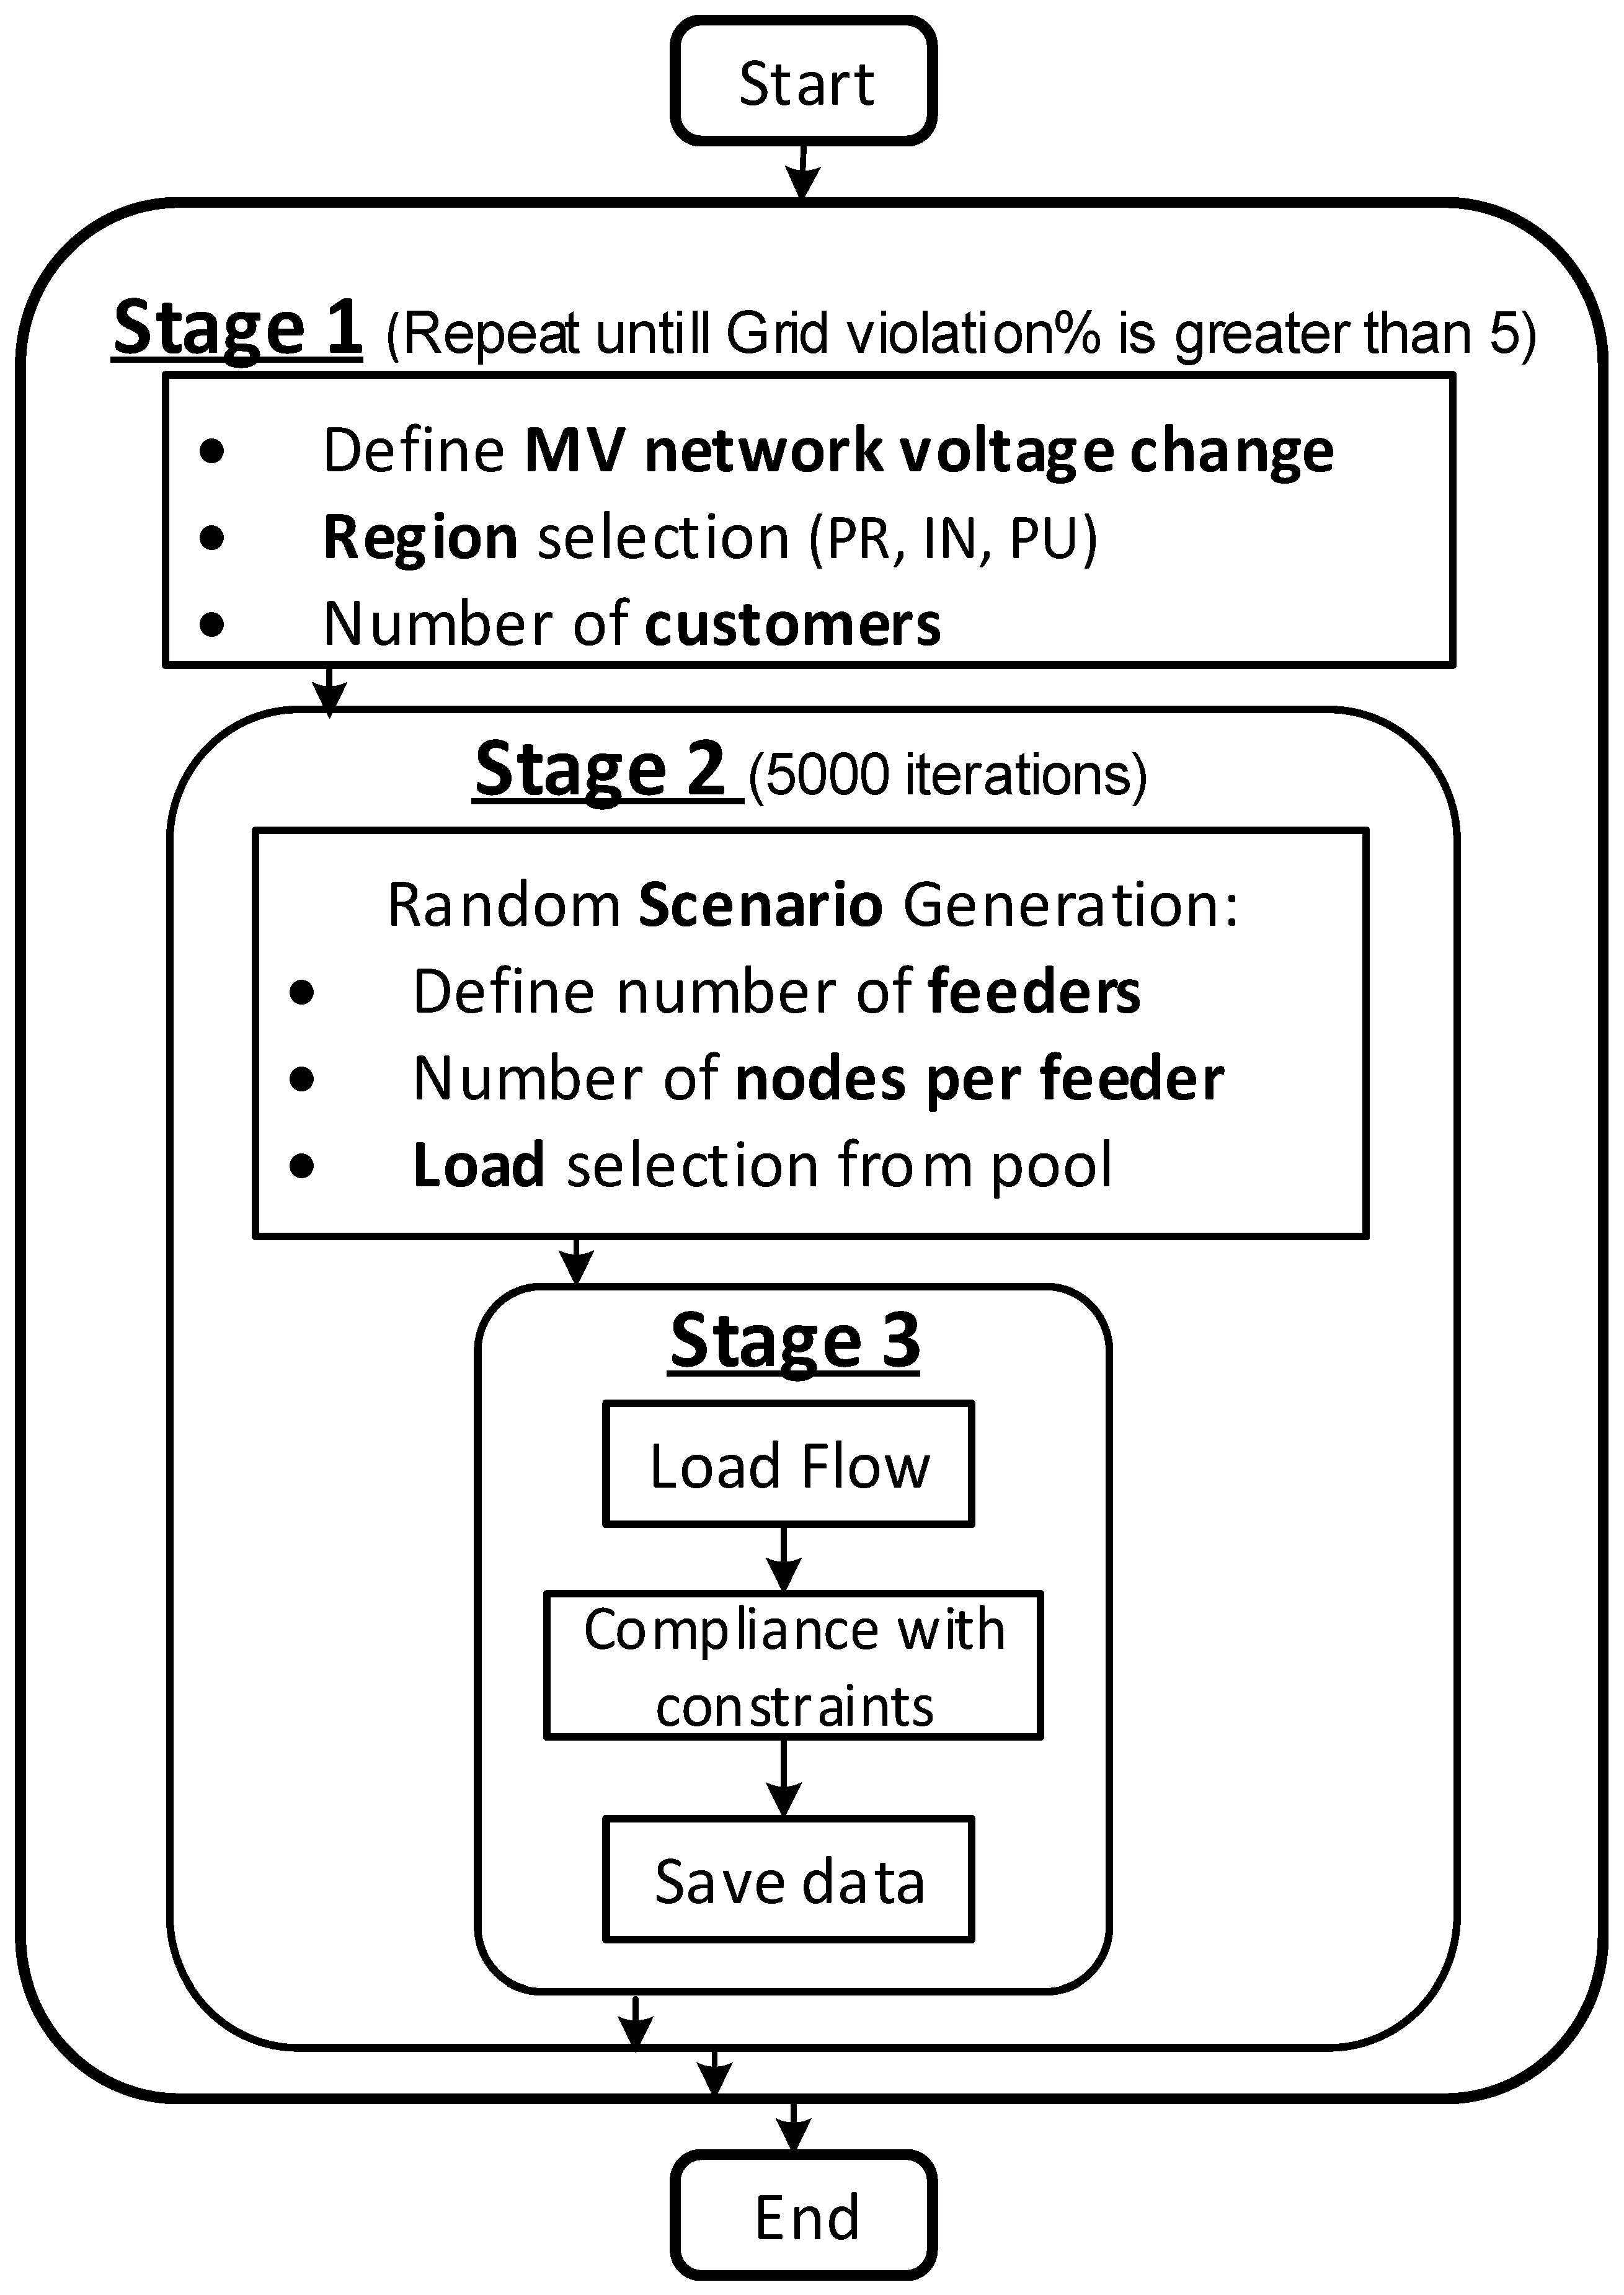
MC simulations were conducted and three different scenarios of MV network voltage changes were considered. However, MV network voltage changes were taken to be constant, which is not the case in reality, because power flow from the adjacent LV networks also affects the MV grid. This a topic for further research.
The number of iterations in MC simulations were also critical to defining the limiting constraints for various scenarios. A low number leads to an inaccurate result, while too many iterations require excessive computational time and resources. For instance, for the simulations with 1000 iterations, the percentage variance in the results obtained was 0.61%. However, for 5000 and 10,000 iterations, deviations were 0.189% and 0.14%, respectively (results are related to the intermediate region, having 0% MV change, for test network formation simulations). Thus, for the cases in which limiting constraints, for a particular grid, are decided based on very small margins; this slight percentage deviation among various MC simulations is decisive and can lead to the wrong result.
The LV network simulations performed gave limiting constraints for the PV hosting capacity, with and without, OLTC employed at the secondary substation and set a benchmark for constraints in planning a network and decision-making process with PV incorporation. In balanced feed-in scenarios, the hosting capacities in PR and IN regions can be increased by utilizing larger transformers, equipped with OLTC. However, the PU region requires network cable reinforcement, as ampacity is the major issue due to large customer density in domestic regions and larger customer loads in public and commercial regions. The hosting capacity augmentation by OLTC operation is undoubtedly significant. Thus, to enhance PV penetration for balanced feed-in cases, an upgrade to active voltage control is a solution. In single phase feed-in, voltage unbalance and neutral wire ampacity violation are the main issues. The results for the OLTC inclusion showed that the increment in PV hosting capacity of the network was not as significant as in the balanced feed-in case.
6. Conclusions
A Monte Carlo based approach was employed to design and investigate the test networks, based on different Finnish regions. Furthermore, the PV hosting capacities of the designed networks were calculated, with and without, OLTC employment in the secondary substation.
Test network formulations for different regions consequently gave the voltage level violation and transformer loading capacity as the deciding factors in sizing LV networks, for the PR and IN regions. However, the PU region had cable ampacity as the deciding factor, due to its large customer density.
The PV hosting capacities of the formulated LV networks were quantified, with and without, OLTC involvement. For balanced PV feed-in, the hosting capacity was significantly larger and over-voltage was the limiting constraint. However, in the single phase feed-in of PV, it reduced to two thirds of the balanced feed-in capacities for PR and IN regions. Moreover, in the PU regions the hosting capacity was reduced by more than half, as compared to the balanced feed-in. However, negative sequence unbalance and the neutral wire ampacity were the main limiting constraints which define the upper limit of the hosting capacity.
The OLTC reinforcement scenario had significant impacts on the hosting capacity when balanced feed-in was considered. However, for single phase PV installations, the increment was quite minor. DNOs have to carefully integrate PV systems in the LV networks and should take into account the OLTC installation cost, to cope with the higher PV generation, while reinforcing secondary substation. Further research should include a more precise analysis of combined LV and MV network voltage variations.


