1. Introduction
Geothermal energy is hot water, steam, gas or thermal energy within hot dry rocks that has accumulated under pressure at a variety of depths in the crust. In other words, geothermal energy may be defined as thermal energy of the globe [
1]. It is estimated that the crust has 5.4 billion EJ of thermal energy. If just 0.1% of this energy could be used, world energy consumption needs for 10,000 years could be met. However, it is very difficult to use the Earth’s energy at this scale and it requires advanced technology [
2]. Geothermal energy is considered to be a clean, reliable and safe renewable energy resource [
3]. Linked to the reservoir fluid temperature, geothermal resources are classified as low (<90 °C), moderate (90 °C–150 °C) and high (>150 °C) enthalpy resources [
4]. Historically Conti created the first device producing electricity from a geothermal steam well in the town of Lardello in Italy in 1904 and in 1913 the first commercial geothermal energy system was linked to the grid with a 250 kW alternator in the same place [
5]. The success of these experiments led to small scale electricity production from geothermal resources in the city of Beppu in Japan in 1919 and from geysers in California in 1921. New Zealand’s Wairakei station began operations in 1958, which was a turning point in the technological history of electricity production and it was the first facility to use wet steam technology (flash steam). Previous power plants were limited to the use of geothermal reservoirs containing dry steam [
6]. In 1977 the first dual flash power plant began operating in Japan and in 1984 geothermal energy power plants using binary cycles started to operate [
7]. Thus electricity production from geothermal energy spread around the world and over one hundred years have passed since the first day electricity was produced from geothermal resources to the present. In this respect, Turkey has a long history of electricity production from this type of energy. In 1984 Turkey’s first geothermal energy power plant with 20.4 MW
e installed power was opened in Denizli (Kızıldere) [
8]. However, to date its share within the variety of energy resources used in Turkey has not reached desired levels. Instead, the basic use of Turkey’s geothermal energy is direct usage [
9].
Geothermal power plants use hydrothermal resources with hydro and thermal components. Hot water or steam turns a turbine and is used to generate electricity. Geothermal power plants require hydrothermal resources with high temperatures (nearly 150 °C–370 °C) coming from hot water wells or dry steam wells [
10]. In this situation, for electricity production from geothermal resources to be possible, generally a minimum temperature of 150 °C is required. The mean temperature gradient within the earth’s crust is 25 °C/km–30 °C/km. As a result, for electricity production from geothermal, either a deep temperature drilling is required or regions with high temperature gradient should be chosen [
11]. Nearly all geothermal power plants can be divided into four categories: dry steam, single flash, dual flash and binary designs. Power plant design is generally a function of the temperature and pressure of the available geothermal resource.
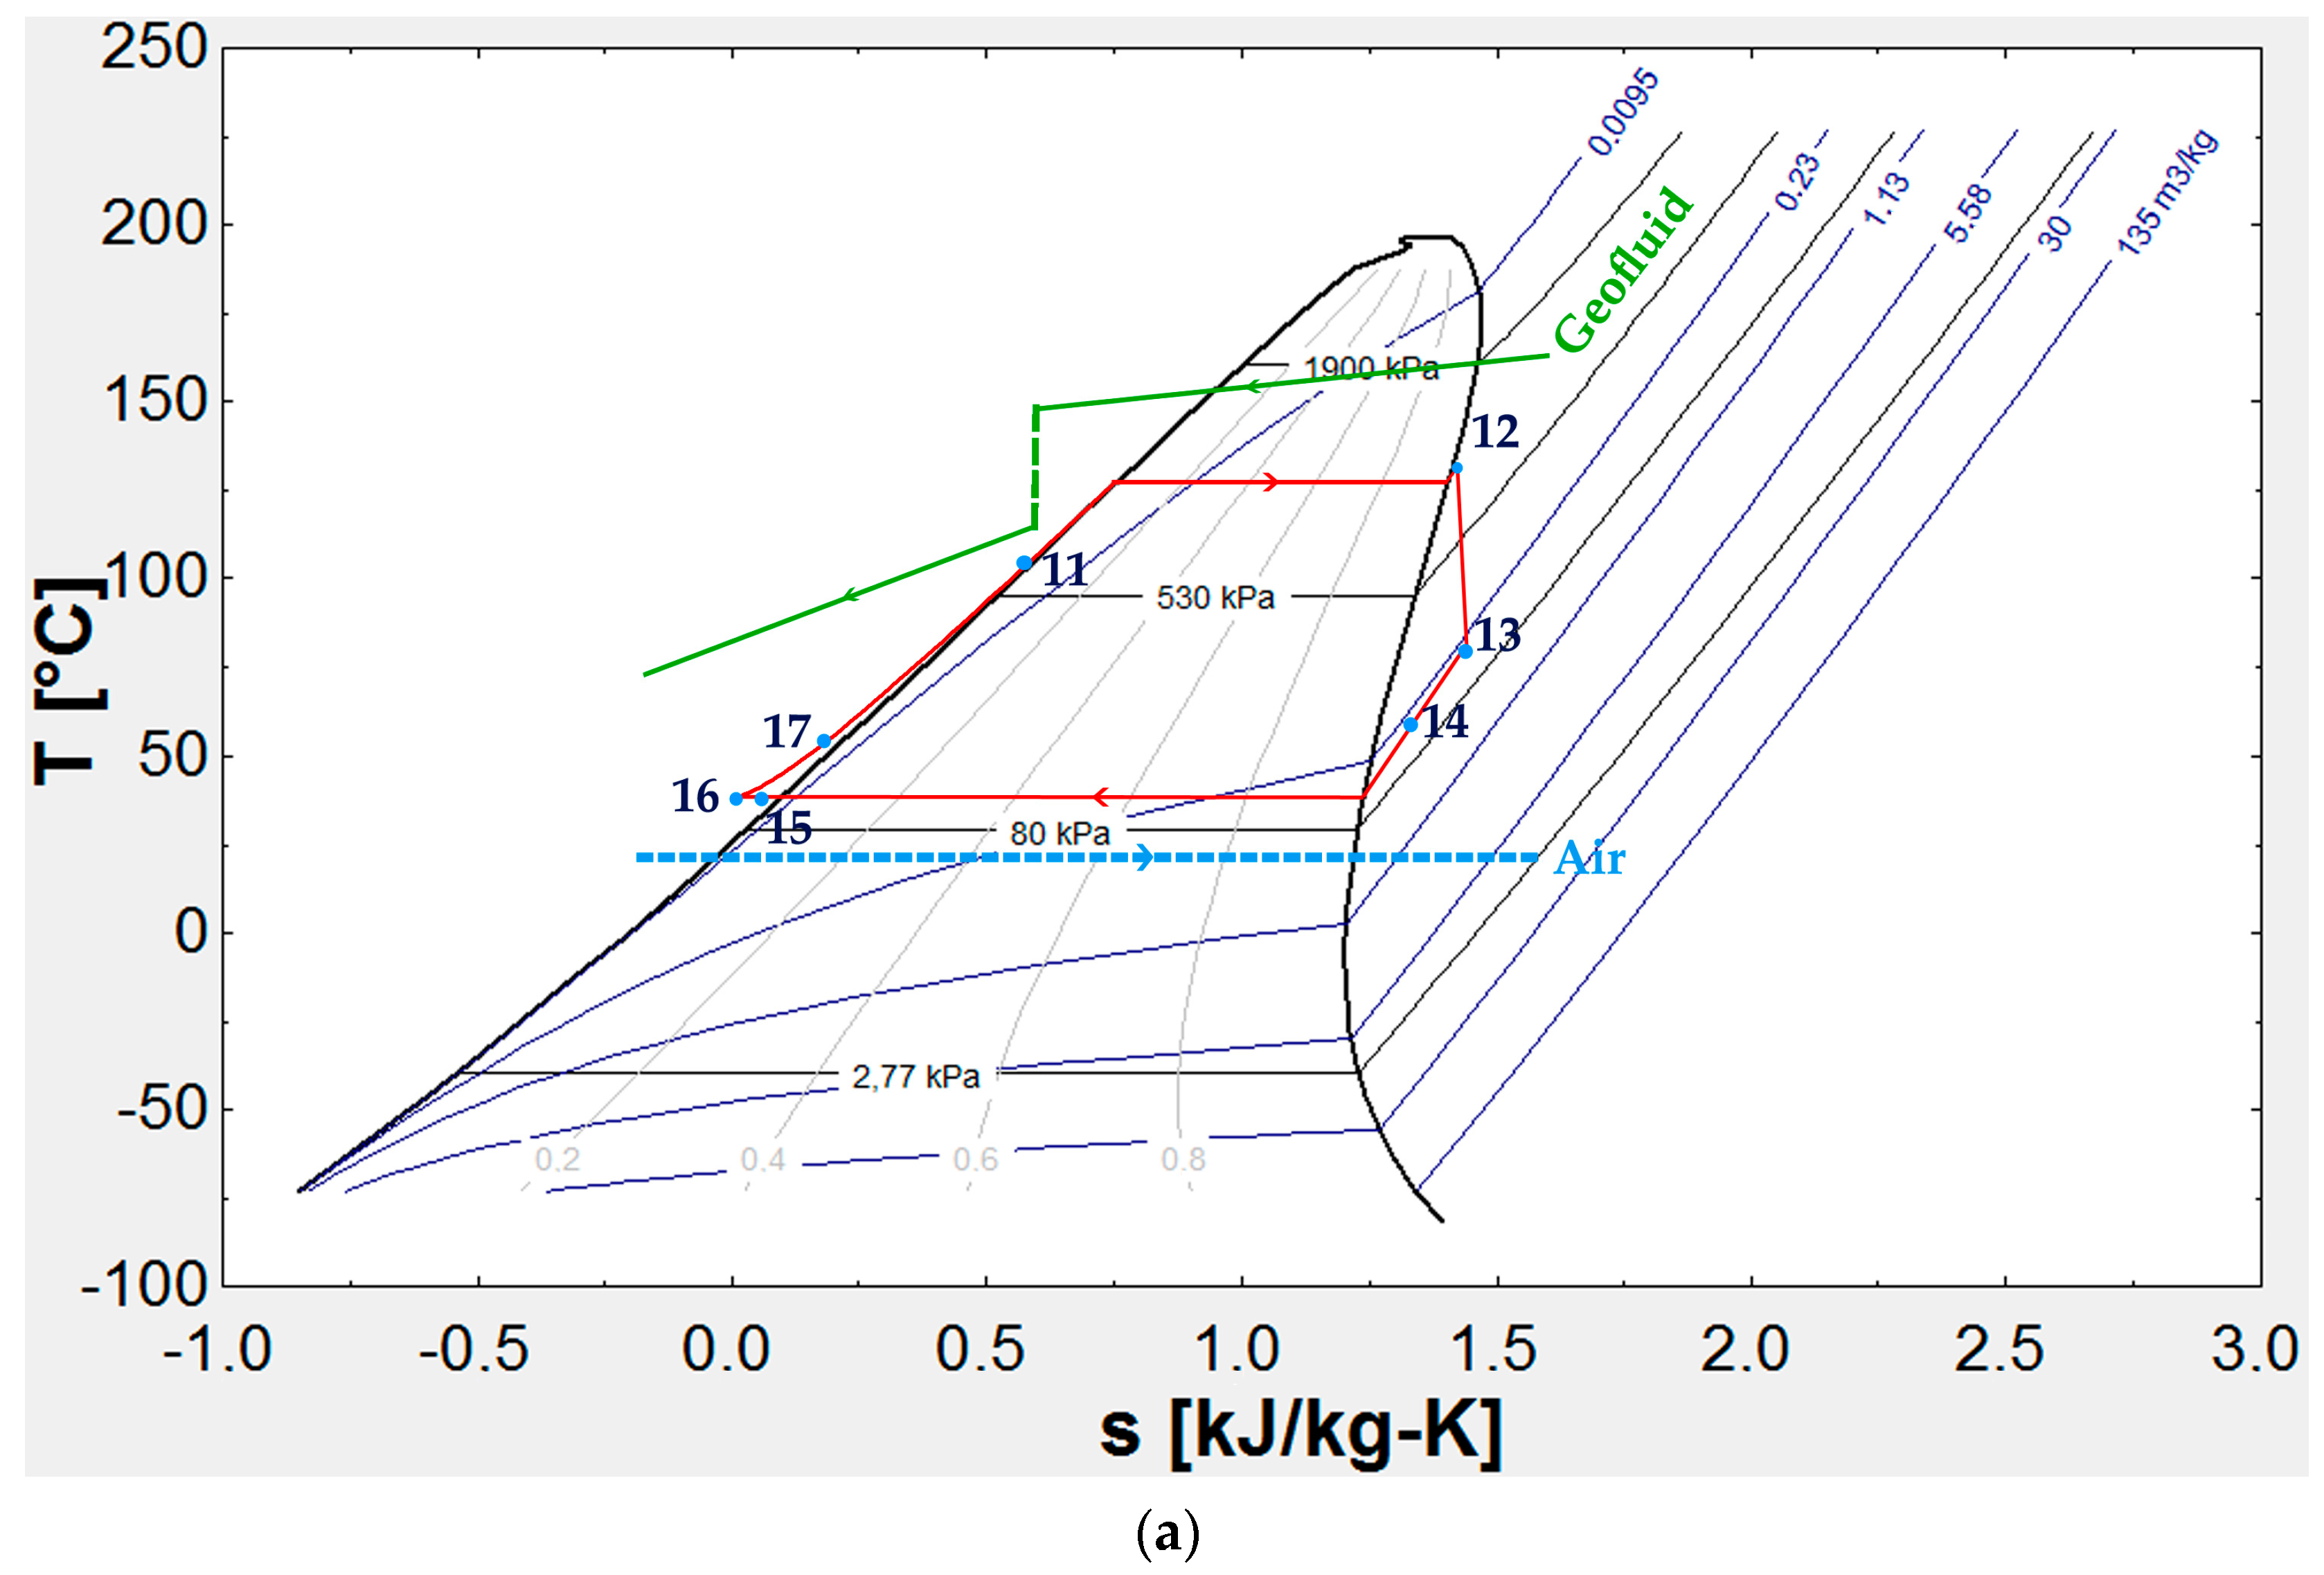
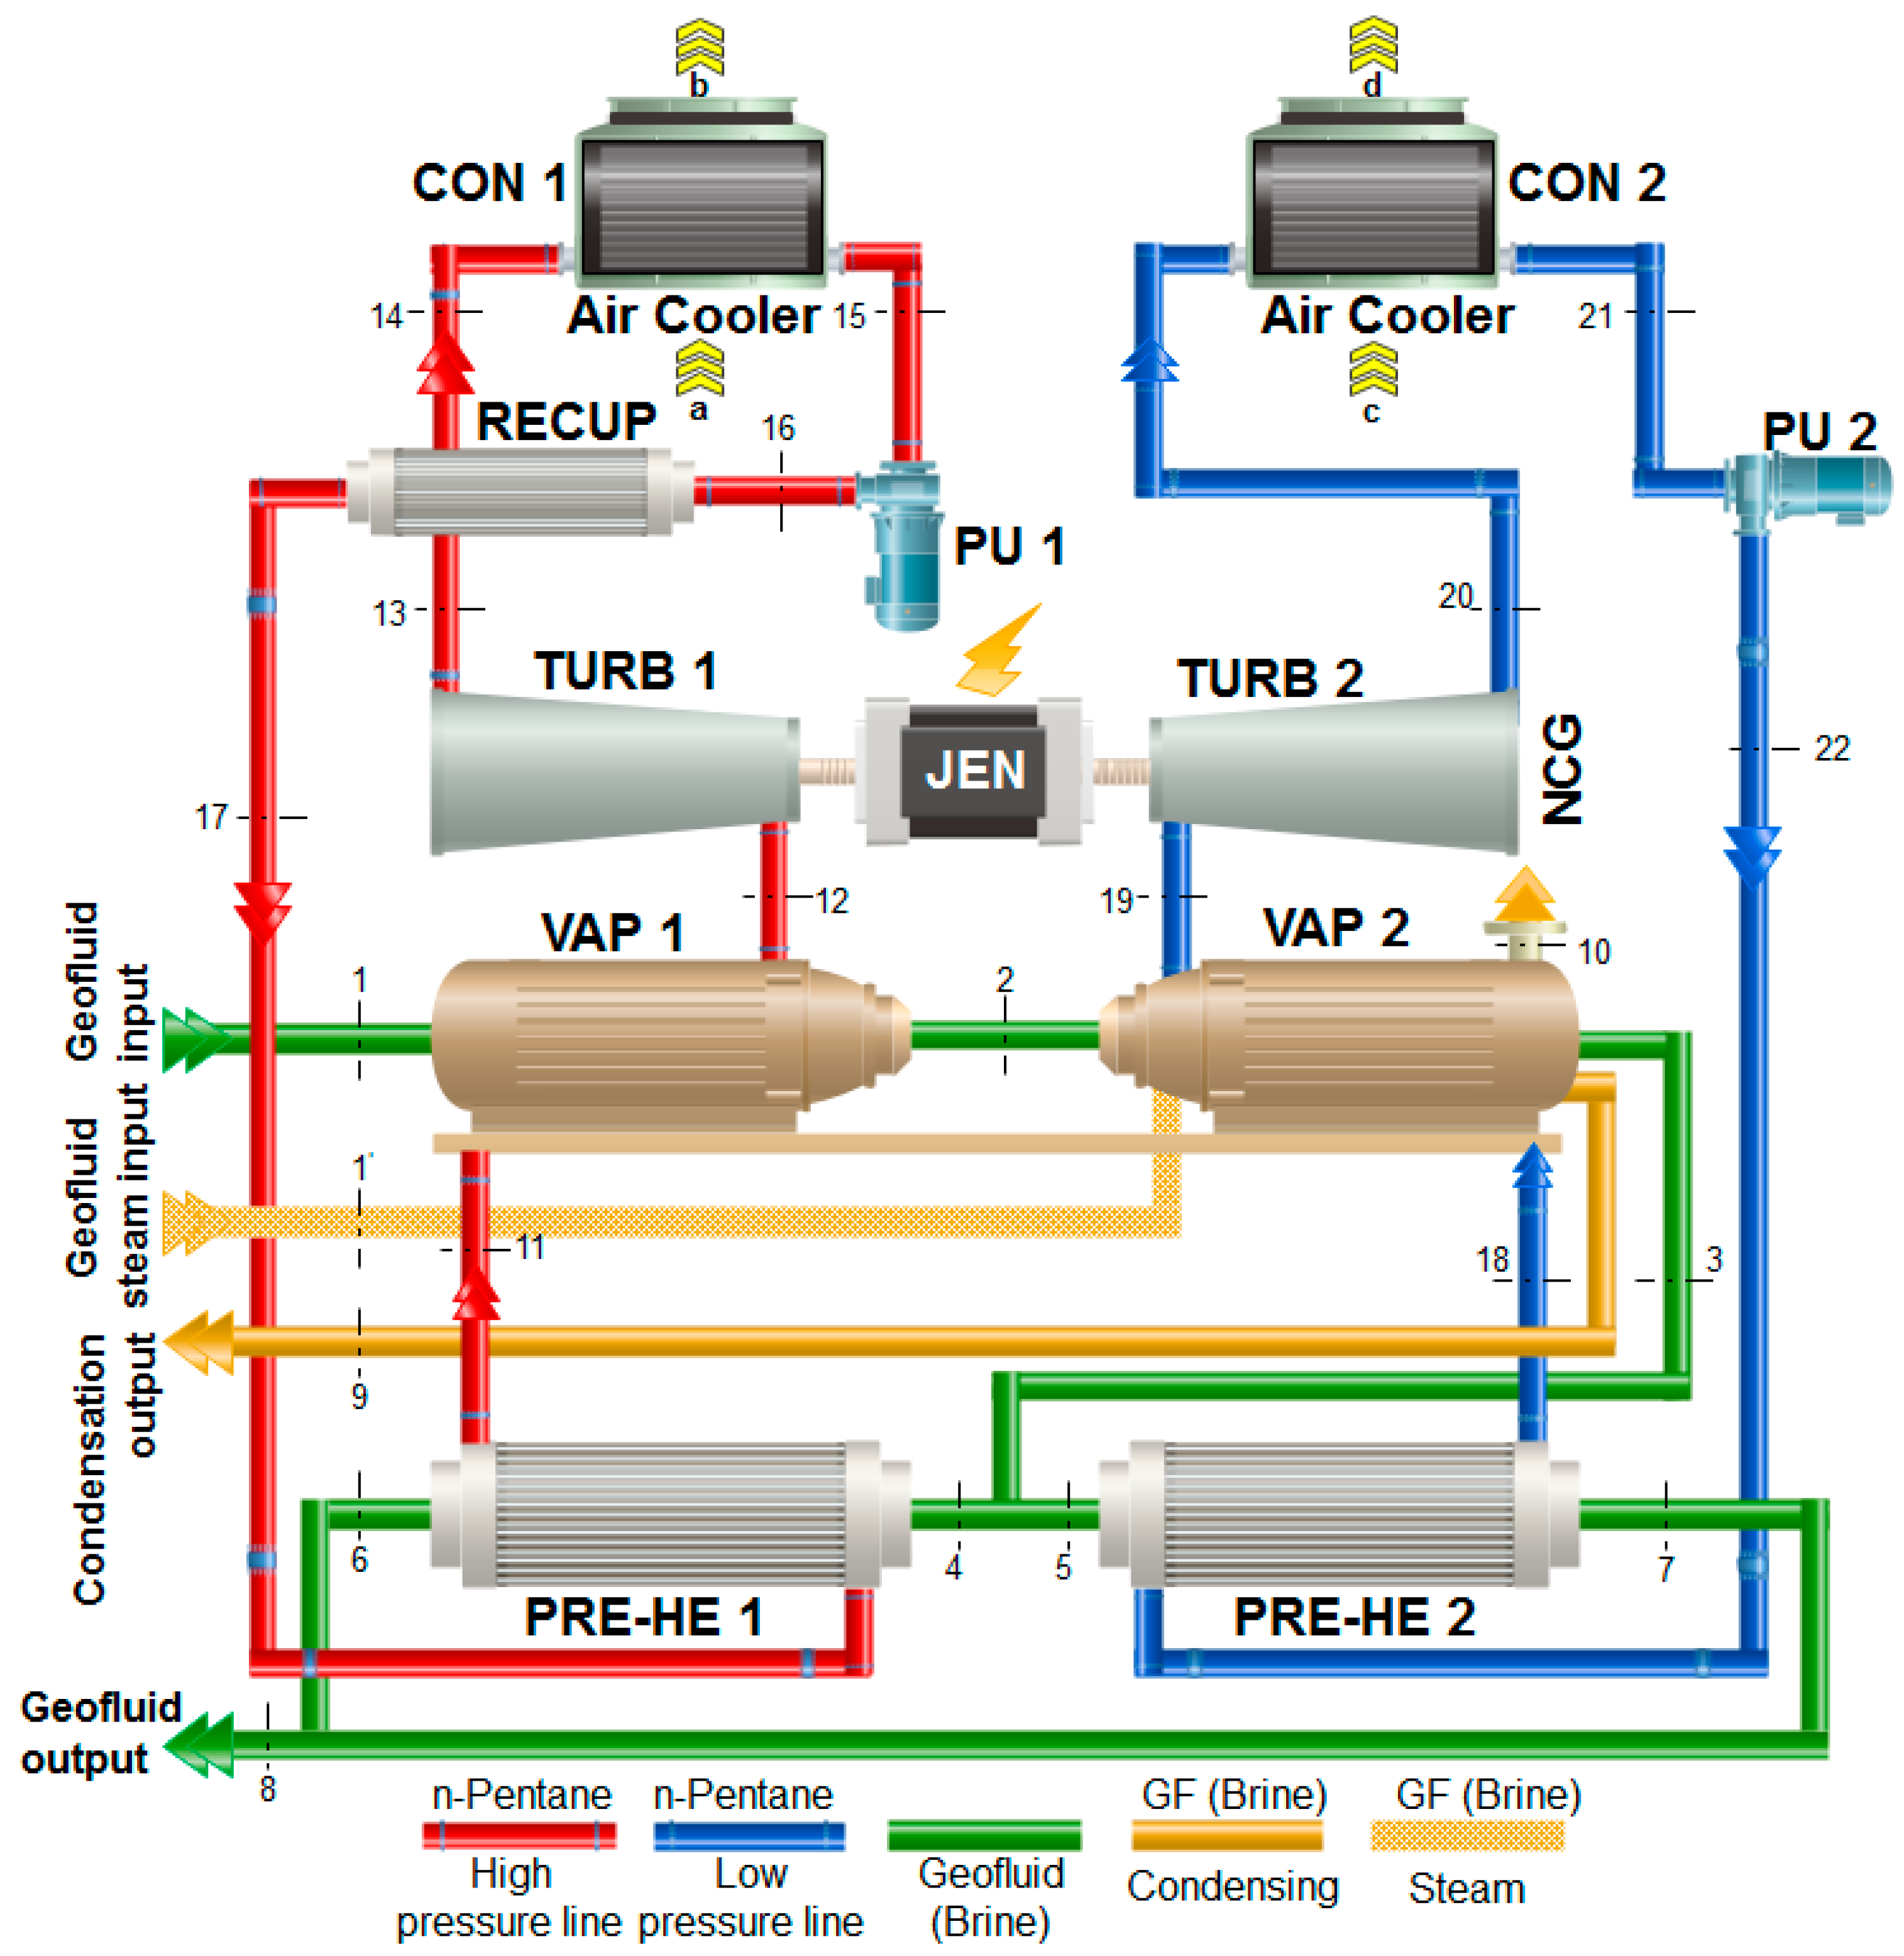
As mentioned above, it is known that for electricity production in power plants, fluid temperatures above 150 °C must be ensured. Additionally, electricity generation from binary geothermal power plants may use very low temperatures. In situations where the temperature of geothermal fluid coming from the production well is below 150 °C (typically between 110 °C and 180 °C), it is not possible to evaporate the fluid flow to form steam. Therefore, binary geothermal power plants are typically used for these applications. A basic binary geothermal power plant operates a geothermal fluid (brine) to ensure thermal input of a pressurized fluid (organic fluid) into an Organic Rankine Cycle (ORC). Geothermal brine heats the organic working fluid (R134a,
n-pentane, isopentane) in a preheater and evaporator which later vaporizes. This steam produces electrical energy by passing through a turbine driving the generator. The working fluid passing through the turbine is generally condensed in an air-cooled condenser before being pumped to the preheater [
12].
After the oil crisis of the 1970s, it was understood that energy efficiency alone could not determine how properly energy was used. Thus exergy analyses began to gain great importance. However, the basis of exergy extends to the 1870s. It was first proposed by Gibbs in 1878 [
13]. The exergy concept as a word was first used by Rant in the year 1953 [
4]. Available energy [
14], available work [
13] and availability or maximum beneficial work [
15] concepts were proposed with equivalent meaning to exergy. İleri and Gürer [
16] brought energy use, in addition to exergy use, to the agenda in Turkey in 1995. The results of their studies completed exergy analysis of apparently efficient systems, and revealed just how inefficient these systems actually were.
The most appropriate design for geothermal power plants is a complicated work encompassing multiple scientific and engineering disciplines. As a result, information should be synthesized about a variety of topics to make appropriate decisions related to the approach to be used and research methods [
17,
18,
19,
20,
21,
22]. Currently characterization of energy resources, power plant design and engineering optimization topics require creation of a conceptual framework comprising the knowledge of the latest available technology and current research. Consequently, energy inputs to the electricity power plant requiring knowledge related to available geothermal resources in the world, in general, should be accurately estimated. During the process of geothermal power plant design, design and modelling research should be fully understood, requiring detailed investigation of operating and continuing power plants. Also, conscious and correct decisions should be made relating to application of the most appropriate optimization techniques. This requires detailed investigation of the literature emphasizing techniques to bring energy power plants or thermal systems to the best state and optimization methods for engineering applications. The majority of scientific studies have focused on design optimization, selection of appropriate fluid, exergy/energy analyses and a variety of techno-economic research. Additionally, a common characteristic of ORC-based systems is the multiple nature of working conditions. The majority of application areas experience variations in thermal resource (or cooling processes) over time and the system should adapt to the working regime to ensure optimum performance. There are few studies related to control aspects and off-design performance of ORC systems [
23,
24,
25,
26,
27,
28,
29,
30,
31,
32,
33,
34,
35]. Thus, all the following studies are related to low temperature ORCs.
As the development of renewable energy resources has intensified, the researches into ORC technologies producing electricity from low enthalpy geothermal resources have increased. The majority of these studies revolve around geothermal binary power plants and their design. At the beginning of the 1970s, Anderson [
36] explained the design of the first binary geothermal binary power plant in the USA, known as Magmamax (and second globally). A short while after, Bliem et al. [
37] developed a computer model to research the effect on levelized cost of electricity (LCOE) with five different temperatures for a Rankine cycle power plant with simple propane-based geothermal resource. Kanoğlu [
38] studied the design of a Rankine cycle power plant with dual pressure using isopentane as working fluid. This research showed that developing efficiency of turbine and condenser provided the largest improvement to power plant efficiency. It also proved that in air-cooled power plants seasonally changing condenser temperatures caused significant changes in power plant output. Öztürk et al. [
39] investigated the energy and exergy analysis for the Kızıldere geothermal power plant. This plant was the first geothermal power plant built in Turkey in 1974. They used real power plant data and researched the effect of a variety of dead situation characteristics on Kızıldere geothermal power plant exergy efficiency to find the optimum performance and working conditions. The calculations given are based on a mean pressure of 0.095 MPa and mean reference temperature of 16 °C. The energy and exergy efficiencies for the whole power plant were determined as 4.9% and 20.5% respectively. Hettiarachchi et al. [
40] applied a more sophisticated optimization method (steepest descent) to design a simple water-cooled ORC binary energy power plant. This study varied the speed of geothermal fluid and cooling water for a variety of working fluids in addition to the evaporation and condensation temperature to minimize the net power output rate of the heat exchanger area. The results of this optimization showed that choice of working fluid may have a significant effect on power plant costs. Sohel et al. [
41] presented optimization of an ORC geothermal power plant performance by optimizing study point parameters based on real time hourly weather data and geothermal fluid flow rates in the search for performance improvement. They characterized the Rotokawa geothermal power plant using energy generation performance and local weather conditions. On the hottest day, the maximum production increase was 6.8%. Due to the operating binary unit production capacity of the Rotokawa power plant with 35 MW, investment in a water-enriched air-cooled system would provide 2 MW productions on the hottest days. Franco and Villani [
42] used an iterative optimization approach and produced a comprehensive data set related to design of geothermal binary power plants. In this study they developed a method to identify optimum combinations of working fluid and cycle type for three different geothermal input and re-injection temperature sets. The method explained by Franco and Villani [
42] considered supercritical cycles, dual pressure Rankine cycles and classic Rankine cycles, in addition to hydrocarbons, synthetic cooling fluids and mixtures to discuss six different working fluids. The results of the study found different combinations of cycle type and working fluid were appropriate for different geothermal brine input and re-injection temperatures and the optimized solution produced significant improved exergetic efficiency. Sohel et al. [
43] presented an iterative method to model the effect of environmental temperature on an air-cooled ORC. Environmental temperature affected the performance of condensers on both routes and so the performance of the whole cycle. Firstly, changing the balance pressure within the condenser changed the turbine output pressure and turbine pressure ratios. The turbine pressure ratio is an important parameter to determine energy produced by the turbine because it directly affects power plant output. Secondly changing the condenser output temperature and environmental temperature changes the pump input and output conditions. Thus the balance temperature and pressure in the vaporizer is affected. The developed method aimed to rebalance conditions for both the condenser and vaporizer. To show the validity of the method, they studied two situations based on performance of a real power plant. The developed method was stable and converged independently from the initial conditions permitted by the physical properties of the working fluid. This method is effective with appropriate initial conditions and limitations under static or dynamic variables for cycles using saturated steam in addition to over-heated steam. Ghasemi et al. [
44] developed a model for an operating ORC using low temperature geothermal resources. Equipped with an air-cooled condenser system, they used Aspen Plus to simulate the performance of the present ORC. The model included real properties of all components and was confirmed by 5000 measurements over a broad interval of environmental temperature. Thus the net output power of the system appeared to be maximized. Different optimal operating strategies were recommended linked to environmental temperature. As the environmental temperature increased in the study, optimum heating values increased and they stated a 9% increase was ensured in total power produced each year. Their study used a representative hourly environmental temperature profile to determine the most appropriate power station design for a certain climate.
In the recent literature, there are not so many models based on physical understanding, broad conceptual design and optimization modelling to estimate the performance of binary geothermal ORC power plant. Generally, it has been focused on the power output and system performance (thermodynamic, economic and environmental) of low temperature sourced power plants, especially efficiency as objective functions, geothermal brine reservoir or crustal output properties, environmental temperature, working fluid selection for ORC, evaluation of new analysis methods, new cycle designs, adding/removing components to existing cycles or renovation studies. However, considering the geothermal power plants and theirs performance analyses, it will be beneficial to rapidly produce a simple thermodynamic model simulating the working cycle. Especially the use of the ABC optimization method used for modelling thermal systems will determine improvement potentials of system components, interactions between components and aspects and potentials for energy saving to provide better performance of real system models. To the best of the authors’ knowledge, this topic is examined for the first time in the literature. This has formed the source of motivation for the authors.
3. Results
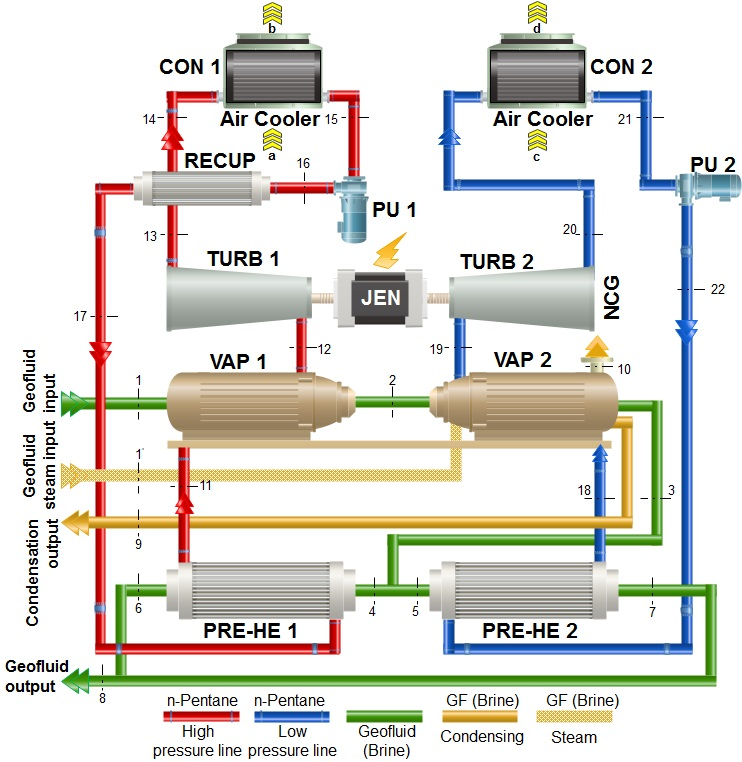
In this study, an air-cooled binary geothermal organic Rankine cycle (ORC) power plant is thermodynamically modelled to observe, test and check its thermodynamic performance more accurately and rapidly. Additionally, to increase the modelled system performance, the artificial bee colony (ABC) method is used to maximize system exergy efficiency. With this aim, real operating data (flow rate, pressure and temperature values from input and output lines of system components) from an existing power plant were collected by the system’s Supervisory Control and Data Acquisition (SCADA) program on 14 April 2013. This date is a transitional period between winter and summer seasons for data from the Sinem GPP. The environmental temperature and pressure on that date were recorded as 18 °C and 1 bar, respectively. Later the operational data according to state numbers of
Figure 1 are presented in
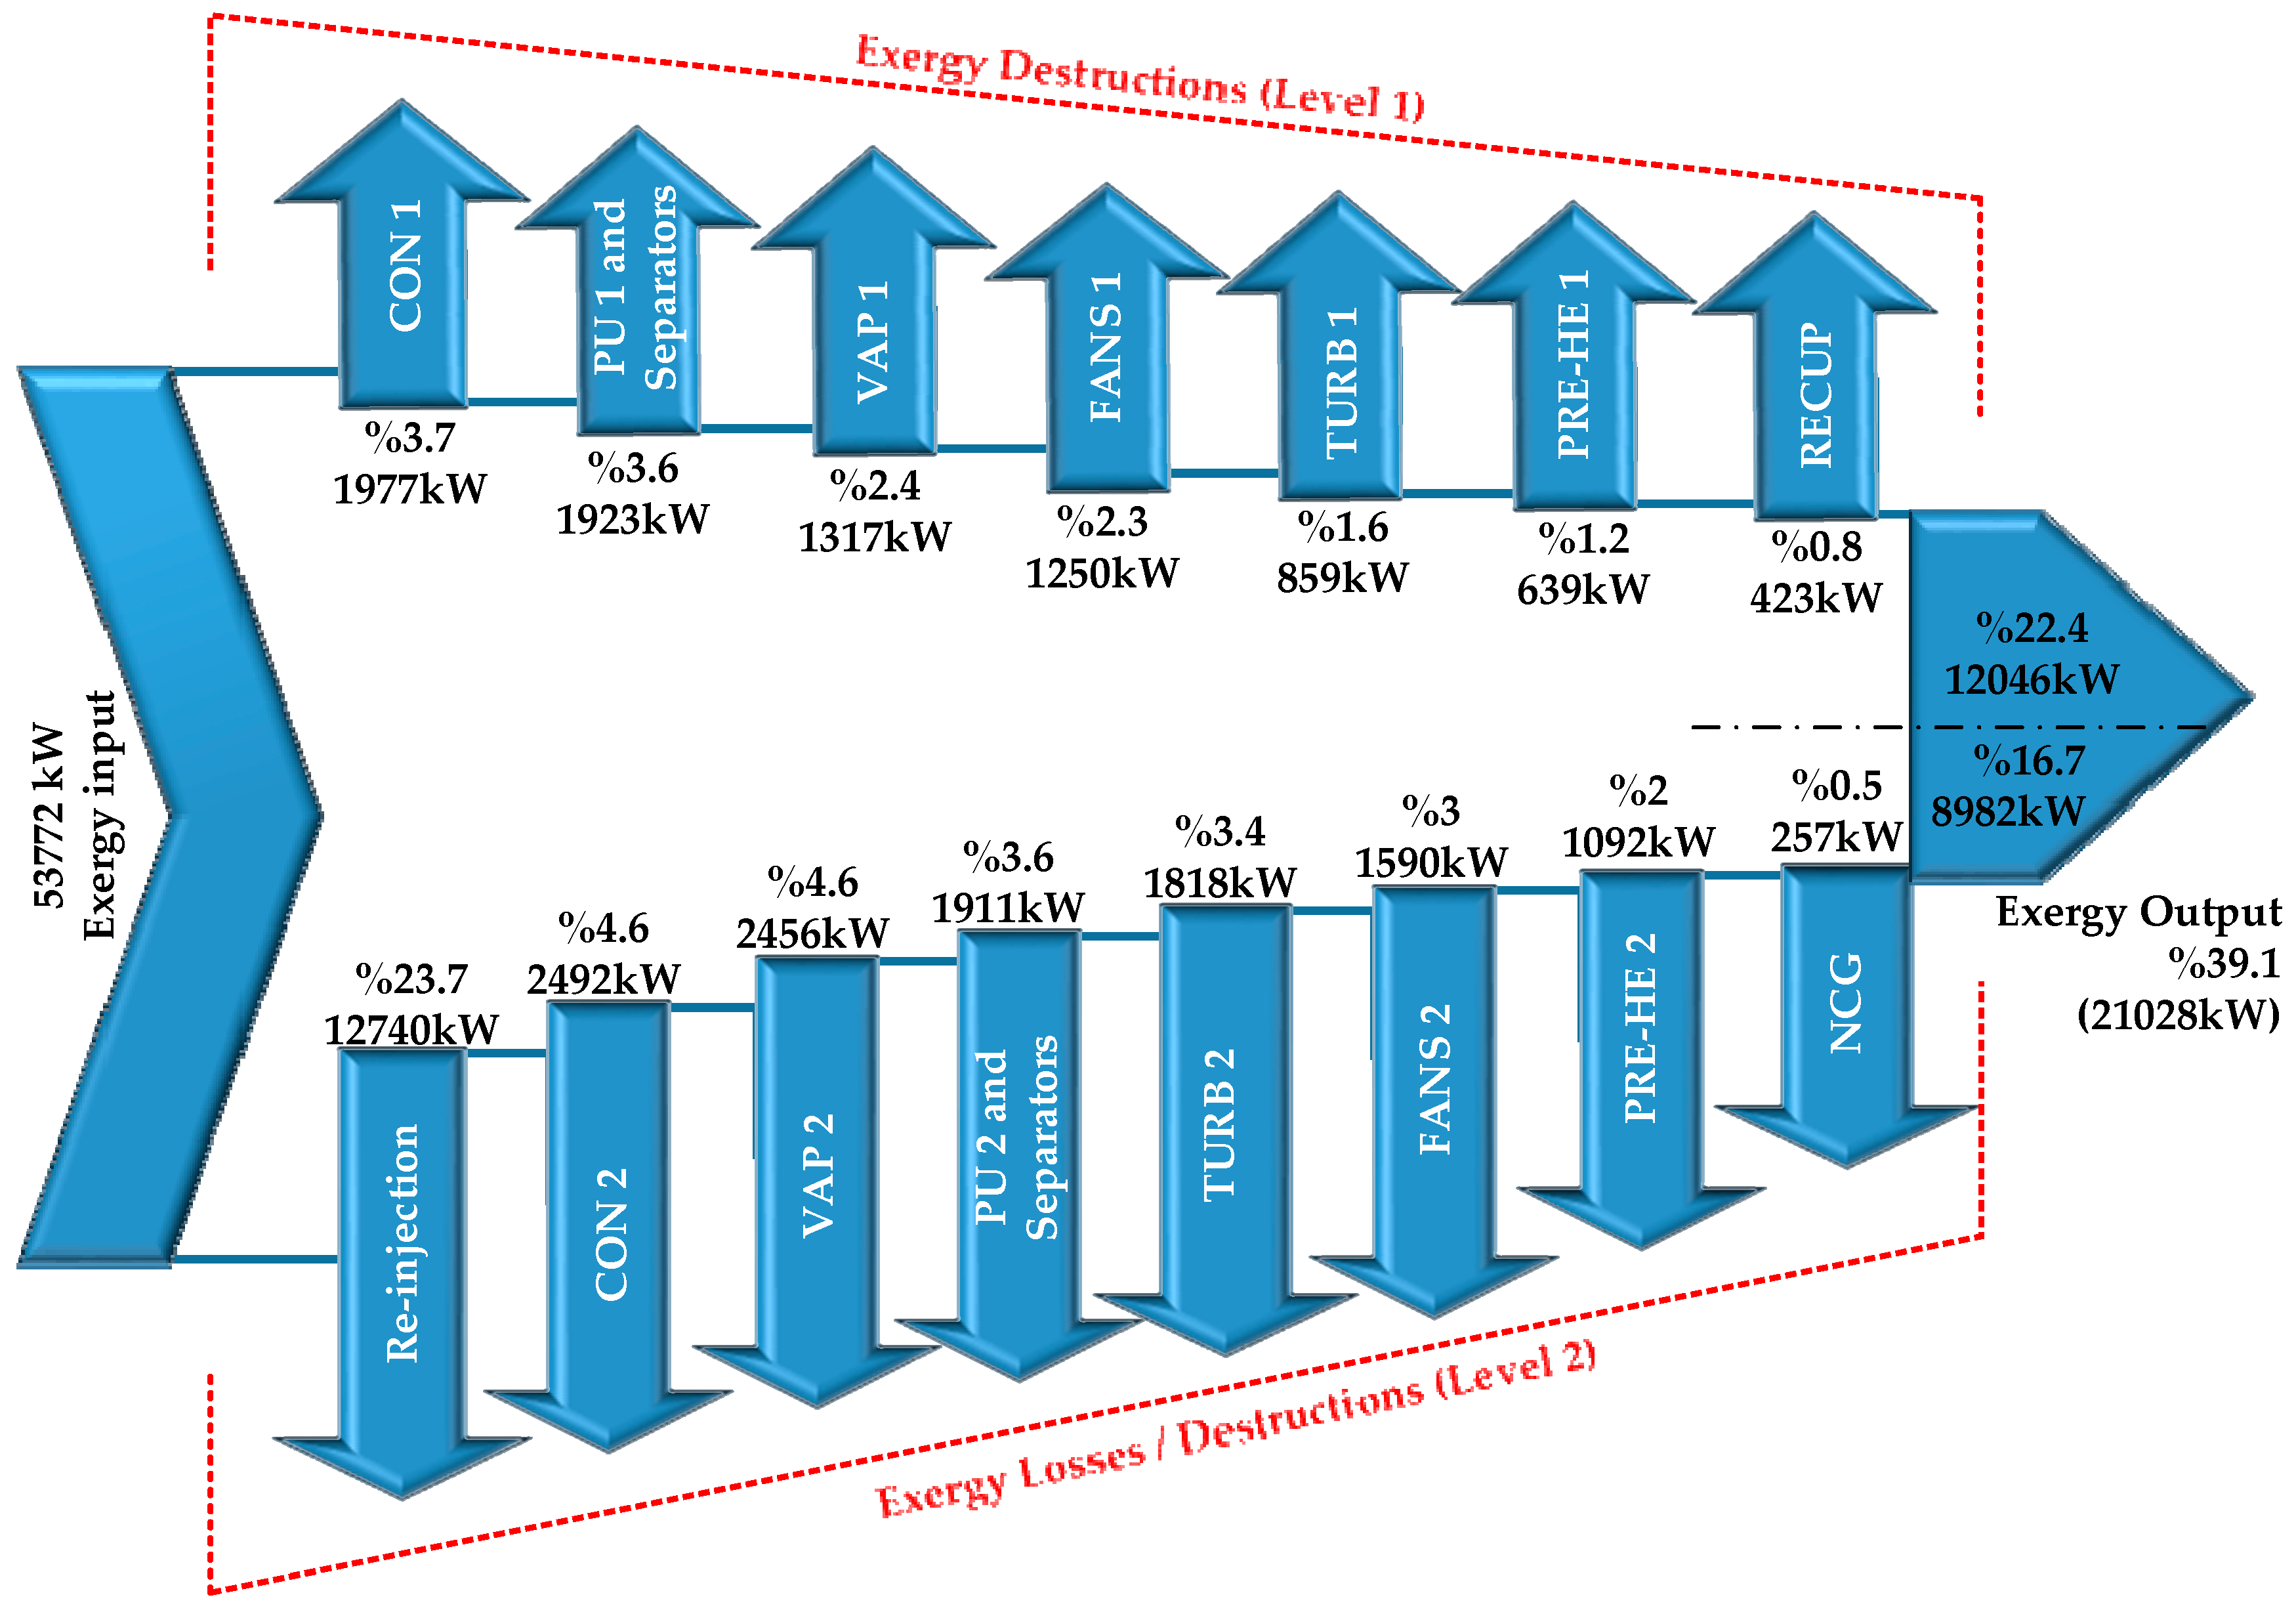
Table 1 and the equations given in the Thermodynamic Analysis section are used to complete exergy analysis. The results of the exergy analysis for the real GPP are shown as the Grossman flow diagram in
Figure 4. The exergy efficiency of the power plant is calculated as 39.1% based on the exergy input of geofluid (brine) and its steam entering the system. However, the power consumed in the operation of turbines, pumps, fans, auxiliary equipment of the GPP is met by the gross power generated by the plant. When this was deduced, the system exergy efficiency was found to be 14.52%. Turning to
Figure 4, the result is that 60.9% of the exergy input rate entering the system is lost as waste heat (exergy loss and destruction). Of the exergy input rate of the geofluid entering the system, 23.7% and 0.5% is lost in the re-injection phase and in the phase of releasing NCG into the atmosphere as exergy loss (heat loss-waste heat), respectively. Of the remaining exergy input rate, 20.6% and 15.6% are consumed as exergy destruction on levels I and II, respectively. The highest exergy destruction percentages for components are 4.6% from condenser CON 2 and vaporizer VAP 2, 3.7% from condenser CON 1 and then 3.6% from pumps and separators on level I and II.
As observed in
Figure 4, there is approximately 53,772 kW exergy input rate into the system from the geofluid and its steam. Of this total exergy input rate, 12,740 kW is calculated as the exergy rate spent on re-injection, 11,102 kW is exergy destruction rate occurring in system components on level I, 8388 kW is exergy destruction rate of those in level II and 275 kW is the exergy loss rate from NCG. The highest exergy destruction rate in the GPP occurs in the condenser CON 2 in level II of the binary cycle. This is followed by VAP 2 on level II and then CON 1 on level I. In this situation the priority components requiring improvement are CON 2, VAP 2 and CON 1.
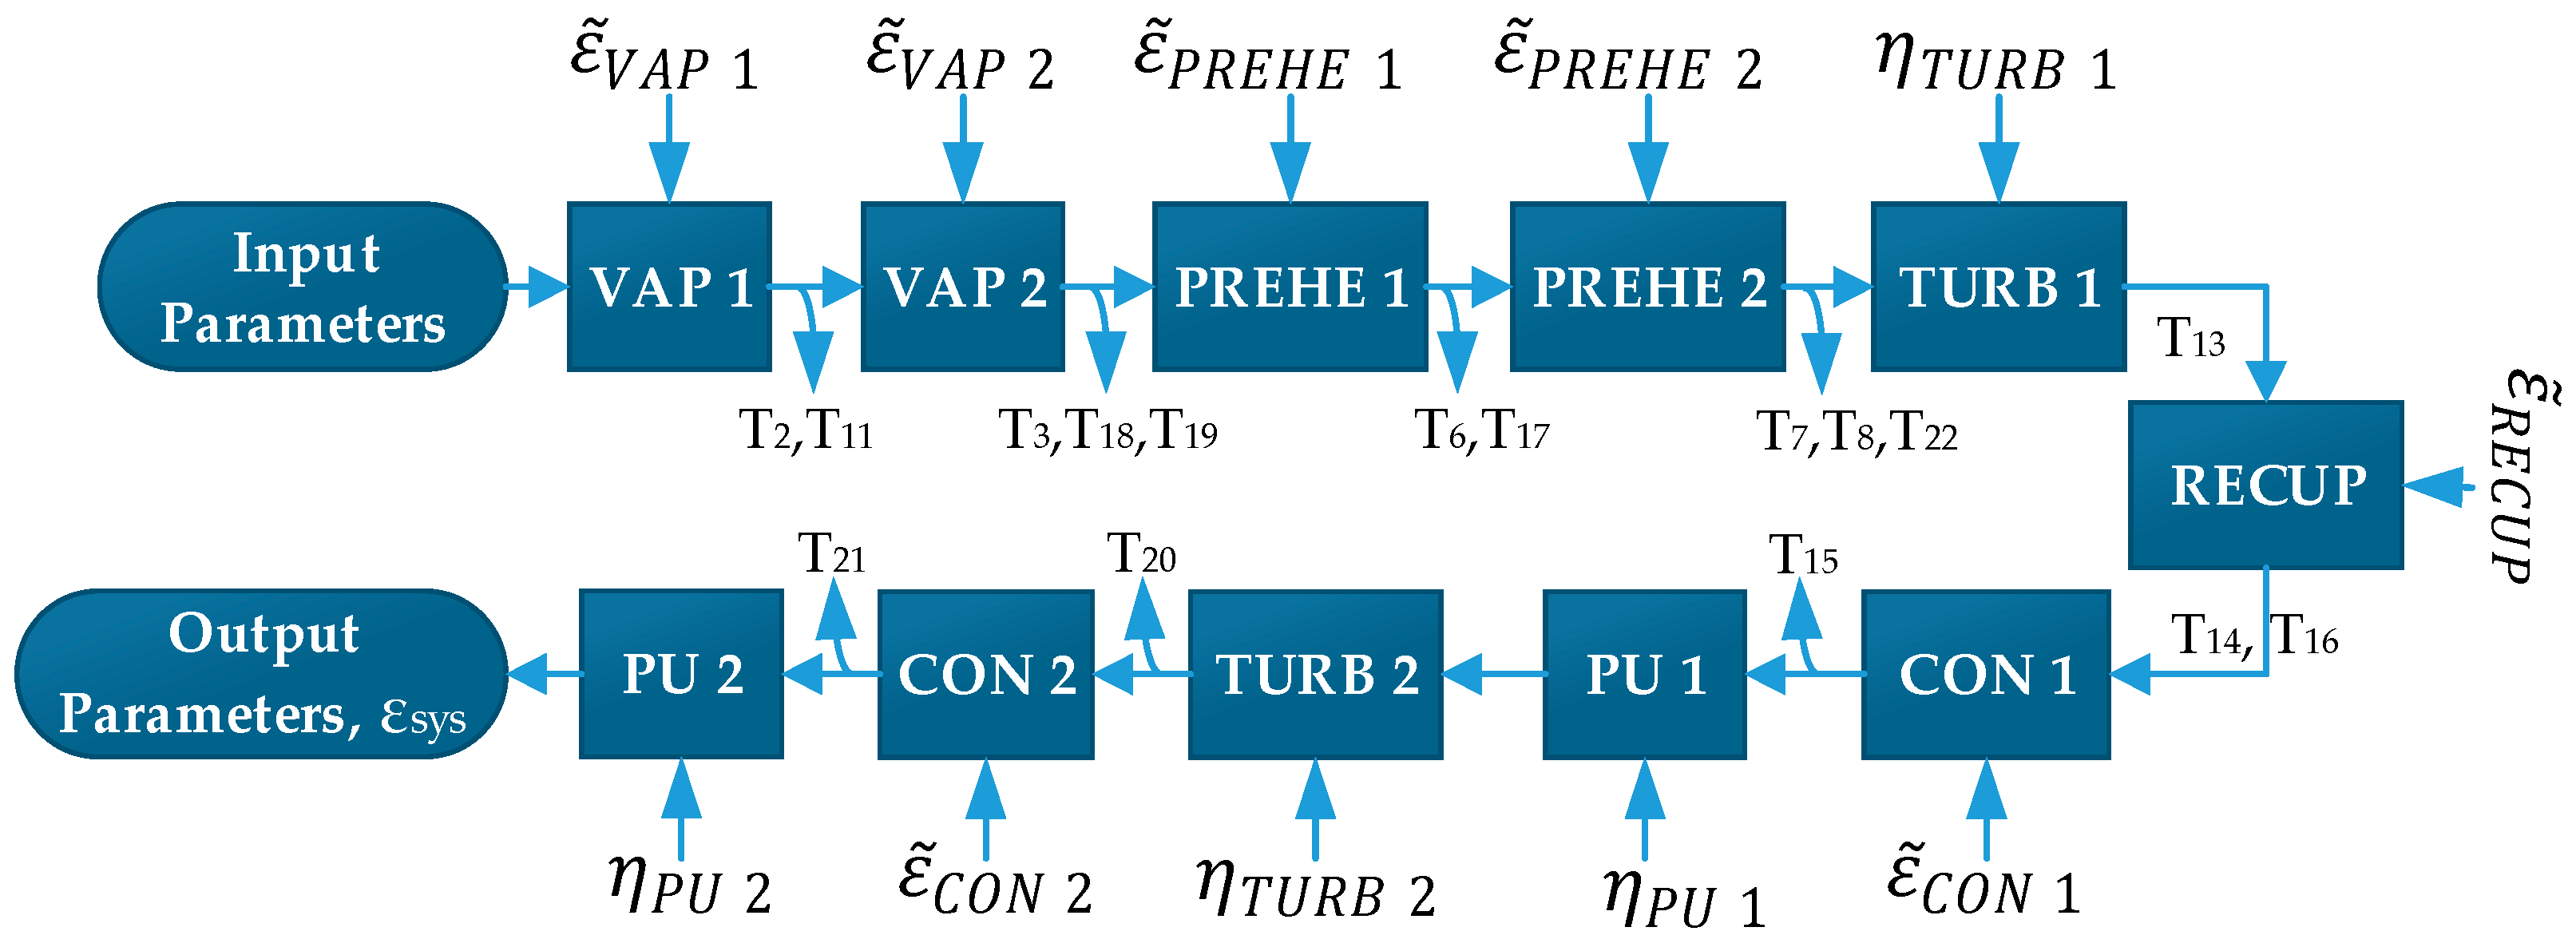
As described in the Modelling of the System section, modelling is based on the exergy analysis of a real GPP. The data (mass flow rate, temperature and pressure on steam lines in
Figure 1) entering and exiting the system and its components are recorded momentarily. Thus, all the data are dynamic over time.
Two parameters (
and η
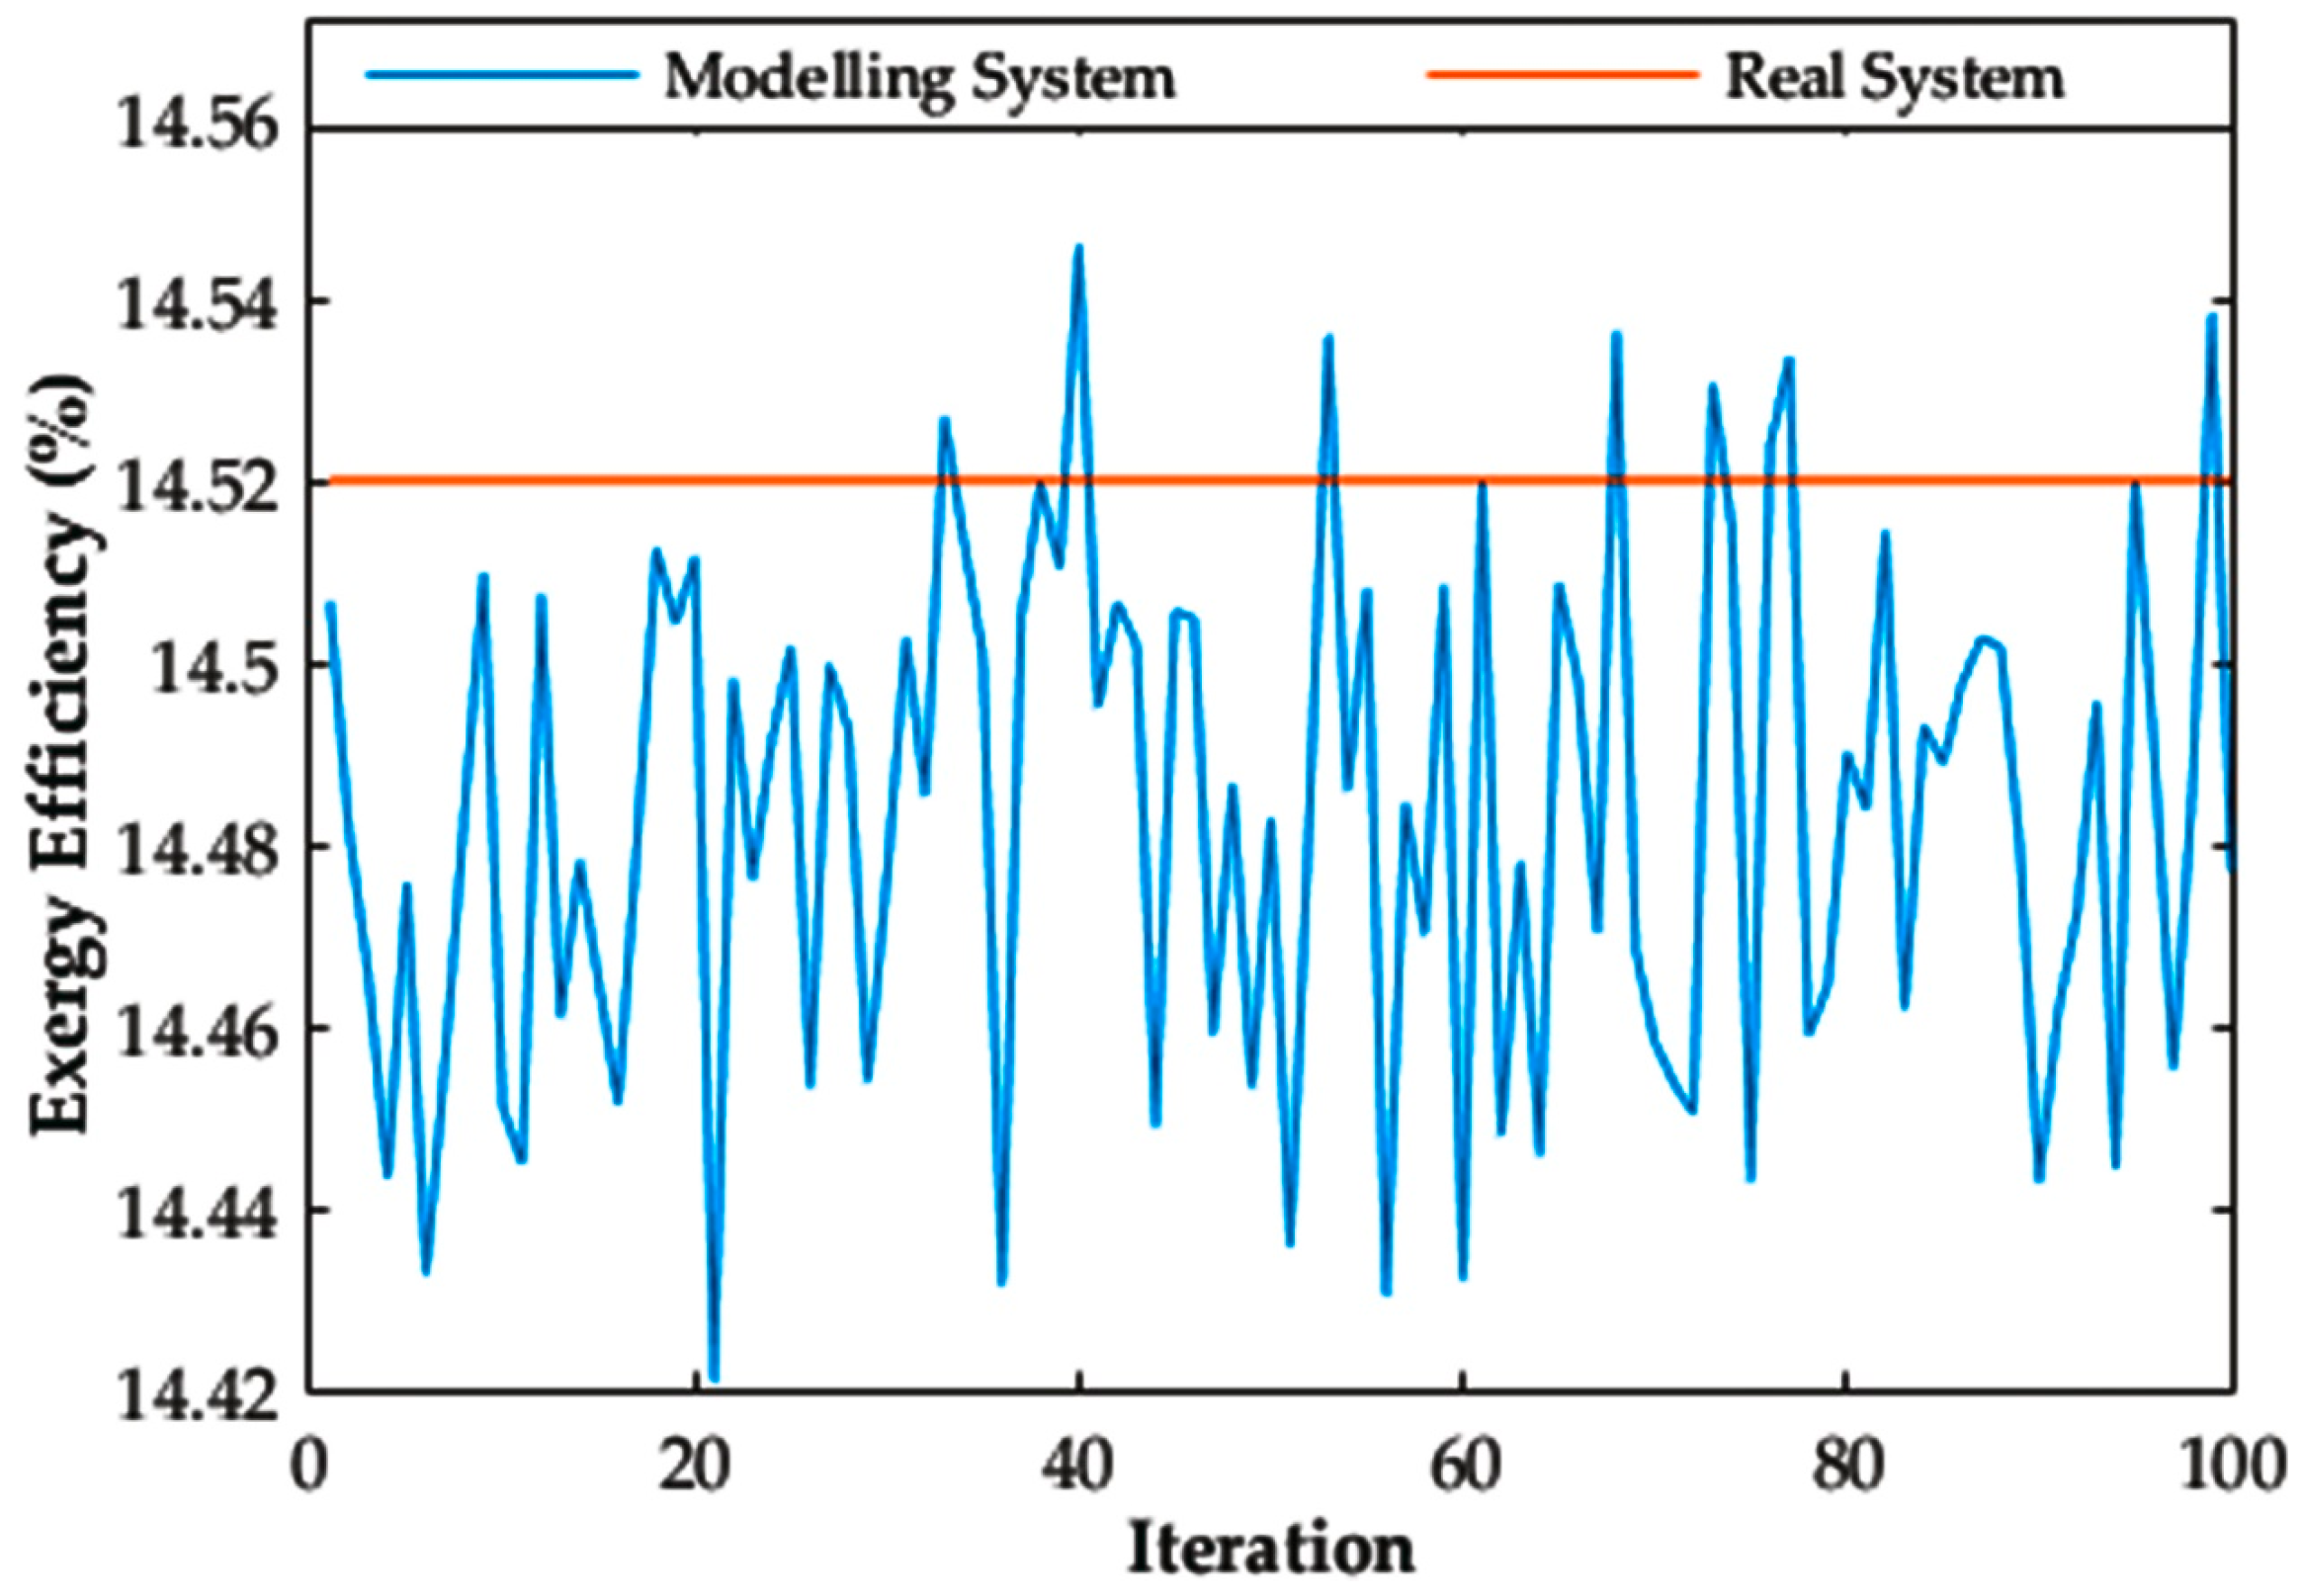
k) with these data are established a relationship between the system components, so an integrated system model has been created. As a result, the behaviour of the model is very close to that of the real system and simulates it accurately. Therefore, the convergence behaviour of the model for modelling the real system according to the exergy efficiency is presented in
Figure 5. Note that the exergy efficiency of the real system is 14.52%. It can be seen that the exergy efficiency of the model fluctuates with an increase in iteration number and varies between 14.42% and 14.55%. This fluctuation occurs during the matching process between the real system and the model. Regarding
Figure 5, the maximum and minimum efficiencies equal respectively the 40th and 21th iterations number occurring at exergy efficiency of the model and the efficiency of the real system is very close to that of the model.
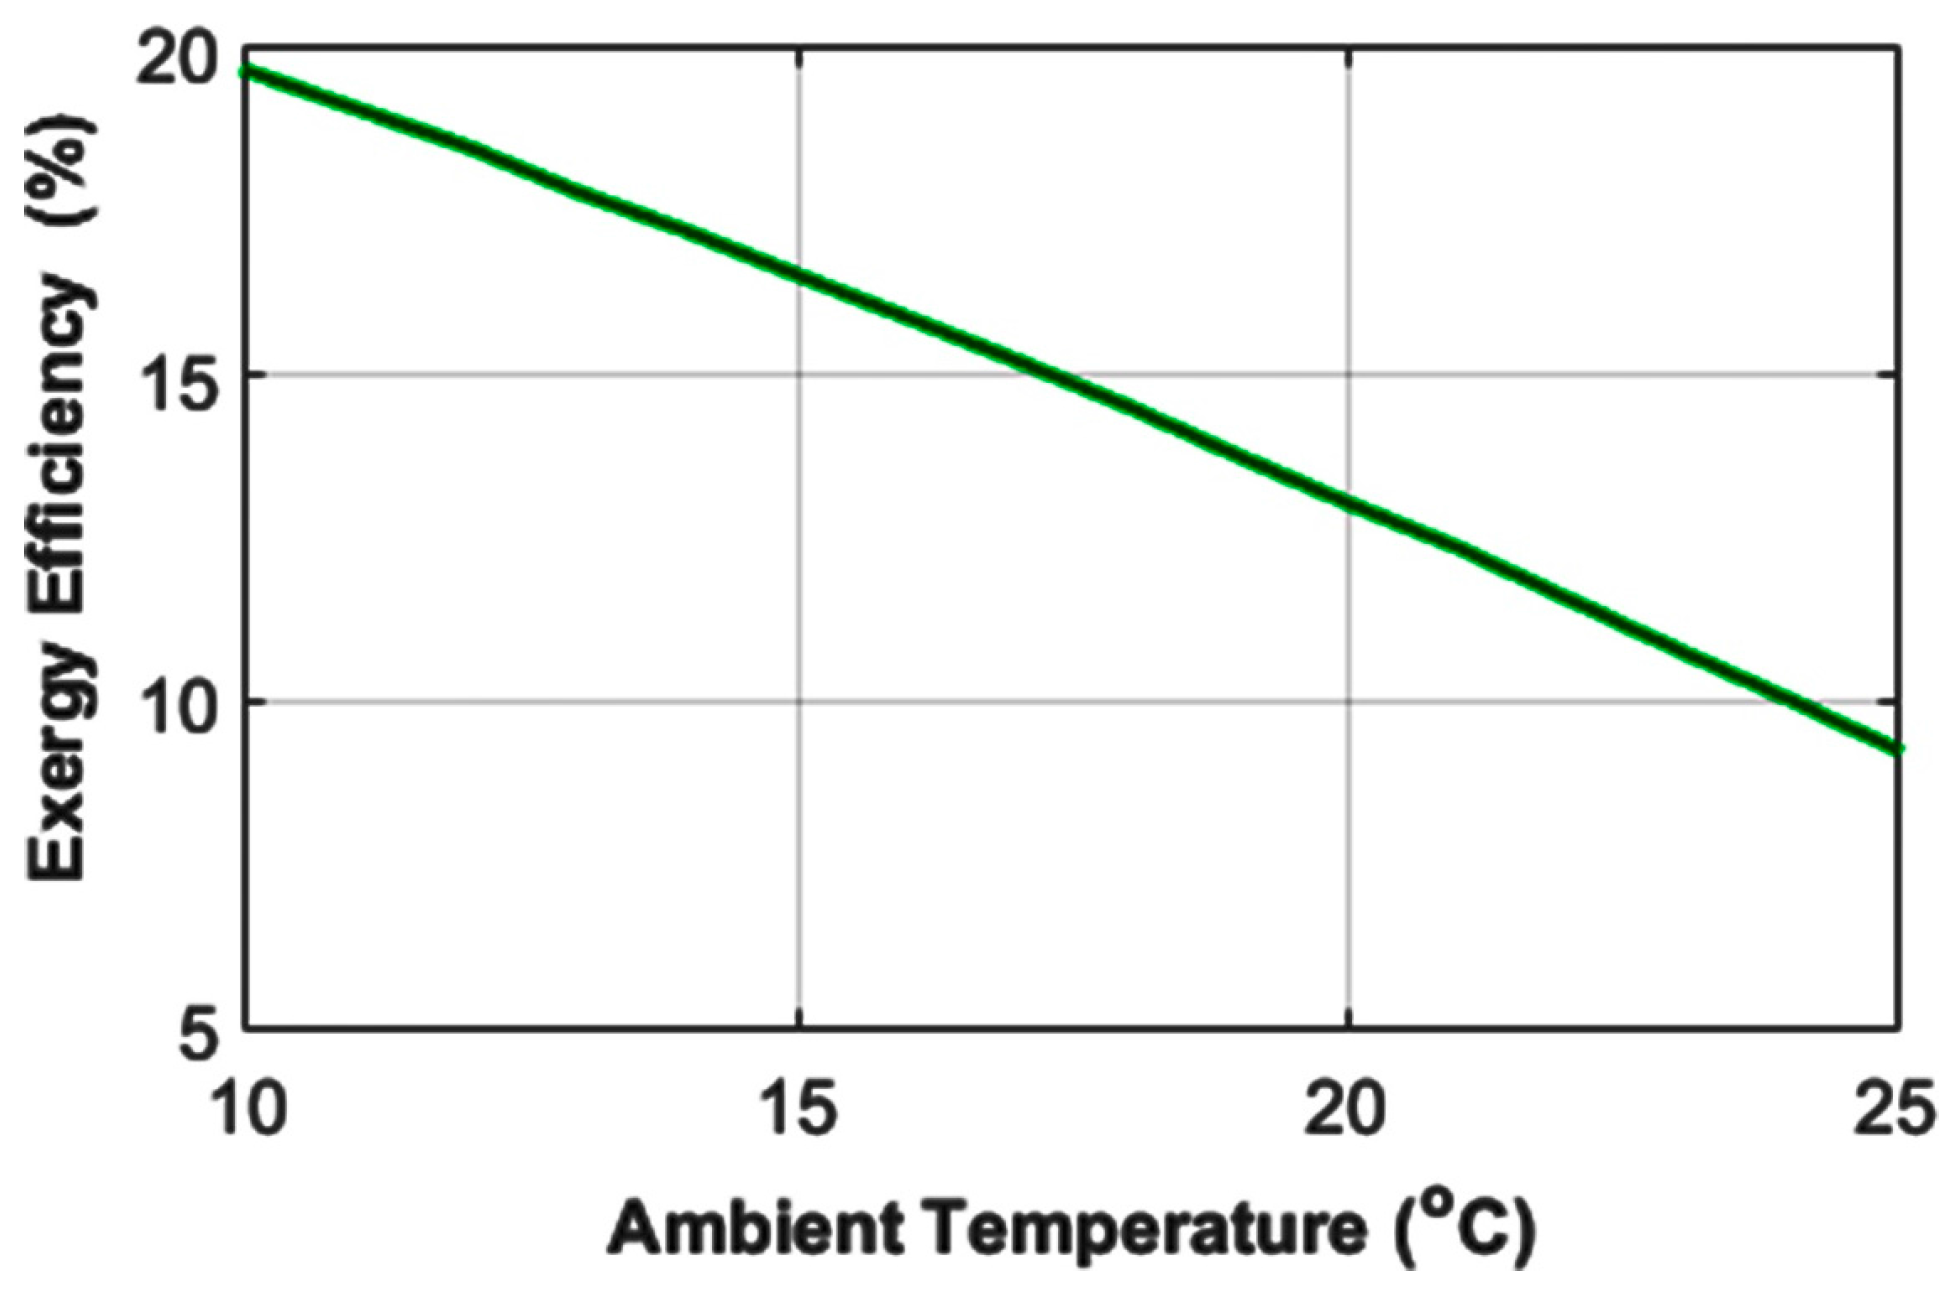
To display dynamic behaviour of the model, the variation in system exergy efficiency with environmental (ambient) temperature is shown in
Figure 6. As it can be seen from
Figure 6, while environmental temperature increases, the exergy efficiency of the system falls. In conclusion, in the general literature, all studies and all engineers, operators and workers researching air-cooled organic Rankine cycles acknowledge that the beneficial exergy of the system is affected by environmental temperature and is known that system exergy efficiency decreases [
56,
57,
58,
59].
After the modelling of the system mentioned above, the thermodynamic performance of the model for the Sinem GPP with real air-cooled geothermal binary organic Rankine cycle has been maximized with the ABC optimization method. To apply the ABC method to the developed model and thus find the best performance of the Sinem GPP, the main parameters presented in
Table 2 are used.
By optimizing the model as maximum exergy efficiency, the optimum values of the pressure, temperature and flow rate data given in
Table 2 for the line numbers of
Figure 1 are found. During the ABC optimization process, the variable parameters and constraints given in
Table 3 are used. The constraints are variable parameters simultaneously. As the real system was modelled according to temperature data at the line numbers in
Figure 1, the exergy efficiency of the developed model was not significantly affected by the changes of temperature data. Each temperature change on the system line numbers, especially changes in the source/well temperature and pressure data in the cycle, completely change the model and sometimes result in insolvability. So temperature and pressure data of the real system were accepted as being dependent or kept fixed some places. Because of this reason, all the data except temperature are used for optimization. Thus, some cases are created by grouping the variable/constraint parameters (see
Table 3). To maximize the exergy efficiency of the model of the Sinem GPP, the cases accepted for optimizing the model in the best way is listed in the last column of
Table 3. Here, the integers specify 12 cases (variable parameter groups). Each of these groups is called as “case”. For example, seeing on the first line of
Table 3 indicates that the variable parameter P
1 is included in case 1, case 3 and case 6. To reveal these cases, numerous calculations have been repeated. In conclusion, to evaluate the effects of variable parameters given in
Table 3 on exergy efficiencies of the modelling components of the GPP components, 12 cases were determined as optimization conditions.
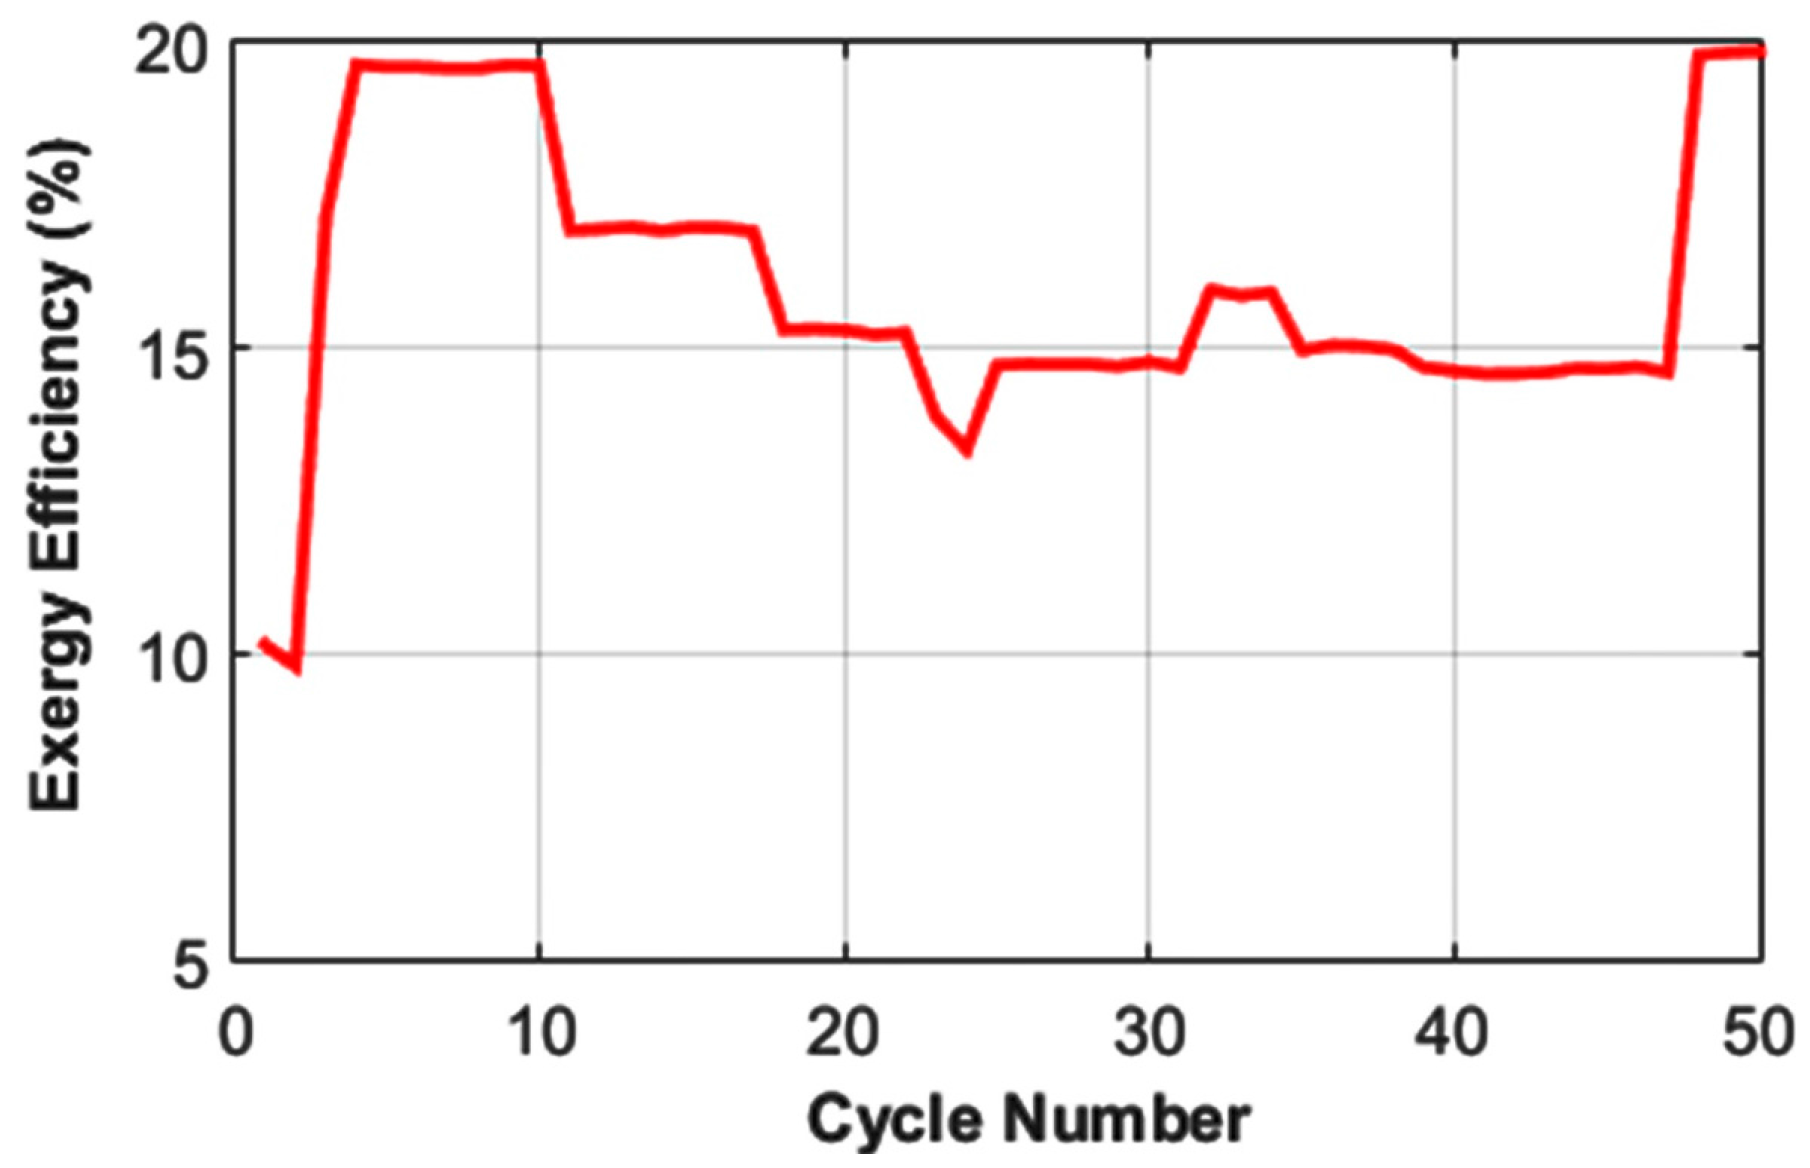
The behaviour of the optimization process for maximizing the exergy efficiency of the model of the Sinem GPP is illustrated in
Figure 7, as a change of exergy efficiency versus cycle number.
Regarding
Figure 7, the system exergy efficiency is taken as the objective function and the function has been maximized. As observed from the figure, although the ABC method may not select a suitable random solution (10.16%) at the initializing stage of finding the best exergy efficiency, it however can rapidly converge to the optimum (19.76% as maximum) exergy efficiency in 4th cycle. It remains at this value until 10th cycle. There are declines in exergy efficiency between 10th and 48th cycles due to random change in the constraint range of variable parameters. Still they are above the real value (14.52%). After 48th cycle, the exergy efficiency has again reached its maximum value. As a result, the ABC optimization process is completed on the model of the GPP.
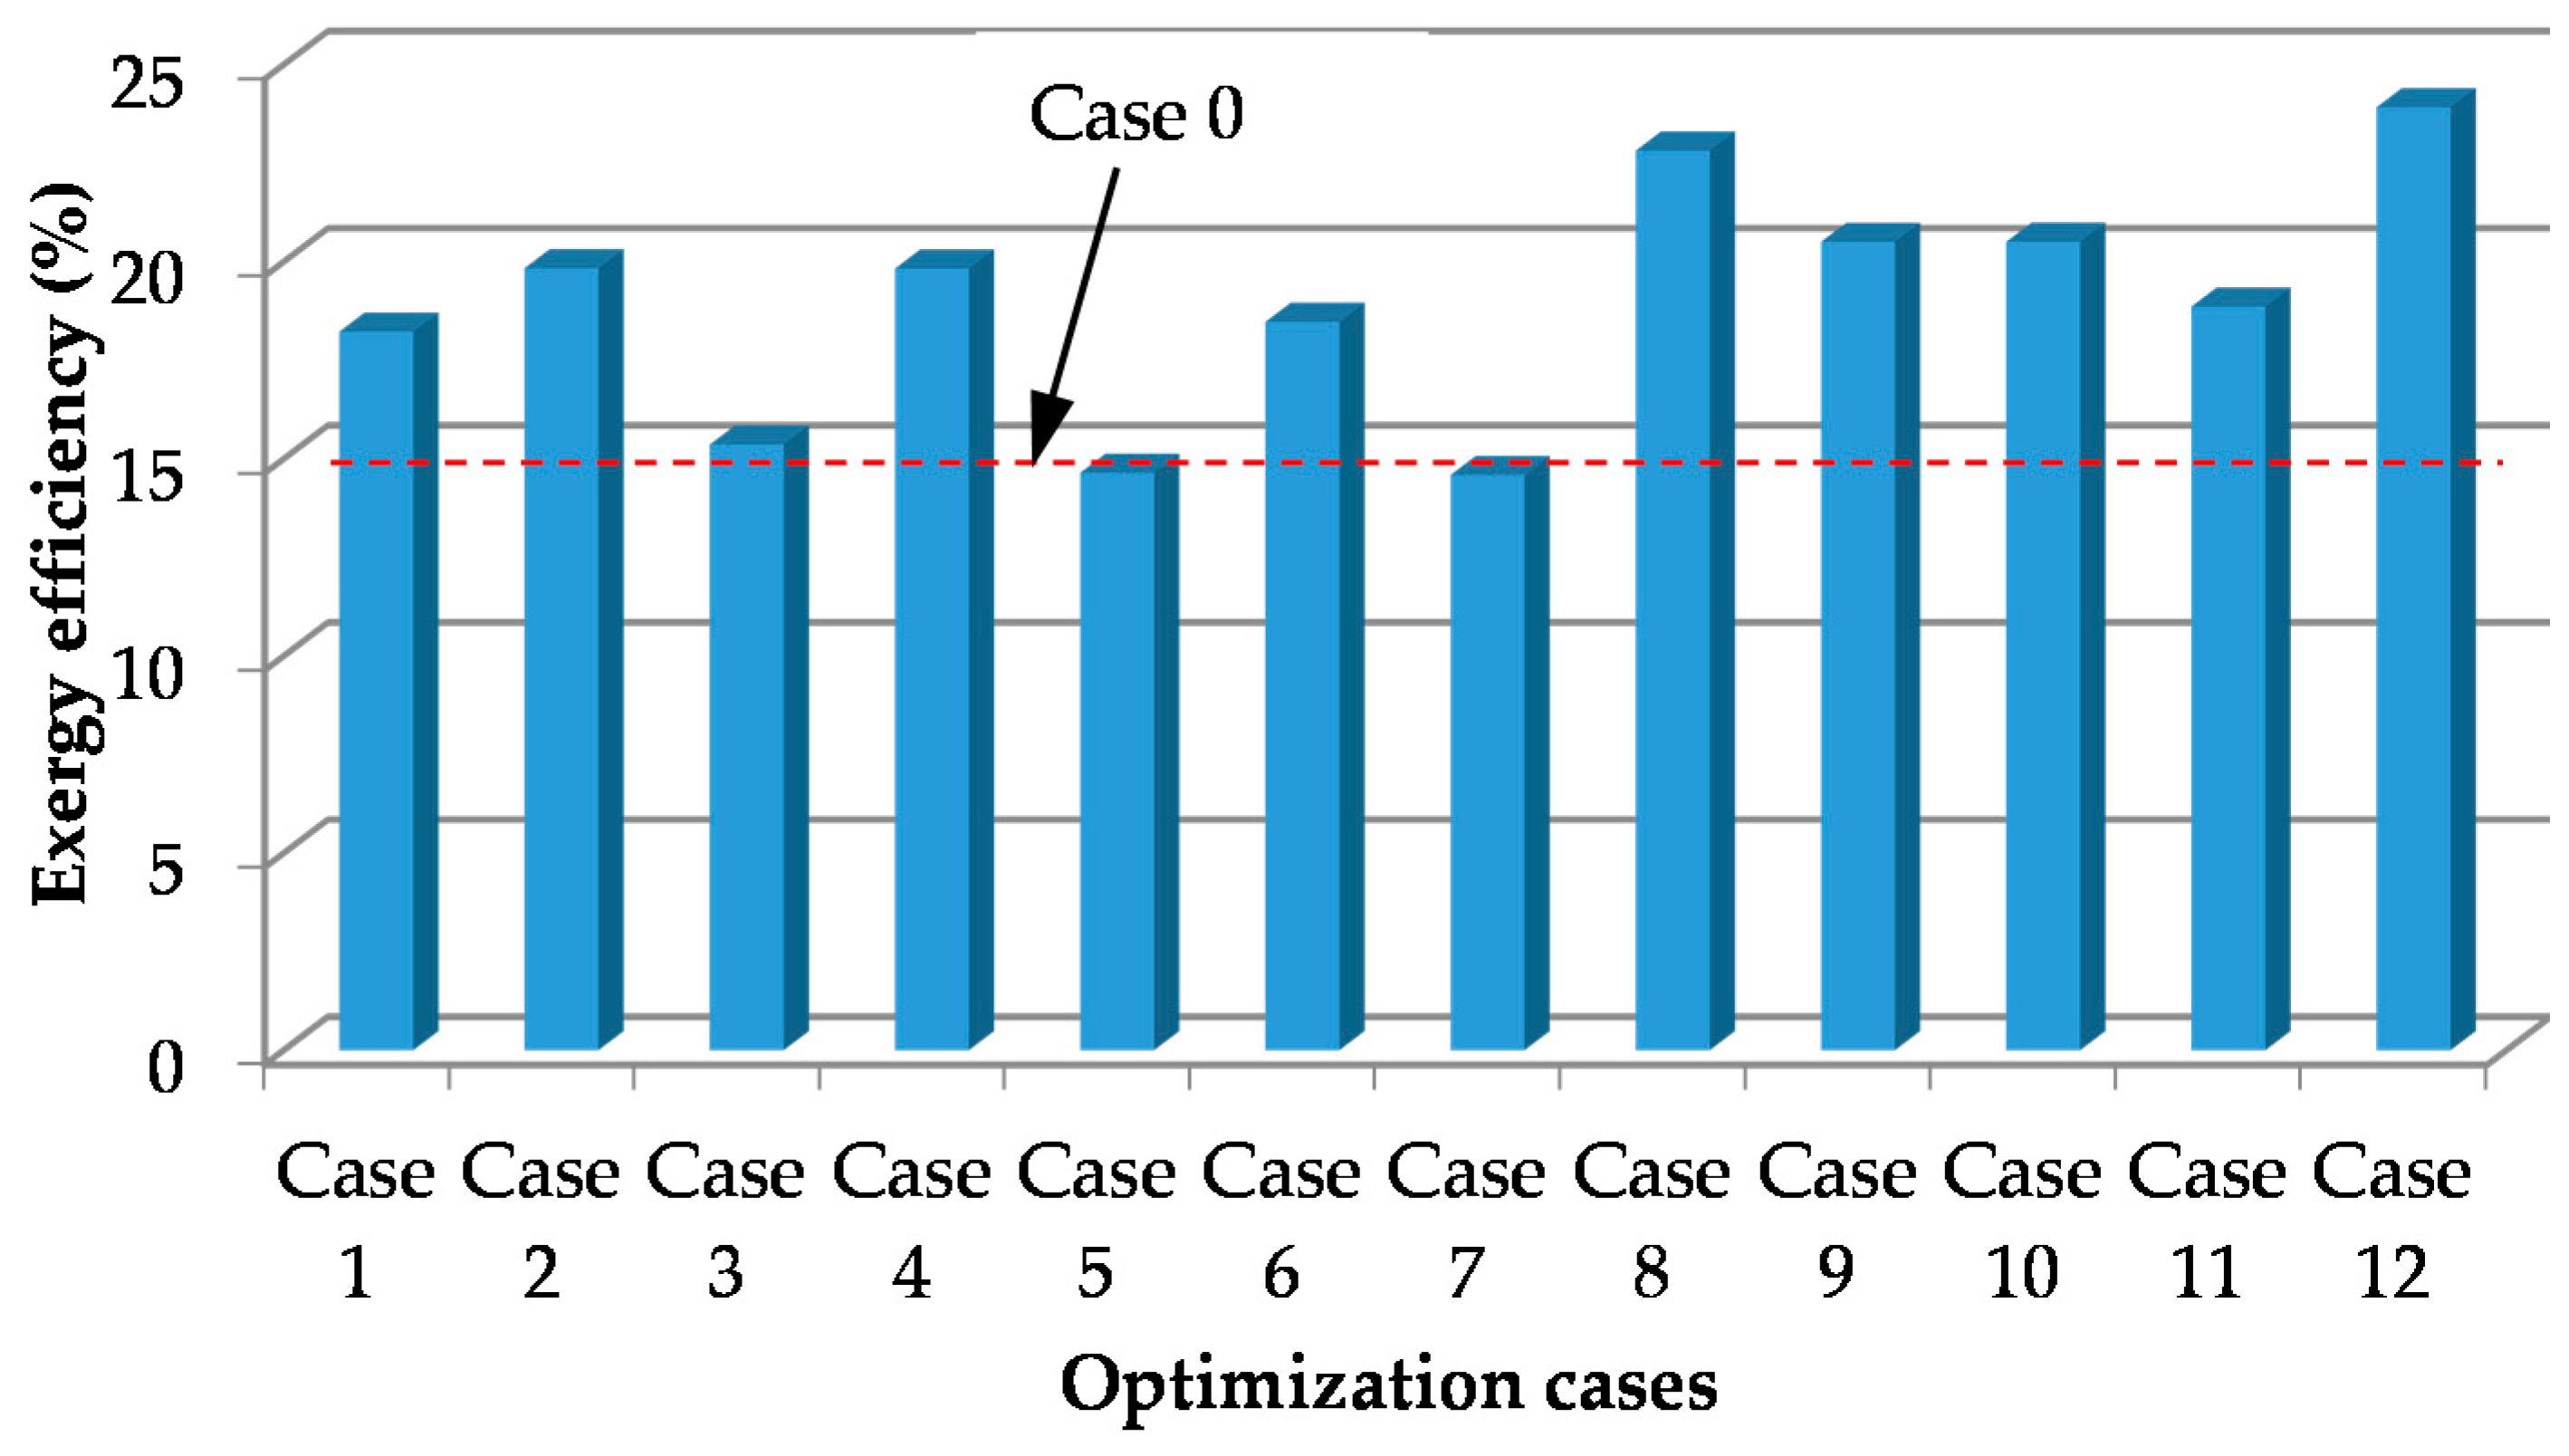
The variation in system exergy efficiency for 12 cases as optimization conditions of the ABC optimization process is shown in
Figure 8. Here Case 0 is the exergy efficiency of the real operating system. Its value is 14.52%. As observed on the figure, for all optimization conditions, their exergy efficiencies are higher than that of Case 0. The exergy efficiency (14.59%) obtained in Case 5 is the closest to that of the real system. This is followed by Cases 7 and 9. Cases 5 and 7 are related to optimization of the pressure of the geofluid along the lines shown in
Figure 1 while Case 9 is related to that of TURB 1-related parameters. Especially in the system, Case 12 has the highest value at exergy efficiency as 23.92%. Case 8 as 22.82%, Case 10 as 20.52% and Case 9 as 20.51% come later. In Cases 8, 9, 10 and 12, it is optimized for the condensers-related parameters in the GPP. According to exergy analysis, the highest exergy destruction rate occured in condenser CON 2. This was followed by VAP 2, CON 1 and the fans. It is observed that, these optimization results show similar results with those of the exergy analysis.
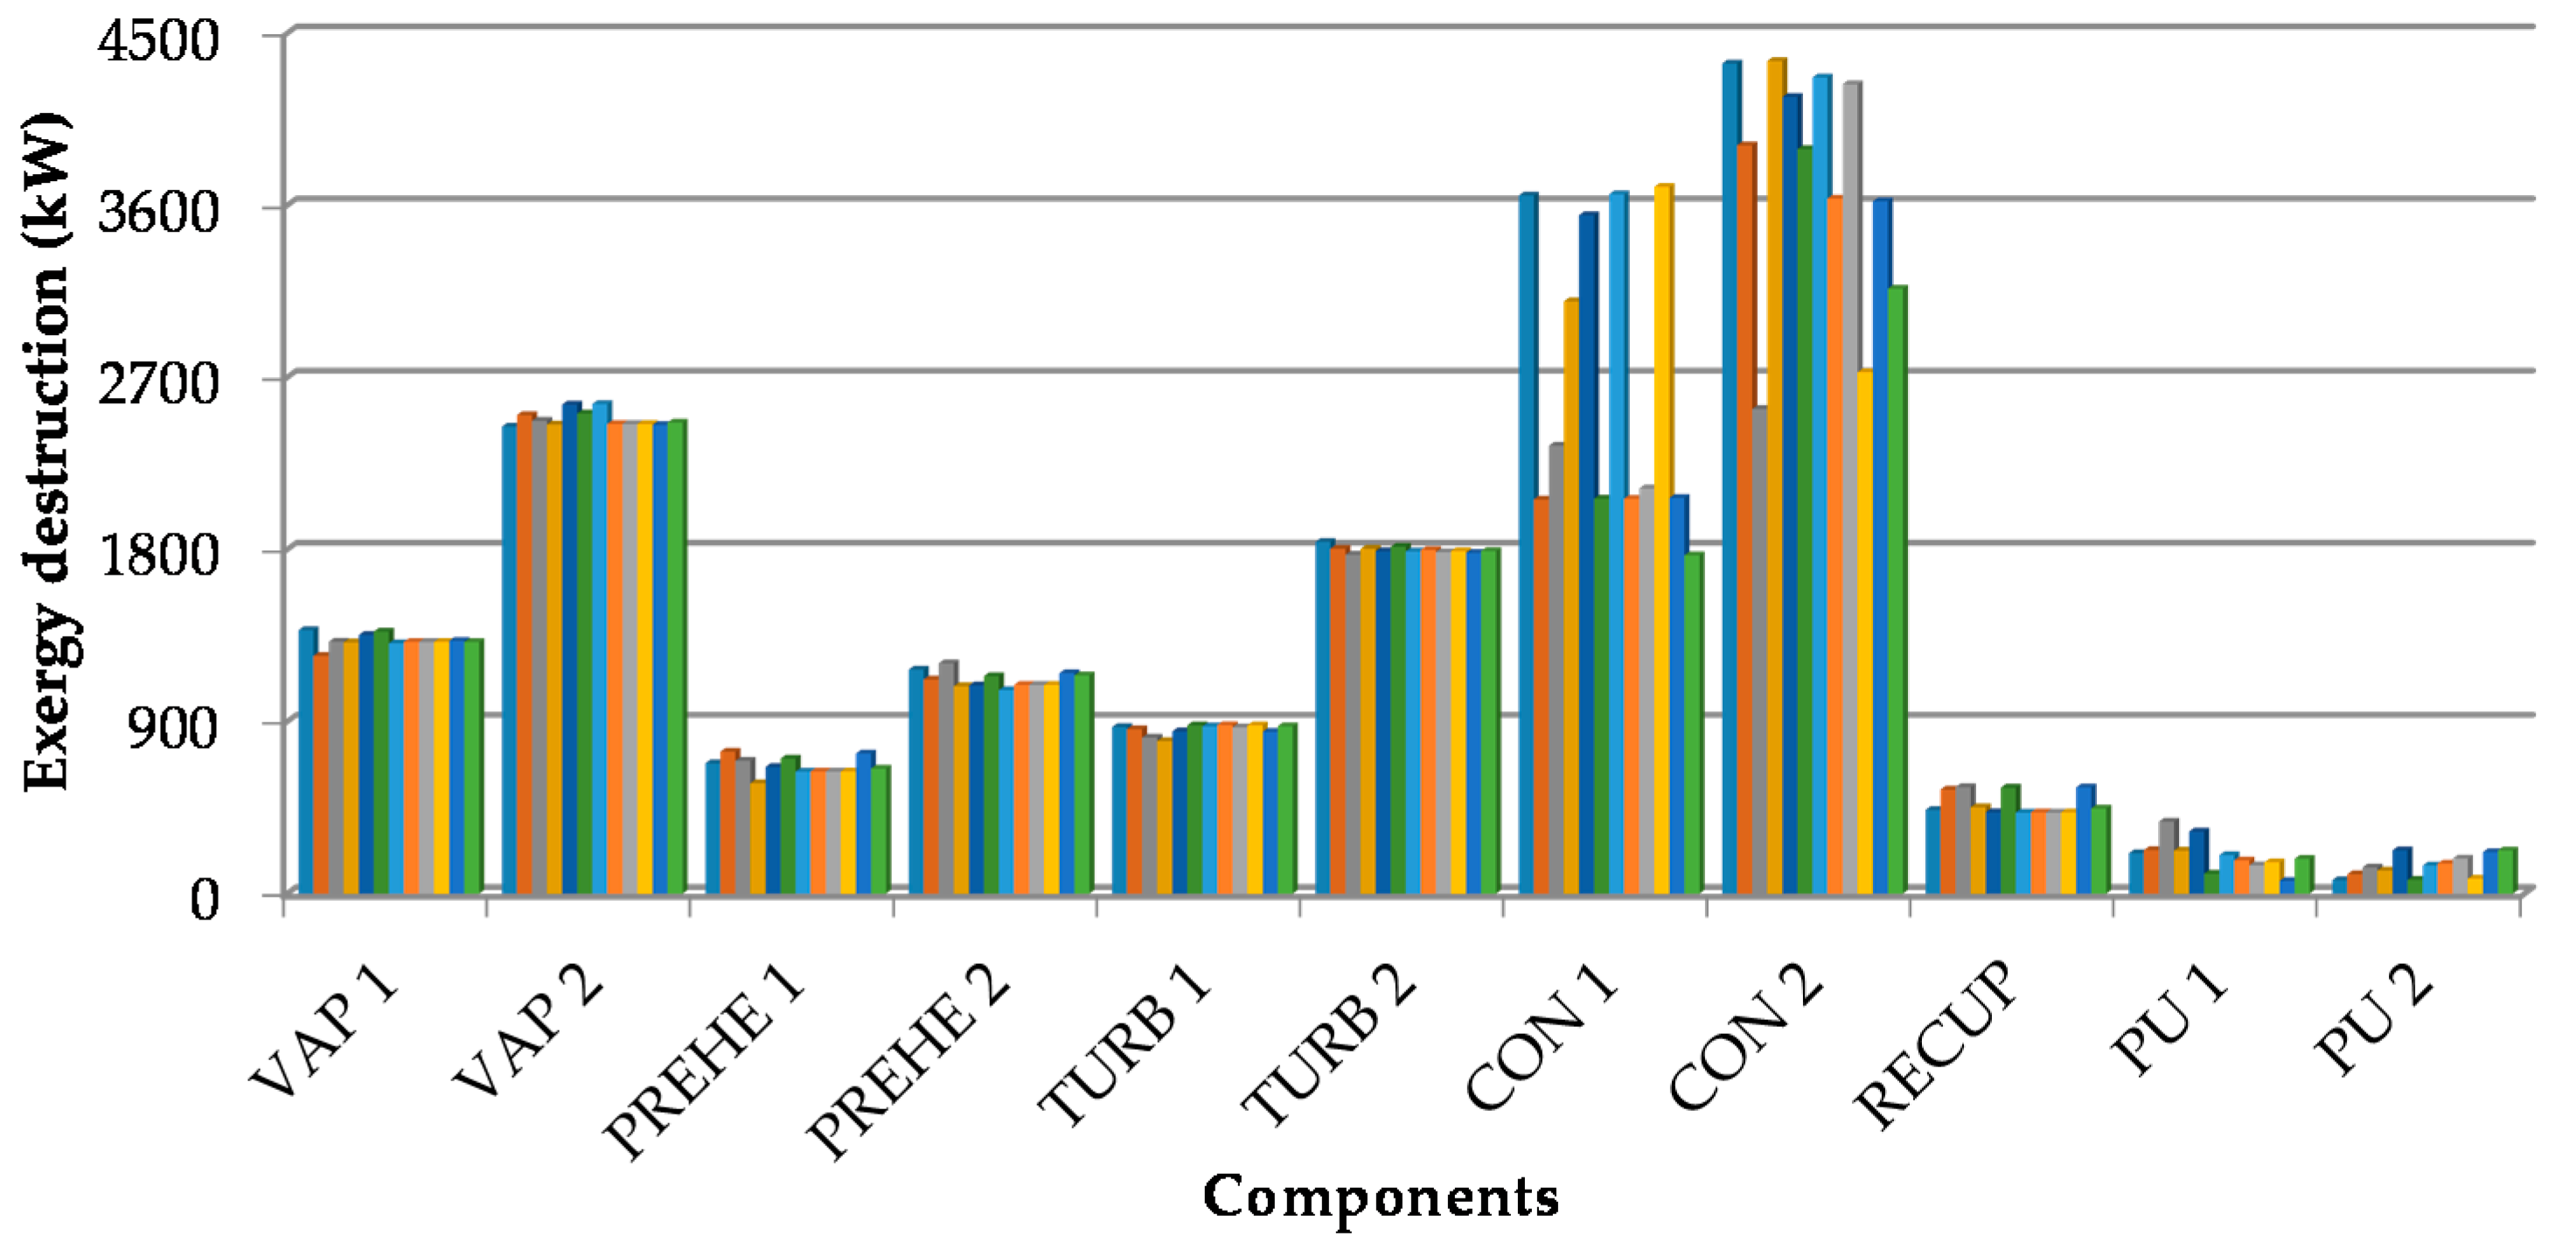
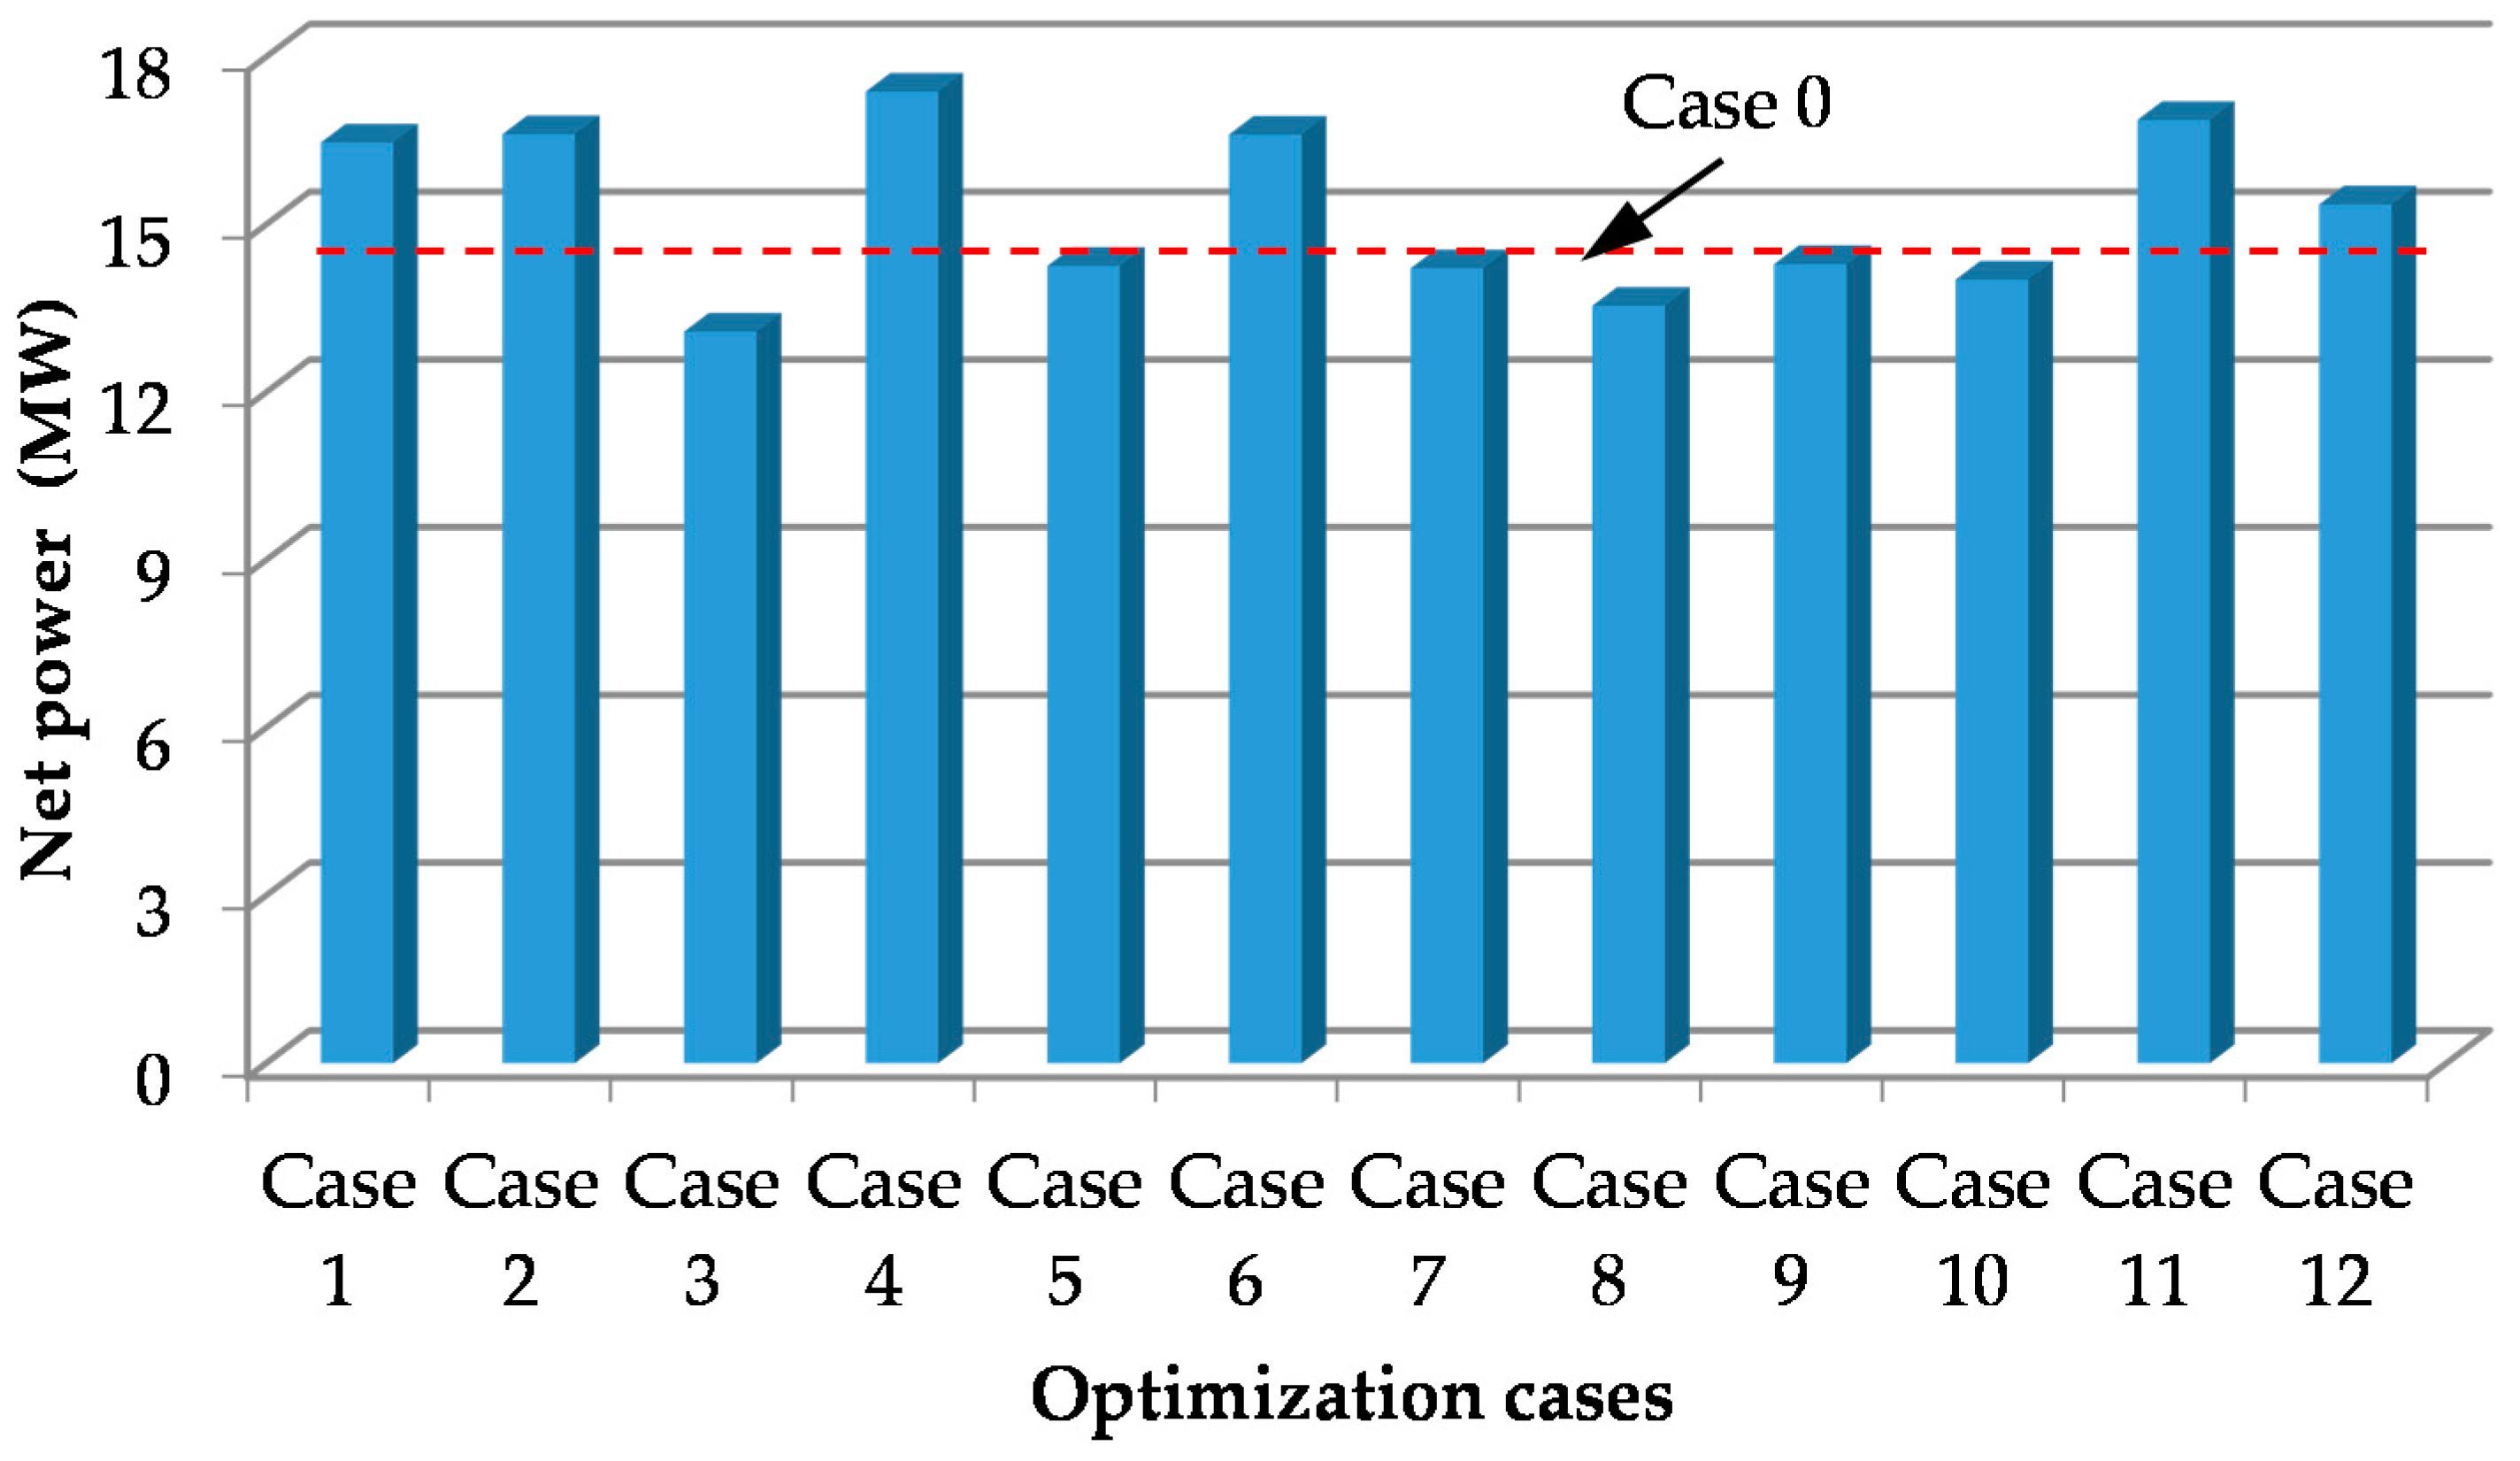
Figure 9 shows the variation in net power generated from the model according to optimization conditions. In the figure, Case 0 states the net power of the real system and its value is 14.21 MW. As seen in the figure, at the end of the optimization process, Cases 3, 8, 9 and 10 have a net power below the value of the real system. When optimized it for n-pentane line-related parameters of TURB 1 (Case 3) and condensers-related parameters (Cases 8–10), they have no much effect on maximum system exergy efficiency. Contrary to the previous conditions, Case 4 with TURB 2-related parameters and Cases 11 and 12 with condensers-related parameters have the highest net power values. The net power rate of Case 4 is 16% larger than that of Case 0. The value is equivalent roughly to 3 MW more electricity generation. For Cases 11 and 12 with condensers-related parameters, this is 15.8% and 14%, respectively. Here it may be concluded that the most important components requiring care during design and operation processes of the Sinem GPP are turbines and condensers. With the aim of maximizing exergy efficiency of the GPP system, the exergy destruction rates occuring from the components for optimization conditions (Cases 1–12) are illustrated in
Figure 10. Looking at
Figure 10, under all optimization conditions large fluctuations occur in the amounts of exergy destruction in the condensers. It can be reached that optimization conditions mainly affect condensers. Thus, in the real system the condensers have primary importance and require emergency improvement. Additionally, the result of optimization processes is showed that exergy destruction in condensers can be reduced due to their fluctuations.
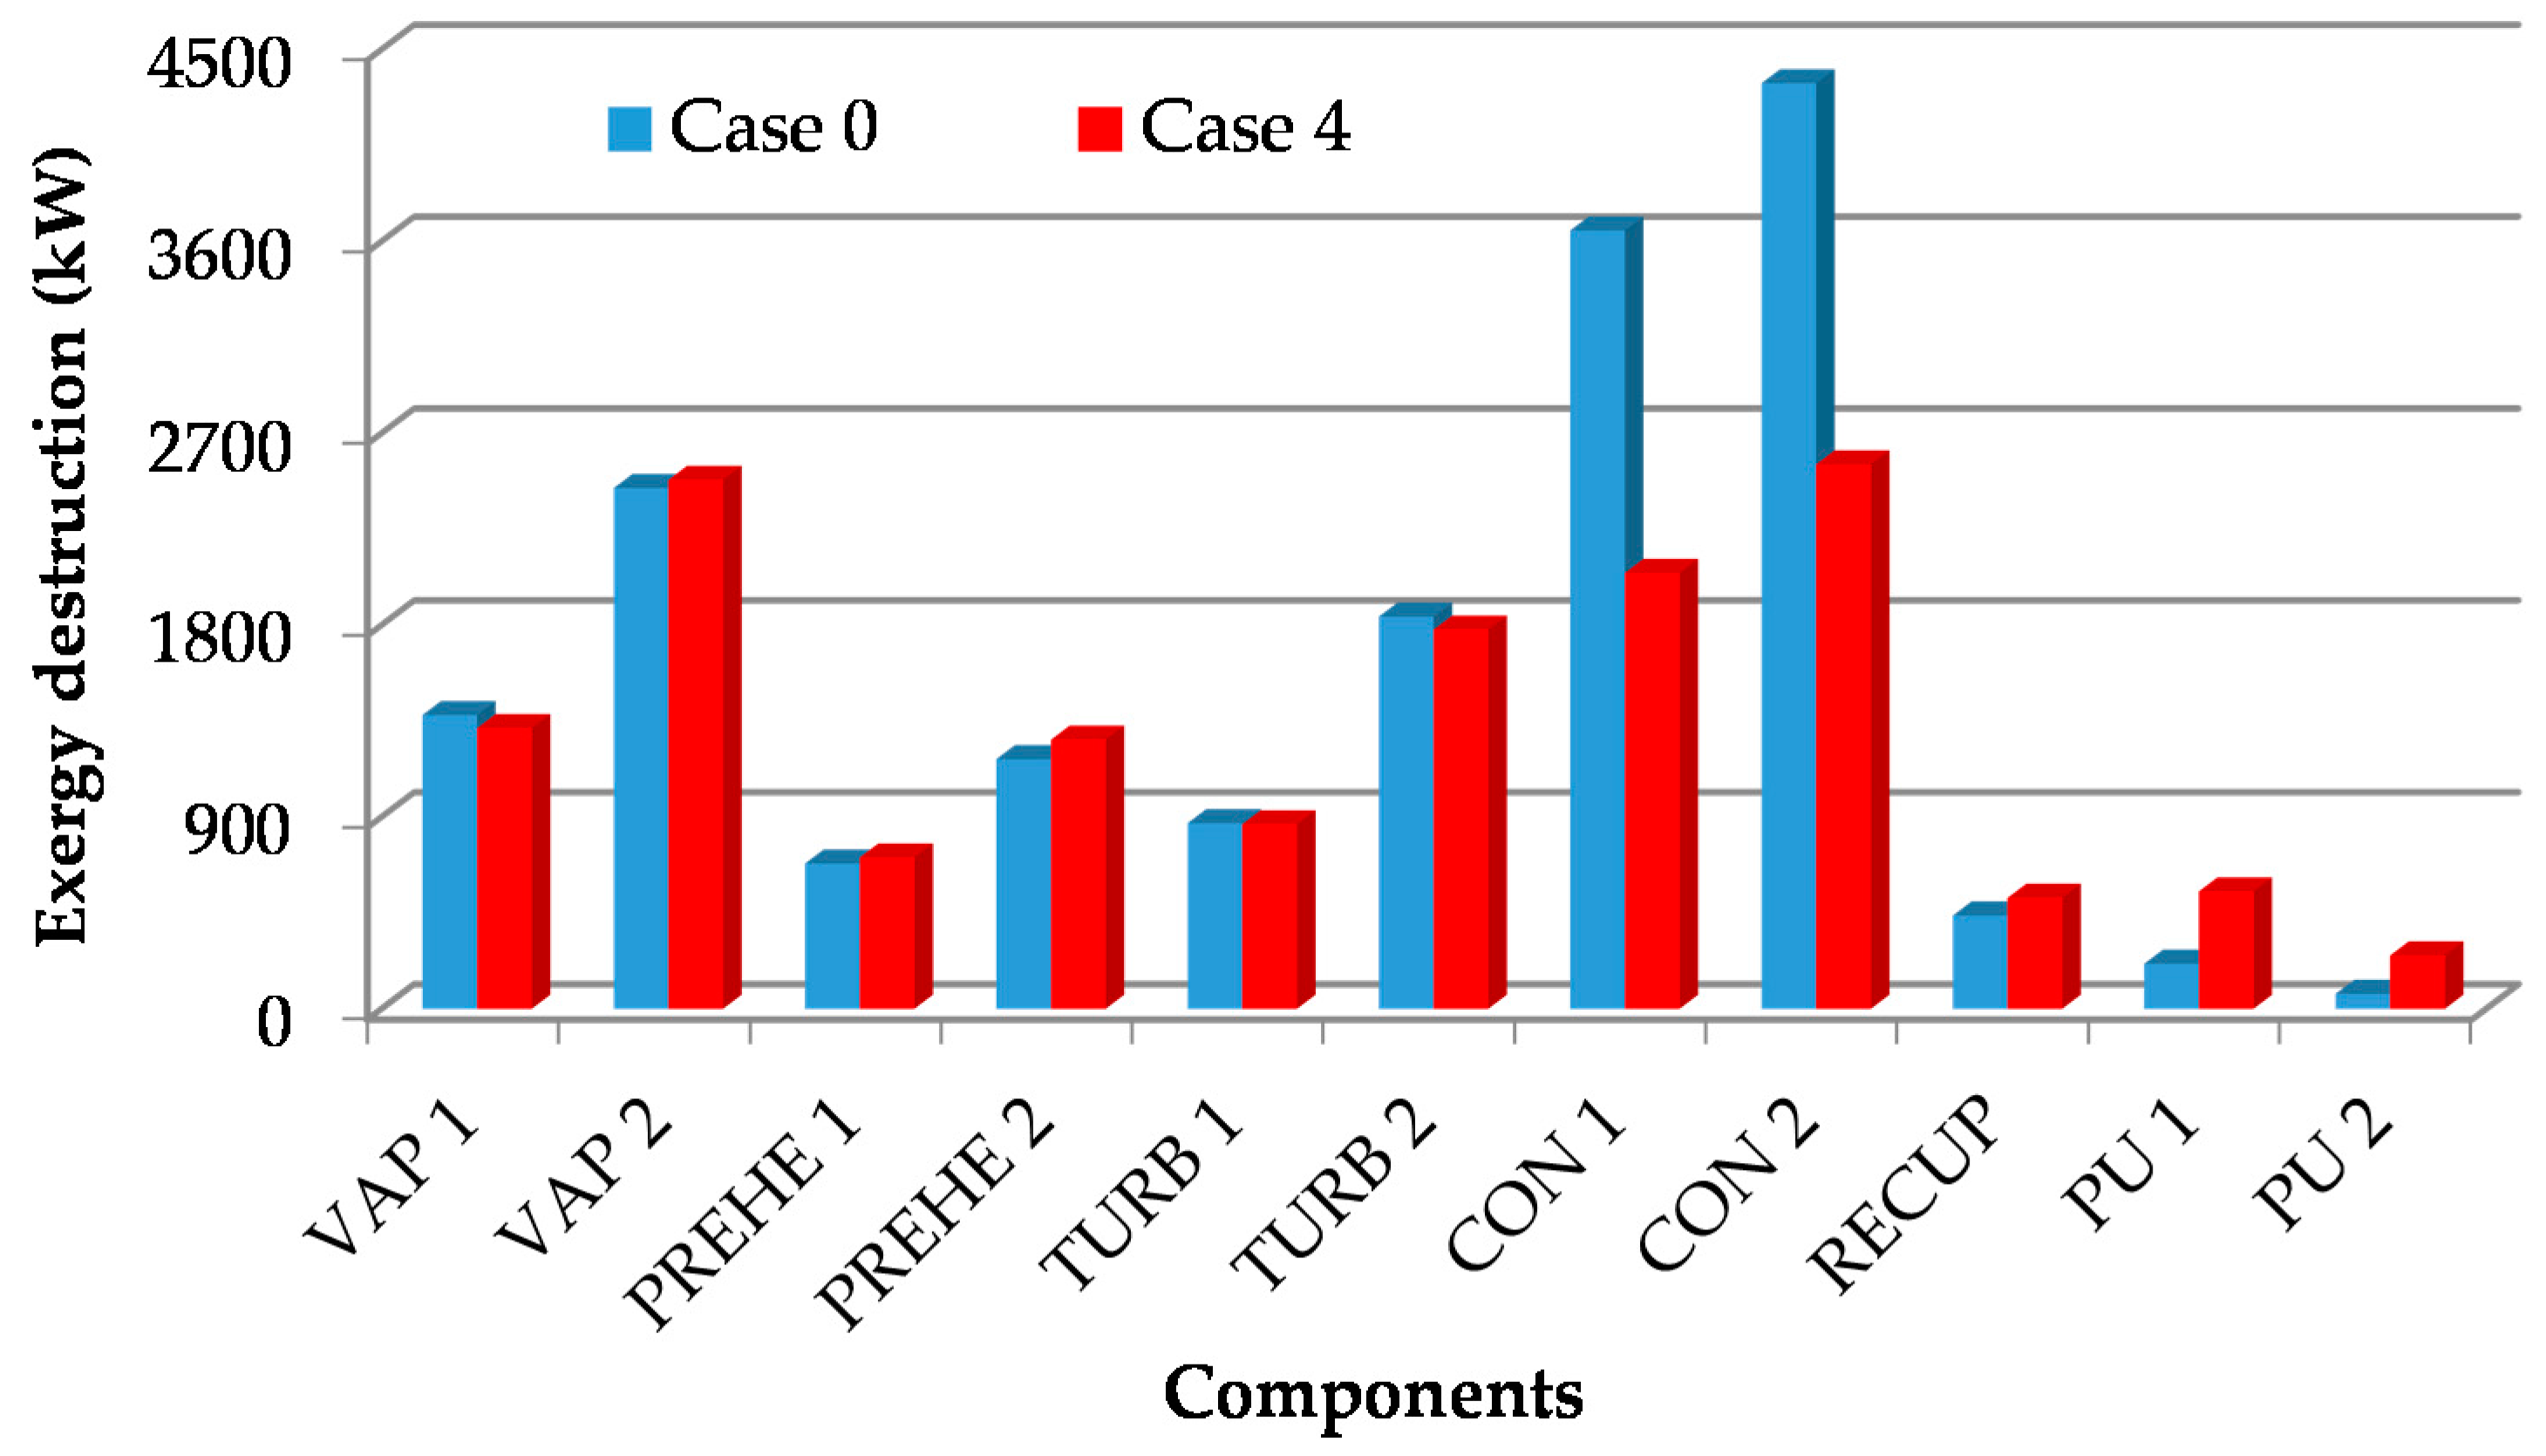
Figure 11 shows the exergy destruction rates of the system components for Case 0 (the real system) and Case 4 with TURB 2-related parameters as optimization conditions. It can be observed from
Figure 11 that the exergy destruction rates for CON 1 and CON 2 in the real system are 3.65 MW and 4.34 MW while in the ABC optimization process, their values fall to 1.77 MW and 3.16 MW, respectively. In this way contrary to increased exergy destruction rate from pumps, recuperator and pre-heaters, there is a 44% and 41% improvement in the condensers (CON 1 and CON 2), respectively. Of the evaporators, VAP 2 causes more exergy destruction compared to VAP 1 on level I. It can be considered that the steep fall in temperature of the geofluid emerging from VAP 1 causes this situation. Again, in the GPP, the mass flow rate of the geofluid steam added to VAP 2 on level II is not sufficient.
A comparison of exergy destruction rates of the system components for Case 0 and Case 12 as optimization conditions is presented in
Figure 12. The results of this graphic are in accordance with the results of
Figure 11. In Case 12 there is a reduction of 51.5% and 27% in exergy destruction rates of condensers CON 1 and CON 2. Due to the pump and recuperator on level I, the percentage fall in level I is greater than that in level II. In this case, PU 1 and PU 2 may be more affected by pressure falls due to pollution and blunting of CON 1 and CON 2.
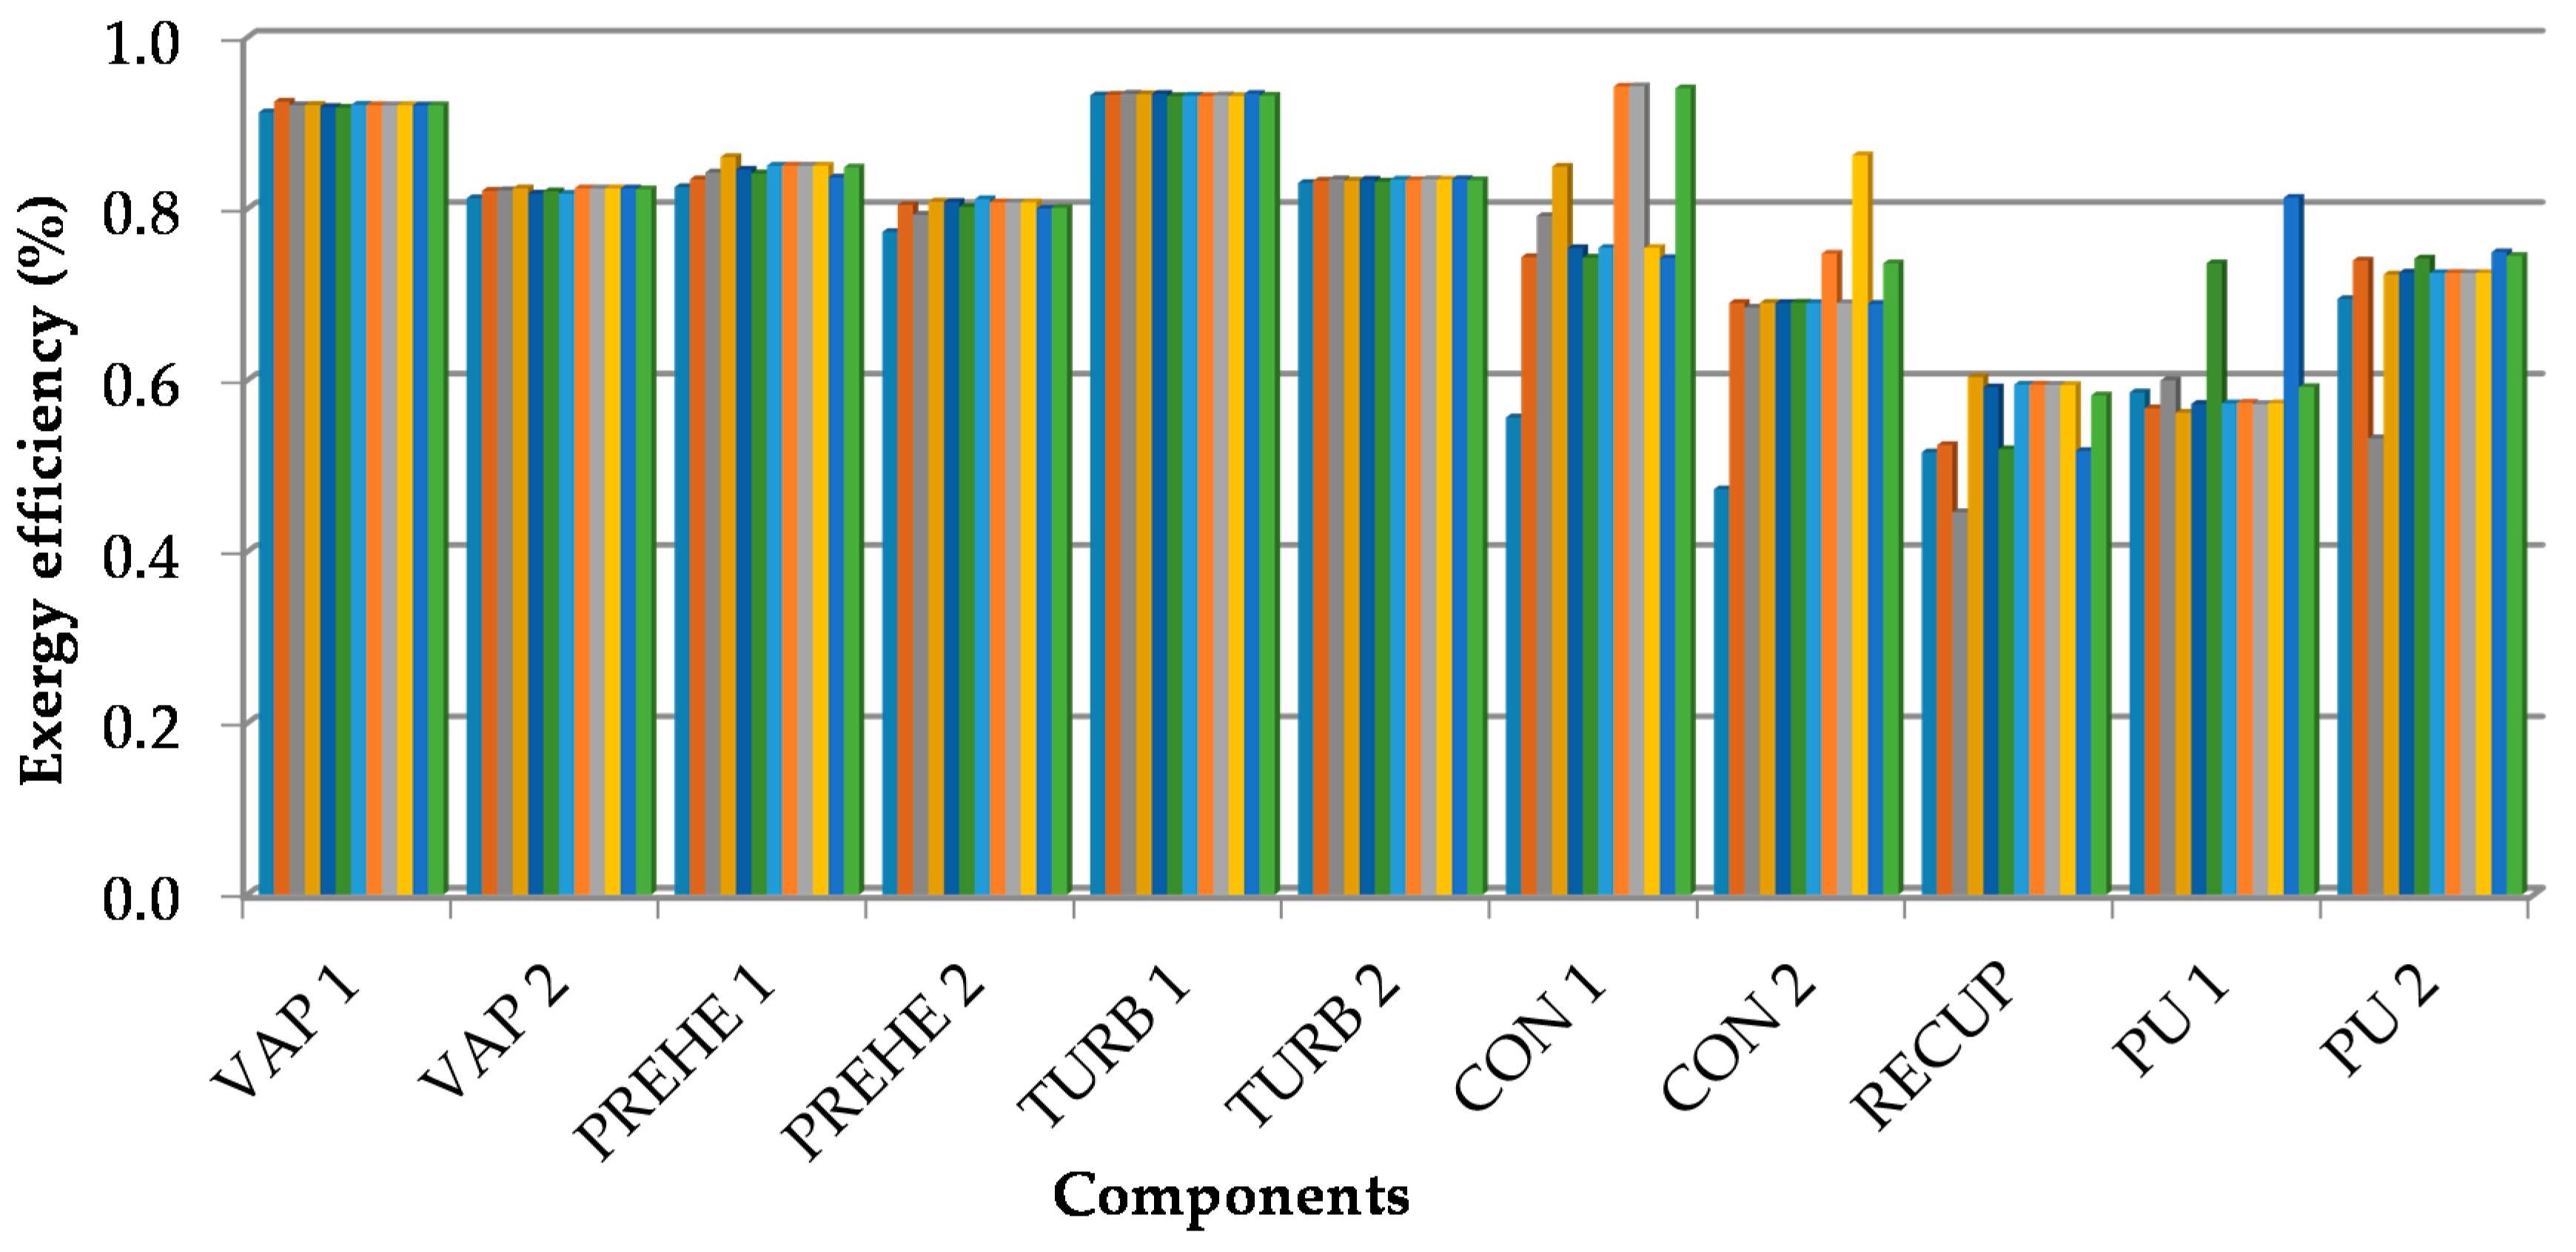
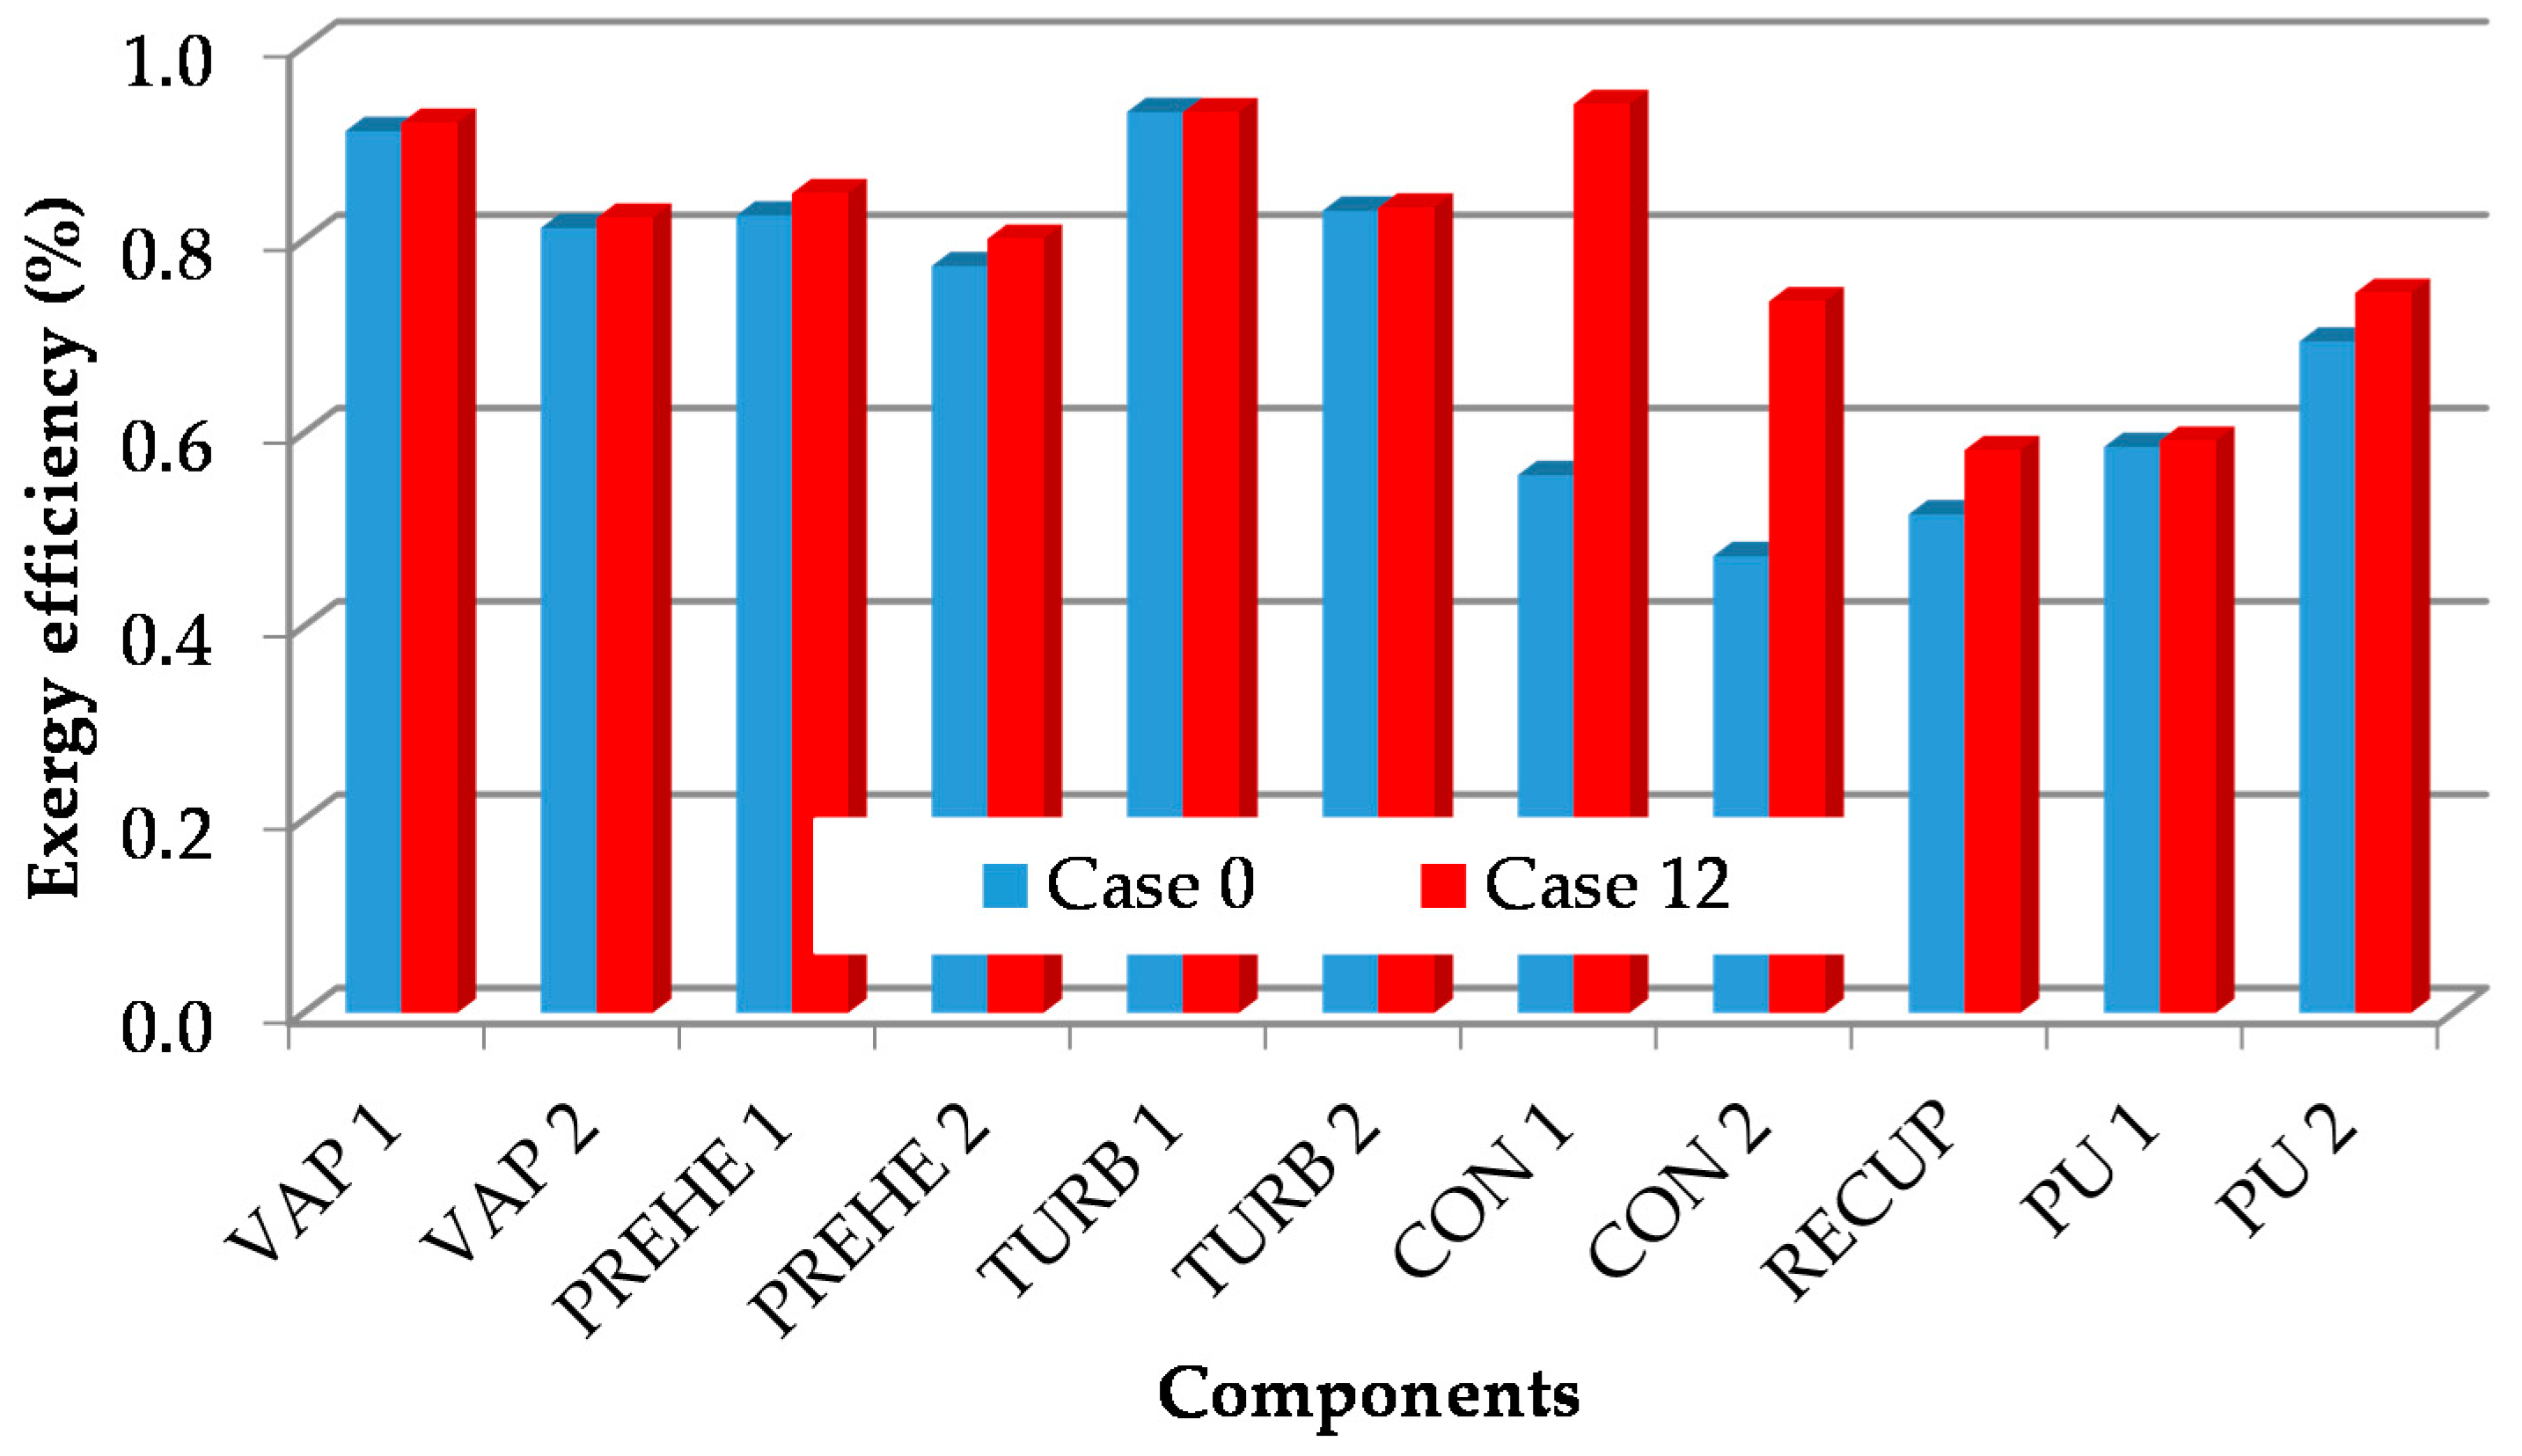
The exergy efficiencies of components in the Sinem GPP for all the optimization conditions (Cases 1–12) is given in
Figure 13. From
Figure 13, under all optimization conditions, the exergy efficiencies especially for the turbines TURB 1 and TURB 2 are similar because the isentropic efficiencies of the turbines were fixed. Thus the power generated from the plant remains constant. In this study the net power of the system has been taken into account as a useful exergy of the system. So this is assessed by subtracting the amount of electricity used to run fans and pumps in the condensers from the generated electricity. As can seen in
Figure 13, the components with highest exergy efficiency are TURB 1 as 93%, VAP 1 as 92% and CON 1 as change in 74–94%. In addition, the exergy efficiency of TURB 2 is 83%. The exergy efficiencies obtained for the turbines are the same as those obtained in the real system. The component with lowest exergy efficiency is the recuperator RECUP with 52%, and 36–54% for the pump PU 1. In TURB 1 and TURB 2, the exergy destruction rate may reach the values in this level due to temperature differences, leaks and pressure falls.
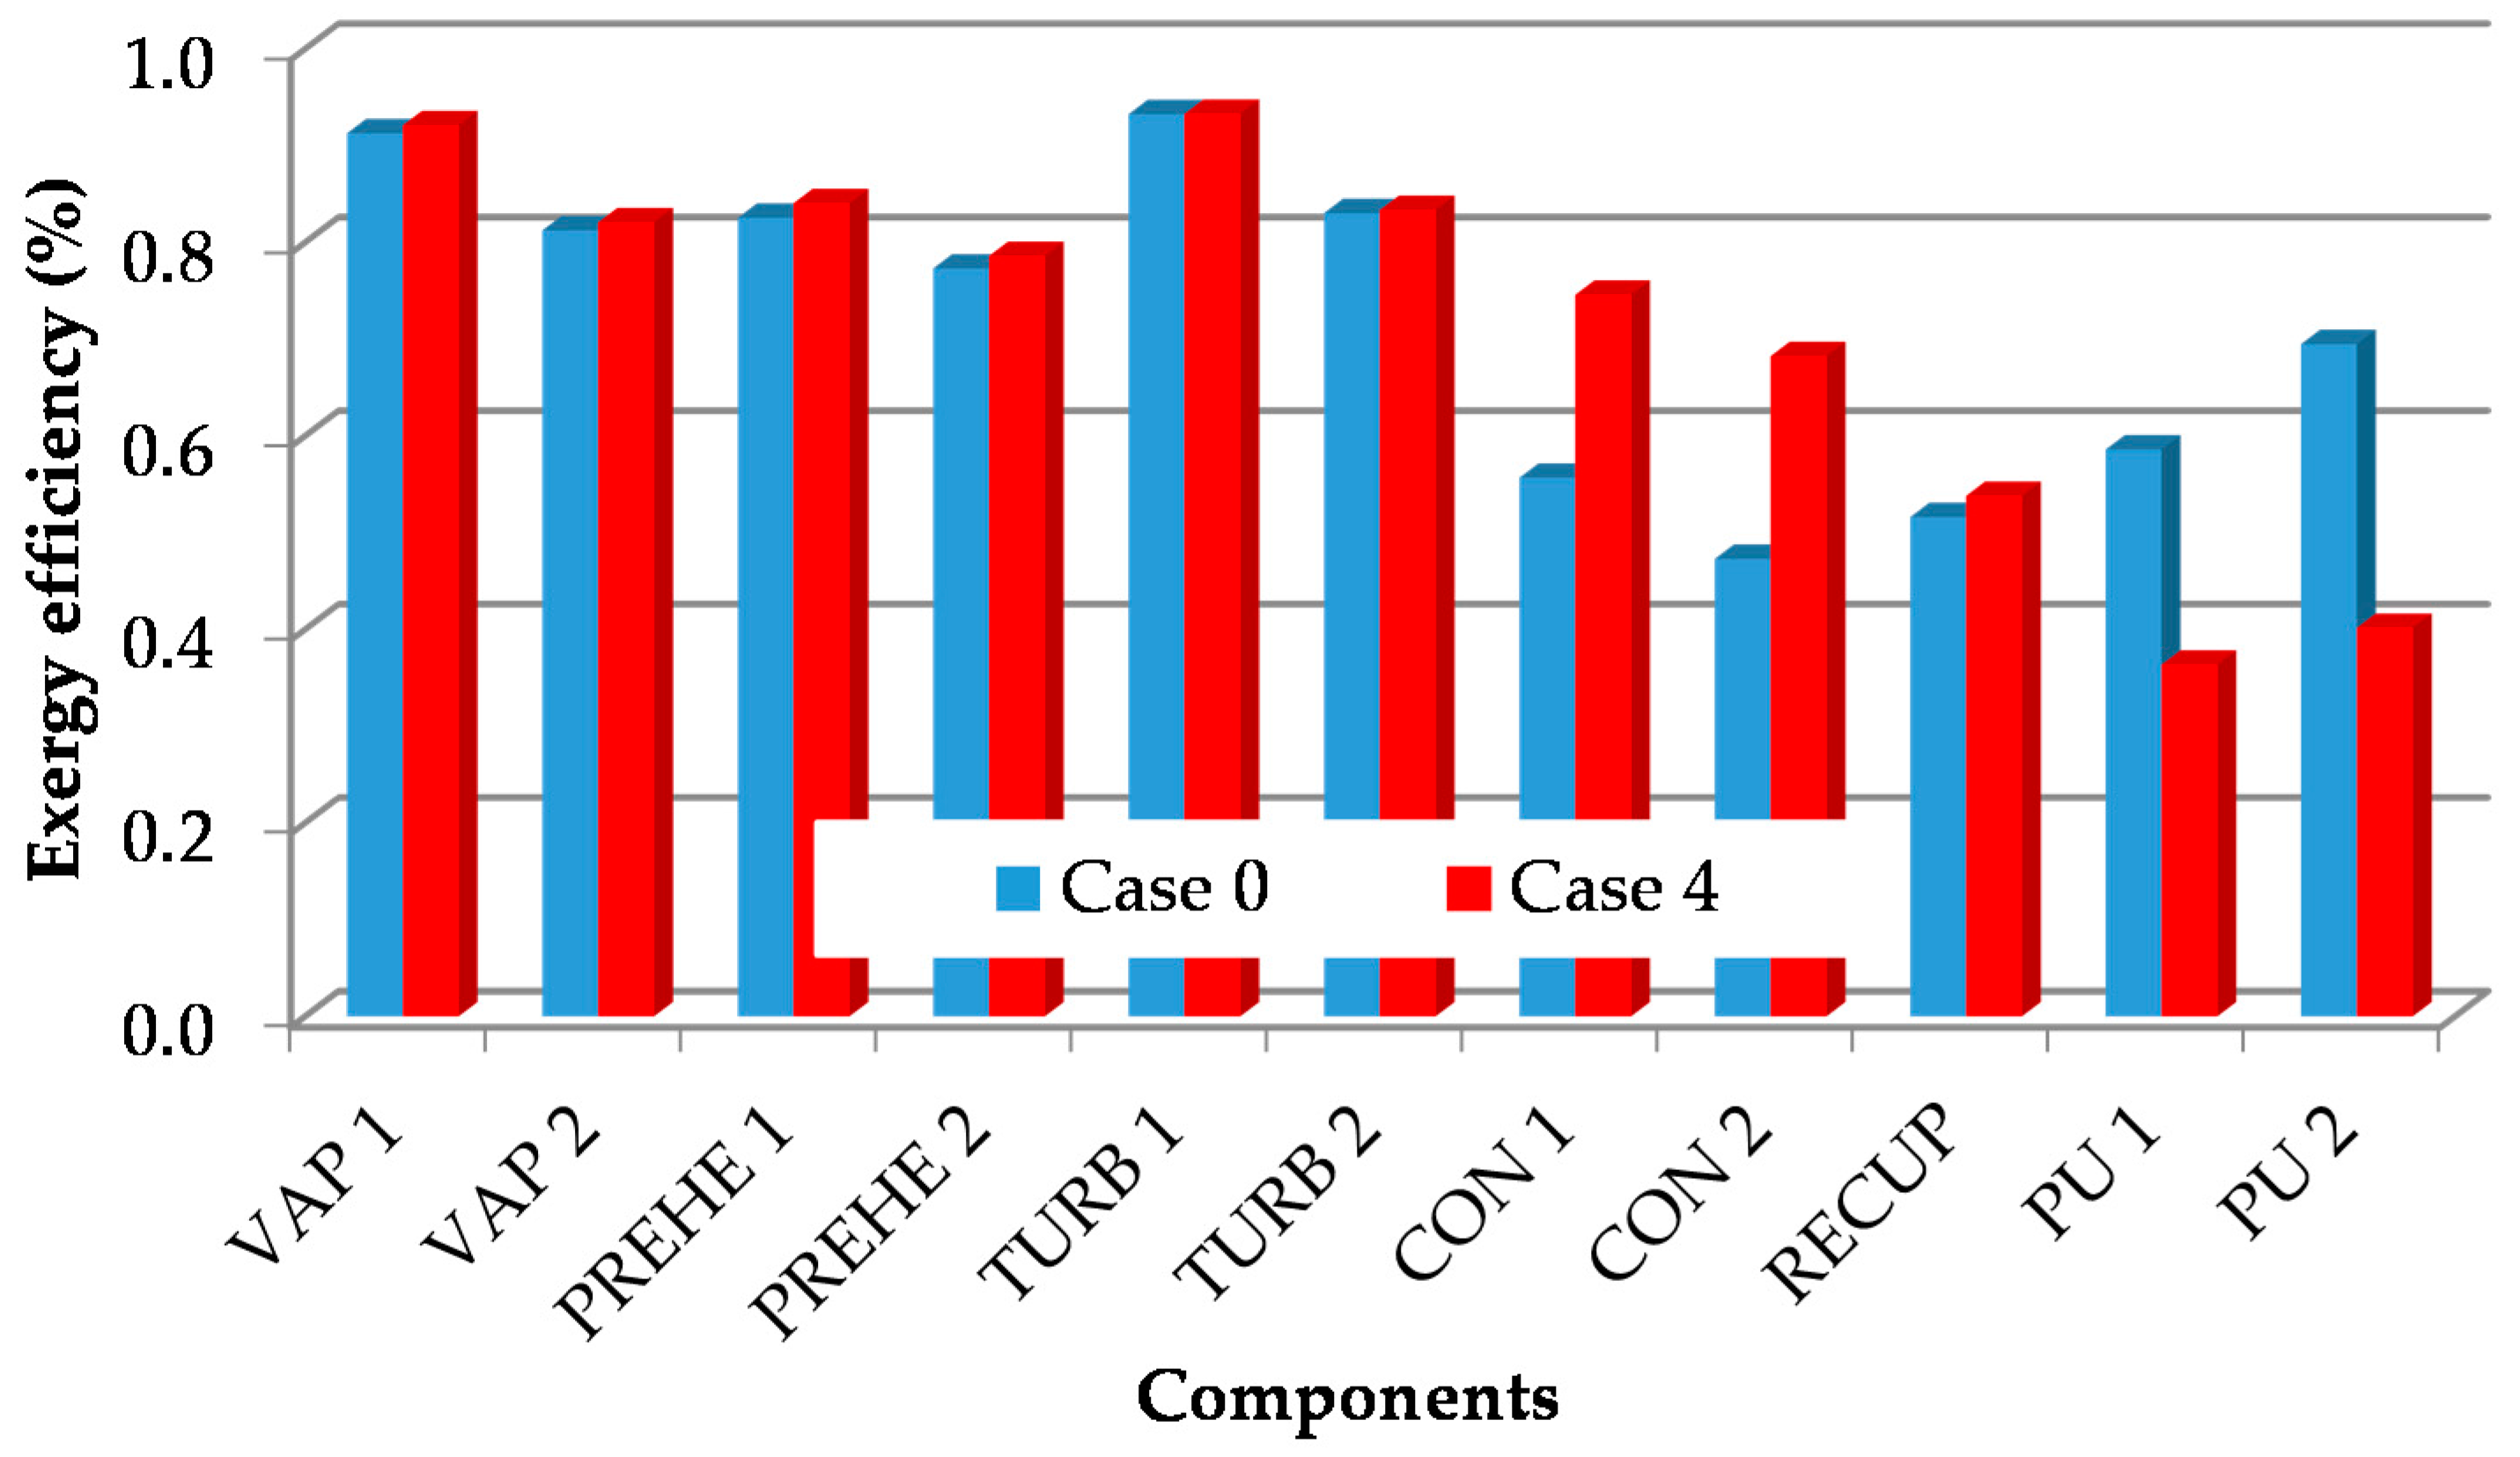
Under Case 4 and Case 12 as optimization conditions, the exergy efficiencies of system components are compared with the exergy efficiency of the real system components, which can be illustrated in
Figure 14 and
Figure 15, respectively. In both figures, the exergy efficiencies of TURB 1 and TURB 2 appear to be the same under real and optimization conditions. Regarding
Figure 14, in Case 4 with TURB 2-related parameters the exergy efficiencies of the pumps reduces, while increasing those of the condensers. Here it can be said that the exergy destructions of the pumps has increased in Case 4. As a result, the
n-pentane output from the turbines at high pressure affects the pumps. In real situations, the desire is that turbine output pressure is very low. In conclusion, a increase in the exergy destruction rates from TURB 2 and PU 2 (thus the fall in exergy efficiencies of the pumps) ensures large exergy efficiencies in the condensers. Hence, the generator works efficiently. In
Figure 15, Case 12 with condensers-related parameters appears to increase the exergy efficiencies for all GPP components. The exergy efficiencies of the condensers CON 1 and CON 2 increase more than those for other components. Apart from the turbines, exergy efficiencies for all the components increases. As a result, this figure shows how effective the condensers are on the thermodynamic performance of GPPs.
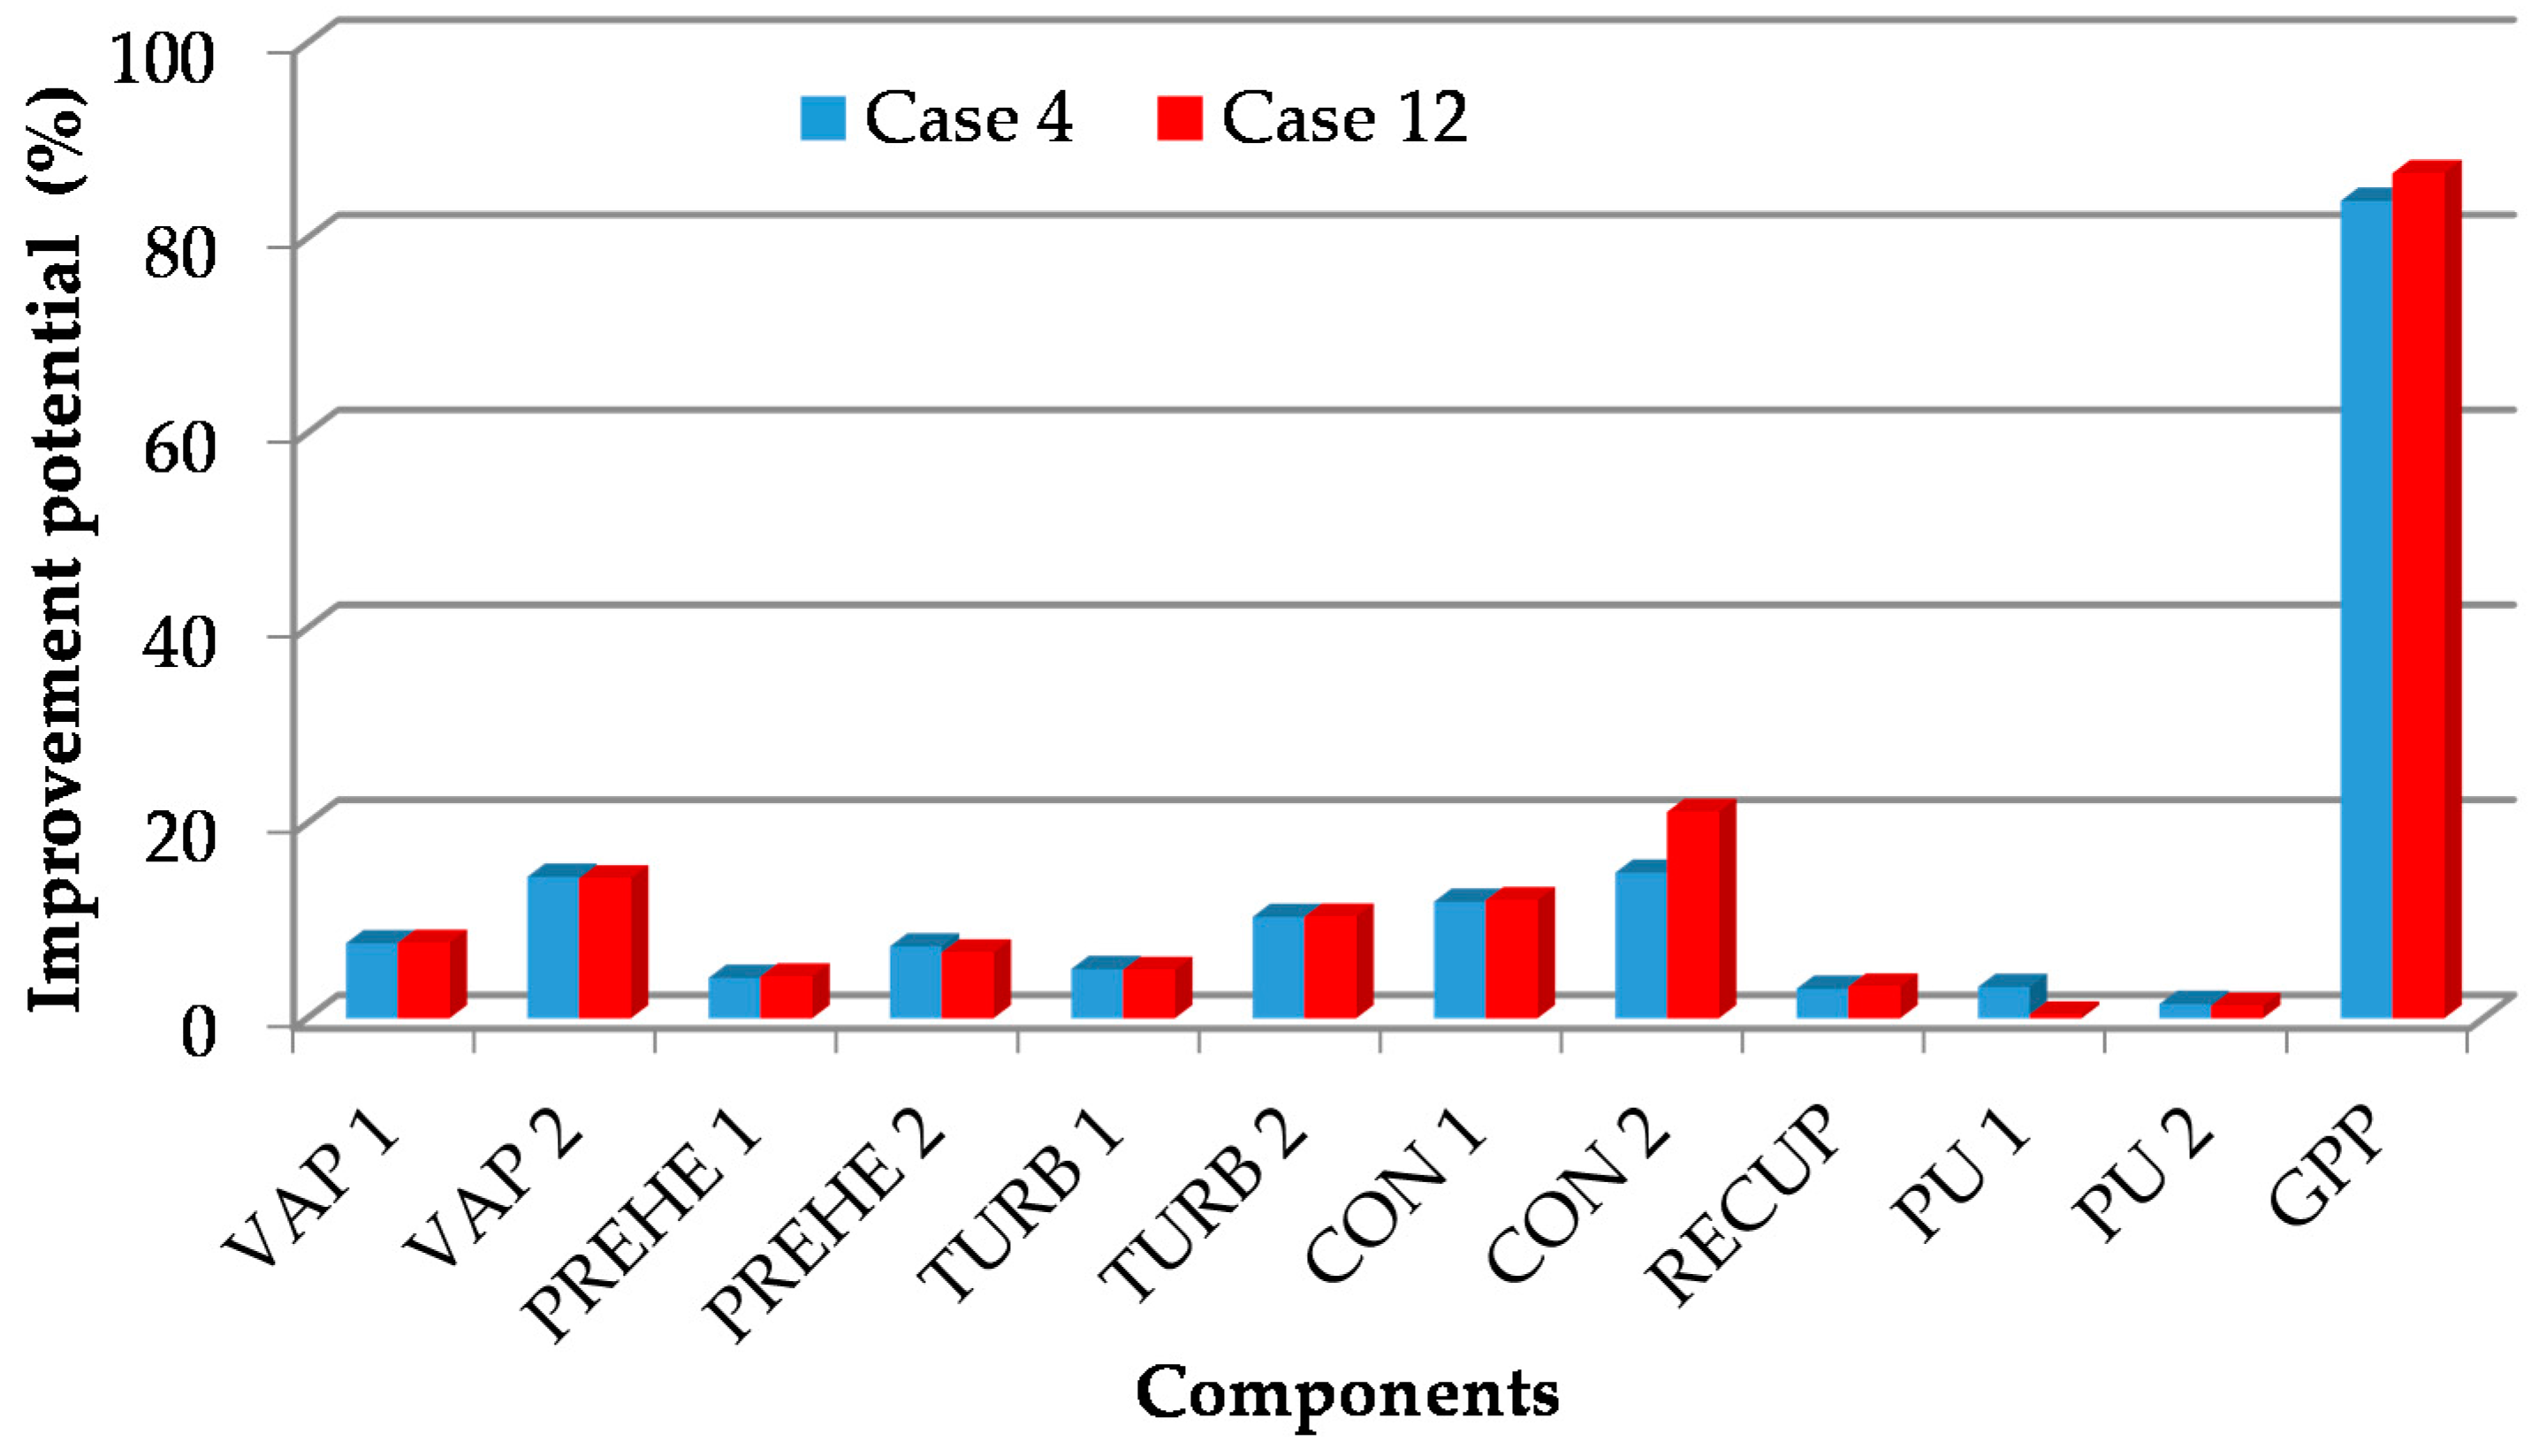
With the ABC optimization process, the best thermodynamic performance for Sinem GPP was obtained for optimization conditions in Case 4 and Case 12. Taking note of the total exergy destruction rate for the system under both optimization conditions, the improvement potentials of the system components are presented in
Figure 16. On the figure the improvement potential of the GPP appears to be high at 84%. When the study is examined from a different angle, the improvement priority of components may be determined based on the exergy development potential on the general performance. From this figure, the following interpretation may be made; the greatest improvement patential for system components may be obtained from CON 2, VAP 2, CON 1 and TURB 2. It can be understood from
Figure 16 that , there is 21.2% improvement potential for CON 2 if a GPP is operated according to Case 12 with condensers-related parameters. According to Case 4, the improvement potentials for CON 2 and VAP 2 are close to each other and nearly 15%. The components with least improvement potential are the pumps (PU 1 and PU 2) and the recuperator (RECUP).
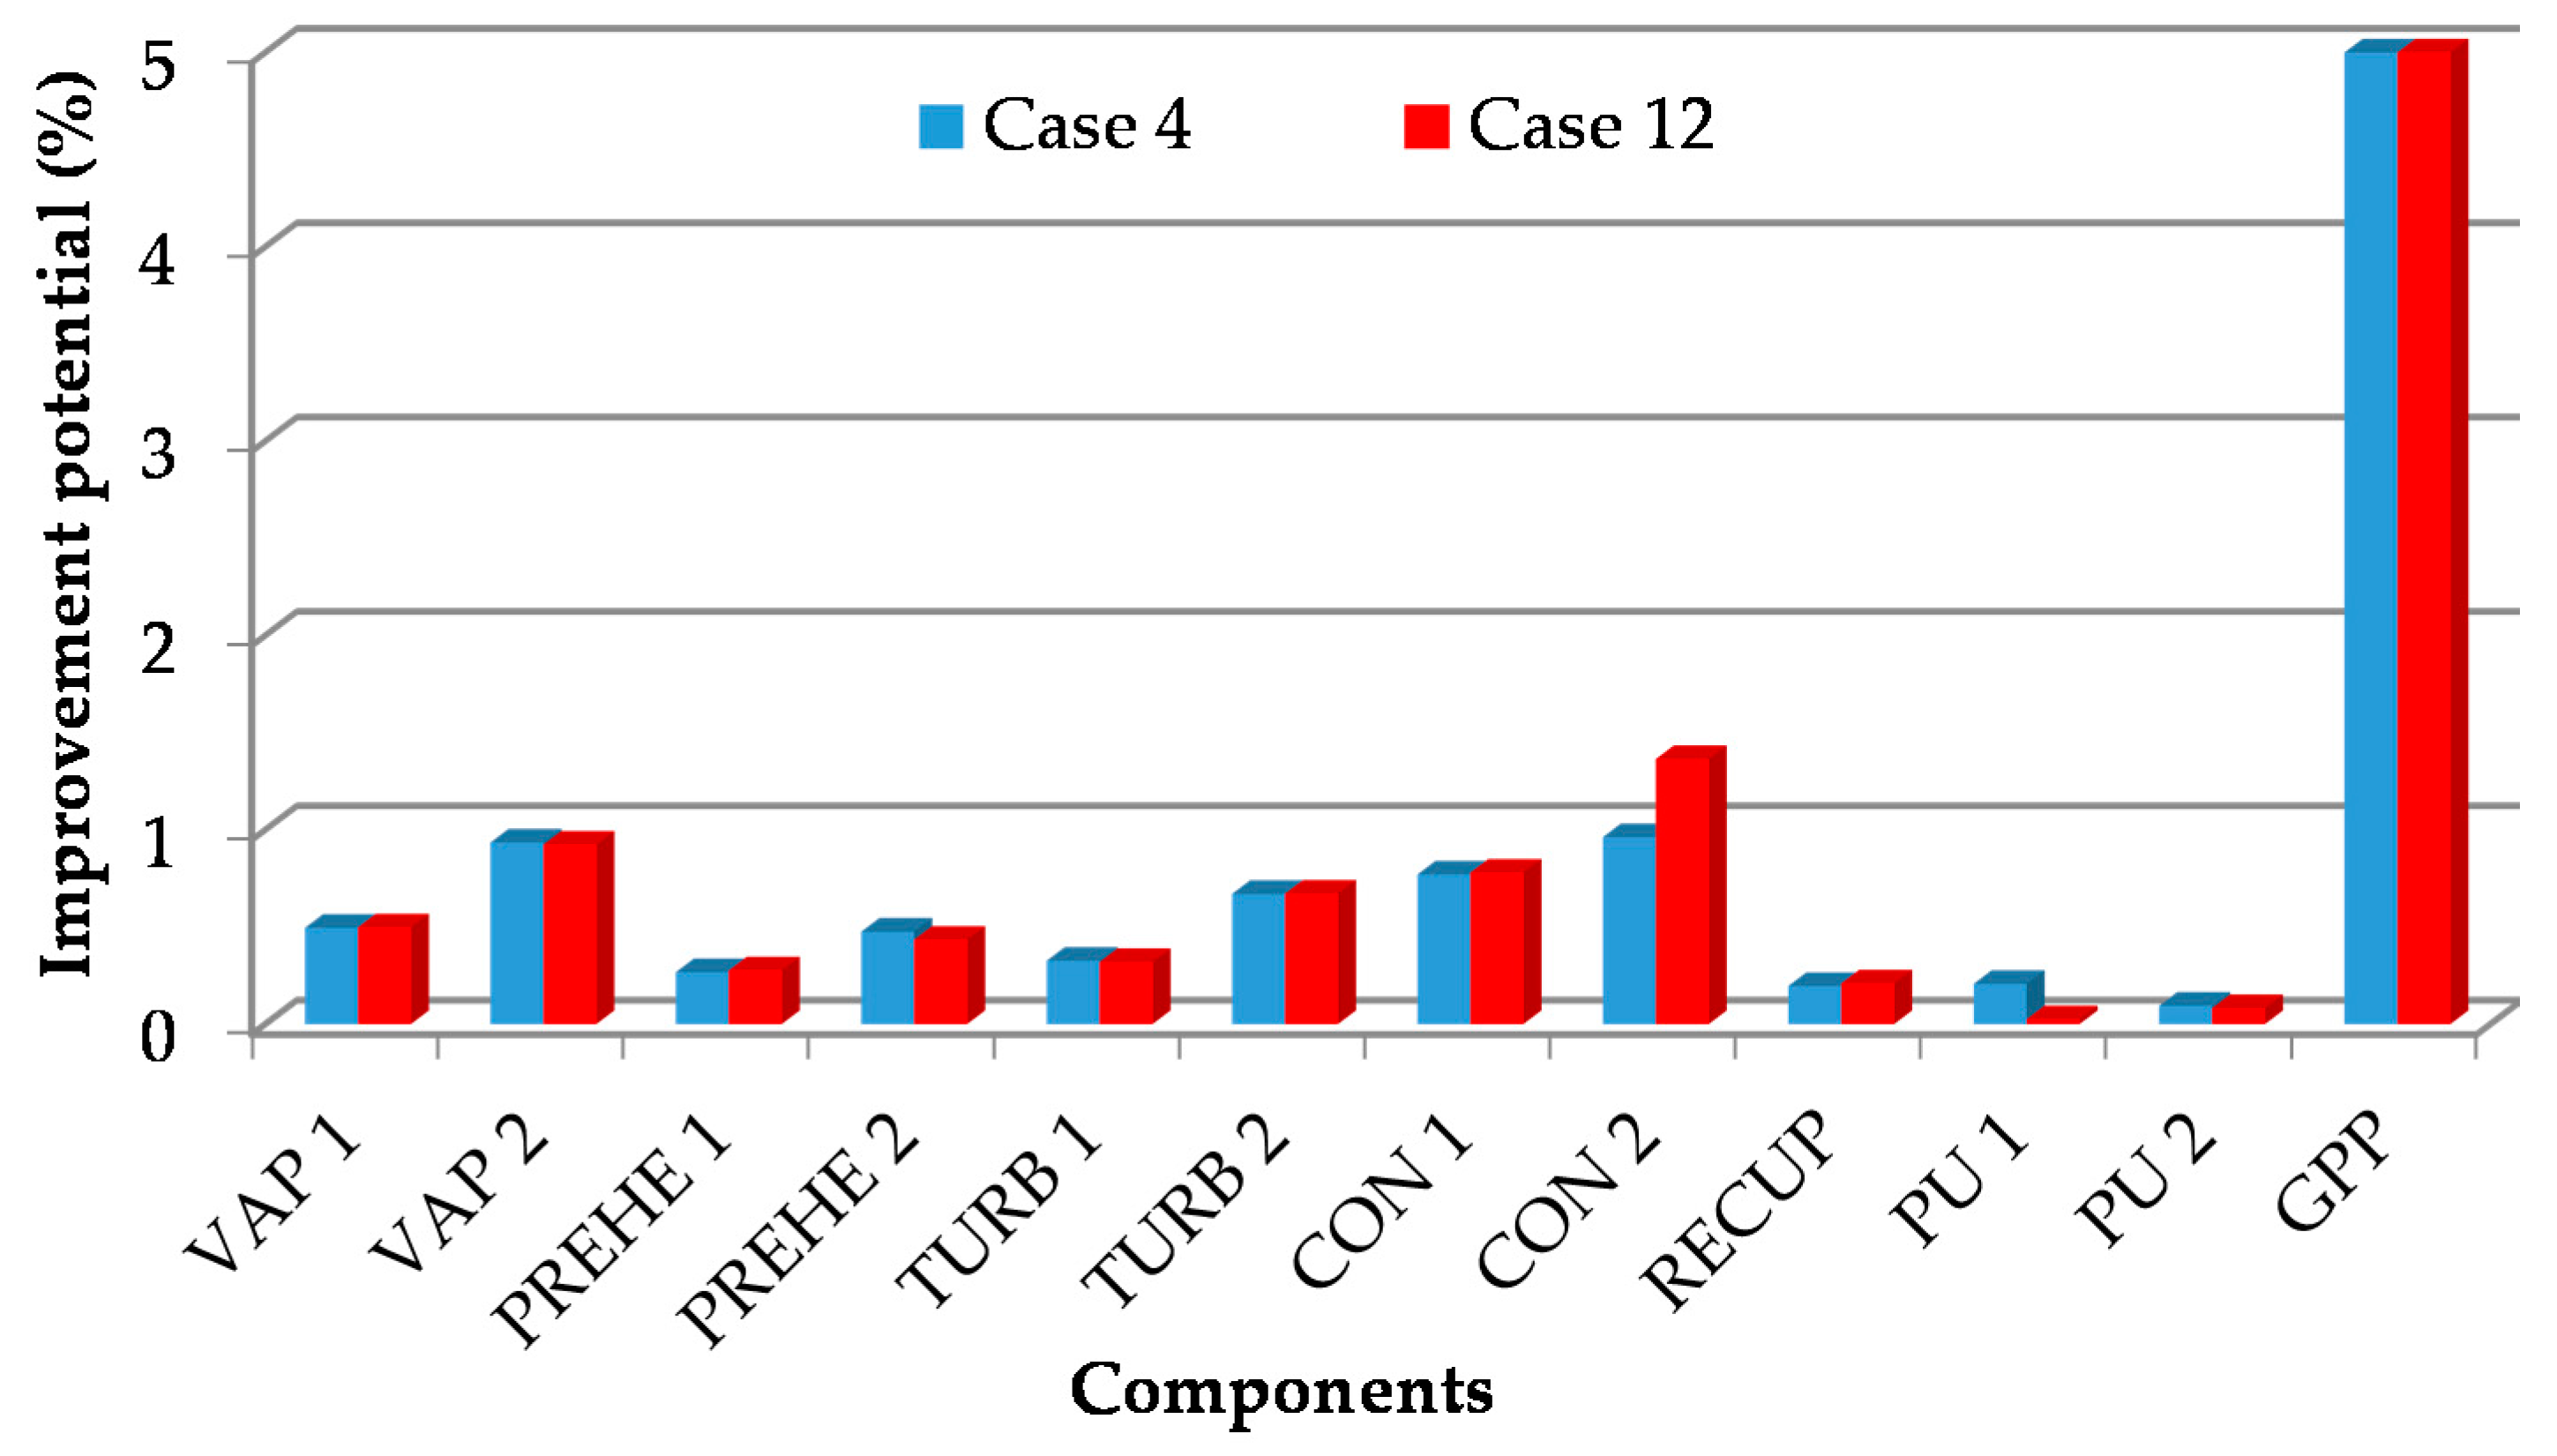
In
Figure 17, the input exergy rate of the real system is noted and the improvement potentials of the system components is compared according to optimization conditions. It can be observed that the improvement potentials of the components appear to be similar to
Figure 16. Wherein the differences are only in the improvement potential percentages and the improvement potential for the exergy input of the whole GPP. On
Figure 16, there is a slight difference in the improvement potential in Case 4 and Case 12, while on
Figure 17 they are the same. According to the exergy rate entering the system, the improvement potentials for the system components as CON 2, VAP 2, CON 1 and TURB 2 are 1.36%, 0.93%, 0.78% and 0.67%, respectively. However, as stated in the exergy analysis, improvement priority for pumps and fans does not appear in the results of the ABC optimization process.
4. Discussion and Conclusions
In this study, information is obtained about modelling and performance improvement of the geothermal binary geothermal power plant (GPP) with air-cooled organic Rankine cycle (ORC). As a case study, the exergy analysis according to the Second Law of Thermodynamics is applied to the Sinem GPP, operating currently and belonging to Maren Maraş Electricity Generation Inc. with data collected from the system under operating conditions. Meanwhile, a model is developed to simulate fully and accurately the GPP in terms of thermodynamics. Using the artificial bee colony (ABC) method, the developed model is optimized for thermodynamic performance. With the ABC method, 12 cases are chosen for optimization conditions. Thus, the performance of the power plant can be predicted with reasonable accuracy and at the same time, the physical process to be used to improve the performance of the power plant can be better understood.
Firstly, exergy analysis is performed for the GPP. The largest exergy losses from the power plant occur during re-injection of the geofluid, and then from the condenser, evaporator and pumps. Of the total 53.8 MW exergy input rate into the system, 23.7% is spent for re-injection, 0.5% for release of NCG into nature and 75.8% is exergy rate destroyed by the components of the GPP. According to exergy analysis, the total exergy production of the GPP is 21 MW and the exergy efficiency is 54.52%, after removing parasitic loads. The results of exergy analysis shown that the highest exergy destruction rate occurs in the condensers. The components with the highest exergy destruction rate are ranked as CON 2, VAP 2, CON 1, PU 1, PU 2 and separators. Their percentages are 4.6%, 4.6%, 3.7%, 3.6% and 3.6%, of the total exergy input rate, respectively. This order also determines the components requiring priority improvement.
In this study, a mathematical model fully simulating Sinem GPP accurately and thermodynamically is developed. This model is completed with the MATLAB program, which can rapidly incorporate thermodynamic flow properties from the COOLPROP program. The model uses an iterative method while attempting to estimate the outputs corresponding to component inputs in the system. This model is used to estimate the true potential of improvement or interactions between components. Fixed values in the model are changed in an attempt to make the model adapt to new conditions. Thus, the model gains dynamism. This model can adapt to environmental temperature and variations in temperature, pressure and flow parameters in all line numbers in the system. However, variations in temperature parameters strongly affect the ORC cycle, it may lead to insolvability. Variable selection and optimization intervals (upper and lower limits) are determined to maximize exergy efficiency of the Sinem GPP with the ABC optimization method. Thus, 12 cases are created with the optimization conditions (Cases 1–12). These cases all maximized exergy efficiency at the GPP. However, the best performance is obtained from Case 4 relating to the 2 turbines and Case 12 relating to the condensers. Case 7 simulates the real system exactly.
As the real Sinem GPP is designed in accordance with parameters relating to geofluid, exergy efficiency of the geothermal brine line did not cause much effect. As the output pressure of the turbines used to produce electricity increased, the condensers began to experience problems (and as a result the fans) and changes in the number of fans ensuring ORC affected the net electrical power generated. The net power generated in Case 4 is 16% larger than that of the real system. This increase is equivalent to electricity production of more than 3 MW. In Case 12 relating to condensers, this value is 14%. Thus, the most important components requiring care in the design and operation of Sinem GPP are turbines and condensers.
The ABC optimization process shows how exergy destruction in all components including condensers can be reduced. For example, the exergy destruction of CON 1 and CON 2 in the real system are 3.65 MW and 4.34 MW, while in the ABC optimization process, these values reduce to 1.77 MW and 3.16 MW, respectively. PU 1 and PU 2 are most affected by pollution and blunting problems in CON 1 and CON 2. Under all optimization conditions, the exergy efficiencies of the turbines TURB 1 and TURB 2 are the same. As a result, for beneficial exergy of the GPP, net power generation is noted. The components with highest exergy efficiency are CON 1 with 94%, TURB 1 with 93% and VAP 1 with 92%. The exergy destruction rates reach this level in TURB 1 and TURB 2 due to temperature differences, leaks and pressure falls.
The improvement potential for Sinem GPP is found to be 84%. Thus greatest improvement among system components are present for CON 2, VAP 2, CON 1 and TURB 2. Components with the least improvement potential are pumps (PU 1 and PU 2) and the recuperator RECUP. According to the exergy rate entering the system, the exergy improvement potentials of system components are in the order CON 2, VAP 2, CON 1 and TURB 2; however this order is not the same in the exergy analysis.
It appears that with developing technology, the efficiency of geothermal power plants continue to increase. At Sinem GPP there are problems such as inability to set the flow rate, temperature and pressure of the geofluid (brine) and/or keeping it low, the high temperature of geofluid, the high working temperature, the use of a recuperator on level I but not on level II, the binary turbines linked to the generator with the same shaft, the insufficient flow of geofluid steam and the high NCG content, the turbine leaks and losses, and the design/operating problems with the air-cooled condenser. Thus, though the exergy inputs are high, the electricity generation amount and efficiency of the power plant are low, so it appears not to work efficiently.
Finally, the ABC optimization method in this study can provide higher quality information than exergy analysis. If geothermal power plants can be studied with similar methods in this study, serious energy and cost savings may be ensured. The ABC optimization method can be completed for all power plants operating in accordance with the organic Rankine cycle.


