Techno-Economic Comparison of Onshore and Offshore Underground Coal Gasification End-Product Competitiveness


GFZ German Research Centre for Geosciences, Fluid Systems Modelling, Telegrafenberg, 14473 Potsdam, Germany
*
Author to whom correspondence should be addressed.
Energies 2017, 10(10), 1643; https://doi.org/10.3390/en10101643
Submission received: 29 September 2017
/
Revised: 11 October 2017
/
Accepted: 13 October 2017
/
Published: 18 October 2017
(This article belongs to the Section L: Energy Sources)
Abstract
:Underground Coal Gasification (UCG) enables the utilisation of coal reserves that are currently not economically exploitable due to complex geological boundary conditions. Hereby, UCG produces a high-calorific synthesis gas that can be used for generation of electricity, fuels and chemical feedstock. The present study aims to identify economically competitive, site-specific end-use options for onshore and offshore produced UCG synthesis gas, taking into account the capture and storage (CCS) and/or utilisation (CCU) of resulting CO2. Modelling results show that boundary conditions that favour electricity, methanol and ammonia production expose low costs for air separation, high synthesis gas calorific values and H2/N2 shares as well as low CO2 portions of max. 10%. Hereby, a gasification agent ratio of more than 30% oxygen by volume is not favourable from economic and environmental viewpoints. Compared to the costs of an offshore platform with its technical equipment, offshore drilling costs are negligible. Thus, uncertainties related to parameters influenced by drilling costs are also negligible. In summary, techno-economic process modelling results reveal that scenarios with high CO2 emissions are the most cost-intensive ones, offshore UCG-CCS/CCU costs are twice as high as the onshore ones, and yet all investigated scenarios except from offshore ammonia production are competitive on the European market.
1. Introduction
Underground Coal Gasification (UCG) can be an economic method to increase worldwide coal reserves by utilisation of coal deposits that are currently not mineable by conventional methods. Hereby, a target coal seam is converted by the injection of a gasification agent into a synthesis gas within a controlled, sub-stoichiometric gasification process [1,2,3,4,5]. After processing, UCG synthesis gas is applicable for different end-use options, such as the provision of chemical raw materials, liquid fuels, hydrogen, fertilizers or electricity (cf. Figure 1). The early idea of UCG and its evolution has a long history that was picked up especially at times of raw material scarcity. Since the 1930s, more than 50 pilot-scale UCG operations have been carried out worldwide, e.g., in the former Union of Soviet Socialist Republics (USSR), Europe, the U.S., South Africa, Australia and China [1,2,3,4]. These tests were predominantly undertaken at shallow depths, e.g., at Angren (110 m) in Uzbekistan, Chinchilla (140 m) in Australia, and Hanna (80 m) and Hoe Creek (30–40 m) in the U.S. One recent pilot-scale UCG operation in Poland was undertaken in 2010 at about 400 m depth in order to gasify 1300 metric tons of coal in three months at an average rate of 600 kg/h [6,7,8,9].
This in situ UCG trial at the Wieczorek mine (cf. Figure 2) was part of the Polish research project “Elaboration of coal gasification technologies for a high efficiency production of fuels and electricity” [11]. The results of the pilot-scale research at the Wieczorek mine serve as basis for the development of prospective commercial-scale UCG operations in the Upper Silesian Basin.
In view of the underlying techno-economic study, the comprehensive data gathered during the Polish UCG pilot-test and availability of representative coal samples offer a solid basis to parametrise techno-economic process and life cycle assessment models [13,14]. The present study aims at a transparent documentation of the techno-economic analysis to identify economically competitive site-specific UCG synthesis gas based end-utilisation options. In order to handle carbon emissions resulting from the combustion of coal, the UCG process is linked to the capture and subsequent storage of CO2 (CCS) in saline aquifers and/or its utilisation (CCU) as raw material for fuel production. Taking into account comprehensive domestic coal resources, the EU environmental guidelines claiming a reduction of import dependency, reduction of CO2 emissions and an increase in energy efficiency [15], coupled UCG-CCS/CCU processes may offer approaches to meet all of these criteria for Poland.
The tool applied for economic assessment is the techno-economic model developed by Nakaten et al. [5]. This model is applicable to calculate the costs of using UCG synthesis gas for electricity generation in a combined cycle gas turbine (CCGT) power plant coupled with CCS, taking into account site-specific geological, chemical, technical and market-dependent boundary conditions. It consists of six sub-models (cf. Figure 3) and is controlled by more than 130 model input parameters, adaptable to site-specific boundary conditions for any study area. For the present study, the techno-economic model was extended to include UCG-based methanol and ammonia production (cf. Figure 3) as well as a corresponding offshore UCG set-up (cf. Section 2.2.2).
Innovations provided within the present study are:
- The implementation of a mass and energy balance assessment for air separation (ASU), CO2 compression, CO2 and gasification agent injection, UCG synthesis gas production, methanol and ammonia synthesis (cf. Figure 3, blue-bordered boxes) to identify process steps requiring energy-saving measures, as well as
- the assessment of individual synthesis gas compositions and the employed gasification agent, impacting overall levelized onshore and offshore costs.
Results obtained from quantification of cost bandwidths by single model parameter variation and comparing offshore to onshore levelized costs for selected UCG-CCS/CCU scenarios show that offshore UCG-based methanol and ammonia production are about twice as expensive as in the investigated onshore scenarios. However, except for offshore ammonia production, all UCG-CCS/CCU scenarios are economically competitive. Furthermore, techno-economic modelling results reveal that compared to the offshore platform with its technical equipment, offshore drilling costs have an insignificant impact of about 1% on total levelized costs. Hence, uncertainties related to parameters influenced by drilling costs are negligible. Besides, results point out approaches for a cost-effective commercial-scale UCG-CCS/CCU operation. A significant method to maintain low production costs is a precise management of the gasification agent composition, whereby an oxygen ratio of maximum 30% by volume is suggested to maintain low ASU costs. Synthesis gas compositions that prove to favour electricity generation are characterized by high calorific values (CV), whereby methanol and ammonia production also significantly benefit from high H2/N2 ratios and low CO2 contents. In the present study, a CO2 share of maximum 10% is sufficient to supply methanol synthesis at a yield of 13.5 kg methanol per second, while waste CO2 production is kept at a minimum.
2. Materials and Methods
Within the underlying Section, basic model assumptions, the calculation methods applied and intermediate calculation results, fundamental for the investigated onshore and offshore UCG-CCS/CCU scenarios are discussed.
2.1. Dimensioning of Assessed UCG-Based Production Chains
Selected onshore UCG synthesis gas end-use options in line with the present study are electricity generation as well as commercially produced methanol and ammonia. Hereby, dimensions of employed process units were adapted to representative commercial-scale plants sizes. For electricity generation, a plant size of 100 MW net generation was chosen. Gross generation amounts up to 285 MW, ensuring energy supply for compressors as well as the separation of air and CO2. Following the model setup presented by Perez et al. [16], methanol production amounts up to 426 kt per year. The amount of produced ammonia was determined to 310 kt per year, representing an average Polish ammonia plant size [17]. Hereby, the determined product outputs listed above were maintained constant for all investigated scenarios.
2.2. Applied UCG Technologies and Well Design
2.2.1. Onshore UCG Technology Implementation
For target coal seam utilisation, we considered the Controlled Retraction Injection Point (CRIP) technology [1,2,3]. Key data related to geological boundary conditions (cf. Table 1) and coal seam extraction (cf. Table 2) were adapted from the coupled thermo-mechanical 3D UCG model set-up introduced by Otto et al. [18] and data elaborated by Otto et al. [19,20].
The suggested optimised vertical well layout for injection and production as well as the network of lined deviated injection boreholes, drilled horizontally into the coal seam are presented in Figure 4. To achieve an individual control of the UCG process by managing gasification agent injection rates and liner retraction, each gasification channel is controlled by a separate liner introduced by a separate injection well.
Aiming at an energy-efficient injection process, we iteratively determined inner liner well diameters, using thermodynamic process simulations embedded into the techno-economic model [21] to mitigate high flow velocities and resulting pressure losses. For thermodynamic modelling, we applied the DWSIM software package [21] considering the ChemSep database [22], whereby interfaces between techno-economic and thermodynamic models were established via a DWSIM control module (cf. Figure 5).
Inner well diameters were conservatively determined using the electricity production model, which represents the highest mass flow rates among the selected UCG end-utilisation options. Hereby, gasification agent mass flow through one injection well amounts to 13.6 kg/s and synthesis gas mass flow through one production well up to 18.4 kg/s (four simultaneously active production wells). The mass flow through one CO2 injection well sums up to 28.2 kg/s. Allowing for a pressure loss of max. 2 bars, we chose inner well diameters of 7 inch for gasification agent injection as well as 9 inch for all production wells and the CO2 injection well. Mass flow rates occurring in line with methanol and ammonia production are up to a fourfold smaller; however, we neglected to develop separate well layouts that would hardly differ from an economic point of view. Hereby, smaller inner liner diameters allow for higher achievable build-up rates, and thus less drilling meters. However, drilling costs have only an insignificant impact of max. 1.7% on total levelized costs in the present study. Further simulation constraints that influence density, viscosity and enthalpy of the gas mixtures, and thus pressure losses in wells result from the hydraulic and thermal well profiles as well as temperature and pressure conditions at the well heads and bottomholes. The hydraulic well profile comprises information on the well casing material, length and diameter.
Based on the inner liner diameters of the injection wells, the achievable build-up rates of the deviated drillings are determined according to Godbolt [23] to 6° per 30.48 m (100 ft). Referring to thermomechanical modelling results on channel stability in the absence of subseismic faults, 60 m (cf. Figure 4) represents a sufficient pillar width to avoid inter-channel hydraulic short circuits [18]. The achievable gasification channel width in the Wieczorek target coal seam amounts to 20 m (cf. Table 2) according to Otto et al. [18]. In order to ensure the daily required synthesis gas feed in the reference scenario for an overall operational lifetime of 20 years, 1.2 UCG panels (15 gasification channels) are required for electricity generation. Referring to methanol and ammonia production, less than one UCG coal panel is required (cf. Table 2) to ensure coal supply for a 20 years operational lifetime.
Production wells are drilled vertically from the surface and spaced at a distance of 100 m along the horizontal extension of each gasification channel (cf. Figure 4). This distance is considered appropriate to avoid consumption of high-value product gas components (synthesis gas cannibalism) [1,4,24]. For the extraction of a complete UCG panel at a width of 2 km, 260 production wells are required. Taking into account the number of simultaneously operating gasification channels (cf. Table 2), the total daily coal consumption (1.1 kt/day for electricity, 538 t/day for methanol and 234 t/day for ammonia production) and the geometrical gasification channel data (cf. Table 1 and Table 2), an average daily horizontal gasification front progress of up to one meter can be achieved [18,25]. The overall coal yield of the chosen UCG well layout is about 25%. Drilling costs (cf. Table 3) were calculated based on the total number of required injection and production wells as well as the target coal seam dimensions (cf. Table 1 and Table 2). Within the UCG sub-model (cf. Figure 3), all cost positions associated with gasification agent production, its compression and injection (Section 2.3), synthesis gas processing (Section 2.4), drilling, land acquisition, piping, measuring, control equipment costs as well as concession fees and permissions are combined.
Table 4 lists further fuel production costs that related to the UCG process, summing up to 876 M€ for electricity as well as 603 M€ for methanol and 380 M€ for ammonia production.
2.2.2. Offshore UCG Technology Implementation
We applied a modified version of the model developed by Nakaten et al. [5] to assess the costs of two offshore UCG-CCS/CCU production chains, aiming at methanol and ammonia generation. For comparability, the generic offshore model parametrisation is equal to that of the previously discussed onshore model. Revised model assumptions are primarily affected by the UCG well design and increased costs accounted for the required offshore infrastructure. Furthermore, we neglected a power generation scenario for the offshore UCG-CCS/CCU economic assessment in favour of methanol and ammonia production. Electricity production on offshore UCG platforms is of limited applicability since the only potential nearby consumer is the platform itself. Further, offshore transport of electricity over large distances is not considered to be as economic as, e.g., the transport of methanol or ammonia by ships. While varying methanol and/or ammonia production capacities do not significantly impact the overall production costs, electricity generation economics strongly depend on a continuous power supply to an electricity network [31,32].
Figure 6 shows the suggested radial well design for offshore coal seam extraction, taking into account the Parallel Controlled Retracting Injection Point (P-CRIP) UCG approach [33,34,35,36]. To maximize the coal yield in one offshore panel by means of 25 gasification channels, injection and production wells are drilled in-seam parallel to each other [36]. Applying this well layout, a maximum coal yield of 46% can be achieved. Hereto, we implemented alternating “long” (997 m) and “short” (650 m) gasification channels for coal yield optimisation (cf. Figure 6), considering a safety distance of at least 100 m between the single gasification channels. Initially, this safety distance was derived from Otto et al. [18] and increased to represent a conservative value in view of the radial design. In this context, Nakaten and Kempka [36] validated the chosen pillar width in terms of potential hydraulic short circuit formation between single UCG reactors and seabed level subsidence by numerical geomechanical simulations.
For the reference scenario, we assumed a maximum gasification channel width of 200 m, decreasing to 45 m (“long” channel system) and to 21 m (“short” channel systems) at the narrow parts close to the circle centre. We further implemented different scenarios with maximum gasification channel widths from 50 to 200 m and quantified the resulting cost bandwidth (cf. Section 3.4.3) to consider economic uncertainties resulting from the assumed maximum achievable gasification channel width. The proposed well design allows for the extraction of 33.8 Mt coal per panel. However, for the reference scenario, taking into account an average daily coal consumption of 538 kt for methanol and 234 kt for ammonia production, 3.9 Mt of coal are sufficient to ensure the operation for a 20 years process lifetime. Relevant data regarding the geological boundary conditions of the offshore UCG design are listed in Table 5.
Due to a lack of data, offshore drilling costs (cf. Table 6) were determined based on the previously introduced onshore costs (cf. Table 3). Since offshore drilling is significantly more expensive than onshore drilling, we conservatively assumed five times higher drilling costs in the offshore reference scenario. Uncertainties related to offshore drilling costs are further assessed and quantified in the scope of the sensitivity analysis (cf. Section 3.4.2). Total UCG costs for offshore methanol production sum up to 1.8 G€ and to 1.6 G€ for offshore ammonia production.
2.3. Gasification Agent Compression and Injection
For comparability, process dimensions of the offshore and onshore models were equalized, thus parametrisation related to gasification agent production, compression and injection as well as the related intermediate results are identical. To provide a gasification agent mixture consisting of 30% O2 and 70% N2 by volume, the UCG set-up was extended by a cryogenic air separation unit (ASU). Air compression in the ASU process is implemented within three stages, whereby modelling results on the total power requirement, obtained from thermodynamic process simulations using the DWSIM software package [21] sum up to about 17 MW for onshore electricity generation. Air compression power demand for methanol production amounts to 8.2 MW and to 3.8 MW for ammonia production. Gasification agent compression before its injection is achieved within five stages, resulting in a total compression power requirement of 26.4 MW (electricity generation), 12.8 MW (methanol production) and 5.7 MW (ammonia production), respectively.
Total Capital Expenditure (CAPEX) and Operational Expenditure (OPEX) for the ASU process as well cost positions related to gasification agent compression and injection in the onshore and offshore reference scenarios are listed in Table 7. Hereby, electricity costs are neglected, since the power requirement for all process stages is autonomously provided by the integrated CCGT power plant (onshore) or a gas turbine at the offshore platform.
2.4. Synthesis Gas Processing
For the techno-economic modelling of the selected UCG end-product utilisation options, we considered a synthesis gas composition (15.90% H2, 1.20% CH4, 6.43% CO2, 17.54% CO, 58.93% N2 including 0.30% of minor constituents such as C2H2, H2S; all data given in % by volume). This composition was achieved during the first stage of a five-stage in situ UCG gasification test at the Wieczorek mine [7], in which different gasification agent compositions at each gasification stage were analyzed. The oxygen fraction in the gasification agent applied in the underlying study amounts to 25% by volume. The synthesis gas calorific value achieved during this stage was 4.4 MJ/sm3. After its transportation to the surface via production wells, the synthesis gas is cooled, scrubbed to remove trace elements and excess water is separated. Subsequently, the synthesis gas is processed in a gas cleaning section, whereby CO is converted into CO2 in a CO-shift reactor. Thereafter, sulfur components and CO2 are removed in a physical absorption process. In line with methanol and ammonia production, CO2 and H2 are seperated from the synthesis gas by means of physical adsorption (PSA) [37,38,39].
CAPEX and OPEX for synthesis gas processing (cf. Table 8) taking into account the Selexol process, were determined using the IECM modelling tool [29] and scaled linearly to the dimensions of the underlying operational UCG set-up by three scaling factors (net output, operating hours, gas flow rate). Referring to electricity generation with a total synthesis gas flow of 71.4 kg/s, synthesis gas processing CAPEX sum up to 132 M€, and variable and fixed costs to 7 M€. Taking into account the PSA process, synthesis gas processing costs in the methanol and ammonia production chains result in CAPEX of 12.9 M€ and 4.4 M€ and yearly OPEX of up to 6.5 M€ (methanol synthesis) and 2.2 M€ (ammonia production). For better comparability, generic model assumptions (process dimensions, synthesis gas composition) of methanol as well as ammonia offshore and onshore models were equalized; hence, related intermediate calculation results are equal, too.
Annual investment costs for the PSA process were calculated according to [30], taking into account total investment costs of 12.9 M€ (methanol) and 4.4 M€ (ammonia), an interest rate of 10% as well as an economic and technical lifetime of 20 years.
2.5. Costs for UCG Offshore Platform
Following Boeing [40], we considered CAPEX of about 591 M€ for the construction of a UCG offshore platform (corrected for inflation) and further 591 M€ for technical services and material costs for 20 years of operation. To maintain comparability to the onshore scenario, where no end-product transportation is considered, transportation is also not included in the UCG offshore cost determination.
2.6. CO2 Capture and Storage (CCS) or Utilisation (CCU)
Three existing technologies can be utilised to capture CO2 from the synthesis gas: post-combustion, pre-combustion and oxy-fuel combustion capture [38,41,42]. For the underlying study, we chose a typical physical absorption pre-combustion process using a Selexol solvent, suitable for high CO2 capture ratios (95% considered in our calclations) and common for IGCC power plants [43]. Hereby, the Selexol procedure requires less equipment for dehydration, solvent recovery and CO2 compression compared to the Rectisol process [39]. Nevertheless, purification from hydrogen and carbon dioxide, crucial for methanol and ammonia syntheses requires the application of the pressure swing adsorption (PSA) technology. Most of the modern plants use multi-bed PSA units to remove water, ethane and CO for the recovery of high-purity hydrogen (99.99%). Carbon dioxide is also seperated during this process with a capture ratio of 90% [44,45].
In view of CO2 storage, one approach discussed by Kempka et al. [24] and Burton et al. [46] is to reinject captured CO2 into the former UCG reactors resulting from coal consumption; however, within the underlying study we assumed the availability of a geological reservoir with sufficient storage capacity to completely trap the captured CO2 of up to 20.6 Mt during a 20 years operational lifetime (max. 18.5 Mt in line with electricity generation). This storage reservoir is assumed to be close to the UCG site (max. 1 km distance) at a depth of about 800 m, which is considered as minimum depth to ensure efficient CO2 storage [46].
2.6.1. Onshore CCS/CCU Costs
Selexol capture costs for UCG-based electricity production were determined according to available data on energy consumption (0.108 kWh/kg CO2 [39]), chemical process simulation results on power demand for CO2 compression as well as Selexol CAPEX (0.67 €/kW) and OPEX (0.10 €/kW) adapted from Mohammed et al. [39]. Scaled to the dimensions of the underlying operational setup (net power generation 100 MWel) with emissions of 1 t CO2/MWh, the total energy demand for CCS sums up to 21.7 MW. Due to the short distance between the UCG site and CO2 storage reservoir, intermediate CO2 compression for transport is not required. As levelized costs for transportation (0.002 €/t CO2) have nearby no impact on total levelized CCS costs, they were neglected in this study. Taking into account one well for CO2 injection, CAPEX for injection amount to 1.57 M€ and OPEX to 0.31 M€/year, summing up to total levelized CO2 injection and storage costs of 0.44 €/t CO2. The estimated discounted monitoring costs for a 40-year period (20 years operational lifetime and additional 20 years for post-closure monitoring), were taken from Gruson et al. [47] and amount to 28 M€ (0.79 €/t CO2). Cumulative levelized CCS costs (cf. Table 9), considering the underlying boundary conditions applied for the electricity generation set-up, amount to about 12.8 €/t CO2.
Aiming at a preferably CO2 emission-neutral methanol process both, CO2 resulting from UCG (12.3 kg CO2/s at a capture ratio of 90%) and power generation (10.1 kg CO2/s at a capture ratio of 95%) is utilised for the production of 13.5 kg methanol per second (426 kt methanol per year). Deducting a waste CO2 mass flow of 0.58 kg/s purged during the methanol synthesis process as well as inseparable CO2 components remaining in the flue gas after Selexol capture (1.3 kg CO2/s), 92% of CO2 produced throughout the entire UCG-MeOH production chain (23.7 kg CO2/s) is utilised. Consequently, carbon capture and its subsequent utilisation represents a new economy for CO2, since captured CO2 has not to be handeled as waste product but can be used as raw material for other processes [16]. In the underlying study, costs for CO2 capture and utilisation (CCU) that arise in line with methanol synthesis are not charged separately. However, CO2 capture costs considering the PSA process are associated with hydrogen production CAPEX and OPEX, since carbon dioxide is purified from the synthesis gas as by-product of hydrogen. Costs for capturing CO2 that result from internal power supply as well as its compression before entering the methanol recycle loop are charged directly with levelized costs as the related processes are part of the methanol synthesis process.
In view of ammonia production, PSA CO2 capture costs are not charged separately but associated with hydrogen costs (cf. Section 3.3). The power required to compress the CO2 mass flow (5.4 kg/s) before storage was determined by means of thermodynamic process simulations and amounts to 1.9 MW. As for the electricity generation model setup, CO2 transportation costs are neglected in this study. Taking into account the boundary conditions for the ammonia model set-up, costs for injection and storage (2.0 €/t CO2) as well as monitoring (4.2 €/t CO2) sum up to 6.2 €/t CO2.
2.6.2. Offshore CCS/CCU Costs
Since offshore electricity generation is not considered in the present study and CO2 related to methanol production is almost completely consumed, offshore CCS costs arise for offshore ammonia production, only. Hereby, to maintain comparability with the onshore ammonia model, similar assumptions referring to the monitoring were taken into account, and thus related cost positions are identical in the onshore and offshore scenarios. Furthermore, we used the same assumptions for the distance (1 km) of the UCG platform to the CO2 storage reservoir (800 m depth) in both models. However, assuming five times higher injection well drilling costs in the offshore scenario, total annualized capital costs as well as operational costs for storage and injection sum up to 2.5 €/t CO2 (compared 0.44 €/t CO2 in the onshore model). Additional electricity costs were not considered, since the required energy is provided by the offshore platforms’ gas turbine.
2.7. Methanol Production Energy Balance
In line with the assessment related to methanol economic competitiveness on the European market, mass and energy flows as well as the amount of CO2 that is not emitted, we considered a commercial-scale methanol production scenario based on UCG synthesis gas at an average scale of the already existing MeOH synthesis plants in Europe. For the present study, we chose to investigate methanol production due to its importance as fuel that is blendable with gasoline, transformable and blendable with diesel, and applicable in fuel cells. Hereby, existing gasoline distribution and storage infrastructure like pipelines, road tankers and filling stations would require little modification to operate with methanol. Besides, methanol can function as storage for hydrogen or as a feedstock to synthesise olefins [16,48,49,50].
Usually, methanol is produced by means of the Fischer-Tropsch process, where CO and 2H2 react to CH3OH [16]. However, in the present study we follow methanol production by direct hydrogenation of CO2 with H2, since CO contained in the UCG synthesis gas is considered to be consumed for internal power supply. Hereby, direct CO2 hydrogenation with H2 is governed by two reactions taking place in the reactor. While Reaction (1) is the one that produces MeOH, CO formed in Reaction (2) is recycled together with unreacted H2 to increase the output, once MeOH and water are separated.
Thermodynamic process simulations to analyse mass and energy flows are implemented using the DWSIM software tool [21], whereby applied boundary conditions and subsequent model validation closely follow the reference process [16,51]. In summary, methanol synthesis consists of the following process steps: after CO2 pressure is increased from 1 bar up to 23.2 bar, H2 (30 bar, 25 °C) and CO2 (23.2 bar, 28 °C) feeds are mixed, compressed to 76.4 bar and heated in a heat exchanger to 210 °C before the methanol synthesis reactor inlet. Hereby, the high temperature is crucial, even though the methanol yield has an negative correlation with temperature and a positive one with pressure. However, the catalyst efficiency is more intense at higher temperatures [48]. The reactor is modelled as an adiabatic Gibbs reactor according to Reactions (1) and (2) [16,51]. At the reactor outlet, before methanol and water are separated in a component separator, stream temperature is cooled down from 294 °C to 35 °C in a heat exchanger. About 99% of unreacted H2, CO2 and CO are recycled, whereby 1% is purged to avoid accumulation of inert gases [16].
In the present study, total electricity consumption for the synthesis of 426 kt MeOH/year results from the power demand for CO2/H2 compression (43.9 MW) as well as methanol and water seperation (1.2 MW), summing up to 45.1 MW. Additional heat resulting from that exchanged among the streams amounts to 91 MW, compared to 81 MW according to Perez et al. [16]. This heat can be further used to generate electricity; however, in order to maintain the focus of the present study, we did not consider conversion of excess heat into electricity in our simulations. Compared to identical model boundary conditions as applied by Perez et al. [16], compression power demand in the underlying study is higher by 42%. This significant difference is related to the energy efficient process set-up applied, using electricity generated by ad-hoc steam turbine systems as well as four expanders that take advantage of the calorific value of the purge gases. In this way, electricity demand can be reduced by 46% [16]. Consequently, considering the utilisation of the heat produced, power demand in the present study can offer opportunities to be optimised significantly. Discrepancy in the methanol production rate compared to Perez et al. [16] amounts to 3.2%. This is likely attributable to the fact that we used the DWSIM software package with a Gibbs reactor, while Perez et al. [16] employed the CHEMCAD software package [52] with a productive copper catalyst (Cu/ZnO/Al2O3).
Combining thermodynamic process simulations on the energy balance of methanol synthesis with the techno-economic process model, power gross generation for the entire UCG-MeOH production chain including air and gasification agent compression, CO2 capture after electricity generation, the methanol synthesis itself adds up to 121 MW. Nevertheless, synthesis gas mass flow related to this gross generation is not sufficient to provide the CO2 amount (22.4 kg CO2/s) required to achieve the envisaged methanol output (13.5 kg MeOH/s). Hence, the model set-up is up-scaled by increasing the power net generation by up to 13 MW, so that the required CO2 amount becomes available. Since this amount of electricity is not required for methanol production itself, it can be fed into the local power grid. As a result of H2 consumption for methanol production (57%), the synthesis gas CV is decreased to 3.4 MJ/kg from initially 4.4 MJ/kg.
2.8. Ammonia Production Energy Balance
Ammonia is a key ingredient to fertilizer production, whereby the widespread use of ammonia in agriculture was initiated by the green revolution, which also involved development of high-yielding crops and advances in pesticides. Thus, ammonia synthesis optimisation is a topic of high interest in industry, as the market continues to expand and demand increases [53]. Ammonia is produced from hydrogen and nitrogen at operating pressures above 100 bar (Haber-Bosch process), necessary for a favorable equilibrium position and high reaction rate [53]. Reduction of expenses for the required compression power can be achieved by the implementation of compressors driven by steam turbines that take advantage of steam produced elsewhere in the process, as applied in the methanol model (cf. Section 2.7). According to the approach of Villesca et al. [53], compression power reduction during ammonia synthesis is achieved by increasing reactor efficiency through the use of an innovative high-activity ruthenium-based synthesis catalyst which is twenty times more active than a conventional iron catalyst, so that lower synthesis pressures and temperatures can be achieved.
For the assessment of costs, mass and energy flows in view of ammonia production, we chose an average scale of existing ammonia plants in Poland with a production rate of about 850 t/day [53]. The DWSIM-based ammonia synthesis model is parametrised according to the optimised process setup by Villesca et al. [53] and scaled to the envisaged output. Hereby, hydrogen and nitrogen derived from the UCG synthesis gas along with small fractions of methane and argon are compressed from 20 bar at 40 °C up to 100 bar at 54 °C and fed to the ammonia process at a molar ratio of 3:1. Mixed with yet not reacted components entrained in a recycling process, nitrogen and hydrogen enter the synthesis reactor with a pressure of 100 bar at 11 °C. The reactor is modelled as an adiabatic Gibbs reactor governed by the kinetics of the exothermic equilibrium reaction (Reaction (3)). The stream (gas phase) leaves the reactor at a temperature of 375 °C and is cooled down to −30 °C before the end-product ammonia is separated (9.8 kg ammonia/s). Unreacted components (H2 and N2), making up less than 1% of the purge stream are recycled to increase the ammonia yield.
DWSIM-based simulation results exhibit just insignificant differences of about 1% compared to the ammonia yield achieved by Villesca et al. [53]. Waste heat resulting from that exchanged among the product streams amounts to 43 MW. The total power demand for ammonia synthesis sums up to 8 MW, thereof 99.6% are required for compression and 0.4% to remove the end-product from the product stream. Villesca et al. [53] do not present the total power requirement for ammonia synthesis; however, compared to findings in view of different ammonia synthesis loop efficiencies [54], our energy balance simulation results are representative. To finally determine economic competitiveness of UCG-based NH3 production on the European market, thermodynamic simulation results on the power required to synthesise ammonia were integrated into the techno-economic model by Nakaten et al. [55]. Thus, taking into account all process steps related to the entire UCG-NH3 production chain, the required gross generation adds up to 33 MW. However, the synthesis gas mass flow associated with this gross generation is not sufficient to provide the required nitrogen share for the envisaged ammonia output. Thus, in order to fulfil the nitrogen demand, the overall model set-up was up-scaled by increasing the power net generation by 12 MW. Since this additional amount of electricity is not required for autonomous power supply of the ammonia production chain, it is considered to be fed to the local power grid. The synthesis gas CV applied to determine gross and net power generation is up to 31% lower than the initial one (4.4 MJ/kg), as 80% of the H2 share contained in the UCG synthesis gas is consumed to synthesise ammonia.
3. Results
In the present chapter, we discuss the techno-economic calculation results for the UCG-based electricity, methanol and ammonia production.
3.1. Levelized UCG-CCGT-CCS Costs
Costs of electricity (COE) are the total costs required for conversion of a fuel into electricity. For the current study, we used the COE calculation according to Nakaten et al. [5], based on UCG synthesis gas electrification in a combined cycle gas turbine power plant (CCGT) with an operational efficiency of 58% and a capacity of 100 MW net power generation. The CCGT power plant gross generation amounts to 285 MW (reference scenario). Hereby, gross generation is automatically adjusted to the energy demand that changes with the underlying synthesis gas composition (cf. Section 3.4.1), while net power generation is maintained constant at 100 MW to ensure comparability between the different scenarios. Further power plant-related boundary conditions that have been considered within the economic assessment are a calculated interest rate on the planning horizon of 7.5% and a real operating cost increase of 1.5%. Electricity production costs are calculated as the average costs on a full-cost basis and all costs were adapted to the reference year 2017. Equations to determine total investment costs, annual capital costs, operating costs, the capital value of the overall costs, the levelized total annual costs with and without demolition were adapted from Nakaten et al. [5], Hillebrand [31] and Schneider [32]. Fuel costs contain all UCG-related costs, such as gasification agent production and injection, synthesis gas processing, drilling, land acquisition, piping-, measuring-, control equipment costs as well as concession fees. Hereby, the levelized fuel costs (8 €/GJ) are calculated by dividing UCG costs by the amount of fuel produced (5.4 PJ/year). All abovementioned cost positions, relevant for the determination of COE (53.6 €/MWh) are shown in Table 10. Hereby, COE are the quotient of the levelized total annual costs and the amount of electricity produced (876 GWh/year).
In summary, COE and CCS costs sum up to 66.3 €/MWh. Compared to COE of other Polish power plants amounting from 45 to 75 €/MWh without CO2 emission charges [56,57,58,59,60] and to 91 €/MWh for gas-fired power plants with CO2 emission charges [57], the application of UCG synthesis gas for electricity production is competitive on the Polish energy market. Offshore electricity production is not considered in the present study; however, taking into account the same amount of fuel produced as in the related onshore model (285 MW gross generation), offshore fuel production costs would be two times higher.
3.2. Levelized UCG-MeOH-CCU Costs
3.2.1. Onshore UCG-MeOH-CCU Costs
Techno-economic process modelling results on the methanol production costs are listed in Table 11. Hereby, CAPEX sum up to 174 M€, OPEX to 6.5 M€/year and total UCG costs to 461 M€ without synthesis gas processing costs. Total levelized UCG-based methanol production costs sum up to 135 €/t MeOH. Compared to the average European market price in 2017 of 380 € per tonne MeOH [61], UCG-based methanol production is competitive. Costs for the production of fuel (synthesis gas) in line with onshore methanol production amount to 4.1 €/GJ. The individual components of total levelized onshore methanol production costs are shown in Table 12.
3.2.2. Offshore UCG-MeOH-CCU Costs
Offshore UCG-based methanol production costs are composed of all UCG-related process costs taken into account for the onshore model as well as the aforementioned CAPEX and OPEX for the UCG offshore platform. Hereby, total levelized offshore methanol production costs amount to 280 €/t MeOH, exceeding associated onshore costs twice. Nevertheless, compared to the current methanol market price, offshore methanol production in the present study is yet economic. Fuel production costs under the given boundary conditions sum up to 12.6 €/GJ. The individual components of total levelized UCG-based offshore methanol production costs are shown in Table 13.
3.3. Levelized UCG-NH3-CCS Costs
3.3.1. Onshore UCG-NH3-CCS Costs
Ammonia synthesis costs (cf. Table 14) were adapted from Bartels [62] and scaled to the dimensions used in the present study. Thus, adding total UCG costs related to the underlying model setup (332 M€ without synthesis gas processing costs), total levelized ammonia production costs cumulate to 186 €/t NH3. Costs for CO2 injection, storage and monitoring sum up to 5.4 €/t NH3. Fuel (synthesis gas) production costs in line with onshore ammonia production amount to 7.7 €/GJ. Compared to the current European ammonia market price of 294 €/t NH3 [63], UCG-based ammonia production is economically competitive. The individual components of total levelized UCG-based onshore ammonia production costs are shown in Table 15.
3.3.2. Offshore UCG-NH3-CCS Costs
UCG design for offshore ammonia production is equal to that used in the onshore scenarios. Thus, costs for the onshore and offshore ammonia synthesis processes are equal. However, due to higher CAPEX and OPEX for the technical offshore equipment as well as five times higher drilling costs compared to the onshore scenarios, offshore ammonia production (384 €/t NH3 and 6 €/t NH3 for CO2 injection, storage and monitoring) is about twice as expensive as the onshore variant. Fuel production in line with offshore ammonia production amounts to 32.5 €/GJ. Compared to the average European ammonia market price for 2017 (294 €/t ammonia), offshore UCG-based ammonia production is not competitive. Table 16 lists the individual components of total levelized UCG-based offshore ammonia production costs.
3.4. Sensitivity Analysis
In order to assess uncertainties related to the UCG synthesis gas end-utilisation option costs, we applied a one-at-a-time (OAT) sensitivity analysis. This kind of sensitivity analysis is used to assess the range of possible outcomes imposed by the variation of one model input parameter across a plausible range of uncertainty. Hereby, the focus is on quantifying the influence of single model input parameters on overall costs to, e.g., assess which process step requires optimisation. In the underlying study, we further investigated the impact of different synthesis gas compositions, calorific values and gasification agent compositions for the onshore UCG-CCS/CCU processes. For offshore UCG-CCS/CCU, uncertain model input data such as drilling costs and the maximum achievable gasification channel width in the offshore well design were considered.
3.4.1. Impact of Synthesis Gas Composition, CV and Gasification Agent Compositions on Total Costs
We further investigated the impact of different synthesis gas CVs and related synthesis gas compositions, as the CV determines UCG synthesis gas end-utilisation options in view of its economical suitability for commercialisation. Besides, CV is one of the parameters that can be controlled with little effort as even minor modifications of the model assumptions may induce its increase or decrease by, e.g., the applied gasification agent composition and gasification phases. To analyze related cost variations, we focused on four synthesis gas compositions (cf. Table 17). The chosen compositions were derived from in situ and ex situ UCG tests at the Wieczorek mine and ex situ tests on coals sampled at the Bielszowice mine, where different gasification agent compositions at varying p/T conditions were investigated [7]. In order to maintain a site-specific techno-economic assessment in the sensitivity analysis, we implemented two scenarios with data, directly related to the selected target area (Scenarios I and II). Furthermore, two scenarios representing the results of gasification tests on coals from the Bielszowice mine (Scenarios III and IV) were included into the analysis due to the availability of extensive data. The considered synthesis gas compositions exhibit significant differences in their CO2 content (up to 72%), CV (up to 37%) and UCG-to-synthesis gas conversion efficiency (up to 26%). Thus, the chosen synthesis gas compositions are suitable to quantify the impact of the abovementioned parameters, already previously assumed to exhibit a major impact on the total levelized costs.
Onshore UCG-CCGT-CCS Scenario
The economic assessment of the COE bandwidth for a coupled onshore UCG-CCGT-CCS process taking into account different synthesis gas compositions revealed that Scenario IV represents the worst-case assumptions. Despite a higher synthesis gas CV (5.74 MJ/m3, cf. Table 17) and higher methane content (4.2%, cf. Table 17) compared to the other scenarios, costs for electricity generation (72.5 €/MWh) exceed those calculated for the other four scenarios by 26 to 43%. CCS costs (16.5 €/MWh) are equal to Scenario III, but about 22 to 29% above those determined in the other scenarios. These notable cost increases are mainly attributable to the relatively high CO2 content (23.2% by volume) in the synthesis gas composition given in Scenario IV (cf. Table 17).
To provide the required amount of O2 for the gasification process, the ASU air feed demand in Scenario IV is 68% higher than in Scenario I (ASU not considered in Scenarios II and III) resulting in an increased compression power demand, and thus higher total costs. Maintaining the previously assumed 100 MW net power generation as a basis for comparing the four investigated scenarios, the gross power generation (407 MWth compared to 285 MWth in Scenario I, 372 MWth in Scenario II and 491 MWth in Scenario III) is iteratively adjusted to the energy requirement of all process steps involved, mainly determined by gas compression. Hereby, a higher gross power generation implies increased coal consumption. Apart from Scenario III, with a coal consumption of 18.9 Mt in 20 years, Scenario IV exposes the highest coal demand with 15.7 Mt in 20 years of operation (8.5 Mt in Scenario I and 12.8 Mt in Scenario II). High CO2 and CO ratios in the synthesis gas also reduce the CV, resulting in a decreased UCG-to-synthesis gas conversion efficiency which increases the required amount of synthesis gas. Hence, the UCG-to-synthesis gas conversion efficiency of 62% in Scenario IV, determined by synthesis gas and coal CVs as well as the theoretical synthesis gas-to-coal ratio is lower than that in Scenarios I (84%) and II (70%), and almost identical to that in to Scenario III. Hereby, the theoretical synthesis gas-to-coal ratio is the product of the coal’s carbon content and the carbon component ratio in the synthesis gas. Data on the carbon content from the ultimate analysis and the carbon content in the tars were provided by Otto et. al and Stańczyk et al. [7,9,18,19,20]. For the four investigated scenarios, the synthesis gas composition most suitable for electricity generation is represented by Scenario II (best case) with COE of 41.3 €/MWh (43% below the worst case). CCS costs in this scenario amount to 11.8 €/MWh, and are hence 29% below those in the worst case. The relatively low production costs in the best-case scenario mainly result from disregarding the ASU process, since the gasification agent is pure air (cf. Table 17); although, lower values of synthesis gas CV and CH4 content are considered compared to the worst case. Costs for fuel production (cf. Table 18) referring to Scenario II amount to 6.1 €/GJ and are by 45% lower than in the worst-case scenario (11.1 €/GJ). In summary, the OAT sensitivity analysis reveals that under the given model assumptions and even in case of a low CV and high CO2/CO contents in the synthesis gas, the application of UCG synthesis gas for electricity production is competitive on the Polish energy market.
Onshore UCG-MeOH-CCU Scenario
From an economic point of view, the boundary condition that favours methanol production in the first place is the absence of an ASU, since in the underlying study ASU costs have a share of up to 44% on overall levelized costs (onshore scenarios). Besides, air separation and compression increase the required power demand, and thus gross generation and related costs significantly while the resulting methanol yield remains unchanged (dis-economy of scale). Hereby, economic assessment results on methanol production costs, taking into account different synthesis gas compositions and related CVs show a similar trend as the COE sensitivity analysis results discussed in the previous section. In accordance with high ASU costs, Scenario IV represents the worst case with levelized methanol production costs of 148 €/t MeOH. Despite the high H2 content and synthesis gas CV achieved, methanol production costs are higher by 9 to 23% than in the other scenarios (Scenario I 135 €/t MeOH, Scenario II 114 €/t MeOH and Scenario III 119 €/t MeOH). Among the four investigated synthesis gas compositions, the one most suitable for methanol production is that represented in Scenario II. In this set-up, the synthesis gas components required for methanol synthesis (CO2, H2) and autonomous power supply (CO, CH4, 63% remaining H2 after synthesising methanol) are sufficient to produce the envisaged methanol output, while ASU costs do not occur. Furthermore, the UCG-to-synthesis gas conversion efficiency achieved in Scenario II is higher by 8% than in the worst case. Fuel production costs that occur in the context of methanol production are listed in Table 19.
Taking into account the amount of CO2 that is required for hydrogenation in comparison to the amount of waste CO2, Scenario I represents the best CO2 utilisation ratio (92%, cf. Table 20) among the investigated scenarios. Due to its high CO2 share, the least appropriate synthesis gas composition from an environmental point of view is represented by Scenario III, where waste CO2 sums up to 42.5% (cf. Table 20). Hereby, for all scenarios the required CO2 amount for methanol synthesis adds up to 22.4 kg/s, whereby CO2 remaining in the purge stream sums up to 0.58 kg/s.
In summary, OAT sensitivity analysis results show that for all investigated scenarios, UCG-based methanol production is profitable and can compete on the Polish energy market. Besides, results show that applying gasification agent oxygen ratios above 30% by volume, and thus increasing the CO2 share in the resulting synthesis gas is not favourable from environmental and economic views. Besides, an oxygen ratio above 30% by volume in the gasification agent is likely to significantly increase abrasion effects in pipelines and well tubings due to the resulting higher flow velocities.
Onshore UCG-NH3-CCS Scenario
Comparing OAT sensitivity analysis results on ammonia production economics, levelized costs taking into account the four selected synthesis gas compositions differ by up to 23% (Scenario I 186 €/t NH3, Scenario II 163 €/t NH3, Scenario III 170 €/t NH3 and Scenario IV 210 €/t NH3). Costs for CO2 compression, injection, storage and monitoring amount to 5.4 €/t NH3 in the reference scenario and vary only marginally (1.8%) in view of the different scenarios. By analogy with findings on cost-driving and -saving process steps for electricity and methanol production, cost-effective ammonia production strongly correlates with the absence of an ASU as well as high synthesis gas CVs and raw material supply (H2 and N2). Consequently, the most favourable synthesis gas composition for ammonia production is represented by Scenario II and the worst case by Scenario IV, respectively. Fuel production costs vary from 4.6 €/GJ to 7.7 €/GJ (cf. Table 21) in the different scenarios. Hereby, Scenario IV shows the most and Scenario I the least favourable synthesis gas composition; although, related to total levelized ammonia costs, Scenario IV represents the worst case. This is due to the fact that fuel production in Scenario IV takes advantage of a power generation capacity which is higher by 76 MW, compared to Scenario I with an increased fuel mass flow rate compared to insignificantly higher fuel production costs. On the other hand, the ammonia yield was equated for all scenarios; thus, economies of scale cannot take effect while fuel production, synthesis gas processing and infrastructural costs increase with the higher gross generation. In order to ensure N2 supply for the daily production of 850 t NH3, net generation for Scenarios I and IV was up-scaled to 12 MW and 41 MW, respectively. Since this additional amount of electricity is not required for ammonia production itself, it can be fed into the local power grid. In summary, OAT sensitivity analysis results on ammonia production costs show that compared to the average European ammonia market price, onshore UCG-based ammonia production is competitive within all investigated scenarios.
3.4.2. Variation of Offshore Drilling Costs
For assessment of offshore drilling costs, we assumed a 5- (reference scenarios), 10- and 15-fold (worst case) cost increase, compared to the drilling costs applied in the onshore calculations. Results reveal that increasing costs for offshore drilling up to the 15-fold, compared to the offshore reference scenario induces an almost linear methanol production cost increment by 3.3 €/t MeOH. The related linear increase of ammonia production costs amounts to 1.5 €/t NH3. The cost bandwidths for methanol and ammonia production, resulting from varying drilling costs are that low, since the share of drilling costs on total costs is about 0.8% for methanol and 0.3% for ammonia production. Hereby, the share of offshore drilling costs related to total levelized offshore costs is even up to 1% lower than the respective share of onshore drilling costs on total levelized onshore costs. This results from the radial shape of the offshore well layout, offering a more optimised design than the applied onshore well layout. However, this design optimisation in the offshore scenarios is associated with higher operational and environmental risks related to the technical implementation of the P-CRIP approach, which was yet not as widely applied as the CRIP-based UCG scheme [36].
3.4.3. Different Technically Achievable Gasification Channel Widths (Offshore)
Based on the gasification channel width in the reference scenario (200 m, best case), we further assessed costs taking into account channel widths of 50 m (worst case), 100 m and 150 m (at the outer radius, cf. Figure 7).
In the present study, the model parameter mainly affected by a variation of gasification channel width is the coal yield per gasification channel, also determining the drilling meters. Consequently, drilling costs depend on the number of additional wells to be drilled, when channel width is decreasing to maintain the required daily coal supply.
OAT sensitivity analysis results listed in Table 22 show that varying the gasification channel width by 150 m causes a difference in drilling meters of up to 58% for methanol and to 50% for ammonia production. However, this obviously significant difference in drilling meters induces only an insignificant difference in the total levelized methanol (1.9%) and ammonia (0.4%) production costs due to the low impact of drilling costs on total offshore UCG-based end-product costs.
Figure 8 presents the percentage variation in the worst and best cases for the investigated onshore and offshore UCG-CCS/CCU end-use options, determined within the sensitivity analysis in comparison to the current market prices. In summary, sensitivity analysis results for the onshore scenarios show that UCG synthesis gas-based electricity, methanol and ammonia production can compete on the market even under the given worst-case assumptions. Sensitivity analysis results related to drilling costs and gasification channel widths for the offshore scenarios reveal that UCG-based methanol production is competitive on the market, while ammonia production is not economic.
4. Discussion and Conclusions
Within the present study, we applied an enhanced techno-economic model based on Nakaten et al. [5] to determine levelized costs of integrated onshore UCG-CCS/CCU production chains in the reference scenario related to electricity generation (66 €/MWh), methanol (135 €/t MeOH) and ammonia production (186 €/t NH3). Techno-economic modelling results reveal that the investigated onshore UCG synthesis gas utilisation options can compete on the Polish energy market, even with CCS costs considered. The offshore UCG-CCS/CCU model was applied to determine the levelized costs for methanol (280 €/t MeOH) and ammonia production (384 €/t NH3). Modelling results show that offshore methanol and ammonia production costs are about twice as high as the onshore ones. Hereby, only UCG-based methanol production is economically competitive in view of the current market prices.
OAT sensitivity analyses were applied to investigate the techno-economics in view of model input data quality, model parametrisation and boundary conditions. Hereby, we assessed four synthesis gas compositions, and consequently different synthesis gas CVs (3.6 to 5.8 MJ/sm3) within the scope of four onshore scenarios. The model boundary condition “synthesis gas composition” with its associated CV was selected for further investigation within the sensitivity analysis, since even small changes in process conditions are likely to induce significant changes in the resulting synthesis gas composition and its suitability as UCG end-product. For the proposed offshore UCG well layout, we investigated the impact of varying gasification channels widths and drilling costs within altogether seven offshore scenarios. Hereby, we chose offshore drilling costs and gasification channel widths as objective parameters for the OAT sensitivity analysis, especially due to the lack of data on offshore drilling costs and practical experience related to the assumed maximum achievable gasification channel width.
OAT sensitivity analysis results demonstrate that besides synthesis gas composition and related CV, UCG-CCS/CCU process costs significantly correlate with gasification agent production costs, energy requirements for compression and the availability of required synthesis gas components for methanol and ammonia production. Taking into account all considered synthesis gas compositions with a maximum deviation of 43% for H2, 72% for CO2, 43% for N2 as well as 37% for the CV, cost variations of 23% (methanol and ammonia production) up to 43% (electricity generation) are determined. Hereby, the most favourable synthesis gas composition for power generation (54 €/MWh with CCS), methanol (114 €/t MeOH with CCU) and ammonia (163 €/t NH3 with CCS) production is that in Scenario II. Characteristics that allow for a low-cost production are the absence of an ASU (pure-air gasification), a high CV (4.7 kg/MJ) and a sufficient provision of the required synthesis gas components (H2, N2).
The least favourable synthesis gas composition (Scenario IV) in view of power generation (89 €/MWh with CCS), methanol (148 €/t MeOH with CCU) and ammonia production (210 €/t NH3 with CCS) is characterized by high ASU and compression costs, despite the synthesis gases high CV. Hereby, even for methanol synthesis where CO2 is required for hydrogenation, a carbon dioxide share of 23% associated with the high O2 content in the gasification agent is more than twice the amount required.
Sensitivity analysis results on offshore drilling costs show that due to the small share of drilling costs on the total costs, total levelized methanol and ammonia production costs are only insignificantly affected. Thus, increasing drilling costs by the 10- and 15-fold, compared to the reference (and best-case) scenario causes a linear methanol and ammonia production cost increment by only 3.3 €/t MeOH and by 1.5 €/t NH3. Different gasification channel widths impact the extractable amount of coal per channel, and hence the required number of channels to maintain the daily coal demand and with that the drilling costs. Varying the gasification channel width by 150 m results in a difference in drilling meters of up to 67% (ammonia production). However, due to the negligible impact of drilling costs on total costs, levelized methanol and ammonia production costs differ by 2%, only.
Based on the findings elaborated in the present study, we draw the following conclusions:
- Costs of the investigated onshore UCG-CCS/CCU scenarios in the study area are economically competitive on the European market.
- Boundary conditions supporting cost-effective electricity generation, methanol and ammonia production are characterized by low or absent ASU costs (air-blown gasification) in the first place. Synthesis gas compositions that favour methanol and ammonia production exhibit high CVs as well as adequate shares of H2 and N2. In order to not to exceed the synthesis gas CO2 share, an oxygen-based gasification agent ratio of more than 30% by volume is not favourable.
- Offshore UCG-based methanol and ammonia production costs are about twice as high as the respective onshore costs, whereby only UCG-based methanol production is economically competitive on the EU market.
- Compared to the offshore platform with its technical equipment, drilling costs have an insignificant impact on total levelized costs. Thus, uncertainties in parameters influenced by drilling costs are negligible. A parameter of high uncertainty is the maximum achievable channel width in P-CRIP UCG operations, whereby the technological feasibility has to be further investigated in field trails.
- Impact of boundary conditions and synthesis gas compositions that favour or hamper UCG-based end-product cost-effectiveness in the present study is subject to changes, if the end-product output is not constant in all scenarios and economies of scale can take effect.
Aiming at a better comparability between the different UCG-CCS/CCU end-product costs in the present study, total levelized costs were determined separately from each other. However, future investigations will aim at the integration of different production chains into a single one to quantify cost savings resulting from the integration of similar processes steps (e.g., H2/CO2 separation), shared infrastructure (e.g., compression, piping systems) as well as the utilisation of waste heat for heat exchangers or additional electricity supply. Besides, future research activities will focus on the implementation of an economic footprint assessment, considering amongst other aspects, costs taking into account potential environmental impacts of UCG-CCS/CCU.
Acknowledgments
The authors gratefully acknowledge the funding received for the EU-FP7 TOPS project (grant 608517) by the European Commission (EC). We thank all TOPS project partners for many fruitful discussions. Special thanks go to our colleagues Krzysztof Kapusta who contributed with knowledge on coal-related data for the study area as well as Dorota Burchart-Korol (Główny Instytut Górnictwa, Katowice, Poland) who contributed Polish onshore drilling data. We further would like to thank Robert Schmidt who was involved in the ammonia synthesis model development. Furthermore, we are grateful for the constructive comments provided by the two anonymous reviewers.
Author Contributions
N.N. and T.K. conceived and designed research; N.N. performed research; N.N. and T.K. analysed the data; N.N. and T.K. wrote the paper.
Conflicts of Interest
The authors declare no conflict of interest.
Abbreviations
The following abbreviations are used in this manuscript:
| ASU | Air Separation Unit |
| CAPEX | Capital Expenditure |
| CCGT | Combined Cycle Gas Turbine |
| CCS | Carbon Capture and Storage |
| CCU | Carbon Capture and Utilisation |
| COE | Costs of Electricity |
| CRIP | Controlled Retraction Injection Point |
| EOS | Equation of State |
| IECM | Integrated Environmental Control Model |
| OAT | One-at-a-Time |
| OFFS | Offshore |
| ONS | Onshore |
| OPEX | Operational Expenditure |
| P-CRIP | Parallel Controlled Retracting Injection Point |
| UCG | Underground Coal Gasification |
References
- Hewing, G.; Hewel-Bundermann, H.; Krabiell, K.; Witte, P. Post-1987 Research and Development Studies of Underground Coal Gasification; Technical Report; Research Association for Second-Generation Coal Extraction: Essen, Germany, 1988. (In German) [Google Scholar]
- Klimenko, A. Early Ideas in Underground Coal Gasification and Their Evolution. Energies 2009, 2, 456–476. [Google Scholar] [CrossRef]
- Prabu, V.; Jayanti, S. Simulation of cavity formation in underground coal gasification using bore hole combustion experiments. Energy 2011, 36, 5854–5864. [Google Scholar] [CrossRef]
- Prabu, V.; Jayanti, S. Integration of underground coal gasification with a solid oxide fuel cell system for clean coal utilisation. Hydrog. Energy 2012, 37, 1677–1688. [Google Scholar] [CrossRef]
- Nakaten, N.C.; Schlüter, R.; Azzam, R.; Kempka, T. Development of a techno-economic model for dynamic calculation of COE, energy demand and CO2 emissions of an integrated UCG-CCS process. Energy 2014, 66, 779–790. [Google Scholar] [CrossRef]
- Kapusta, K.; Stańczyk, K. Pollution of water during underground coal gasification of hard coal and lignite. Fuel 2011, 90, 1927–1934. [Google Scholar] [CrossRef]
- Stańczyk, K.; Howaniec, N.; Smolinski, A.; Swiadrowski, J.; Kapusta, K.; Wiatowski, M.; Grabowski, J.; Rogut, J. Gasification of lignite and hard coal with air and oxygen enriched air in a pilot scale ex-situ reactor for underground gasification. Fuel 2011, 90, 1953–1962. [Google Scholar] [CrossRef]
- Kapusta, K.; Stańczyk, K.; Wiatowski, M.; Chećko, J. Environmental aspects of a field-scale underground coal gasification trial in a shallow coal seam at the Experimental Mine Barbara in Poland. Fuel 2013, 113, 196–208. [Google Scholar] [CrossRef]
- Stańczyk, K. Experience of Central Mining Institute in Underground Coal Gasification–Research and Pilot Test in “KWK Wieczorek” Mine, World Clean Coal Conference, Turkey, 2015. Available online: http://www.fossilfuel.co.za (accessed on 26 September 2017).
- Kinaev, N.; Belov, A.; Bongers, G.; Grebenyuk, I.; Vinichenko, I. Integrated assessment of feasibility of coal-to-chemical projects. In Proceedings of the 8th International Freiberg Conference on IGCC & XtL Technologies: Innovative Coal Value Chains, Cologne, Germany, 12–16 June 2016. [Google Scholar]
- Mocek, P.; Zamiar, R.; Jachimczyk, R.; Gowarzewski, R.; Świadrowski, J.; Gil, I.; Stańczyk, K. Selected issues of operating 3 MW underground coal gasification installation. Maint. Reliab. 2015, 17, 427–434. [Google Scholar] [CrossRef]
- EURACOAL. Mineable Coal and Lignite Reserves Poland 2016. Available online: http://euracoal2.org (accessed on 9 December 2016).
- Czaplicka-Kolarz, K.; Krawczyk, P.; Ludwik-Pardala, M.; Burchart-Korol, D. Cost-effectiveness of underground coal gasification by the shaft method. Przem. Chem. 2015, 94, 1708–1713. (In Polish) [Google Scholar] [CrossRef]
- Burchart-Korol, D.; Korol, J.; Czaplicka-Kolarz, K. Life cycle assessment of heat production from underground coal gasification. Int. J. Life Cycle Assess. 2016, 21, 1391–1403. [Google Scholar] [CrossRef]
- EC. Energy Roadmap 2050. Technical Report. European Commission: Brussels, 2011. Available online: http://eur-lex.europa.eu (accessed on 15 February 2017).
- Pérez-Fortes, M.; Schöneberger, J.C.; Boulamanti, A.; Tzimas, E. Methanol synthesis using captured CO2 as raw material: Techno-economic and environmental assessment. Appl. Energy 2016, 161, 718–732. [Google Scholar] [CrossRef]
- European Commission. Large Volume Inorganic Chemicals-Solids and Others. European Commission, August 2007. Available online: http://eippcb.jrc.ec.europa.eu/ (accessed on 17 October 2017).
- Otto, C.; Kempka, T.; Kapusta, K.; Stańczyk, K. Fault Reactivation Can Generate Hydraulic Short Circuits in Underground Coal Gasification-New Insights from Regional-Scale Thermo-Mechanical 3D Modeling. Minerals 2016, 6, 101. [Google Scholar] [CrossRef]
- Otto, C.; Kempka, T. Thermo-mechanical Simulations Confirm: Temperature-dependent Mudrock Properties are Nice to have in Far-field Environmental Assessments of Underground Coal Gasification. Energy Procedia 2015, 76, 582–591. [Google Scholar] [CrossRef]
- Otto, C.; Kempka, T. Thermo-Mechanical Simulations of Rock Behavior in Underground Coal Gasification Show Negligible Impact of Temperature-Dependent Parameters on Permeability Changes. Energies 2015, 8, 5800–5827. [Google Scholar] [CrossRef]
- DWSIM. Open-Source CAPE-OPEN Compliant Chemical Process Simulator. Available online: http://dwsim.inforside.com.br (accessed on 12 December 2016).
- ChemSep. Modeling Separation Processes, Databases. Available online: http://www.chemsep.org (accessed on 12 December 2016).
- Godbolt, B. Scientific Drilling UCG Training School, Directional Drilling in Coal, 2011. Available online: http://repository.icse.utah.edu (accessed on 12 December 2016).
- Kempka, T.; Fernandez-Steeger, T.; Li, D.; Schulten, M.; Schlẗer, R.; Krooss, B. Carbon dioxide sorption capacities of coal gasification residues. Environ. Sci. Technol. 2011, 45, 1719–1723. [Google Scholar] [CrossRef] [PubMed]
- Najafi, M.; Jalali, S.M.E.; KhaloKakaie, R. Thermal-Mechanical Numerical Analysis of Stress Distribution in the vicinity of Underground Coal Gasification (UCG) Panels. Int. J. Coal Geol. 2014, 134–135, 1–16. [Google Scholar] [CrossRef]
- Świadrowski, J.; Mocek, P.; Jedrysik, E.; Stańczyk, K.; Krzemień, J.; Krawczyk, P.; Chećko, J. Demonstration facility for underground coal gasification. CHEMIK 2015, 69, 815–826. [Google Scholar]
- KOPEX. The Draft Technical Installations PZW on KWK Wieczorek; Project Report; KOPEX Construction Company Szybów SA, 2012; unpublished. [Google Scholar]
- Acheick, A.M.; Batto, S.F.; Changmoon, Y.; Chien, S.C.; Choe, J.I.; Cole, K.R.; Engel, K.; Grander, W.; Gilbert, S.N.; Hui, Y.; et al. Viability of Underground Coal Gasification with Carbon Capture and Storage in Indiana; Technical Report; Indiana University-Bloomington School of Public and Environmental Affairs, 2011. Available online: http://www.indiana.edu (accessed on 20 January 2017).
- Integrated Environmental Control Model (IECM). A Tool for Calculating the Performance, Emissions, and Cost of a Fossil-Fueled Power Plant (Version 8.0.1 Beta). Available online: http://www.iecm-online.com (accessed on 12 December 2016).
- Cardenas Barranon, D.C. Methanol and Hydrogen Production. Master’s Thesis, 2006. Available online: http://ltu.diva-portal.org (accessed on 18 September 2017).
- Hillebrand, B. Stromerzeugungskosten neu zu Errichtender Konventioneller Kraftwerke; Technical Report; RWI-Papiere Nr. 47; Rheinisch-Westfälisches Institut für Wirtschaftsforschung: Essen, Germany, 1997. (In German) [Google Scholar]
- Schneider, L. Stromgestehungskosten von Großkraftwerken. Technical Report, Öko-Institut e.V.. 1998. Available online: http://www.oeko.de (accessed on 12 December 2016). (In German).
- Chen, K.D.; Yu, L. Experimental study on long-tunnel large-section two-stage underground coal gasification. Min. Sci. Technol. 1996, 125, 313–316. [Google Scholar]
- Creedy, D.P.; Garner, K. Clean Energy from Underground Coal Gasification in China; Technical Report; COAL R250 DTI/Pub URN 03/1611; Department of Trade and Industry: London, UK, 2004.
- Couch, G.R. Underground Coal Gasification; Technical Report; CCC/151 IEA Clean Coal Centre: London, UK, 2009. [Google Scholar]
- Nakaten, N.; Kempka, T. Radial-symmetric well design to optimize coal yield and maintain required safety pillar width in oshore underground coal gasification. Energy Procedia 2017, 125, 27–33. [Google Scholar] [CrossRef]
- Gräbner, M.; Morstein, O.; Rappold, D.; Gunster, W.; Beysel, G.; Meyer, B. Constructability study on a German reference IGCC power plant with and without CO2 capture for hard coal and lignite. Energy Convers. Manag. 2010, 51, 2179–2187. [Google Scholar] [CrossRef]
- Zero Emissions Platform (ZEP). The Costs of CO2 Capture; Technical Report; 2011; Available online: http://www.zeroemissionsplatform.eu (accessed on 12 December 2016).
- Mohammed, I.Y.; Samah, M.; Mohamed, A.; Sabina, G. Comparison of SelexolTM and Rectisol Technologies in an Integrated Gasification Combined Cycle (IGCC) Plant for Clean Energy Production. IJER 2014, 3, 742–744. [Google Scholar] [CrossRef]
- Boeing, N. Bohrende Fragen. Technology Review. Magazin für Innovation 2010. Available online: https://www.heise.de (accessed on 12 December 2016). (In German).
- Hammond, G.P.; Ondo Akwe, S.S.; Williams, S. Techno-economic appraisal of fossil-fuelled power generation systems with carbon dioxide capture and storage. Energy 2011, 36, 975–984. [Google Scholar] [CrossRef] [Green Version]
- Li, H.; Ditaranto, M.; Berstad, D. Technologies for increasing CO2 concentration in exhaust gas from natural gas-fired power production with post-combustion, amine-based CO2 capture. Energy 2011, 36, 1124–1133. [Google Scholar] [CrossRef]
- Ausfelder, F.; Bazzanella, A. Diskussionspapier Verwertung und Speicherung von CO2. Technical Report, DECHEMA e.V.. 2008. Available online: https://dechema.de (accessed on 12 December 2016). (In German).
- Katofsky, R.E. The Production of Fluid Fuels from Biomass. Technical Report, Princeton. 1993. Available online: http://acee.princeton.edu (accessed on 18 September 2017).
- Komiyama, H.; Mitsumori, T.; Yamaji, K.; Yamada, K. Assessment of energy systems by using biomass plantation. Fuel 2001, 80, 707–715. [Google Scholar] [CrossRef]
- Burton, E.; Friedmann, J.; Upadhye, R. Best Practices in Underground Coal Gasification. Technical Report, Contract No. W-7405-Eng-48. Lawrence Livermore National Laboratory, 2006. Available online: http://www.purdue.edu (accessed on 6 January 2014).
- Gruson, J.F.; Serbutoviez, S.; Delprat-Jannaud, F.; Akhurst, M.; Nielsen, C.; Dalhoff, F.; Bergmo, P.; Bos, C.; Volpi, V.; Iacobellis, S. Techno-Economic Assessment of Four CO2 Storage Sites. Oil Gas Sci. Technol. Rev. IFP Energies Nouvelles 2015, 70, 753–766. [Google Scholar] [CrossRef]
- Kunkes, E.; Behrens, M. Methanol Chemistry. In Chemical Energy Storage; R. Schlögl de Gruyter: Berlin, Germany, 2013; Available online: http://pubman.mpdl.mpg.de (accessed on 20 September 2017).
- Moffat, A.S. Methanol-powered. Science 1991, 251, 515. [Google Scholar]
- Olah, G.A.; Goeppert, A.; Prakash, G.K.S. Beyond Oil and Gas: The Methanol Economy. Angew. Chem. 2006, 44, 2636–2639. [Google Scholar] [CrossRef] [PubMed]
- Van-Dal, E.; Bouallou, C. CO2 abatement through a methanol production process. Chem. Eng. Trans. 2012, 29, 463–468. [Google Scholar] [CrossRef]
- CHEMCAD. Version 6 User Guide. Manual Chemstations, Inc., 2007. Available online: http://www.chemstations.com (accessed on 28 September 2017).
- Villesca, J.; Bala, V.; Garcia, A. Reactor Project: Ammonia Synthesis. Technical Report, Ceng 403 Project 1 Report. 1997. Available online: http://www.owlnet.rice.edu (accessed on 20 September 2017).
- Penkuhn, M.; Tsatsaronis, G. Comparison of different ammonia synthesis loop configurations with the aid of advanced exergy analysis. In Proceedings of the 29th International Conference on Efficiency, Cost, Optimization, Simulation and Environmental Impact of Energy Systems, Portoroz, Slovenia, 19–23 June 2016; Available online: http://www.owlnet.rice.edu (accessed on 20 September 2017).
- Nakaten, N.C.; Islam, R.; Kempka, T. Underground Coal Gasification with Extended CO2 Utilisation—An Economic and Carbon Neutral Approach to Tackle Energy and Fertilizer Supply Shortages in Bangladesh. Energy Procedia 2014, 63, 8036–8043. [Google Scholar] [CrossRef]
- Ernst&Young. Wplyw Energetyki Wiatrowej na Wzrost Gospodarczy w Polsce. Technical Report, 2012. Available online: http://domrel.pl (accessed on 12 December 2016). (In Polish).
- Zaporowski, B. Koszty Wytwarzania Energii Elektrycznej dla Perspektywicznych Technologii WytwóRczych Polskiej Elektroenergetyki. Polityka Energetyczna, 2012. Available online: https://www.min-pan.krakow.pl (accessed on 12 December 2016). (In Polish).
- CSOP. The Economy of Fuel and Energy in 2013 and 2014. Technical Report; Central Statistical Office of Poland, 2015. Available online: http://stat.gov.pl/ (accessed on 12 December 2016).
- ERO. Information of the President of the Energy Regulatory Office No. 3/2015, 2015. Available online: https://www.kpmg.com (accessed on 29 February 2014).
- ERO. Information of President of Energy Regulatory Office No. 46/2015, 2015. Available online: https://www.ure.gov.pl (accessed on 4 November 2016).
- Methanex. The Power of Agility, 2017. Available online: https://www.methanex.com (accessed on 20 September 2017).
- Bartels, J.R. A Feasibility Study of Implementing an Ammonia Economy. Master’s Thesis, Iowa State University, Ames, IA, USA, 2008. Available online: http://lib.dr.iastate.edu (accessed on 20 September 2017).
- AMIS. Fertilizer Outlook. Market Monitor, 2017. Available online: http://www.fao.org (accessed on 20 September 2017).
Figure 1.
Supply chains for different Underground Coal Gasification (UCG) end-use options analysed within the present study (electricity generation, hydrogen production and its utilisation for methanol and ammonia synthesis), modified according to Kinaev et al. [10].
Figure 1.
Supply chains for different Underground Coal Gasification (UCG) end-use options analysed within the present study (electricity generation, hydrogen production and its utilisation for methanol and ammonia synthesis), modified according to Kinaev et al. [10].
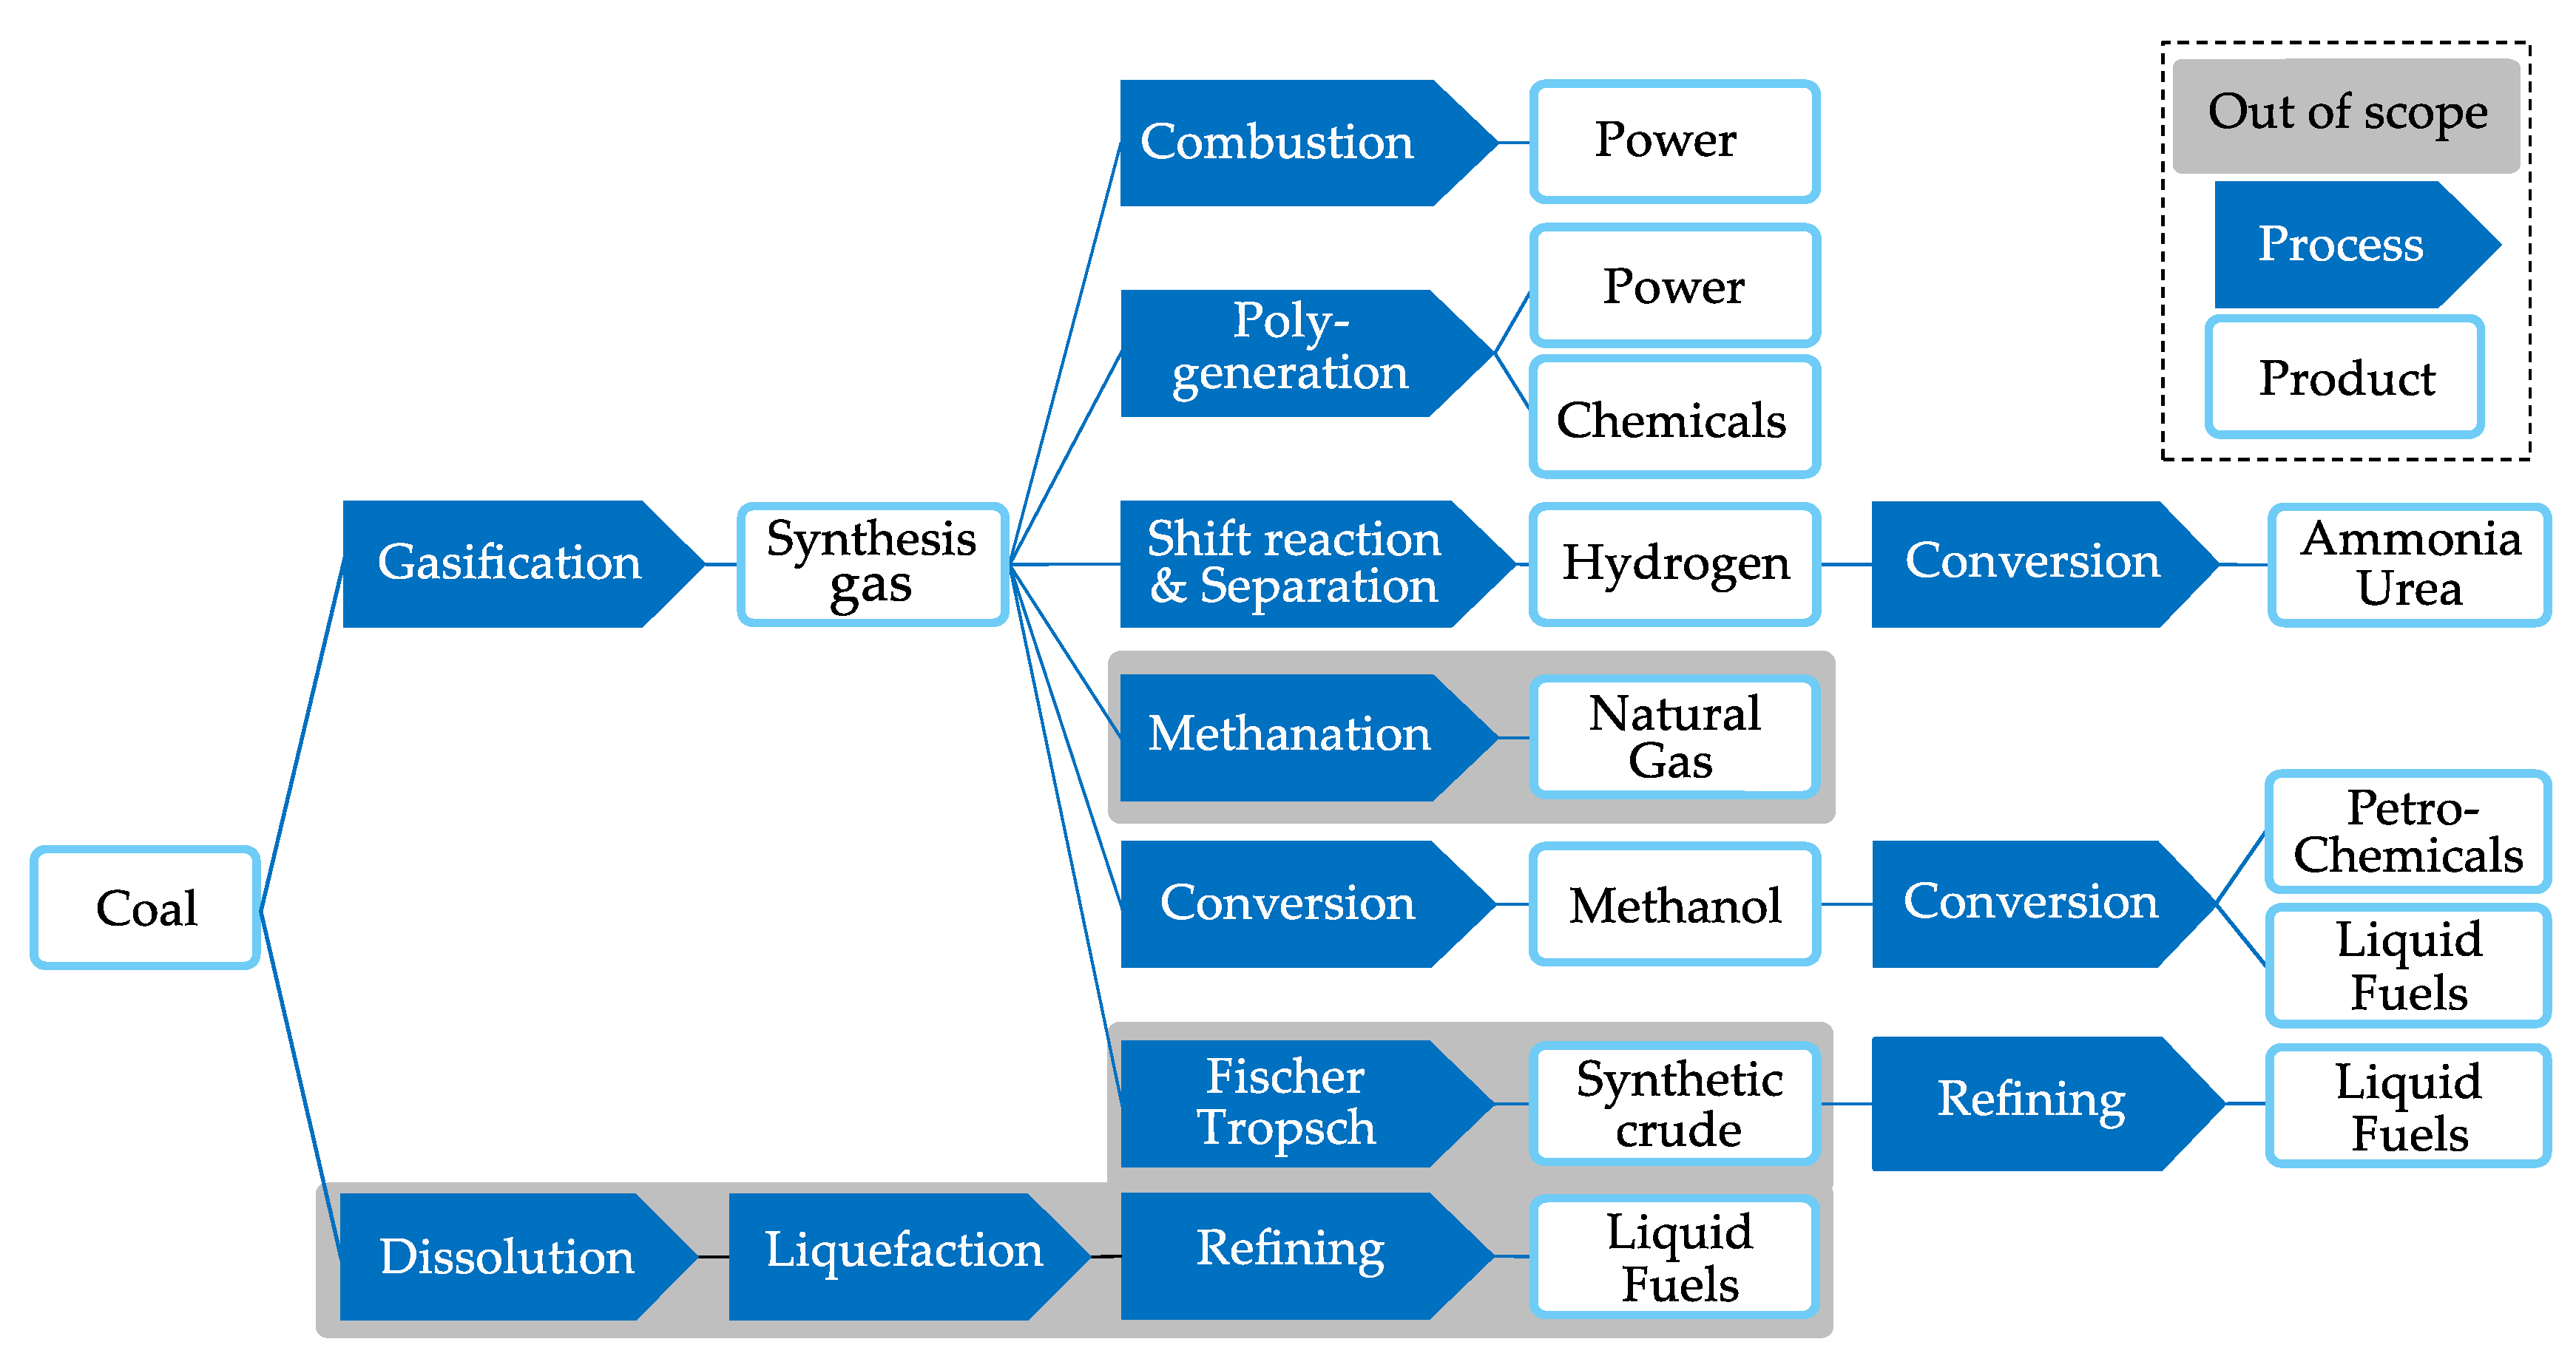
Figure 2.
Location of the selected study area (Wiezcorek coal mine) in Poland. Modified according to European Association for Coal and Lignite [12].
Figure 2.
Location of the selected study area (Wiezcorek coal mine) in Poland. Modified according to European Association for Coal and Lignite [12].

Figure 3.
Techno-economic model for cost determination of coupled Underground Coal Gasification (UCG), Carbon Capture and Storage (CCS)/Carbon Capture and Utilisation (CCU) scenarios based on Nakaten et al. [5], extended to fulfil the requirements of the present study.
Figure 3.
Techno-economic model for cost determination of coupled Underground Coal Gasification (UCG), Carbon Capture and Storage (CCS)/Carbon Capture and Utilisation (CCU) scenarios based on Nakaten et al. [5], extended to fulfil the requirements of the present study.

Figure 4.
Computer-Aided Design (CAD) model visualizing (a) 3D perspective and (b) plan view of the onshore well design for one UCG panel with 13 reactor channels and 260 production wells, utilised as basis for drilling cost assessment.
Figure 4.
Computer-Aided Design (CAD) model visualizing (a) 3D perspective and (b) plan view of the onshore well design for one UCG panel with 13 reactor channels and 260 production wells, utilised as basis for drilling cost assessment.

Figure 5.
Integration of techno-economic model with thermodynamic process simulations by means of the DWSIM process simulator [21], considering air compression, oxidizer compression and injection, synthesis gas production as well as CO2 compression and injection.
Figure 5.
Integration of techno-economic model with thermodynamic process simulations by means of the DWSIM process simulator [21], considering air compression, oxidizer compression and injection, synthesis gas production as well as CO2 compression and injection.
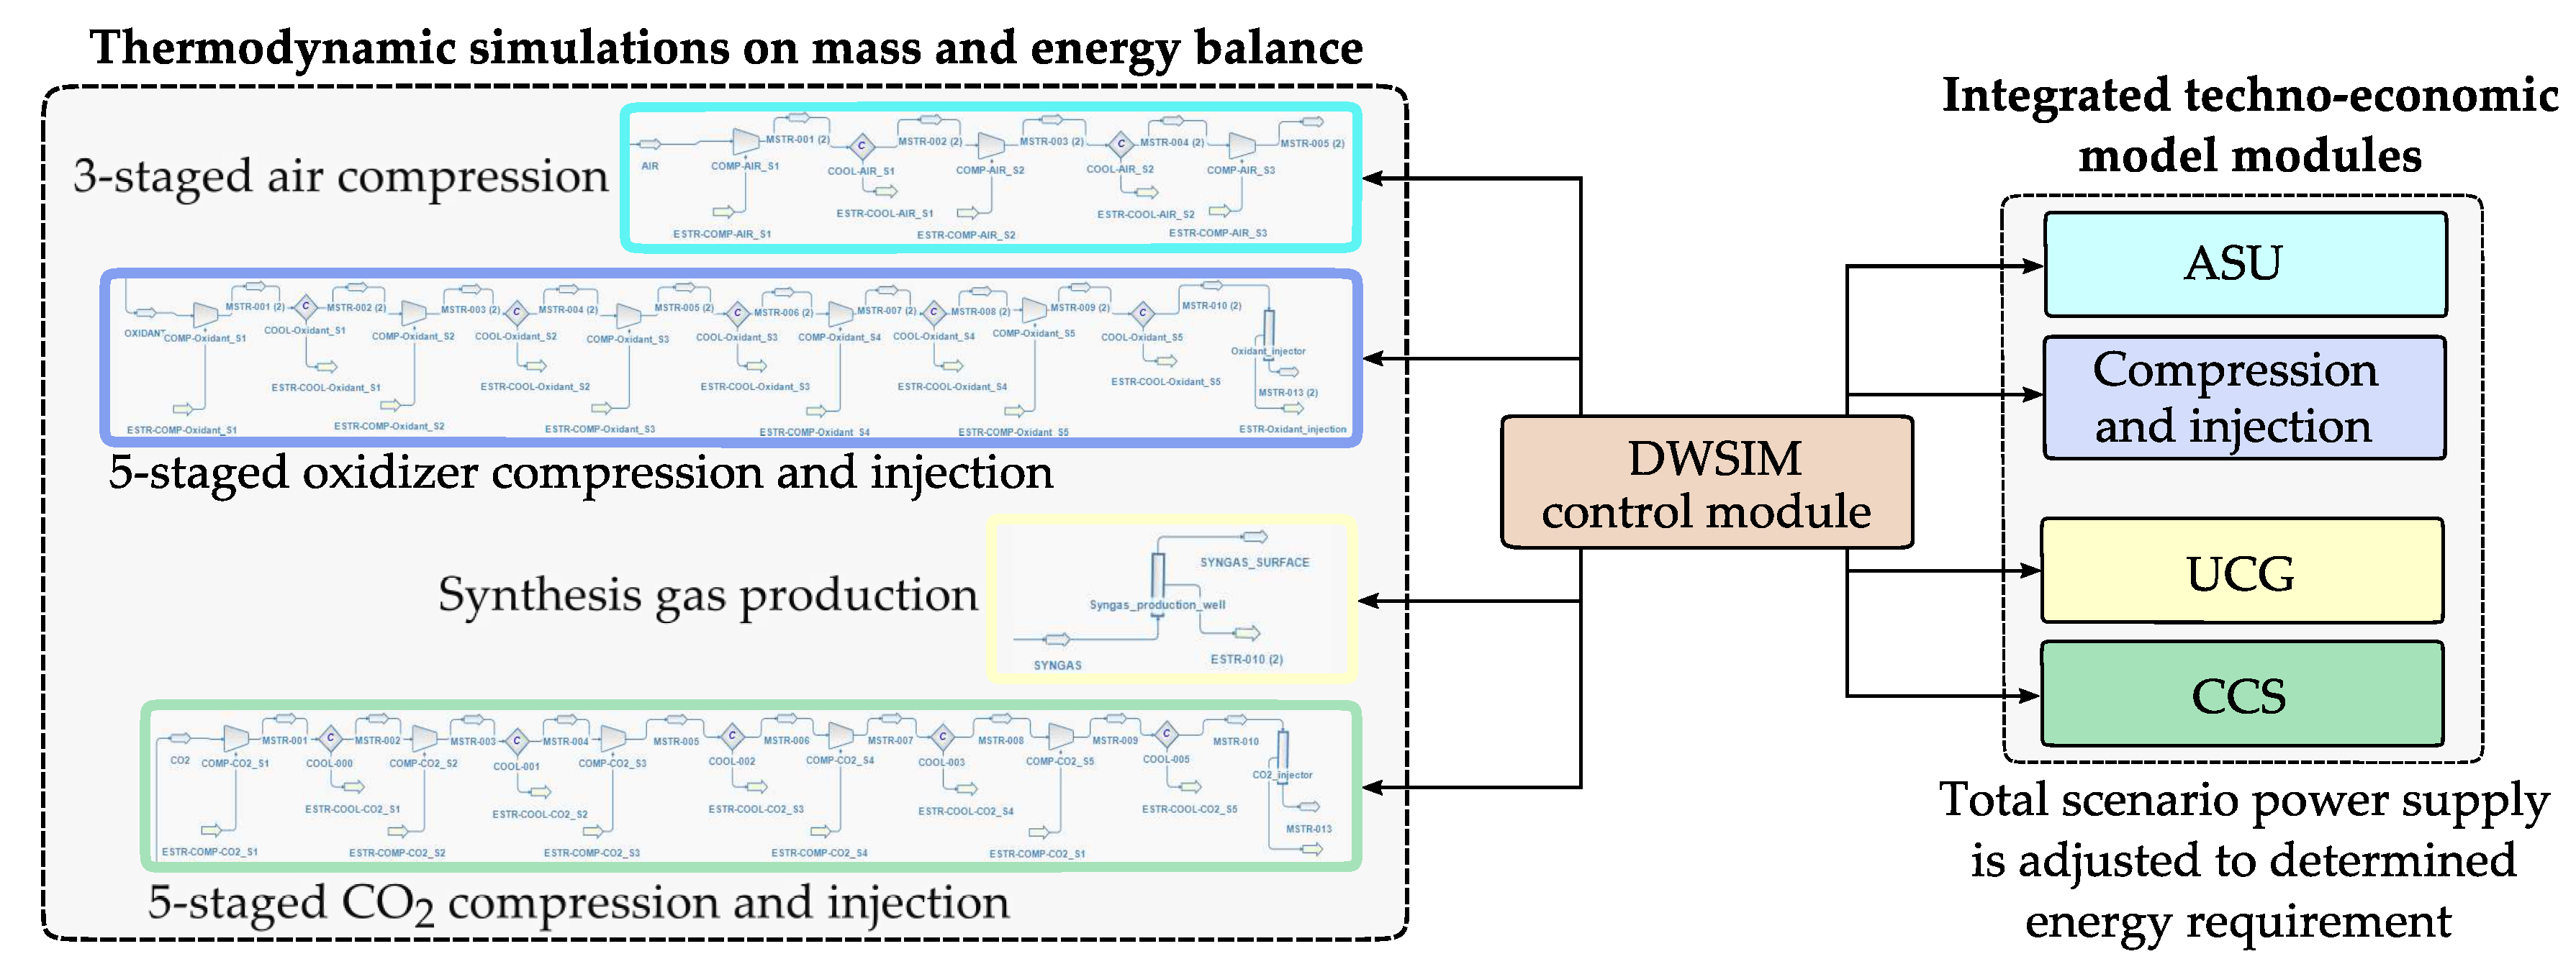
Figure 6.
Computer-Aided Design (CAD) model visualizing the proposed Parallel Controlled Retracting Injection Point (P-CRIP) offshore Underground Coal Gasification (UCG) well design with twelve “long” and 13 “short” channel systems. Figure copyright [36] (modified), licensed under CC BY-NC-ND 4.0.
Figure 6.
Computer-Aided Design (CAD) model visualizing the proposed Parallel Controlled Retracting Injection Point (P-CRIP) offshore Underground Coal Gasification (UCG) well design with twelve “long” and 13 “short” channel systems. Figure copyright [36] (modified), licensed under CC BY-NC-ND 4.0.
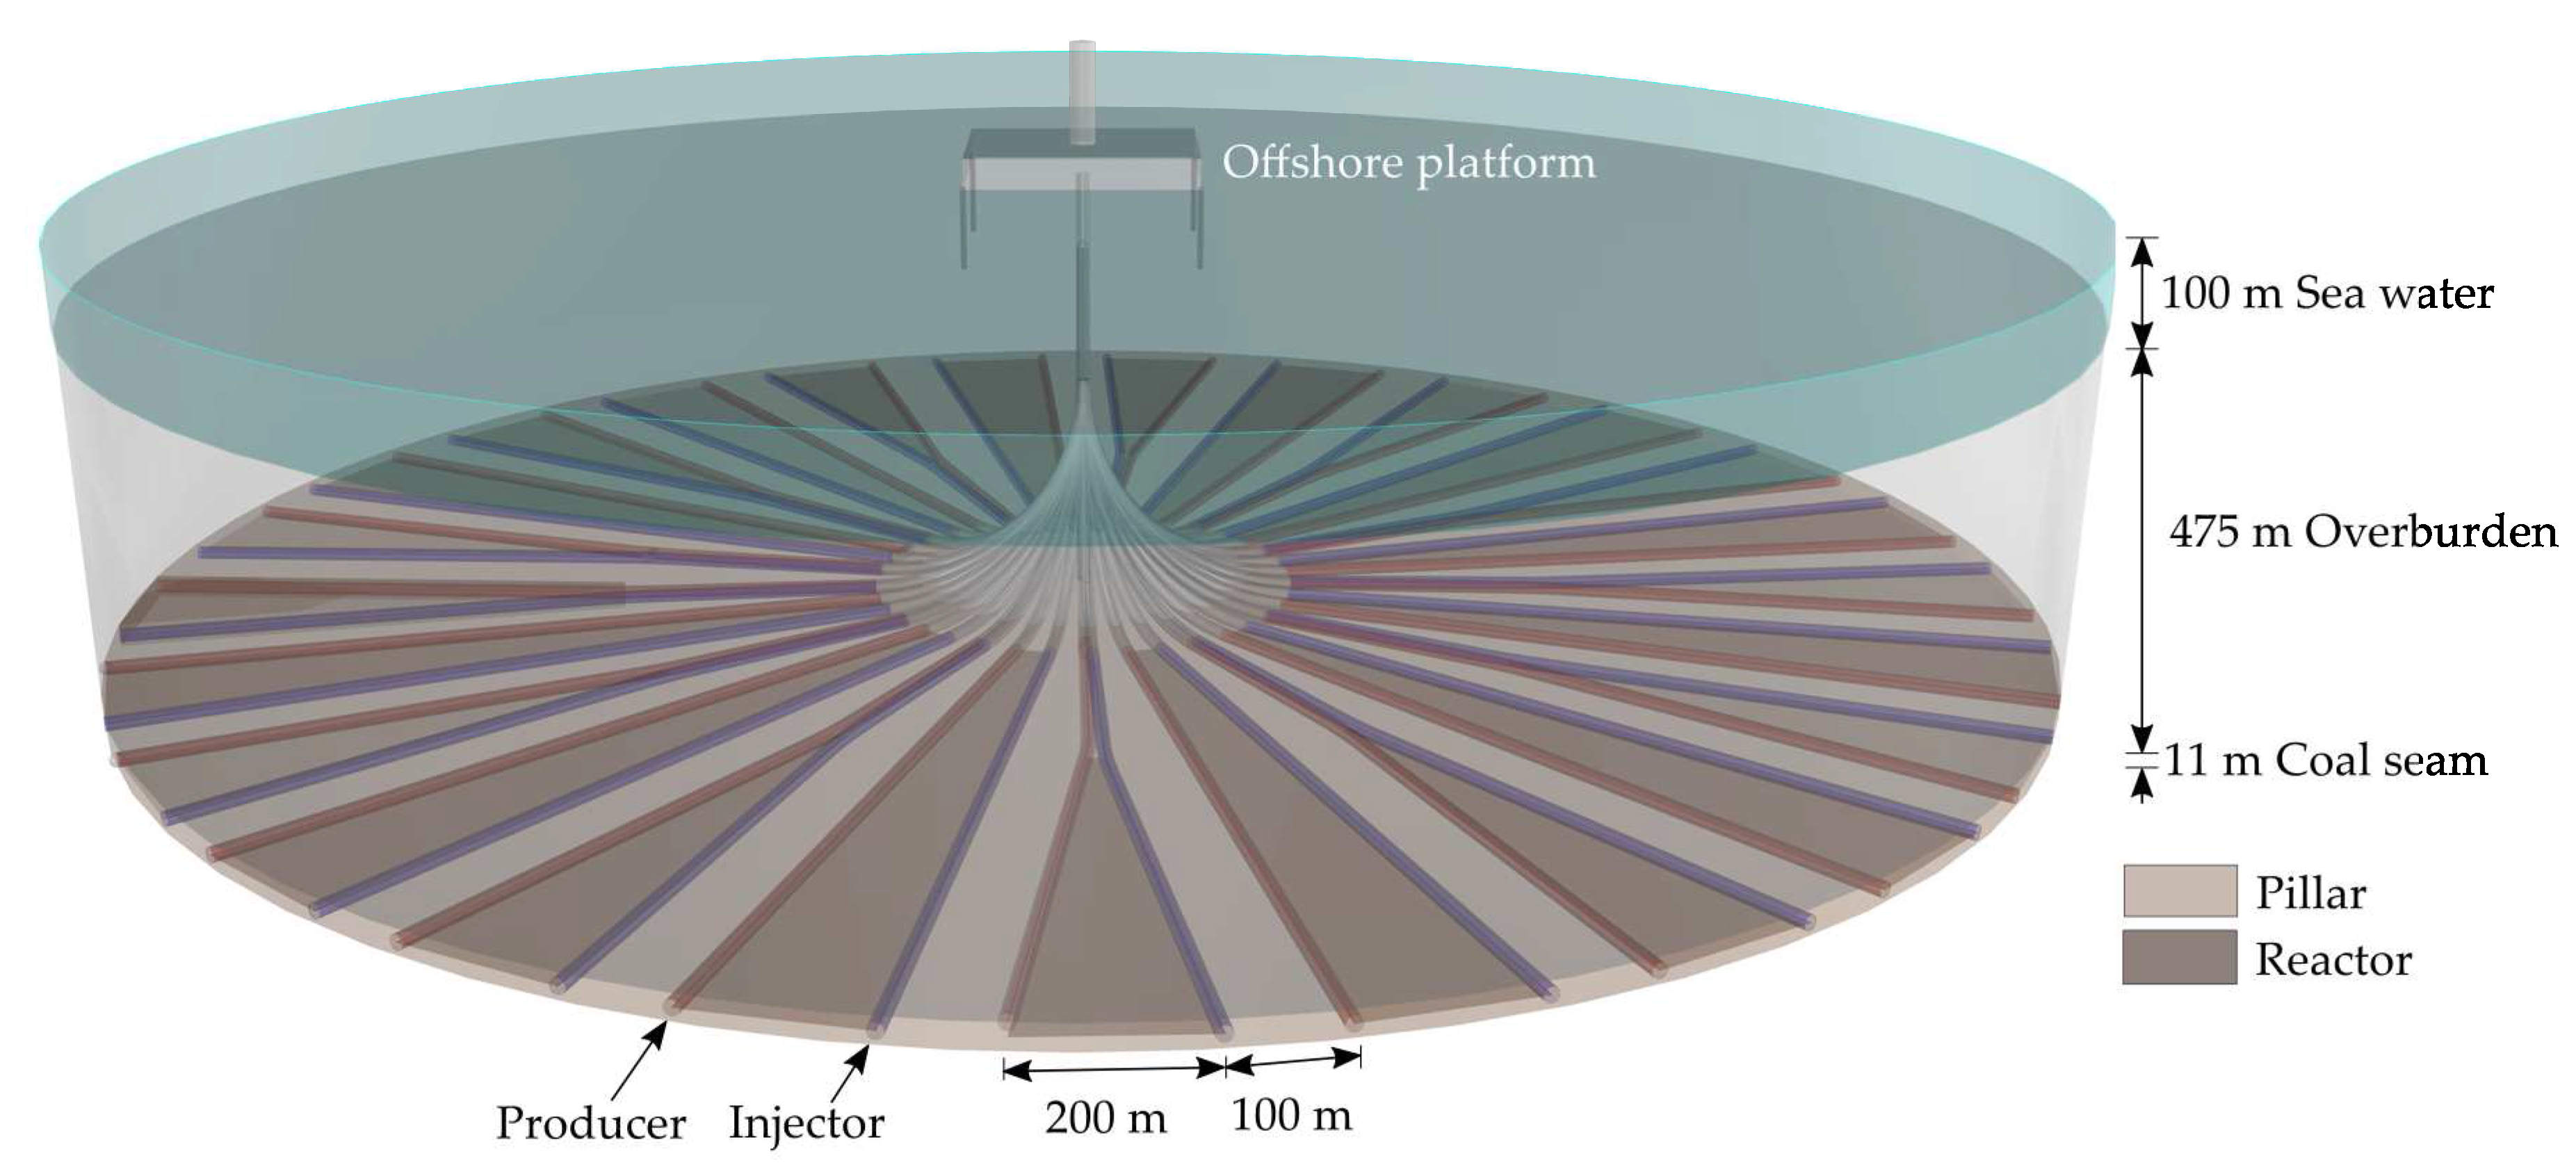
Figure 7.
Gasification channel design for different channel widths (50 m to 200 m).

Figure 8.
Percentage variation of the calculated best- and worst-case costs in the onshore (UCG-based electricity generation “ONS-UCG-CCGT-CCS”, methanol “ONS-UCG-MeOH-CCU”, ammonia production “ONS-UCG-NH3-CCS” and offshore scenarios (UCG-based methanol “OFFS-UCG-MeOH-CCU” and ammonia “OFFS-UCG-NH3-CCS” production), compared to the current market prices.


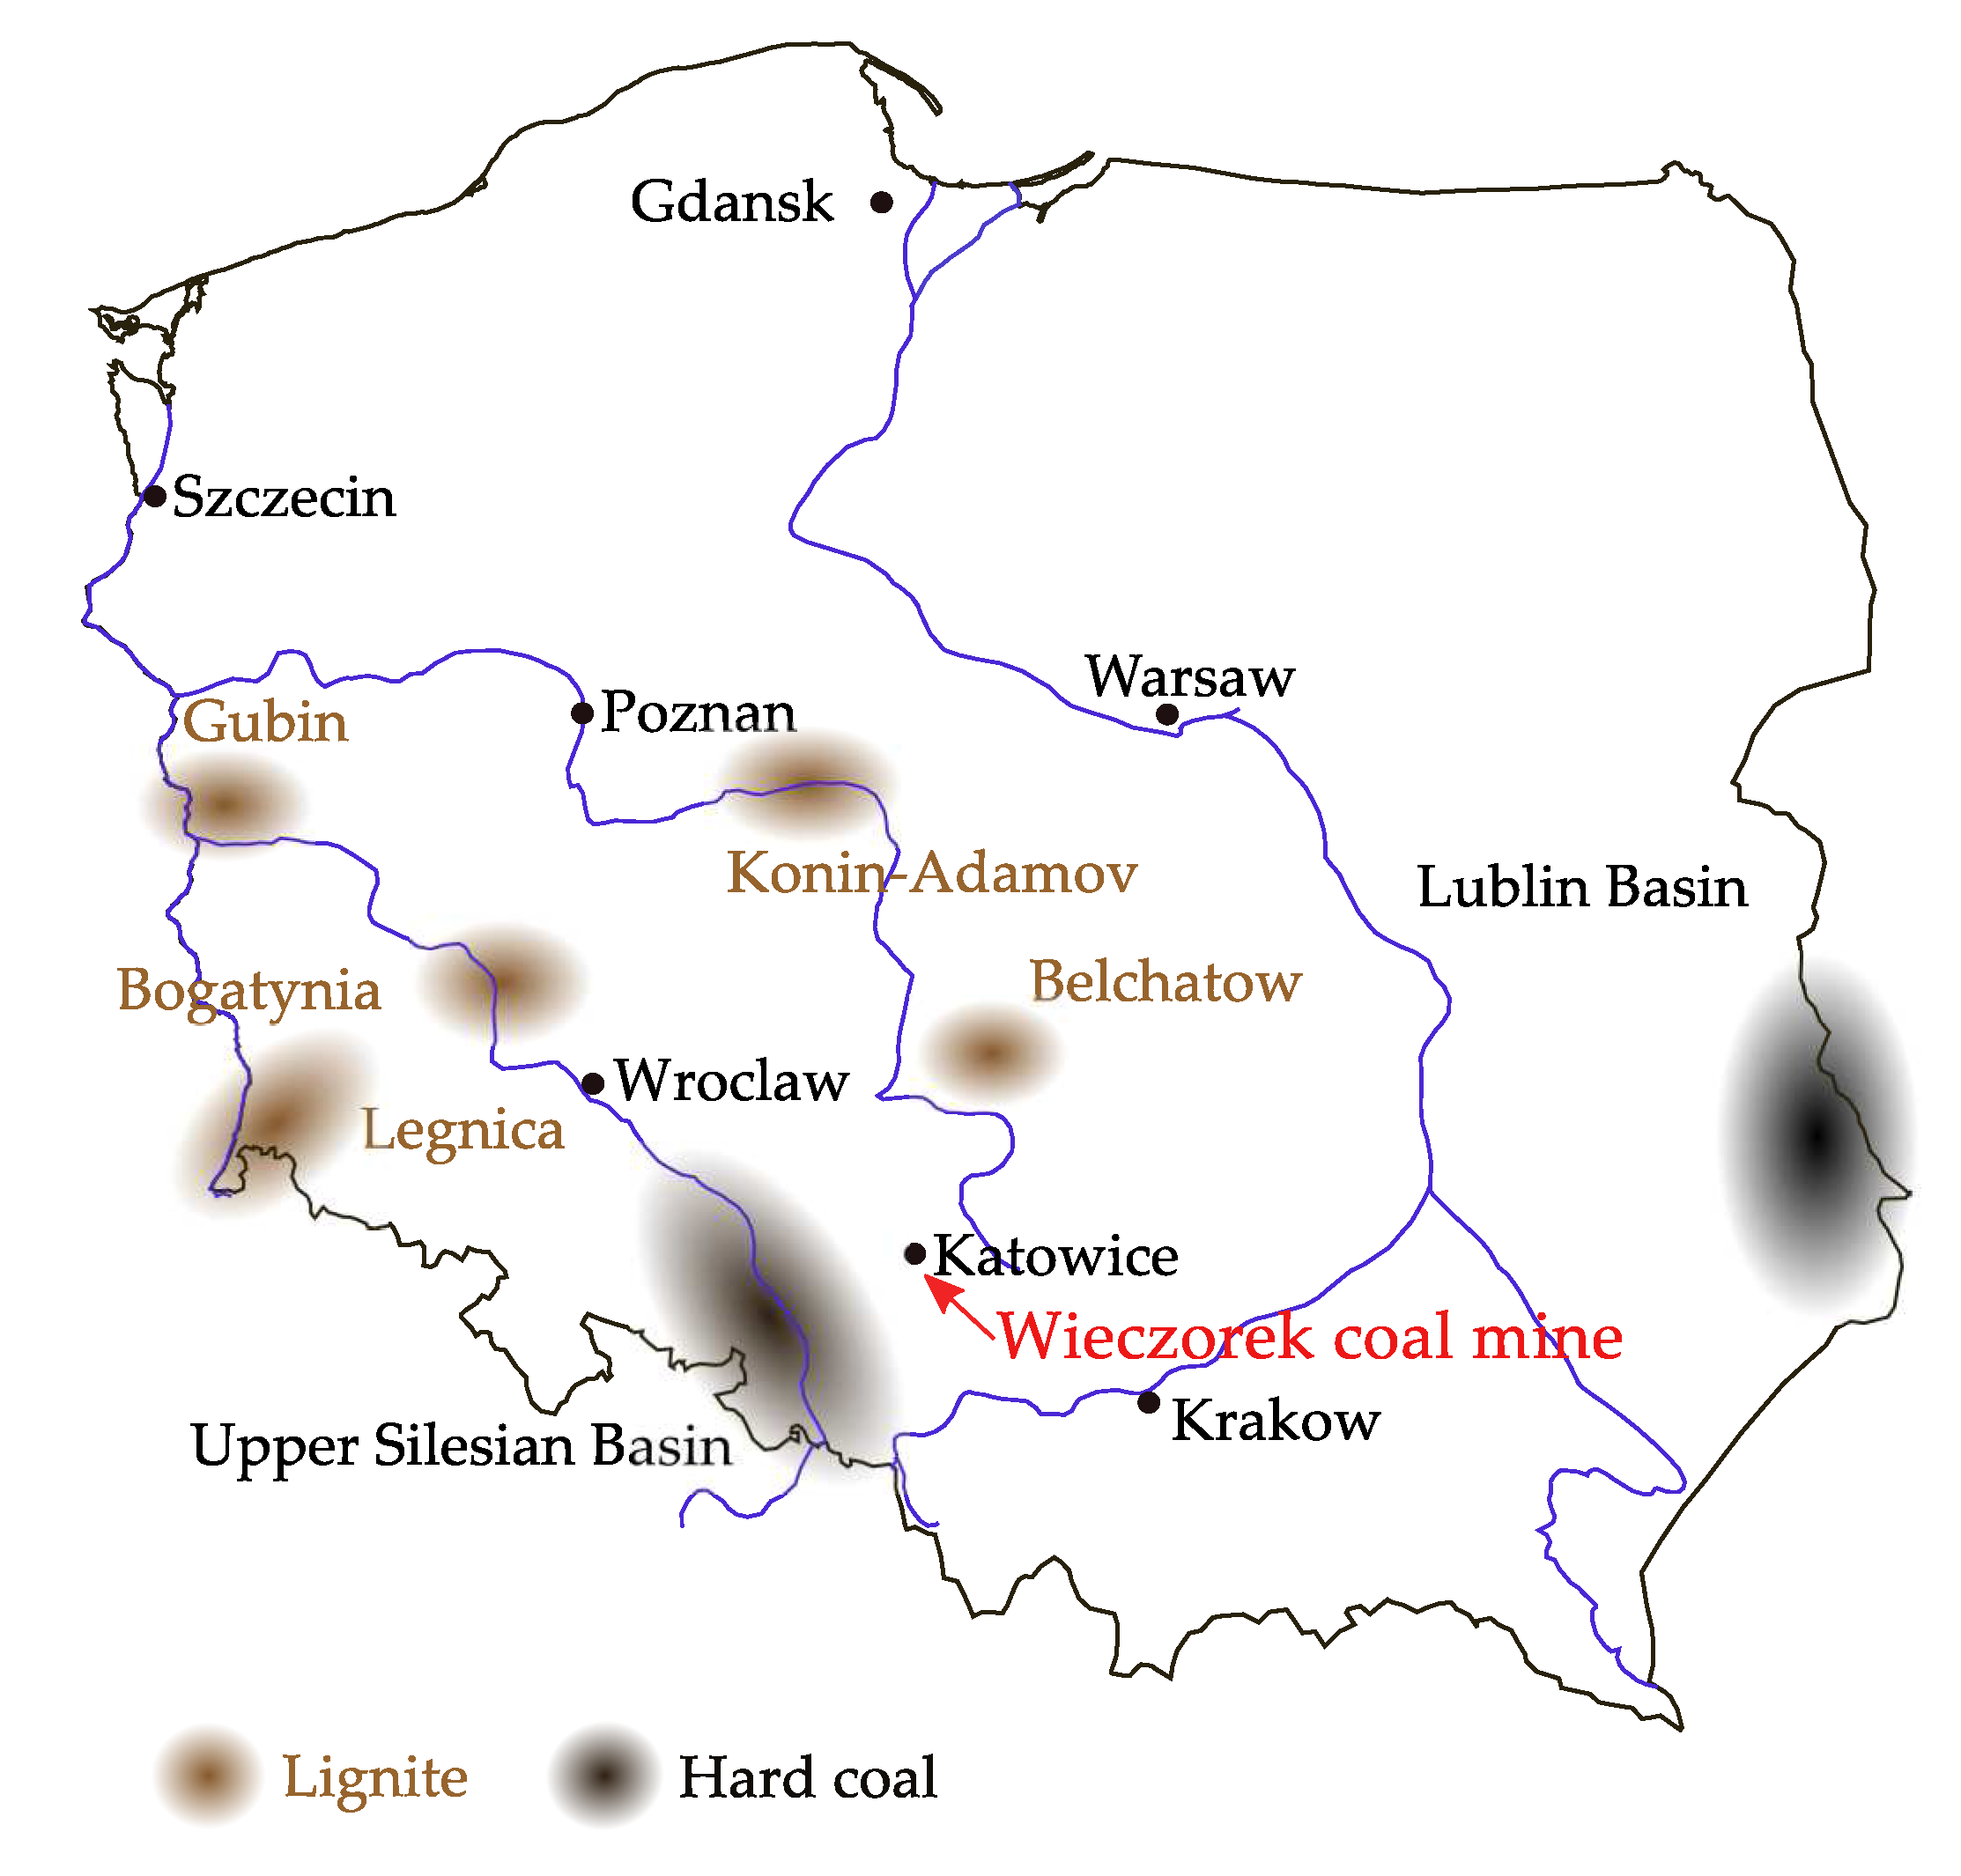
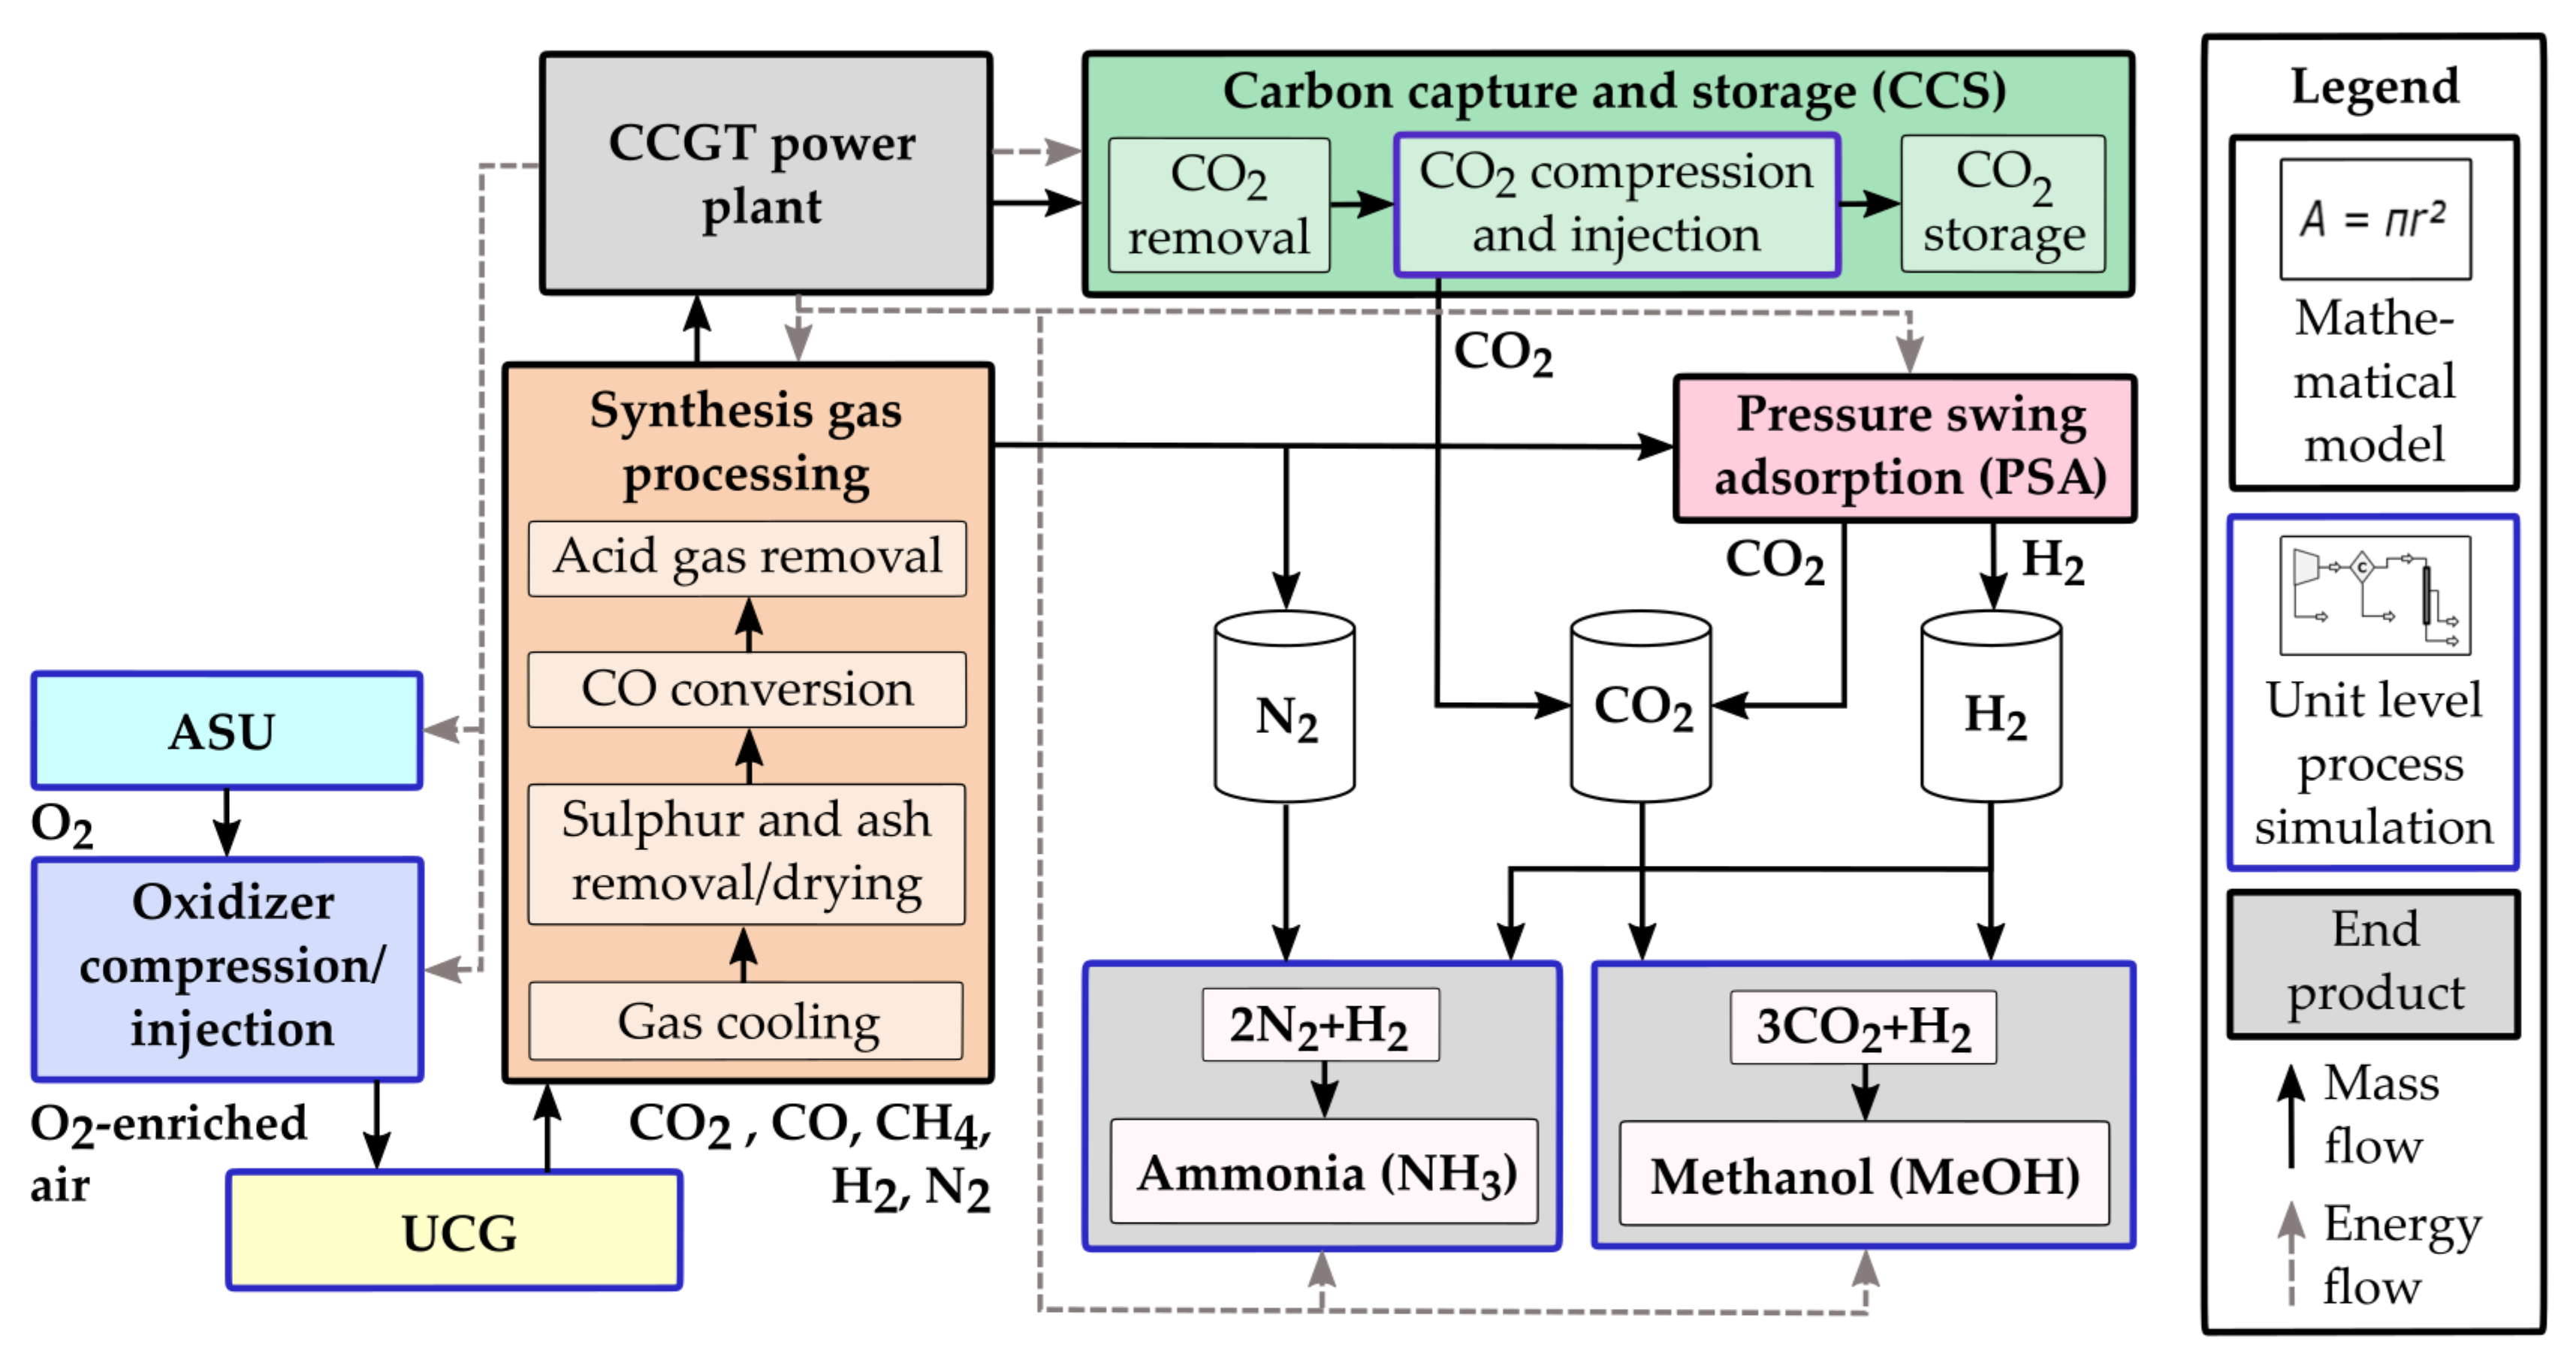
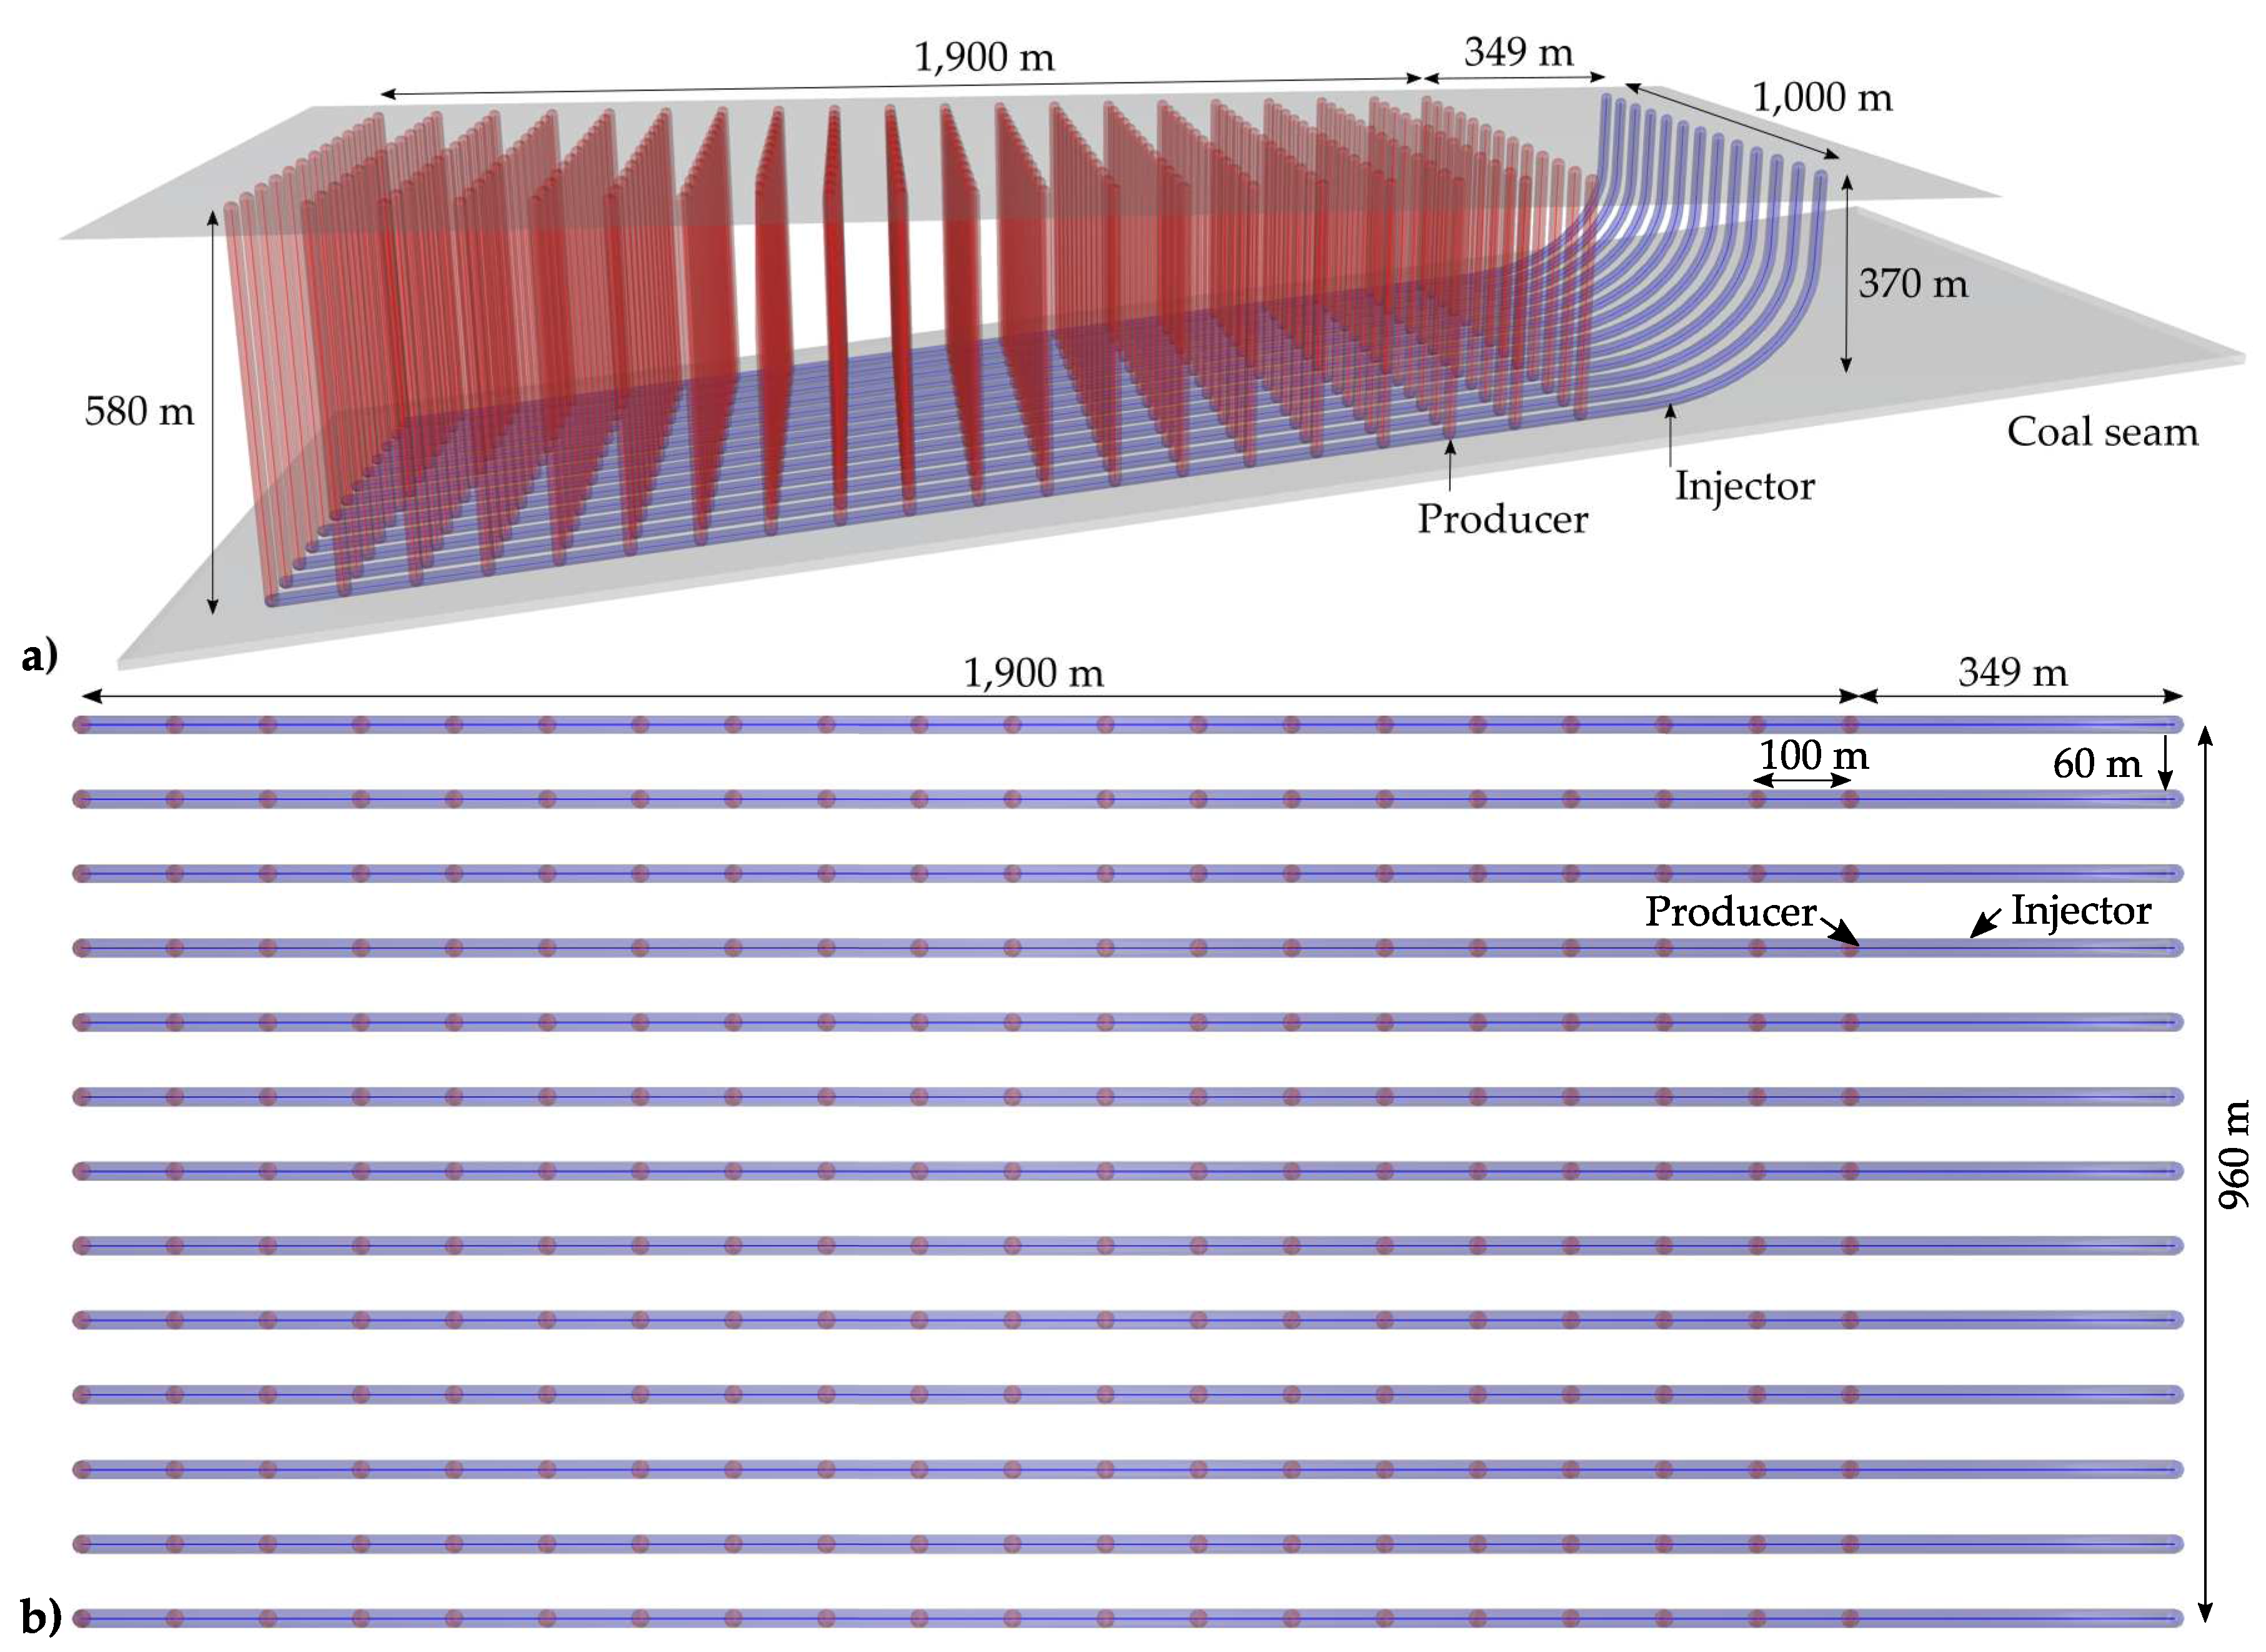
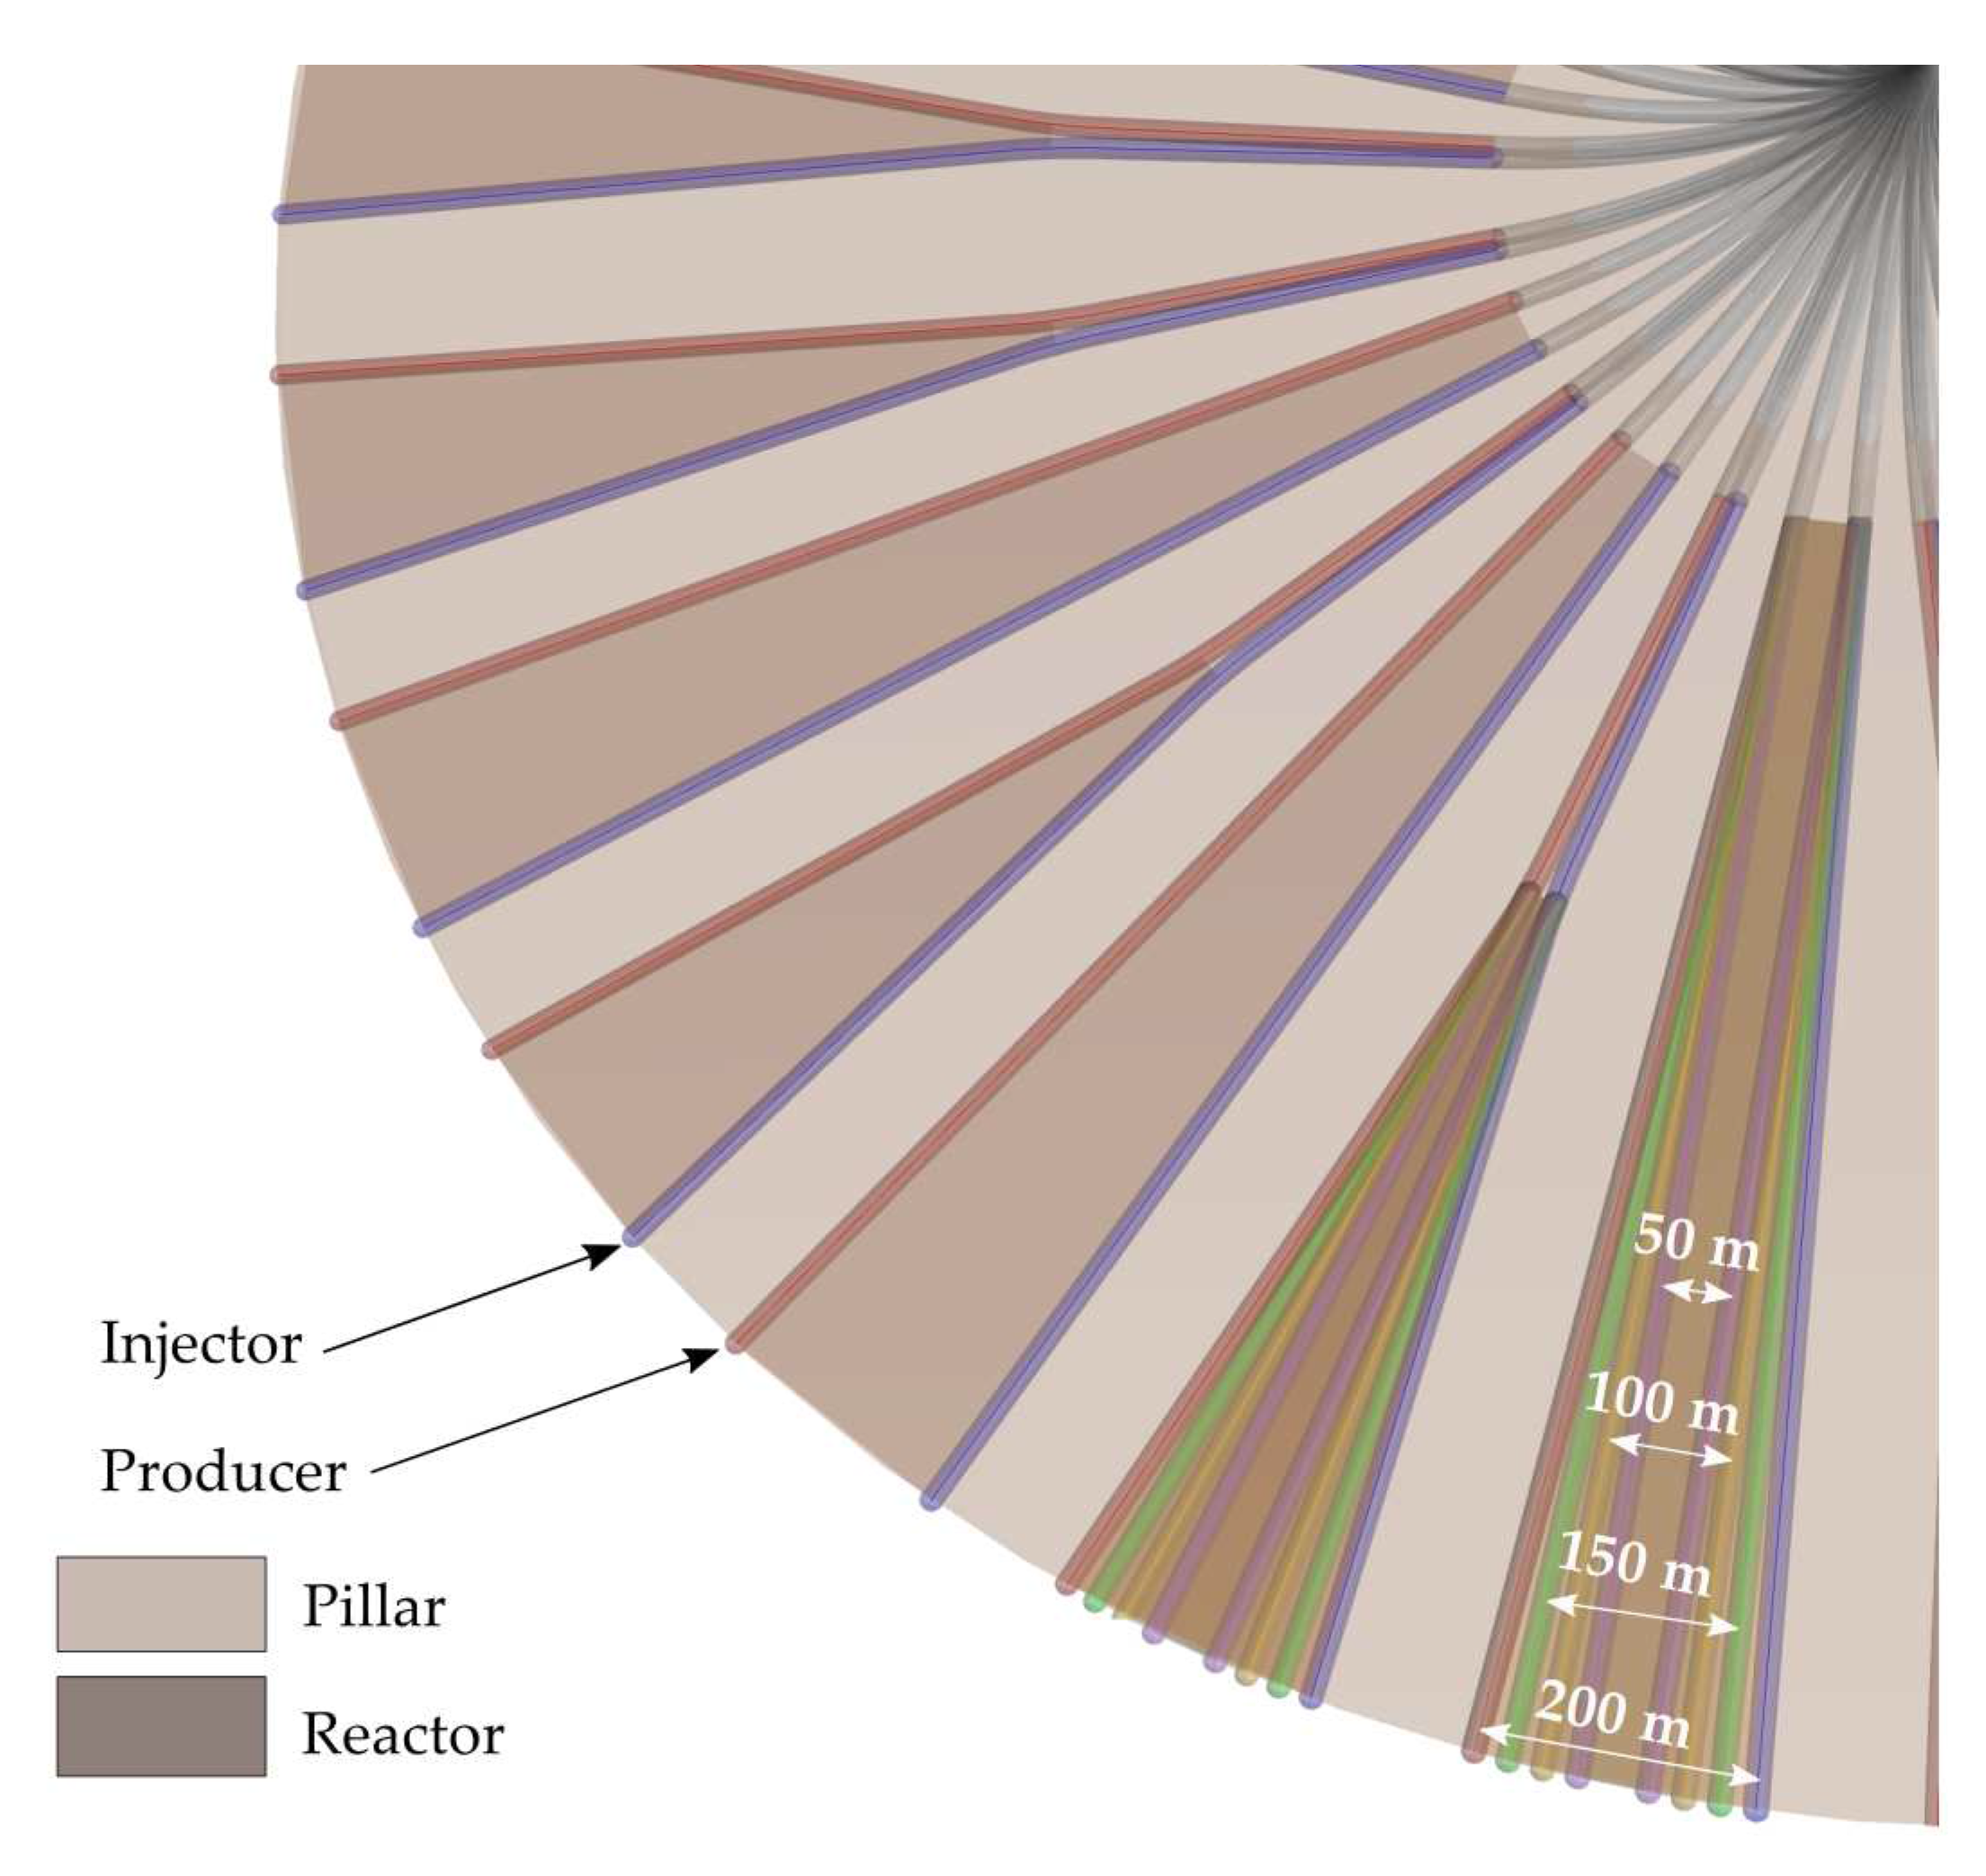
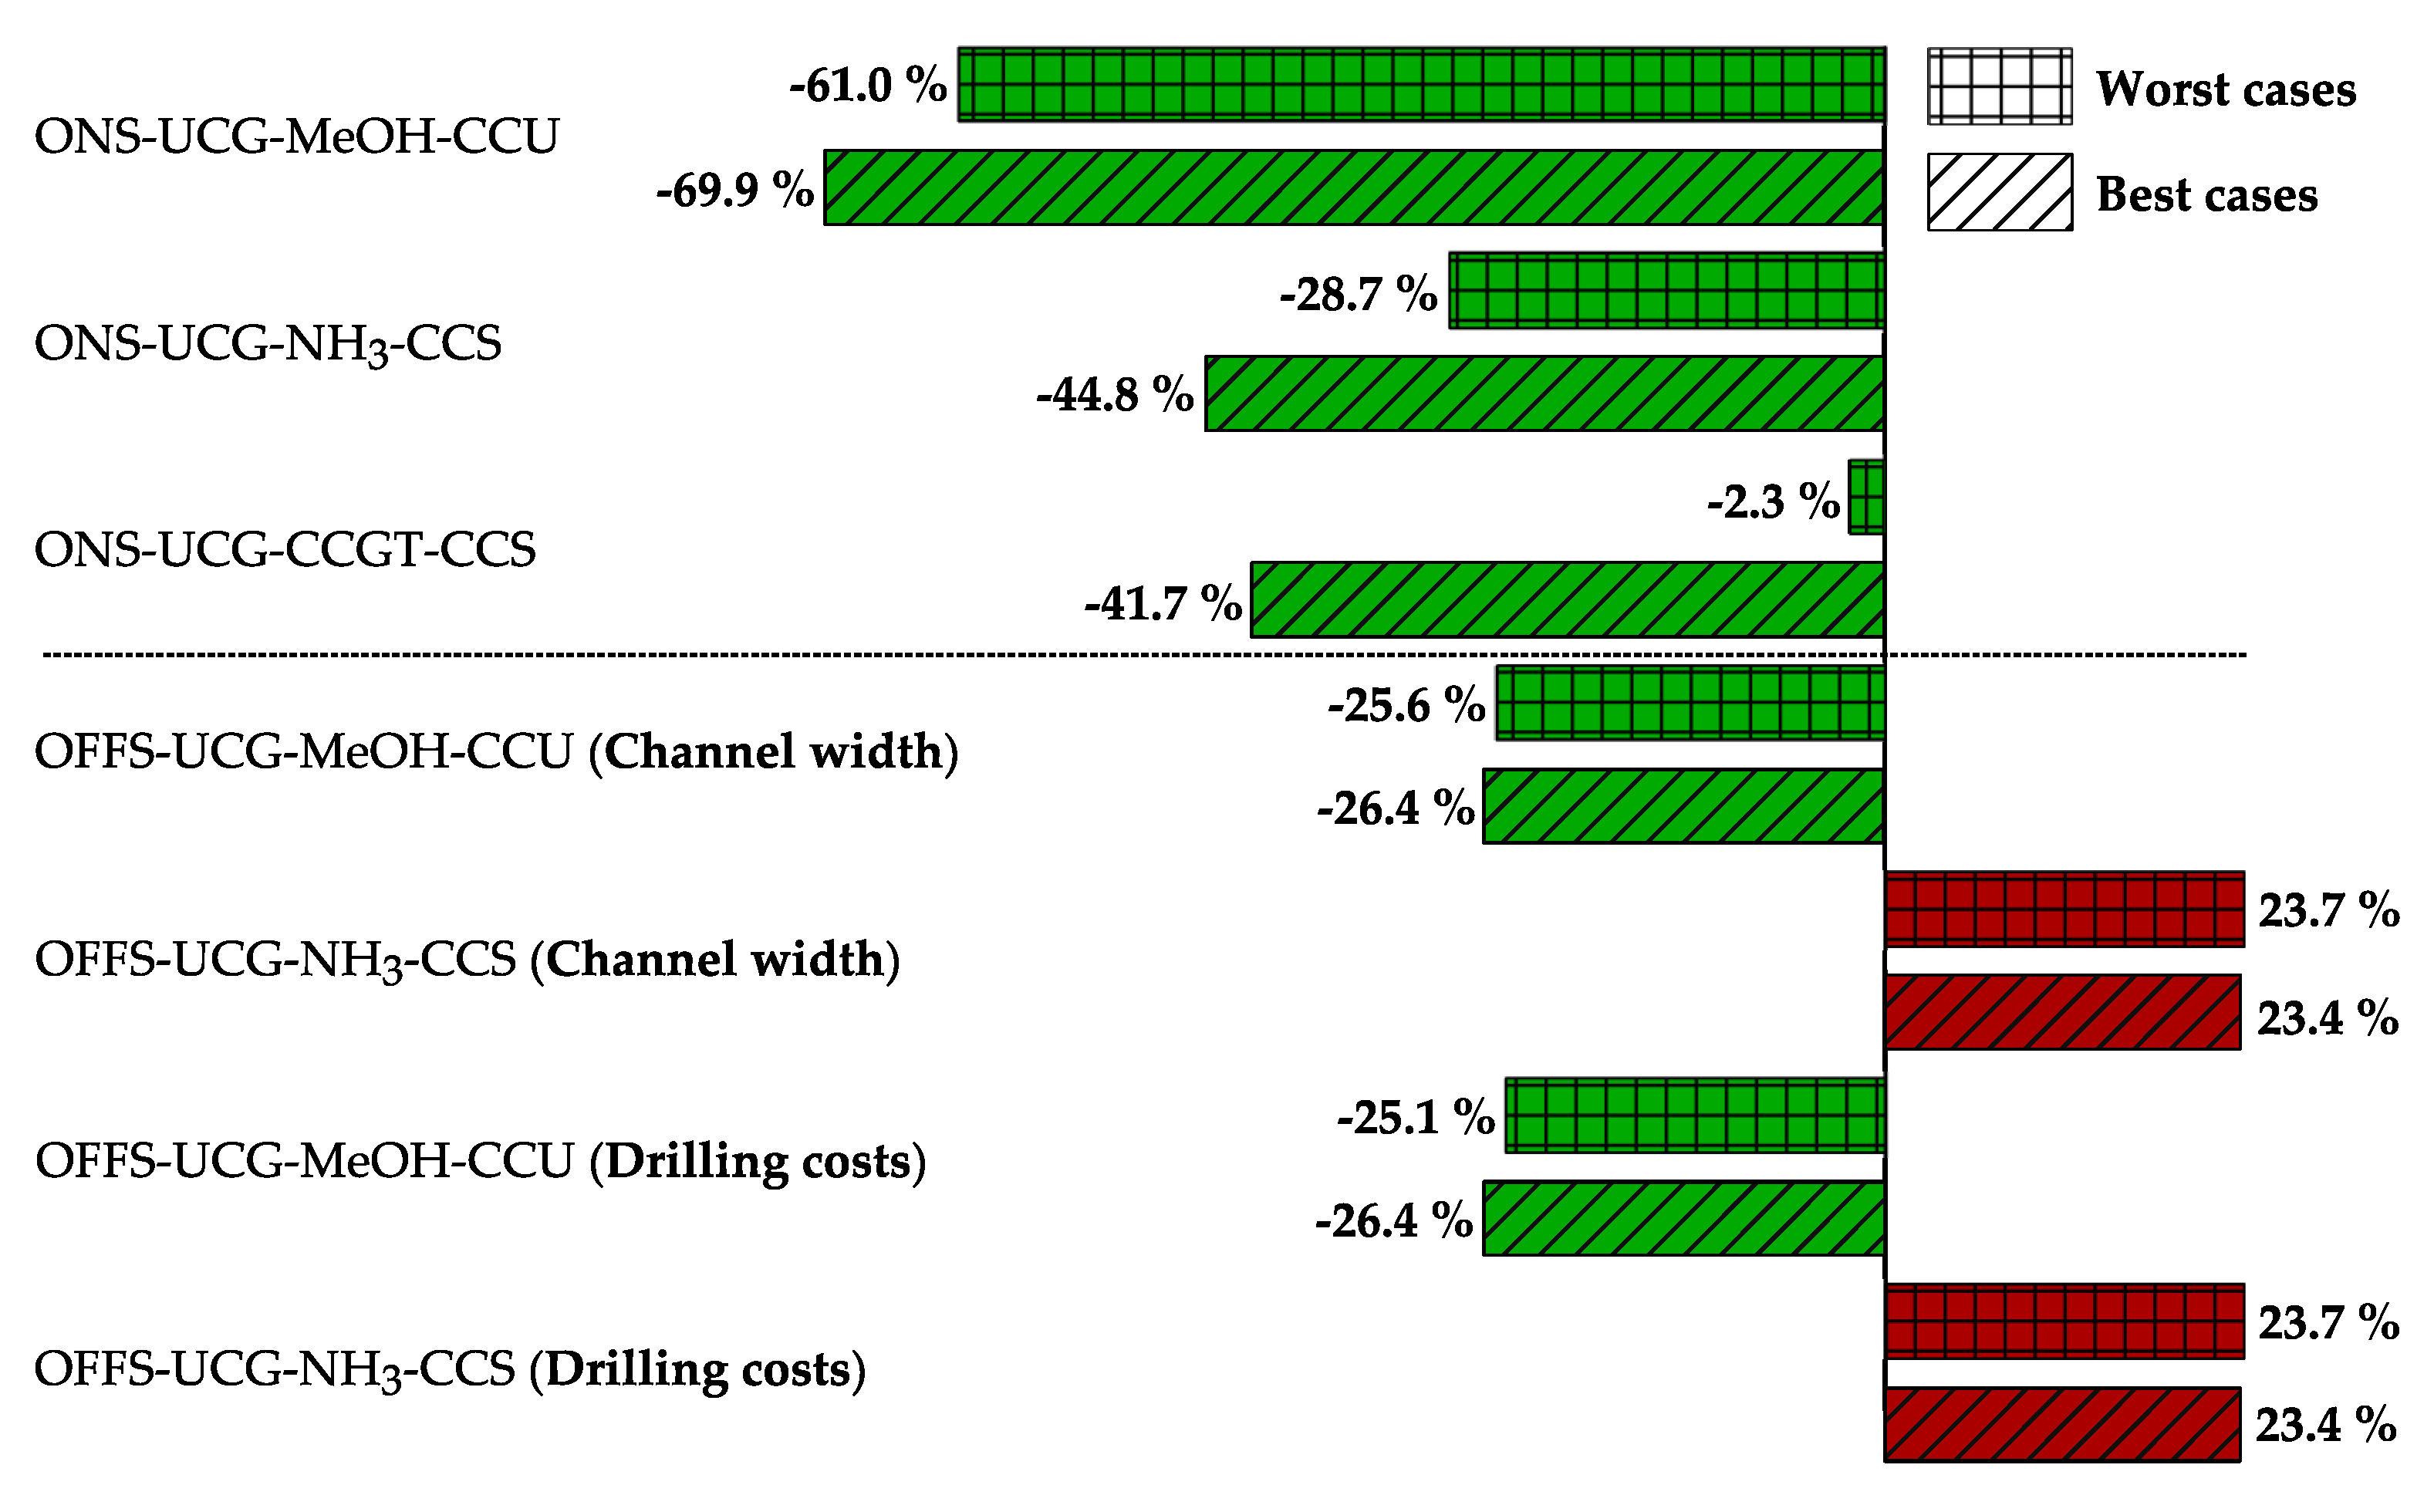
Table 1.
Geological data of target coal seam, adapted from Otto et al. [18].
Table 1.
Geological data of target coal seam, adapted from Otto et al. [18].
| Model Input Parameters | Value |
|---|---|
| Average coal seam thickness (m) | 11.0 |
| Average coal calorific value (MJ/kg) | 29.0 |
| Average dip angle of coal seam (°) | 8.6 |
| Average coal seam depth (m) | 475.0 |
| Average coal density (t/m3) | 1.281 |
Table 2.
UCG design adapted from Otto et al. [18] and adjusted to the investigated electricity, methanol and ammonia scenarios.
Table 2.
UCG design adapted from Otto et al. [18] and adjusted to the investigated electricity, methanol and ammonia scenarios.
| Key Data | Electricity | Methanol | Ammonia | Reference |
|---|---|---|---|---|
| UCG panel width (km) | 1.9 | 1.9 | 1.9 | [18,19,20] |
| UCG panel length (km) | 1.0 | 1.0 | 1.0 | [18,19,20] |
| UCG panel coal resources (Mt) | 7.3 | 7.3 | 7.3 | Calculated |
| Channel width-to-height ratio (-) | 1.8 | 1.8 | 1.8 | [18,19,20] |
| Number of simultaneously operating production wells (-) | 4.0 | 2.0 | 1.0 | Calculated |
| Number of injection wells per UCG panel (-) | 13.0 | 13.0 | 13.0 | Calculated |
| Number of simultaneously operating injection wells (-) | 4.0 | 2.0 | 1.0 | Calculated |
| Gasification channel width (m) | 20.0 | 20.0 | 20.0 | [18,19,20] |
| Distances between gasification channels (m) | 60.0 | 60.0 | 60.0 | [18,19,20] |
| Coal consumption (Mt) | 8.5 | 4.0 | 2.3 | Calculated |
| Total required gasification agent (Mt) | 34.3 | 16.6 | 7.2 | Calculated |
| UCG panels required (-) | 1.2 | 0.5 | 0.3 | Calculated |
Table 3.
Calculated drilling meters and resulting costs for injection and production wells in the onshore electricity, methanol and ammonia production scenarios.
Table 3.
Calculated drilling meters and resulting costs for injection and production wells in the onshore electricity, methanol and ammonia production scenarios.
| Cost Position | Electricity | Methanol | Ammonia | Reference |
|---|---|---|---|---|
| Vertical drilling length (km) | 188.5 | 88.0 | 50.3 | CAD model |
| Costs vertical drilling meters (€/m) | 80.0 | 80.0 | 80.0 | [11,13,26,27] |
| Cumulative costs vertical drilling meters (M€) | 15.1 | 7.0 | 4.0 | Calculated |
| Deviated drilling length (km) | 0.6 | 0.3 | 0.2 | CAD model |
| Costs deviated drilling meters (€/m) | 480.0 | 480.0 | 480.0 | [11,13,26,27] |
| Cumulative costs deviated drilling meters (M€) | 0.3 | 0.1 | 0.1 | Calculated |
| Horizontal drilling length (km) | 30.3 | 14.2 | 8.1 | CAD model |
| Costs horizontal drilling meters (€/m) | 230.0 | 230.0 | 230.0 | [11,13,26,27] |
| Cumulative costs horizontal drilling meters (M€) | 7.0 | 3.3 | 1.9 | Calculated |
| Total drilling costs (M€) | 22.4 | 10.4 | 6.0 | Calculated |
Table 4.
Onshore UCG cost positions of the onshore electricity as well as methanol and ammonia production scenarios for 20 years of operation.
Table 4.
Onshore UCG cost positions of the onshore electricity as well as methanol and ammonia production scenarios for 20 years of operation.
| Cost Position | Electricity | Methanol | Ammonia | Reference |
|---|---|---|---|---|
| Fees for area, permission, research, exploration (M€) | 1.9 | 1.7 | 1.7 | [11,13,26,27] |
| Land acquisition costs (M€) | 59.3 | 29.7 | 29.6 | [11,13,26,27] |
| Piping, measuring, control equipment costs (M€) | 14.1 | 3.0 | 0.8 | [28] |
| Gasification agent production, injection costs (M€) | 390.1 | 60.2 | 183.9 | [29] |
| Synthesis gas processing costs (M€) | 280.0 | 142.0 (PSA) | 48.1 (PSA) | [28,30] |
| Annual staff salaries (M€) | 4.6 | 2.2 | 0.7 | [28] |
Table 5.
Boundary conditions for the radial offshore UCG well design in the reference scenario [36].
Table 5.
Boundary conditions for the radial offshore UCG well design in the reference scenario [36].
| Model input Parameters | Value |
|---|---|
| Average coal seam thickness (m) | 11.0 |
| Coal panel radius (km) | 1.3 |
| Overall UCG panel extension (km2) | 5.3 |
| Extractable coal resources per UCG panel (Mt) | 33.8 |
| Pillar width (m) | 100.0 |
Table 6.
Drilling meters and costs in the offshore methanol and ammonia production scenarios.
| Cost Position | Methanol | Ammonia |
|---|---|---|
| Total deviated drilling meters (m) | 2739.0 | 913.0 |
| Cumulated costs for deviated drilling meters (M€) | 6.6 | 2.2 |
| Total horizontal drilling meters (m) | 5997.0 | 1999.0 |
| Cumulated costs for horizontal drilling meters (M€) | 6.9 | 2.3 |
| Total vertical drilling meters (m) | 1091.0 | 364.0 |
| Cumulated costs for vertical drilling meters (M€) | 0.5 | 0.2 |
| Total drilling costs (M€) | 13.9 | 4.6 |
Table 7.
CAPEX and OPEX of the air separation process onshore (ONS) and offshore (OFFS) for 20 years of operation, determined using the Integrated Environmental Control Model (IECM) [29].
Table 7.
CAPEX and OPEX of the air separation process onshore (ONS) and offshore (OFFS) for 20 years of operation, determined using the Integrated Environmental Control Model (IECM) [29].
| CAPEX | Electricity (ONS) | MeOH (ONS/OFFS) | NH3 (ONS/OFFS) |
| Process facilities capital (M€) | 77.9 | 56.9 | 44.8 |
| General facilities capital (M€) | 11.7 | 8.5 | 6.7 |
| Staff costs (M€) | 7.8 | 5.7 | 4.5 |
| Project and process contingency costs (M€) | 15.6 | 11.4 | 9.0 |
| Interest charges (M€) | 6.1 | 4.4 | 3.5 |
| Royalty fees (M€) | 0.4 | 0.3 | 0.2 |
| Preproduction (start-up) costs (M€) | 2.8 | 2.0 | 1.6 |
| Inventory (working) capital (M€) | 0.6 | 0.4 | 0.3 |
| Total ASU CAPEX (M€) | 123.0 | 90.0 | 71.0 |
| OPEX (Variable and Fixed Costs) | Electricity (ONS) | MeOH (ONS/OFFS) | NH3 (ONS/OFFS) |
| Variable costs (M€/year) | 2.6 | 1.2 | 0.6 |
| Operating labour (M€/year) | 1.8 | 1.4 | 1.0 |
| Maintenance labour (M€/year) | 0.9 | 0.7 | 0.5 |
| Maintenance material (M€/year) | 1.4 | 1.0 | 0.8 |
| Admin and support labour (M€/year) | 1.0 | 0.7 | 0.6 |
| Total ASU OPEX (M€) | 7.7 | 5.0 | 3.5 |
Table 8.
Costs for synthesis gas processing in the electricity production scenario for 20 years of operation, modeled via the Integrated Environmental Control Model [29] and scaled accordingly.
Table 8.
Costs for synthesis gas processing in the electricity production scenario for 20 years of operation, modeled via the Integrated Environmental Control Model [29] and scaled accordingly.
| CAPEX | Value |
| Selexol sulphur removal unit (M€) | 46.2 |
| Process facilities capital (M€) | 49.4 |
| General facilities capital (M€) | 7.4 |
| Staff fees (M€) | 4.9 |
| Project and process contingency cost (M€) | 10.8 |
| Interest charges (M€) | 8.1 |
| Royalty fees (M€) | 0.3 |
| Preproduction (start-up) costs (M€) | 4.2 |
| Inventory (working) capital (M€) | 0.7 |
| OPEX (Variable and Fixed Costs) | Value |
| Selexol solvent (M€/year) | 0.1 |
| Sulphur by-product (M€/year) | 0.4 |
| Disposal costs (M€/year) | 720.0 |
| Operating labour (M€/year) | 4.1 |
| Maintenance labour (M€/year) | 0.6 |
| Maintenance material (M€/year) | 0.9 |
| Administrative and support labour (M€/year) | 1.4 |
Table 9.
Levelized costs (reference scenario, electricity generation set-up) for onshore Selexol capture, injection, storage and monitoring considering CO2 emissions of 2.2 t/t coal.
Table 9.
Levelized costs (reference scenario, electricity generation set-up) for onshore Selexol capture, injection, storage and monitoring considering CO2 emissions of 2.2 t/t coal.
| Selexol Capture Costs | Value |
| Energy costs (€/t CO2) | 3.8 |
| Selexol CAPEX (€/t CO2) | 6.7 |
| Selexol OPEX (€/t CO2) | 1.0 |
| CO2 Storage Costs | Value |
| Injection and storage costs (€/t CO2) | 0.4 |
| Monitoring costs (€/t CO2) | 0.8 |
| Total Levelized CCS Costs (€/t CO2) | 12.8 |
Table 10.
Costs of all integrated Underground Coal Gasification (UCG) and generation in a Combined Cycle Gas Turbine (CCGT) process stages combined as Cost of Electricity (COE), determined according to the calculation method provided by Schneider [32].
Table 10.
Costs of all integrated Underground Coal Gasification (UCG) and generation in a Combined Cycle Gas Turbine (CCGT) process stages combined as Cost of Electricity (COE), determined according to the calculation method provided by Schneider [32].
| Cost Position | Value |
|---|---|
| CCGT investment costs (k€) | 18.2 |
| CCGT annual interest payments (k€/year) | 608.0 |
| CCGT fixed operating costs (k€/year) | 856.0 |
| CCGT variable operating costs (k€/year) | 245.0 |
| UCG annual fuel costs (M€/year) | 43.8 |
| CCGT levelized total annual costs with demolition (k€/year) | 46.9 |
| UCG-CCGT Costs of Electricity (€/MWh) | 53.6 |
Table 11.
Costs positions for methanol production process stages combined as Underground Coal Gasification (UCG) based methanol production costs.
Table 11.
Costs positions for methanol production process stages combined as Underground Coal Gasification (UCG) based methanol production costs.
| CAPEX | Value | Reference |
| Plant designing, constructing and building (M€) | 154.8 | [16] |
| Plant equipment, civil work, site preparation (M€) | 62.9 | [16] |
| Engineering costs, infrastructure modification (M€) | 33.9 | [16] |
| Working capital (M€) | 19.4 | [16] |
| PSA plant equipment (M€) | 12.6 | [30] |
| OPEX | Value | Reference |
| Staff (5 operators, 3 shift positions) costs (M€/year) | 38.7 | [16] |
| CO2/H2 provision in line with PSA (M€/year) | 6.5 | [30] |
| Cooling, process water, other materials (€/t ammonia) | 15 | [16] |
Table 12.
Individual components of levelized onshore Underground Coal Gasification (UCG) based methanol production costs for 20 years of operation.
Table 12.
Individual components of levelized onshore Underground Coal Gasification (UCG) based methanol production costs for 20 years of operation.
| Cost Position | €/t MeOH |
|---|---|
| Total drilling costs | 2.3 |
| Fees, land acquisition, piping, measuring, control equipment | 42.6 |
| Synthesis gas processing | 31.8 |
| Gasification agent production (ASU) and injection | 58.3 |
| Total Costs | 135.1 |
Table 13.
Individual components of levelized offshore Underground Coal Gasification (UCG) based methanol production costs for 20 years of operation.
Table 13.
Individual components of levelized offshore Underground Coal Gasification (UCG) based methanol production costs for 20 years of operation.
| Cost Position | €/t MeOH |
|---|---|
| Total drilling costs | 2.1 |
| Offshore platform, piping, measuring, control equipment | 216.2 |
| Synthesis gas processing | 21.6 |
| Gasification agent production (ASU) and injection | 39.7 |
| Total Costs | 279.6 |
Table 14.
Costs (CAPEX and OPEX) for ammonia production.
| Cost Position | Value | Reference |
|---|---|---|
| Capital charge without ASU/gas turbine (M€) | 34.7 | [63] |
| Haber-Bosch synthesis loop (M€/year) | 6.5 | [63] |
Table 15.
Individual components of levelized onshore Underground Coal Gasification (UCG) based ammonia production costs for 20 years of operation.
Table 15.
Individual components of levelized onshore Underground Coal Gasification (UCG) based ammonia production costs for 20 years of operation.
| Cost Position | €/t NH3 |
|---|---|
| Total drilling costs | 2.9 |
| Fees, land acquisition, piping, measuring, control equipment | 69.6 |
| Synthesis gas processing | 23.6 |
| Gasification agent production (ASU) and injection | 90.2 |
| Total Costs | 279.6 |
Table 16.
Individual components of levelized offshore Underground Coal Gasification (UCG) based ammonia production costs for 20 years of operation.
Table 16.
Individual components of levelized offshore Underground Coal Gasification (UCG) based ammonia production costs for 20 years of operation.
| Cost Position | €/t NH3 |
|---|---|
| Total drilling costs | 1.1 |
| Offshore platform, piping, measuring, control equipment | 327.2 |
| Synthesis gas processing | 11.5 |
| Gasification agent production (ASU) and injection | 44.0 |
| Total Costs | 383.8 |
Table 17.
Synthesis gas compositions and calorific values investigated in one-at-a-time (OAT) sensitivity analyses. Values given in% by volume, data for scenarios derived from Otto et al. and Stańczyk et al. [7,9,18,19,20], CVs calculated.
| Scenario | CO2 (%) | H2 (%) | N2 (%) | CH4 (%) | CO (%) | CV (MJ/sm3) | Oxidizer Composition (%) |
|---|---|---|---|---|---|---|---|
| Wieczorek (I) | 6.4 | 15.9 | 58.9 | 1.2 | 17.5 | 4.4 | O2: 35, N2: 65 |
| Wieczorek (II) | 9.2 | 10.7 | 63.7 | 2.0 | 14.5 | 3.7 | Air: 100 |
| Bielszowice (III) | 14.8 | 11.9 | 60.1 | 2.8 | 10.4 | 3.6 | Air: 100 |
| Bielszowice (IV) | 23.2 | 18.9 | 36.2 | 4.2 | 17.5 | 5.8 | O2: 51.3, N2: 48.7 |
Table 18.
Fuel production costs for electricity production considering different synthesis gas compositions.
Table 18.
Fuel production costs for electricity production considering different synthesis gas compositions.
| Scenarios | I | II | III | IV |
|---|---|---|---|---|
| Fuel costs (€/GJ) | 8.1 | 6.1 | 7.6 | 11.1 |
Table 19.
Fuel production costs for onshore methanol production considering different synthesis gas compositions.
Table 19.
Fuel production costs for onshore methanol production considering different synthesis gas compositions.
| Scenarios | I | II | III | IV |
|---|---|---|---|---|
| Fuel costs (€/GJ) | 4.1 | 2.8 | 2.7 | 4.2 |
Table 20.
Total CO2 produced (UCG and electricity generation) and its percentage share utilised for methanol synthesis in the four investigated scenarios.
Table 20.
Total CO2 produced (UCG and electricity generation) and its percentage share utilised for methanol synthesis in the four investigated scenarios.
| Scenario | CO2 from UCG (kg/s) | CO2 from CCGT (kg/s) | Total CO2 Utilised (%) |
|---|---|---|---|
| I | 14.0 | 10.7 | 92.2 |
| II | 18.0 | 13.0 | 73.0 |
| III | 25.0 | 14.0 | 57.2 |
| IV | 25.0 | 14.0 | 57.5 |
Table 21.
Fuel production costs for onshore ammonia production considering different synthesis gas compositions.
Table 21.
Fuel production costs for onshore ammonia production considering different synthesis gas compositions.
| Scenarios | I | II | III | IV |
|---|---|---|---|---|
| Fuel costs (€/GJ) | 7.7 | 5.6 | 6.7 | 4.6 |
Table 22.
Different channel widths and resulting levelized methanol/ammonia costs.
| Channel Width (m) | Channel Number | Drilling Length (km) | Drilling Costs (M€) | MeOH Costs (€/t MeOH) | NH3 Costs (€/t NH3) |
|---|---|---|---|---|---|
| 50.0 | 6 */3 | 19.7 */9.8 | 27.8 */13.9 | 285.1 | 385.3 |
| 100.0 | 4/2 | 13.1/6.6 | 18.5/9.3 | 280.2 | 384.5 |
| 150.0 | 3/2 | 9.8/6.6 | 13.9/9.3 | 279.6 | 384.5 |
| 200.0 | 3/1 | 9.8/3.3 | 13.9/4.6 | 279.6 | 383.8 |
* First values in table columns 2-4 are related to methanol, second to ammonia production.
© 2017 by the authors. Licensee MDPI, Basel, Switzerland. This article is an open access article distributed under the terms and conditions of the Creative Commons Attribution (CC BY) license (http://creativecommons.org/licenses/by/4.0/).
Share and Cite
MDPI and ACS Style
Nakaten, N.C.; Kempka, T. Techno-Economic Comparison of Onshore and Offshore Underground Coal Gasification End-Product Competitiveness. Energies 2017, 10, 1643. https://doi.org/10.3390/en10101643
AMA Style
Nakaten NC, Kempka T. Techno-Economic Comparison of Onshore and Offshore Underground Coal Gasification End-Product Competitiveness. Energies. 2017; 10(10):1643. https://doi.org/10.3390/en10101643
Chicago/Turabian StyleNakaten, Natalie Christine, and Thomas Kempka. 2017. "Techno-Economic Comparison of Onshore and Offshore Underground Coal Gasification End-Product Competitiveness" Energies 10, no. 10: 1643. https://doi.org/10.3390/en10101643
Note that from the first issue of 2016, this journal uses article numbers instead of page numbers. See further details here.