1. Introduction
Increasing the efficiency and specific power output of turbines are two major goals in gas turbine designs. These goals can be achieved by increasing the turbine entry temperature. Therefore, modern gas turbines are operating at a temperature far higher than the current blade materials could afford. The blade’s tip is one of the regions with the highest heat transfer rate in the entire rotor blade, because the leakage flow driven by the large pressure difference between pressure side and the suction side is accelerated in the tip gap region and impinges on the tip. Bunker et al. [
1] provided a review of the previous experimental and computational investigations into the tip leakage, and pointed out that the tip surface is exposed in the most extreme aero-thermal environment within gas turbines. Kwak et al. [
2] reported that the overall heat transfer coefficient on the blade tip showed a higher value than that on the shroud and in the near tip regions of the blade pressure and suction sides, through their experiment. Therefore it is of great importance to study the performance of fluid flow and heat transfer in the tip leakage and to analyze the effect of leakage flow characteristics on the turbine blade and mainstream.
The experimental investigations on the fluid flow and heat transfer in the tip gap region of the turbine rotors are usually quite difficult. As shown in
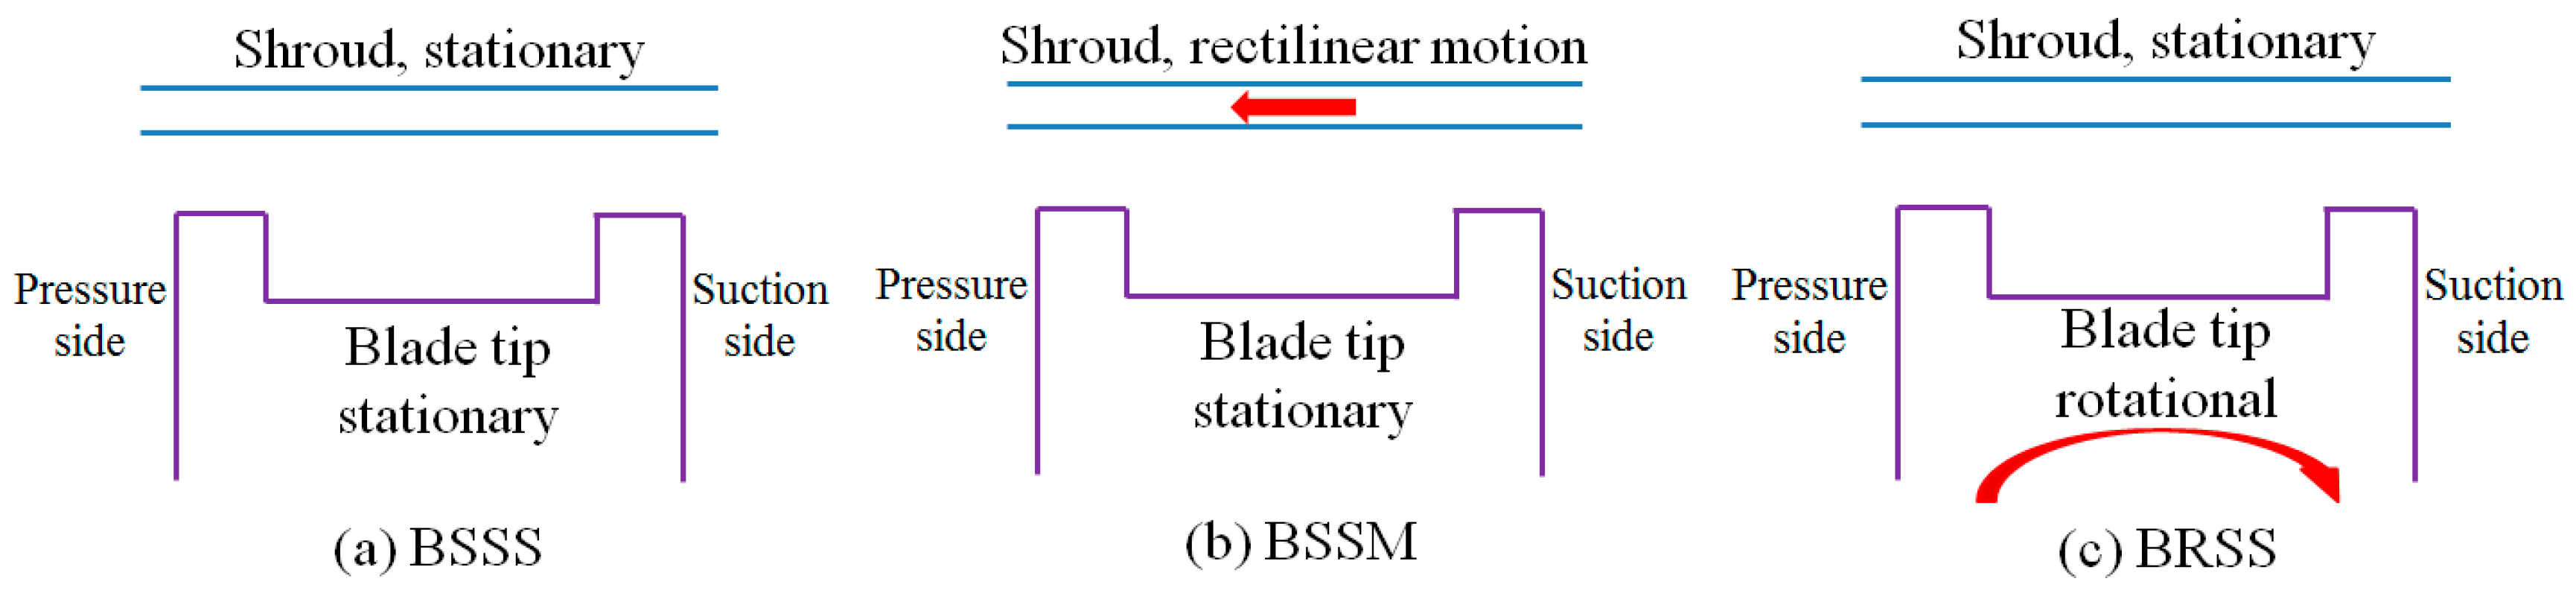
Figure 1, the experiments were conducted in three typical methods in the open literature: (1) Most experiments were conducted under the conditions of BSSS (the blade is stationary, and the shroud is also stationary) [
2,
3,
4,
5,
6]; (2) To simulate blade rotation, some experiments were conducted under a relative movement condition of BSSM (the blade is stationary, but the shroud moves along a straight line, to simulate relative movement) [
7,
8,
9,
10,
11]; (3) Few experiments were performed with BRSS (the blade is rotating, but the shroud is stationary, which is the real status of turbine rotor operation) [
12,
13,
14,
15,
16,
17]. Obviously the third kind of experiment condition, BRSS, is a real condition of a turbine rotor operating, but it is very expensive to create the real experimental environment of a gas turbine, and therefore BRSS experiments were nearly all carried out at low rotational speeds. Yang et al. [
18] used the numerical approach to study the rotation effects on the tip leakage flow and heat transfer, and they found that the relative motion of the shroud significantly increases the averaged heat transfer coefficient on the blade tip. Thus there is no guarantee of the accuracy of the results obtained in experiments conducted under the conditions of BSSS, BSSM and BRSS with a low rotational speed. However there are a few investigations into the systematic and comprehensive analysis and comparison of the tip leakage flow characteristics under different experiment methods so far. Acharya et al. [
19] numerically investigated the effects of film cooling, heat transfer and aerodynamics on the blade tip and pressure and suction sides under the three experiment conditions, but their numerical simulations were carried out only at two low rotation speeds of 375 and 750 r/min. Krishnababu et al. [
20] compared the streamlines across the tip and contours of the heat transfer coefficient on the tip under BSSS and BSSM conditions through simulations without the consideration of film cooling.
To reduce the heat impinging of the leakage flow on the tip, the new rotor of the squealer tip with a grooved structure has been widely employed in the blades instead of the traditional flat tip. The groove acts as a labyrinth seal to increase the flow resistance, and the leakage mass flow is thereby decreased. Recently a great number of investigations have been conducted on the improvement and transformation of the squealer tip [
21,
22,
23,
24,
25].
As for the simulation method, the large eddy simulation (LES) is deemed to be able to provide more accurate predictions of flow characteristics. Hahn et al. [
26] used LES to investigate a fully three-dimensional swept-wing geometry featuring separation from a curved leading edge. Hahn et al. [
27] present a systematic numerical investigation of different implicit large eddy simulations for massively separated flows. However the calculations by LES are time-consuming processes. In consideration of the complex blade geometry and huge computational grid scale in this research, Reynolds-averaged Navier–Stokes equations were used to solve the tip leakage flow.
The turbulence model and simulation method is one of the critical factors in the numerical simulation of tip leakage flow. Leschziner et al. [
28] gave a detailed review of turbulence models in aeronautics. There are various turbulence models employed in the existing literatures, such as the standard k-
ω model by Yang et al. [
18], the SST k-
ω model by Krishnababu et al. [
20] and the RNG k-
ε model by Yang et al. [
29]. To validate the numerical strategy including the turbulence model, an experiment was performed in this work. Through the comparison between the experimental data and the numerical results obtained by different turbulence models, it was found that the RNG k-
ε turbulence model matched best and thereby the turbulence model and simulation method used are reasonable. As the open literatures indicate, most experiments were conducted in the simplified BSSS case, because the experimental expenses of BSSS are much lower than those of BRSS and BSSM. However, the deviation caused by the simplification and how to reduce the deviation were not considered up to now. Aiming at exhibiting the differences between the three experimental methods, and searching for a modification approach to the experimental data obtained by the simplified BSSS method, this work experimentally and numerically investigated the tip leakage flow of a turbine rotor. A three-bladed stationary linear cascade was designed and manufactured. The corresponding flow behavior of the tip leakage, mainstream and cooling air were captured by a particle image velocimetry (PIV) system. Using the validated numerical strategy, three experimental methods (BSSS, BSSM and BRSS) were simulated and are discussed at three rotation rates (1000, 2500 and 4000 r/min). Through the discussion, the flow characteristics of the tip leakage in BSSM case was found to be very close to the real state BRSS, and the differences of tip leakage flow between BSSS and BRSS were quantitatively evaluated by the tip leakage mass flow. Accordingly, a method based on correcting the wall viscous shear stress via shroud wall roughness is proposed to reduce the difference caused in BSSS case from the real case, BRSS.
2. Experimental Apparatus and Procedures
2.1. Blade Model Geometry
The tested blade model had the same profile as a GE-E
3 rotor, but was scaled up three times to improve optical access and meet the requirements of PIV measurement. The geometry parameters of the blade are summarized in
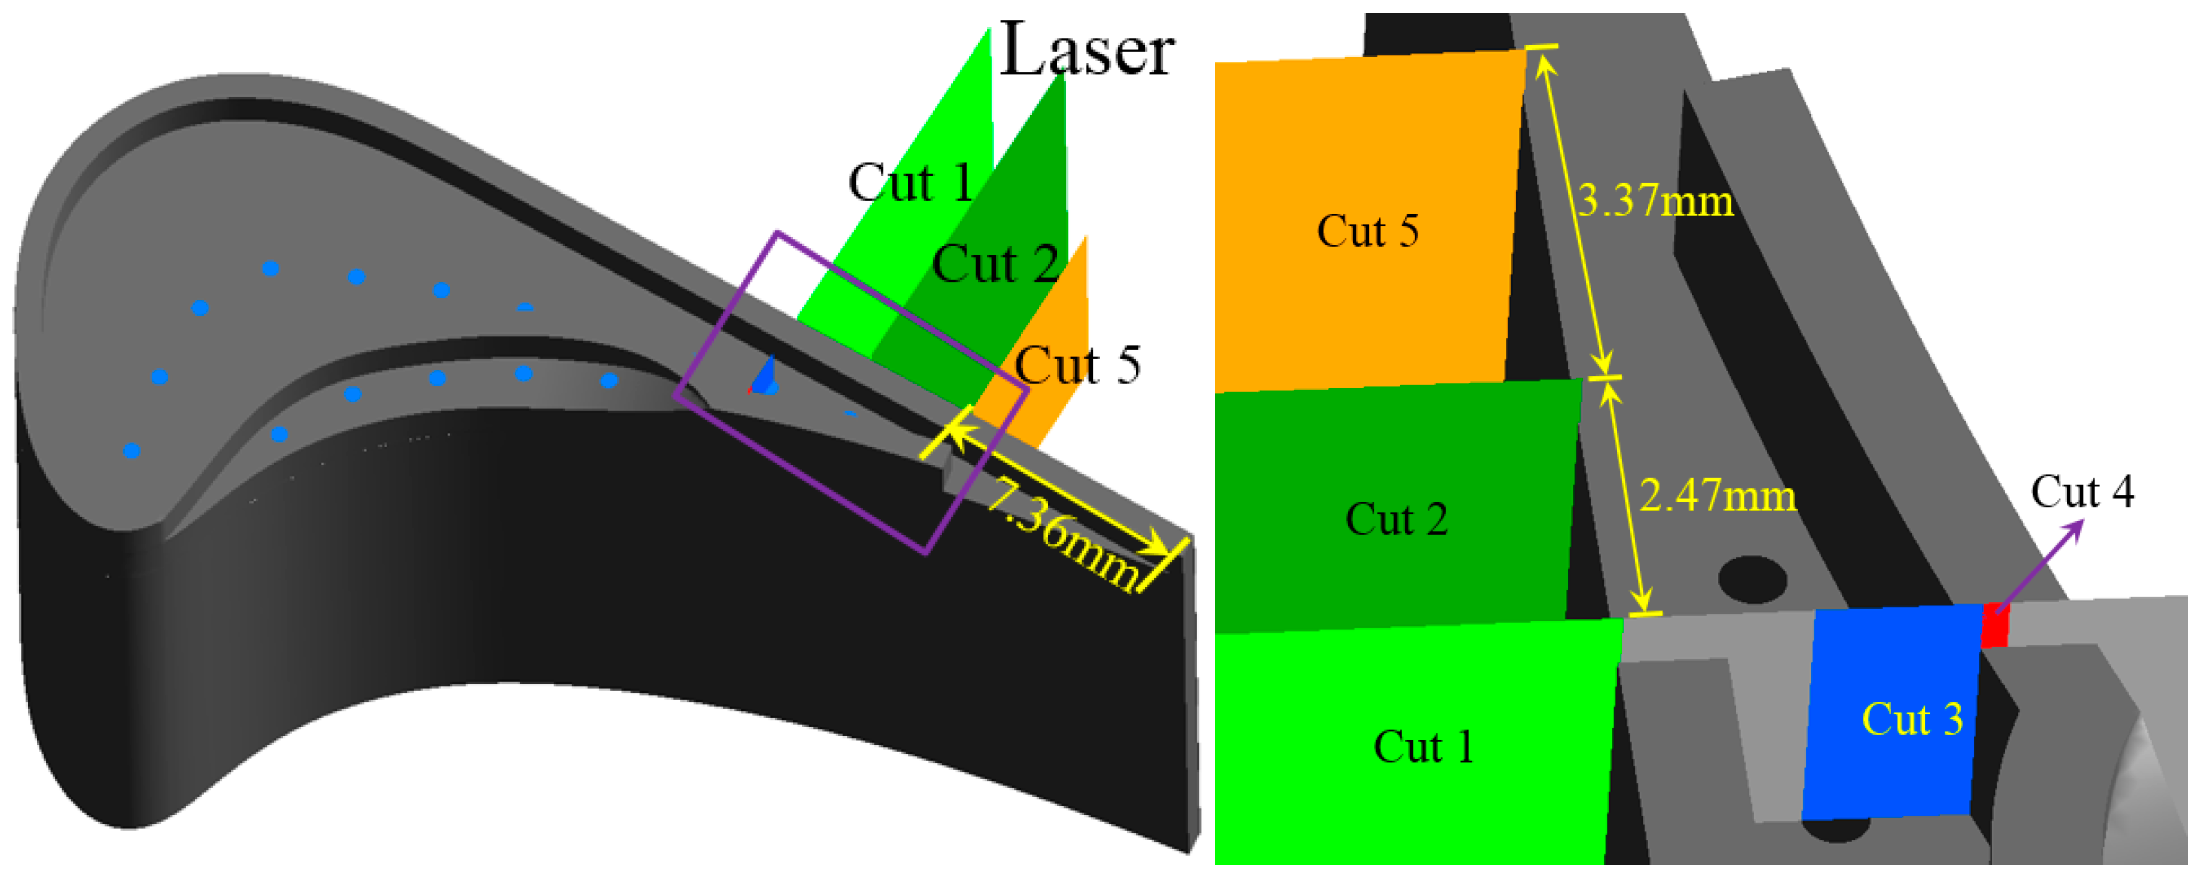
Table 1. There were two rows of cylindrical film cooling holes on the blade tip, the diameter of the film holes was 1.5 mm, and the injection direction was perpendicular to the tip surface, as shown in
Figure 2. The squealer at the suction side was along the blade profile, but at the pressure side there was a small gap with a size of 7.36 mm from the trailing edge, in order to decrease the accumulation of cooling air on the tip. On the pressure side of the blade tip there were five film holes outside the squealer, so that the cooling air injected from the film holes could restrain the leakage flow into the tip gap. Along the camber line of the tip, there were 11 film holes to hinder the fluid passing through the suction side. The distance between adjacent holes was 2.5 mm. The tested blade was made of stainless steel, and to avoid optical reflection, its surface was processed to approach a black body.
2.2. Experimental System
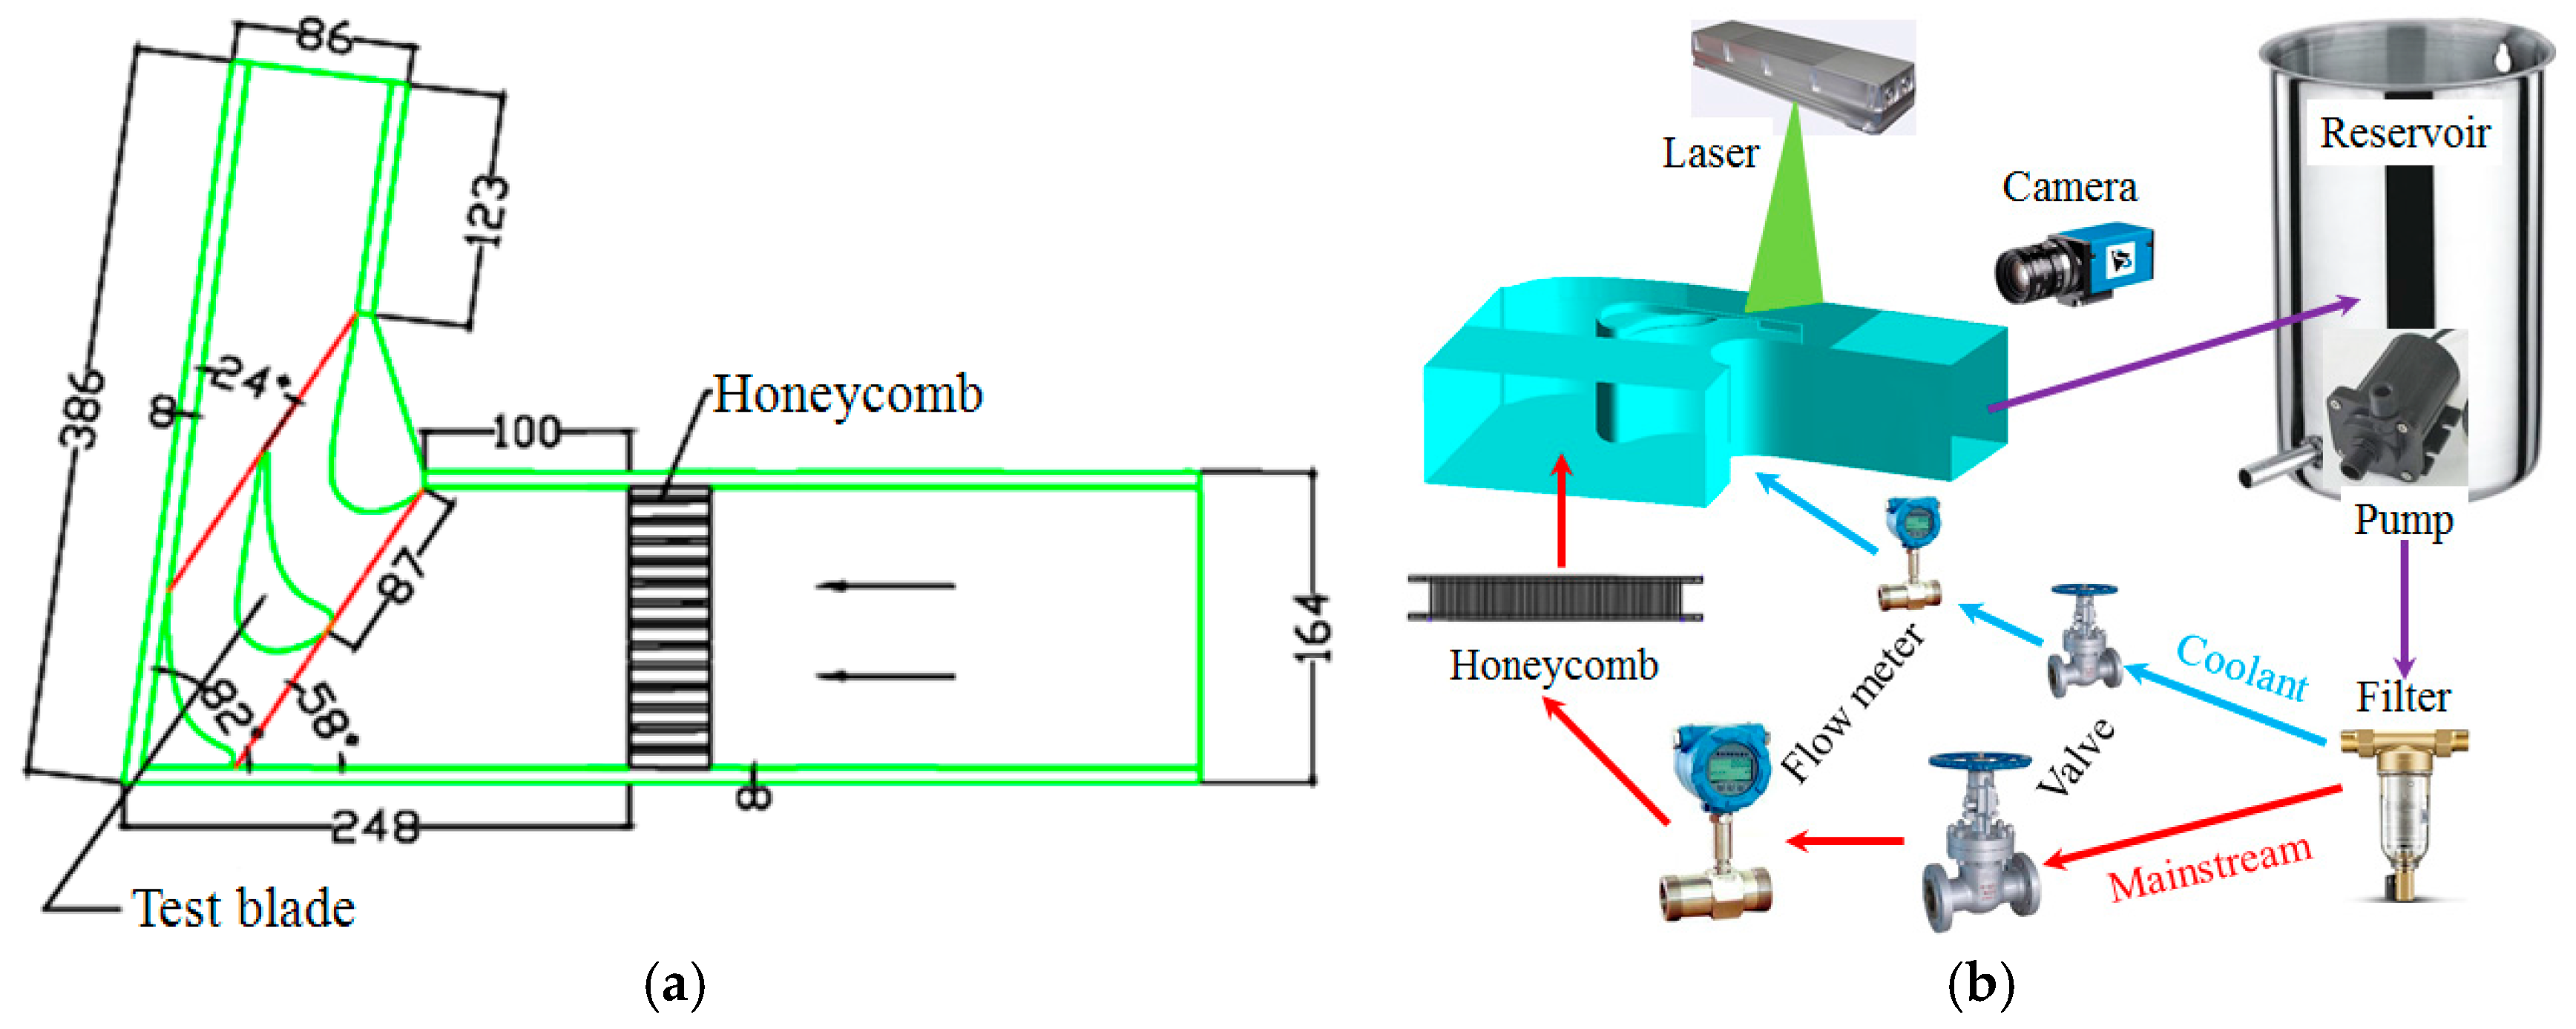
The experiment was performed in a three-bladed stationary linear cascade, which consisted of one fully profiled and two semi-profiled blade models. A schematic illustration of the test section is shown in
Figure 3, and the experimental conditions are summarized in
Table 1. The inlet section, test section and exit section were made of Plexiglas with a thickness of 8 mm to ensure good transparency. The mainstream region was extended upwards and downwards from the leading edge and trailing edge, respectively.
Filtered water was used as a mainstream and coolant, and injected from a reservoir by a diving pump. The inlet velocities of the mainstream and coolant were controlled by two valves and two turbine flow meters. To assure spatially uniform and undisturbed inlet flow, a square-hole honeycomb with 65% porosity and 40 mm length was set into the developing zone. The discharged water flowed back into the reservoir to recycle.
2.3. Particle Image Velocimetry Measurements
The experiments were carried out at ambient temperature and pressure. The characteristics of the tip leakage flow were captured at two cross sections (cuts one and two) by PIV, which are marked in
Figure 2. The tracer particles used in the PIV measurement were hollow glass spheres with an average diameter of 10 µm, and the density ratio of the spheres to water was 1.05. The illumination was provided by a double-cavity Gemini Nd:Yag pulsed laser, and its pulse energy was 200 mJ/pulse. The pulse delay between two laser pulses was set to 3 ms in this experiment. A HiSense 1024 × 768 pixels CCD camera was perpendicularly positioned to the light sheet. The size of an interrogation area was 32 × 32 pixels with 50% overlap. The images captured by the camera were processed into vector maps by the software Dantec Flowmap 1500.
2.4 Measurement Uncertainty
The time-mean velocities at each point in a measured plane were calculated by a sequence of 300 instantaneous PIV vector maps in this experiment. For each velocity measurement, the bias uncertainty was caused by the camera calibration (M = L0/L1), time interval of recording (∆t) and particle displacement vector (∆s) detection. Here L0 is the size of the real object plane (in units of mm), and L1 means the pixel number in digital images.
In this experiment, the bias uncertainties were L0, L1, and ∆t are 0.0001 m, 0.15 pixels, and 0.0000001 s, respectively. According to error transfer formula, the absolute values of relative errors of the mean velocities were less than 2%.
3. Theoretical Analysis and Numerical Approach
The fluid flow behavior of mainstream, leakage and cooling air in the gas turbine rotor can be described by compressible Reynolds-averaged Navier–Stokes (RANS) equations:
where Kronecker delta
δij = 1 if
i =
j and
δij = 0 if
i ≠
j. In the experiments, water was employed, which can be regarded as an incompressible fluid, therefore, the equations can be written in a more concise form:
The commercial CFD software ANSYS CFX 14.0 was employed to solve the mathematical model described by the above equations. The entire computational domain had the same geometric structure and size as the experimental section shown in
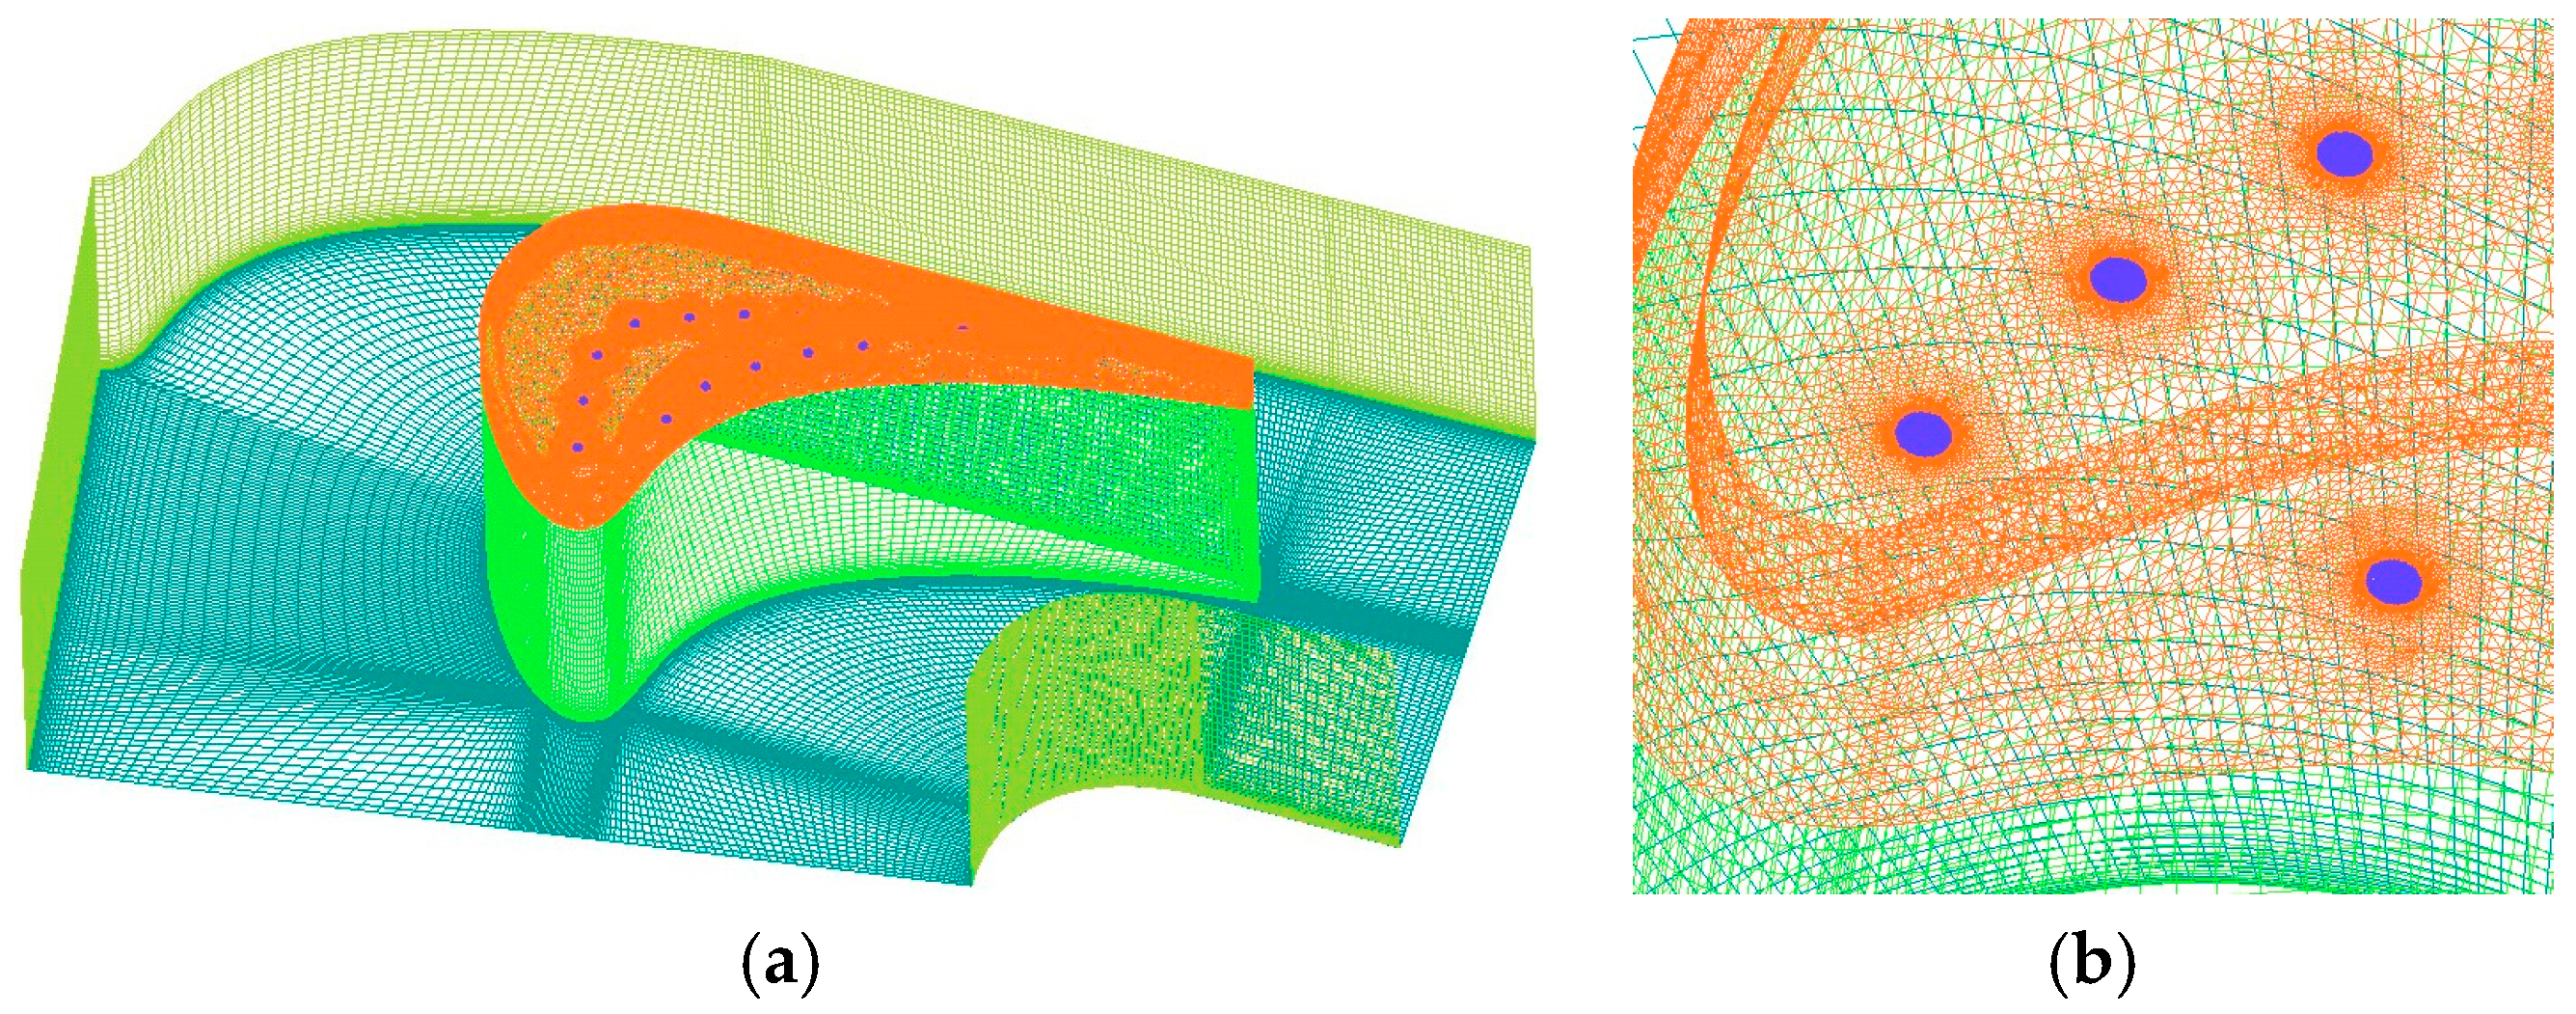
Figure 3, and was discretized with a finite control volume method. Using the commercial grid generation program ANSYS ICEMCFD 14.0, the mainstream region was filled with hexahedral mesh, while the tip region was filled with tetrahedral mesh. The hybrid grid consisted of both prisms and tetrahedral cells were used around the solid boundaries. The grid spacing was refined, so that the maximal value of the dimensionless distance, y+, was less than one for the first nodes away from walls.
Figure 4 shows the meshes assigned in the computation domain.
Simulations were conducted by RNG k-ε turbulence model under the same conditions as the experiment. The wall function was set to be scalable. Water was chosen as the fluid material. The boundary conditions at all walls of the passage (including shroud, hub and the blade surfaces) were set to be no slip wall.
The grid independence of the numerical results was validated by testing five different meshes, as shown in
Table 2. The numerical results of the tip leakage mass flow rate were compared, and finally the mesh with 5.96 million cells was employed in the following numerical simulations. The max relative deviation of the tip leakage mass flow was less than 0.13%. The convergence of the simulations was judged on residual histories, and the convergence criterion was 10
−5. This convergence criterion ensured that the average numerical uncertainty of velocities was less than 0.1%.
5. Discussion of Results for BSSS, BSSM, and BRSS
As shown in
Figure 1, the experimental methods used in the previous investigations of the tip leakage flow can be classified into three groups, according to the movement type of the blade and the shroud: (1) BSSS (the blade is stationary and the shroud is also stationary); (2) BSSM (the blade is stationary but the shroud moves, to realize the same relative rotation); (3) BRSS (the blade has a rotation speed and the shroud is stationary). Using the validated numerical strategy, the characteristics of mainstream, cooling air and tip leakage are simulated with the real structure and size of a GE-E
3 rotor in the three cases. The simulations are conducted at ambient temperature and pressure. The tip gap is 0.4 mm (1.2% of the blade chord), and the radius of the shroud circle r is 300 mm. The mainstream and cooling air are deemed to be an ideal gas. The mean velocity of the mainstream at the inlet is 60 m/s, and the corresponding Reynolds number is 3.89 × 10
5, based on the blade chord.
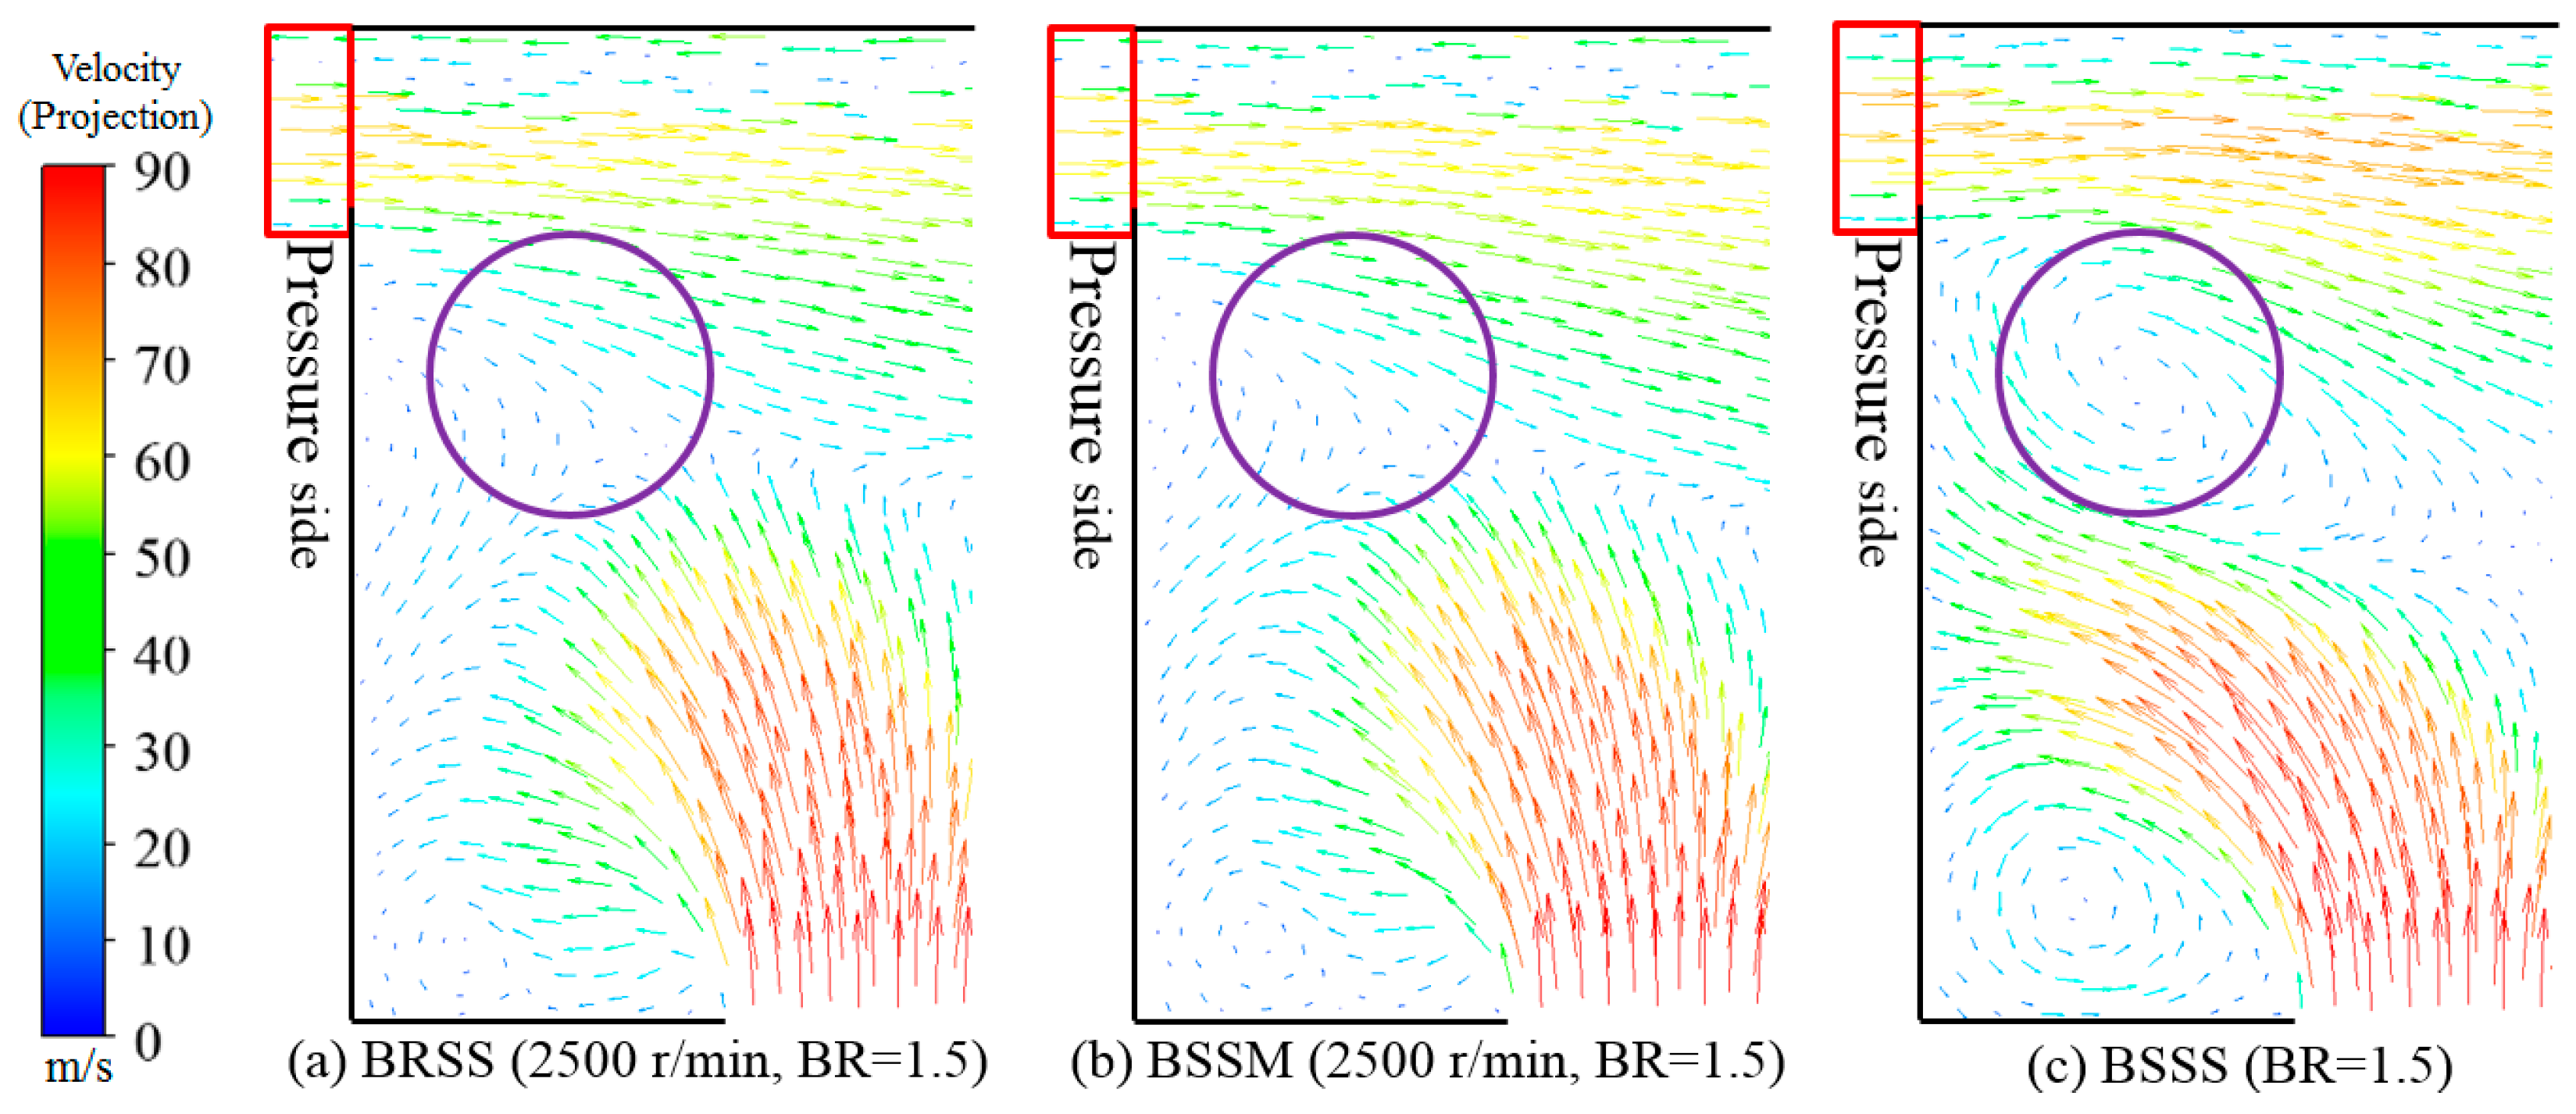
5.1. Comparisons of the Tip Leakage Flow Field in Three Cases
Figure 6 exhibits the tip leakage flow field on the cross sections of cuts 3 and 4 in the three cases at a blowing ratio of BR = 1.5. The length and arrow of the vectors in
Figure 6 represent the value and direction of local velocities, respectively. In the BRSS case, the rotation speed of the blade
ω is 2500 r/min, and in the BSSM case, a corresponding reverse velocity of the shroud is set. For the convenience of comparing the tip leakage behavior, the blade is regarded as the reference system.
As shown in
Figure 6, both the trajectories of cooling air and tip leakage are clearly presented in the three cases, and the fluid velocities are relatively higher in the exits of the film hole and gap. BRSS corresponds to the real operating condition of the turbine rotor, and therefore can be regarded as the reference case here. Comparing
Figure 6a–c, the differences between the velocity distributions of tip leakage and cooling air can be obviously observed. In
Figure 6c, there are two vortices, one is counter-clockwise and the other is clockwise, but in
Figure 6a,b, no complete vortices can be observed. In addition, the averaged velocities passing through cut 4 in the BSSS case are higher than those in the BRSS and BSSM cases.
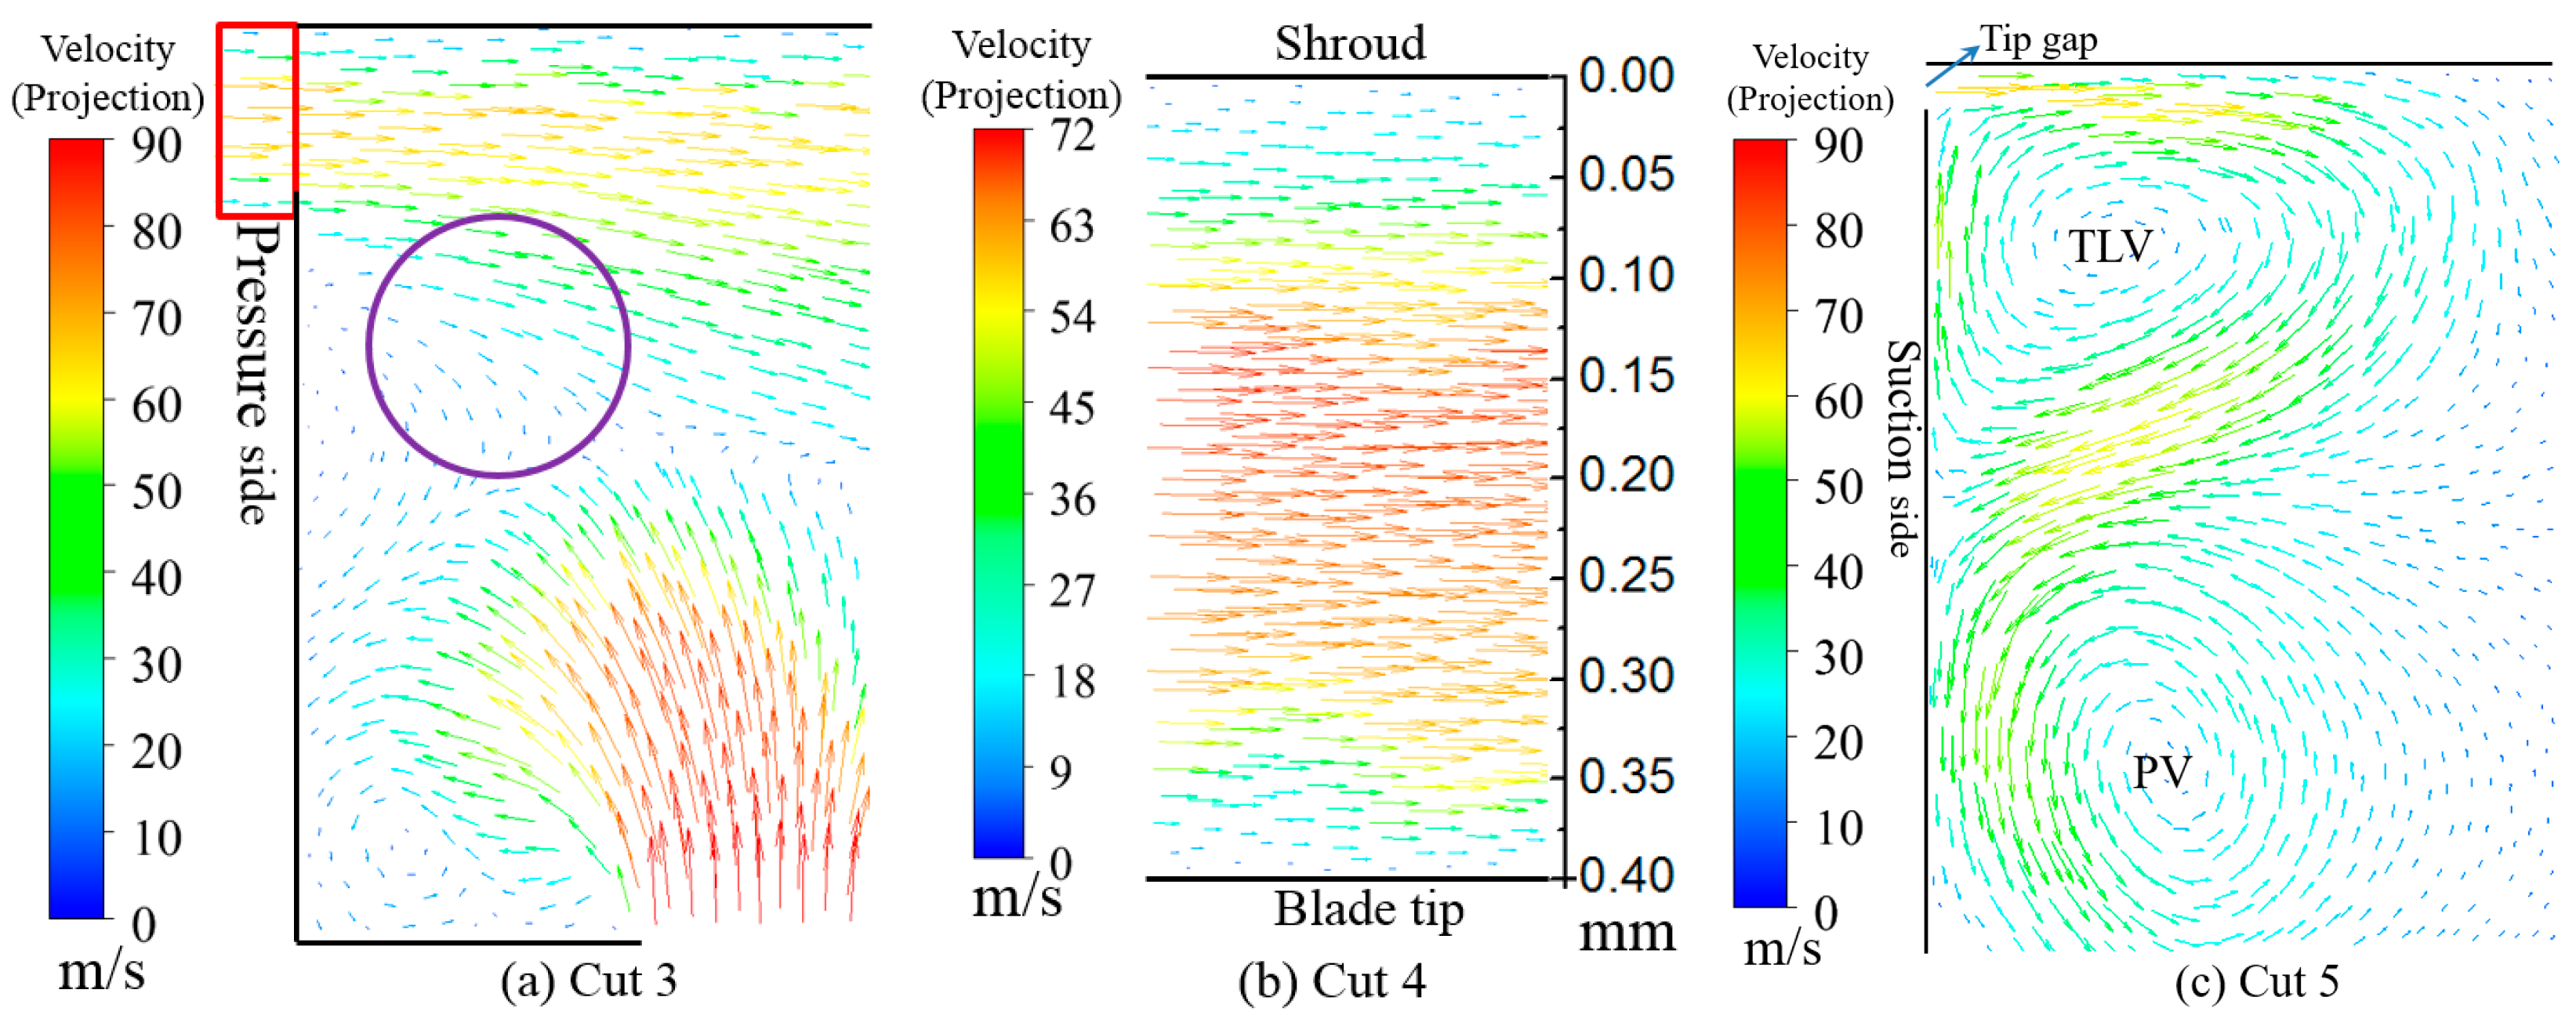
To clearly display the differences of tip leakage flow near the shroud region among the three cases, the velocity field in cut 4, which corresponds to the red rectangle region in
Figure 6, is enlarged and presented in
Figure 7. As shown in
Figure 7, the tip leakage behaviors near the shroud in the BRSS and BSSM cases are identical, but both are different from that in the BSSS case. The main differences appear in the velocity field near the shroud wall, and the reason is that the blade and shroud move relatively in the BRSS and BSSM cases, while keeping stationary in the BSSS case.
The essential reason for the differences as discussed above is the viscous force of fluid.
Figure 8 illustrates the kinetic models of the three cases. In the BSSS case, the velocities of tip leakage flow relative to the blade tip and shroud are the same, so the viscous forces at the two surfaces are nearly the same. However, the velocities relative to the blade tip and shroud are
v and
ω r +
v, respectively, in the BRSS case, which results in a great difference in the viscous forces at the two surfaces. In the BSSM and BRSS cases there are similar velocity and viscous force distributions, and therefore the flow fields at the tip gap in the two cases are similar, but they are different from the BSSS case.
It is well known that the tip leakage flow results in a mainstream energy loss and an increase in the thermal load at the tip surface. In the real operating condition, the rotation rate is extremely high, so that the effect of the fluid viscous force at the tip gap cannot be ignored. This means that the errors caused by BSSS simplification cannot be eliminated. BRSS corresponds to the real operating condition of the gas turbine rotor, and BSSM can provide a similar velocity field to BRSS, in which the fluid fields obtained by the experiments can reflect the true situation. However the experimental methods of BRSS and BSSM are extremely expensive, and therefore the BSSS method is usually employed for economic reasons.
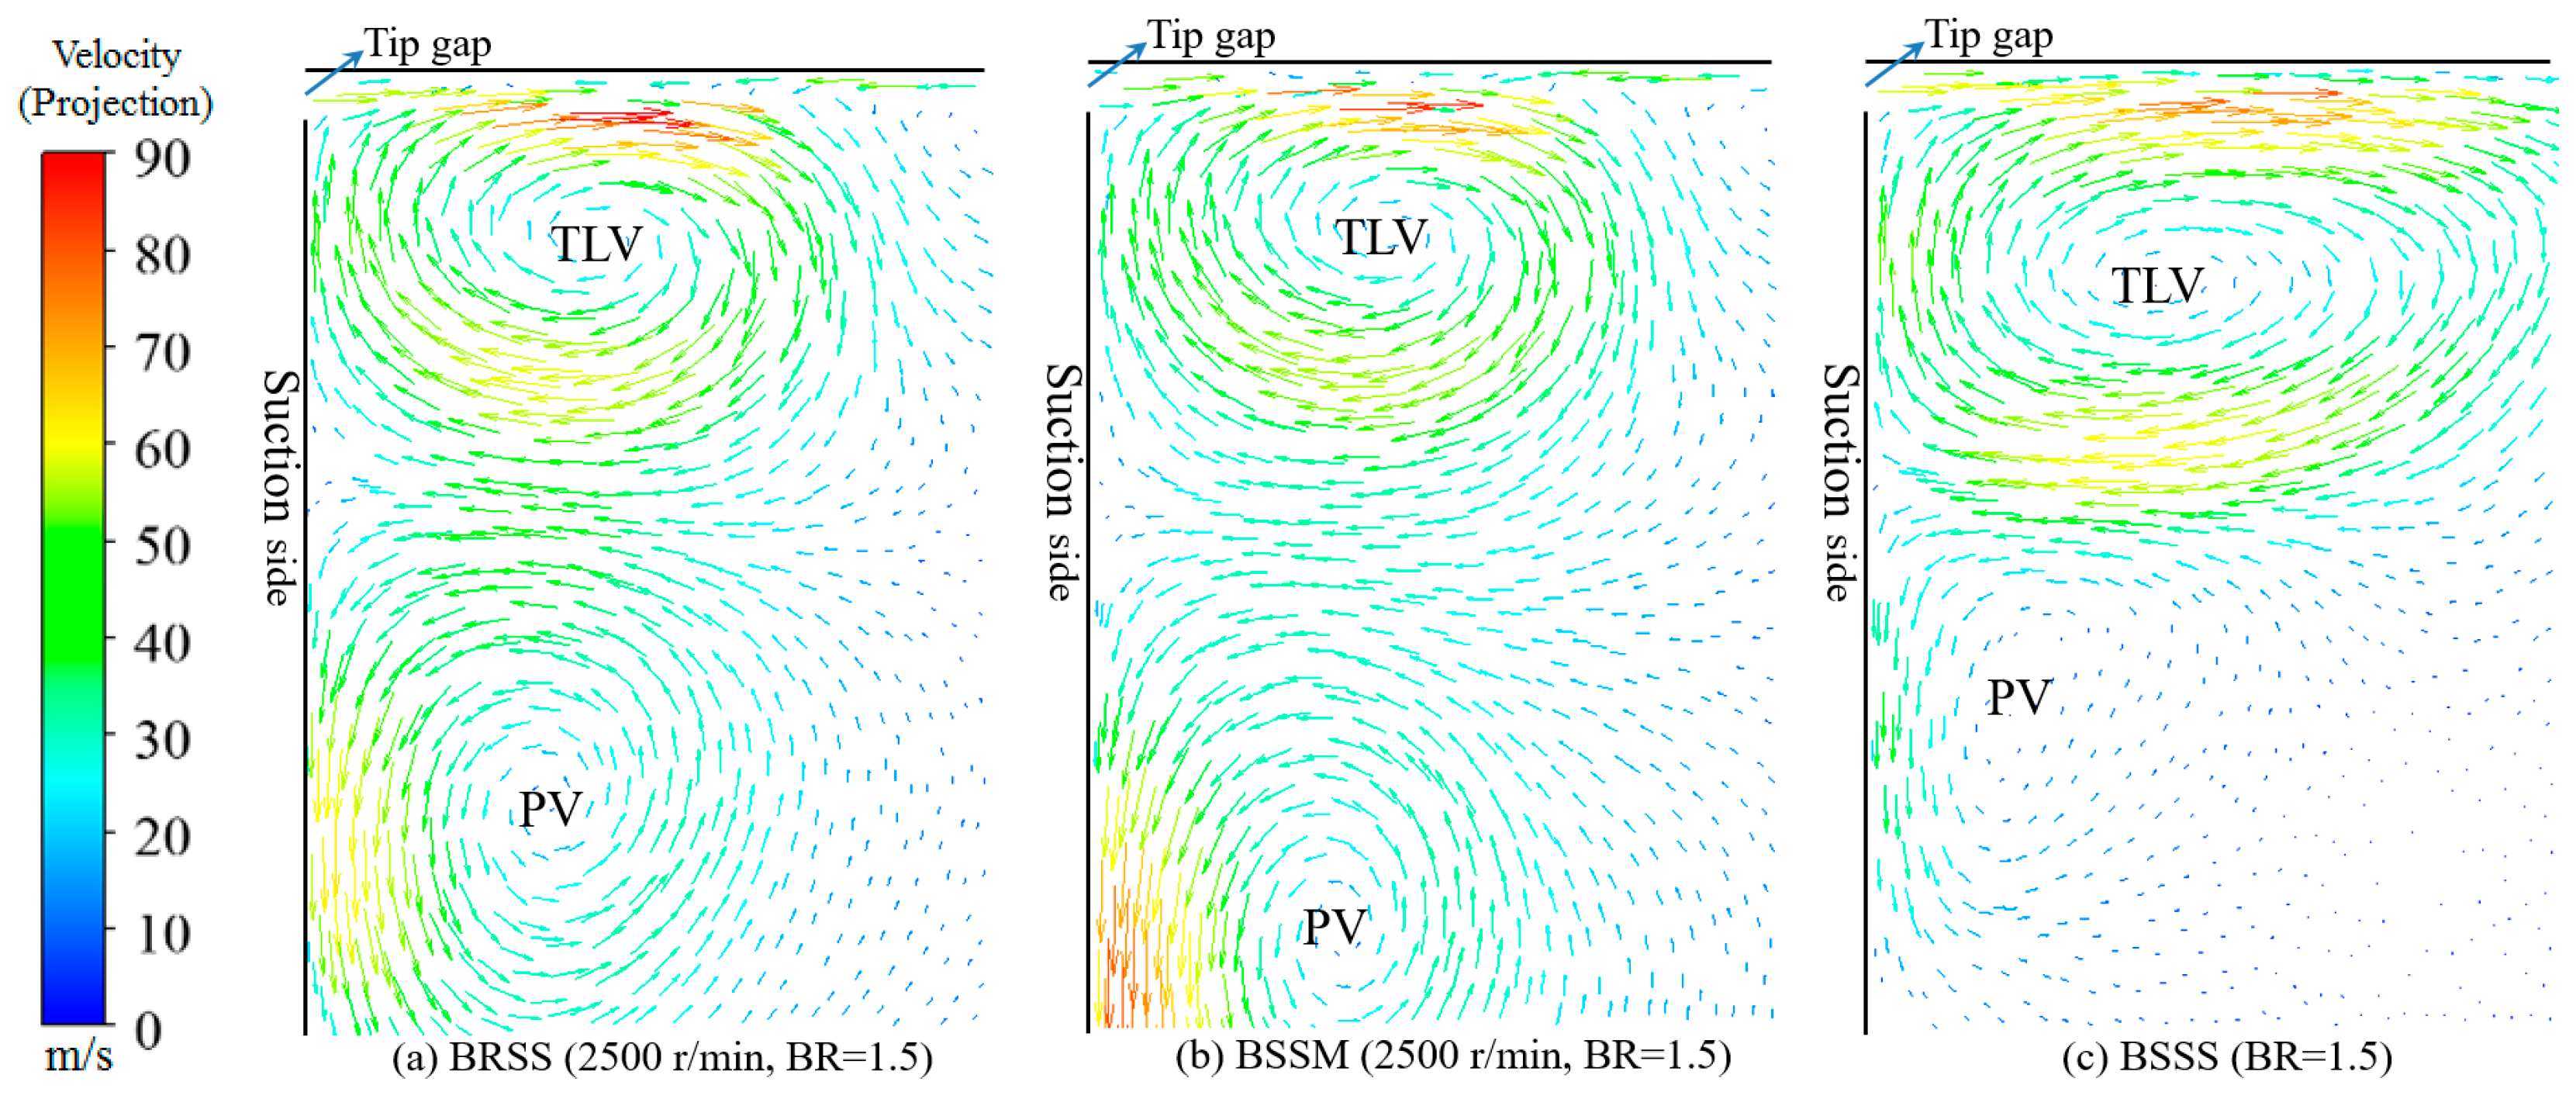
5.2. Comparisons of the Passage Flow Field in the Three Cases
Tip leakage flow usually leads to tip leakage vortex (TLV) and passage vortex (PV), which will reduce the safety and efficiency of the gas turbine rotor. Therefore, the characteristics of TLV and PV were considered.
Figure 9 illustrates the velocity distributions on cut 5 in the three cases.
According to the
Figure 9, the shapes, sizes and locations of TLV and PV in the BSSM and BRSS cases are similar, but different from that in the BSSS case.
5.3. Comparisons of the Tip Leakage Mass Flow Rate in the Three Cases
The tip leakage mass flow rate is an important factor influencing turbine efficiency. To compare quantitatively the tip leakage mass flow in the three cases, a series of simulations were carried out at the rotation speeds of 1000, 2500, 4000 r/min. The numerical results of the mass flow rate and the deviations of BSSS and BSSM from BRSS are listed in
Table 3. From
Table 3, the following three interesting conclusions can be drawn: (1) Regardless of the rotation rate, the tip leakage mass flow rate in BSSS was higher, while the BSSM cases were lower than the BRSS case; (2) The deviations of the BSSS and BSSM cases from the BRSS case both increased when the rotation rate increased; (3) The experimental data for BSSM was better than that for BSSS.
From
Table 3, one can find that the rotation rate is a critical factor, which may lead to different deviations of the tip leakage mass flow rate in three cases.
Figure 10 shows the velocity field of the tip leakage flow on cut 4 in the BRSS case at the rotation speeds 1000, 2500 and 4000 r/min, and the corresponding velocities of the shroud are 31.4, 78.5 and 125.7 m/s, respectively. From this figure, it can be observed that the velocity of the tip leakage flow near the shroud increases with the rotation rate. As a consequence, the viscous force of the fluid at the tip gap increases and the boundary layer becomes thicker. Therefore the average velocity of the tip flow decreases and the tip leakage mass flow rate passing through the tip gap reduces.
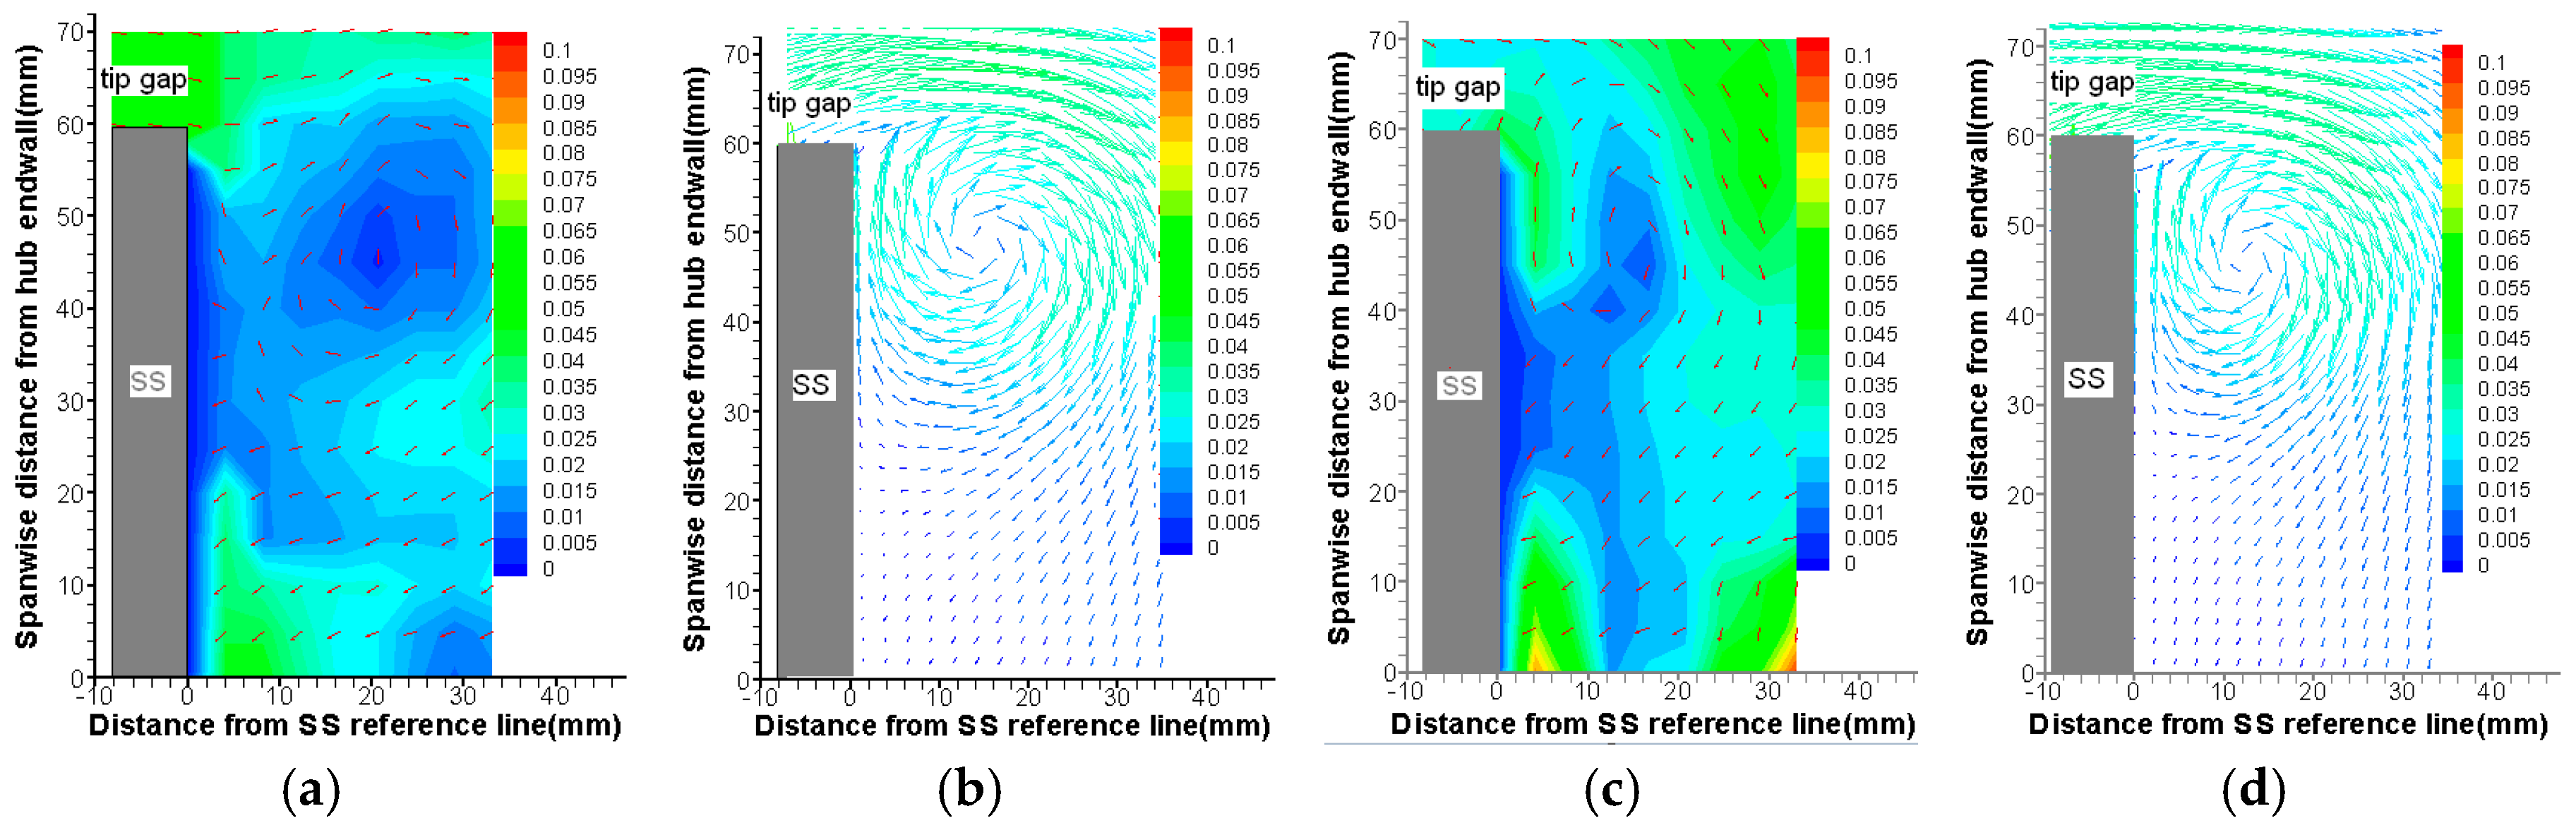
5.4. Revision of the BSSS Case via the Shroud Wall Viscous Shear Stress
Although the BSSS experiment method has been widely used due to its easy, economical and effective performance, the velocities of the tip leakage flow in the BRSS and BSSS cases are different, and the reason is that the viscous shear stresses at the shroud wall are not identical. To reduce the deviation of the BSSS experiment from the BRSS experiment, a simple method is proposed here, which is based on correcting the shroud wall viscosity in the BSSS case. When we add a parameter of equivalent sand-grain roughness of
hs = 0.04 mm into the shroud surface of BSSS, we can obtain the velocity vectors maps on cuts 3, 4 and 5, which are similar to the case for BRSS, as shown in
Figure 11. Of course, the roughness parameter is adjusted and dependent on rotation speed. However, the velocity of the tip leakage flow is not the same value at the tip gap, and therefore the viscosity at the shroud is different at different locations, so how to choose a suitable shroud surface roughness deserves to be further studied.
Comparing
Figure 11a–c with
Figure 6a,
Figure 7a and
Figure 9a, it can be found that the BSSS case with a rough shroud surface is very similar to the BRSS case, including the tip leakage flow in the gap, and the mainstream, TLV and PV in the passage. The tip leakage mass flow rate decreased from 1.0343 g/s to 0.9939 g/s after revision, and the deviation of the BSSS case from the BRSS case is greatly reduced. Therefore, the surface roughness is an important parameter, when the BSSS experiment method is used to study the real gas turbine system, and a shroud with the appropriate roughness can improve the accuracy of experimental results significantly.


