Influences of Traction Load Shock on Artificial Partial Discharge Faults within Traction Transformer—Experimental Test for Pattern Recognition


Abstract
:1. Introduction
- The traction substation transformer usually works under an imbalanced load condition, which must withstand a high content of negative sequence current [1].
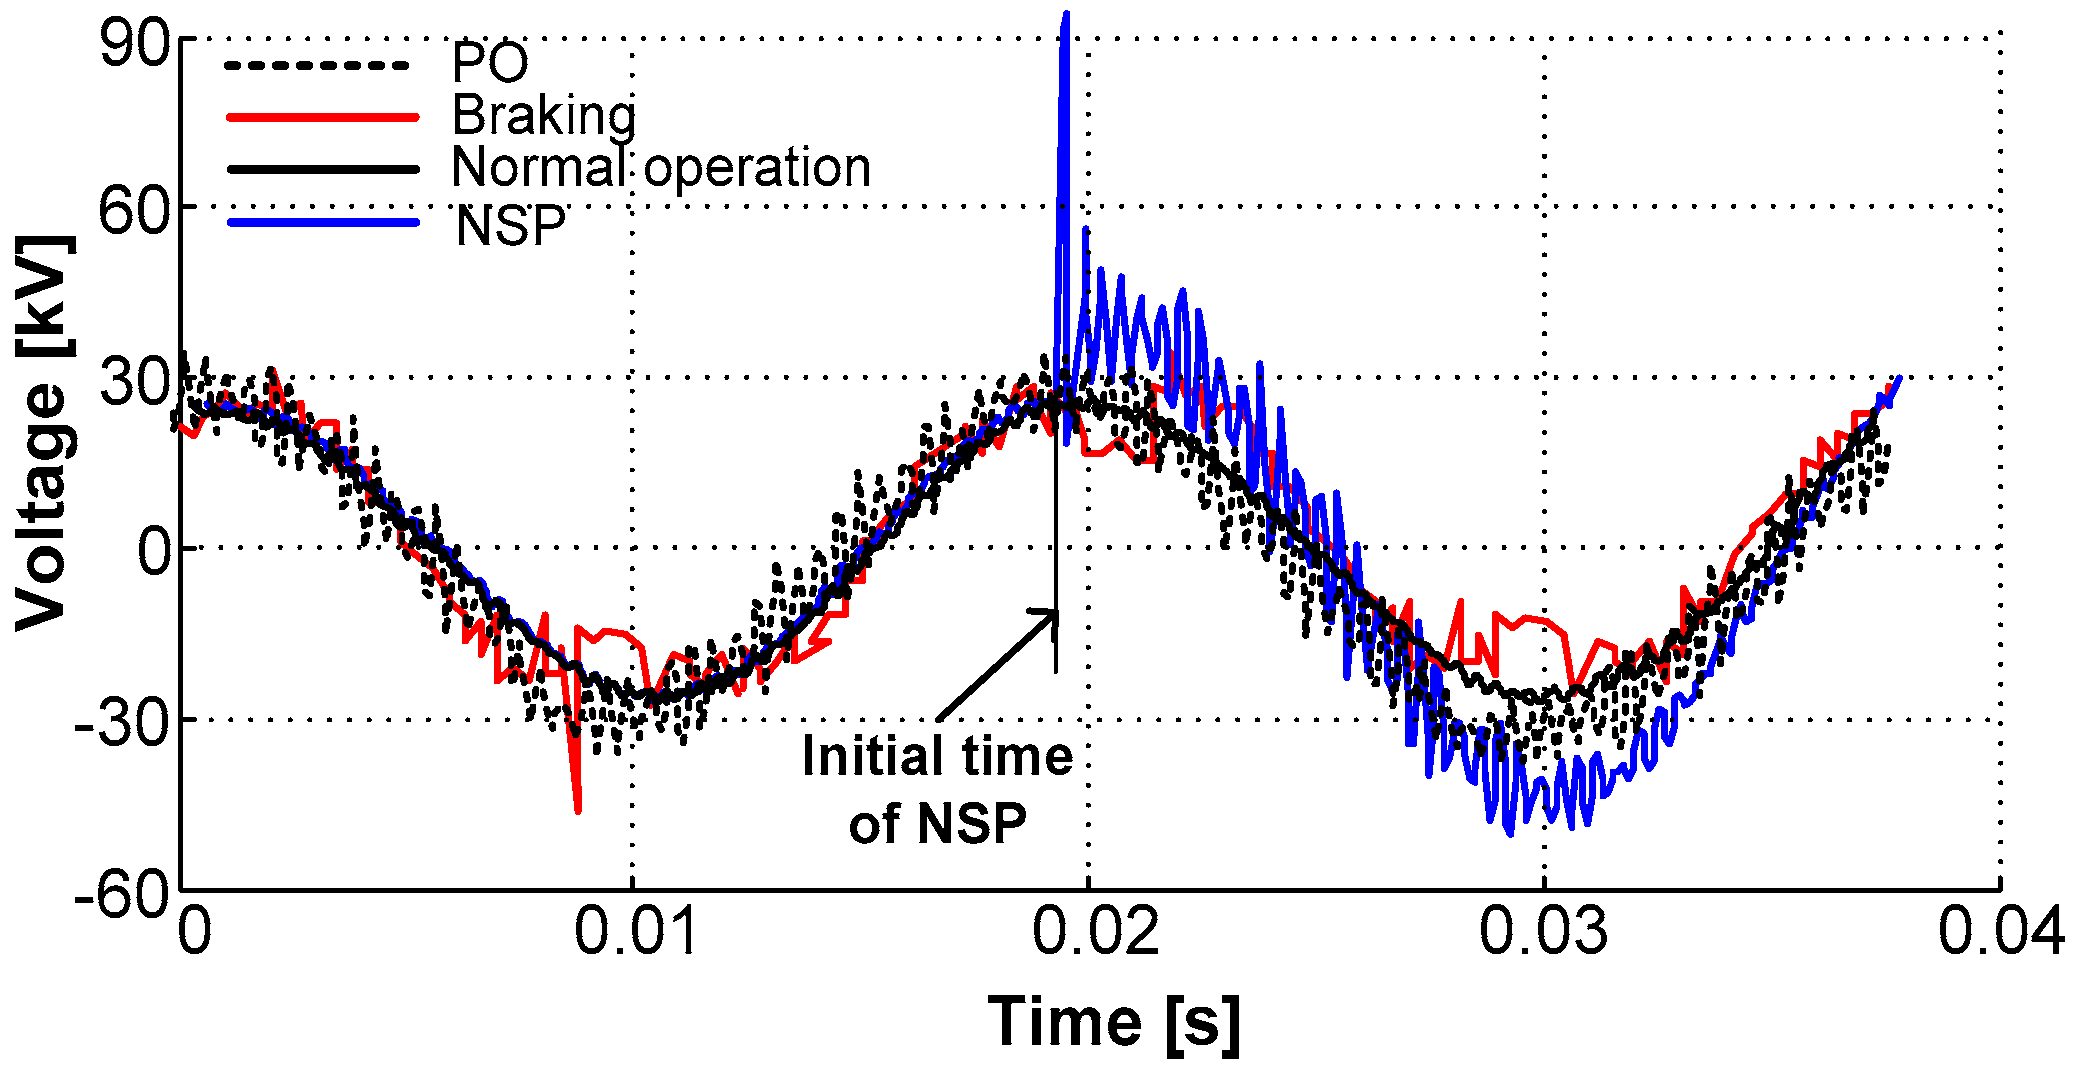
- During regenerative braking or neutral section passing of the train, transient overvoltages often occur. In the worst case, this will lead to a resonant overvoltage in the traction power supply and distribution system [6].
- PD due to bad grounding (metal-to-metal discharge) [13], and
2. Experimental Setup
2.1. Test Platform Configurations
2.1.1. High Voltage Generation Unit
2.1.2. PD Simulating System
2.1.3. The Measurements
2.2. Operating Principle of Test Platform
3. Measurements and Analysis
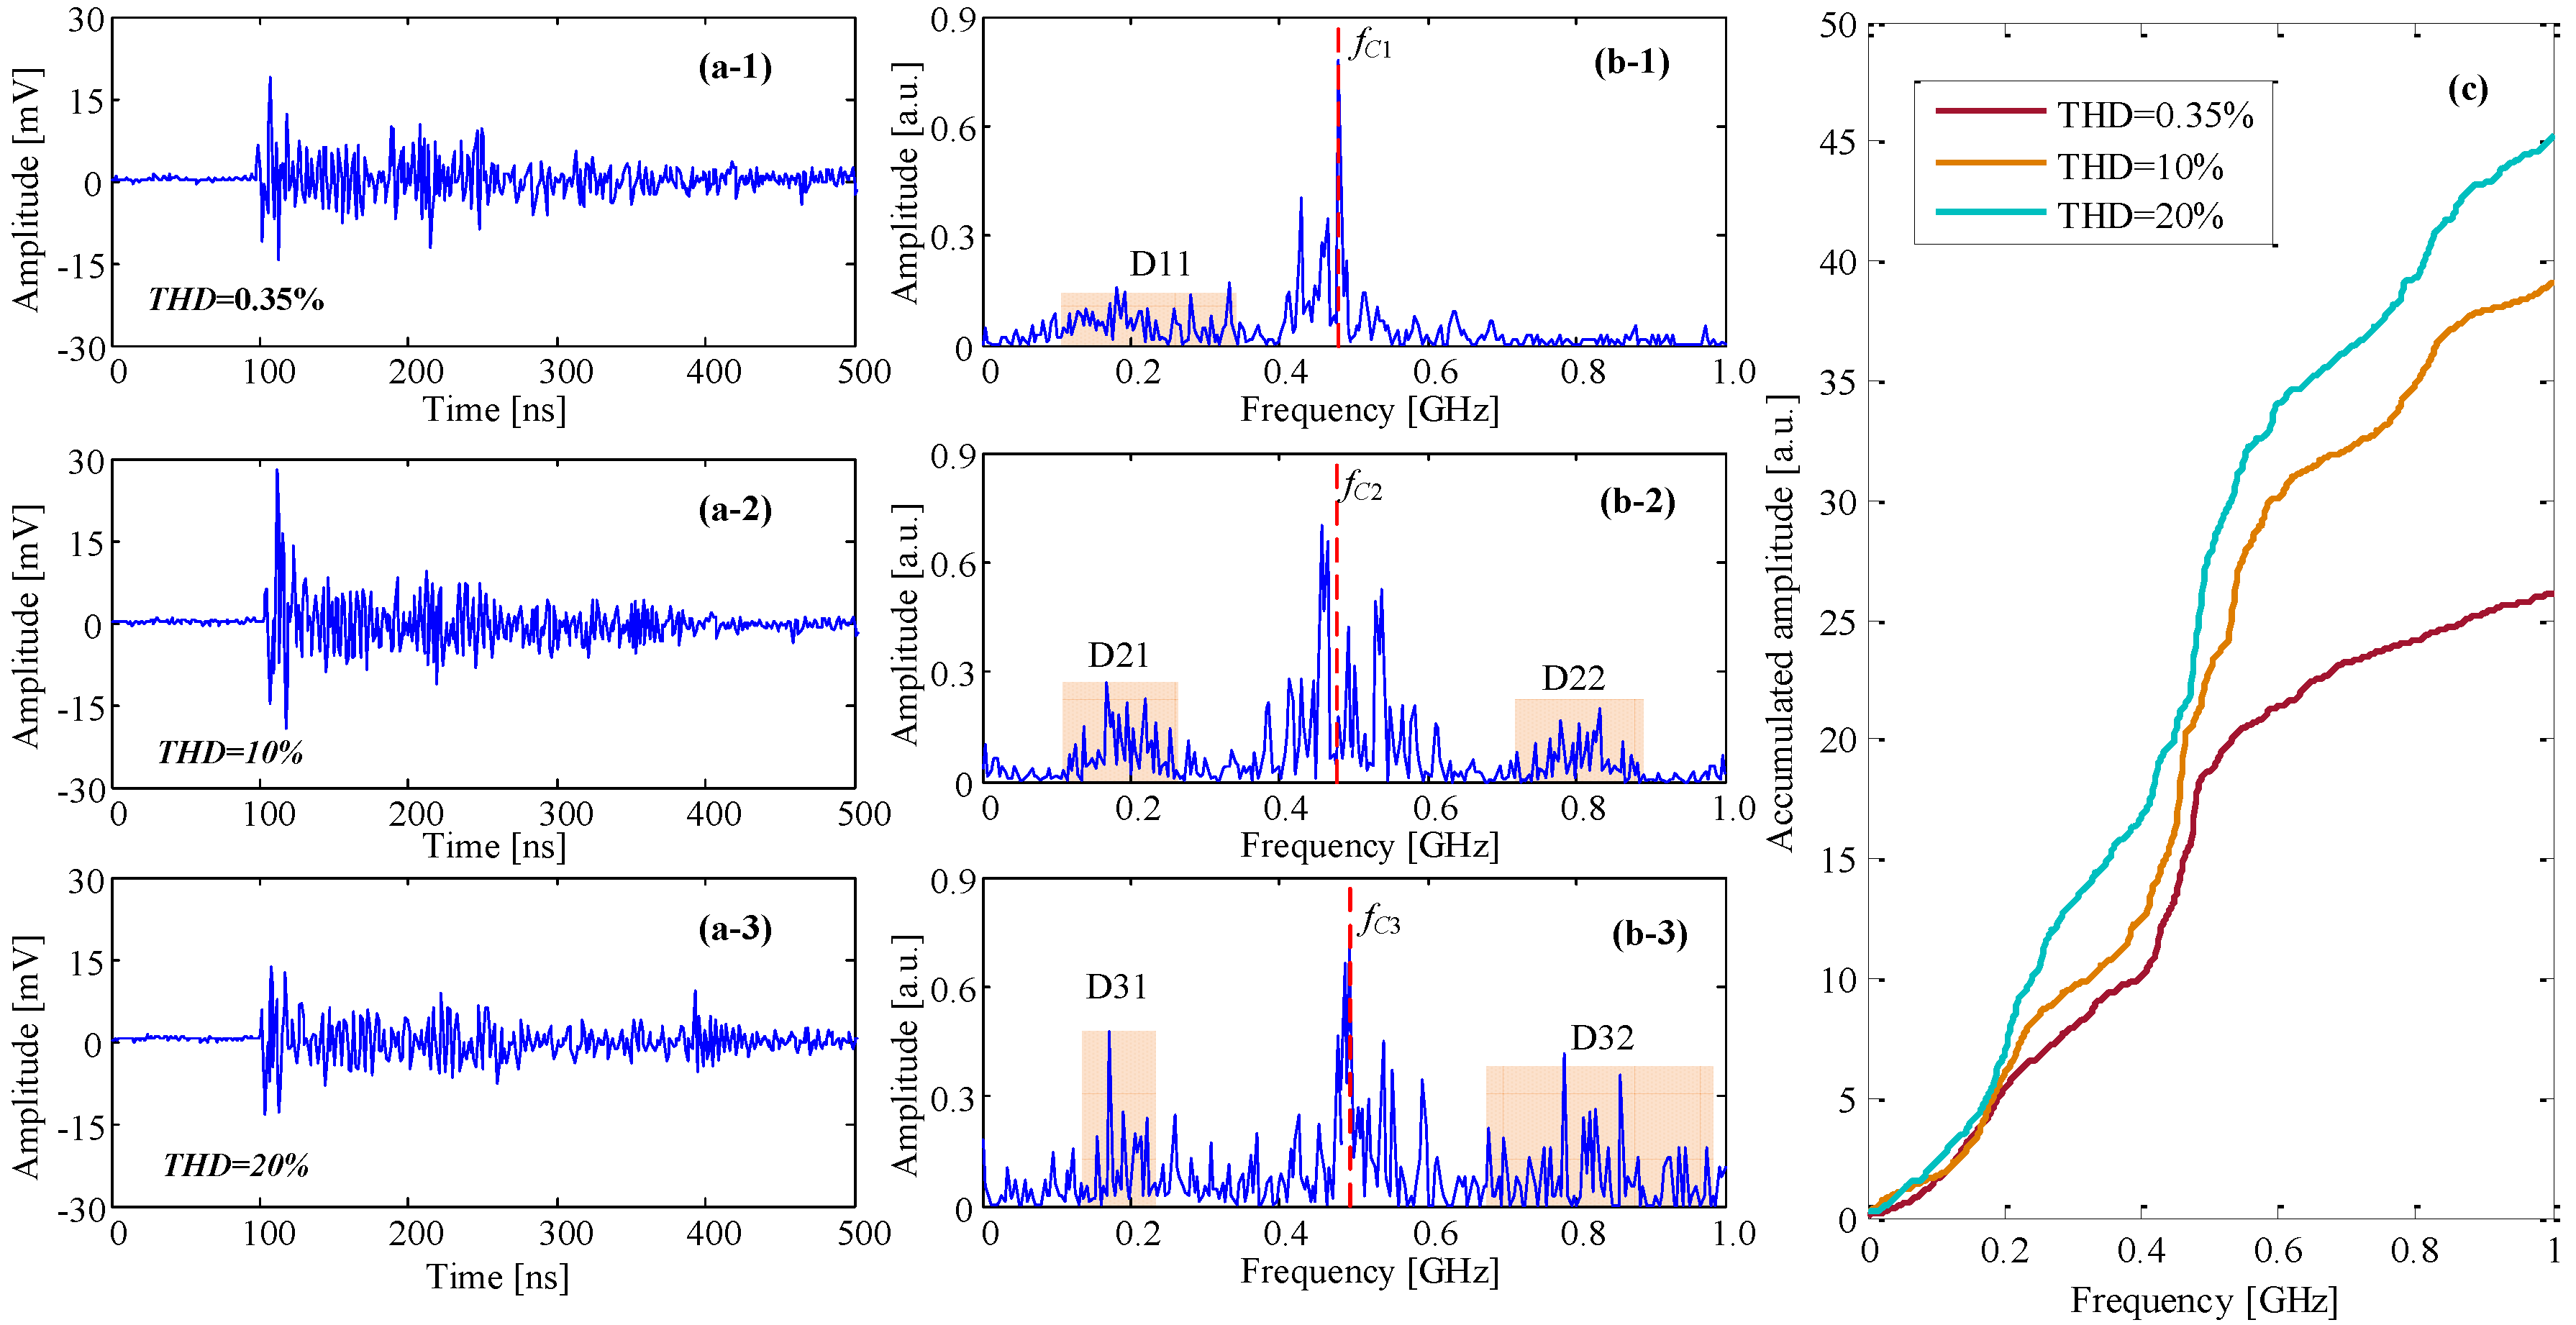
3.1. PD Test under Harmonic AC Voltages
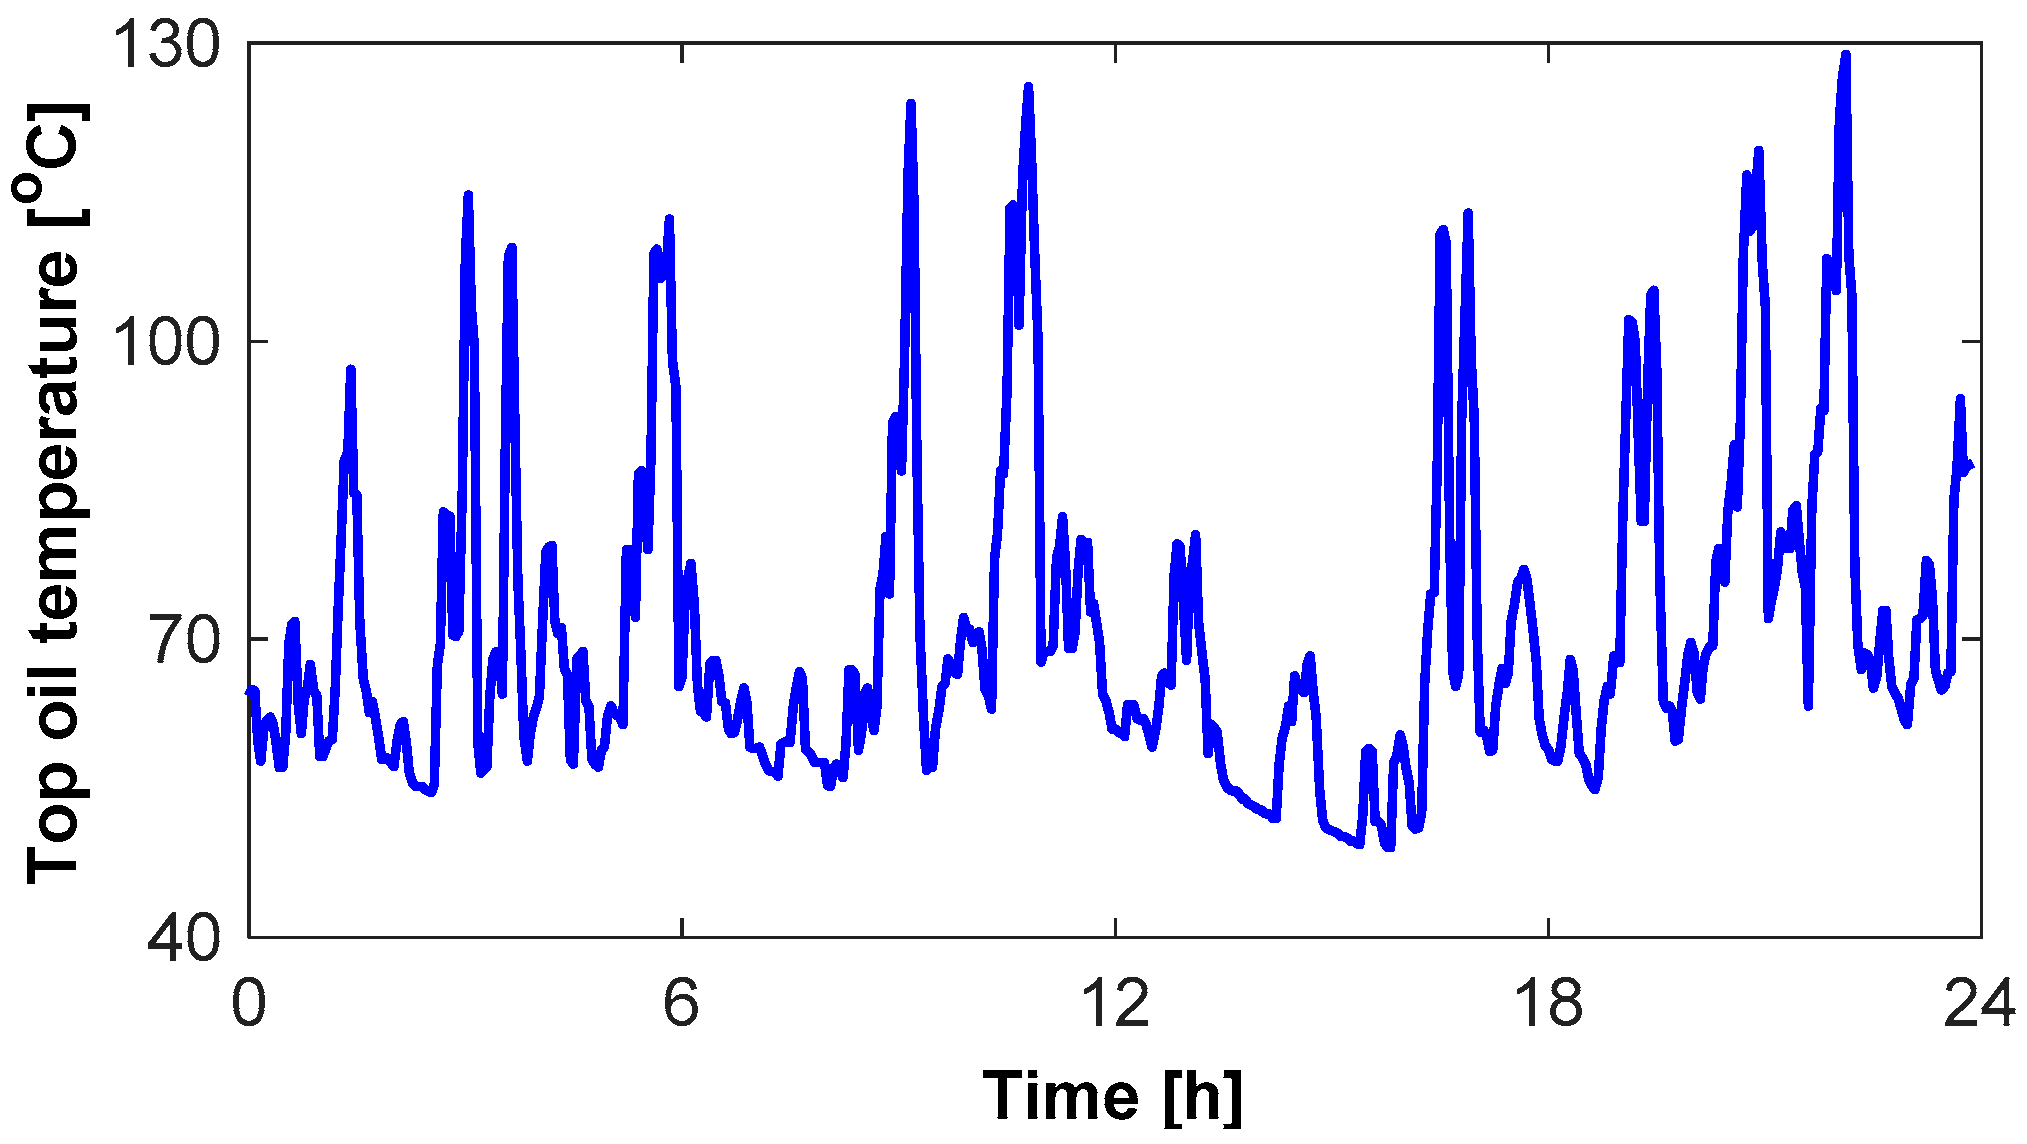
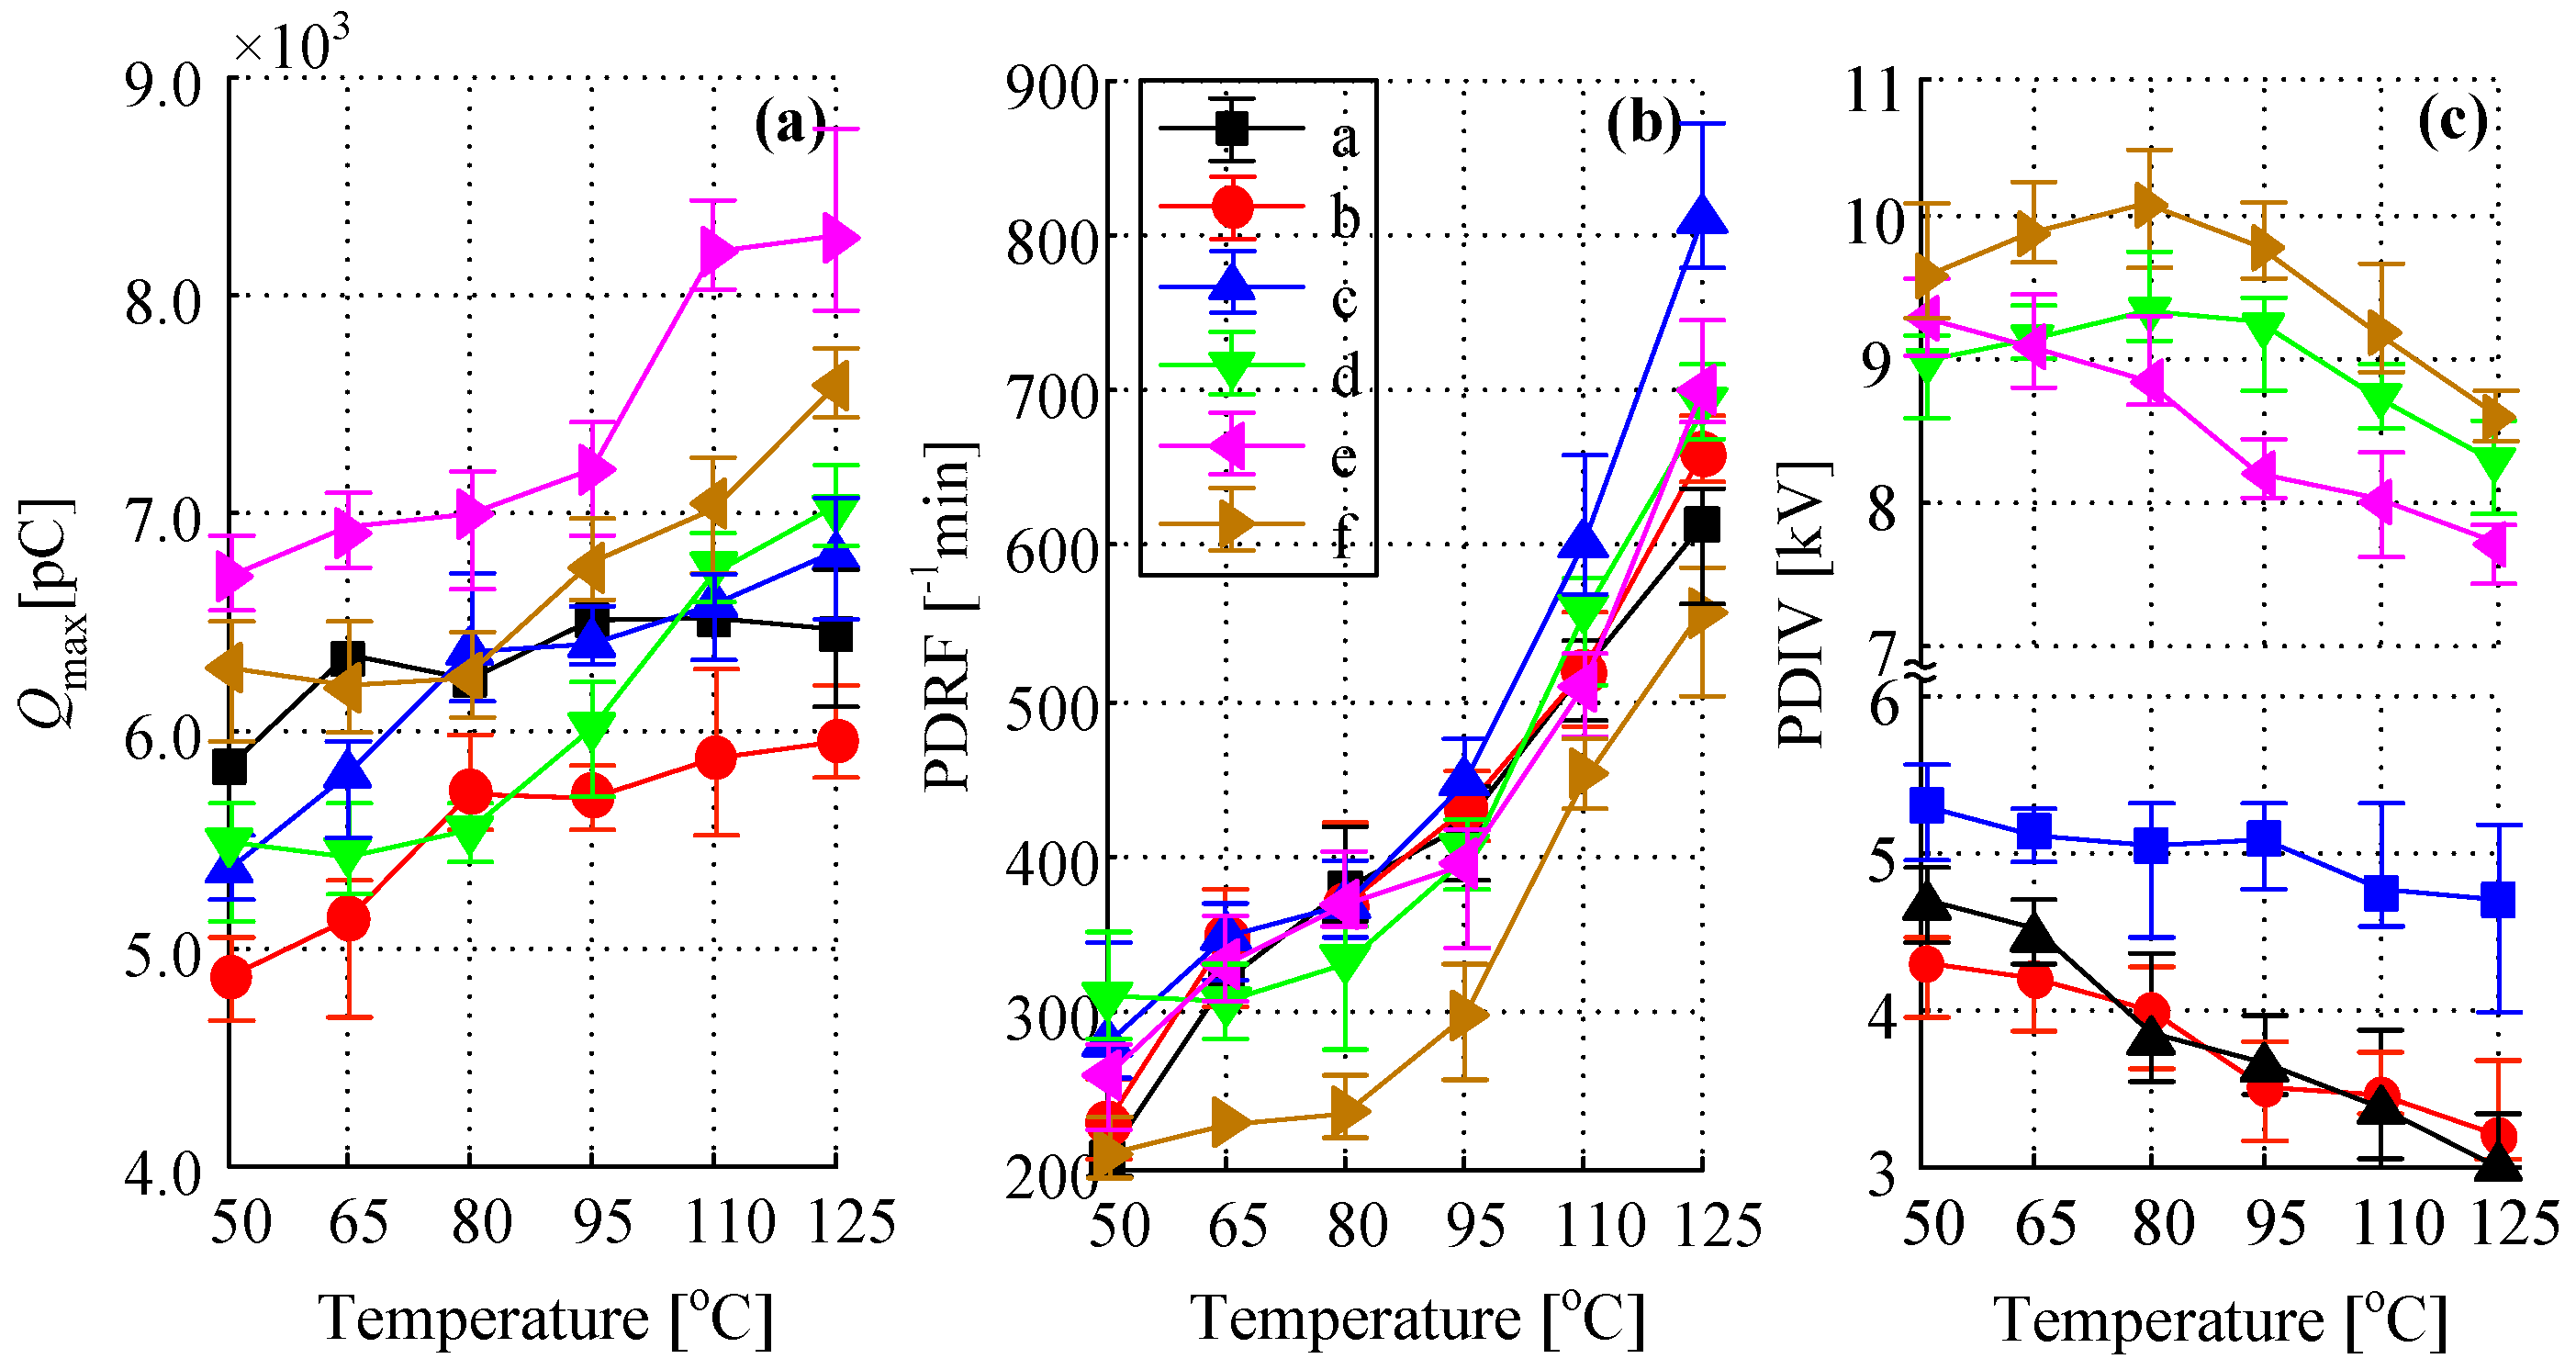
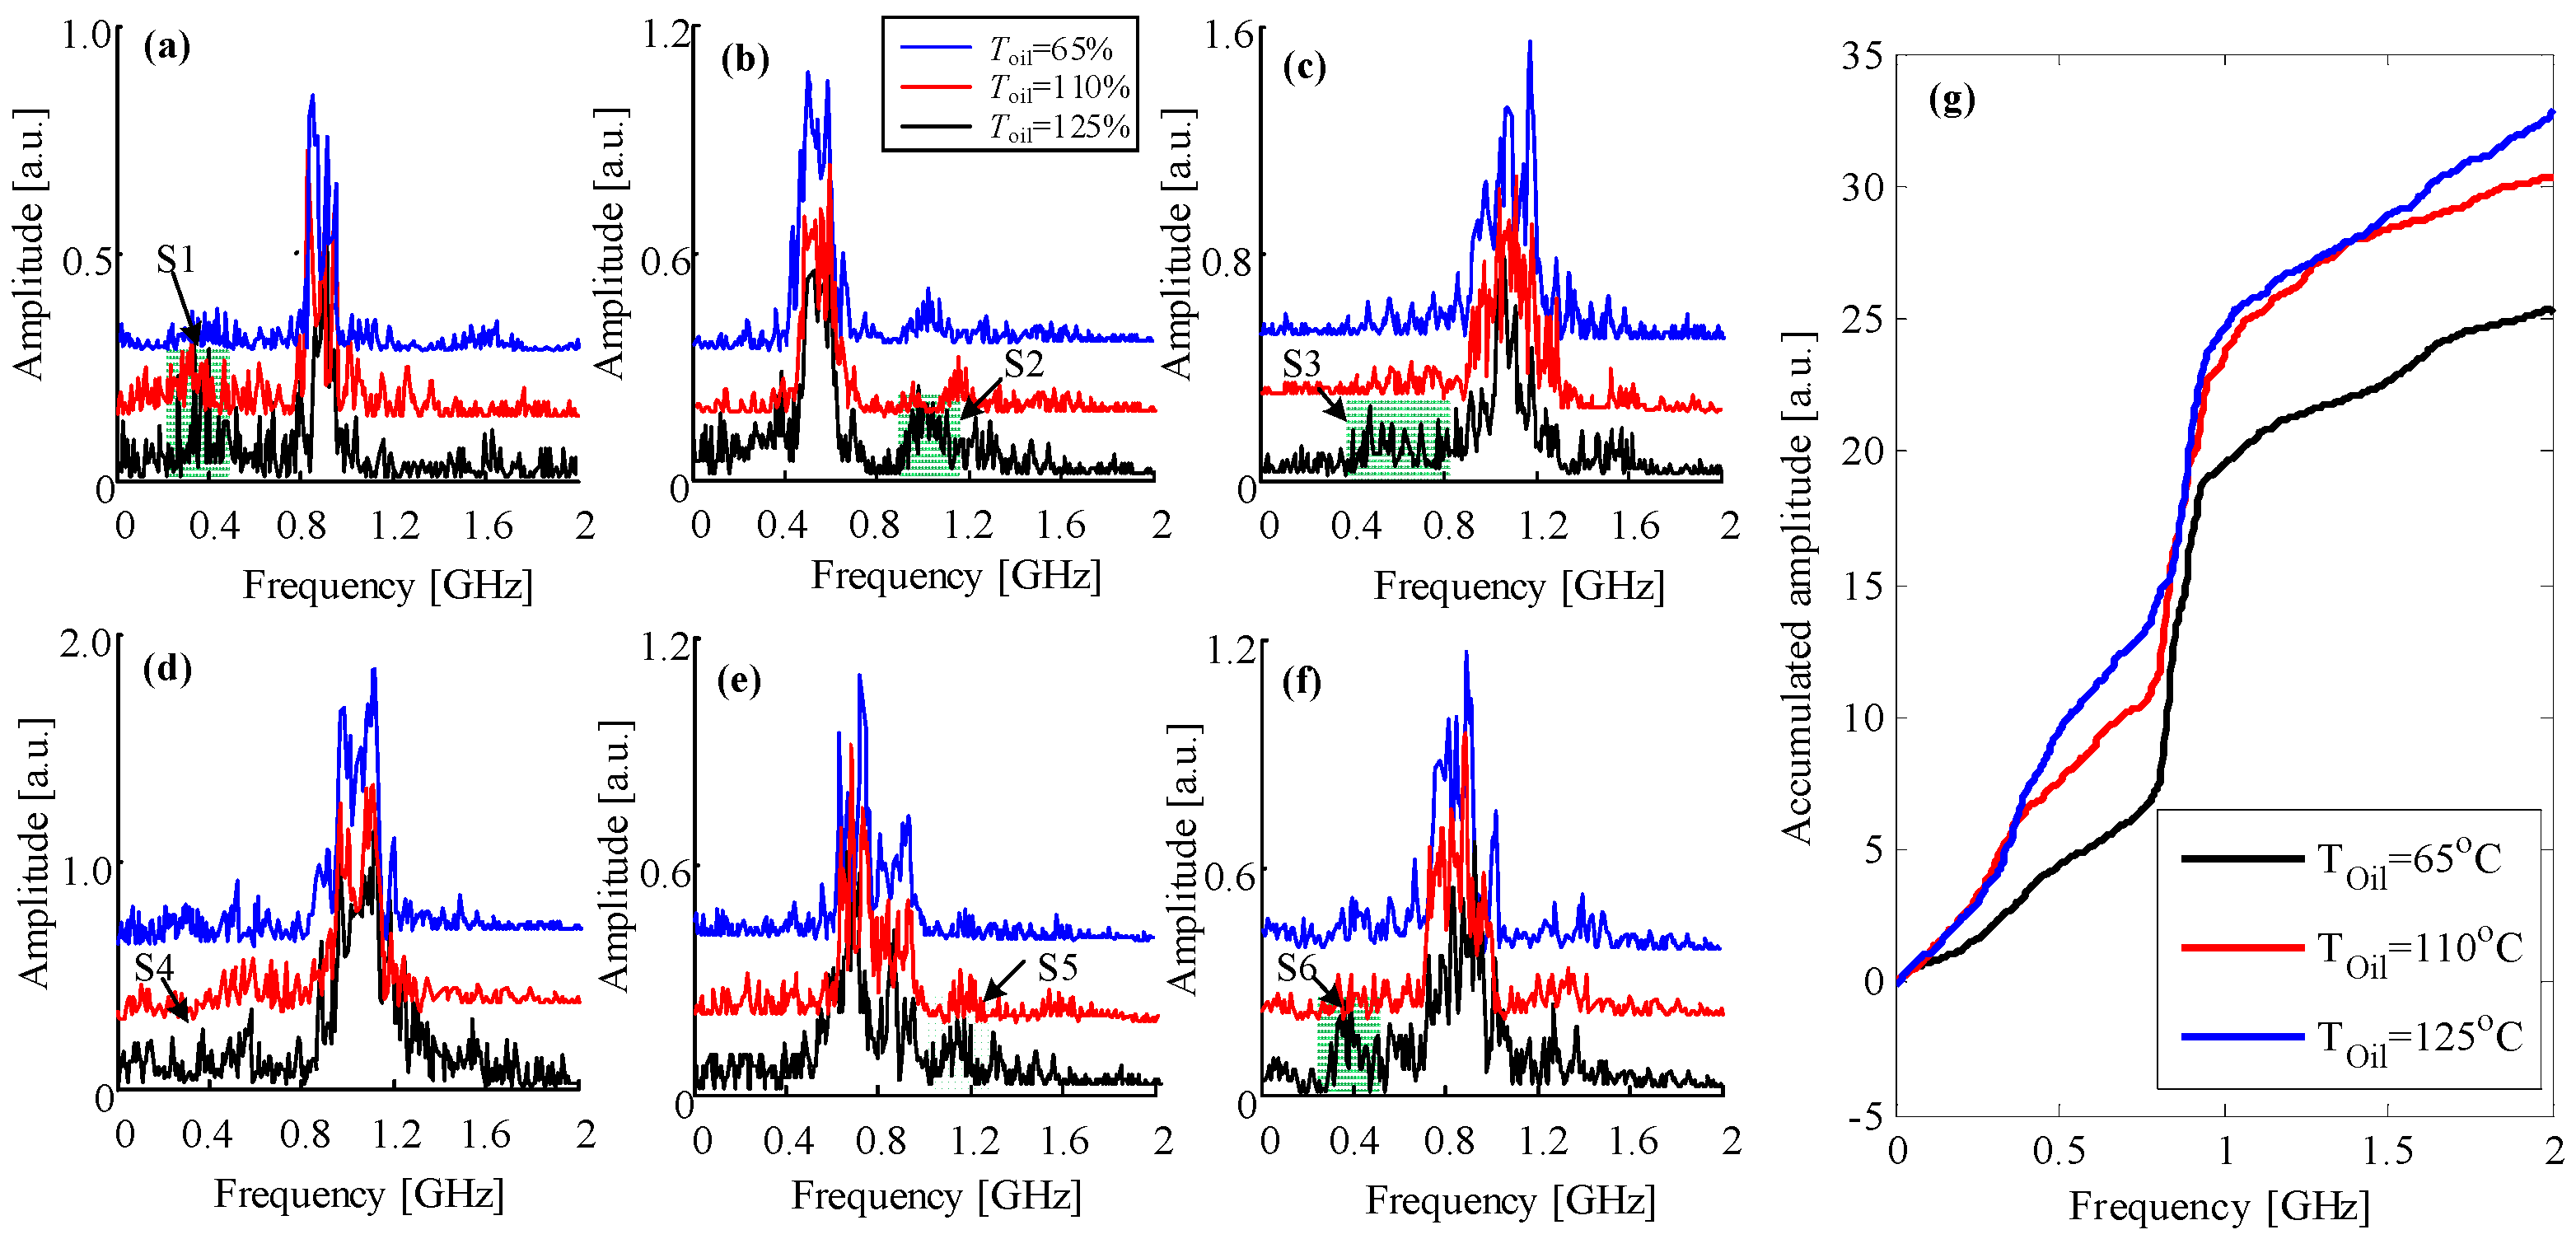
3.2. PD Test under Variable Temperature
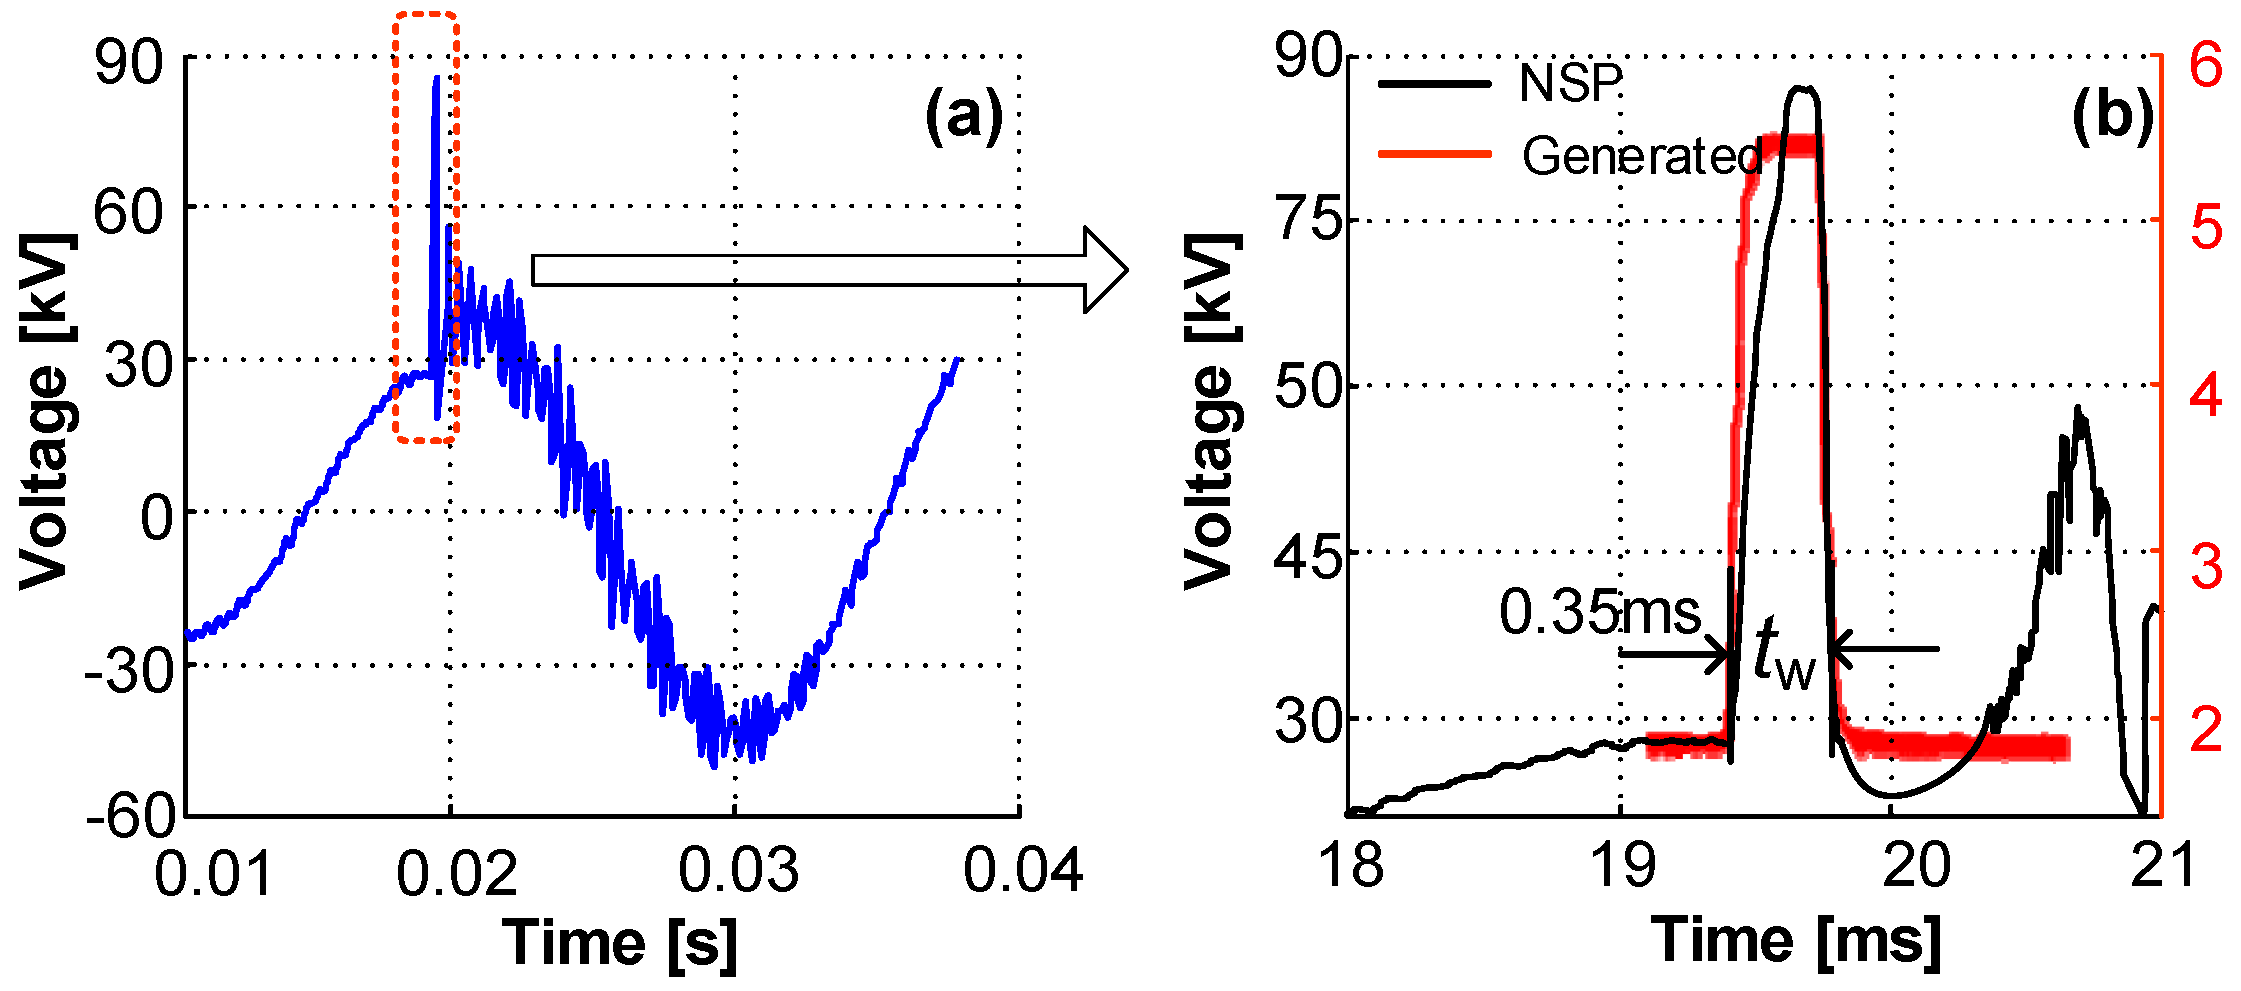
3.3. PD Test under Square Voltage Pulse Superimposed AC Voltage
- (1)
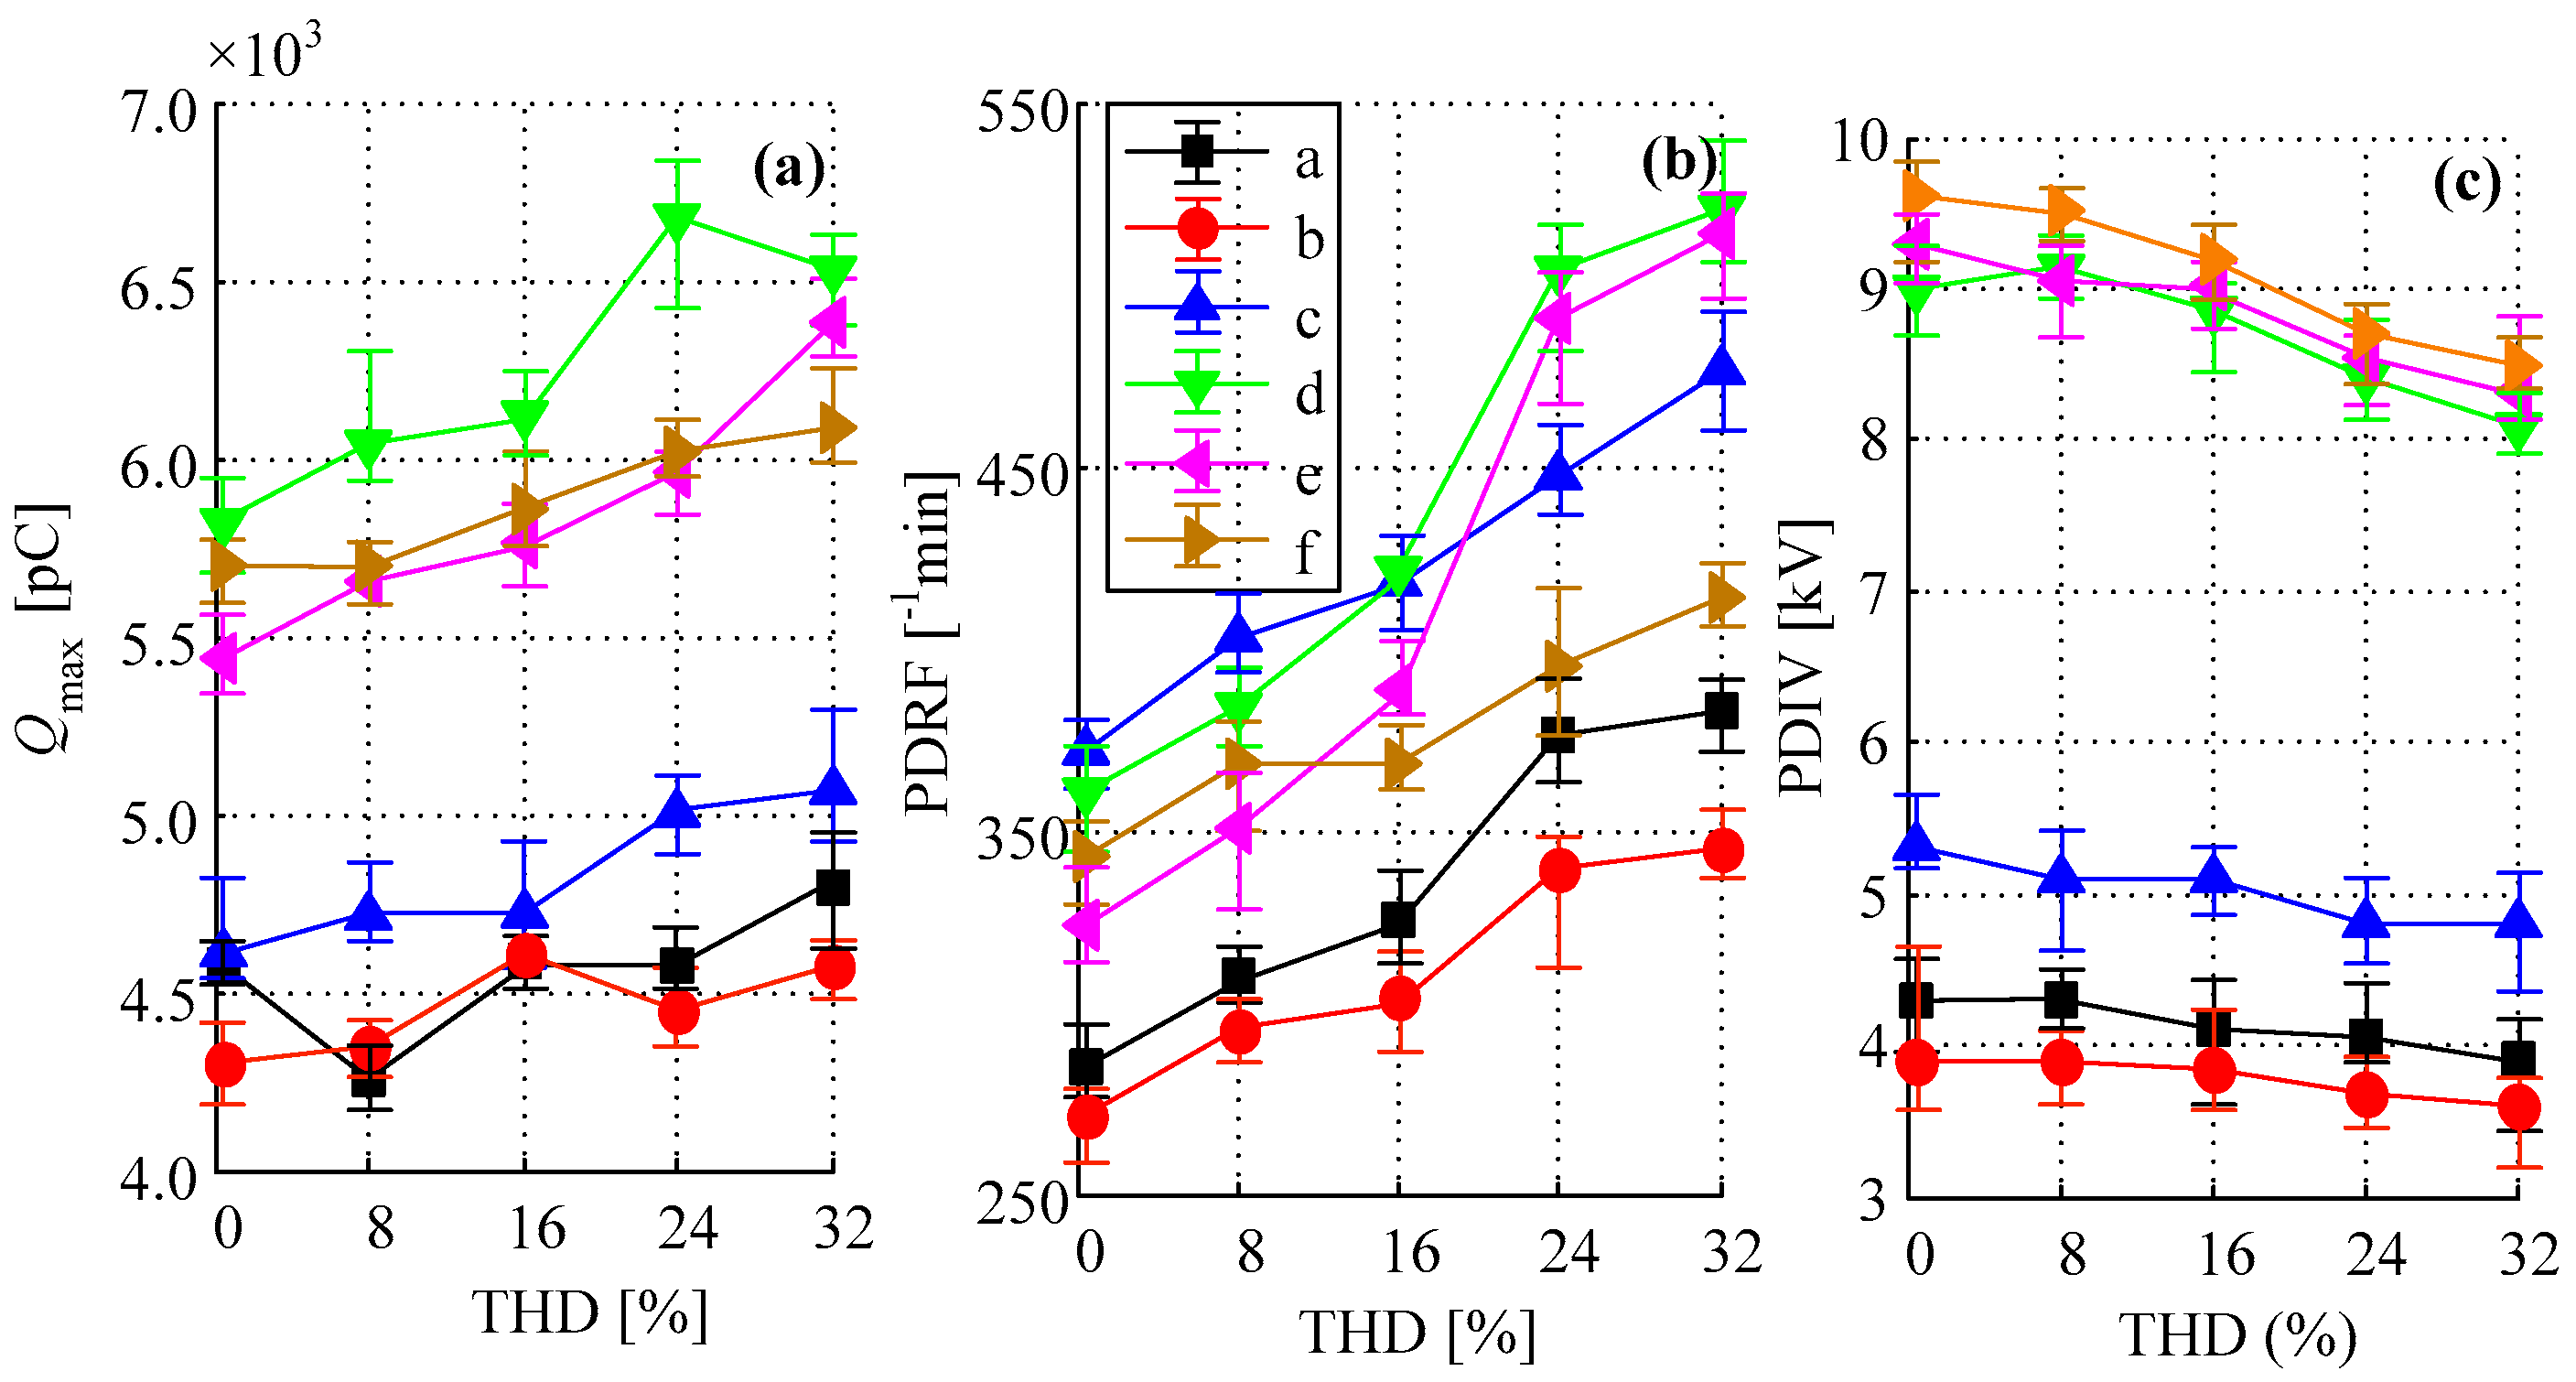
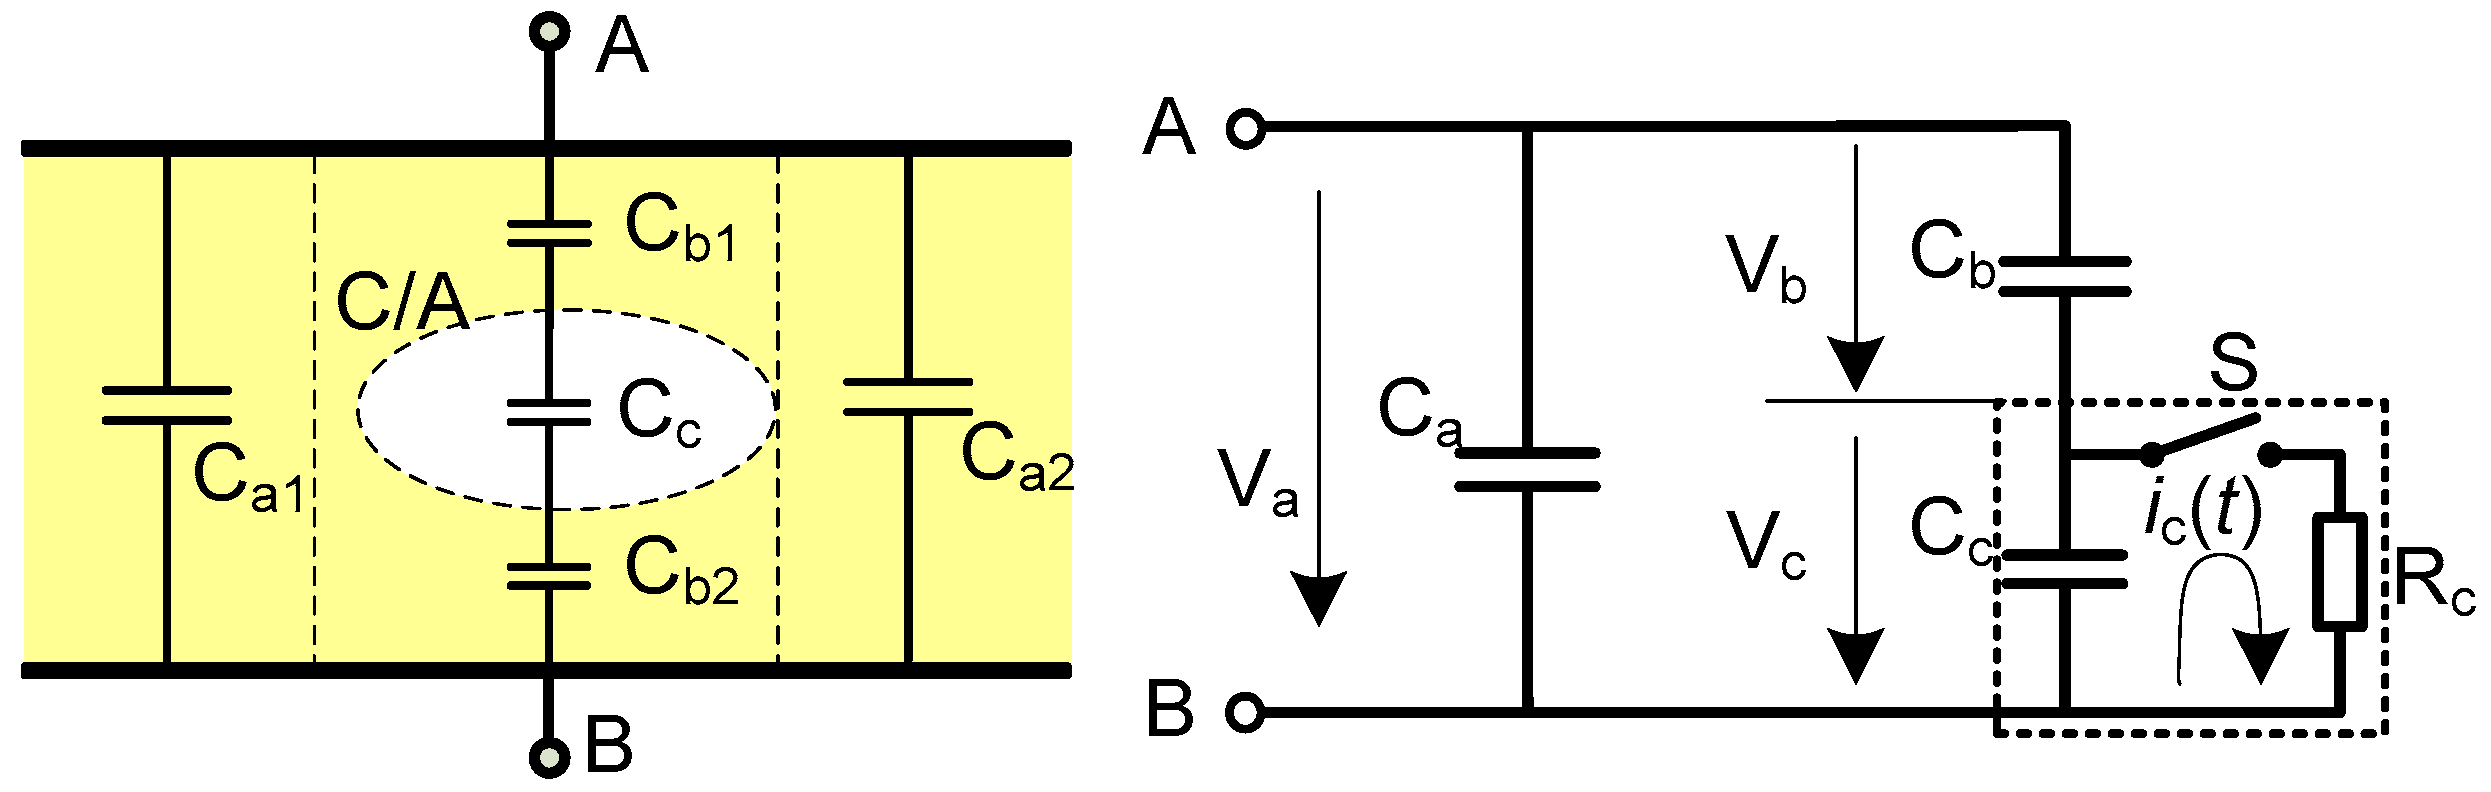
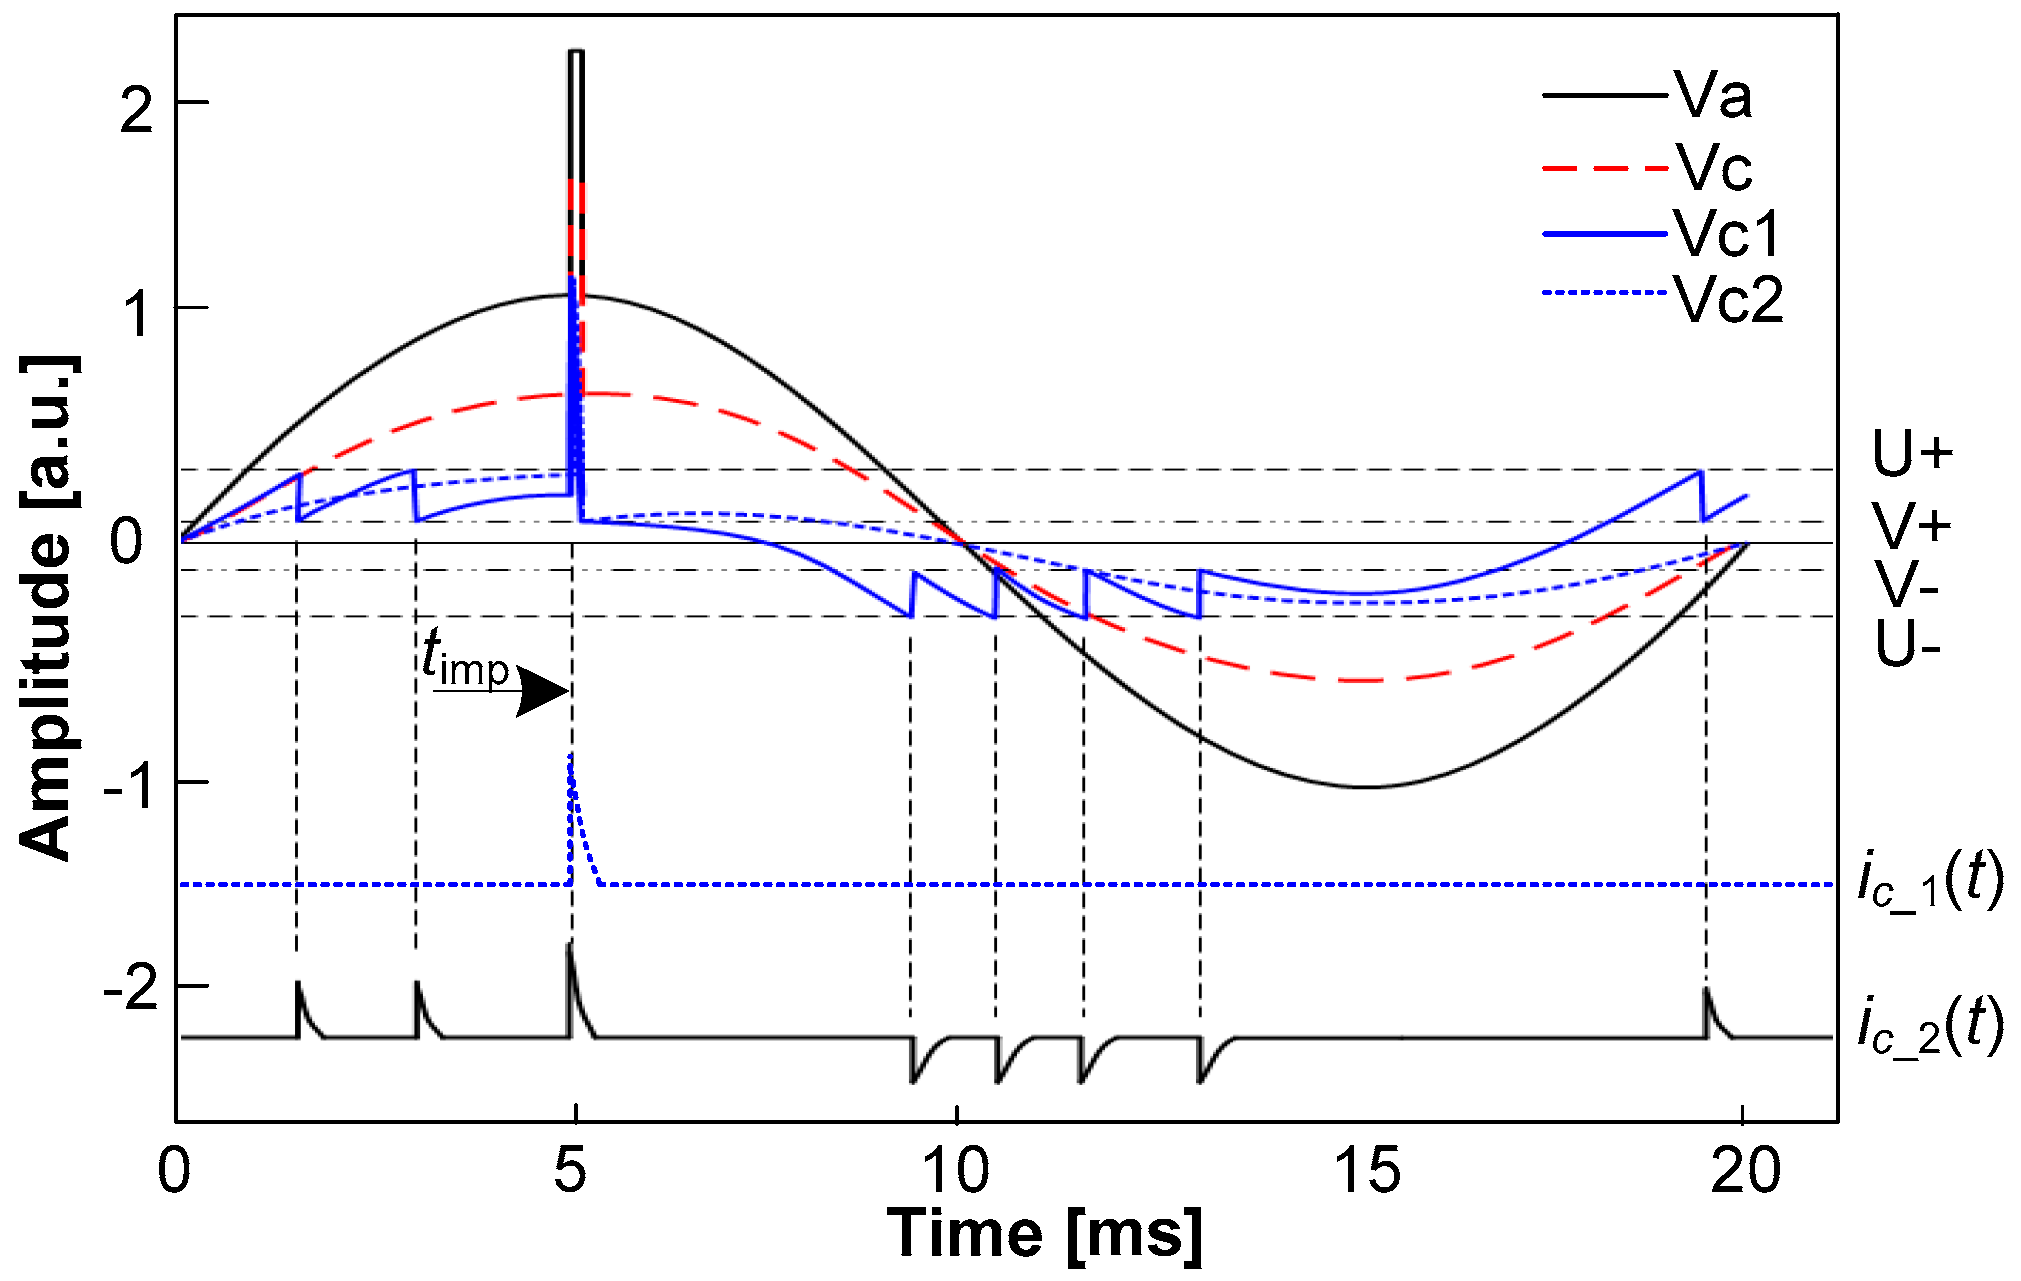
- When Va bellows the PD inception voltage of the PD models that only with pure AC voltage applied, the potential drop Vc1 would not reach to a breakdown voltage U+ until a square impulse voltage was superimposed on the waveform at a phase angle of 90 degrees. That is why the PD inception voltage decreases dramatically (plotted in Figure 13c) under a combined voltage waveform. The capacitor Cc would be discharged and the potential would decrease to the voltage V+ that needed for extinguishing the PD pulse. The PD current ic (t) would last for a very short time, which can be described using a typical PD circuit shown in the dotted orthogon in Figure 14. In this case, only one discharge impulse can be recorded, which is plotted in dotted blue line in Figure 15. However, as the potential drop on Cc is much higher than it needed for discharge, the amplitude of ic_1(t) would also be much higher.
- (2)
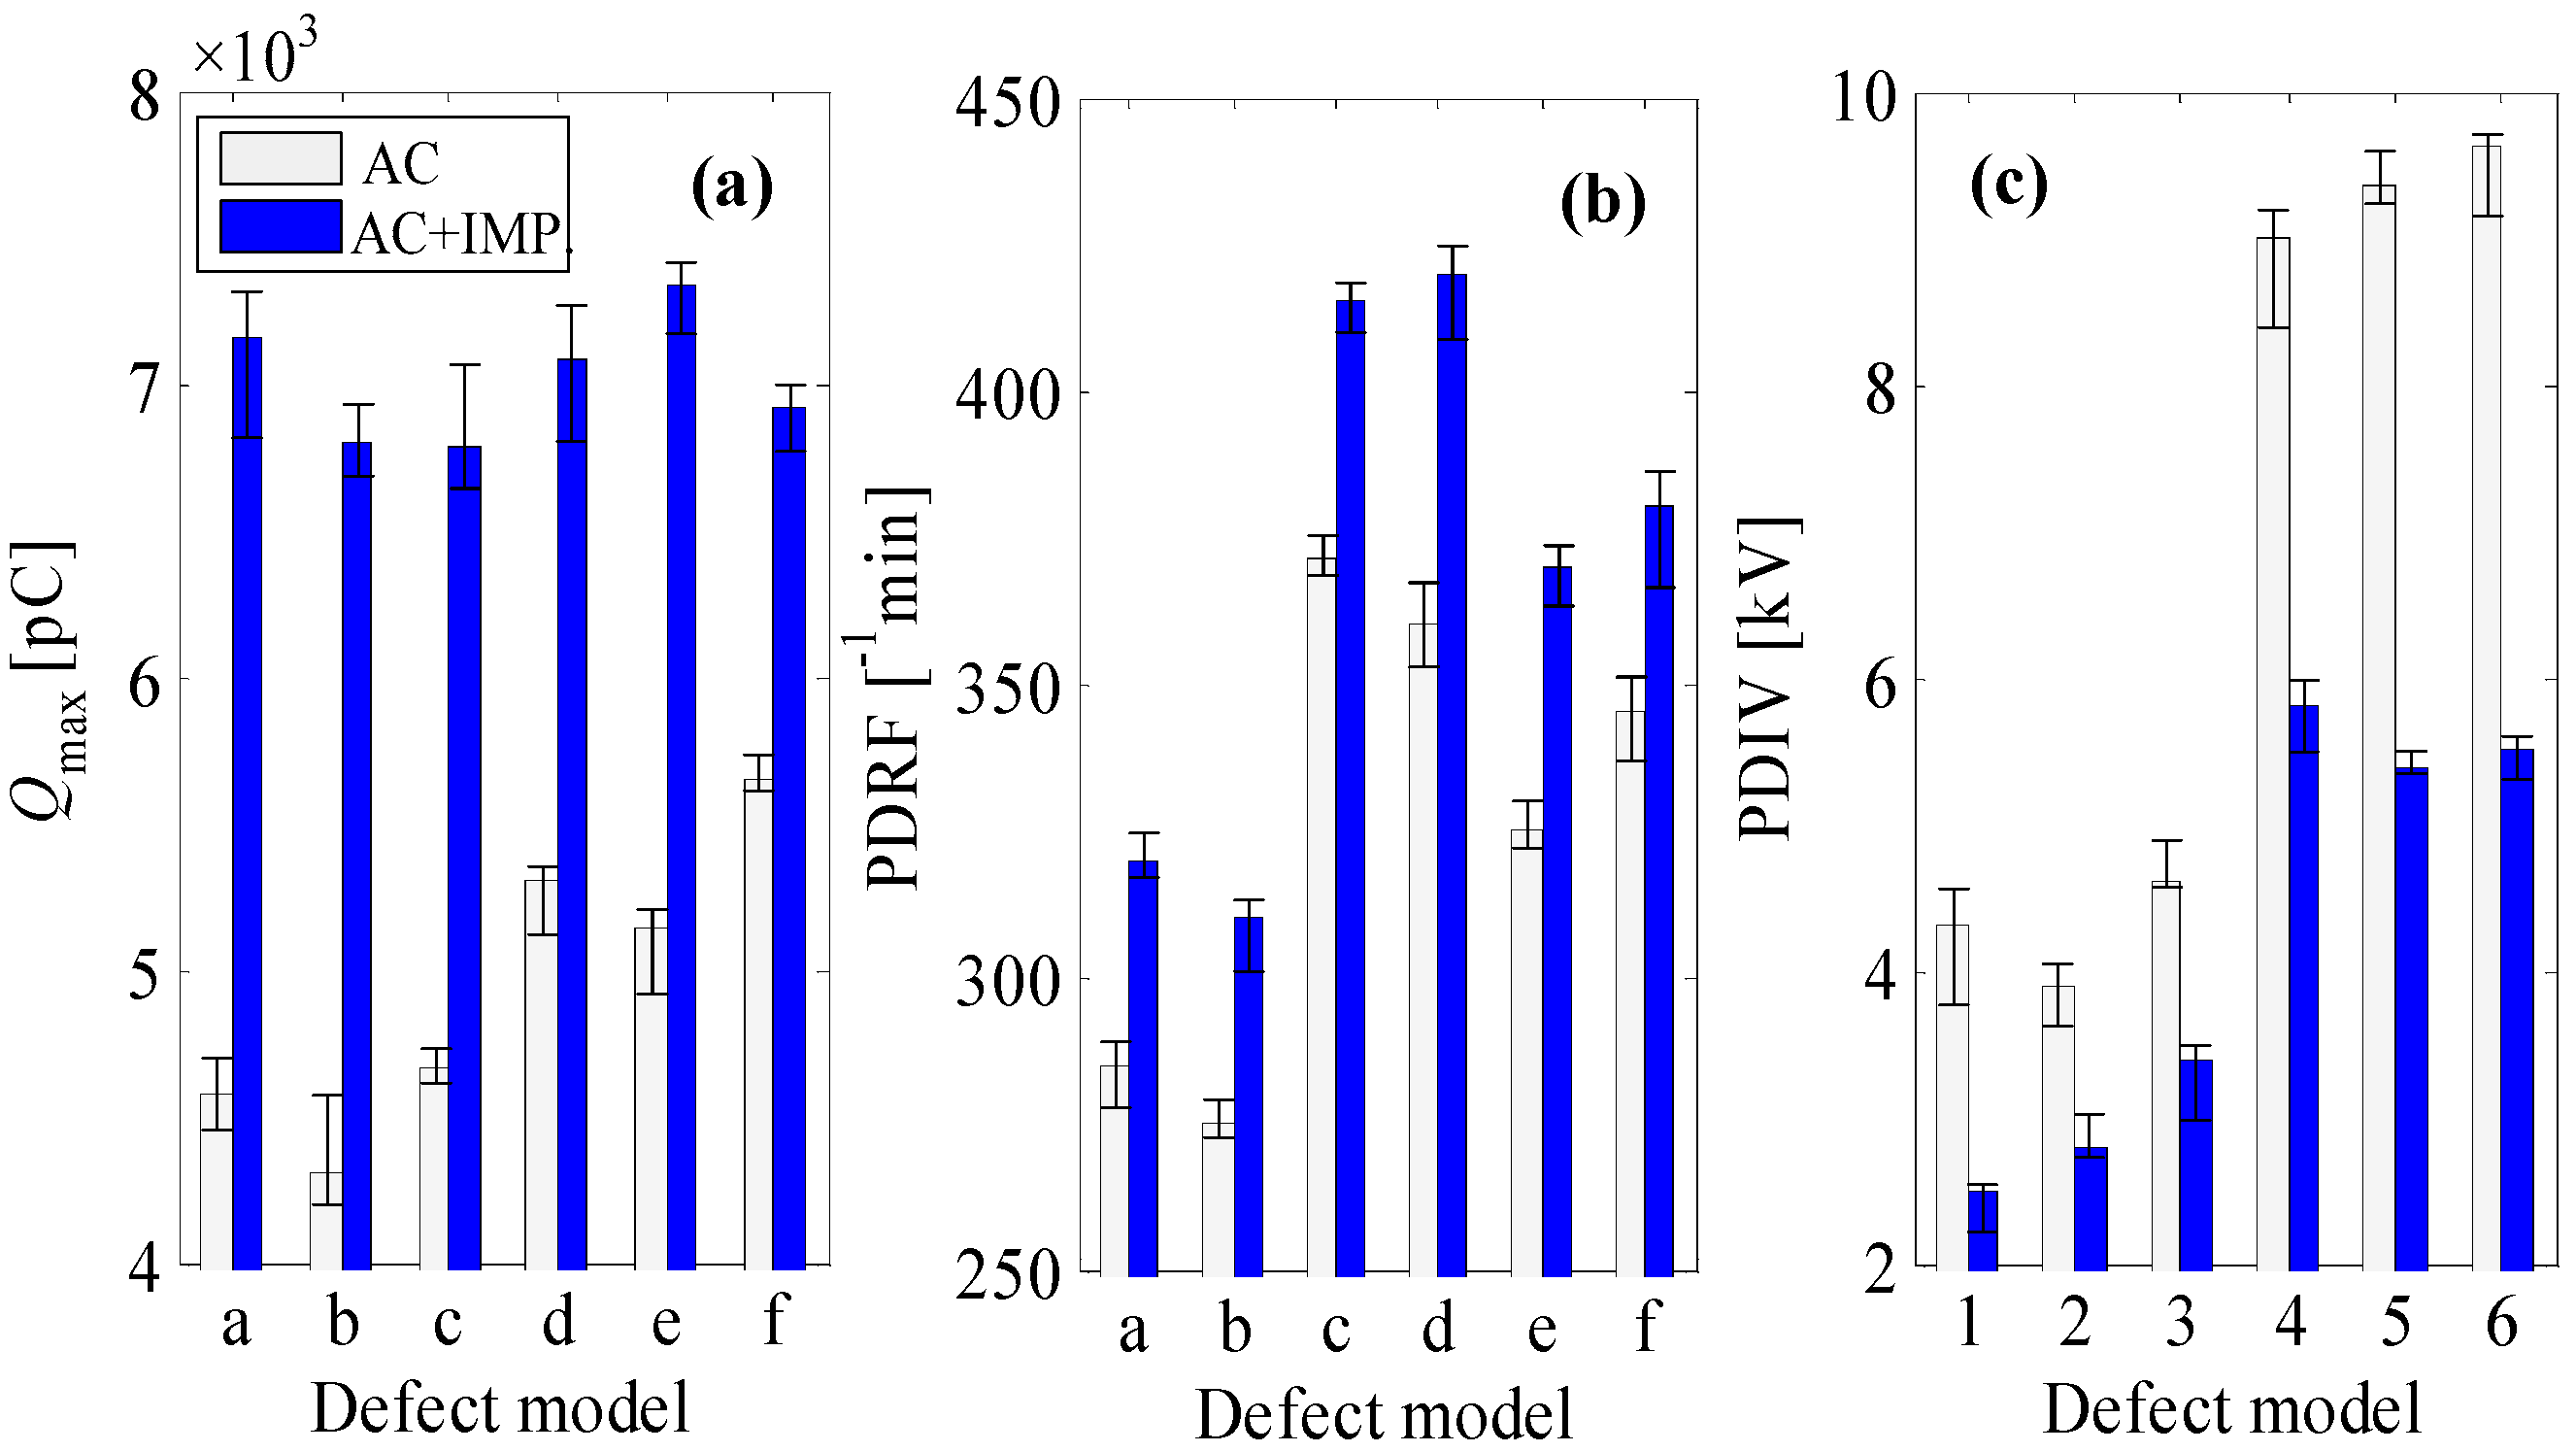
- As Va increases to the same level or exceeds the PD inception voltage of the PD models only with pure AC voltage applied, two discharge impulses a and b would occur before the square voltage impulse applied. The potential drop Vc2 would reach to a breakdown voltage U+ suddenly at time timp, and this would result in a big discharge impulse. After that, another five discharge impulses would occur with only pure AC voltage applied. In this case, the PD current is depicted as ic_2(t). Together with the first case, it is easy to find that the number of impulses as well as the amplitude of discharge will increase once a square impulse applied, and that is why the Qmax and PD repetitive rate increase greatly in Figure 13a,b.
3.4. Discussions
4. Conclusions
Acknowledgments
Author Contributions
Conflicts of Interest
References
- Andreev, V.V.; Grechishnikov, V.A.; Privezentsev, N.N.; Shevlyugin, M.V. Calculation of a relative actualized transformer power of a traction substation on insulation aging. Russ. Electr. Eng. 2011, 82, 441–444. [Google Scholar] [CrossRef]
- Lao, K.W.; Wong, M.C.; Wong, C.K.; Lam, C.S. A systematic approach to hybrid railway power conditioner design with harmonic compensation for high-speed railway. IEEE Trans. Ind. Electron. 2015, 62, 930–942. [Google Scholar] [CrossRef]
- Zhuo, S.; Jiang, X.; Zhu, D.; Zhang, G. A novel active power quality compensator topology for electrified railway. IEEE Trans. Power Electron. 2004, 19, 1036–1042. [Google Scholar] [CrossRef]
- Zhou, L.; Wu, G.; Yu, J.; Zhang, X. Thermal overshoot analysis for hot-spot temperature rise of transformer. IEEE Trans. Dielectr. Electr. Insul. 2007, 14, 1316–1322. [Google Scholar] [CrossRef]
- Liu, Y.; Wu, G.; Hua, H.; Wang, L. Research for the effects of high-speed electrified railway traction load on power quality. In Proceedings of the 4th International Conference on Electric Utility Deregulation and Restructuring and Power Technologies, Weihai, China, 6–9 July 2011; IEEE: Piscataway, NJ, USA, 2011. [Google Scholar]
- Cheng, F.; Sun, Y.; Ma, W. Research on the over-voltage of 220kV power system caused by traction transformer’s commissioning. In Proceedings of the 9th International Conference on Electronic Measurement & Instruments, Beijing, China, 16–19 August 2009; IEEE: Piscataway, NJ, USA, 2009. [Google Scholar]
- International Electrotechnical Commission. Railway Applications-Traction Transformers and Inductors on Board Rolling Stock, IEC Standard 60310–2004; International Electrotechnical Commission: Geneva, Switzerland, 2004. [Google Scholar]
- 220 Single Phase Traction Transformer; Machinery Industry Standard of the People’s Republic of China; National Development and Reform Commission of the P.R. China: Beijing, China, 2007; JB/T 10776-2007. (In Chinese)
- Vv Connection Traction Transformer; Ministry of Industry and Information Technology Standard of the People’s Republic of China; Ministry of Industry and Information Technology of the P.R. China: Beijing, China, 2013; JB/T 11328-2013. (In Chinese)
- Pompili, M.; Bartnikas, R. On partial discharge measurement in dielectric liquids. IEEE Trans. Dielectr. Electr. Insul. 2012, 19, 1476–1481. [Google Scholar] [CrossRef]
- Pompili, M. Partial discharge development and detection in dielectric liquid. IEEE Trans. Dielectr. Electr. Insul. 2009, 16, 1648–1654. [Google Scholar] [CrossRef]
- Pompili, M.; Mazzetti, C.; Bartnikas, R. Comparative Partial discharge impulse burst characteristics of transformer type natural and synthetic ester fluids and mineral oils. IEEE Trans. Dielectr. Electr. Insul. 2009, 16, 1511–1518. [Google Scholar] [CrossRef]
- Suresh, S.D.R.; Savadamuthu, U. Cluster classification of partial discharges in oil-impregnated paper insulation. Adv. Electr. Comput. Eng. 2010, 10, 90–93. [Google Scholar] [CrossRef]
- Wang, K.; Li, J.; Zhang, S.; Gao, F. A new image-oriented feature extraction method for partial discharges. IEEE Trans. Dielectr. Electr. Insul. 2015, 22, 1015–1024. [Google Scholar] [CrossRef]
- Chen, W.; Chen, X.; Peng, S.; Li, J. Canonical correlation between partial discharges and gas formation in transformer oil/paper insulation. Energies 2012, 5, 1081–1097. [Google Scholar] [CrossRef]
- Chan, J.; Ma, H.; Saha, T.K. Automatic blind equalization and thresholding for PD measurement in Power Transformer. IEEE Trans. Power Deliv. 2014, 29, 1927–1938. [Google Scholar] [CrossRef]
- Niasar, M.G.; Taylor, N.; Janus, P.; Wang, X. Partial discharges in a cavity embedded in oil-impregnated paper: Effect of electrical and thermal aging. IEEE Trans. Dielectr. Electr. Insul. 2015, 22, 1071–1079. [Google Scholar] [CrossRef]
- Kiiza, R.C.; Niasar, M.G.; Nikjoo, R.; Wang, X. Change in partial discharge activity as related to degradation level in oil-impregnated paper insulation: Effect of high voltage impulses. IEEE Trans. Dielectr. Electr. Insul. 2014, 21, 1243–1250. [Google Scholar] [CrossRef]
- Liao, R.; Yang, L.; Li, J.; Grzybowski, S. Aging condition assessment of transformer oil-paper insulation model based on partial discharge analysis. IEEE Trans. Dielectr. Electr. Insul. 2011, 18, 303–311. [Google Scholar] [CrossRef]
- Li, J.; Si, W.; Yao, X.; Li, Y. Measurement and simulation of partial discharge in oil impregnated pressboard with an electrical aging process. Meas. Sci. Technol. 2009, 20, 251–252. [Google Scholar] [CrossRef]
- Sun, Z.; Gu, C.; Zhao, X.; Li, Y. Partial discharge activity in oil—Paper insulated system under DC superimposed AC and harmonic voltage. Electr. Rev. 2011, 87, 199–201. [Google Scholar]
- Tsuchie, M.; Kozako, M.; Hikita, M.; Sasaki, E. Modeling of early stage PD and overheating degradation of paper-oil insulation. IEEE Trans. Dielectr. Electr. Insul. 2014, 21, 1342–1349. [Google Scholar] [CrossRef]
- Florkowski, M.; Florkowska, B.; Furgal, J.; Zydron, P. Impact of high voltage harmonics on interpretation of PD patterns. IEEE Trans. Dielectr. Electr. Insul. 2014, 21, 2383–2393. [Google Scholar] [CrossRef]
- Sha, Y.; Zhou, Y.; Zhang, L.; Huang, M. Measurement and simulation of PD in oil-paper insulation under the combined AC-DC voltage. J. Electrost. 2013, 21, 2009–2016. [Google Scholar] [CrossRef]
- Gao, B.; Wu, G.; Tong, L.; Lin, T. Novel insulation aging test system based on continuous high voltage square impulses for inverter-fed traction motors. Chin. J. Sci. Instrum. 2008, 29, 43–48. [Google Scholar]
- Tang, J.; Zhou, J.; Zhang, X.; Liu, F. A transformer partial discharge measurement system based on fluorescent fiber. Energies 2012, 5, 1490–1502. [Google Scholar] [CrossRef]
- Sarathi, R.; Merin Sheema, I.P.; Sundara Rajan, J.; Danikas, M.G. Influence of harmonic AC voltage on surface discharge formation in transformer insulation. IEEE Trans. Dielectr. Electr. Insul. 2014, 21, 2383–2393. [Google Scholar] [CrossRef]
- Sarathi, R.; Archana, M. Investigation of partial discharge activity by a conducting particle in transformer oil under harmonic AC Voltages adopting UHF technique. IEEE Trans. Dielectr. Electr. Insul. 2014, 19, 1514–1520. [Google Scholar] [CrossRef]
- International Electrotechnical Commission: High-Voltage Test Techniques—Partial Discharge Measurements, IEC Standard 60270; International Electrotechnical Commission: Geneva, Switzerland, 2000.
- Preventive Test Code for Electric Power Equipment; Electric Power Industry Standard of People’s Republic of China; Ministry of Power Industry of the PR. China: Beijing, China, 2005; DL/T 596-2005. (In Chinese)
- Quality of Electric Energy Supply—Harmonics in Public Networks; Standard of the People’s Republic of China; General Administration of Quality Supervision, Inspection and Quarantine of the P.R. China: Beijing, China, 2009; GB/T 14549-2009. (In Chinese)
- Niasar, M.G. Partial Discharge Signatures of Defects in Insulation Systems Consisting of Oil and Oil-impregnated Paper. Ph.D. Thesis, Royal Institute of Technology, Stockholm, Sweden, 2012. [Google Scholar]
- Densley, R.J. Partial discharges in electrical insulation under combined alternating and impulse stresses. IEEE Trans. Electr. Insul. 1970, 4, 96–103. [Google Scholar] [CrossRef]
- Sarathi, R.I.; Merin Sheema, P.; Sundara Rajan, J. Understanding surface discharge activity in copper sulphide diffused oil impregnated pressboard under AC voltage. IEEE Trans. Electr. Insul. 2014, 26, 674–682. [Google Scholar] [CrossRef]
- Tang, J.; Zhu, L.; Ma, S. Characteristics of suspended and mobile microbubbles partial discharge in insulation oil. High Volt. Eng. 2010, 36, 1341–1346. (In Chinese) [Google Scholar]
- Sarathi, R.; Giridhar, A.V.; Mani, A.; Sethupathi, K. Investigation of partial discharge activity of conducting particles in liquid nitrogen under DC voltages using UHF technique. IEEE Trans. Electr. Insul. 2008, 15, 655–662. [Google Scholar] [CrossRef]


| Resistance (Ω) | Capacitance (pF) | Power (W) | |||||
|---|---|---|---|---|---|---|---|
| R1 | R2 | C1 | C2 | Heater | Radiator | Blender | Pump |
| 2 × 10⁶ | 40 | 0.2 | 200 | 150 | 120 | 10 | 10 |
| Defect Models | ϕD1/D2 | ϕD3/D4 | h1/h3/h7 | h2/h6 | h5/h8 | d1/d2 |
|---|---|---|---|---|---|---|
| Model a | 50/75 | -/- | 10/-/- | 2.5/- | -/- | 5/- |
| Model b | -/75 | 12/- | -/15/- | 1.5/- | -/- | -/- |
| Model c | 50/75 | 12/- | 10/15/- | 1.5/- | 2.0/- | -/20 |
| Model d | 50/75 | -/- | 10/-/- | -/5.0 | -/- | -/- |
| Model e | 50/75 | -/- | 10/-/- | -/5.0 | -/- | -/- |
| Model f | -/75 | -/12 | -/-/10 | -/8.0 | -/2.0 | -/- |
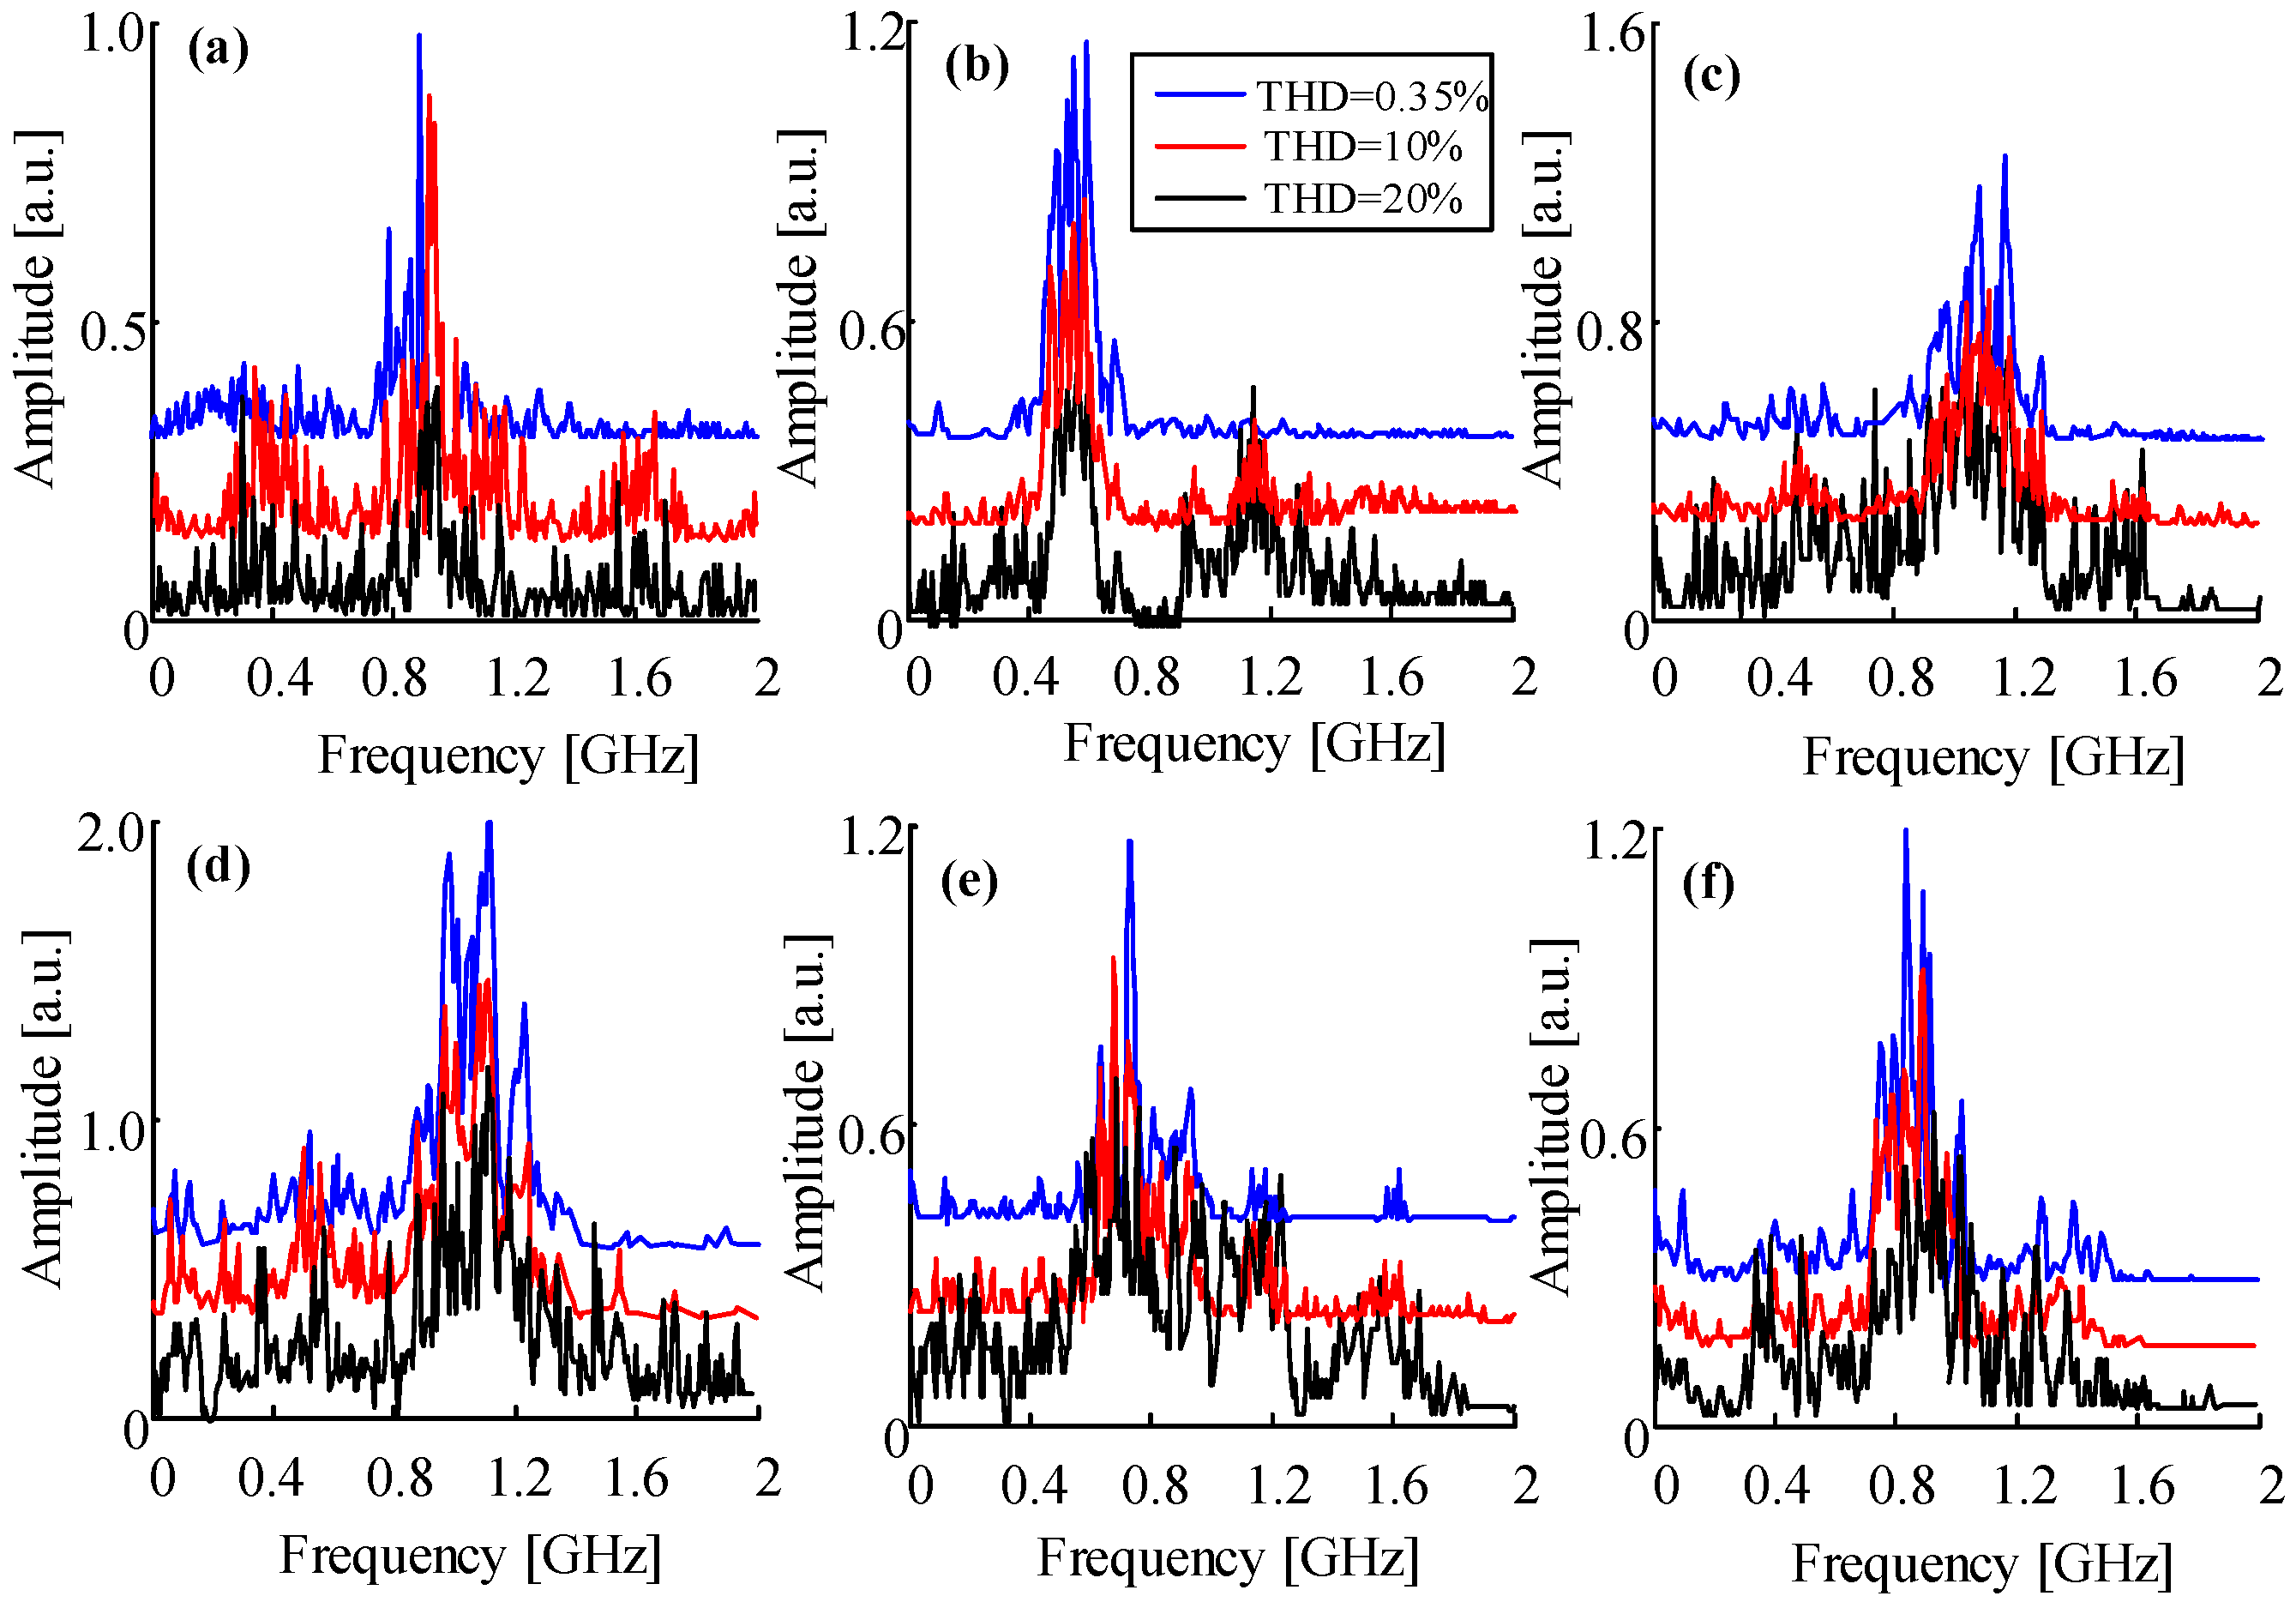
| Defect Model | a | b | c | D | e | f |
|---|---|---|---|---|---|---|
| Central frequency (GHz) | 0.91 | 0.48 | 1.12 | 1.05 | 0.72 | 0.87 |
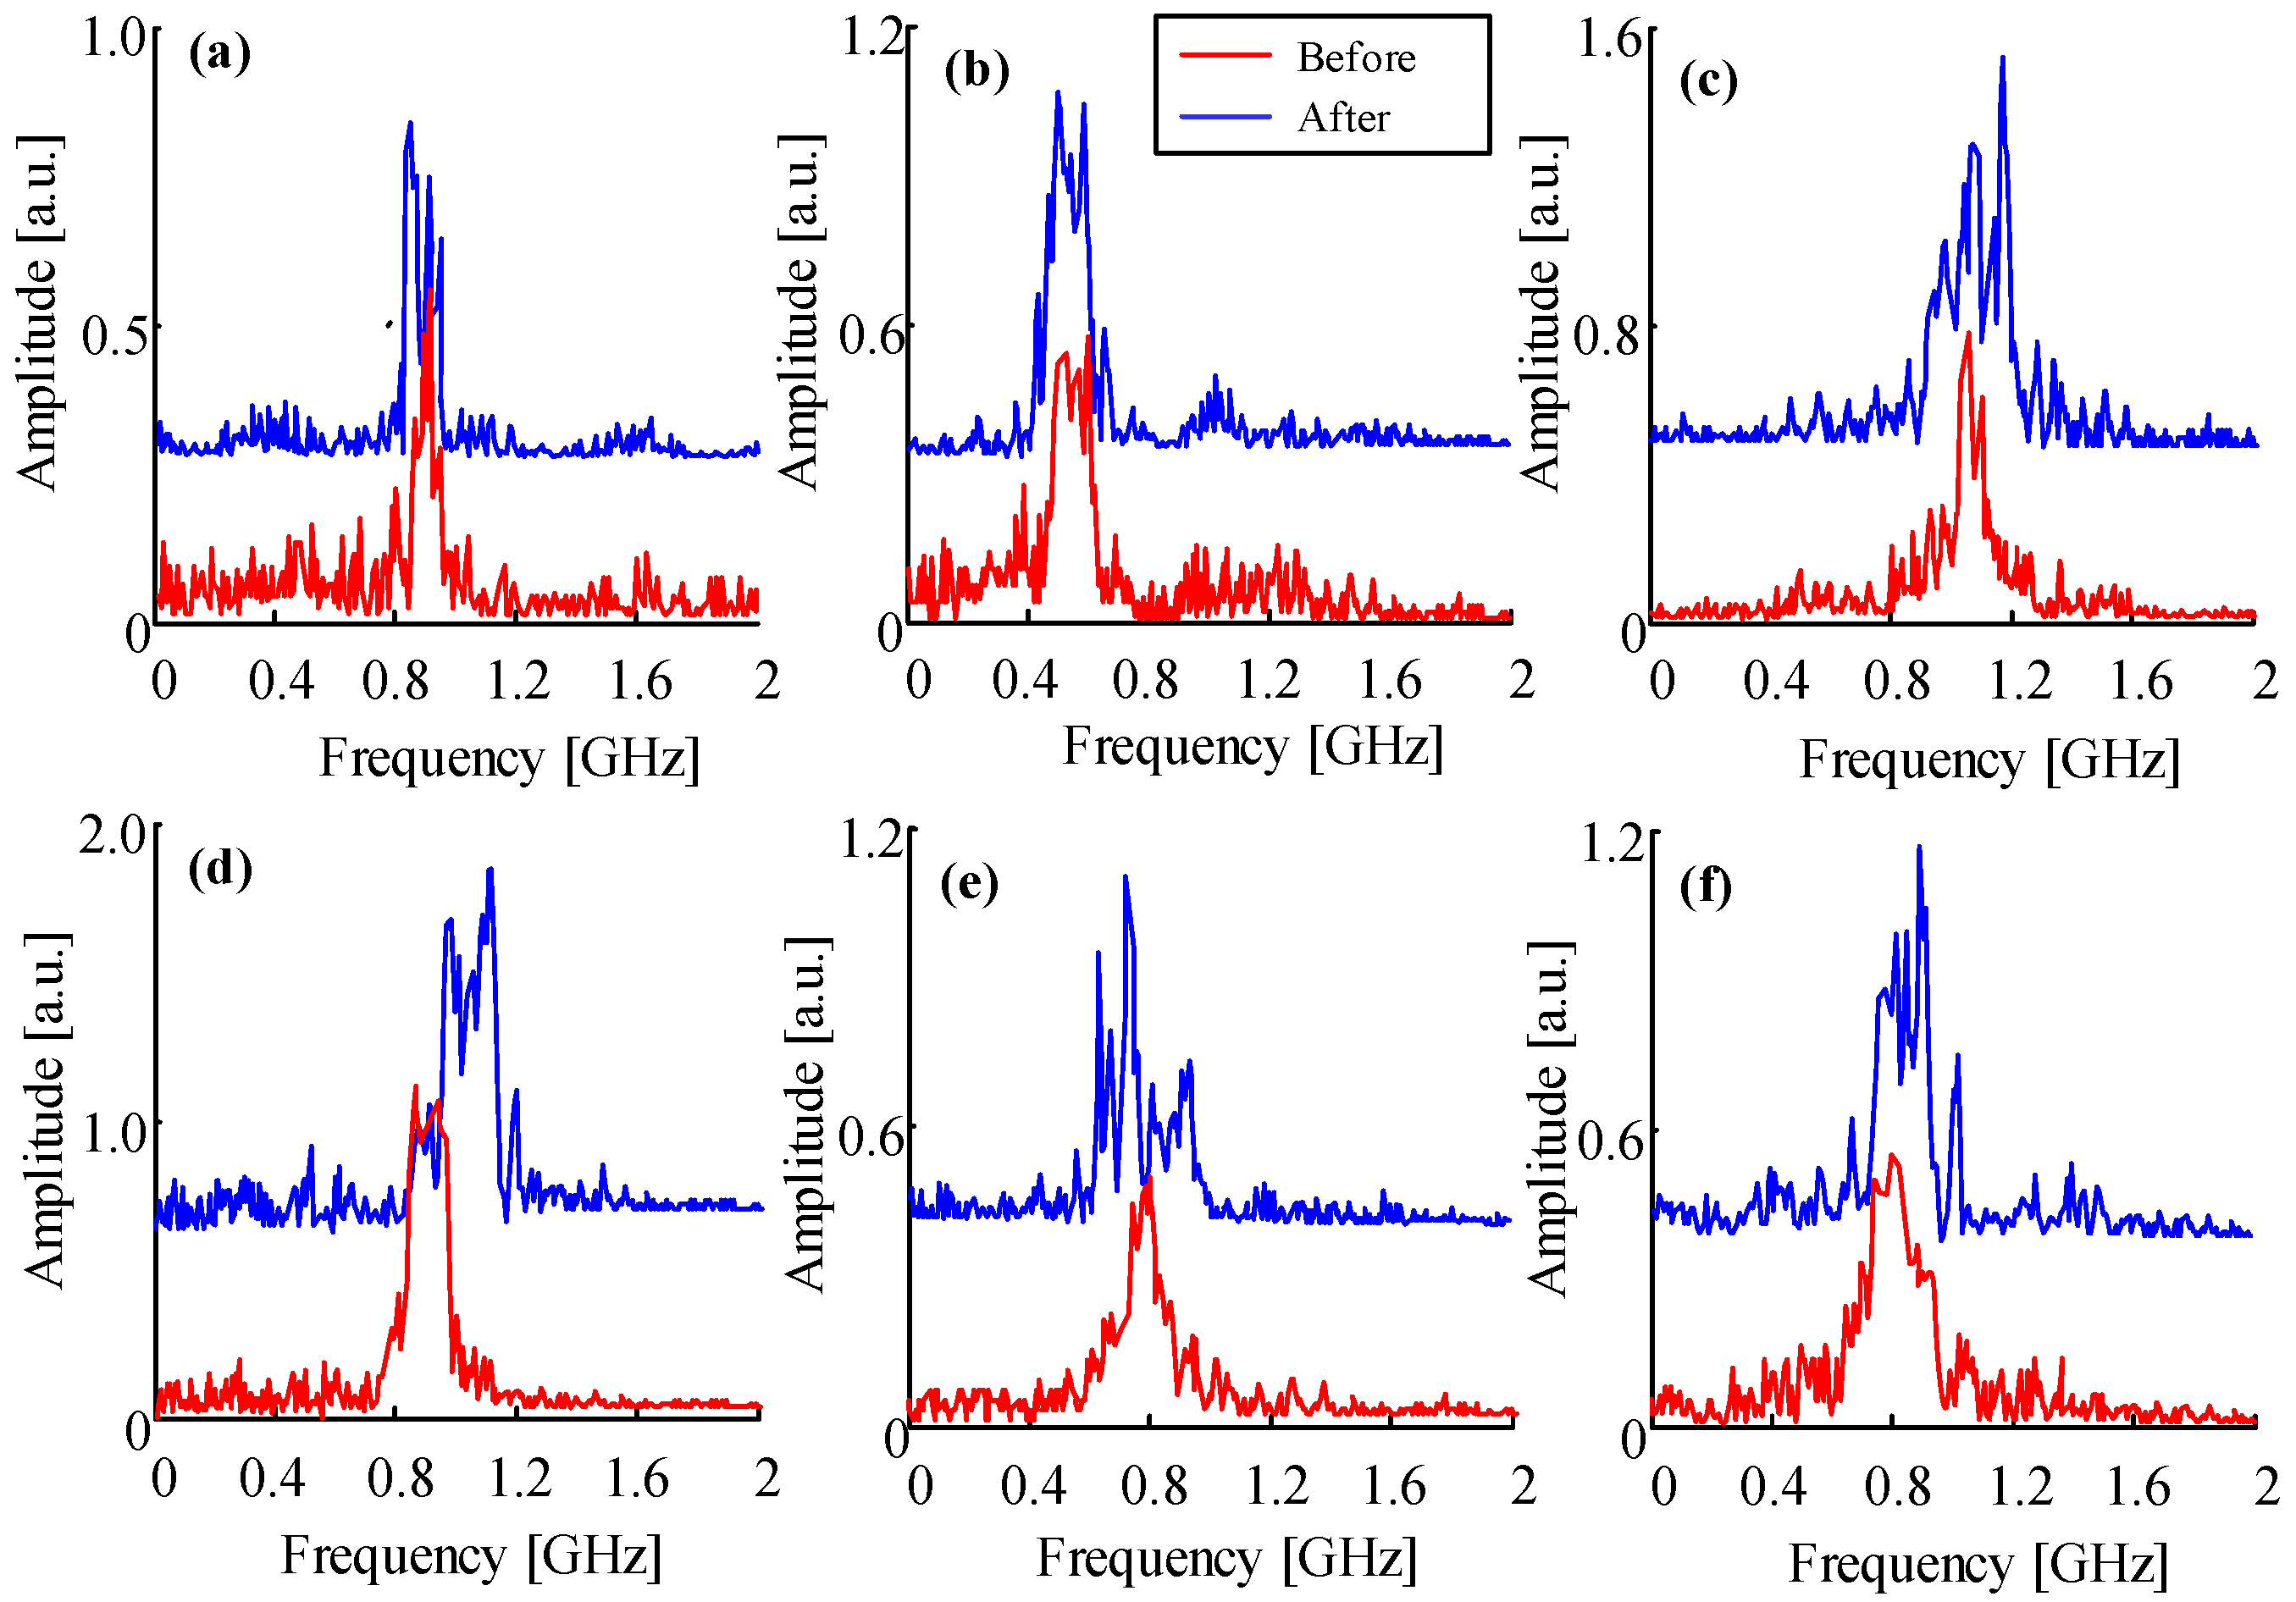
| Defect Model | a | b | c | d | e | f |
|---|---|---|---|---|---|---|
| Central frequency, before (GHz) | 0.91 | 0.48 | 1.12 | 0.84 | 0.72 | 0.87 |
| Central frequency, after (GHz) | 0.91 | 0.48 | 1.09 | 1.05 | 0.81 | 0.83 |
© 2017 by the authors. Licensee MDPI, Basel, Switzerland. This article is an open access article distributed under the terms and conditions of the Creative Commons Attribution (CC BY) license (http://creativecommons.org/licenses/by/4.0/).
Share and Cite
Li, S.; Gao, G.; Hu, G.; Gao, B.; Yin, H.; Wei, W.; Wu, G. Influences of Traction Load Shock on Artificial Partial Discharge Faults within Traction Transformer—Experimental Test for Pattern Recognition. Energies 2017, 10, 1556. https://doi.org/10.3390/en10101556
Li S, Gao G, Hu G, Gao B, Yin H, Wei W, Wu G. Influences of Traction Load Shock on Artificial Partial Discharge Faults within Traction Transformer—Experimental Test for Pattern Recognition. Energies. 2017; 10(10):1556. https://doi.org/10.3390/en10101556
Chicago/Turabian StyleLi, Shuaibing, Guoqiang Gao, Guangcai Hu, Bo Gao, Haojie Yin, Wenfu Wei, and Guangning Wu. 2017. "Influences of Traction Load Shock on Artificial Partial Discharge Faults within Traction Transformer—Experimental Test for Pattern Recognition" Energies 10, no. 10: 1556. https://doi.org/10.3390/en10101556