1. Introduction
Many previous studies [
1,
2] have shown that there is a risk of fossil fuel energy scarcity, which constrains human socio-economic development globally. The discrepancy between energy consumption and production varies geographically, which can increase the difficulty of responding to the risk [
2]. Besides energy scarcity, environmental and climate change pressures also call for a more efficient approach to energy use [
3,
4].
Distributed generation (DG) is one of the solutions for solving the above challenges. Moreover, DG can supply energy service more stably. It can help avoid the problems associated with “putting all the eggs in the same basket”, reducing systematic risks and enhancing the reliability of energy systems [
5].
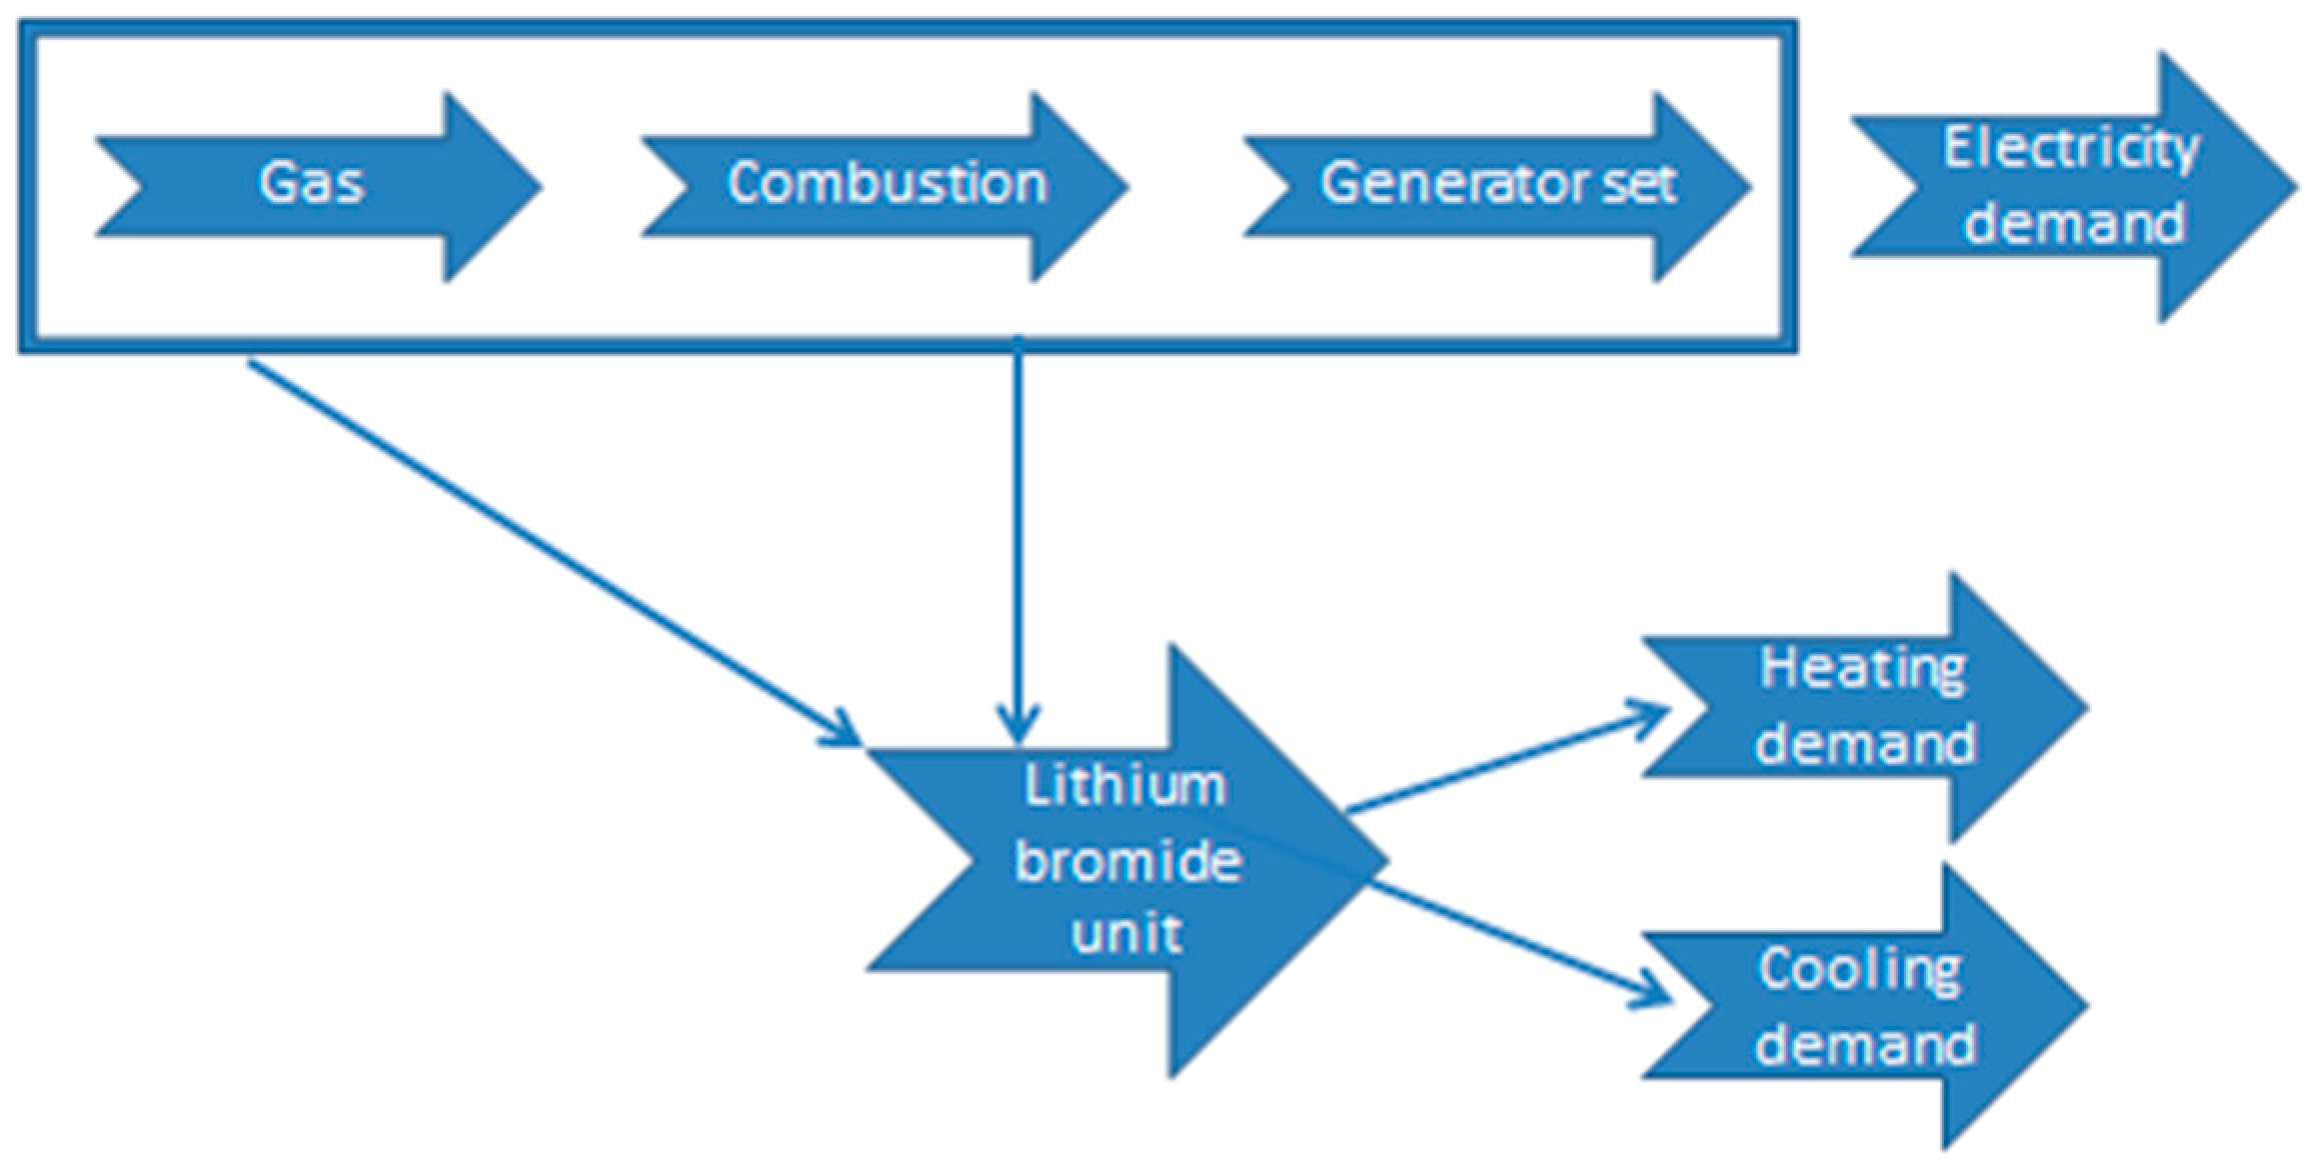
Figure 1 illustrates a typical DG system.
Although the concept of DG pictures an ideal solution to strike the balance between stable supply and clean production, not all regions regard DG as best practice. An understanding of what DG can bring can help justify the varied reactions to the new concept [
5]. The practice of DG should be evaluated to tell if DG can be the key to various problems in the real-world setting. The performance of DG needs to be quantified, analyzed, and compared [
6]. The regions that suffer from energy scarcity and environmental pollution, and proactively push the development of DG, are worth specific research. It remains to be seen if they made the right choices and if other regions should follow [
2,
5].
The development of DG in China, especially natural gas (NG) DG projects, is especially rapid. Research focused on the overall benefit assessment of NG DG projects in China is relatively rare and case studies using the life-cycle analysis (LCA) method for the DG project in the context of China are required.
The aim of this paper is to assess the overall performance of the actual project of NG-based Distributed Energy System (DES) in China with respect to energy saving, GHG emissions reduction (GER), and economic efficiency. The analysis includes how the production process is organized, the life cycle energy consumption and GHG emissions, and an economic analysis. Using our case study, the paper also provides details of relevant policies in China to help inform other countries that are looking to develop DES.
The remaining sections of this paper are arranged as follows.
Section 2 introduces the background.
Section 3 introduces the research methodology, including the scenario design, the LCA system boundary, and the calculation methods.
Section 4 lists the key data and assumptions.
Section 5 presents the results.
Section 6 provides concluding remarks and supplies policy suggestions for the development of NG DG projects in China.
2. Background
2.1. Growing Trend of Distributed Generation Projects
China has recognized the advantages of clean energy and DG and has generated policies supporting the development of DG, especially NG projects (
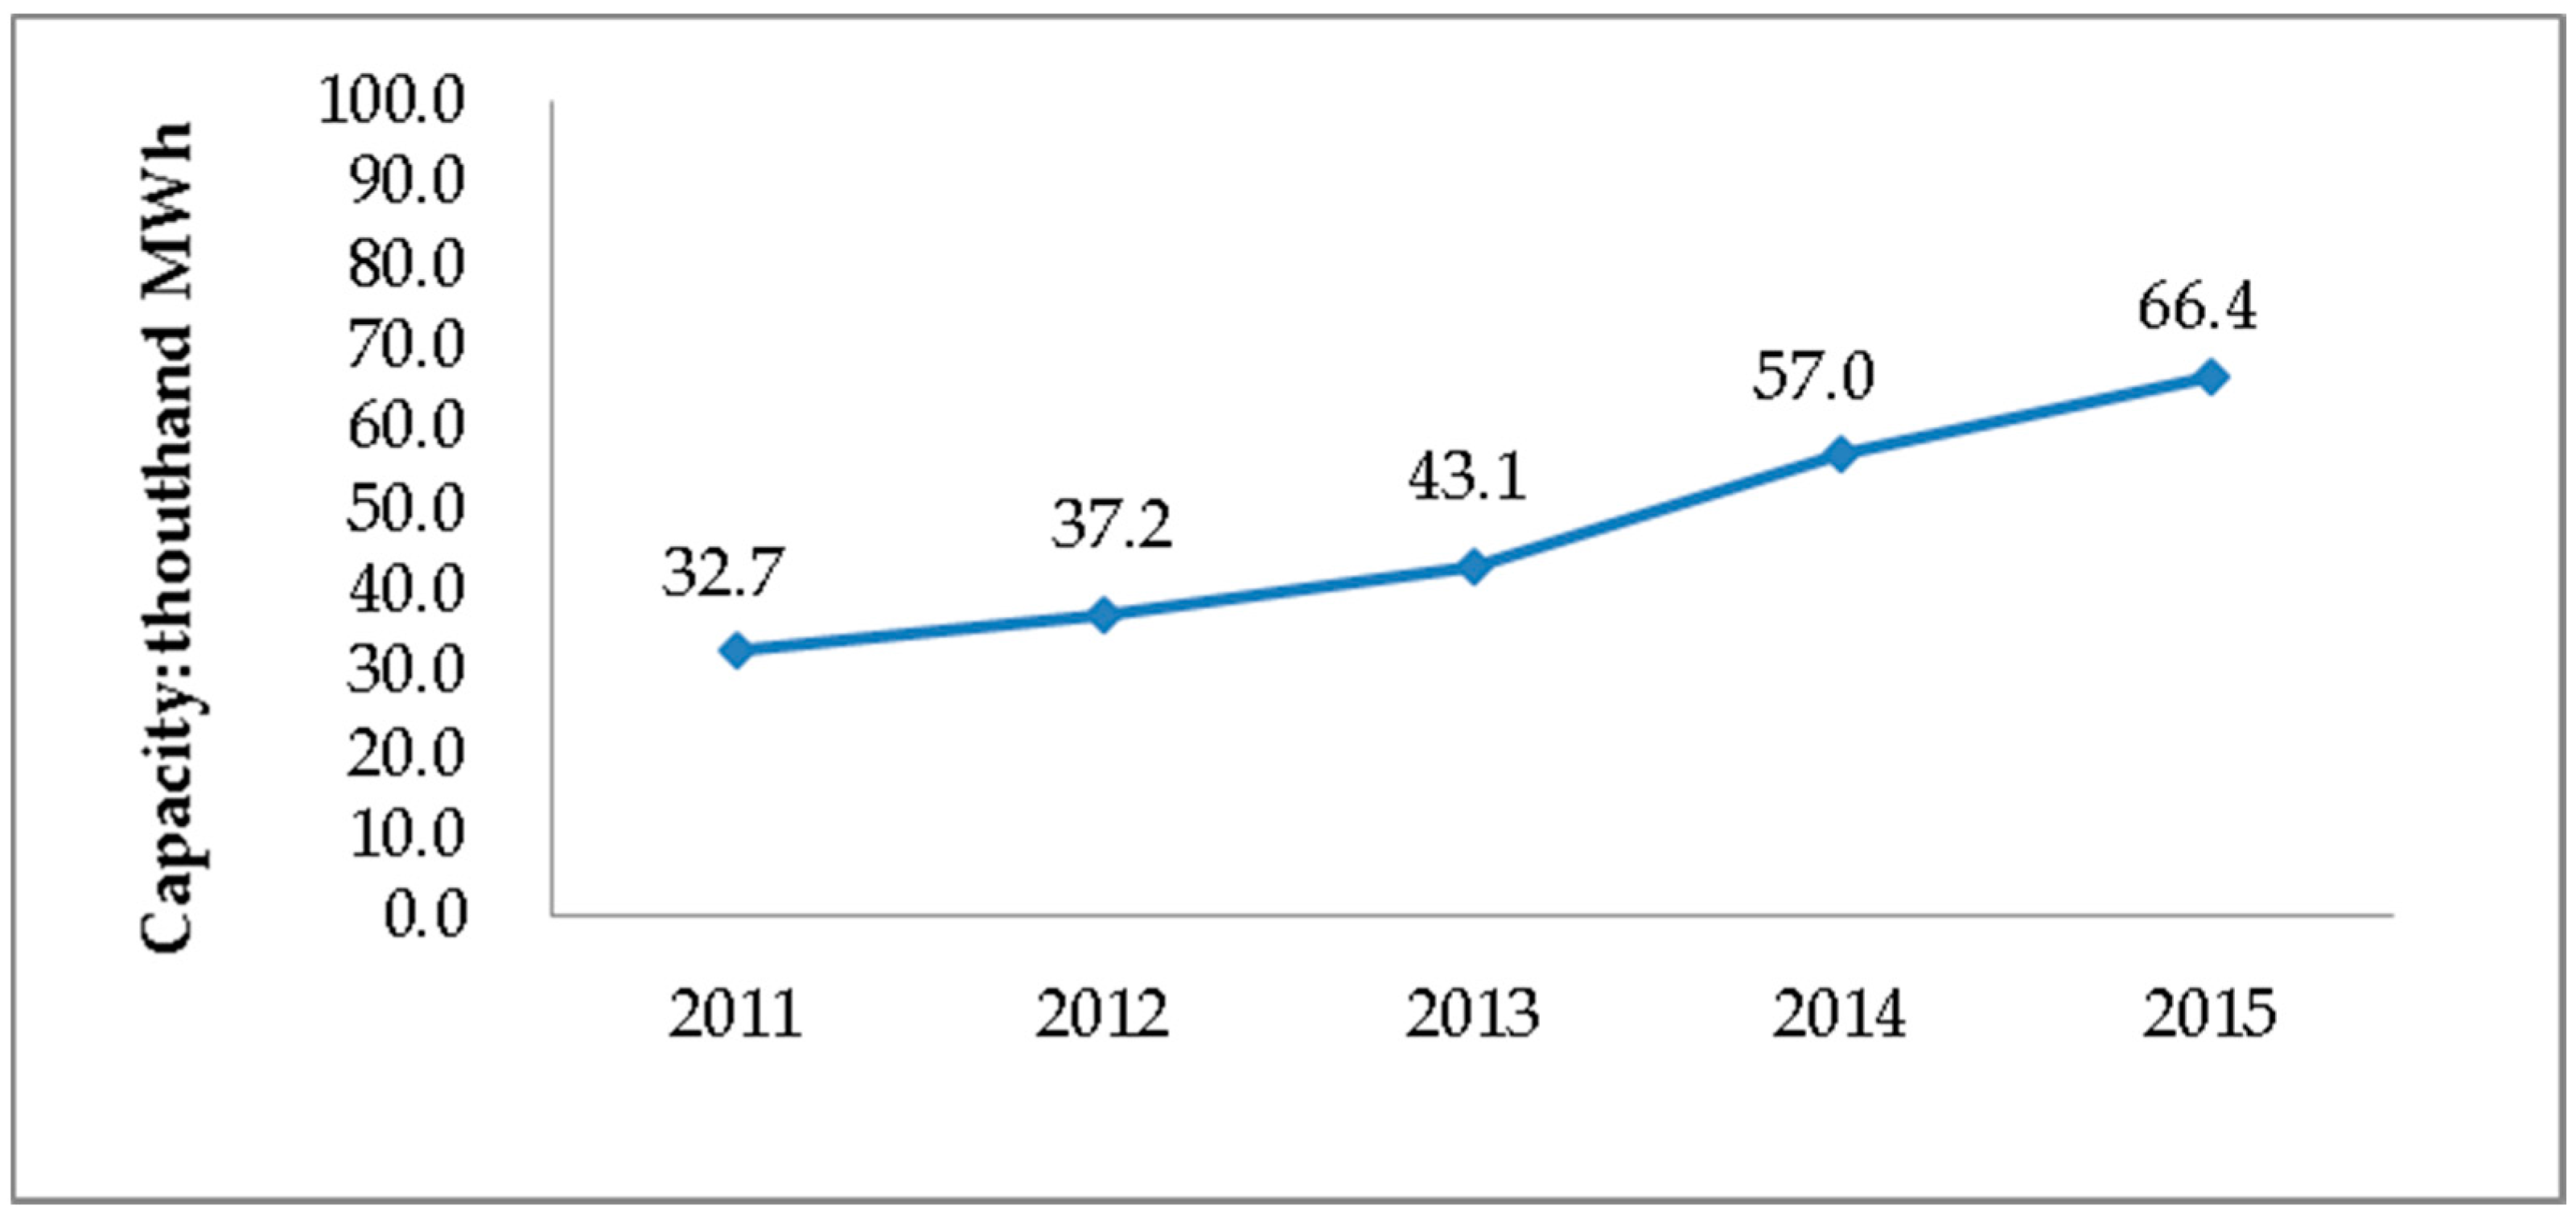
Table 1). The capacity of NG DG in China has rapidly expanded in recent years (
Figure 2).
The development of NG DG projects calls for research on their performance, which is important for both policymakers and investors. Since the investment of NG DG projects incurs an opportunity cost, the comprehensive benefits of these projects require examination. Research based on Chinese case studies can offer insights about the decision-making of DG development.
2.2. Life-Cycle Analysis as a Mainstream Evaluation Method
Many studies have analyzed various aspects of DES and DG projects; for example, studies on the operation strategies and benefit evaluation of DG [
8,
9]. The most frequently analyzed metrics of DG benefit include economy (net present value and internal return rate), GHG emissions, energy consumption reduction, and marginal abatement cost [
10,
11].
Life-cycle analysis, which takes indirect energy consumption and emissions into account, has become a mainstream method to evaluate the reduction in GHG emissions and energy consumption [
12,
13,
14]. Several successful studies have been conducted using LCA case studies in Western regions such as Europe and the USA [
15,
16,
17,
18]. However, international experience may not apply to the context of China, because conclusions based on the LCA method should be viewed on a case-by-case basis, considering the major geographical differences [
12].
Therefore, China-specific cases are important to enhance LCA research, and the NG DG LCA can add more information to the literature on China NG cases [
19]. In China, case studies based on data from real NG-based projects rather than simulations are relatively rare [
20,
21,
22,
23]. Wang Yanling et al. [
24] examined the comprehensive value of NG-based DES projects, with detailed calculation of economic value, user value, system value, and environmental value; however, that study did not use an LCA framework. Wang Weilin et al. [
25] took another case study, comparing the GHG emissions for cases in which heat, cooling, and electricity were provided individually, to examine the environmental performance of real projects. The efficiency of cooling, heat, and power (CHP) projects has been also analyzed [
26,
27]. It was found that in-depth efficiency analysis embedded in the LCA method may help to improve understanding of efficiency at different stages.
2.3. Background of the Sichuan NG DG Case
In this study, we conducted a detailed analysis on the energy and environmental and economic assessment of an NG DG project in China Resources Snow Breweries (CRSB) Company, Sichuan province, China. The case study will be beneficial both for academic research and policymaking through the provision of a large amount of specific and realistic data.
The studied case is the China Resources Snow Breweries DES project (CRSB) in Sichuan, which is the first DES project to provide electricity to the grid in China. The output data of this project are 31,160 MWh/year for electricity, 4990 GJ/year for cooling, and 95 thousand ton/year for steam [
28]. We have also conducted a field survey on the case study project and collected a large amount of energy use and efficiency data. The acquired data from the field survey will be used to assess this project, combined with data from other sources such as the literature, as described in
Section 4.
3. Methodology
3.1. Scenario Design
As
Table 2 shows, Scenario 1 (All NG) is the base scenario, which is the actual situation in which this project operated, and all the energy inputs to the project are NG. Scenario 2 (Coal + Grid Electricity) and Scenario 3 (All Coal) were used as references to assess the energy saving and GHG emissions reductions of the DES project. It was assumed that coal was used to generate heat and grid electricity was used to provide cooling and satisfy electricity demand in Scenario 2, whereas coal was used as the sole input to co-generate electricity, heat, and cooling in Scenario 3.
We also set three scenarios to investigate the performance of the renewable energy-based DES by considering the wind power, biomass, and solar power both on- and off-site. Scenario 4 (LSMU) used local solar power to provide part of the electricity demand and then follow Scenario 2. Scenario 5 (LBMU) used biomass (methane gas generated by wine lees) energy to provide the electricity demand and cooling and coal to provide heat. Scenario 6 (OWE) used wind power generated from the distant place to satisfy electricity demand and cooling, and coal to provide heat.
The local solar/biomass maximum utilization rate was set at an economically reasonable level in this study [
27]. We can assume local solar power provides part of the energy demand, leaving the rest satisfied by grid electricity. This is because Sichuan province is unique, having few solar resources and even scarcer wind power. However, this story does not hold for wind power. According to OSGeo, a GIS lab, Sichuan has an annual average wind speed of 1–2 m/s. The wind resource is negligible and the amount may fall below the economic threshold. Therefore, outside wind electricity from other provinces may be an appropriate substitute.
3.2. LCA System Boundary and Functional Unit
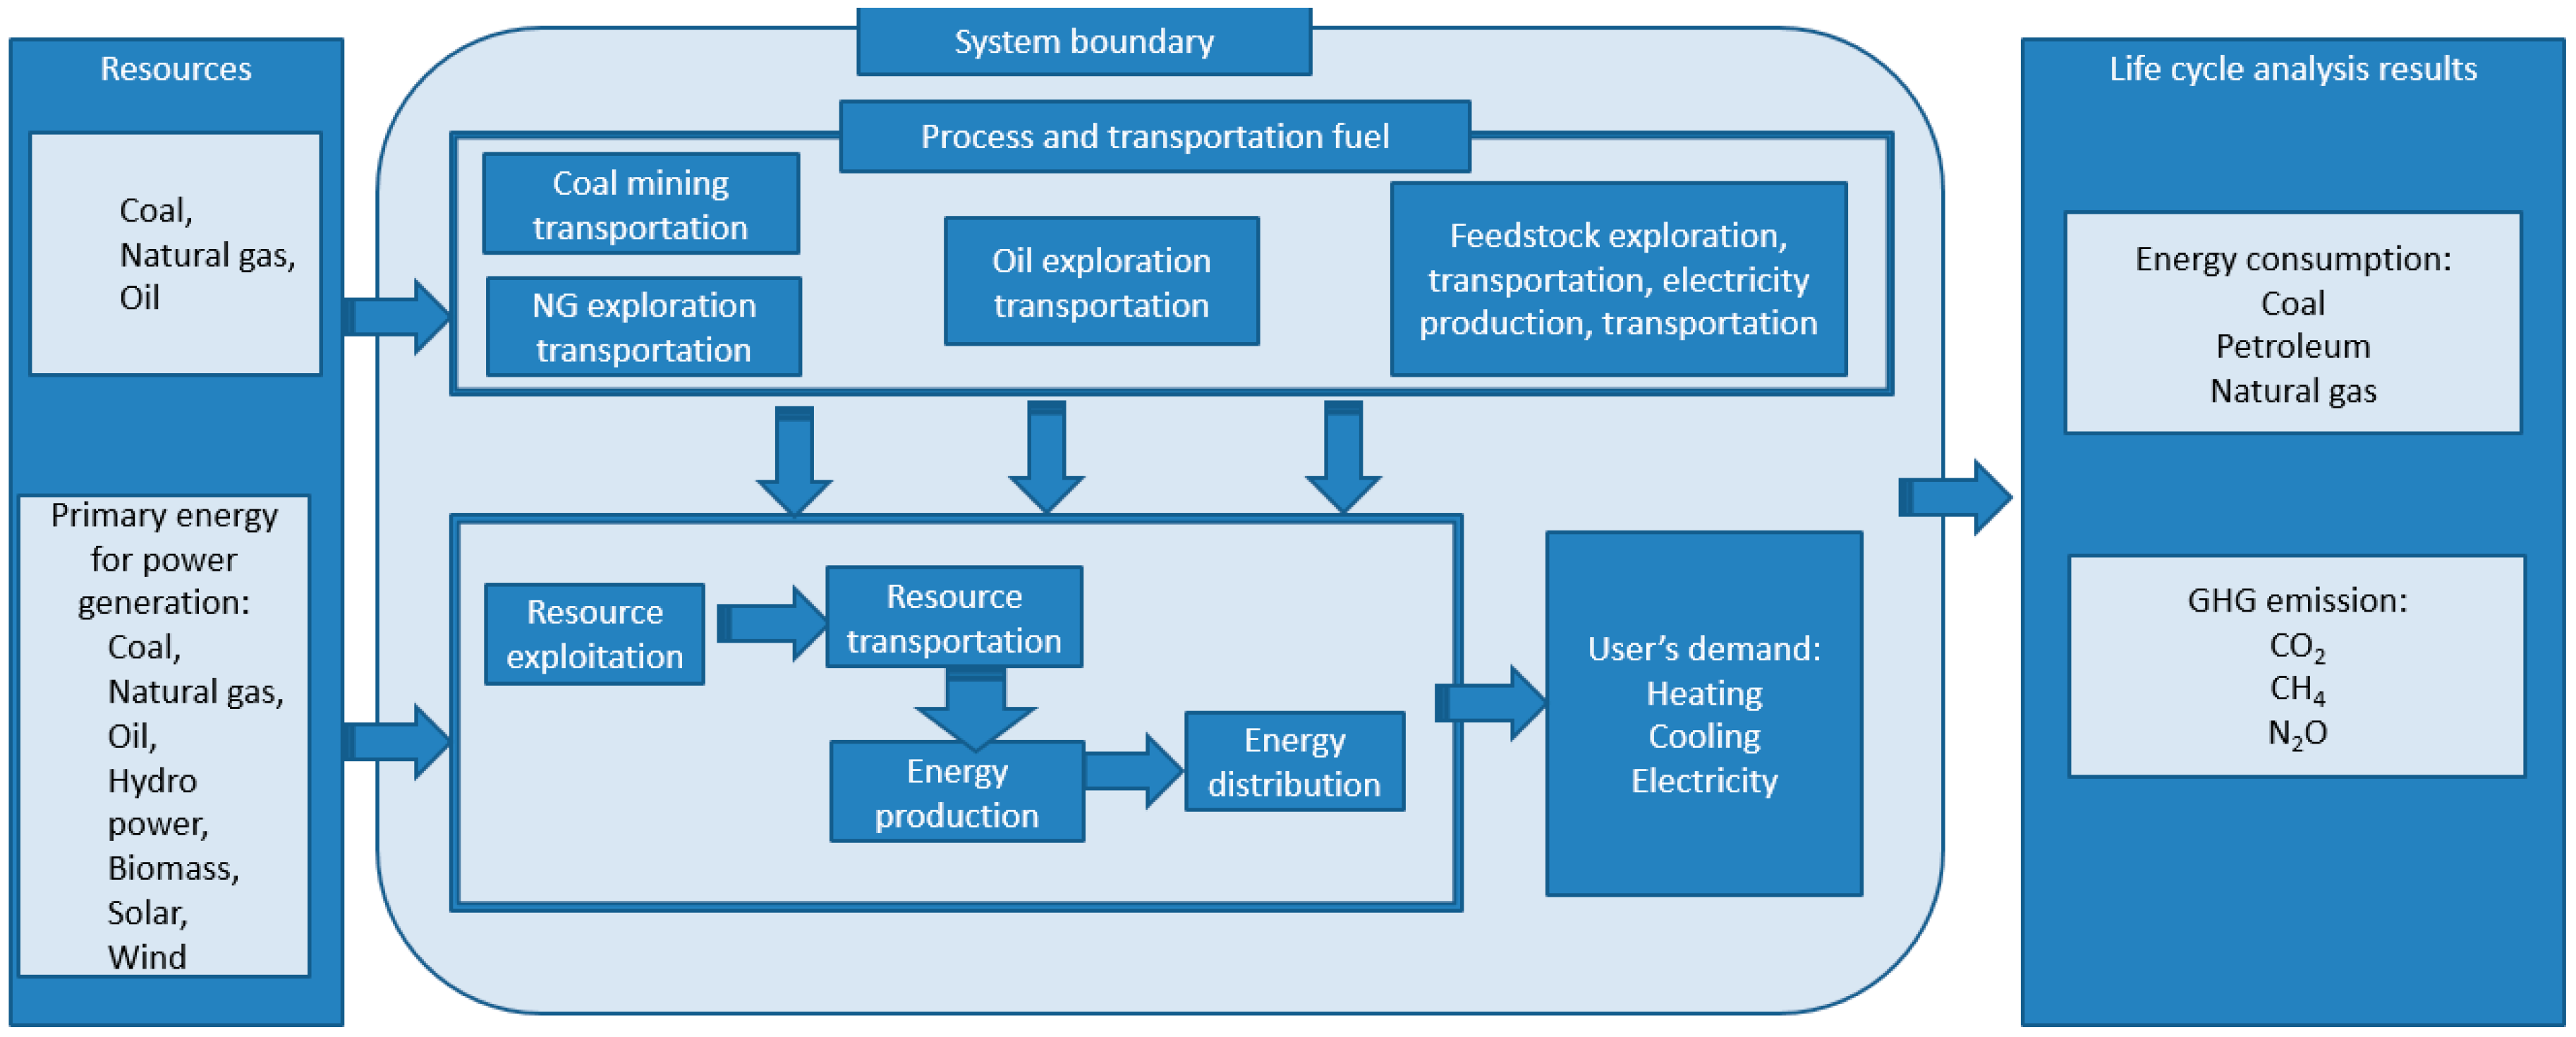
In this study, we conducted LCA of energy consumption and GHG emissions in the DES projects under different energy supply pathways. With energy services for user demand (electricity, heat, and cooling) held constant, the end-use energy demand was calculated given efficiency factors. Subsequently, the life cycle energy consumption and GHG emissions can be derived using the LCA method.
In the system boundary shown in
Figure 3, we consider the full life cycle energy consumption and GHG emissions in processes (such as transportation). The end-use energy generated for end users is transmitted into energy service including cooling, heating, and electricity. Life cycle fossil primary energy (coal, petroleum, and natural gas) and GHG (including CO
2, CH
4, and N
2O) emissions can be investigated using LCA (covering both the upstream and use stages) on the process and transportation fuel used for all stages (the resource exploration, transportation, and energy production and distribution sub-stages).
The functional unit is a compound unit, which includes the overall electricity, heat, and cooling service demand in a year from the system.
3.3. Calculation Methods
3.3.1. Key Variables Related to Life Cycle Stages and Pathways
The key variables related to life cycle stages and pathways are listed in
Table 3 and will be used in the calculations of life cycle fossil primary energy and GHG emissions. If
, the project is assumed to be set in a province that has nationwide average LCA energy consumption and GHG emission factors of electricity. If
, the energy service to be satisfied is the heating of the project, which is in the form of steam.
3.3.2. End-Use Energy Input
As Equation (1) shows, the total end-use energy input can be calculated based on the different type of energy service and the corresponding coefficient from energy to service by energy type.
where
is the end-use energy input of
type in scenario
, and
is the coefficient from energy type
to service
.
In Scenario 1, the natural gas consumption () data are provided. In Scenarios 2–6, energy service demand including cooling, heat (steam) and electricity are used to calculate energy input.
In Scenario 2, coal is burnt to generate heat, so coal consumption (
) depends on heat demand (
) and coal-heat efficiency (
) (Equation (2)).
Electricity input (
or
) is the sum of user’s electricity demand (
) and electricity used in cooling driven by cooling demand (
) and the coefficient of performance (COP,
and
) (Equation (3)). Note that the effect of substituting national level electricity (
) is discussed in the sensitivity analysis (
Section 5.3).
In Scenario 3, all demand is satisfied by burning coal (
), and the efficiency of coal-electricity (
) is indicated by Equation (4).
In Scenario 4, solar electricity can satisfy part of the electricity demand. Solar electricity (
) can be derived by geographic information (solar resources (
) and solar-electricity efficiency
), as shown in Equation (5). The remaining part follows the design of Scenario 2. Electricity bought (
) is the difference between
and
. , as shown in Equation (6).
In Scenario 5, methane is used to generate electricity, produce steam, and provide cooling. The equivalent electricity
is
plus the bioenergy used in heating, which is determined by
and methane-heat efficiency (
) (Equation (7)).
In Scenario 6, considering line loss (
), we can derive the wind electricity input (
) as follows (Equation (8)):
We can then can calculate the life cycle energy consumption and GHG emissions based on the energy input of each scenario.
3.3.3. Life Cycle Fossil Energy Consumption and GHG Emissions
Life cycle fossil primary energy consumption can be calculated based on end-use energy input and the life cycle energy coefficient (Equations (9) and (10)). Life cycle GHG emissions associated with energy consumption can be calculated using the corresponding lifecycle emissions coefficient (Equations (11) and (12)).
where
is the primary energy consumption
caused by energy input
;
is the primary energy consumption
in Scenario
;
is the total life cycle energy consumption in Scenario
;
is the life cycle GHG emissions
caused by energy input
;
is the life cycle GHG emissions
in scenario
; and
is total life cycle GHG emissions in Scenario
.
3.3.4. Energy Saving and GHG Emissions Reduction Rates
As Equations (13) and (14) show, we can calculate energy saving ratio
and GHG emissions reduction ratio
by comparing scenario
and
.
3.4. Calculation Method of Marginal CO2 Abatement Cost
We derive the marginal abatement cost (
) by dividing the difference of cost
by the GHG emissions reduction
) between Scenario 1 and 2 (Equations (15)–(17)). The cost is defined as cost to the national economy, excluding tax or subsidies. The cost should include fuel cost, import of electricity, annual operation, and investment cost.
where
is the cost in Scenario 1;
is the cost in Scenario 2;
is the GHG emissions in Scenario 1;
is the GHG emissions in Scenario 2;
is the NG price;
denotes the annual operation and investment cost in Scenario 1;
is the electricity price;
is the coal price; and
denotes the annual operation and investment cost in Scenario 1.
If we further assume that
is equal to
,
may be calculated as follows (Equation (18).
4. Key Data and Assumptions
In
Table 4,
Table 5 and
Table 6, we provide the key data and assumptions for LCA energy and GHG analysis. Most of these were taken from the literature [
12,
13,
25,
28,
29] and the remainder are based on our on-site survey. The life cycle fossil energy factors and GHG factors for coal and NG were both taken from our previous studies [
12,
13].
We assume prices of natural gas, coal, and electricity to prepare for abatement cost analysis, based on the wind.net database (
http://wind.net/) and electricity policy in China, as
Table 7 shows. The prices are average numbers. The RMB/USD exchange rate, which is assumed to be 6.6, are taken between 1 June 2015 and 1 June 2017.
5. Results and Discussions
5.1. Life Cycle Energy Consumption and GHG Emissions
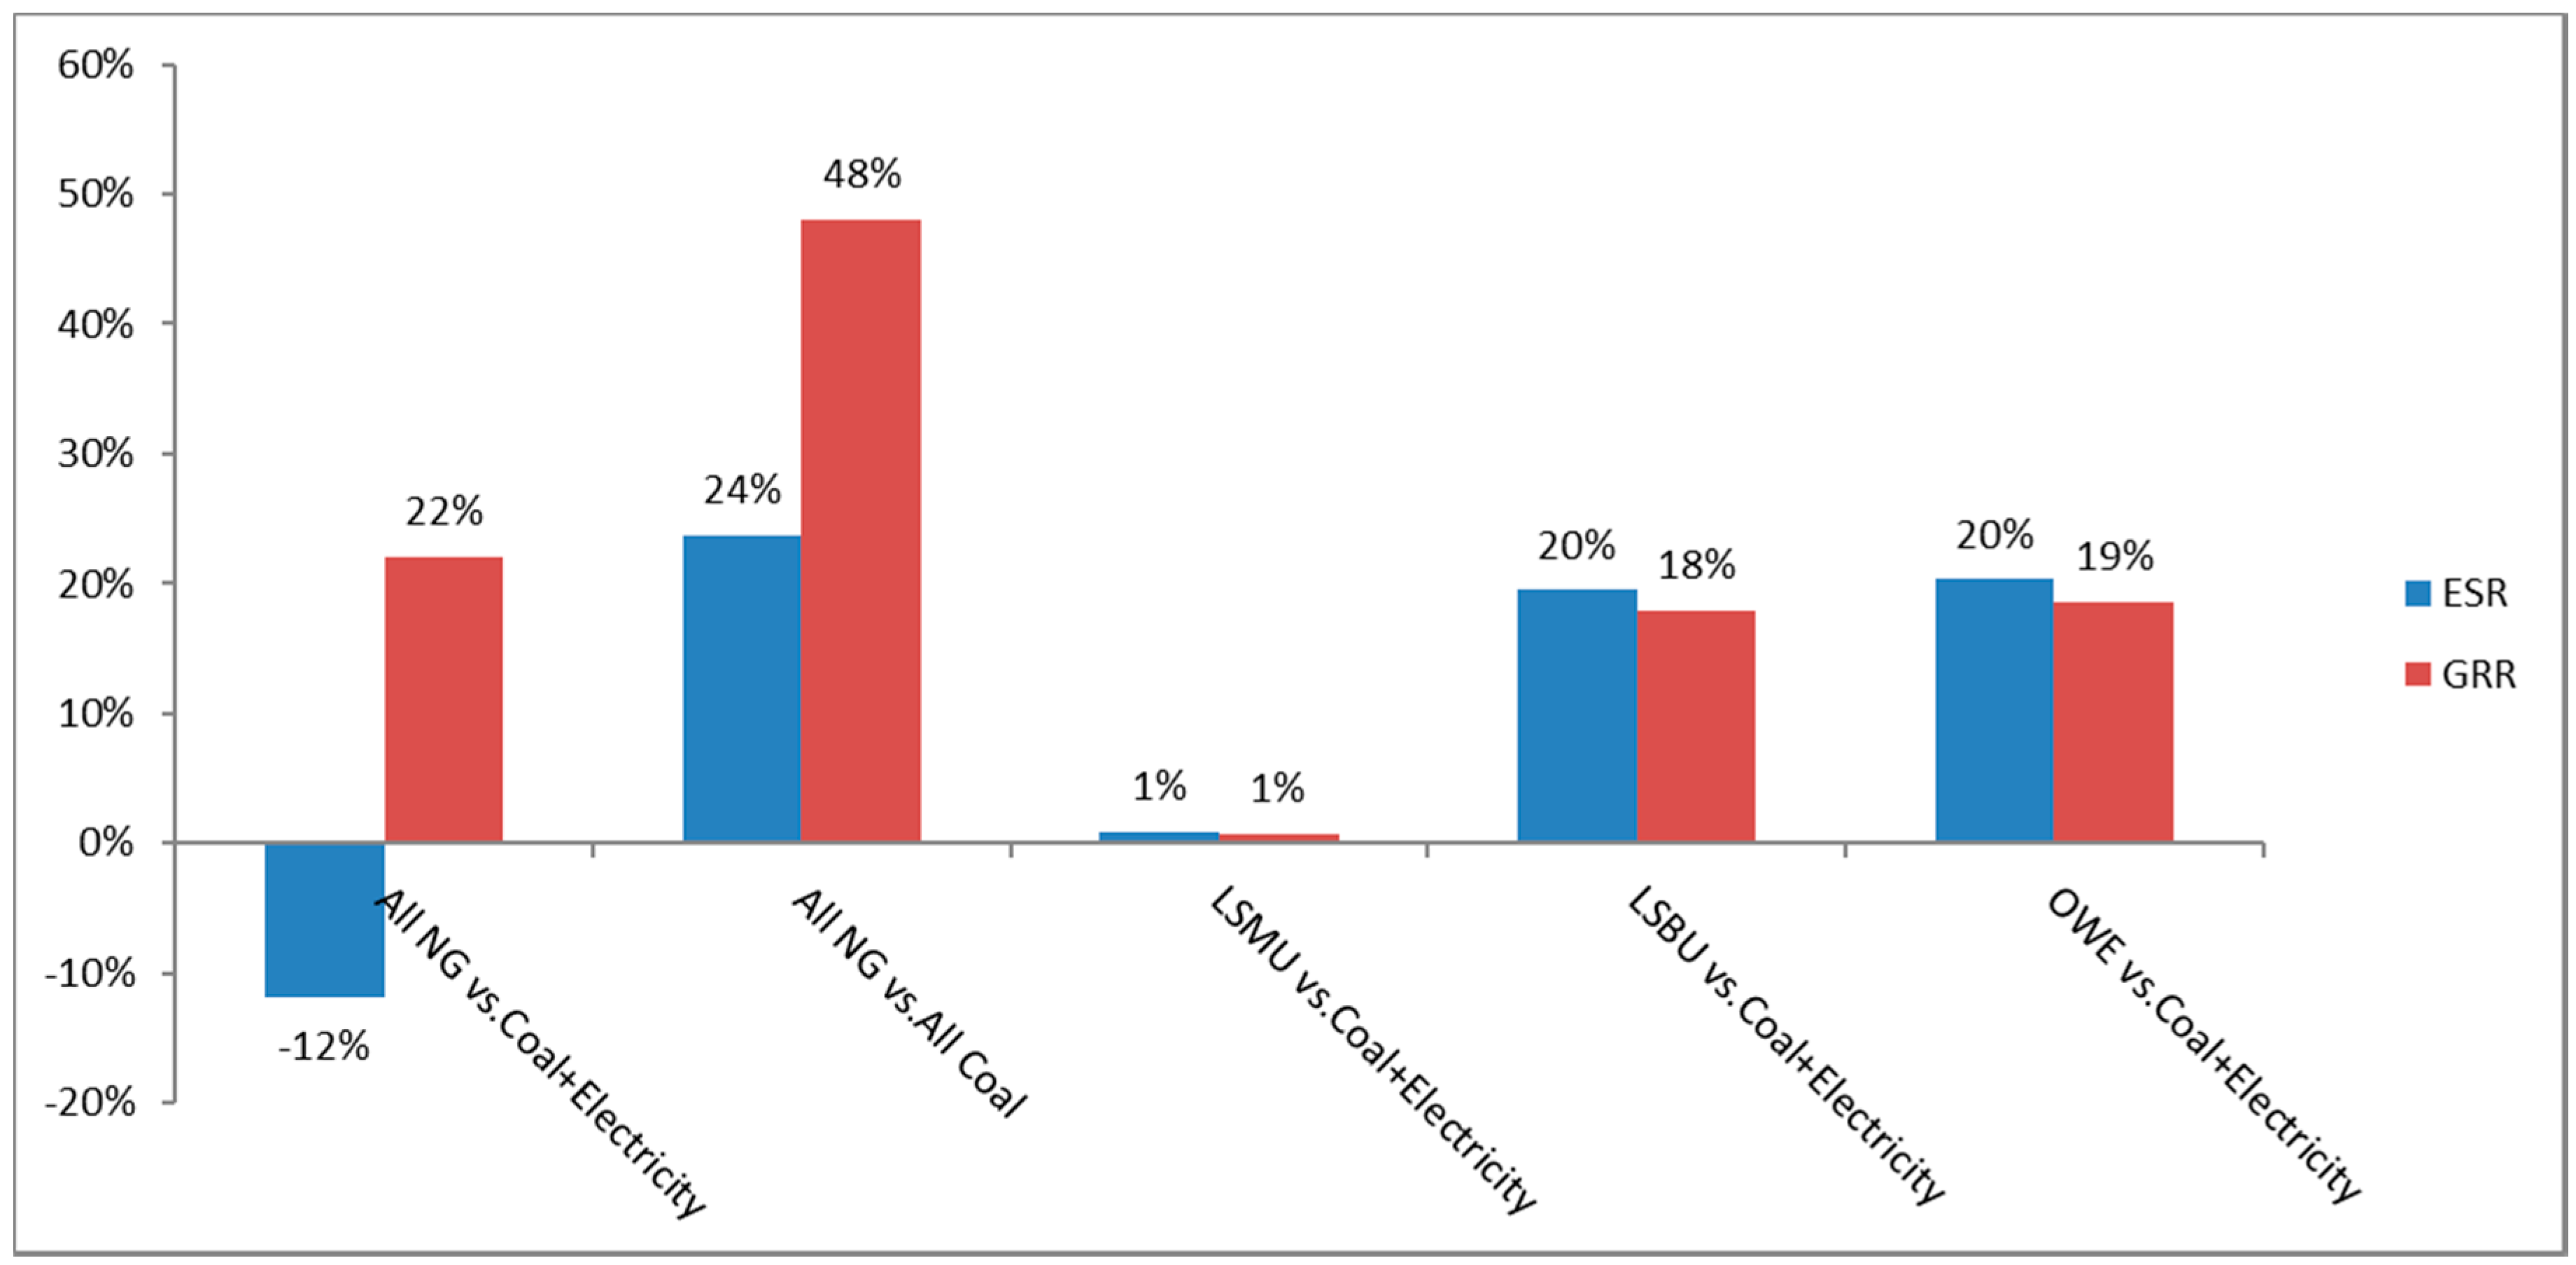
The life cycle energy saving and GHG emissions reduction between different scenarios are shown in
Figure 4. The NG-based DG project (All NG scenario, Scenario 1) will increase energy use by 12% and save energy by 24% compared with the Coal + Grid Electricity scenario (Scenario 2) and All Coal scenario (Scenario 3), respectively. Although the energy saving effect is limited, this DG project can reduce GHG emissions by 22% and 48% compared with the Coal + Grid Electricity scenario (Scenario 2) and All Coal scenario (Scenario 2), respectively, and it thus represents a major advantage over traditional energy pathways.
Because solar power is constrained by local resources, the LSMU scenario (Scenario 4) cannot save energy or reduce GHG emissions significantly compared with the Coal + Grid Electricity scenario (Scenario 2). This scenario (biomass using wine lees) may have a great potential in energy saving and emissions reduction, and the LBMU scenario (Scenario 5) can save 20% energy and reduce GHG emissions by 18% compared with the Coal + Grid Electricity scenario (Scenario 2). The OWE scenario (Scenario 6) can save energy by 20% and reduce GHG emissions by 19% compared with the Coal + Grid Electricity scenario (Scenario 2).
Life cycle primary fossil energy consumption in different scenarios is shown in
Table 8. Development of the NG DG project can substitute coal with NG, which is cleaner and lower carbon.
The GHG emissions can also be decomposed by gas type as
Table 9 shows. Of these, CO
2 dominates the GHG (about 98–99%).
5.2. The Result of Marginal Abatement Cost
It is estimated that the marginal abatement cost of the Sichuan DES Project is about 51 USD/ton CO
2 equivalents. This figure is between the level in the Shanghai thermal electricity industry (34.4 USD/ton) and the level in Sichuan province (65.7 USD/ton) [
30,
31]. The former is an upgrade program for traditional thermal electricity plant, and the latter is the marginal abatement cost of current economy.
The result shows that it is more economically efficient to upgrade traditional thermal electricity plant in a nationwide context, but in a given province, DG program is positioned in the marginal cost curve below the equilibrium point, so the development of DG is efficient in a certain area.
5.3. Discussion on the Impacts of Selling Surplus Electricity to the Public Grid and Carbon Intensity of Regional Grid
The project can sell surplus electricity to the public grid, paving the way for a larger clean substitution effect. If the project uses more NG to produce 10% more electricity and sells them to the local Sichuan electricity grid, the NG-based DG project would reduce GHG emissions at a rate of 24% (from the original 22% in
Section 5.1) compared with the Coal + Grid Electricity scenario.
The project is located in Sichuan province, where hydropower accounts for a large part of the electricity mix (about 3/4) and grid electricity’s emissions are relatively small compared with those of coal-dominated electricity grid. If the NG DG model is applied in other provinces where the electricity mix contains more thermal electricity, a greater level of energy saving and GHG emissions reduction effects can be expected. For example, the NG-based DG project can reduce GHG emissions at the rate of 42% (from the original 22% in Sichuan province) at the average national level.
5.4. Sensitivity Analysis
To illustrate the robustness of results, we alter the coefficients. Since we focus on the NG pathway compared with the conventional coal and public grid combined pathway,
,
, and
are changed by 10% and 30%. As
Table 10 shows,
is the only influential factor. Note that the boiler efficiency will reach 100% if the former assumption is increased by 25%; we can be confident that a 5% GHG emissions reduction rate (GRR) can be guaranteed and the potential of GHG emission reduction can be up to 42% in regions where boiler efficiency is low.
To test the performance of projects based on different types of gas supply, we assume liquified natural gas (LNG) is used in the CRSB project, with LCA factor in line with results in previous research [
32], which is listed in
Table 11 under different assumptions of LNG calorific values. As
Table 11 shows, results of GRR comparing All NG with Coal + Electricity and that comparing All NG with All Coal are not significantly different from results in 4.1. Thus, the source of natural gas is not an important factor determining the GHG emission reduction performance of DG projects.
5.5. Comparison with Similar Studies
It is important to compare the results of this study with those in other literature. Here, we focus on the GHG emissions GRR between the NG pathway compared with the conventional coal and public grid combined pathway.
As shown in
Table 12, the results in this study were different from previous international findings [
16,
33,
34] because the GHG emissions level of the grid in the studied project is low due to the large contribution of hydro power. However, if the project can supply electricity to other regions in China, the GHG emissions reduction effect is expected to be similar to that shown in other countries. These findings indicate that NG DG projects may have great potential for GHG emissions reduction in China.
In a general perspective, DG can be an effective tool to solve the global climate change or clean production problems, although the effects may vary in different regions, admittedly. As
Section 5.4 shows, the source of natural gas is not influential, so the decision of NG DG investment by different regions should be based on other factors, including economic efficiency and systematic value to the grid.
6. Concluding Remarks
We present a case study of the Sichuan CRSB DES project, analyzing the advantages of NG DG projects in life cycle energy consumption and GHG emissions reduction.
The NG-based DG project (in the All NG scenario) can reduce GHG emissions by 22% but increase energy consumption by 12% compared with the scenario of using coal combined with grid electricity as an energy input. This project can save 24% of energy and reduce GHG emissions by 48% compared with the scenario in which all of the energy input is coal, from the perspective of LCA. Surplus electricity sales enable further energy saving and GHG emissions reduction.
It is found that renewable energy DG has the potential to enhance energy conservation and reduce GHG emissions. The LBMU scenario, in which biomass energy is utilized, saves 20% energy and reduces GHG emissions by 18% compared with the Coal + Grid Electricity scenario.
It is estimated that the marginal abatement cost of this DES Project is between the level of the Shanghai thermal electricity industry (34.4 USD/ton) and the level in Sichuan Province (65.7 USD/ton). Such NG DG projects can strike a balance between the economy and low carbon in a provincial context.
It is found that the source of natural gas is not an important factor determining the GHG emission reduction performance of DG projects by sensitivity analysis, and DG can be an effective tool for solving the global climate change or clean production problem, although the effects may vary in different regions, admittedly, when our study results are compared with similar studies.
That is to say, the source of natural gas supply is not the decisive factor of NG DG performance in a country, so the mapping between DG development and country traits should be based on other factors including economic efficiency and systematic value. The performance varied in different regions, with high potential in areas where boiler efficiency is low.
In conclusion, the paper used the China case study to indicate the comprehensive benefits of NG DG projects, which can be an effective solution to striking the balance between stable supply and clean production. Based on the results, policymakers should support the development of NG-based DG projects in China, especially in areas where electricity is generated with high GHG emission, and a developed institution for DG electricity to be sold to the grid is especially important. When it comes to DG in a global context, there is great potential of GHG emission reduction in other regions. Although the natural gas resource is not the bottleneck, other factors can be researched deeper by following research.


