3.1. Impedance Phase Shift with Equilibrium Temperature at 10 Hz
Many studies have elucidated that the EIS characteristics of battery are dramatically impacted by the external environment and internal conditions, especially the temperature [
16,
17,
18,
19,
20,
32]. The electrochemical reaction rate, transfer rate and diffusion rate of lithium-ion are slowed down resulting from the temperature decreasing [
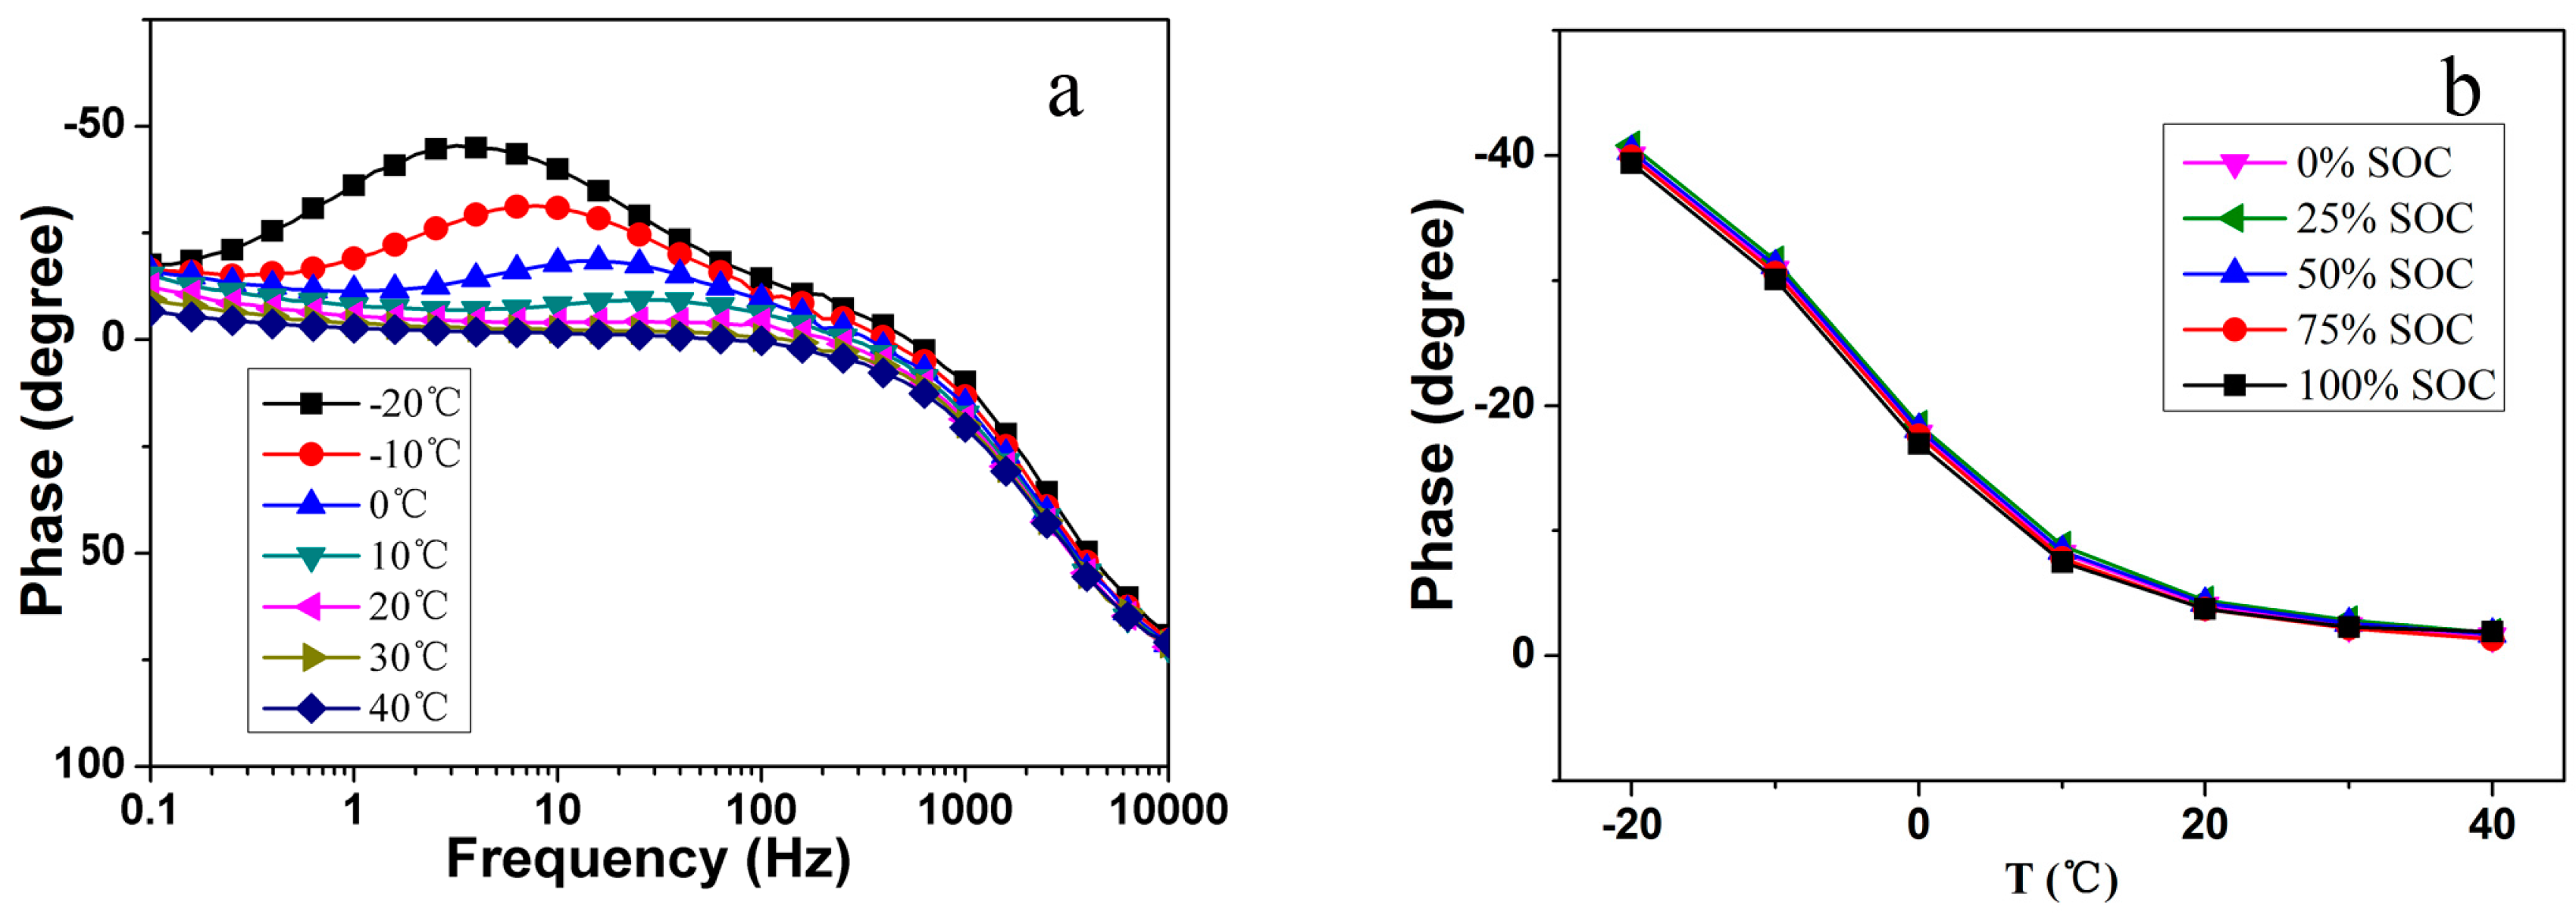
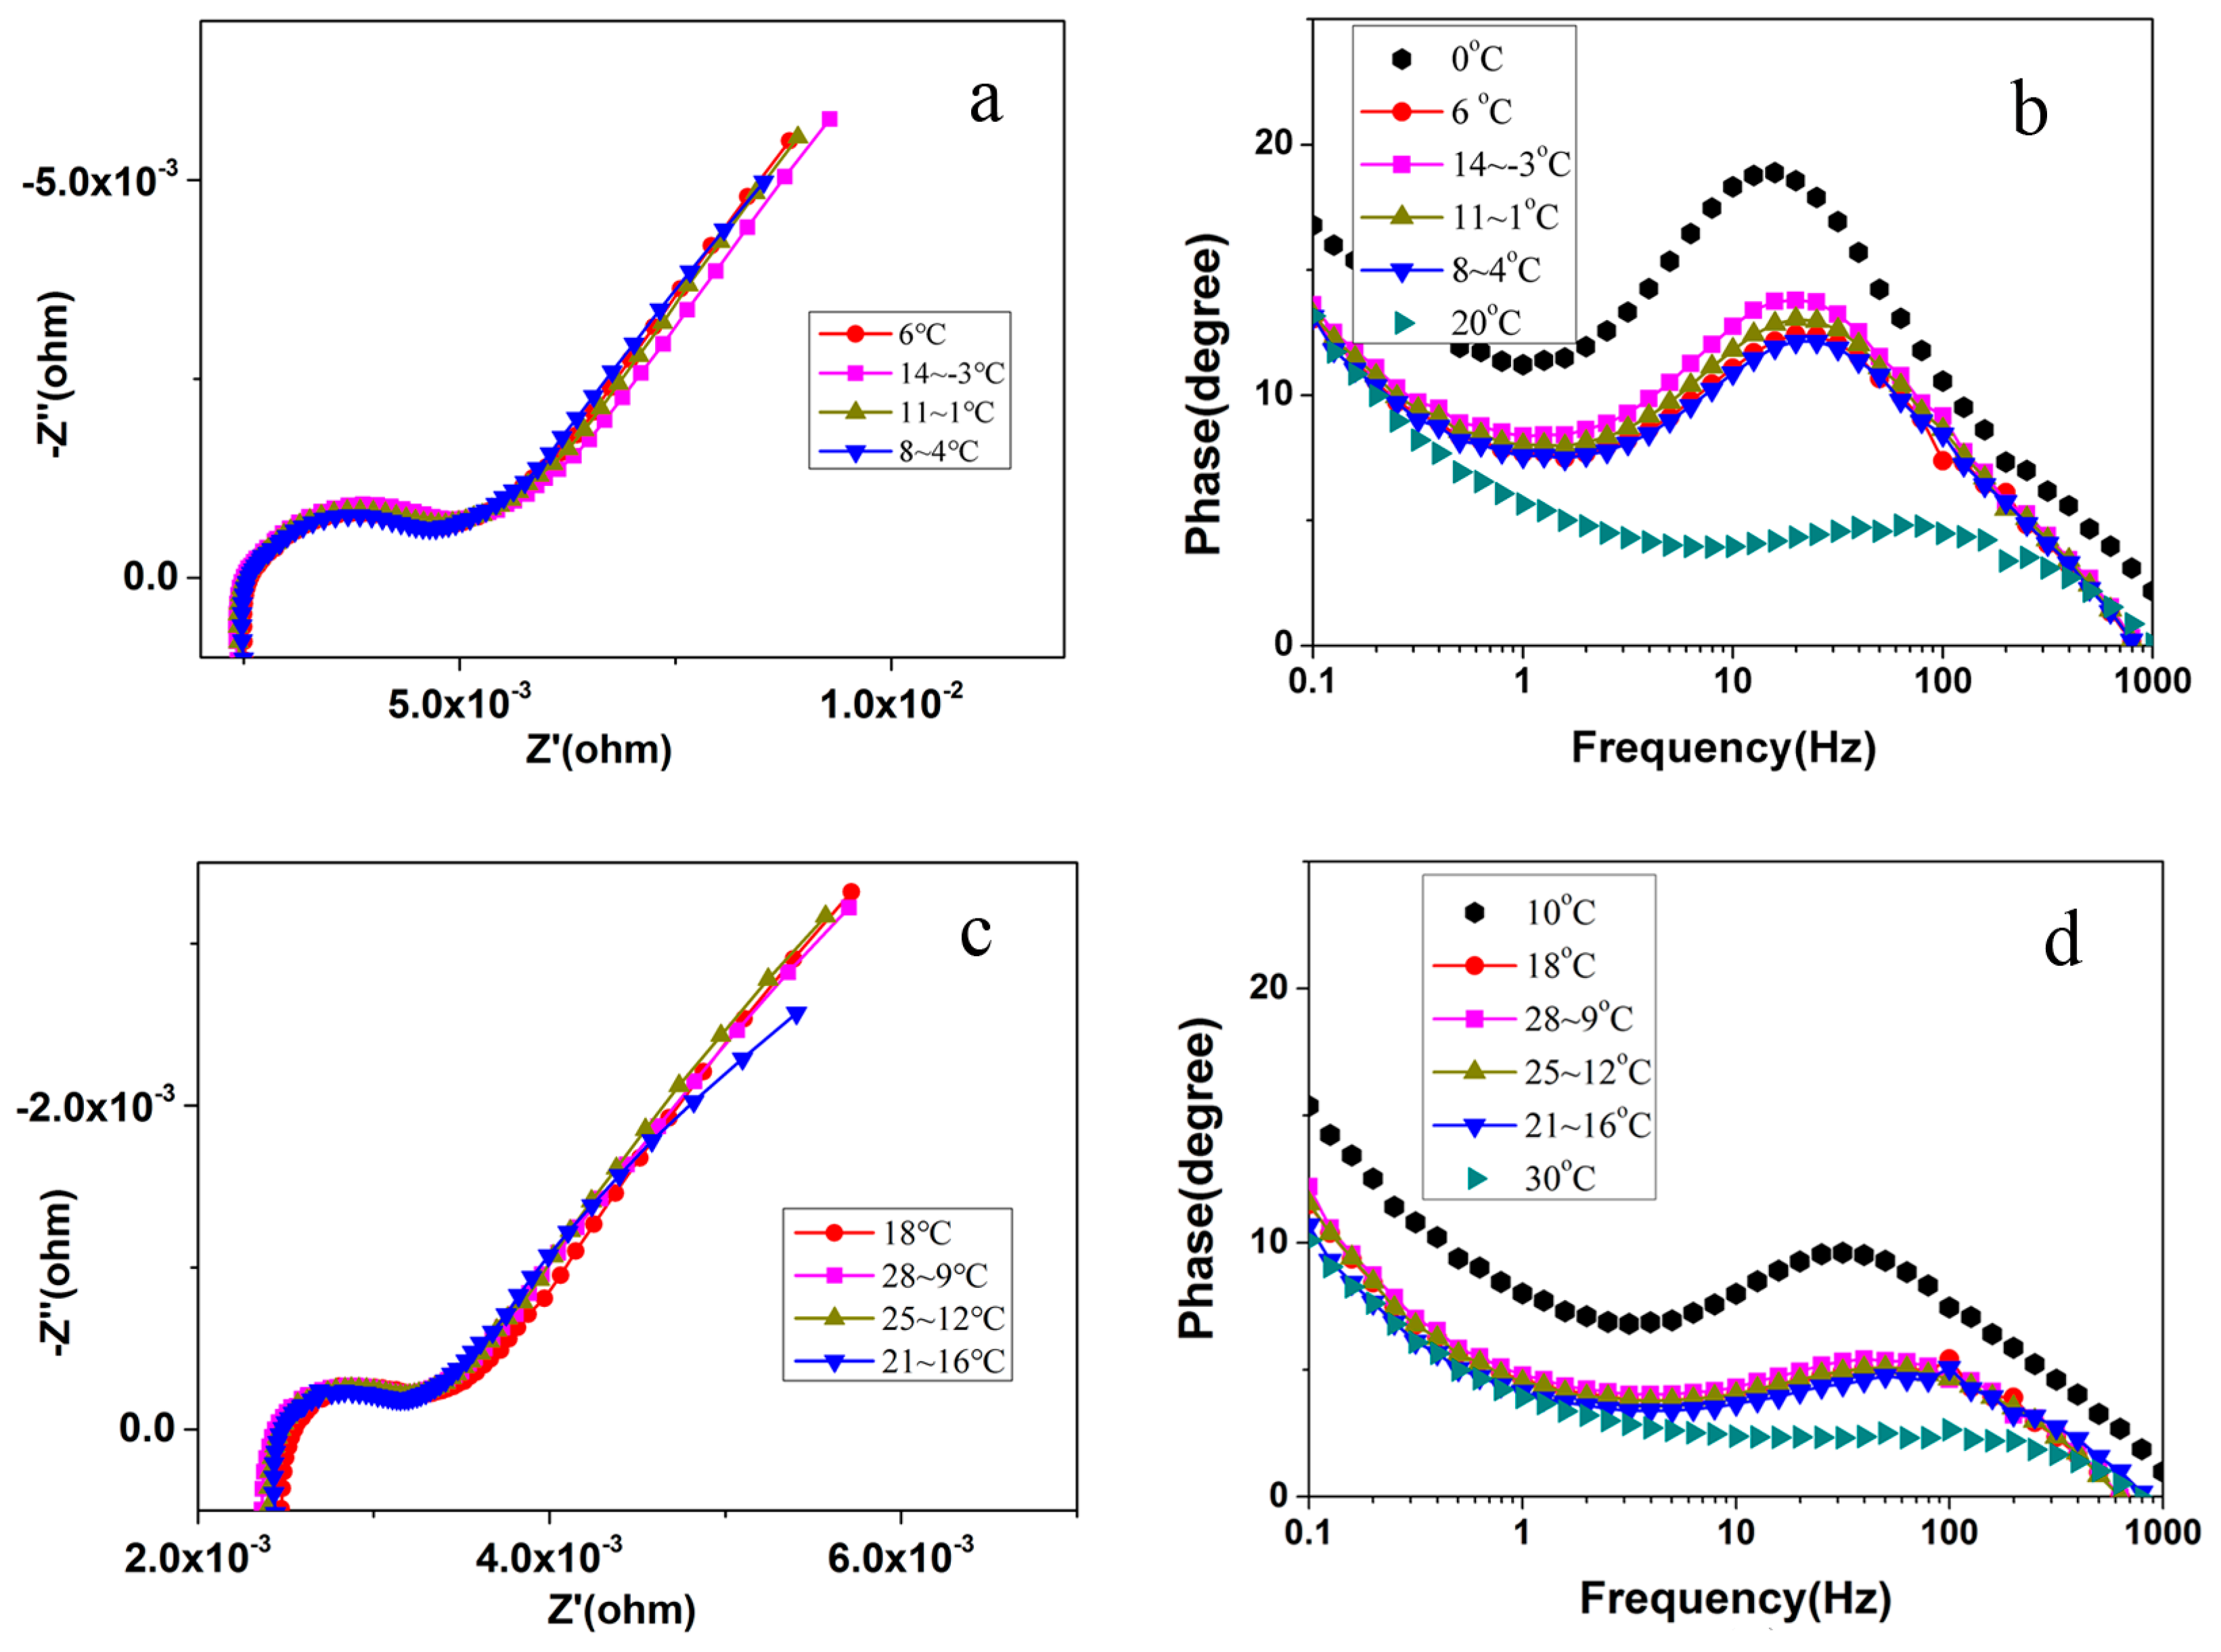
32], so the lower temperature enlarges the battery impedance. The EIS procedures A1 are performed and the results are illustrated in
Figure 4a. As can be seen, the phase shift changes distinctly with the temperature in the whole frequency range. The relationship between impedance phase shift and battery temperature at 10 Hz is indicated in
Figure 4b. A certain frequency range, which is able to exclude the influence of SoC and battery aging on the impedance phase shift, was selected in previous research [
4,
20]. As illustrated in
Figure 4b, the phase shift does not alter with SoC at 10 Hz, which facilitates the impedance-based temperature estimator design since the SoC often visibly changes and is hard to be estimated and calculated in the vehicular application. The phenomenon mainly related to battery electrochemical reaction and diffusion process has been interpreted in our previous study from the electrochemical perspective [
20]. In this study, we utilize the phase shift values at 10 Hz tentatively to track the battery internal temperature for the representative of other available frequency points, and the relationship between phase shift and temperature is employed as a reference for the estimation model in the next section.
3.2. Impedance Phase Shift with Artificial Temperature Gradients
Some typical EIS measurements at 50% SoC and with different temperature gradients from procedures B1 are depicted in
Figure 5. Different temperature gradients are artificially constructed by controlling the temperature of the ambient environment and the heating plate. Because of heat dissipation between cells and the environment, the battery surface temperatures are different with the setting values, so the actual measured values displayed in
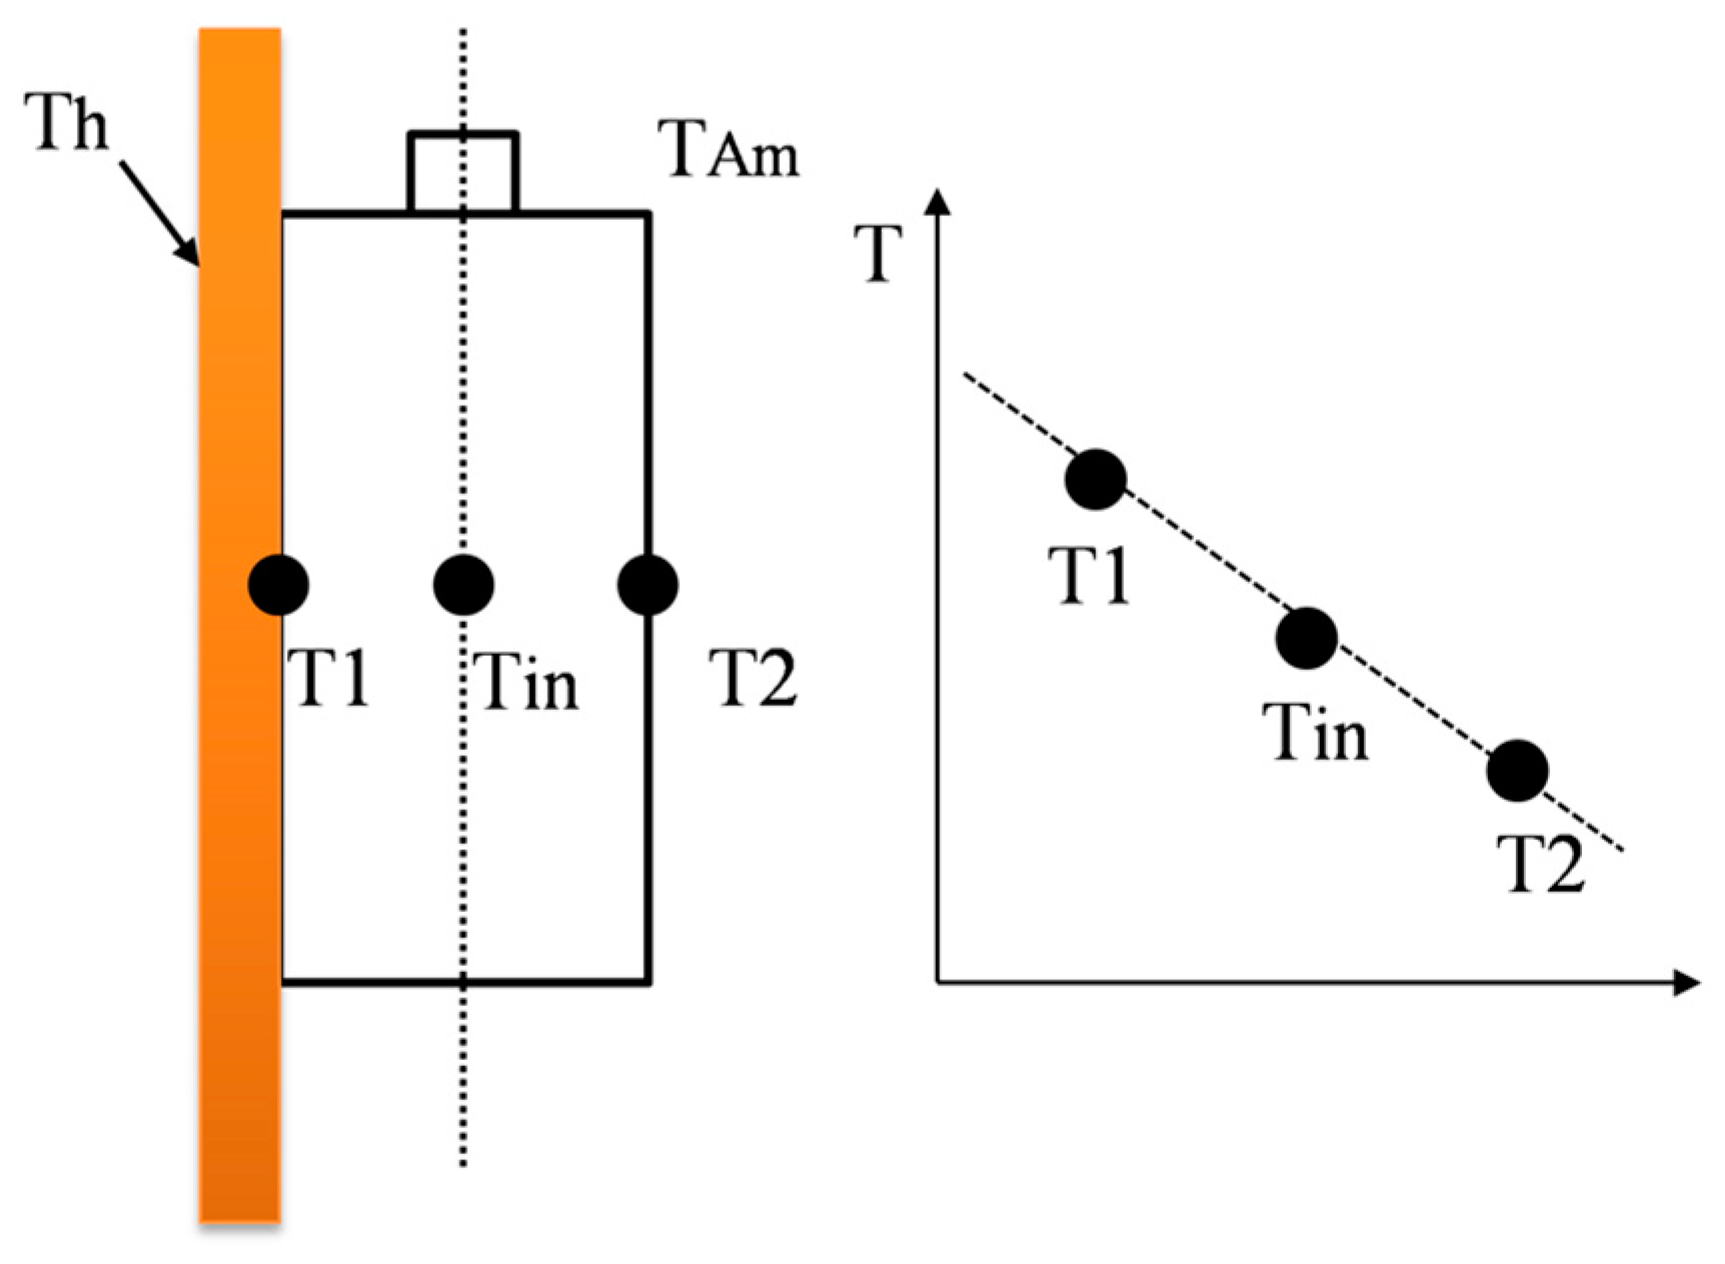
Table 3 are used in the paper. The internal temperatures of 6 °C, 9 °C, 12 °C, 18 °C and 22 °C were measured at the central position, and 6 °C (
Figure 5a,b) and 18 °C (
Figure 5c,d) are presented here for the representative. The black, red and dark cyan color lines represent the battery phase shift measured with thermal equilibrium. The gradient perpendicular to the electrodes is assumed to be linear, as shown in
Figure 3. In
Figure 5, the impedance spectroscopy and phase shift values are almost the same, even with different temperature gradients, and the effect of high temperature gradients on the phase shift is slightly larger in medium frequencies. It indicates that even under temperature gradients, the cell performs as under a uniform temperature with electrochemical equilibrium. The experimental results are beneficial to the impedance-based estimation method. The effect of temperature non-uniformity on the electrochemical impedance was studied by Schmidt et al. [
17], who also proposed that the uniform temperature was the cell internal average temperature based on the impedance results at high frequencies. The variation of the phase shift in our paper may be related to cell impedance characteristics and the experiments schemes. Anticipated detailed interpretation for the measured results will be in next study.
3.3. Impedance Phase Shift Correction Considering Relaxation Time
Because of the complexity of the battery charge and discharge process in practical applications, there is seldom sufficient time to satisfy the cell to reach electrochemical equilibrium. The short-term current interruption, such as waiting at red lights, may be the opportunity for AC incentives. Barai et al. [
33] and Schindler et al. [
34] have studied the impedance of lithium ion cell with different relaxation process between the removal of an electrical load and the impedance measurement. We find that the phase shift is also correlative to relaxation time, especially when the battery is at low temperatures. The impedance measurements are taken after current pulses; when the battery temperature reaches an approximate steady state (200 cycles), the current is switched off to allow the impedance test with different relaxation time.
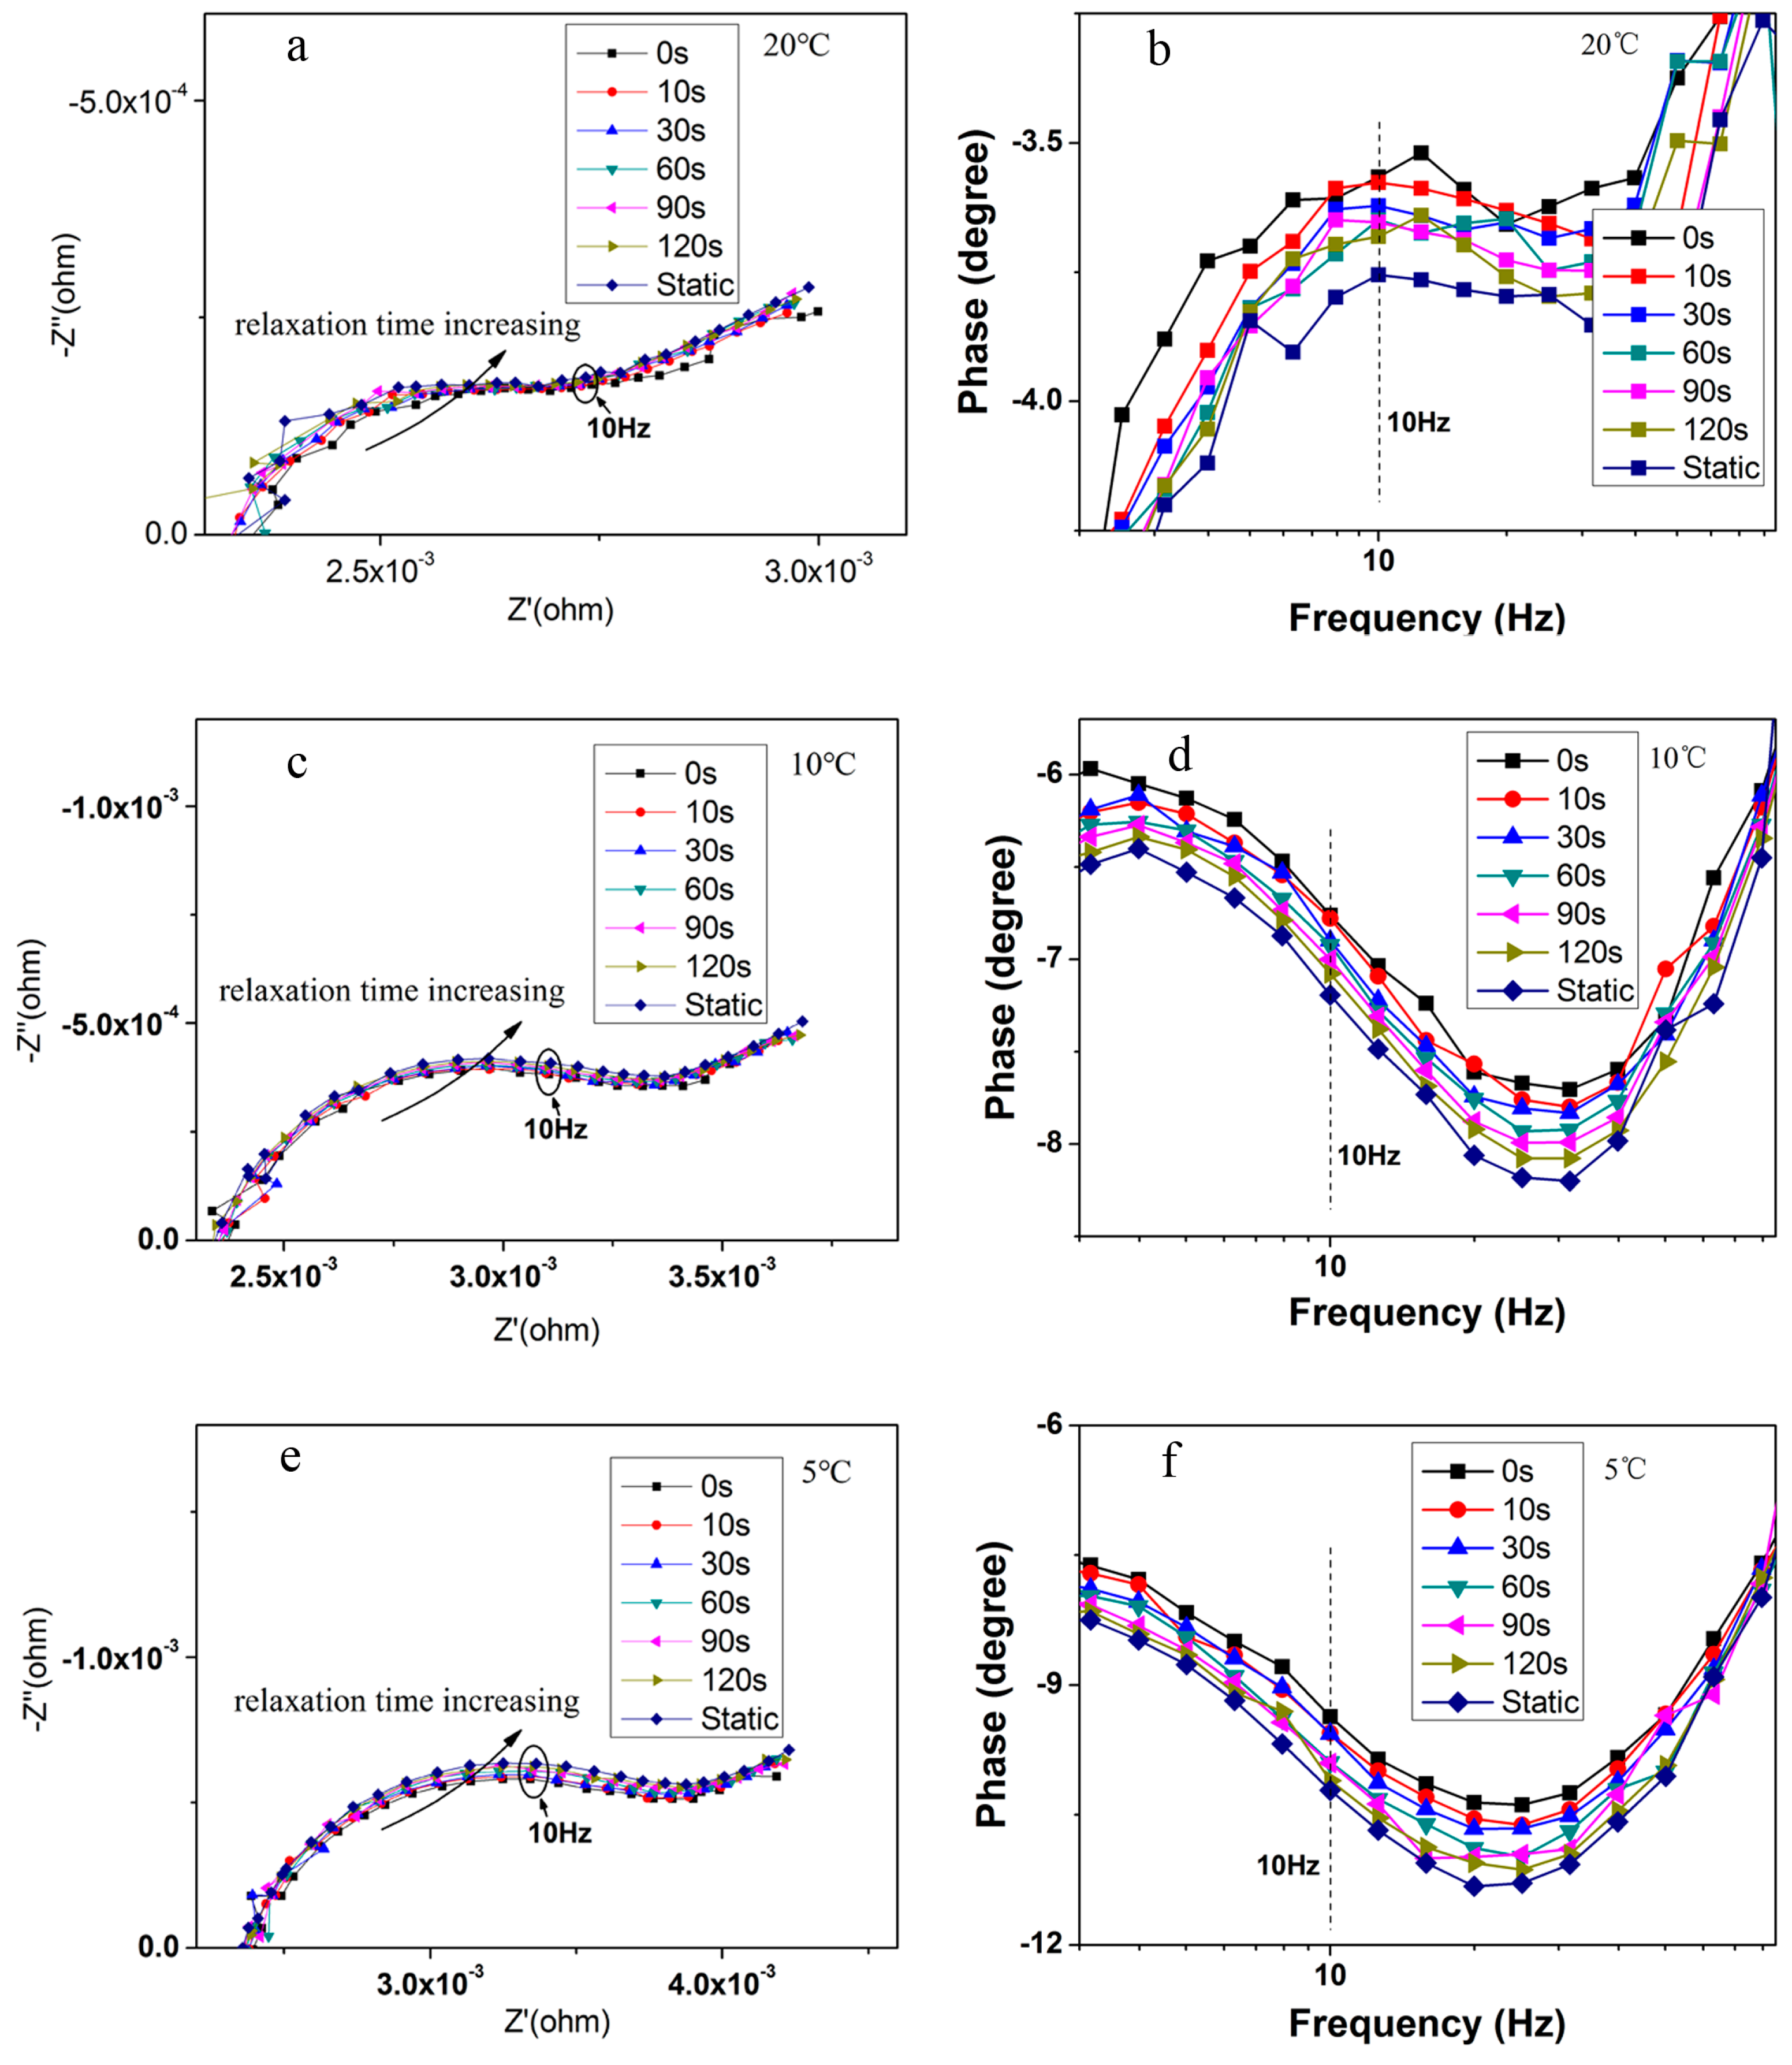
The evolution of the impedance spectra and phase shift directly after switch-off the pulse current is illustrated for the tests of C1 and C2 in
Figure 6. The impedance arc enlarges and the phase shift goes down with the elevation of relaxation time.
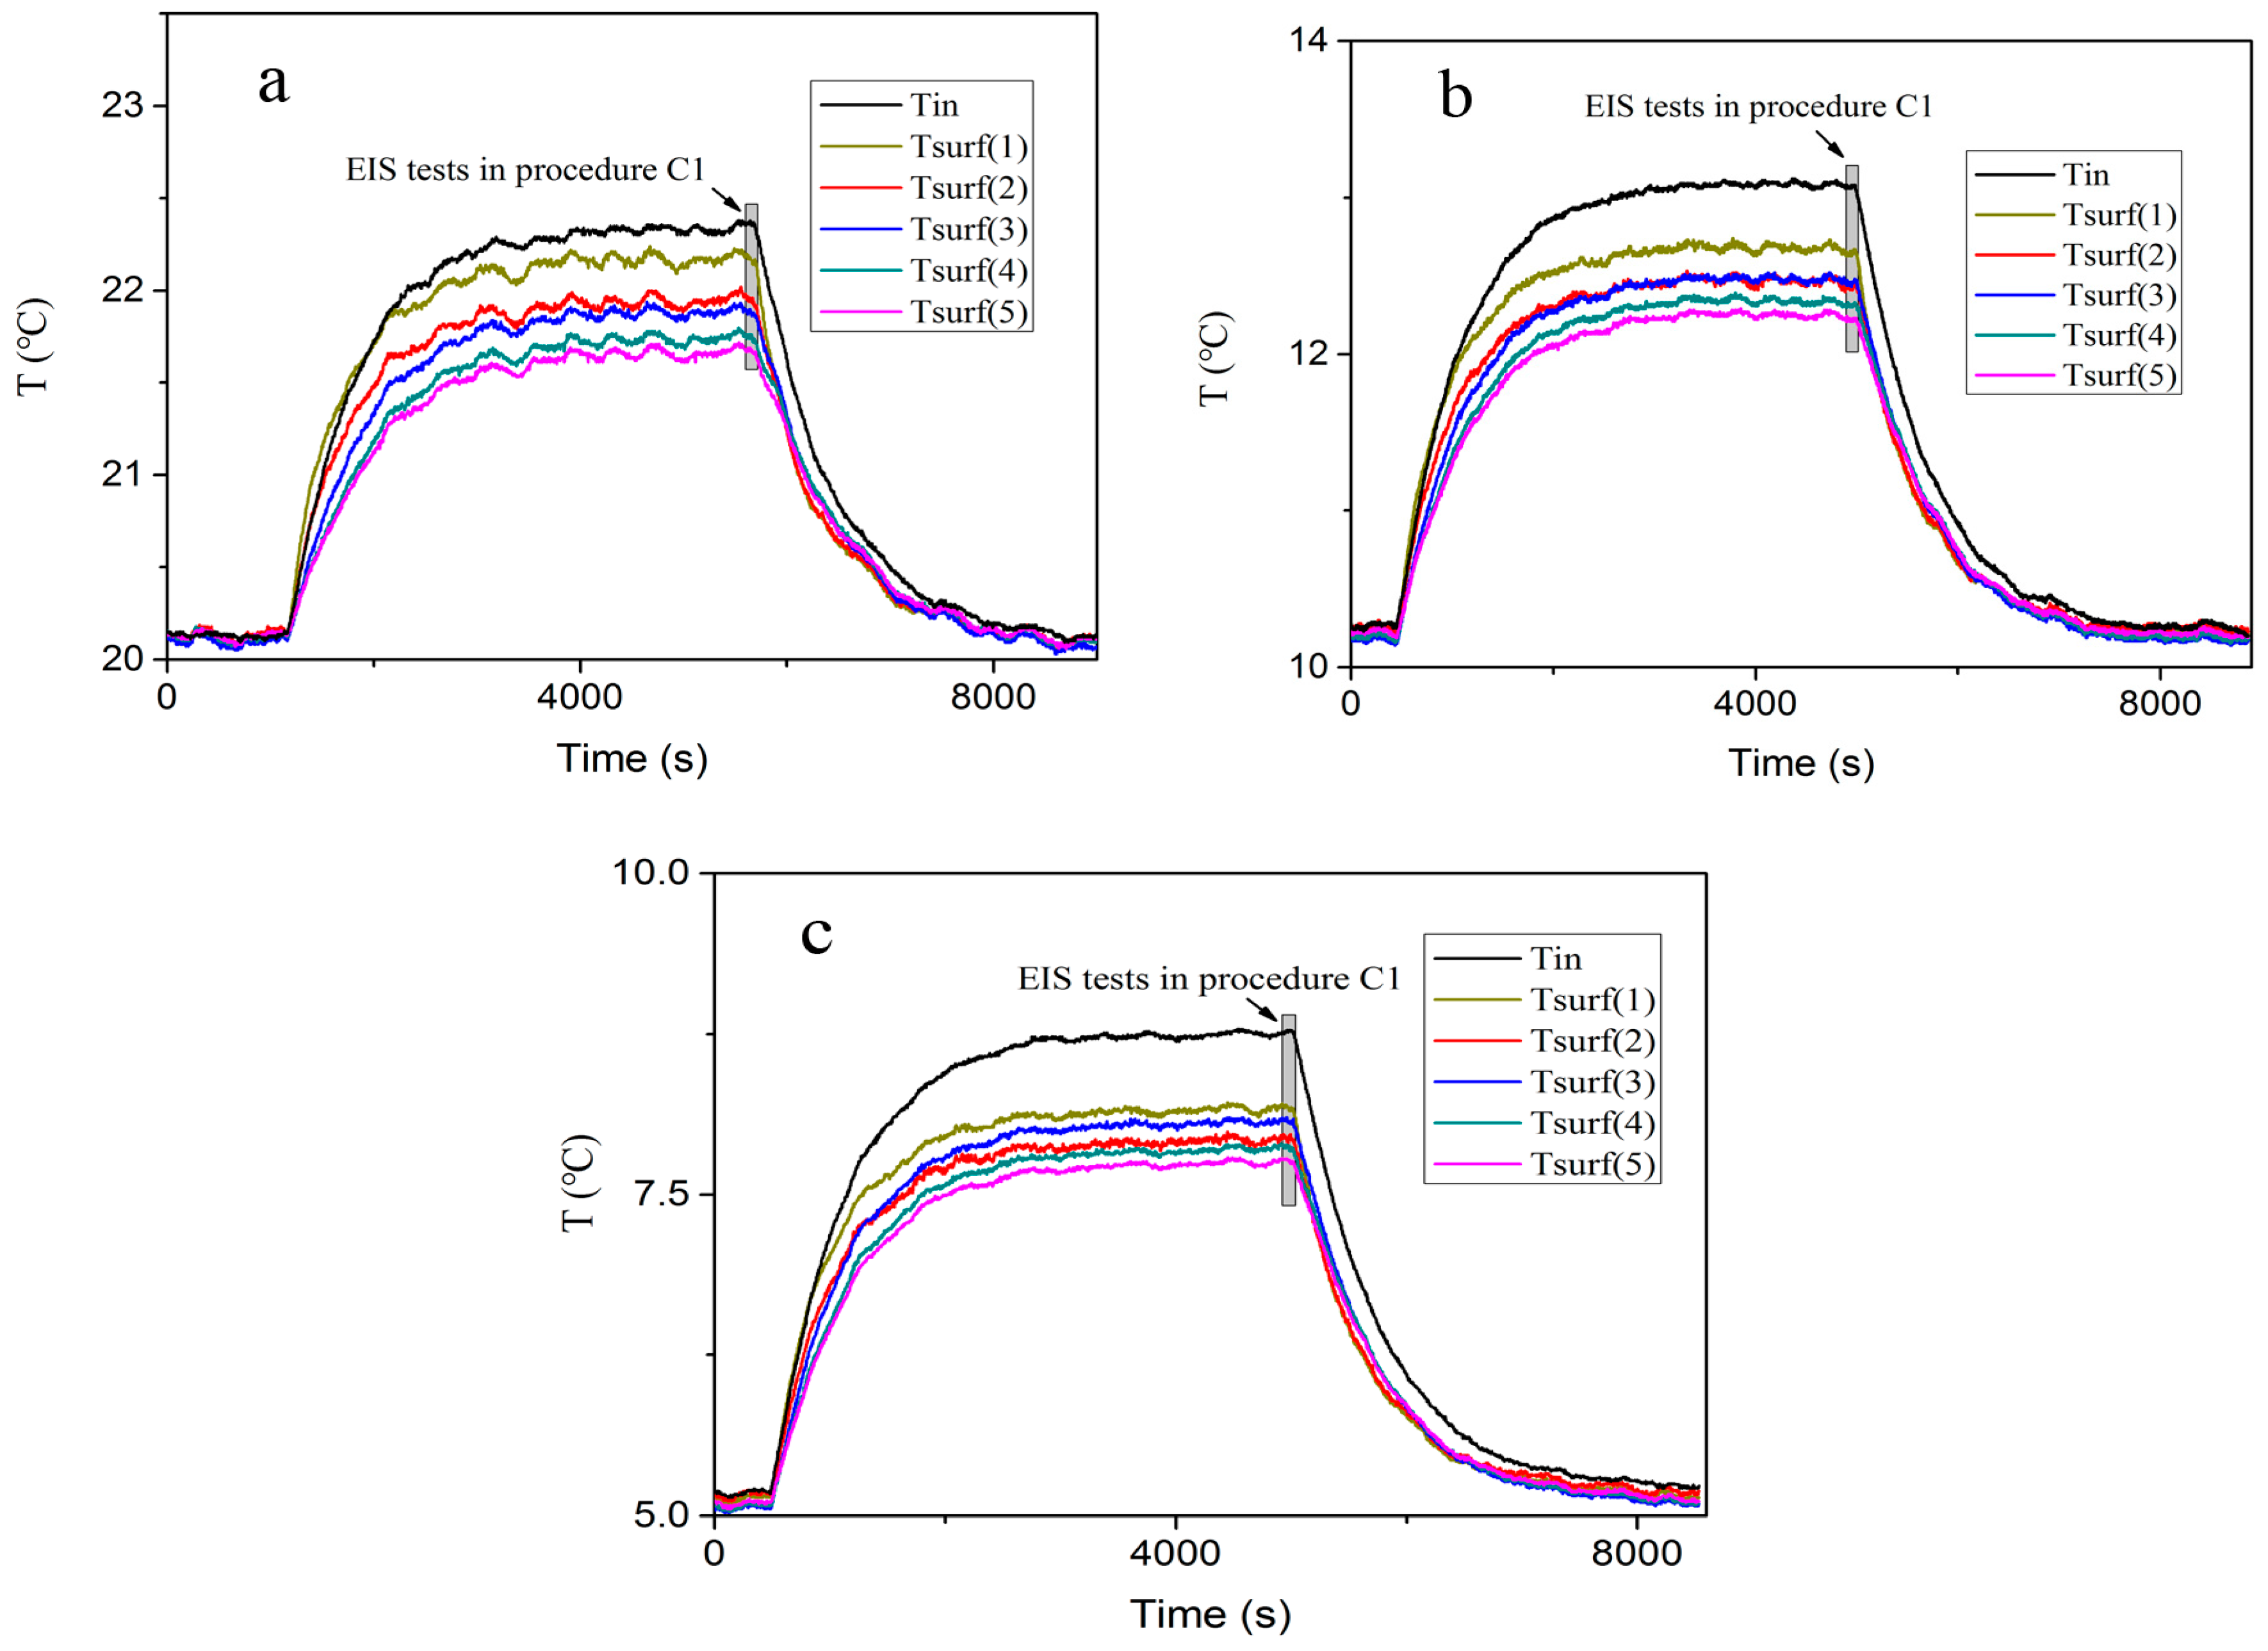
The temperature during the pulse excitation is elucidated in
Figure 7.
Tin is the battery internal temperature, and
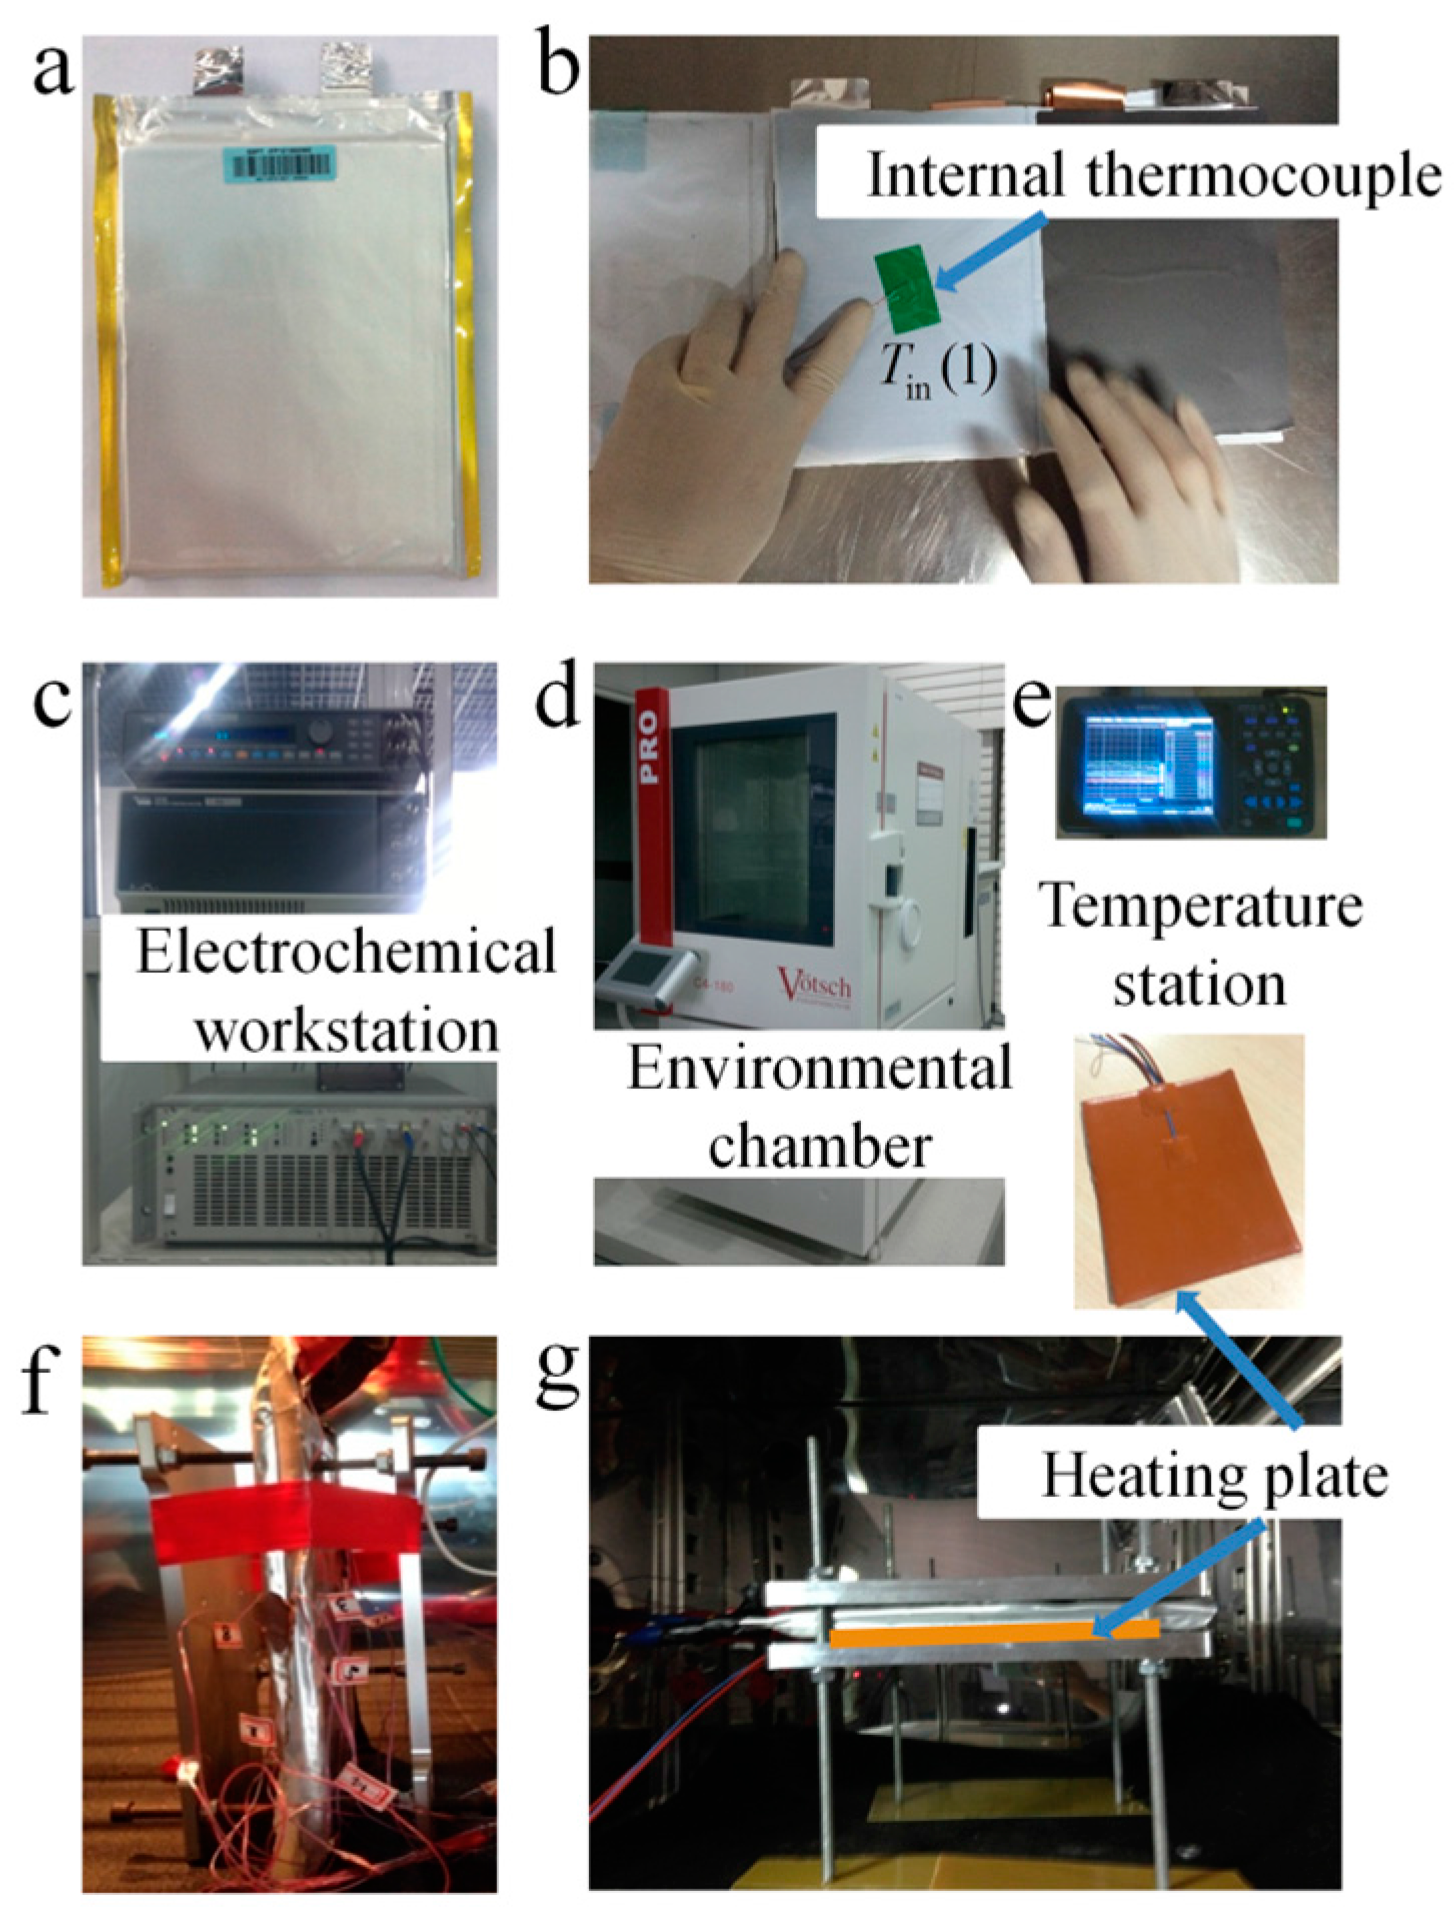
Tsurf(1)–(5) represent the battery surface temperature monitored by the thermalcouples. The temperature first ascends with the increment of cycles and then gradually reaches static state due to the thermal equilibrium. The impedance test is performed in the relaxation break as shown the grey rectangle in
Figure 7. The cell internal temperature which is monitored by the internal thermalcouple drops by at most 0.3 °C during the maximum relaxation period (120 s). The thermal response of the battery to the applied 200 cycles is not obviously altered when the current excitation is switched-off. It can be argued that the exponential decay of the phase shift is not associated with temperature decay. Therefore, temperature and SoC are kept constant for all the tests to isolate the distraction of relaxation time before cell impedance measurements.
The temperature values inputted in procedures C2 is the calculated temperature after the periodic pulse swing, and the impedance obtained in C2 is employed in
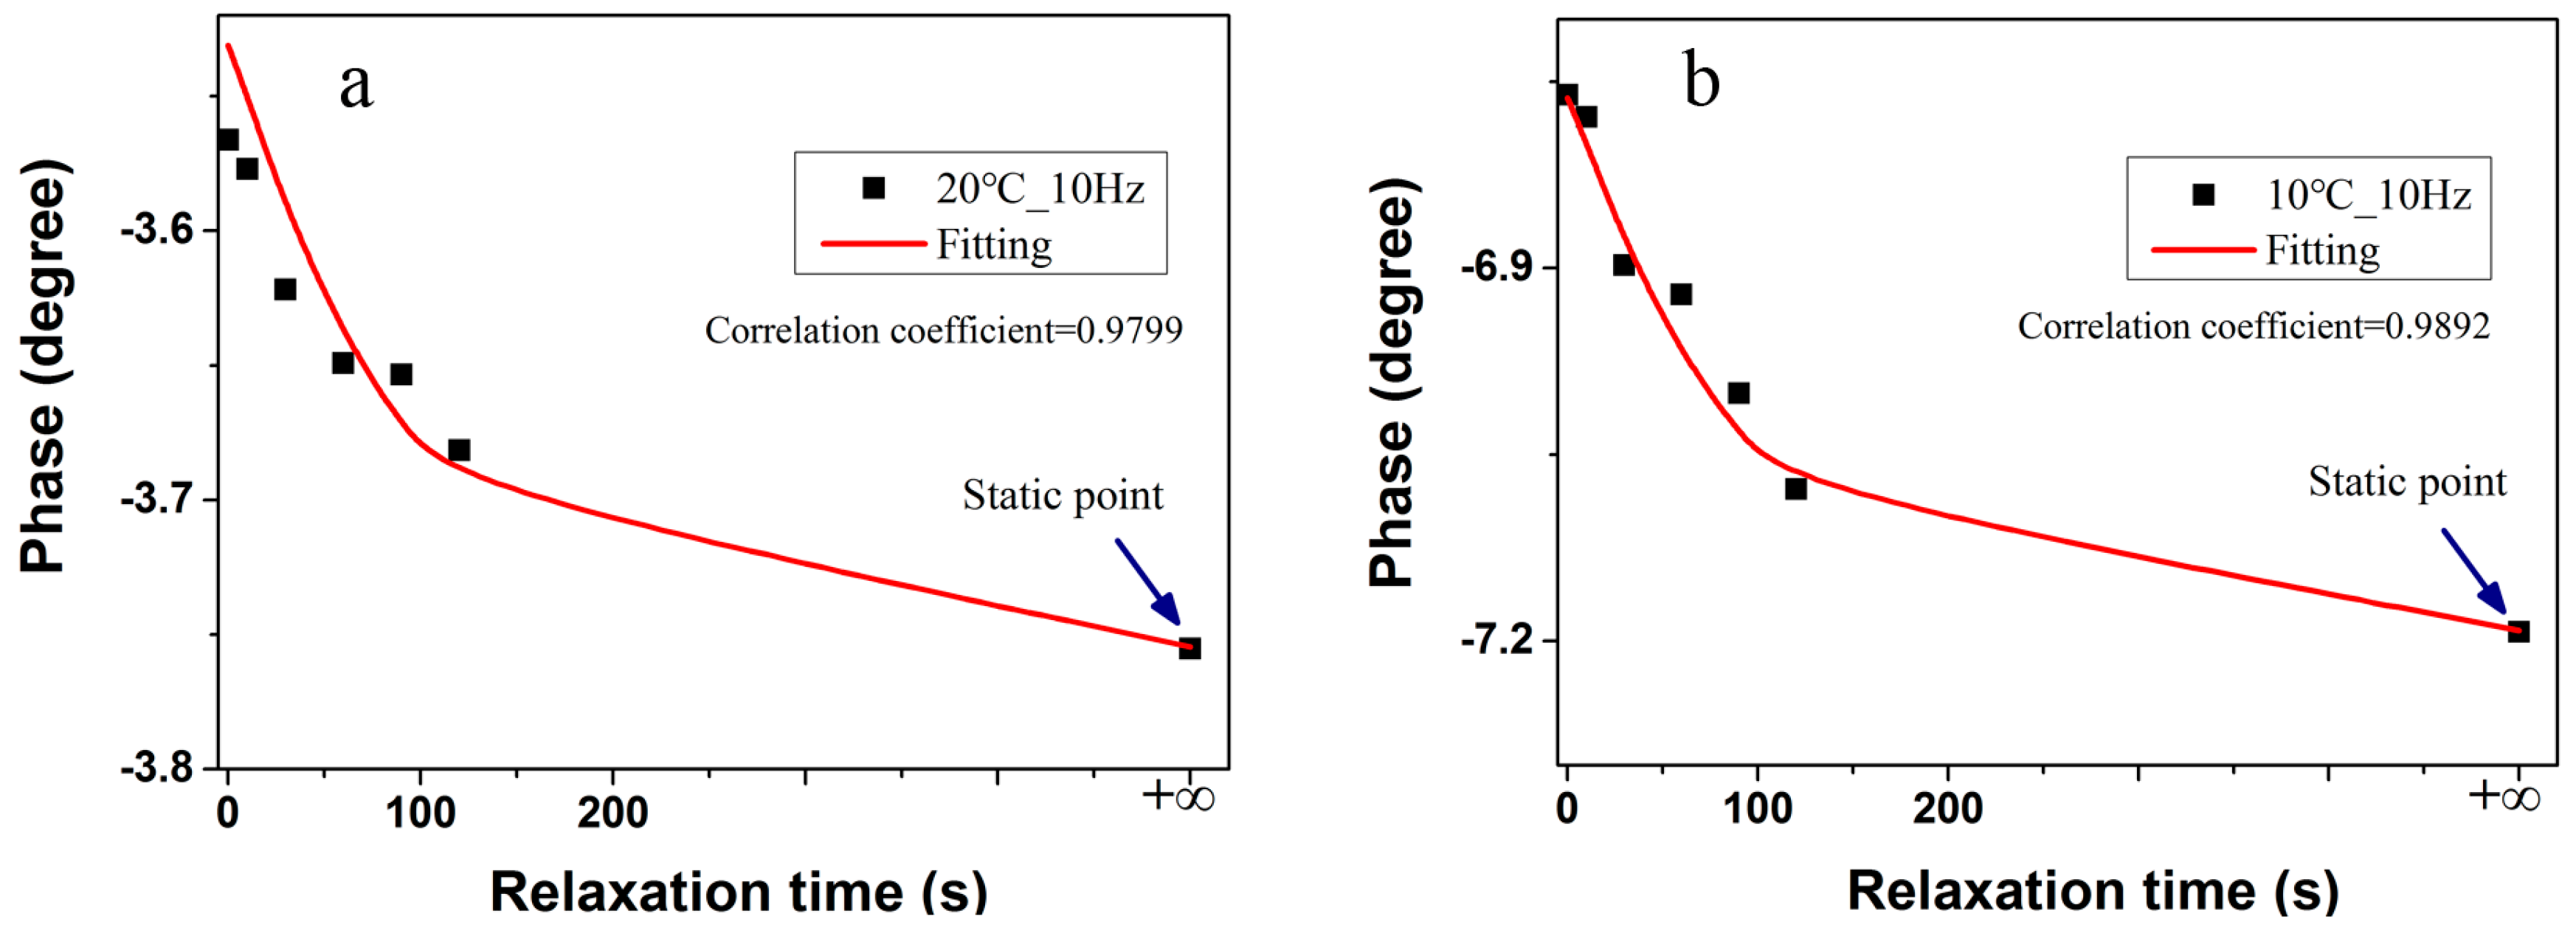
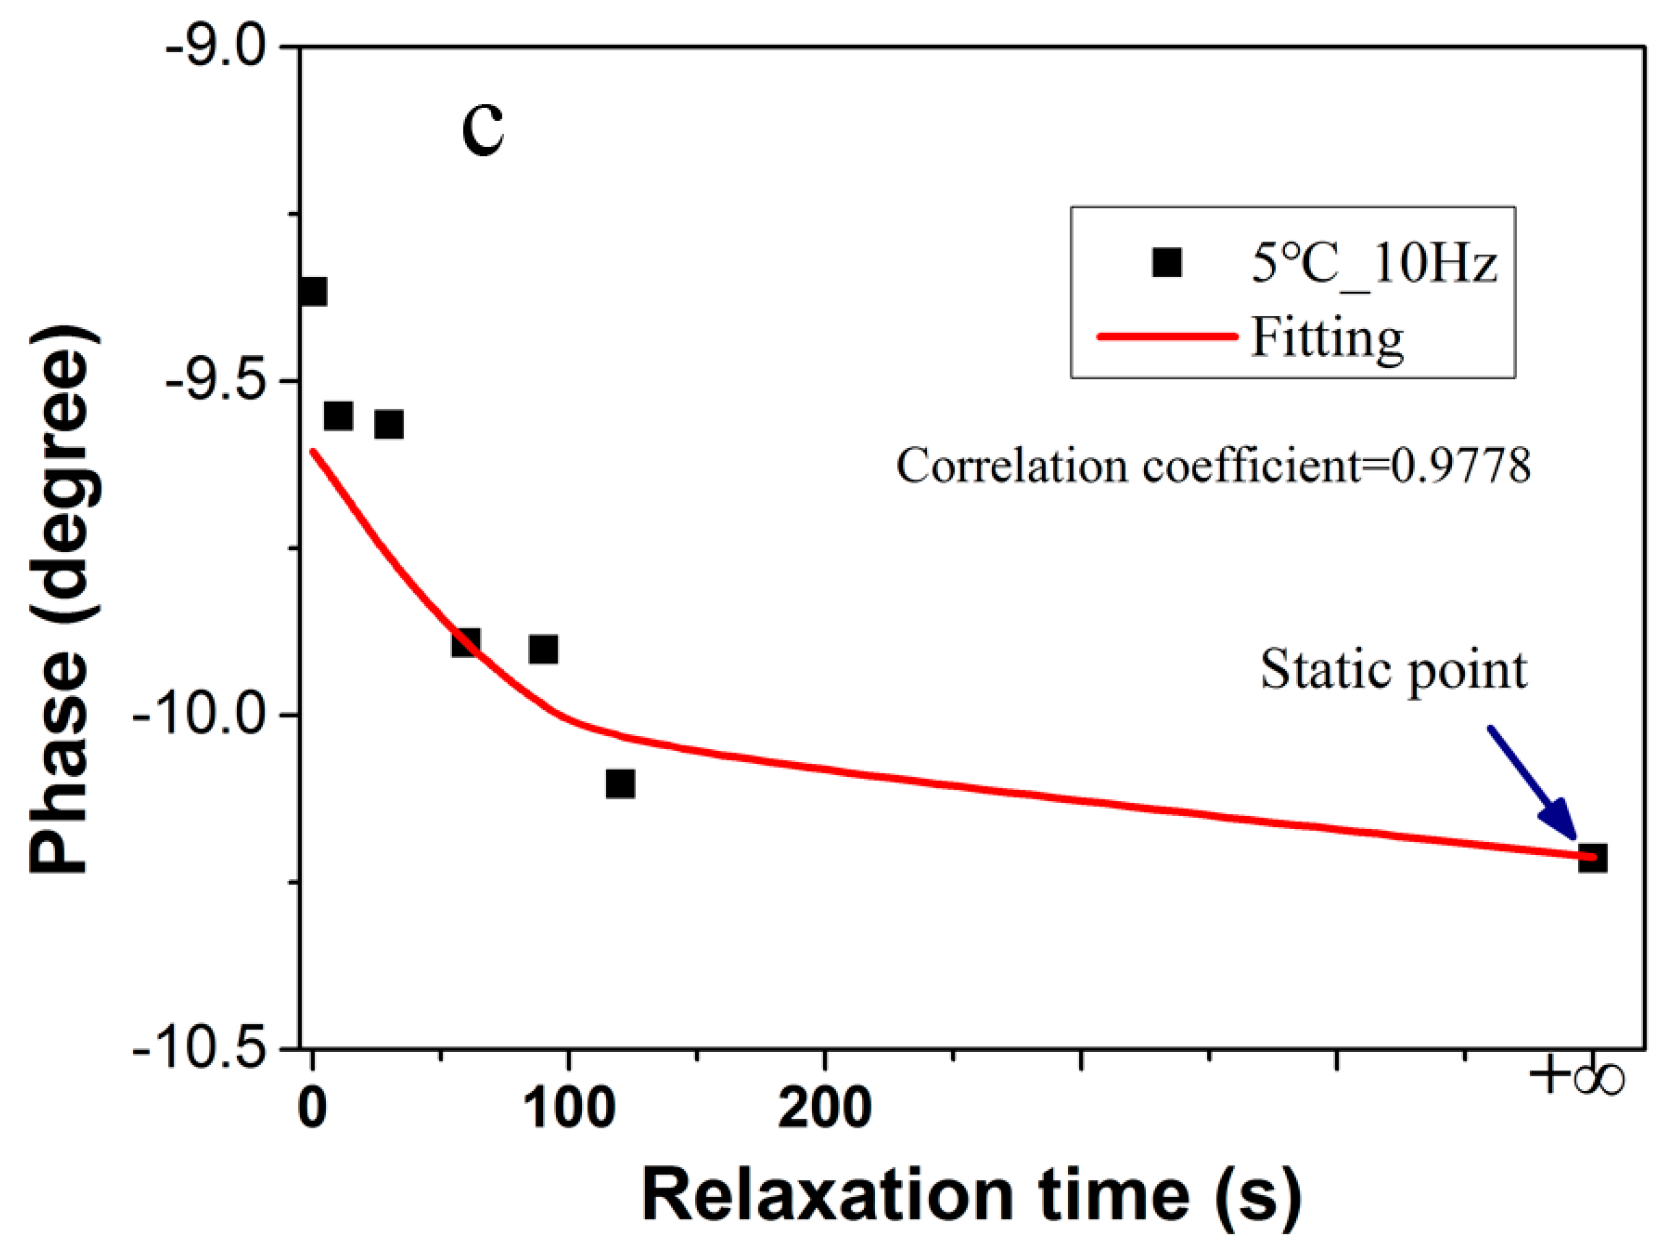
Figure 6 (static scatters) for comparison. Two major features can be extracted from the results of the recorded spectra: (1) it is apparent that the impedance arc enlarges with the incremental relaxation time gradually, especially at low temperatures; and (2) the phase shift particularly slumps at a certain frequency point. In this study, the phase shift at 10 Hz for the representative of other frequency points is selected to estimate battery internal temperature tentatively, thereby the relationship between phase shift and relaxation time at 10 Hz is displayed in
Figure 8. The observed variations are linked to the physical processes occurring at the cell during the relaxation period.
The EIS is constituted with the impedance under discrete excitation frequency. The phase shift can be obtained from [
20]:
where
is with the variation of excitation frequency.
Battery relaxation is mainly dominated by diffusion processes and may take up to several hours, especially when the battery is almost empty, at low temperature, and after charging or discharging with high current rates [
35]. The changes of imaginary part are mainly related to the battery capacitive component. The porosity of the electrodes confers a capacitance to the electrodes when a potential difference is applied to the cell, and the electrodes can be considered as a parallel plate capacitor as described by the Barai et al. [
33]. One common observation reports that the capacitance of the cell follows an exponential decay with a subsequent continuous relaxation. The authors attribute their findings to ionic diffusion during the redistribution of ions within the electrolyte after switch-off the pulse current. This redistribution of ions declines the battery capacitance until the overall concentration of the electrolyte reaching equilibrium. As the concentration of ions at the electrolyte surface decreases, when compared to that of the cell under polarization, the total cell capacitance goes down. Therefore, one alternative explanation is that the reduction in the concentration gradients with the electrolyte induces the enlargement of the impedance arc in
Figure 6. Because the variation in concentration gradient does not occur instantaneously, but rather occurs at several minutes or hours, the total cell capacitance decreases accordingly as a function of relaxation time. Similarly, the solid state diffusion will occur within the bulk of the particles during the relaxation period, which leads to a rearrangement of the lithium atoms in the electrode materials and will be also reflected in the change of observed impedance arc. S. Schindler et al. [
30] also indicated the real part of medium impedance arc rises after the electrical load removed because of battery polarization by experiments.
The shrinking phenomenon of phase shift in
Figure 6 should be considered in the temperature estimation method. A possible way to incorporate the information about the relaxation time is to introduce a correction phase shift factor
, which is calculated from
tre and measured phase shift
, and indicates whether the battery is completely recovered or not. An exponential function corresponding to time is numerously employed to describe the battery relaxation process, such as voltage relaxation [
35], and the double layer capacitance relaxation [
33]. The phase shift relaxation process is also assumed to proceed as an exponential decay with the time constant
, and the equation can be described as:
where
is the pre-exponential factor. We assume that the state of battery does not obviously alert during the frequency sweeping from 10 kHz to 10 Hz, so
tre represents the relaxation time,
is the estimated internal temperature with measured phase shift, and
is the estimated internal temperature corresponding to correction
. When
equals 0.065,
equals 85 s in the equation for the cells, the phase shift of the cell follows the exponential decay, and the experimental data (scatters) and simulation data (line) fit very well as illustrated in
Figure 8. Equation (2) takes account for the effect of relaxation time on impedance phase shift, and the evaluation plays a vital role in the subsequent estimation model. In the validation experiments, a relaxation period of 60 s is adopted firstly. The cells are tested utilizing pulse swing excitation profiles above zero temperature, and constant-current discharge at subzero temperature to avoid the lithium dendrites. The temperature of the embedded thermocouple
is employed to verify the estimated results. The estimated results before and after relaxation time optimization are respectively presented in
Table 7. In the results, we can find that the correction Equation (2) can improve the accuracy of the proposed model. The estimated results at a lower temperature are more accurate than that in a higher temperature, which is probably ascribed to the uncertainty of the impedance measurement as the decreasing of impedance at higher temperature. The correction considering the relaxation time, which can promote estimation accuracy, is the main contribution of this work. To further improve the accuracy of the estimator, a multivariate linear regression equation associated with environment temperature is proposed in
Section 3.4.
3.4. Multivariate Linear Optimization and Validation
The environment temperature, operating time, current and other battery properties all have a great influence on battery internal temperature. Because the impedance reduces significantly at higher temperatures (
T > 10 °C), a multivariate linear regression equation is established to improve the battery internal temperature estimation accuracy. The relationship is expressed as:
To simplify the algorithm, we assume that the internal average temperature is related to the battery property, and the environment temperature is mainly pertinent to heat dissipation.
When considering the situation in which
independent multivariate observations
have been collected, and the number of responses measured in each observation is
, the multivariate linear regression model can be written as:
To obtain the parameter vector
,
sets of observations:
n is the number of independent variables,
is the number of data sets.
Nine data sets in
Table 7 (the even sequences in No. 2–18) are selected to identify the three parameter vector
. The goodness of fit (
R test), significance test (
F test), and regression coefficient significance test (
t test) are calculated. The values are all presented in
Table 8. At test level
, all the test values (
R,
F, and
t) prove that Equation (3) is effective and reliable to be used.
3.5. Estimation Method Validation
After the obtainment of phase shift according to the correction Equation (1), the measured phase shift can be modified considering relaxation time with Equation (2). Then, the internal average temperature can be calculated from the relationship described in
Figure 4. On the basis of multivariate linear equation operation, the estimated temperature
can be observed finally.
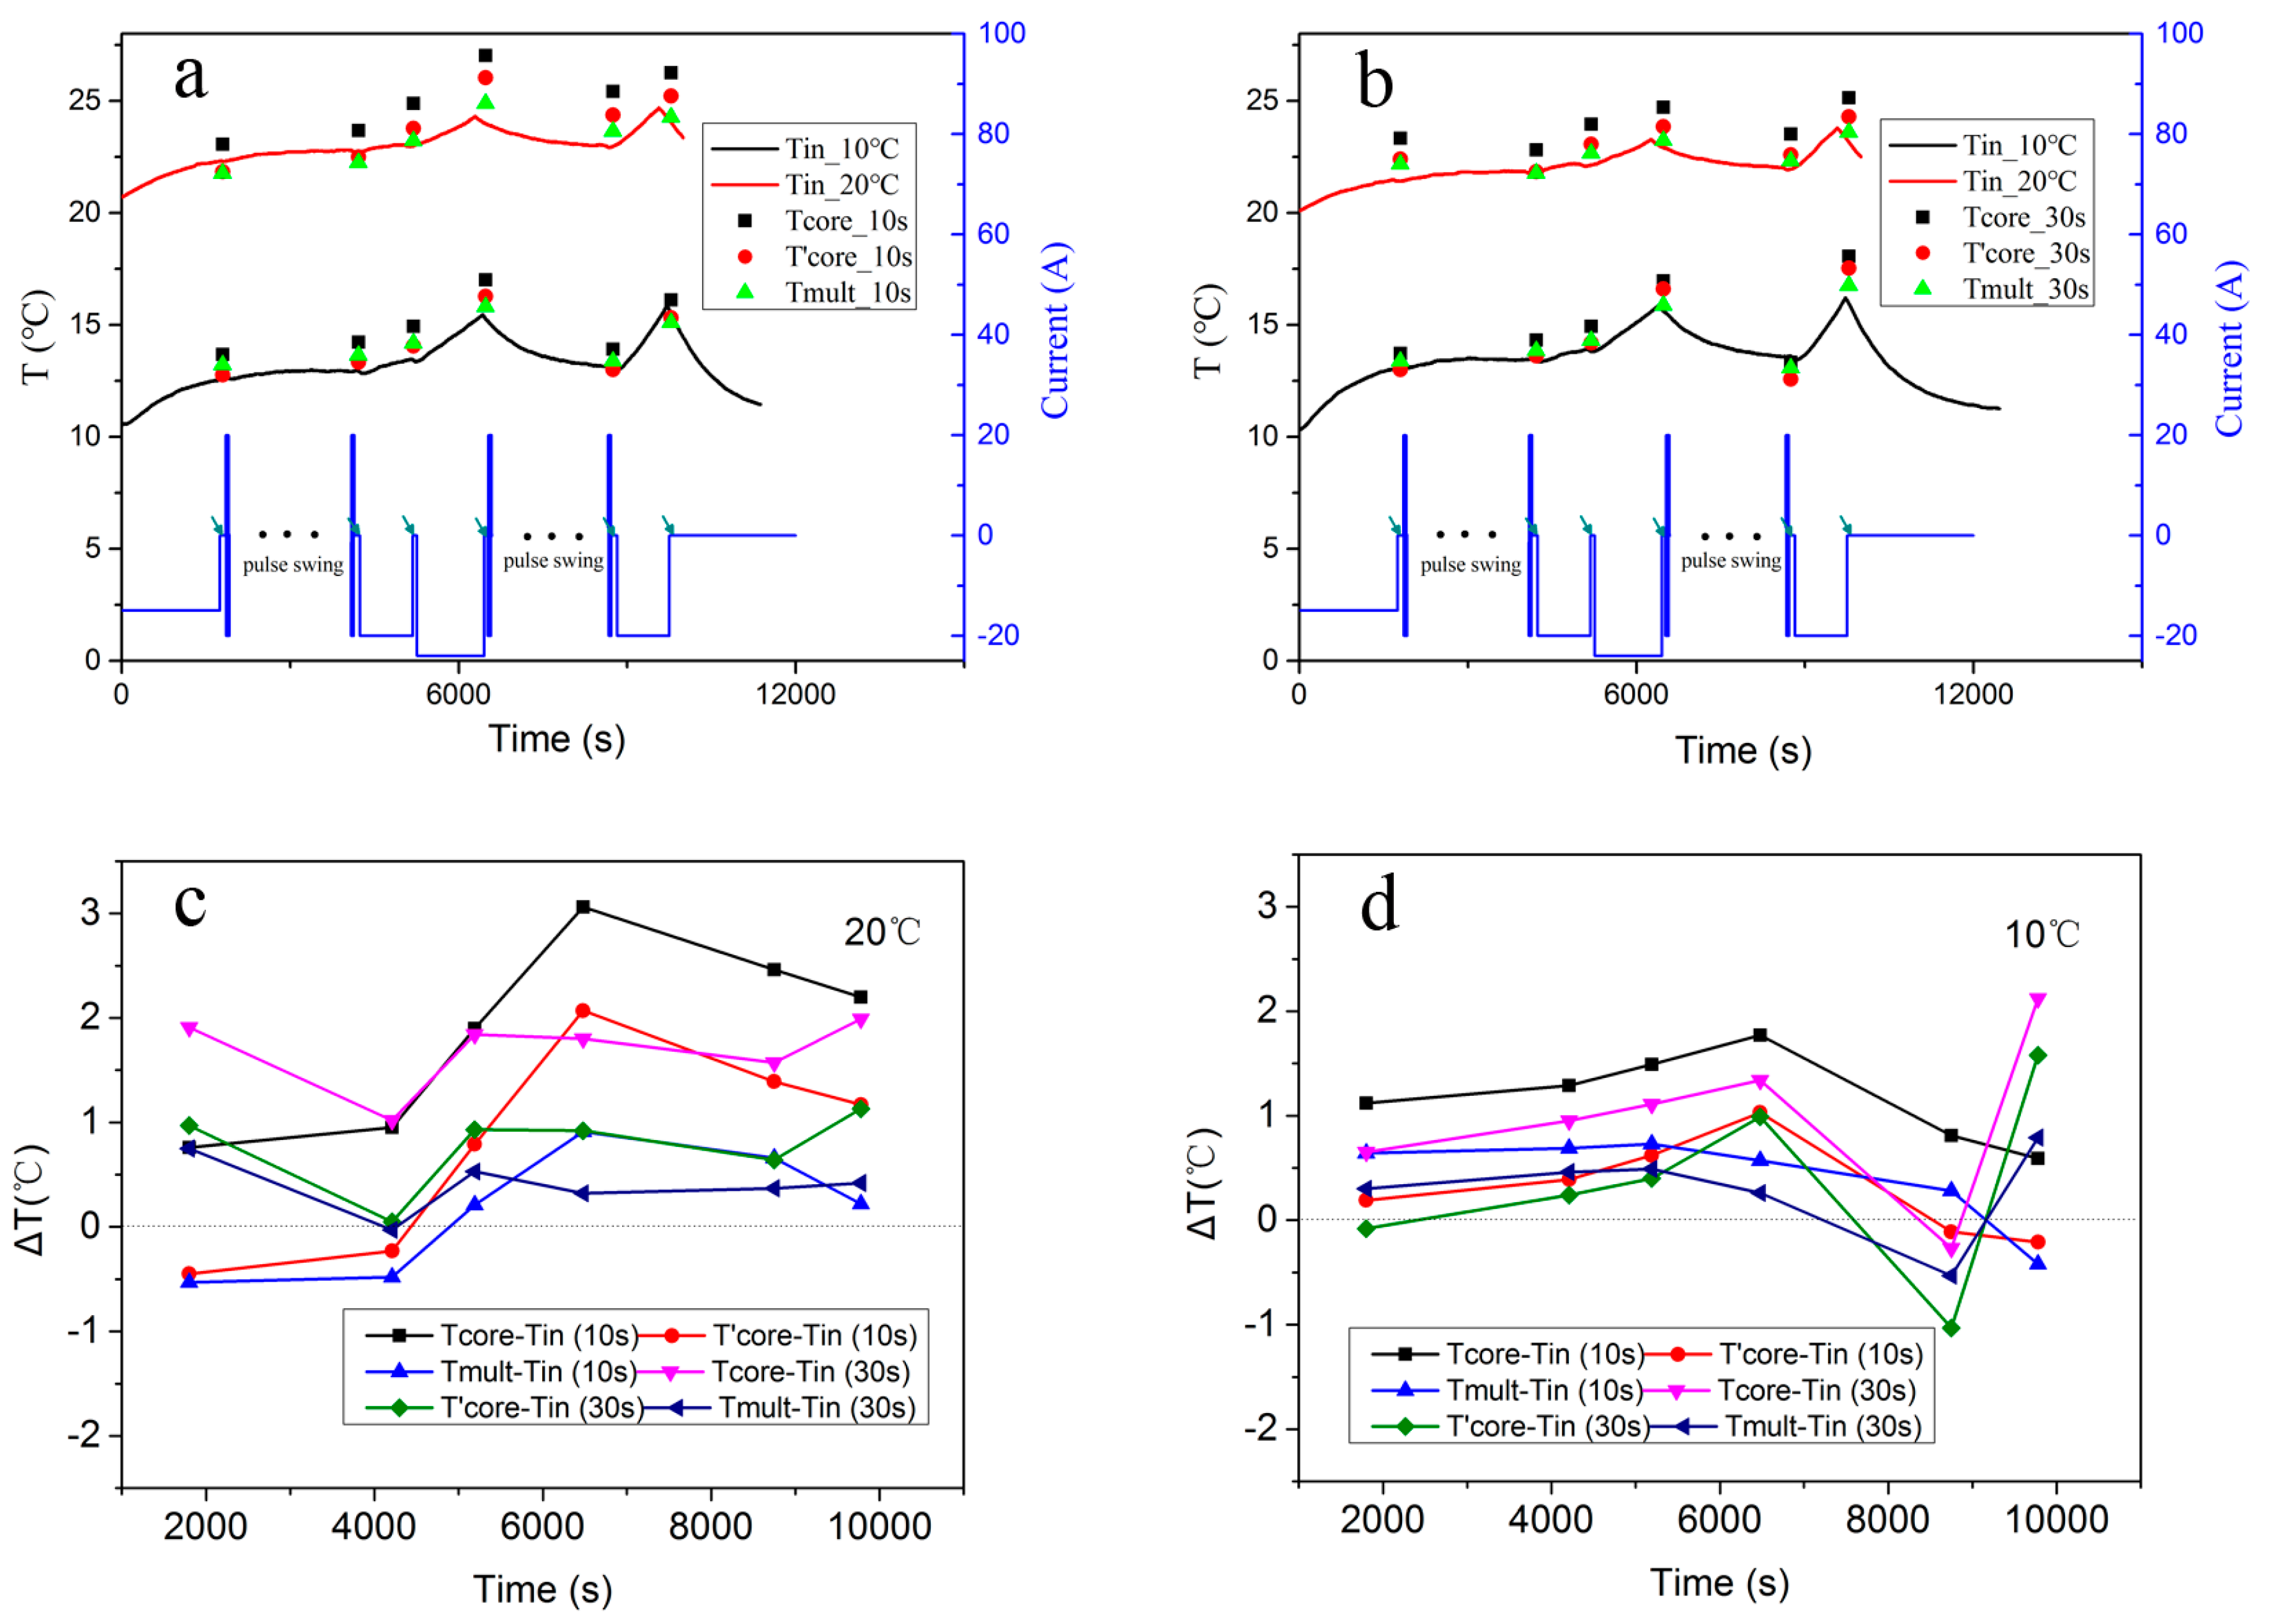
To further verify the estimated results, a discharge profile is involved at 10 °C and 20 °C as displayed in
Figure 9. The AC frequency excitations (10 Hz, dark cyan arrows) are executed after the relaxation process (10 s and 30 s). The estimated temperature results are, respectively, presented in scatters for comparison in
Figure 9a,b.
In
Figure 9, the estimation temperature
has larger deviation compared to
, and the estimation results
and
show good concordance with the measured cell internal temperature. The results with 30 s relaxation at 20 °C are more accurate than that with 10 s, as shown in
Figure 9d. One interpretation is that the battery will be more stabilized and balanced with the incremental relaxation time because of the faster ions transfer and diffusion at higher temperature. Thus, the impedance can be obtained more precisely. Another interpretation could be that the model term to correct for the ambiguous error is more accurate for the 30 s relaxation, as it is already closer to the static value. When the battery operates at 10 °C, the maximum errors are 1.58 °C with Equation (2), and 0.76 °C with Equation (3). When the cells are operated at 20 °C, the errors are 2.07 °C and 0.91 °C, respectively. It indicates that the multivariate linear equation can improve the model accuracy, which mainly contains two aspects: on one hand, Equation (2) is used to modify the measuring deviation caused by electrochemical non-equilibrium. On the other hand, the ambient temperature is introduced in Equation (3) to consider battery temperature distribution due to uneven heat dissipation.
The impedance changes with the degradation of the cell. Identifying ageing and degradation mechanisms in a battery is a main and most challenging goal in the implementation. L.H.J. Raijmakers et al. [
4] conduct battery cyclic life tests and their temperature estimated method does not depend on the battery aging. The relationship between the phase shift and battery cyclic aging for the LiFePO
4 cell has been discussed in the previous study [
20], which shows that the impedance magnitude varies obviously with aging, but the phase shift is not affected by the battery cyclic aging. The aforementioned research facilitates the temperature estimation method in our study. They just test the cyclic life of the cells, however, the calendar life and other complicated utilization mode, e.g., charging and discharging rates like the ones corresponding to the New European Driving Cycle or Urban Dynamometer Driving Schedule, may cause different ageing effects. Hence, validating the relationship between phase shift and other degradation mode is the next focus in our work.


