
The Cell Surface Markers Expression in Postmenopausal Women and Relation to Obesity and Bone Status

Abstract
:1. Introduction
2. Materials and Methods
2.1. Study Population
2.2. Detection of Cell Surface Markers
2.3. Statistical Analysis
3. Results
4. Discussion
5. Conclusions
Acknowledgments
Author Contributions
Conflicts of Interest
Abbreviations
| BMI | Body Mass Index |
| BMD | Bone Mineral Density |
| CD | Cluster of Differentiation |
| DCs | Dendritic Cells |
| NK cells | Natural Killer cells |
| NKT cells | Natural Killer T cells |
| Treg cells | Regulatory T cells |
| RANK | Receptor Activator of Nuclear Factor κ-B |
| RANKL | Receptor Activator of Nuclear Factor κ-B Ligand |
| GFR | Glomerular Filtration Rate |
| TLR | Toll-Like Receptor |
References
- Ghosh, M.; Rodriguez-Garcia, M.; Wira, C.R. The immune system in menopause: Pros and cons of hormone therapy. J. Steroid Biochem. Mol. Biol. 2014, 142, 171–175. [Google Scholar] [CrossRef] [PubMed]
- Lee, B.-C.; Lee, J. Cellular and molecular players in adipose tissue inflammation in the development of obesity-induced insulin resistance. Biochim. Biophys. Acta 2014, 1842, 446–462. [Google Scholar] [CrossRef] [PubMed]
- Gameiro, C.; Romao, F. Changes in the immune system during menopause and aging. Front. Biosci. 2010, 2, 1299–1303. [Google Scholar] [CrossRef]
- Greco, E.A.; Lenzi, A.; Migliaccio, S. The obesity of bone. Ther. Adv. Endocrinol. Metable. 2015, 6, 273–286. [Google Scholar] [CrossRef] [PubMed]
- Faienza, M.F.; Ventura, A.; Marzano, F.; Cavallo, L. Postmenopausal osteoporosis: The role of immune system cells. Clin. Dev. Immunol. 2013. [Google Scholar] [CrossRef] [PubMed]
- Page, G.; Miossec, P. RANK and RANKL expression as markers of dendritic cell-T cell interactions in paired samples of rheumatoid synovium and lymph nodes. Arthritis Rheum. 2005, 52, 2307–2312. [Google Scholar] [CrossRef] [PubMed]
- Theill, L.E.; Boyle, W.J.; Penninger, J.M. RANK-L and RANK: T cells, bone loss, and mammalian evolution. Annu. Rev. Immunol. 2002, 20, 795–823. [Google Scholar] [CrossRef] [PubMed]
- Cline-Smith, A.; Gibbs, J.; Shashkova, E.; Buchwald, Z.S.; Novack, D.V.; Aurora, R. Pulsed low-dose RANKL as a potential therapeutic for postmenopausal osteoporosis. JCI Insight 2016. [Google Scholar] [CrossRef] [PubMed]
- Weitzmann, M.N. The Role of Inflammatory Cytokines, the RANKL/OPG Axis, and the Immunoskeletal Interface in Physiological Bone Turnover and Osteoporosis. Scientifica 2013. [Google Scholar] [CrossRef] [PubMed]
- Chen, B.; Wu, W.; Sun, W.; Zhang, Q.; Yan, F.; Xiao, Y. RANKL expression in periodontal disease: Where does RANKL come from? BioMed Res. Int. 2014. [Google Scholar] [CrossRef] [PubMed]
- Blank, S.E.; Johnson, E.C.; Weeks, D.K.; Wysham, C.H. Circulating dendritic cell number and intracellular TNF-α production in women with type 2 diabetes. Acta Diabetol. 2012, 49, 25–32. [Google Scholar] [CrossRef] [PubMed]
- Engelmann, F.; Rivera, A.; Park, B.; Messerle-Forbes, M.; Jensen, J.T.; Messaoudi, I. Impact of estrogen therapy on lymphocyte homeostasis and the response to seasonal influenza vaccine in post-menopausal women. PLoS ONE 2016, 11, e0149045. [Google Scholar] [CrossRef] [PubMed]
- Chen, Y.J.; Liao, H.F. NK/NKT cells and aging. Int. J. Gerontol. 2007, 1, 65–76. [Google Scholar] [CrossRef]
- Mraz, M.; Haluzik, M. The role of adipose tissue immune cells in obesity and low-grade inflammation. J. Endocrinol. 2014, 222, R113–R127. [Google Scholar] [CrossRef] [PubMed]
- Wagner, N.M.; Brandhorst, G.; Czepluch, F.; Lankeit, M.; Eberle, C.; Herzberg, S.; Faustin, V.; Riggert, J.; Oellerich, M.; Hasenfuss, G.; et al. Circulating regulatory T cells are reduced in obesity and may identify subjects at increased metabolic and cardiovascular risk. Obesity 2013, 21, 461–468. [Google Scholar] [CrossRef] [PubMed]
- Kamada, M.; Irahara, M.; Maegawa, M.; Yasui, T.; Takeji, T.; Yamada, M.; Tezuka, M.; Kasai, Y.; Aono, T. Effect of hormone replacement therapy on post-menopausal changes of lymphocytes and T cell subsets. J. Endocrinol. Investig. 2000, 23, 376–382. [Google Scholar] [CrossRef] [PubMed]
- Sivro, A.; Lajoie, J.; Kimani, J.; Jaoko, W.; Plummer, F.A.; Fowke, K.; Blake Ball, T. Age and menopause affect the expression of specific cytokines/chemokines in plasma and cervical lavage samples from female sex workers in Nairobi, Kenya. Immun. Ageing 2013, 10, 42. [Google Scholar] [CrossRef] [PubMed]
- Hirokawa, K.; Utsuyama, M.; Hayashi, Y.; Kitagawa, M.; Makinodan, T.; Fulop, T. Slower immune system aging in women versus men in the Japanese population. Immun. Ageing 2013, 10, 19. [Google Scholar] [CrossRef] [PubMed]
- Engelmann, F.; Asquith, M.; Messaoudi, I. Modulation of immune senescence by menopause and hormone therapy. In Sex Steroids; Kahn, S.M., Ed.; InTech: Rijeka, Croatia, 2012; pp. 247–272. [Google Scholar]
- Panach, L.; Pineda, B.; Mifsut, D.; Tarín, J.J.; Cano, A.; García-Pérez, M.Á. The role of CD40 and CD40L in bone mineral density and in osteoporosis risk: A genetic and functional study. Bone 2016, 83, 94–103. [Google Scholar] [CrossRef] [PubMed]
- Robinson, J.W.; Li, J.Y.; Walker, L.D.; Malik Tiyagi, A.; Reott, M.; Yu, M.; Adams, J.; Weitzmann, M.N.; Pacifici, R. T cell expressed CD40L potentiates the bone anabolic activity of intermittent PTH treatment. J. Bone Miner. Res. 2015, 30, 695–705. [Google Scholar] [CrossRef] [PubMed]
- Adeel, S.; Singh, K.; Vydareny, K.H.; Kumari, M.; Shah, E.; Weitzmann, M.N.; Tangpricha, V. Bone loss in surgically ovariectomized pre-menopausal women is associated with T lymphocyte activation and thymic hypertrophy. J. Investig. Med. 2013, 61, 1178–1183. [Google Scholar] [CrossRef] [PubMed]
- Zhao, W.; Liu, Y.; Cahill, C.M.; Yang, W.; Rogers, J.T.; Huang, X. The role of T cells in osteoporosis, an update. Int. J. Clin. Exp. Pathol. 2009, 2, 544–552. [Google Scholar] [PubMed]
- Mori, G.; D’Amelio, P.; Faccio, R.; Brunetti, G. Bone-immune cell crosstalk: Bone diseases. J. Immunol. Res. 2015. [Google Scholar] [CrossRef] [PubMed]
- Li, J.Y.; Tawfeek, H.; Bedi, B.; Yang, X.; Adams, J.; Gao, K.Y.; Zayzafoon, M.; Weitzmann, M.N.; Pacifici, R. Ovariectomy disregulates osteoblast and osteoclast formation through the T-cell receptor CD40 ligand. Proc. Natl. Acad. Sci. USA 2011, 108, 768–773. [Google Scholar] [CrossRef] [PubMed]
- Weiskopf, D.; Weinberger, B.; Grubeck-Loebenstein, B. The aging of the immune system. Transpl. Int. 2009, 22, 1041–1050. [Google Scholar] [CrossRef] [PubMed]
- Ongrádi, J.; Kövesdi, V. Factors that may impact on immunosenescence: An appraisal. Immun. Ageing 2010, 7, 7. [Google Scholar] [CrossRef] [PubMed]
- Chou, J.P.; Effros, R.B. T cell replicative senescence in human aging. Curr. Pharm. Des. 2013, 19, 1680–1698. [Google Scholar] [PubMed]
- Teitelbaum, S.L. Postmenopausal osteoporosis, T cells, and immune Dysfunction. Proc. Natl. Acad. Sci. USA 2004, 101, 16711–16712. [Google Scholar] [CrossRef] [PubMed]
- Holstead Jones, D.; Kong, Y.Y.; Penninger, J.M. Role of RANKL and RANK in bone loss and arthritis. Ann. Rheum. Dis. 2002, 61, ii32–ii39. [Google Scholar] [CrossRef]
- Pacifici, R. T cells, osteoblasts, and osteocytes: Interacting lineages key for the bone anabolic and catabolic activities of parathyroid hormone. Ann. N. Y. Acad. Sci. 2016, 1364, 11–24. [Google Scholar] [CrossRef] [PubMed]
- Novack, D.V.; Mbalaviele, G. Osteoclasts, key players in skeletal health and disease. Microbiol. Spectr. 2016. [Google Scholar] [CrossRef]
- Nanke, Y.; Kobashigawa, T.; Yago, T.; Kawamoto, M.; Yamanaka, H.; Kotake, S. RANK expression and osteoclastogenesis in human monocytes in peripheral blood from rheumatoid arthritis patients. Biomed. Res. Int. 2016. [Google Scholar] [CrossRef] [PubMed]
- Zhao, L.J.; Guo, Y.F.; Xiong, D.H.; Xiao, P.; Recker, R.R.; Deng, H.W. Is a gene important for bone resorption a candidate for obesity? An association and linkage study on the RANK (receptor activator of nuclear factor-κB) gene in a large Caucasian sample. Hum. Genet 2006, 120, 561–570. [Google Scholar] [CrossRef] [PubMed]
- Cao, J.J. Effects of obesity on bone metabolism. J. Orthop. Surg. Res. 2011, 6, 30. [Google Scholar] [CrossRef] [PubMed]
- Palermo, A.; Tuccinardi, D.; Defeudis, G.; Watanabe, M.; D’Onofrio, L.; Lauria Pantano, A.; Napoli, N.; Pozzilli, P.; Manfrini, S. BMI and BMD: The potential interplay between obesity and bone fragility. Int. J. Environ. Res. Public Health 2016, 13, 544. [Google Scholar] [CrossRef] [PubMed]
- Mosheimer, B.A.; Kaneider, N.C.; Feistritzer, C.; Sturn, D.H.; Wiedermann, C.J. Expression and Function of RANK in Human Monocyte Chemotaxis. Arthritis Rheum. 2004, 50, 2309–2316. [Google Scholar] [CrossRef] [PubMed]
- Ivashkiv, L.B.; Zhao, B.; Park-Min, K.; Takami, M. Feedback inhibition of osteoclastogenesis during inflammation by IL-10, M-CSF receptor shedding, and induction of IRF8. Ann. N. Y. Acad. Sci. 2011, 1237, 88–94. [Google Scholar] [CrossRef] [PubMed]
- Buchwald, Z.S.; Yang, C.; Nellore, S.; Shashkova, E.V.; Davis, J.L.; Cline, A.; Ko, J.; Novack, D.V.; DiPaolo, R.; Aurora, R. A bone anabolic effect of RANKL in a murine model of osteoporosis mediated through FoxP3+ CD8 T-cells. J. Bone Miner. Res. 2015, 30, 1508–1522. [Google Scholar] [CrossRef] [PubMed]
- Zaiss, M.M.; Frey, B.; Hess, A.; Zwerina, J.; Luther, J.; Nimmerjahn, F.; Engelke, K.; Kollias, G.; Hünig, T.; Schett, G.; et al. Regulatory T cells protect from local and systemic bone destruction in arthritis. J. Immunol. 2010, 184, 7238–7246. [Google Scholar] [CrossRef] [PubMed]
- Lei, H.; Schmidt-Bleek, K.; Dienelt, A.; Reinke, P.; Volk, H.D. Regulatory T cell-mediated anti-inflammatory effects promote successful tissue repair in both indirect and direct manners. Front. Pharmacol. 2015. [Google Scholar] [CrossRef] [PubMed]
- Luo, C.Y.; Wang, L.; Sun, C.; Li, D.J. Estrogen enhances the functions of CD4+CD25+Foxp3+ regulatory T cells that suppress osteoclast differentiation and bone resorption in vitro. Cell. Mol. Immunol. 2011, 8, 50–58. [Google Scholar] [CrossRef] [PubMed]
- Kim, Y.G.; Lee, C.K.; Nah, S.S.; Mun, S.H.; Yoo, B.; Moon, H.B. Human CD4+CD25+ Treg cells inhibit the differentiation of osteoclasts from peripheral blood mononuclear cells. Biochem. Biophys. Res. Commun. 2007, 357, 1046–1052. [Google Scholar] [CrossRef] [PubMed]
- Kelchtermans, H.; Geboes, L.; Mitera, T.; Huskens, D.; Leclercq, G.; Matthys, P. Activated CD4+CD25+ regulatory T cells inhibit osteoclastogenesis and collagen-induced arthritis. Ann. Rheum. Dis. 2009, 68, 744–750. [Google Scholar] [CrossRef] [PubMed]
- Taams, L.S.; Palmer, D.B.; Akbar, A.N.; Robinson, D.S.; Brown, Z.; Hawrylowicz, C.M. Regulatory T cells in human disease and their potential for therapeutic manipulation. Immunology 2006, 118, 1–9. [Google Scholar] [CrossRef] [PubMed]
- Lugli, E.; Troiano, L.; Pinti, M.; Nasi, M.; Roat, E.; Ferraresi, R.; Bertoncelli, L.; Gibellini, L.; Nemes, E.; Cossarizza, A. Lymphocytes subtypes and function in centenarians as models for successful ageing. In Handbook of Immunosenescence: Basic Understanding and Clinical Application; Fulop, T., Franceschi, C., Hirokawa, K., Pawelec, G., Eds.; Springer Science and Business Media: Berlin, Germany, 2009; pp. 35–51. ISBN 978–1-4020–9063–9. [Google Scholar]
- Seillet, C.; Laffont, S.; Tremollieres, F.; Rouquie, N.; Ribot, C.; Arnal, J.F.; Douin-Echinard, V.; Gourdy, P.; Guery, J.C. The TLR-mediated response of plasmacytoid dendritic cells is positively regulated by estradiol in vivo through cell-intrinsic estrogen receptor signalling. Blood 2012, 119, 454–464. [Google Scholar] [CrossRef] [PubMed]
- Engelmann, F.; Messaoudi, I. The impact of menopause on immune senescence. Open Longev. Sci. 2012, 6, 101–111. [Google Scholar] [CrossRef]
- Laffont, S.; Guéry, J.C. Estrogen receptor-dependent modulation of dendritic cell biology of mice and women. Receptors Clin. Investig. 2015, 2, e671. [Google Scholar] [CrossRef]
- Agrawal, A.; Gupta, S. Impact of aging on dendritic cell functions in humans. Ageing Res. Rev. 2011, 10, 336–345. [Google Scholar] [CrossRef] [PubMed]
- Zhan, Y.; Chow, K.V.; Soo, P.; Xu, Z.; Brady, J.L.; Lawlor, K.E.; Masters, S.L.; O’keeffe, M.; Shortman, K.; Zhang, J.G.; et al. Plasmacytoid dendritic cells are short-lived: Reappraising the influence of migration, genetic factors and activation on estimation of lifespan. Sci. Rep. 2016, 6, 25060. [Google Scholar] [CrossRef] [PubMed]
- Warrington, K.J.; Vallejo, A.N.; Weyand, C.M.; Goronzy, J.J. CD28 loss in senescent CD4+ T cells: Reversal by interleukin-12 stimulation. Blood 2003, 101, 3543–3549. [Google Scholar] [CrossRef] [PubMed]
- Palmer, A.K.; Kirkland, J.L. Aging and adipose tissue: Potential interventions for diabetes and regenerative medicine. Exp. Gerontol. 2016, 86, 97–105. [Google Scholar] [CrossRef] [PubMed]
- Poggi, M.; Morin, S.O.; Bastelica, D.; Govers, R.; Canault, M.; Bernot, D.; Georgelin, O.; Verdier, M.; Burcelin, R.; Olive, D.; et al. CD28 deletion improves obesity-induced liver steatosis but increases adiposity in mice. Int. J. Obes. 2015. [Google Scholar] [CrossRef] [PubMed]
- Cauley, J.A. Steroids and aging bone. In Osteoporosis in Older Persons: Pathophysiology and Therapeutic Approach; Duque, G., Kiel, D.P., Eds.; Springer: Berlin, Germany, 2009; pp. 47–58. [Google Scholar]
- Gimble, J.M.; Floyd, Z.E.; Kassem, M.; Nuttall, M.E. Aging and bone. In Osteoporosis in Older Persons: Pathophysiology and Therapeutic Approach; Duque, G., Kiel, D.P., Eds.; Springer: Berlin, Germany, 2009; pp. 47–58. [Google Scholar]
- Wolf, D.; Jehle, F.; Ortiz Rodriguez, A.; Dufner, B.; Hoppe, N.; Colberg, C.; Lozhkin, A.; Bassler, N.; Rupprecht, B.; Wiedemann, A; et al. CD40L deficiency attenuates diet-induced adipose tissue inflammation by impairing immune cell accumulation and production of pathogenic IgG-antibodies. PLoS ONE 2012, 7, e33026. [Google Scholar] [CrossRef]
- Missiou, A.; Wolf, D.; Platzer, I.; Ernst, S.; Walter, C.; Rudolf, P.; Zirlik, K.; Köstlin, N.; Willecke, F.K.; Münkel, C.; et al. CD40L induces inflammation and adipogenesis in adipose cells—A potential link between metabolic and cardiovascular disease. Thromb. Haemost. 2010, 103, 788–796. [Google Scholar] [CrossRef] [PubMed]


| Cluster of Differentiation (CD) Markers | Mean (%) | Median (%) | Percentiles 25 | Percentiles 75 |
|---|---|---|---|---|
| CD3+ T-lymphocytes | 71.99 | 72.5 | 67.6 | 76.95 |
| CD4+ T-lymphocytes | 45.63 | 45 | 39.9 | 51.2 |
| CD8+ T-lymphocytes | 20.26 | 20 | 20 | 23.93 |
| CD19+ B-lymphocytes | 9.49 | 9.1 | 7.28 | 11.63 |
| CD19+HLADR+HLADR+ B-lymphocytes | 9.17 | 8.75 | 6.98 | 11.13 |
| CD3−CD56+ NK cells | 10.86 | 9.65 | 6.5 | 14.33 |
| CD3+CD56+ NKT cells | 5.04 | 3.2 | 1.85 | 6.4 |
| CD3+CD28+ Activated T-lymphocytes | 58.87 | 59.8 | 51.5 | 66.23 |
| CD3+CD40L Activated T-lymphocytes | 8.34 | 7.95 | 6.1 | 10 |
| CD4+CD127+CD25− Memory effector T cells | 86.04 | 87.9 | 83.95 | 90.63 |
| CD4+CD127−CD25+ Natural regulatory T-cells | 3.06 | 2.85 | 1.78 | 4.13 |
| CD3+CD45RO−CD45RA+ Naive CD3+ T-lymphocytes | 35.56 | 35.2 | 28.38 | 42.6 |
| CD3+CD45RO+CD45RA− Memory CD3+ T-lymphocytes | 45.92 | 43.45 | 36.98 | 49 |
| CD3+CD8+CD45RO−CD45RA+ Naive CD8+ T-lymphocytes | 38.51 | 39.5 | 30.68 | 47.33 |
| CD3+CD8+CD45RO+CD45RA− Memory CD8+ T-lymphocytes | 31.45 | 30.6 | 24 | 37.28 |
| CD19−HLADR+CD123+ Plasmacytoid dendritic cells | 0.63 | 0.6 | 0.4 | 0.8 |
| CD19−HLADR+CD11c+ Myeloid dendritic cells | 0.52 | 0.5 | 0.3 | 0.7 |
| CD19−HLADR+CD11c−CD123+ Plasmacytoid Dendritic cells | 14.72 | 13.6 | 8.98 | 18.85 |
| CD19−HLADR+CD11c+CD123− Myeloid Dendritic cells | 9.41 | 7.75 | 5.48 | 11.2 |
| CD265+ (RANK) Monocyte population | 4.84 | 4.7 | 3.68 | 5.9 |
| CD265+CD11c+ Monocyte population | 1.73 | 1.6 | 1.1 | 2.13 |
| CD265+CD19−HLADR+CD11c+CD123− RANK on Myeloid Dendritic cells | 11.18 | 10.5 | 5.7 | 15.4 |
| CD265+CD19−HLADR+CD11c−CD123+ RANK on Plasmacytoid Dendritic cells | 15.05 | 13.3 | 13.3 | 21 |
| CD3+CD254+ RANKL on T-lymphocytes | 3.53 | 3.3 | 2.4 | 4.6 |
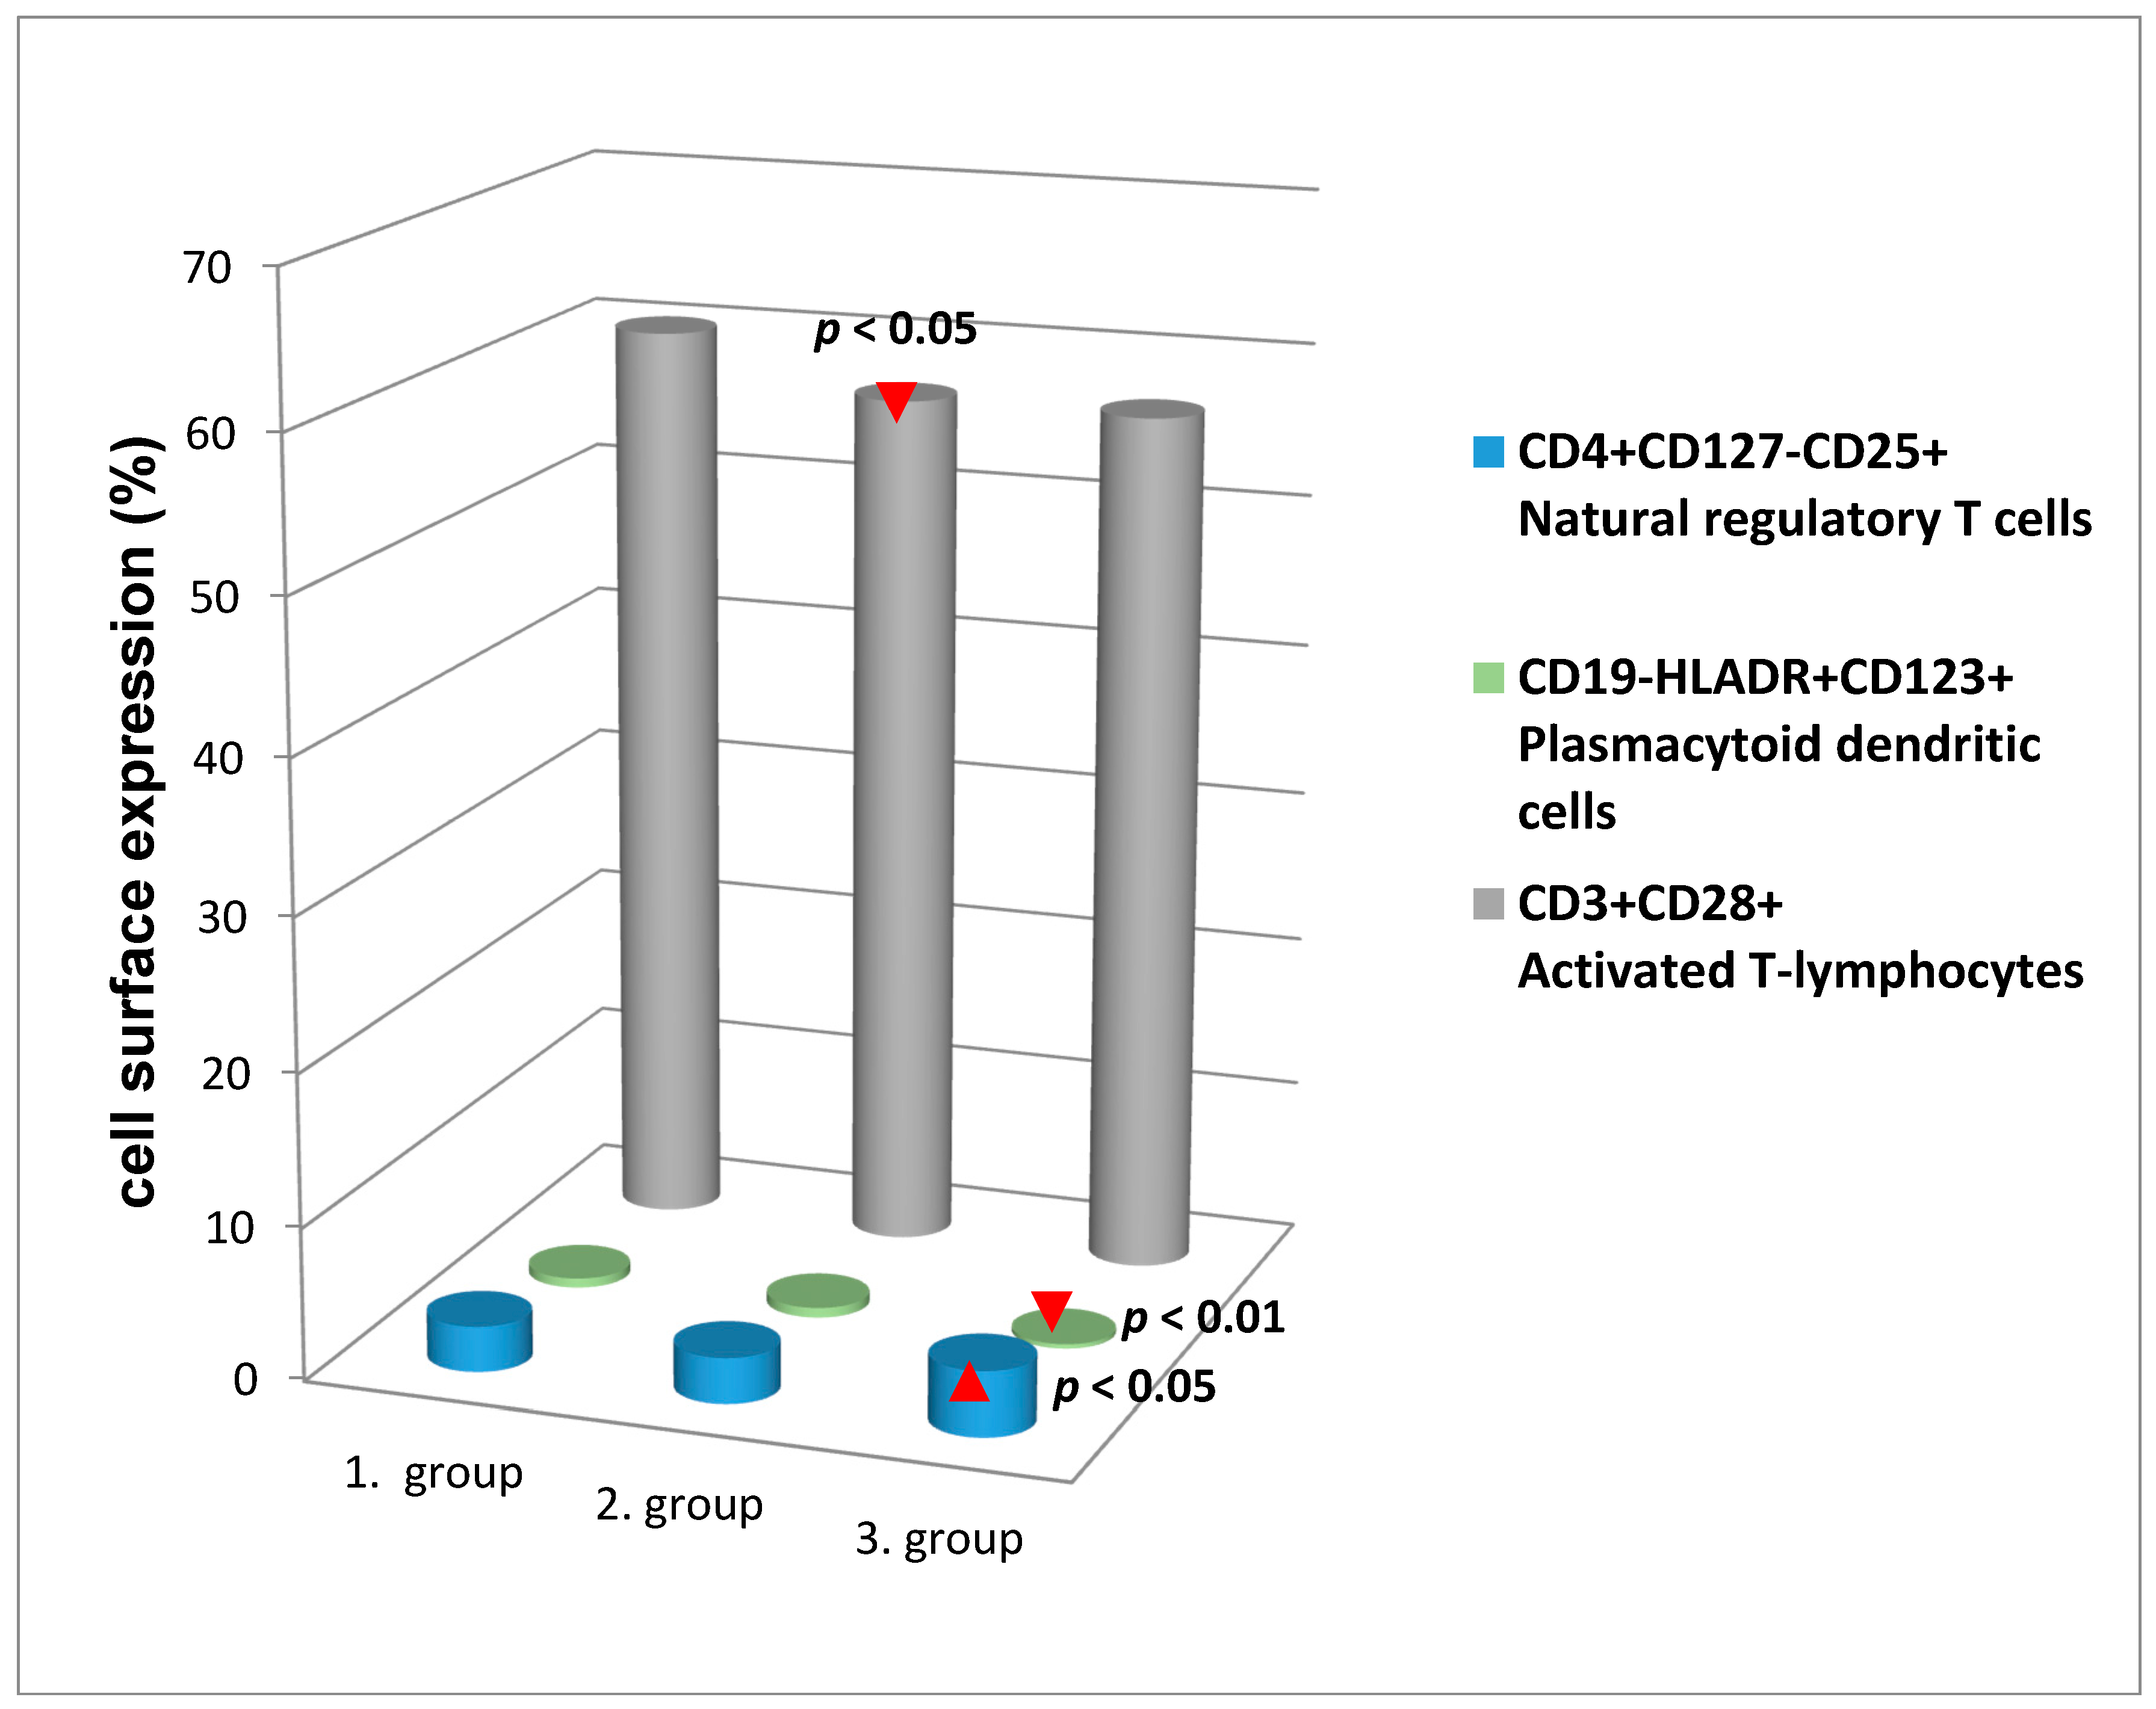
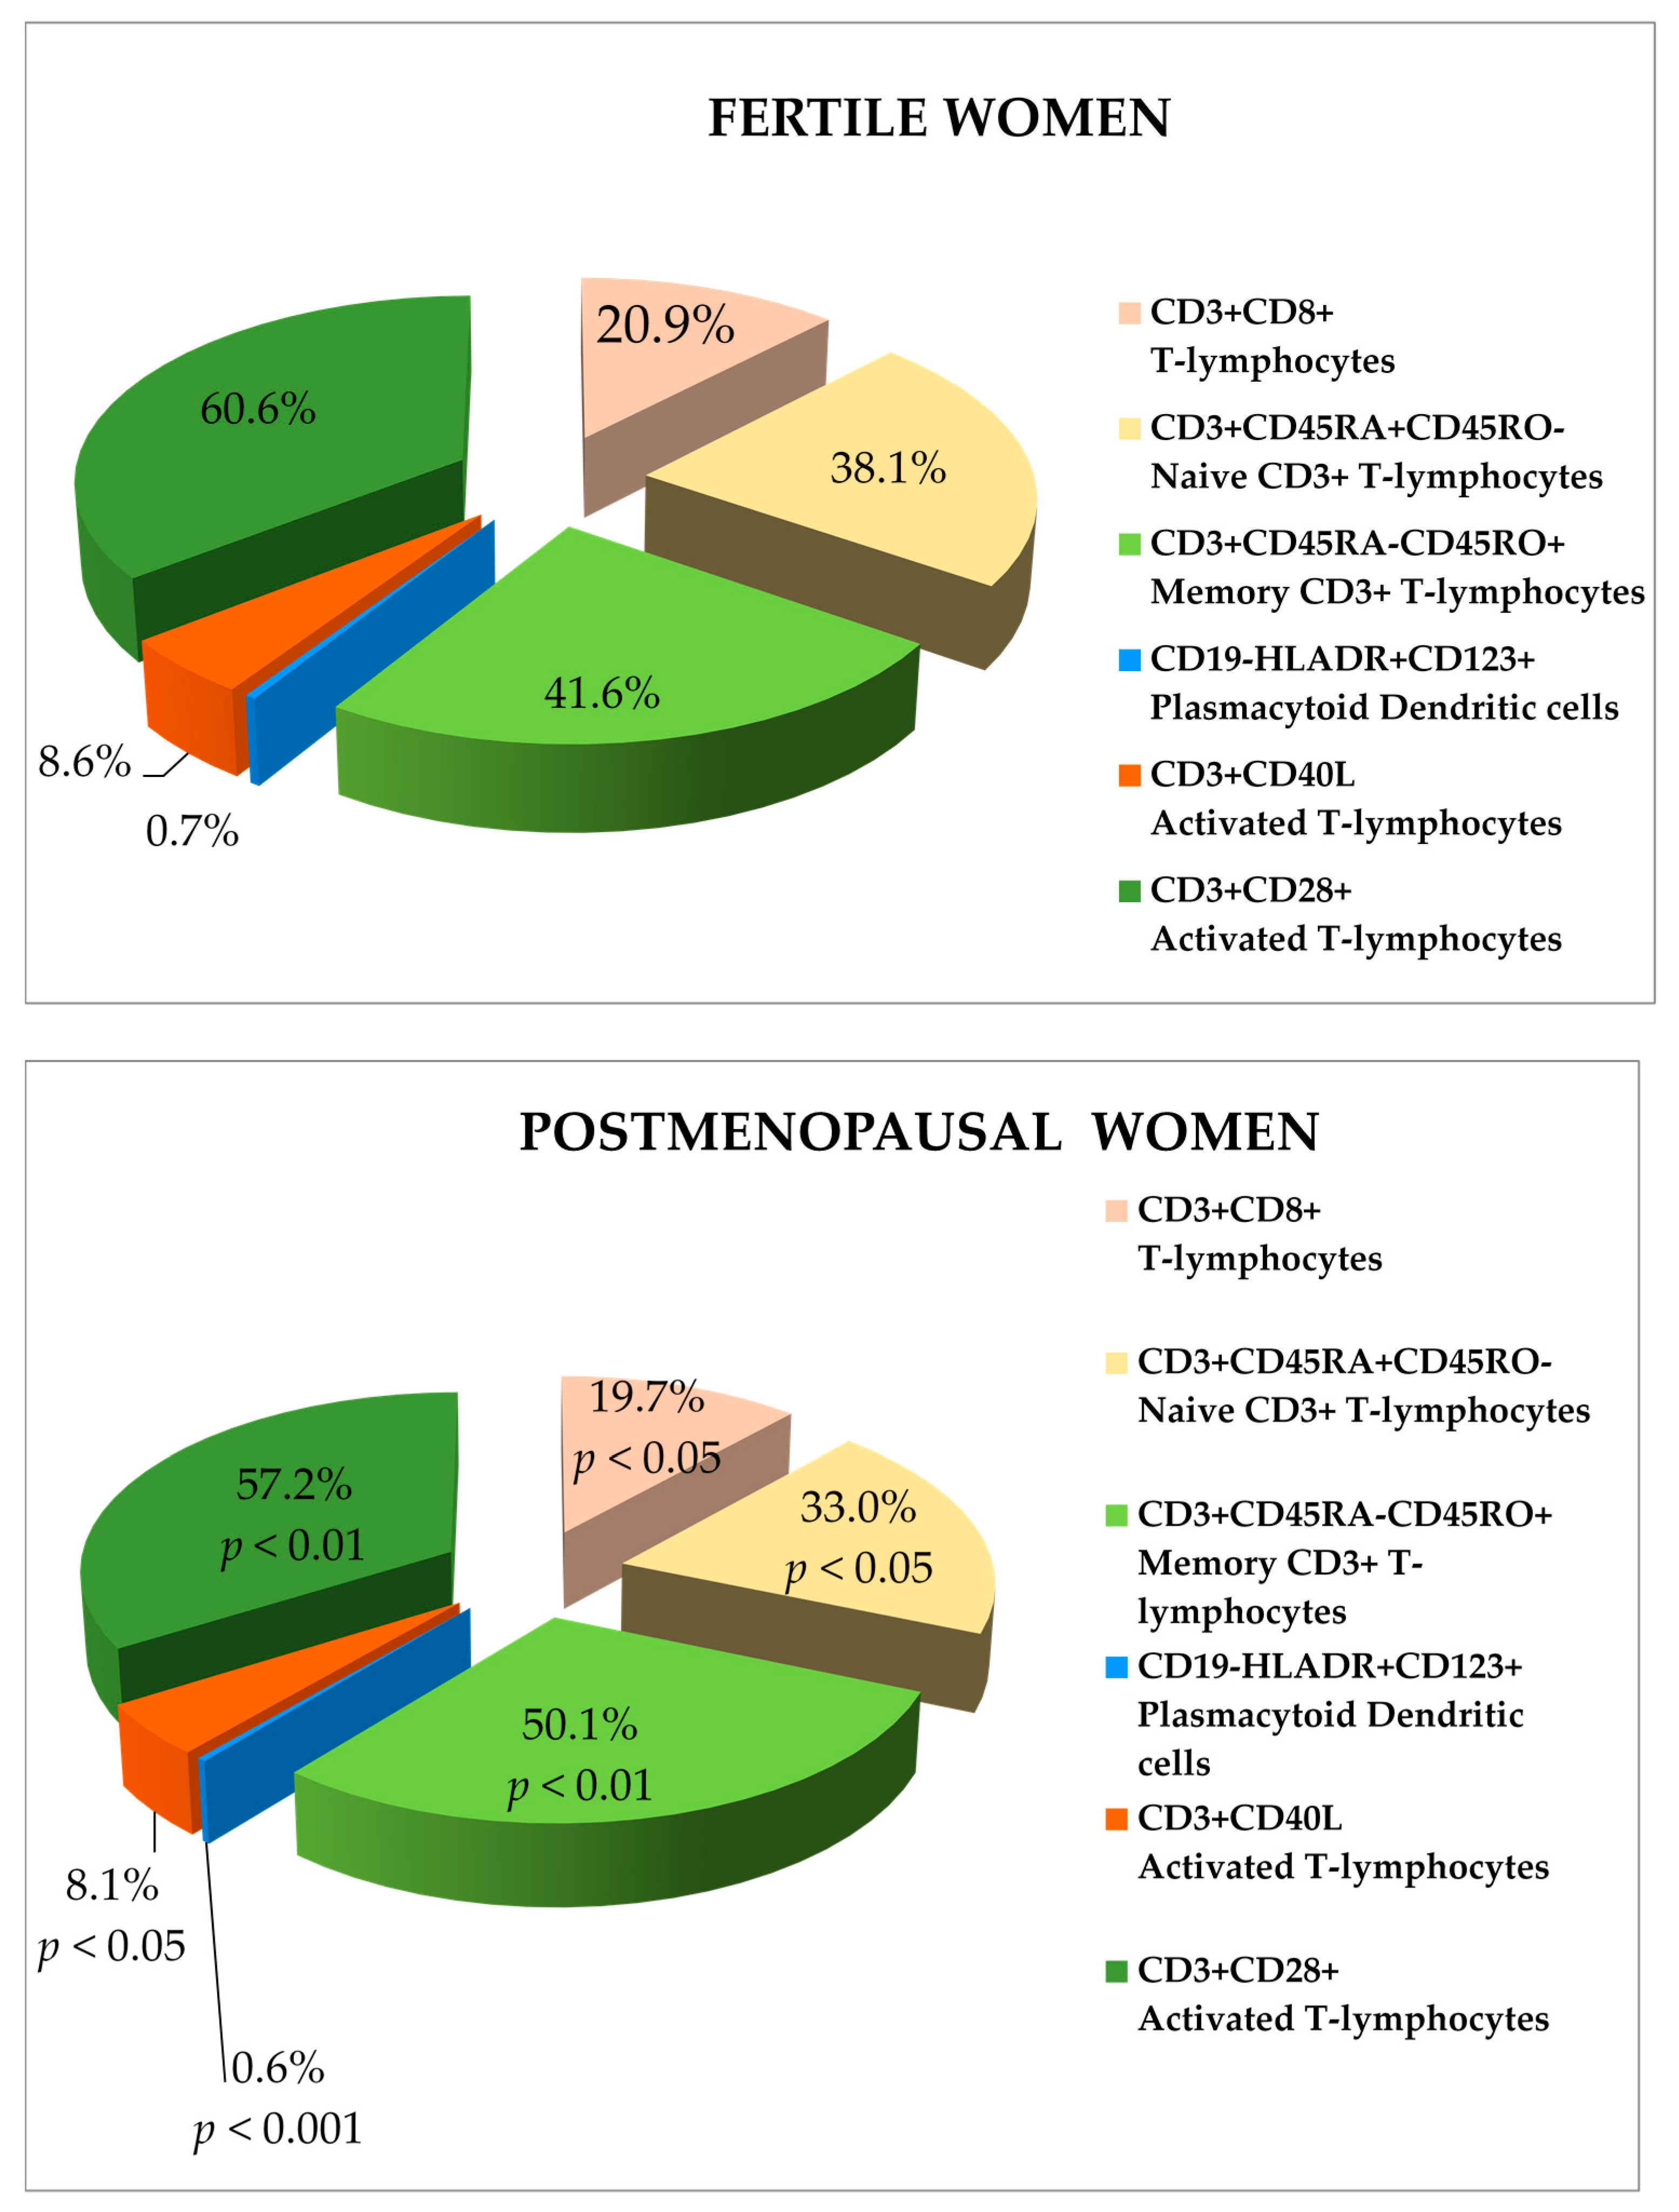
| CD Markers | Fertile Women | Postmenopausal Women | Significance | ||
|---|---|---|---|---|---|
| 1. FC | 2. FO | 3. PMC | 4. PMO | ||
| CD3+ T-lymphocytes | • | • | p < 0.05 | ||
| CD19+ B-lymphocytes | • | • | p < 0.05 | ||
| CD3+CD45RA+CD45RO− Naive CD3+ T-lymphocytes | • | • | p < 0.05 | ||
| • | • | p < 0.05 | |||
| CD19-HLADR+CD123+ Plasmacytoid Dendritic cells | • | • | ** p < 0.01 | ||
| • | • | p < 0.05 | |||
| CD265+ (RANK) Monocyte population | • | • | ** p < 0.05 | ||
| • | • | p < 0.05 | |||
| CD265+CD11c+ Monocyte population | • | • | ** p < 0.01 | ||
| • | • | p < 0.01 | |||
| CD3+CD40L Activated T-lymphocytes | • | • | p < 0.05 | ||
| CD3+CD28+ Activated T-lymphocytes | • | • | p < 0.05 | ||
| CD Markers | BMI | Tissue Fat | Waist Size | BMD | Age |
|---|---|---|---|---|---|
| CD4+ T-lymphocytes | r = 0.149 p < 0.05 | ||||
| CD19−HLADR+CD123+ Plasmacytoid Dendritic cells | r = −0.178 p < 0.05 | r = −0.195 p < 0.01 | r = −0.159 p < 0.05 | ||
| CD3+CD28+ Activated T-lymphocytes | r = −0.145 p < 0.05 | r = −0.153 p < 0.05 | r = −0.157 p < 0.05 | ||
| CD265+CD19−HLADR+CD11c−CD123+ RANK on Lymphoid Dendritic cells | r = −0.196 p < 0.05 | ||||
| CD4+CD127+CD25− Memory effector cells | r = −0.172 p < 0.05 | ||||
| CD3+CD45RO+CD45RA− Memory CD3+ T-lymphocytes | r = 0.207 p < 0.01 | ||||
| CD3+CD45RO−CD45RA+ Naive CD3+ T-lymphocytes | r = −0.229 p < 0.01 | ||||
| CD19−HLADR+CD11c+ Myeloid Dendritic cells | r = −0.152 p < 0.05 |
| Covariantes | Models Predicting Percentage of: | ||||||||
|---|---|---|---|---|---|---|---|---|---|
| CD4+ | CD3+ | CD19+ | |||||||
| B | SE | Sig. | B | SE | Sig. | B | SE | Sig. | |
| Women | |||||||||
| fertile vs. | 4.091 | 2.968 | 0.170 | 4.662 | 2.621 | 0.077 | −1.606 | 1.088 | 0.142 |
| postmenopausal | |||||||||
| BMD | −0.029 | 1.259 | 0.982 | −0.337 | 1.112 | 0.762 | 0.244 | 0.461 | 0.597 |
| BMI | 0.054 | 0.266 | 0.838 | −0.069 | 0.235 | 0.771 | −0.088 | 0.097 | 0.369 |
| Tissue fat | −0.041 | 0.157 | 0.796 | 0.051 | 0.138 | 0.714 | 0.032 | 0.057 | 0.573 |
| Waist size | 0.106 | 0.115 | 0.358 | 0.030 | 0.101 | 0.770 | 0.034 | 0.042 | 0.418 |
| Women age | −0.088 | 0.114 | 0.439 | −0.227 | 0.101 | p < 0.050 | 0.040 | 0.042 | 0.343 |
| CD3+CD45RO+CD45RA− | CD3+CD45RA+CD45RO− | CD3+CD8+CD45RO+CD45RA− | |||||||
| B | SE | Sig. | B | SE | Sig. | B | SE | Sig. | |
| Women | |||||||||
| fertile vs. | 11.135 | 15.253 | 0.466 | −6.919 | 3.938 | 0.081 | 4.196 | 3.88 | 0.281 |
| postmenopausal | |||||||||
| BMD | 16.457 | 6.617 | p < 0.050 | 2.040 | 1.708 | 0.234 | −0.175 | 1.685 | 0.917 |
| BMI | 0.699 | 1.344 | 0.604 | −0.395 | 0.347 | 0.256 | 0.169 | 0.342 | 0.622 |
| Tissue fat | 1.059 | 0.799 | 0.187 | −0.103 | 0.206 | 0.617 | 0.271 | 0.203 | 0.185 |
| Waist size | −1.153 | 0.579 | p < 0.050 | 0.322 | 0.150 | p < 0.050 | −0.298 | 0.148 | p < 0.050 |
| Women age | −0.539 | 0.590 | 0.362 | −0.039 | 0.152 | 0.799 | −0.084 | 0.150 | 0.576 |
| CD3−CD56+ | CD265+CD19−HLADR+CD11c+CD123- | CD3+CD40L+ | |||||||
| B | SE | Sig. | B | SE | Sig. | B | SE | Sig. | |
| Women | |||||||||
| fertile vs. | 1.844 | 2.080 | 0.377 | 5.698 | 2.685 | p < 0.050 | −3.323 | 1.574 | p < 0.050 |
| postmenopausal | |||||||||
| BMD | −0.367 | 0.900 | 0.684 | −0.377 | 1.138 | 0.741 | 0.123 | 0.682 | 0.857 |
| BMI | 0.21 | 0.183 | 0.249 | −0.101 | 0.243 | 0.678 | 0.124 | 0.141 | 0.381 |
| Tissue fat | −0.068 | 0.109 | 0.533 | 0.234 | 0.143 | 0.105 | −0.179 | 0.083 | p < 0.050 |
| Waist size | −0.050 | 0.079 | 0.524 | −0.069 | 0.108 | 0.521 | 0.037 | 0.060 | 0.539 |
| Women age | −0.015 | 0.08 | 0.851 | −0.242 | 0.104 | p < 0.050 | 0.131 | 0.061 | p < 0.050 |
| CD3+CD56+ | CD265+CD19−HLADR+CD11c−CD123+ | CD3+CD8+ | |||||||
| B | SE | Sig. | B | SE | Sig. | B | SE | Sig. | |
| Women | |||||||||
| fertile vs. | −1.594 | 2.061 | 0.440 | −2.662 | 3.842 | 0.490 | 0.482 | 2.360 | 0.838 |
| postmenopausal | |||||||||
| BMD | −0.073 | 0.874 | 0.933 | 1.900 | 1.622 | 0.243 | −0.004 | 1.001 | 0.997 |
| BMI | 0.236 | 0.185 | 0.205 | 0.539 | 0.347 | 0.122 | −0.165 | 0.211 | 0.436 |
| Tissue fat | −0.108 | 0.109 | 0.322 | 0.059 | 0.205 | 0.773 | 0.030 | 0.125 | 0.809 |
| Waist size | −0.068 | 0.080 | 0.396 | −0.411 | 0.154 | p < 0.010 | 0.000 | 0.091 | 0.999 |
| Women age | −0.099 | 0.079 | 0.213 | 0.060 | 0.149 | 0.689 | −0.065 | 0.091 | 0.474 |
© 2017 by the authors. Licensee MDPI, Basel, Switzerland. This article is an open access article distributed under the terms and conditions of the Creative Commons Attribution (CC BY) license (http://creativecommons.org/licenses/by/4.0/).
Share and Cite
Horváthová, M.; Ilavská, S.; Štefíková, K.; Szabová, M.; Krivošíková, Z.; Jahnová, E.; Tulinská, J.; Spustová, V.; Gajdoš, M. The Cell Surface Markers Expression in Postmenopausal Women and Relation to Obesity and Bone Status. Int. J. Environ. Res. Public Health 2017, 14, 751. https://doi.org/10.3390/ijerph14070751
Horváthová M, Ilavská S, Štefíková K, Szabová M, Krivošíková Z, Jahnová E, Tulinská J, Spustová V, Gajdoš M. The Cell Surface Markers Expression in Postmenopausal Women and Relation to Obesity and Bone Status. International Journal of Environmental Research and Public Health. 2017; 14(7):751. https://doi.org/10.3390/ijerph14070751
Chicago/Turabian StyleHorváthová, Mira, Silvia Ilavská, Kornélia Štefíková, Michaela Szabová, Zora Krivošíková, Eva Jahnová, Jana Tulinská, Viera Spustová, and Martin Gajdoš. 2017. "The Cell Surface Markers Expression in Postmenopausal Women and Relation to Obesity and Bone Status" International Journal of Environmental Research and Public Health 14, no. 7: 751. https://doi.org/10.3390/ijerph14070751